WO2023162185A1 - 監視装置、監視方法及び監視プログラム - Google Patents
監視装置、監視方法及び監視プログラム Download PDFInfo
- Publication number
- WO2023162185A1 WO2023162185A1 PCT/JP2022/008084 JP2022008084W WO2023162185A1 WO 2023162185 A1 WO2023162185 A1 WO 2023162185A1 JP 2022008084 W JP2022008084 W JP 2022008084W WO 2023162185 A1 WO2023162185 A1 WO 2023162185A1
- Authority
- WO
- WIPO (PCT)
- Prior art keywords
- channel
- power value
- range
- power
- optical
- Prior art date
- Legal status (The legal status is an assumption and is not a legal conclusion. Google has not performed a legal analysis and makes no representation as to the accuracy of the status listed.)
- Ceased
Links
Images






Classifications
-
- H—ELECTRICITY
- H04—ELECTRIC COMMUNICATION TECHNIQUE
- H04B—TRANSMISSION
- H04B10/00—Transmission systems employing electromagnetic waves other than radio-waves, e.g. infrared, visible or ultraviolet light, or employing corpuscular radiation, e.g. quantum communication
- H04B10/07—Arrangements for monitoring or testing transmission systems; Arrangements for fault measurement of transmission systems
- H04B10/075—Arrangements for monitoring or testing transmission systems; Arrangements for fault measurement of transmission systems using an in-service signal
- H04B10/079—Arrangements for monitoring or testing transmission systems; Arrangements for fault measurement of transmission systems using an in-service signal using measurements of the data signal
- H04B10/0795—Performance monitoring; Measurement of transmission parameters
- H04B10/07955—Monitoring or measuring power
-
- H—ELECTRICITY
- H04—ELECTRIC COMMUNICATION TECHNIQUE
- H04B—TRANSMISSION
- H04B10/00—Transmission systems employing electromagnetic waves other than radio-waves, e.g. infrared, visible or ultraviolet light, or employing corpuscular radiation, e.g. quantum communication
- H04B10/07—Arrangements for monitoring or testing transmission systems; Arrangements for fault measurement of transmission systems
- H04B10/075—Arrangements for monitoring or testing transmission systems; Arrangements for fault measurement of transmission systems using an in-service signal
- H04B10/079—Arrangements for monitoring or testing transmission systems; Arrangements for fault measurement of transmission systems using an in-service signal using measurements of the data signal
-
- H—ELECTRICITY
- H04—ELECTRIC COMMUNICATION TECHNIQUE
- H04J—MULTIPLEX COMMUNICATION
- H04J14/00—Optical multiplex systems
- H04J14/02—Wavelength-division multiplex systems
Definitions
- the present invention relates to a monitoring device, a monitoring method, and a monitoring program.
- an optical path which is a communication route for optical signals, is constructed by multiple nodes interconnected by optical fibers.
- a sending end node and a receiving end node are connected via a plurality of relay nodes.
- an abnormality occurs in any of a plurality of nodes forming an optical path, it affects the quality of the optical signal transmitted through the optical path, so it is required to identify the node in which the abnormality has occurred. For example, by installing a high-resolution monitor such as an OSA (Optical Spectrum Analyzer) at each node and accurately grasping the waveform shape of the optical signal output from the node by the monitoring device, it is possible to determine whether the node is abnormal. proposed (see, for example, Non-Patent Document 1).
- OSA Optical Spectrum Analyzer
- the monitoring device it is required to improve the accuracy of determining node abnormalities while reducing the installation cost of the monitor and the communication load with the monitor.
- the monitoring apparatus acquires a first power value in a first range including the entire wavelength of the channel from a monitor that measures the power value of the optical signal output from the transmission apparatus, and obtains the first power value of the wavelength of the channel.
- a data acquisition unit that acquires a second power value in a second range that includes a portion; and a data acquisition unit that compares the first power value and the second power value with a threshold value based on the steady-state power value of the transmission device. and a judgment unit for judging abnormality of the transmission device.
- the present invention it is possible to improve the accuracy of node abnormality determination while reducing the installation cost of the monitor and the communication load with the monitor.
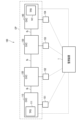
- FIG. 1 is a conceptual diagram of an optical transmission system to which a monitoring device according to this embodiment is applied;
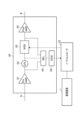
- FIG. FIG. 3 is a diagram showing the configuration of a node;
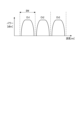
- FIG. 4 is a diagram showing waveforms of optical signals of a plurality of channels output from WSS; It is a functional block diagram which shows the structure of a monitoring apparatus. It is a figure explaining the range which a data acquisition part acquires a power value.
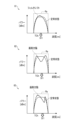
- FIG. 5 is a diagram for explaining an example of waveform abnormality caused by an abnormality in the filter function of WSS; It is a figure explaining the aspect which acquires a power value with respect to the abnormal waveform. It is a figure explaining an example of the setting of a threshold value. It is a figure explaining an example of abnormality determination processing.
- FIG. 4 is a flowchart showing the flow of abnormality determination processing; 4 is a flowchart showing the flow of threshold setting processing; It is a hardware configuration diagram showing an example of a computer that implements the functions of the monitoring apparatus according to the present embodiment.
- FIG. 10 is a diagram illustrating a range for acquiring power values in Modification 1; It is a figure explaining a comparative example.
- 9 is a flowchart showing the flow of abnormality determination processing according to Modification 1;
- FIG. 11 is a diagram illustrating a range for acquiring power values in Modification 2;
- FIG. 11 is a functional block diagram showing the configuration of a monitoring device according to modification 3; 13 is a flowchart showing the flow of threshold correction processing according to modification 3;
- FIG. 1 is a conceptual diagram of an optical transmission system to which a monitoring device according to this embodiment is applied.
- FIG. 2 is a diagram showing the configuration of a node.
- an optical transmission system 100 has a plurality of nodes interconnected by optical fibers fb, which are optical transmission lines.
- FIG. 1 shows an example in which four nodes 110, 120, 130, and 140 configure an optical path OP, which is a communication path for optical signals.
- An example is shown in which an optical signal is transmitted from the node 110 to the node 140 on the optical path OP. That is, node 110 is a sending node, node 140 is a receiving node, and nodes 120 and 130 are relay nodes.
- FIG. 1 shows an example in which a plurality of nodes 110, 120, 130, and 140 are connected in series in the optical transmission system 100, the nodes may be connected in a mesh or a ring. That is, each node can be connected to other nodes (not shown), and can output and input optical signals with the other nodes.
- Each node 110, 120, 130, 140 is configured as a transmission device.
- the transmission device can be, for example, an Optical Cross Connect (OXC) device.
- Each node 110, 120, 130, 140 transmits an optical wavelength multiplexed signal in which optical signals of a plurality of channels are wavelength-multiplexed.
- an inline amplifier (ILA) for amplifying an optical wavelength multiplexed signal may be provided between each of the nodes 110, 120, 130, and 140 of the optical path OP.
- the transmitting end node 110 and the receiving end node 140 are provided with transponders (TPD, Transponder) 111 and 141, respectively, which are transceivers.
- TPD Transponder
- the nodes 120 and 130 which are relay nodes, may also have transponders, and the nodes 120 and 130 may be the transmitting end nodes or the receiving end nodes in the other optical paths OP.
- the transmitting end node 110 wavelength-multiplexes the optical signal input from the transponder 111 and outputs an optical wavelength-multiplexed signal.
- the relay nodes 120 and 130 demultiplex the optical signals contained in the input optical wavelength multiplexed signals.
- the relay nodes 120 and 130 wavelength-multiplex the separated optical signals again and output optical wavelength-multiplexed signals.
- the receiving end node 140 demultiplexes the optical signal included in the input optical wavelength multiplexed signal and receives it by the transponder 141 .
- Nodes 110 to 140 have the same configuration, but FIG. 2 shows the configuration of node 120 as a representative.
- the node 120 includes a preamplifier 101, a coupler (CPL, Coupler) 102, a wavelength selective switch (Wave Selective Switch, hereinafter also referred to as "WSS") 103, a postamplifier 104, a selector ( SEL (Selector) 105, an optical channel monitor (OCM, Optical Channel Monitor) 106, and the like.
- Node 120 also includes a node controller 152 that controls the operation of node 120 .
- the output side of the preamplifier 101 is connected to the input side of the postamplifier 104 via the coupler 102 and WSS 103 .
- the selector 105 selects any one of the output of the preamplifier 101 , the output of the coupler 102 and the output of the WSS 103 and outputs it to the optical channel monitor 106 .
- the optical channel monitor 106 measures the output power of the preamplifier 101, coupler 102 or WSS 103 input from the selector 105. A measured value of the output power of the WSS 103 is used for abnormality determination processing of the monitoring device 1, which will be described later. The measurements are input to node controller 152 .
- the preamplifier 101 amplifies the optical wavelength multiplexed signal input from the optical fiber fb, which is an optical transmission line, and inputs it to the WSS 103 .
- the WSS 103 separates the optical wavelength multiplexed signal into optical signals of multiple channels.
- the WSS 103 outputs the separated optical signal to the set output destination.
- the WSS 103 outputs the optical signal to be dropped to a transponder (not shown).
- the WSS 103 inputs the add target optical signal input from the transponder to the set channel, multiplexes it with the through target optical signal, generates an optical wavelength multiplexed signal, and inputs it to the post-amplifier 104 .
- the post-stage amplifier 104 amplifies the optical wavelength multiplexed signal and outputs it to the optical fiber fb.
- the WSS 103 includes an array type light beam deflection element such as LCOS (Liquid Crystal on Silicon).
- LCOS has a two-dimensional matrix structure of millions of pixels, and can allocate multiple control pixels to light signals.
- the WSS 103 can change the passband of the optical signal for each channel under the control of the node controller 152 regardless of the hardware configuration. That is, the WSS 103 has a filter function for filtering the optical signal of each channel into the wavelength band set by the node controller 152 .
- FIG. 3 is a diagram showing waveforms of optical signals of a plurality of channels Ch1, Ch2, and Ch3 output from the WSS 103.
- FIG. 3 Although three channels Ch1, Ch2 and Ch3 are shown in FIG. 3, the number of channels is arbitrary.
- the node controller 152 divides the entire available wavelength band by the grid width, and assigns each wavelength band BW to channels Ch1, Ch2, and Ch3.
- the minimum unit of the grid width is 12.5 GHz, and it is variable to 12.5 GHz, 25 GHz, 50 GHz, and 100 GHz. That is, the node controller 152 can change the number of channels and the width of each wavelength band BW by changing the grid width.
- FIG. 3 shows waveforms in a state (steady state) in which the filter function of the WSS 103 functions normally.
- the waveforms of channels Ch1, Ch2, and Ch3 have generally symmetrical shapes with gentle peaks in the center.
- channels Ch1, Ch2, and Ch3 are simply referred to as channels Ch unless it is necessary to distinguish between them.
- the WSS 103 has a variable optical attenuator.
- WSS 103 attenuates and multiplexes the optical signals of channels Ch1 to Ch3.
- Attenuation in the variable optical attenuator is controlled by the node controller 152 .
- the node controller 152 obtains the measured optical power per channel Ch from the optical channel monitor 106 .
- the node controller 152 controls attenuation in the variable optical attenuator based on the measured value.
- the node controller 152 performs power control so as to compensate for power loss caused by the optical signal of each channel Ch being filtered by the WSS 103 .
- the optical channel monitor 106 measures the power value of the optical signal of each channel Ch.
- the optical channel monitor 106 cuts out the optical signal of each channel Ch input from the selector 105 with a filter, and measures the total value of the power in the cut out range.
- the optical channel monitor 106 can change the extraction range of the optical signal by changing the filter resolution setting.
- the resolution setting of optical channel monitor 106 is controlled by node controller 152 .
- the node controller 152 measures power values in a plurality of ranges while changing the resolution of the optical channel monitor 106 .
- nodes 110, 120, 130 and 140 are provided with node controllers 151, 152, 153 and 154, respectively.
- the monitoring device 1 is connected to each node controller 151, 152, 153, 154 via a communication network.
- the monitoring device 1 is also connected to transponders 111 and 141 provided at the transmitting end node 110 and the receiving end node 140 via a communication network.
- the transponders 111 and 141 contain a digital signal processing (DSP) chip inside, and monitor the quality of the optical signal transmitted on the optical path OP using surplus resources.
- DSP digital signal processing
- the transponders 111 and 141 input a notification to the monitoring device 1 when detecting degradation of signal quality.
- the notification contains information identifying the optical signal for which degradation was detected. Also, if an abnormality in the transponders 111 and 141 themselves is identified as the cause of deterioration, the notification includes information indicating the abnormality in the transponders 111 and 141 .
- FIG. 4 is a functional block diagram showing the configuration of the monitoring device 1.
- the monitoring device 1 can be configured as a network controller that manages the entire optical transmission system 100, for example. That is, the monitoring device 1 communicates with the node controllers 151 , 152 , 153 , 154 and the transponders 111 , 141 to control them and monitor the optical transmission system 100 for anomalies.
- the monitoring device 1 includes a control section 10 , an input/output section 15 and a storage section 16 .
- the input/output unit 15 inputs and outputs data between the node controllers 151, 152, 153, and 154 and the transponders 111 and 141.
- the input/output unit 15 includes a communication interface for transmitting and receiving information via a communication line, and an input/output interface for inputting and outputting information between an input device such as a keyboard (not shown) and an output device such as a display. Configured.
- the storage unit 16 further stores a program (monitoring program) for executing each function unit of the control unit 10 and information necessary for the processing of the control unit 10.
- the storage unit 16 stores identification information, configuration information, and the like of the nodes 110, 120, 130, and 140.
- FIG. Further, the storage unit 16 stores path information including channel allocation information for each optical signal transmitted on the optical path OP.
- the storage unit 16 also stores information such as threshold values used in the abnormality determination process, which will be described later.
- the control unit 10 controls the overall processing performed by the monitoring device 1.
- the control unit 10 receives a signal quality degradation notification from the transponders 111 and 141 and the notification does not include an abnormality in the transponders 111 and 141 themselves, the control unit 10 detects an abnormality in the nodes 110 , 120 , 130 and 140 . Perform judgment processing. The control unit 10 thereby identifies the node in which the abnormality has occurred.
- the control unit 10 includes a data acquisition unit 11 , a determination unit 12 and a threshold setting unit 13 .
- the data acquisition unit 11 identifies the optical signal in which deterioration has been detected from the notification of the transponder 141 .
- the data acquisition unit 11 refers to the route information stored in the storage unit 16 to identify the channel Ch (hereinafter referred to as “target channel Tch”) that is the route of the degraded optical signal.
- the data acquisition unit 11 communicates with the node controllers 151, 152, 153 and 154 and causes the optical channel monitors 106 of the nodes 110, 120, 130 and 140 to measure the power value of the target channel Tch.
- Node controllers 151, 152, 153, and 154 control optical channel monitor 106 and selector 105 (see FIG. 2) to cause optical channel monitor 106 to measure the power value of target channel Tch output by WSS 103.
- FIG. Node controllers 151 , 152 , 153 , and 154 acquire measurement values of optical channel monitor 106 and input them to data acquisition unit 11 .
- FIG. 5 is a diagram for explaining the range in which the data acquisition unit 11 acquires power values.
- the data acquisition unit 11 acquires the power values IV1, IV2, and IV3 in the three ranges Ra, Rb, and Rc from the optical channel monitor 106 for the target channel Tch. 5, the data acquisition unit 11 acquires the power value IV1 of the range Ra including the entire wavelength of the optical signal of the target channel Tch. 5, the data acquisition unit 11 acquires a power value IV2 in a range Rb including part of the wavelength of the optical signal of the target channel Tch. 5, the data acquisition unit 11 acquires a power value IV3 in a range Rc that includes part of the wavelength of the optical signal of the target channel Tch and is shifted from the range Rb.
- the power value IV1 corresponds to the first power value
- the power values IV2 and IV3 correspond to the second power values.
- the optical channel monitor 106 changes the filter resolution to cut out light in ranges Ra, Rb, and Rc from the optical signal, and measures respective power values IV1, IV2, and IV3.
- the power value means the total value of power in each range, that is, the integrated value of power.
- the widths of the ranges Ra, Rb, and Rc are determined according to the wavelength band BW (see FIG. 3) assigned to each channel Ch. In FIG. 5, as an example, when the grid width is 50 GHz, the width of the ranges Ra, Rb, and Rc is 0.42 nm. The widths of the ranges Rb and Rc may be the same as or different from the range Ra.
- the ranges Rb and Rc may be set by shifting their positions from each other, and their positions are not limited.
- the positions of the ranges Rb and Rc may be symmetrical with respect to the range Ra, for example.
- the ranges Rb and Rc may be set so as to partially overlap each other, or may be set so as to be spaced apart from each other.
- FIG. 5 as an example, when the position of range Ra is (X), the position of range Rb is (X+0.315 nm) and the position of range Rc is (X-0.315 nm).
- the determination unit 12 compares the power values IV1, IV2, and IV3 acquired by the data acquisition unit 11 with thresholds TH1, TH2, and TH3, respectively.
- the threshold values TH1, TH2, and TH3 are set in advance by the threshold setting unit 13 and stored in the storage unit 16, which will be described later.
- the thresholds TH1, TH2, and TH3 are set based on the power values in the ranges Ra, Rb, and Rc in the steady state, respectively.
- the determination unit 12 calculates differences D1, D2, and D3 between the power values IV1, IV2, and IV3 and the thresholds TH1, TH2, and TH3 as absolute values. If any of the differences D1, D2, and D3 exceeds a predetermined value PD, the determination unit 12 determines that an abnormality has occurred in that node. The determination unit 12 notifies the user of the determination result via the input/output unit 15 .
- the power values IV1-IV3 are obtained in order to grasp the abnormality of the nodes 110, 120, 130, and 140.
- FIG. In particular, the power values IV2 and IV3 are acquired in order to grasp an abnormality in the waveform of the optical signal caused by an abnormality in the filter function of the WSS 103.
- FIG. FIG. 6 is a diagram for explaining an example of a waveform abnormality caused by an abnormality in the filter function of the WSS 103.
- steady-state waveforms are indicated by solid lines
- abnormal waveforms are indicated by broken lines.
- the waveform has a generally symmetrical shape with a gentle peak in the center.
- the diagram 61 in FIG. 6 shows a waveform anomaly called filter shift.
- the waveform of the filter shift is left-right asymmetrical, and the peak on the left side of the center protrudes more than in the steady state.
- Diagrams 62 and 63 show waveform abnormalities called pixel defects.
- a pixel defect means a state in which a pixel defect occurs in the LCOS that filters the optical signal in the WSS 103 .
- the steady-state waveform has a gentle peak in the center
- the pixel defect waveform has a sharp drop in power at the peak, as shown in diagrams 62 and 63 .
- the sharp drop in power can occur in the center of the waveform, as shown in the diagram labeled 62, or it can occur offset to the right or left of the center, as shown in the diagram labeled 63.
- the monitoring device 1 is required to identify the node that is the cause of the waveform anomaly. For example, if a high-resolution monitor such as an OSA is used, it is possible to accurately grasp abnormalities in waveforms as shown by reference numerals 61 to 63 in FIG. 6 and determine node abnormalities.
- a high-resolution monitor such as an OSA
- providing an OSA at each node 110, 120, 130, 140 increases installation costs.
- the communication load increases as the amount of data transmitted from the OSA to the monitoring device 1 increases.
- the optical channel monitor 106 provided in each node 110, 120, 130, 140 measures the power value with the resolution set according to the wavelength band BW of the target channel Ch, as described above. . That is, the optical channel monitor 106 measures power values with a lower resolution than OSA. Reducing the resolution of the optical channel monitor 106 reduces installation costs and communication load compared to OSA. However, from the power values measured by the optical channel monitor 106, it is not possible to accurately grasp abnormal waveforms as shown in the diagrams of reference numerals 61 to 63 in FIG.
- the power values IV1, IV2, and IV3 obtained from the multiple ranges Ra, Rb, and Rc are each set to a threshold value TH1 in order to determine whether a node is abnormal using the optical channel monitor 106 set to a low resolution. , TH2 and TH3.
- the threshold value TH1 when the power value IV1 measured from the range Ra covering the entire wavelength is significantly different from the threshold value TH1 based on the steady state, it can be determined that the nodes 110, 120, 130, and 140 are abnormal. can. However, waveform anomalies caused by an anomaly in the filter function of the WSS 103, such as those indicated by reference numerals 61 to 63 in FIG. 6, may not be determined by comparison between the power value IV1 and the threshold TH1.
- node controllers 151 , 152 , 153 , 154 perform power control to compensate for losses caused by WSS 103 filtering. Similar power control is performed when a loss occurs due to an abnormality in the filter function of WSS 103 . As shown by reference numeral 61 in FIG. 6, in the waveform of the filter shift, the left side power peak protrudes more than in the steady state, but the right side power is smaller than in the steady state. That is, power control is performed so that the power of all wavelengths is the same. In this case, the difference D1 between the power value IV1 of the range Ra covering the entire wavelength and the threshold TH1 may not be so large as to exceed the predetermined value PD. As shown in the diagrams 62 and 63 in FIG.
- the pixel defect waveform also has higher power than in the steady state on both sides of the point where the power suddenly drops. That is, power control is performed so that the power of all wavelengths is the same. In this case, the difference D1 between the power value IV1 of the range Ra covering the entire wavelength and the threshold TH1 may not be so large as to exceed the predetermined value PD.
- FIG. 7 is a diagram for explaining a mode of acquiring power values IV2 and IV3 from ranges Rb and Rc for waveforms in which an abnormality has occurred.
- the ranges Rb and Rc that include part of the wavelength, the portion where the power difference between the abnormal waveform and the steady state is large is included. easier.
- the range Rb includes the portion on the right side of the waveform of the filter shift where the power is lower than in the steady state. Therefore, the difference D2 between the power value IV2 in the range Rb and the threshold TH2 tends to increase.
- the range Rc includes the point on the left side of the filter shift waveform where the power is greater than in the steady state. Therefore, the difference D2 between the power value IV3 in the range Rc and the threshold TH3 tends to increase.
- the diagram of reference numeral 72 in FIG. 7 shows a pixel defect in which the power drops sharply in the center of the waveform, but the ranges Rb and Rc include portions where the power rises on both ends. Therefore, the differences D2 and D3 between the power values IV2 and IV3 of the ranges Rb and Rc and the threshold values TH2 and TH3 tend to increase.
- the diagram of reference numeral 73 in FIG. 7 shows a pixel defect with a sharp drop in power on the right side of the waveform, and the range Rb spans the point where the power drops and the point where the power rises.
- the difference D2 between the power value IV2 in the range Rb and the threshold TH2 may not become large.
- the range Rc includes only locations where the power has increased, the difference D3 between the power value IV3 of the range Rc and the threshold TH3 tends to increase.
- the WSS 103 when an abnormality is determined at the power value IV1, it can be determined that the cause is an abnormality in a component other than the WSS 103, and when an abnormality is determined at the power values IV2 and IV3, the WSS 103 can be determined to be the cause. That is, by obtaining the power values IV1, IV2, and IV3, it is possible to identify the node in which the abnormality has occurred and to isolate the location of the abnormality in the node.
- FIG. 8 is a diagram illustrating an example of threshold setting. Since the thresholds TH1, TH2, and TH3 can be set in the same manner, the thresholds TH1, TH2, and TH3 are collectively indicated as the threshold TH in FIG.
- the threshold setting unit 13 updates the thresholds TH1, TH2, and TH3 according to the switching of the optical signal.
- the threshold setting unit 13 causes the storage unit 16 to store the updated thresholds TH1, TH2, and TH3.
- the storage unit 16 stores threshold values TH1, TH2, and TH3 set for each channel.
- the threshold setting unit 13 acquires the measured values of the output power of the WSS 103 measured by the optical channel monitor 106 for a certain period of time via the node controllers 151, 152, 153, 154 of the respective nodes 110, 120, 130, 140. to obtain time-series data for each channel.
- the threshold setting unit 13 acquires time-series data for each of the ranges Ra, Rb, and Rc.
- FIG. 8 shows, as an example, time-series data obtained when the grid width is changed from 50 GHz to 12.5 GHz.
- the threshold setting unit 13 can set, for example, the median value of the power as the threshold TH. Furthermore, the variation width is set as a predetermined value PD.
- the threshold TH is not limited to the median value, and for example, the average value may be used as the threshold TH.
- the method of setting the threshold TH is not limited to these examples, and can be changed as appropriate according to the environment of the optical transmission system 100 .
- the channel Ch serving as the path of the switched optical signal and the adjacent channels Ch on both sides thereof are to be updated.
- the ranges Rb and Rc also include the waveforms of the adjacent channels Ch. Therefore, when the steady-state power value of the optical signal of one channel Ch fluctuates, the power values measured from the ranges Rb and Rc of the adjacent channel Ch also fluctuate. Therefore, the adjacent channel Ch is also subject to update.
- the threshold setting unit 13 updates the thresholds TH1, TH2, and TH3 of channel Ch2.
- the threshold setting unit 13 also updates the threshold TH3 of the channel Ch1 adjacent to the left of the channel Ch2.
- the threshold setting unit 13 also updates the threshold TH1 of the channel Ch3 adjacent to the right of the channel Ch2. That is, the threshold setting unit 13 updates a total of five thresholds.
- FIG. 9 is a diagram illustrating an example of abnormality determination processing.
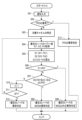
- FIG. 10 is a flowchart showing the flow of abnormality determination processing.
- FIG. 9 illustrates an example in which the transponder 141 of the receiving end node 140 notifies of deterioration of signal quality.
- step S01 when the transponder 141 detects degradation of optical signal quality, a notification is input to the monitoring device 1 (step S01). If the notification includes an abnormality in the transponder 141 itself (step S02: Yes), the control unit 10 determines the abnormality in the transponder 141 (step S13). An abnormality of the transponder 141 is notified via the input/output unit 15 . If the notification does not include an abnormality in transponder 141 itself (step S02: No), control unit 10 proceeds to step S03.
- the data acquisition unit 11 identifies the target channel Tch, which is the path of the optical signal in which deterioration has been detected (step S03).
- the data acquisition unit 11 acquires the power values IV1, IV2, and IV3 of the target channel Tch of the i-th node (step S04).
- the abnormality determination process is performed in reverse order from the receiving end node 140 side to the transmitting end node 110 side.
- abnormality determination processing is performed from the fourth receiving end node 140 .
- the data acquisition unit 11 controls the optical channel monitor 106 via the node controller 154 of the receiving end node 140 to acquire power values IV1, IV2 and IV3 measured in the ranges Ra, Rb and Rc, respectively.
- the determination unit 12 calculates a difference D1 between the power value IV1 and the threshold TH1, a difference D2 between the power value IV2 and the threshold TH2, and a difference D3 between the power value IV2 and the threshold TH3. (step S05).
- step S06: Yes When the difference D1 exceeds the predetermined value PD (step S06: Yes), the determination unit 12 determines that the constituent elements of the i-th node other than the WSS 103 are abnormal (step S09). The determination unit 12 notifies the user of the determination result via the input/output unit 15 . If the difference D1 does not exceed the predetermined value PD (step S06: No), the determination unit 12 proceeds to step S07. When at least one of the difference D2 and the difference D3 exceeds the predetermined value PD (step S07: Yes), the determination unit 12 determines that the WSS 103 of the i-th node is abnormal (step S08). The determination unit 12 notifies the user of the determination result via the input/output unit 15 .
- step S07 No
- step S11 the determination unit 12 returns to step S04 and performs abnormality determination processing for the i-th node. That is, the node that has completed the abnormality determination process moves to a node adjacent to the transmission end side, and similarly performs the abnormality determination process.
- the determination unit 12 determines that the first node (transmitting end node 110) is abnormal (step S12), and leaves the determination result to the user. That is, when the abnormality determination process for the node 120 ends in step S10, it means that the nodes 140, 130, and 120 have not been determined to be abnormal. In this case, since the remaining sending end node 110 has an abnormality, it is possible to determine the abnormality of the sending end node 110 by the process of elimination without performing the abnormality determination process.
- the determination unit 12 can notify the user of the abnormality of the sending end node 110 via the input/output unit 15 . In order to determine whether the cause of the abnormality is the WSS 103 or an element other than the WSS 103, the transmission end node 110 may also be subjected to abnormality determination processing.
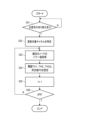
- FIG. 11 is a flowchart showing the flow of threshold setting processing.
- the threshold value setting unit 13 determines whether or not the optical signal transmitted through the optical path OP undergoes switching such as wave increase, wave decrease, or route change (step S21). Then, when there is switching (step S21: Yes), the threshold setting unit 13 identifies the channel to be updated (step S22).
- the update target channels are the channel (switching channel) that is the route of the switched optical signal and the channels adjacent to both sides thereof.
- the threshold setting process can be performed retroactively from the receiving end node 140 side to the transmitting end node 110 side in the same manner as the abnormality determination process.
- the threshold setting unit 13 controls the optical channel monitor 106 via the node controller 154 of the i-th node to obtain the power value of the update target channel Ch (step S23).
- the threshold setting unit 13 acquires power values in ranges Ra, Rb, and Rc for the switching channel. For the adjacent channel, the power value of one of the ranges Rb and Rc containing the waveform of the switching channel is obtained.
- the threshold setting unit 13 acquires each time-series data by acquiring each power value for a certain period of time.
- the threshold setting unit 13 sets thresholds TH1, TH2, and TH3 and a predetermined value PD from the time-series data of the ranges Ra, Rb, and Rc (step S24).
- the threshold setting unit 13 causes the storage unit 16 to store and update the thresholds TH1, TH2, TH3 and the predetermined value PD.
- step S26: No the threshold setting unit 13 returns to step S23 and proceeds to threshold setting processing for the i-th node. That is, the node that has completed the threshold setting process moves to a node adjacent to the transmission end side, and similarly performs the threshold setting process. If i is 0 (step S26: Yes), the threshold setting unit 13 ends the process because the threshold setting process for all the nodes 110, 120, 130, and 140 has been completed.
- FIG. 12 is a hardware configuration diagram showing an example of a computer 900 that implements the functions of the monitoring device 1 according to this embodiment.
- Computer 900 includes CPU (Central Processing Unit) 901, ROM (Read Only Memory) 902, RAM (Random Access Memory) 903, HDD (Hard Disk Drive) 904, input/output I/F (Interface) 905, communication I/F 906 and media I/F907.
- CPU Central Processing Unit
- ROM Read Only Memory
- RAM Random Access Memory
- HDD Hard Disk Drive
- I/F Interface
- the CPU 901 operates based on a program (monitoring program) stored in the ROM 902 or HDD 904, and performs control by the control unit 10 of the monitoring device 1 shown in FIG.
- the ROM 902 stores a boot program executed by the CPU 901 when the computer 900 is started, a program related to the hardware of the computer 900, and the like.
- the CPU 901 controls an input device 910 such as a mouse and keyboard, and an output device 911 such as a display via an input/output I/F 905 .
- the CPU 901 acquires data from the input device 910 via the input/output I/F 905 and outputs the generated data to the output device 911 .
- a GPU Graphics Processing Unit
- a GPU may be used together with the CPU 901 as a processor.
- the HDD 904 stores programs executed by the CPU 901 and data used by the programs.
- Communication I/F 906 receives data from other devices such as node controllers 151, 152, 153 and 154 (see FIG. 1) via a communication network (for example, NW (Network) 920) and outputs the data to CPU 901, Also, the data generated by the CPU 901 is transmitted to another device via a communication network.
- NW Network
- the media I/F 907 reads programs or data stored in the recording medium 912 and outputs them to the CPU 901 via the RAM 903 .
- the CPU 901 loads a program related to target processing from the recording medium 912 onto the RAM 903 via the media I/F 907, and executes the loaded program.
- the recording medium 912 is an optical recording medium such as a DVD (Digital Versatile Disc) or a PD (Phase change rewritable Disk), a magneto-optical recording medium such as an MO (Magneto Optical disk), a magnetic recording medium, a conductor memory tape medium, a semiconductor memory, or the like. is.
- the CPU 901 of the computer 900 implements the functions of the monitoring device 1 by executing the program loaded on the RAM 903 .
- Data in the RAM 903 is stored in the HDD 904 .
- the CPU 901 reads a program related to target processing from the recording medium 912 and executes it.
- the CPU 901 may read a program related to target processing from another device via the communication network (NW 920).
- the monitoring device 1 monitors transmission devices (nodes 110, 120, 130, and 140) that transmit optical wavelength multiplexed signals including optical signals of a plurality of channels Ch1, Ch2, and Ch3.
- the monitoring device 1 includes a data acquisition section 11 and a determination section 12 .
- the data acquisition unit 11 obtains a range Ra (first range), and acquires power values IV2 and IV3 (second power values) of ranges Rb and Rc (second ranges) including part of the wavelength of the target channel Tch. .
- the determination unit 12 compares the power values IV1, IV2, and IV3 with threshold values TH1, TH2, and TH3 based on the steady-state power values of the nodes 110, 120, 130, and 140, respectively, to determine the nodes 110, 120, 130, 140 abnormalities are determined.
- the monitoring device 1 it is possible to improve the accuracy of abnormality determination in the nodes 110, 120, 130, and 140 even when using measured values obtained from the optical channel monitor 106 with low resolution. As a result, the installation cost can be reduced compared to the case where each node is provided with a monitor with high resolution such as an OSA. Furthermore, since the amount of data acquired from the monitor is reduced, the communication load can be reduced.
- the monitoring device 1 detects that the nodes 110 and 120 in which an abnormality has occurred on the optical path OP, which is the communication route. , 130 and 140 are identified.
- the data acquisition unit 11 of the monitoring device 1 acquires the power value of the optical signal of the target channel Tch in which an abnormality has been detected from the optical channel monitor 106 provided on the output side of each node 110 , 120 , 130 , 140 .
- the data acquisition unit 11 acquires a power value IV1 (first power value) in a range Ra (first range) covering the entire wavelength of the target channel Tch.
- the determination unit 12 compares the power value IV1 with a threshold value TH1 set based on the power value in the range Ra in the steady state. When the difference D1 between the power value IV1 and the threshold TH1 exceeds a predetermined value PD due to an abnormality in the waveform of the target channel Tch, the determination unit 12 can determine that the node outputting the optical signal is abnormal.
- the filtering function of the WSS 103 of the nodes 110, 120, 130, and 140 may not be possible to determine whether the filtering function of the WSS 103 of the nodes 110, 120, 130, and 140 is abnormal only by comparing the power value IV1 and the threshold TH1.
- Node controllers 151 , 152 , 153 and 154 perform power control to compensate for waveform losses caused by WSS 103 filtering. This is the same when a loss occurs due to an abnormality in the filter function of WSS 103 . Therefore, the waveform due to the filter abnormality of the WSS 103 may have the same power over the entire wavelength as the steady-state waveform. In this case, the difference D1 between the power value IV1 obtained from the range Ra covering the entire wavelength and the threshold TH1 may not be so large as to exceed the predetermined value PD. In this case, abnormality of the nodes 110, 120, 130, and 140 cannot be determined.
- the data acquisition unit 11 obtains the power values IV2 and IV3 (second power values) in the ranges Rb and Rc (second ranges) including part of the wavelength of the target channel Tch. get.
- the determination unit 12 also compares the power values IV2 and IV3 with thresholds TH2 and TH3 set based on the ranges Rb and Rc in the steady state, respectively.
- the ranges Rb and Rc that include part of the wavelength, it becomes easier to include locations where there is a large difference between the abnormal waveform and the steady state waveform.
- the ranges Rb and Rc do not cover the entire wavelength, the power values within the range are less likely to result in the same steady state than the range Ra. Therefore, it is possible to increase the possibility that the differences D2 and D3 between the power values IV2 and IV3 of the ranges Rb and Rc and the threshold values TH2 and TH3 exceed the predetermined value PD and that an abnormality is determined.
- the nodes 110, 120, 130, and 140 multiplex the optical signals of a plurality of channels Ch1, Ch2, and Ch3 to generate optical wavelength multiplexed signals, and the wavelength bands assigned to each of the channels Ch1, Ch2, and Ch3.
- a WSS 103 (wavelength selective switch) is provided to filter the optical signal according to the BW.
- the determination unit 12 of the monitoring device 1 determines abnormality of the constituent elements (elements) other than the WSS 103 in the nodes 110, 120, 130, and 140 based on the comparison between the power value IV1 and the threshold TH1.
- the determination unit 12 determines whether the WSS 103 is abnormal based on comparison between the power values IV2 and IV3 and the thresholds TH2 and TH3.
- the determination unit 12 By acquiring a plurality of power values IV1, IV2, and IV3 from different ranges Ra, Rb, and Rc by the data acquisition unit 11, the determination unit 12 also isolates the cause of the abnormality in the nodes 110, 120, 130, and 140. be able to. Thereby, the convenience of the monitoring device 1 can be improved.
- the data acquisition unit 11 of the monitoring device 1 sets two ranges Rb and Rc that include part of the wavelength of the target channel Tch (channel) and are shifted from each other as second ranges. are obtained as second power values.
- the result may be the same power as in the steady state.
- the difference D2 between the power value IV2 and the threshold TH2 does not exceed the predetermined value PD, and the abnormality of the nodes 110, 120, 130, and 140 cannot be determined.
- the data acquisition unit 11 sets two ranges Rb and Rc that are displaced from each other as the second range, and acquires the power values IV2 and IV3 from the respective ranges as the second power values.
- the determination unit 12 can determine that the nodes 110, 120, 130, and 140 are abnormal, so the accuracy of the abnormality determination can be improved.
- the number of ranges to be set as the second range is not limited to two, and three or more ranges may be set, and the power value of each range may be acquired as the second power value.
- the monitoring device 1 includes a threshold setting unit 13 that sets thresholds TH1, TH2, and TH3.
- the threshold setting unit 13 acquires the power values of the channel serving as the route of the switched optical signal and the power values of the adjacent channels from the optical channel monitor 106, and sets the threshold TH1. , TH2 and TH3.
- the threshold setting unit 13 updates the thresholds TH1, TH2, and TH3 at the switching timing, so that the thresholds TH1, TH2, and TH3 reflect the power values in the steady state, and the nodes 110, 120, 130, and 140 become abnormal. It is possible to improve the accuracy of determining the
- the above effects can also be applied to the monitoring method implemented by the monitoring device 1 and the monitoring program for causing the computer 900 to function as the monitoring device 1.
- Modification 1 of the present embodiment will be described with reference to the drawings. A detailed description of the same configuration and processing of Modification 1 as those of the present embodiment will be omitted.
- 13A and 13B are diagrams for explaining a range for obtaining power values in Modification 1.
- FIG. FIG. 14 is a diagram explaining a comparative example.
- Modification 1 modifies the processing of the above-described embodiment so that it is possible to determine abnormality of nodes 110, 120, 130, and 140 even when abnormality occurs in the waveforms of all channels Ch1, Ch2, and Ch3. It is something to do.
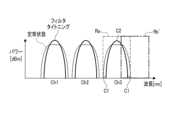
- FIG. 13 shows an example in which an abnormality called filter tightening occurs in the waveforms of all channels Ch1, Ch2, and Ch3.
- FIG. 13 shows steady-state waveforms in dashed lines and filter tightening waveforms in solid lines.
- the filter tightening waveform has a decreased power in the edge component C1 and an increased power in the center component C2 when compared to the steady state waveform.
- the control unit 10 performs an abnormality determination process when receiving a notification that optical signal deterioration has been detected from the transponders 111 and 141 .
- the data acquisition unit 11 identifies the target channel Tch, which is the path of the optical signal in which deterioration has been detected. process.
- the data acquisition unit 11 selects a termination channel from among all channels Ch1, Ch2, and Ch3.
- a terminated channel means a channel that is not adjacent to another channel on either end of the waveform. In the example of FIG. 13, channel Ch3 is selected as the termination channel.
- Channel Ch3 is bordered on the left end by channel Ch2, but is not bordered on the right end by another channel.
- the data acquisition unit 11 may select channel Ch1 as the termination channel.
- Channel Ch1 is bordered on the right end by channel Ch2, but is not bordered on the left end by another channel.
- the data acquisition unit 11 acquires the power value IV1 in the range Ra including the entire wavelength of the optical signal of the channel Ch3, as in the embodiment.
- the data acquisition unit 11 acquires the power value IV2' of the range Rb' including the right end portion of the wavelength of the channel Ch3 where other channels are not adjacent.
- Range Rb' is a range that does not cover the entire wavelength but only part of the wavelength. If the channel Ch1 is the terminal channel, the data acquisition unit 11 acquires the power value IV2' from the range Rb' including the left end of the channel Ch1 where no other channel is adjacent.
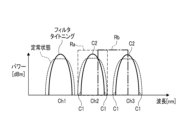
- FIG. 14 shows, as a comparative example, a case where ranges Ra and Rb are set for channel Ch2 having channels Ch1 and Ch3 adjacent to both ends thereof, as in the embodiment.
- the node controllers 151, 152, 153, and 154 perform power control so as to compensate for the loss caused by the WSS 103's filter malfunction. Therefore, as shown in FIG. 14, in the filter tightening waveform, the power of the end component C1 is lower than in the steady state, but the power of the central component C2 is higher than in the steady state.
- Range Rb includes end components C1 where the power of channels Ch2 and Ch3 is reduced, and central component C2 where the power of channel Ch3 is increased.
- the difference D2 between the power value IV2 in the range Rb and the threshold TH2 does not exceed the predetermined value PD, and the nodes 110, 120, 130, and 140 Abnormalities may not be detected.
- the data acquisition unit 11 sets range Ra and range Rb' in the termination channel Ch3. Furthermore, the data acquisition unit 11 sets the range Rb' to include the right end portion where other channels of the termination channel Ch3 are not adjacent. Thereby, the range Rb' does not include waveforms of adjacent channels. That is, the decrease in power due to the component C1 at the edge of the channel Ch3 is not offset by the increase in the central component C2 of the adjacent channel. Therefore, the power value IV2' of the range Rb' becomes smaller due to the end component C1, and the difference D2' from the threshold TH2' tends to exceed the predetermined value PD. As a result, the accuracy of determining whether the nodes 110, 120, 130, and 140 are abnormal can be improved.
- the threshold TH2' can be set by performing a process similar to the threshold setting process of the embodiment when the optical signal of the termination channel Ch3 is switched.
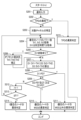
- FIG. 15 is a flowchart showing the flow of abnormality determination processing according to Modification 1.
- the transponder 141 of the receiving end node 140 notifies of deterioration of signal quality.
- a notification is input to the monitoring device 1 (step S101). If the notification includes an abnormality of the transponder 141 itself (step S102: Yes), the control unit 10 determines the abnormality of the transponder 141 (step S114) and notifies the abnormality of the transponder 141 via the input/output unit 15. If the notification does not include an abnormality in the transponder 141 itself (step S102: No), the control unit 10 proceeds to step S103.
- the data acquisition unit 11 identifies the target channel Tch, which is the path of the optical signal in which deterioration has been detected (step S103). If the target channels Tch are not all channels Ch1, Ch2, and Ch3 (step S104: No), the data acquisition unit 11 proceeds to the process of step S04 in FIG. 10 and performs the same abnormality determination process as in the embodiment.
- the data acquisition unit 11 selects channel Ch3, which is the terminal channel.
- the data acquisition unit 11 acquires the power values IV1 and IV2' from the ranges Ra and Rb' of the termination channel Ch3 of the i-th node (step S105).
- the determination unit 12 calculates a difference D1 between the power value IV1 and the threshold TH1 and a difference D2' between the power value IV2' and the threshold TH2' (step S106).
- step S107: Yes the determination unit 12 determines that the constituent elements of the node other than the WSS 103 are abnormal (step S110). The determination unit 12 notifies the user of the determination result via the input/output unit 15 . If the difference D1 does not exceed the predetermined value PD (step S107: No), the determination unit 12 proceeds to step S108. When the difference D2' exceeds the predetermined value PD (step S108: Yes), the determination unit 12 determines that the WSS 103 of the node is abnormal (step S109). The determination unit 12 notifies the user of the determination result via the input/output unit 15 .
- step S112 If i is not 1 (step S112: No), the determination unit 12 returns to step S105 and performs abnormality determination processing for the i-th node. If i is 1 (step S112: YES), the determination unit 12 determines that the sending end node 110, which is the first node, is abnormal (step S113).
- the range Rb set to include part of channel Ch may include the wavelengths of adjacent channels Ch. Since filter tightening also occurs in the wavelength of the adjacent channel Ch, the difference D2 between the power value IV2 in the range Rb and the threshold TH2 does not exceed the predetermined value PD, and it is determined that the nodes 110, 120, 130, and 140 are abnormal. may not be possible.
- the range Rb' is set so as to include the end portions of the termination channels Ch1 and Ch3 to which no other channel is adjacent.
- the difference D2' between the power value IV2' and the threshold TH2' may exceed the predetermined value PD when filter tightening occurs. Therefore, the accuracy of determining whether the nodes 110, 120, 130, and 140 are abnormal can be improved.
- step S104 when the target channels Tch are all channels Ch1, Ch2, and Ch3 (step S104: YES), two power values IV1 and IV2' are obtained from the end channel Ch3, and the abnormality determination process is performed. .
- only two power values are obtained, so the amount of data processing in the abnormality determination process can be reduced. It should be noted that this is not limited to the example of FIG. 15, and even if the target channels are all channels Ch1, Ch2, and Ch3, the process proceeds to step S04 in FIG.
- the values IV1, IV2, and IV3 may be acquired and the abnormality determination process may be performed. In that case, the range Rb is set to include the ends of the channel.
- the determination unit 12 can end the abnormality determination process when an abnormality is determined in any channel.
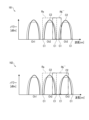
- FIG. 16 is a diagram illustrating a range for acquiring power values in Modification 2.
- the range Rb' is set for channel Ch3, which is the terminal channel, so that waveforms of adjacent channels are not included.
- the range Rb'' is set so that when filter tightening occurs, an abnormality can be determined even in channels adjacent to each other on both sides.
- FIG. 16 shows an example of setting range Rb'' for channel Ch2. Specifically, the data acquisition unit 11 sets a range Rb'' which has a width different from the range Ra covering the entire wavelength and includes the end of the wavelength of the channel Ch2.
- the data acquisition unit 11 acquires the power value IV2'' in the range Rb'' from the optical channel monitor 106.
- the determination unit 12 calculates the difference D2'' between the power value IV2'' of the range Rb'' and the threshold TH2'', as in the embodiment.
- the determination unit 12 determines that the node is abnormal if the difference D2'' exceeds a predetermined value PD.
- the threshold TH2'' can be set by performing the same process as the threshold setting process of the embodiment.
- the width of the range Rb'' may be narrower than the range Ra.
- the range Rb'' does not include the central component C2 where the adjacent channel Ch3 has increased power.
- the decrease in power due to the component C1 at the ends of the channels Ch2 and Ch3 is not offset by the increase due to the central component C2, so the power value IV2'' in the range Rb'' is reduced. This increases the difference D2'' between the power value IV2'' and the threshold TH2'', making it easier to determine an abnormality.
- the width of range Rb'' may be wider than range Ra.
- the proportion of the central component C2 of the channel Ch3 in the range Rb'' is increased.
- the power value IV2'' of the range Rb'' increases. This increases the difference D2'' between the power value IV2'' and the threshold TH2'', making it easier to determine an abnormality.
- the data acquisition unit 11 changes the width of the range Ra and the range Rb'' by changing the resolution setting of the optical channel monitor 106 via the node controllers 151, 152, 153, and 154.
- the resolution of the optical channel monitor 106 finer, the width of the range Rb'' can be narrowed as shown in the diagram of reference numeral 161 in FIG.
- the width of the range Rb'' can be widened, as shown in the diagram of reference numeral 162 in FIG.
- the data acquisition unit 11 of the monitoring device 1 sets a range Rb'' having a width different from the range Ra (first range) and including the end of the wavelength of the channel as a second range, and the power value Obtain IV2'' (second power value).
- the power-decreasing component (component C1) and the power-increasing component (component C2) included in the range Rb'' The ratio can be different. This increases the difference D2'' between the power value IV2'' and the threshold TH2'', thereby improving the accuracy of node abnormality determination.
- the abnormality of a node can be determined not only in the termination channel but also in the channel Ch having adjacent channels on both ends, so that the convenience of the monitoring device 1 can be improved. .
- the process of Modification 2 can be performed when the target channels Tch are all channels Ch1, Ch2, and Ch3 (step S104: Yes).
- the data acquisition unit 11 selects an arbitrary channel from all channels Ch1, Ch2, and Ch3, acquires power values IV1 and IV2'' at two points in the range Ra and the range Rb'', and performs abnormality determination processing. It can be performed.
- the data acquisition unit 11 may acquire both the widened power value and the narrowed power value of the range Rb''.
- the process may proceed to step S04 in FIG. 10 and sequentially perform abnormality determination processing for each channel.
- the process may proceed to step S04 in FIG. 10 and sequentially perform abnormality determination processing for each channel.
- power values IV1, IV2, and IV3 from ranges Ra, Rb, and Rc for each channel, power values IV2'' of range Rb'' are obtained.
- the determination unit 12 can end the abnormality determination process when an abnormality is determined in any channel.
- FIG. 17 is a functional block diagram showing the configuration of a monitoring device 1A according to Modification 3.
- a monitoring device 1A according to Modification 3 has a threshold correction unit 14 in addition to the configuration described in the embodiment.
- the data acquisition unit 11 acquires power values IV1, IV2, and IV3 from ranges Ra, Rb, and Rc, respectively, in the target channel Tch of each node, as in the embodiment.
- the data acquisition unit 11 causes the optical channel monitor 106 to measure the power value IV1 for the predetermined time T only for the power value IV1 in the range Ra, and acquires data of the power value IV1 for the predetermined time T.
- the threshold setting unit 13 determines whether there is a change in the power value IV1 from the data for the predetermined time period T acquired by the data acquisition unit 11 .
- the threshold setting unit 13 determines the offset value based on the amount of fluctuation.
- the threshold setting unit 13 adds the determined offset value to each of the thresholds TH1, TH2, and TH3, thereby correcting the thresholds TH1, TH2, and TH3.
- the determination unit 12 compares the power values IV1, IV2, and IV3 with the corrected thresholds TH1, TH2, and TH3 to perform abnormality determination processing in the same manner as in the embodiment.
- the WSS 103 Normally, if the grid width is not changed, the WSS 103 outputs a constant power value IV1, but the power value IV1 may not be constant and fluctuate due to factors such as severe environmental conditions.
- the offset value is determined based on the variation amount of the power value IV1, and the threshold values TH1, TH2, and TH3 are corrected, so that abnormality determination processing can be performed according to the environmental conditions.
- FIG. 18 is a flowchart showing the flow of threshold correction processing according to Modification 3. As shown in FIG. Since the processing of steps S201 to S203 in FIG. 18 is the same as the processing in steps S01 to S03 of FIG. 10, description thereof is omitted.
- the data acquisition unit 11 acquires power values IV1, IV2, and IV3 from ranges Ra, Rb, and Rc, respectively, in the target channel Tch of the i-th node. The data acquisition unit 11 acquires data for a predetermined time T for the power value IV1.
- the threshold correction unit 14 refers to the data of the power value IV1 for the predetermined time T and determines whether the power value IV1 has changed (step S205). If the power value IV1 does not change (step S205: No), the threshold correction unit 14 inputs the thresholds TH1, TH2, and TH3 to the determination unit 12 without correction. If the power value IV1 fluctuates (step S205: Yes), the threshold correction unit 14 determines an offset value from the fluctuation amount, and corrects the thresholds TH1, TH2, and TH3 by adding the offset value (step S206). The threshold correction unit 14 inputs the corrected thresholds TH1, TH2, and TH3 to the determination unit 12 .
- the determination unit 12 calculates differences D1, D2 and D3 between the power values IV1, IV2 and IV3 and the thresholds TH1, TH2 and TH3 input from the threshold correction unit 14 (step S207). Since the processing of steps S208 to S215 is the same as the processing of steps S06 to S13 in FIG. 10, the description thereof is omitted.
- the monitoring device 1A includes a threshold correction unit 14 that corrects the thresholds TH1, TH2, and TH3 based on the variation amount of the power value IV1 (first power value) during the predetermined time period T acquired by the data acquisition unit 11. Prepare. As a result, it is possible to improve the accuracy of node abnormality determination even in environmental conditions in which the power values IV1, IV2, and IV3 fluctuate.
- the monitoring device may be applied to node controllers 151-154 that control each of the nodes 110-140.
- part of the functional configuration of the monitoring device 1 may be implemented by the node controllers 151 , 152 , 153 , and 154 .
- the network controller may set the threshold, and the node controllers 151, 152, 153, and 154 may perform the abnormality determination processing.
- monitoring device 11 data acquisition unit 12 determination unit 13 threshold setting unit 14 threshold correction unit 15 input/output unit 16 storage unit 110, 120, 130, 140 node (transmission device, OXC) 103 wavelength selective switch (WSS) 106 optical channel monitor (monitor) Ra range (first range) Rb, Rb', Rb'', Rc range (second range) IV1 power value (first power value) IV2, IV2', IV2'', IV3 power values (second power values)
- WSS wavelength selective switch
Landscapes
- Engineering & Computer Science (AREA)
- Computer Networks & Wireless Communication (AREA)
- Signal Processing (AREA)
- Physics & Mathematics (AREA)
- Electromagnetism (AREA)
- Optical Communication System (AREA)
Abstract
監視装置(1)のデータ取得部(11)は、ノード(110~140)が出力する光信号のパワー値を測定する光チャネルモニタ(106)から、対象チャネル(TCh)の波長全体を含む範囲(Ra)のパワー値(IV1)を取得し、対象チャネル(Tch)の波長の一部を含む範囲(Rb、Rc)のパワー値(IV2、IV3)を取得する。判定部(12)は、パワー値(IV1、IV2、IV3)を、それぞれノード(110~140)の定常状態におけるパワー値に基づいた閾値(TH1、TH2、TH3)と比較して、ノード(110~140)の異常を判定する。
Description
本発明は、監視装置、監視方法および監視プログラムに関する。
光伝送システムでは、光ファイバによって相互に接続された複数のノードによって、光信号の通信経路である光パスが構築されている。光パスにおいて、送信端ノードと受信端ノードが、複数の中継ノードを介して接続されている。
光パスを構成する複数のノードのいずれかに異常が生じると、光パスで送信される光信号の品質に影響を与えるため、異常が生じたノードを特定することが求められている。
たとえば、各ノードにOSA(Optical Spectrum Analyzer)等の高分解能のモニタを設けて、監視装置においてノードから出力される光信号の波形形状を正確に把握することで、ノードの異常を判定することが提案されている(例えば、非特許文献1参照)。
たとえば、各ノードにOSA(Optical Spectrum Analyzer)等の高分解能のモニタを設けて、監視装置においてノードから出力される光信号の波形形状を正確に把握することで、ノードの異常を判定することが提案されている(例えば、非特許文献1参照)。
Behnam Shariati, et al. "Learning From the Optical Spectrum: Failure Detection and Identification" JOURNAL OF LIGHTWAVE TECHNOLOGY, VOL. 37, NO. 2 (2019)
しかしながら、高分解能のモニタを各ノードに設けることで、光伝送システムにおける設置コストが増加する。各モニタから監視装置に送信されるデータ量も増加するため通信負荷が増大する。
監視装置において、モニタの設置コストおよびモニタとの通信負荷を低減しつつ、ノードの異常を判定する精度を向上させることが求められている。
本発明に係る監視装置は、前記伝送装置が出力する前記光信号のパワー値を測定するモニタから、前記チャネルの波長全体を含む第1範囲の第1パワー値を取得し、前記チャネルの波長の一部を含む第2範囲の第2パワー値を取得するデータ取得部と、前記第1パワー値および前記第2パワー値を、それぞれ前記伝送装置の定常状態におけるパワー値に基づいた閾値と比較して、前記伝送装置の異常を判定する判定部と、を備えることを特徴とする。
本発明によれば、モニタの設置コストおよびモニタとの通信負荷を低減しつつ、ノードの異常を判定する精度を向上させることができる。
次に、本発明を実施するための形態(以下、「本実施形態」と称する。)について、図面を参照して説明する。本実施形態では、監視装置を光伝送システムに適用する例を説明する。
図1は、本実施形態に係る監視装置が適用される光伝送システムの概念図である。
図2は、ノードの構成を示す図である。
図1は、本実施形態に係る監視装置が適用される光伝送システムの概念図である。
図2は、ノードの構成を示す図である。
図1に示すように、光伝送システム100は、光伝送路である光ファイバfbによって相互に接続された複数のノードを有する。図1では、4つのノード110、120、130、140によって、光信号の通信経路である光パスOPが構成される例を示している。光パスOPにおいて、光信号が、ノード110からノード140に送信される例を示している。すなわち、ノード110が送信端ノードであり、ノード140が受信端ノードであり、ノード120、130は中継ノードである。
なお、図1では、光伝送システム100において複数のノード110、120、130、140が直列に接続される例を示しているが、ノードはメッシュ状またはリング状に接続されていても良い。すなわち、各ノードは、図示されない他のノードに接続可能であり、他のノードとの間で光信号の出力および入力を行うことができる。
なお、図1では、光伝送システム100において複数のノード110、120、130、140が直列に接続される例を示しているが、ノードはメッシュ状またはリング状に接続されていても良い。すなわち、各ノードは、図示されない他のノードに接続可能であり、他のノードとの間で光信号の出力および入力を行うことができる。
各ノード110、120、130、140は、伝送装置として構成される。伝送装置は、たとえば、光クロスコネクト(Optical Cross Connect,OXC)装置とすることができる。各ノード110、120、130、140は、複数のチャネルの光信号が波長多重された光波長多重信号を伝送するものである。図示は省略するが、光パスOPの各ノード110、120、130、140の間には、光波長多重信号を増幅するインラインアンプ(InLine-Amplifier、ILA)を設けても良い。
送信端ノード110と受信端ノード140は、それぞれ、送受信器であるトランスポンダ(TPD、Transponder)111、141を備える。なお、図示は省略するが、中継ノードであるノード120、130もトランスポンダを備えていても良く、ノード120、130を、他の光パスOPにおける送信端ノードまたは受信端ノードとしても良い。
送信端ノード110は、トランスポンダ111から入力された光信号を波長多重して光波長多重信号を出力する。中継ノード120、130は、入力された光波長多重信号に含まれる光信号を分離する。中継ノード120、130は、分離した光信号を再び波長多重して光波長多重信号を出力する。受信端ノード140は、入力された光波長多重信号に含まれる光信号を分離して、トランスポンダ141で受信する。
ノード110~140は同じ構成を有するが、図2では、代表してノード120の構成を示している。
図2に示すように、ノード120は、前段アンプ101、カプラ(CPL、Coupler)102、波長選択スイッチ(Wave Selective Switch、以降、「WSS」とも表記する)103と、後段アンプ104、選択器(SEL:Selector)105および光チャネルモニタ(OCM、 Optical Channel Monitor)106等を備えている。ノード120は、また、ノード120の動作を制御するノードコントローラ152を備えている。
図2に示すように、ノード120は、前段アンプ101、カプラ(CPL、Coupler)102、波長選択スイッチ(Wave Selective Switch、以降、「WSS」とも表記する)103と、後段アンプ104、選択器(SEL:Selector)105および光チャネルモニタ(OCM、 Optical Channel Monitor)106等を備えている。ノード120は、また、ノード120の動作を制御するノードコントローラ152を備えている。
前段アンプ101の出力側が、カプラ102およびWSS103を介して、後段アンプ104の入力側に接続される。選択器105は、前段アンプ101の出力と、カプラ102の出力と、WSS103の出力のうち何れかを選択して光チャネルモニタ106に出力する。
光チャネルモニタ106(モニタ)は、選択器105から入力された前段アンプ101、カプラ102またはWSS103の出力パワーを測定する。後述する監視装置1の異常判定処理には、WSS103の出力パワーの測定値が用いられる。測定値はノードコントローラ152に入力される。
前段アンプ101は、光伝送路である光ファイバfbから入力される光波長多重信号を増幅して、WSS103に入力する。
WSS103は、光波長多重信号を、複数のチャネルの光信号に分離する。WSS103は、分離した光信号を、設定された出力先に出力する。WSS103は、ドロップ対象の光信号をトランスポンダ(不図示)に出力する。WSS103は、トランスポンダから入力されたアド対象の光信号を、設定されたチャネルに入力し、スルー対象の光信号と共に多重化して、光波長多重信号を生成し、後段アンプ104に入力する。後段アンプ104は光波長多重信号を増幅して、光ファイバfbに出力する。
WSS103は、図示は省略するが、例えば、LCOS(Liquid Crystal on Silicon)等のアレイ型光ビーム偏向素子を備える。LCOSは、数百万画素の二次元マトリックス構造を有し、光信号に対して複数の制御画素を割り当てることができる。これにより、WSS103は、チャネルごとの光信号の通過帯域を、ハードウェア構成によらず、ノードコントローラ152の制御により変化させることができる。すなわち、WSS103は、各チャネルの光信号を、ノードコントローラ152が設定した波長帯域にフィルタリングするフィルタ機能を備えている。
図3は、WSS103から出力される複数のチャネルCh1、Ch2、Ch3の光信号の波形を示す図である。図3では、3つのチャネルCh1、Ch2、Ch3を示しているが、チャネル数は任意である。
ノードコントローラ152は、利用可能な波長帯域全体をグリッド幅で分割し、チャネルCh1、Ch2、Ch3にそれぞれの波長帯域BWを割り当てる。グリッド幅は12.5GHzを最小単位とし、12.5GHz、25GHz、50GHz、100GHzと可変である。すなわち、ノードコントローラ152は、グリッド幅を変更することにより、チャネルの数とそれぞれの波長帯域BWの幅を変更可能である。
図3は、WSS103のフィルタ機能が正常に機能した状態(定常状態)における波形を示している。定常状態において、チャネルCh1、Ch2、Ch3の波形は概ね左右対称の形状を有し、中央になだらかなピークを有する。
なお、以下の説明において、チャネルCh1、Ch2、Ch3を区別する必要がなければ、単にチャネルChともいう。
なお、以下の説明において、チャネルCh1、Ch2、Ch3を区別する必要がなければ、単にチャネルChともいう。
WSS103は、図示は省略するが、可変光減衰器を備えている。WSS103は、チャネルCh1~Ch3の光信号を減衰して多重化する。可変光減衰器における減衰量は、ノードコントローラ152によって制御される。ノードコントローラ152は、光チャネルモニタ106から、チャネルCh単位の光パワーの測定値を取得する。ノードコントローラ152は、測定値に基づいて、可変光減衰器における減衰量を制御する。ノードコントローラ152は、各チャネルChの光信号がWSS103でフィルタリングされることによって生じるパワーの損失を補償するようにパワー制御を行う。
光チャネルモニタ106は、各チャネルChの光信号のパワー値を測定する。光チャネルモニタ106は、選択器105から入力された各チャネルChの光信号をフィルタで切り出して、切り出した範囲のパワーの合計値を測定する。光チャネルモニタ106は、フィルタの分解能の設定を変更することで、光信号の切り出し範囲は変更可能である。光チャネルモニタ106の分解能の設定はノードコントローラ152によって制御される。後述する監視装置1の異常判定処理の際に、ノードコントローラ152は、光チャネルモニタ106の分解能を変更しながら、複数の範囲におけるパワー値の測定を行う。
図1に示すように、ノード110、120、130、140は、それぞれノードコントローラ151、152、153、154を備えている。監視装置1は、各ノードコントローラ151、152、153、154と通信ネットワークを介して接続されている。監視装置1はさらに、送信端ノード110と受信端ノード140に設けられたトランスポンダ111、141にも、通信ネットワークを介して接続されている。
トランスポンダ111、141は、内部にデジタル信号処理(DSP)のチップが含まれており、余剰リソースを活用して光パスOPで送信される光信号の品質を監視する。監視方法は、たとえば、特開2020-088628号公報に記載される公知の方法を用いることができる。トランスポンダ111、141は、信号品質の劣化を検出した場合、監視装置1に通知を入力する。通知には、劣化を検出した光信号を特定する情報が含まれている。また、トランスポンダ111、141自体の異常が劣化の原因として特定されていれば、通知にはトランスポンダ111、141の異常を示す情報が含まれている。
図4は、監視装置1の構成を示す機能ブロック図である。
監視装置1は、例えば、光伝送システム100全体の管理を行うネットワークコントローラとして構成することができる。すなわち、監視装置1は、ノードコントローラ151、152、153、154およびトランスポンダ111、141と通信を行うことによって、これらを制御すると共に、光伝送システム100の異常を監視する。
図4に示すように、監視装置1は、制御部10と、入出力部15と、記憶部16と、を備える。
監視装置1は、例えば、光伝送システム100全体の管理を行うネットワークコントローラとして構成することができる。すなわち、監視装置1は、ノードコントローラ151、152、153、154およびトランスポンダ111、141と通信を行うことによって、これらを制御すると共に、光伝送システム100の異常を監視する。
図4に示すように、監視装置1は、制御部10と、入出力部15と、記憶部16と、を備える。
入出力部15は、ノードコントローラ151、152、153、154およびトランスポンダ111、141との間で、データの入出力を行う。この入出力部15は、通信回線を介して情報の送受信を行う通信インタフェースと、不図示のキーボード等の入力装置やディスプレイ等の出力装置との間で情報の入出力を行う入出力インタフェースとから構成される。
記憶部16には、さらに、制御部10の各機能部を実行させるためのプログラム(監視プログラム)や、制御部10の処理に必要な情報が記憶される。一例として、記憶部16には、ノード110、120、130、140の識別情報および構成情報等が記憶されている。さらに、記憶部16には、光パスOPで送信される各光信号のチャネルの割り当て情報を含む経路情報が記憶される。また、記憶部16には、後述する異常判定処理において用いる閾値等の情報が記憶されている。
制御部10は、監視装置1が実行する処理の全般を司る。制御部10は、トランスポンダ111、141から信号品質の劣化の通知が入力され、かつ通知にトランスポンダ111、141自体の異常が含まれていなかった場合、ノード110、120、130、140に対して異常判定処理を行う。制御部10は、これによって異常が生じたノードを特定する。
制御部10は、データ取得部11、判定部12および閾値設定部13を含んで構成される。
データ取得部11は、トランスポンダ141の通知から、劣化が検出された光信号を特定する。データ取得部11は、記憶部16に記憶された経路情報を参照して、劣化した光信号の経路であるチャネルCh(以降、「対象チャネルTch」という)を特定する。
データ取得部11は、ノードコントローラ151、152、153、154と通信を行い、各ノード110、120、130、140の光チャネルモニタ106に、対象チャネルTchのパワー値を測定させる。ノードコントローラ151、152、153、154は、光チャネルモニタ106および選択器105(図2参照)を制御して、WSS103が出力した対象チャネルTchのパワー値を光チャネルモニタ106に測定させる。ノードコントローラ151、152、153、154は、光チャネルモニタ106の測定値を取得して、データ取得部11に入力する。
データ取得部11は、トランスポンダ141の通知から、劣化が検出された光信号を特定する。データ取得部11は、記憶部16に記憶された経路情報を参照して、劣化した光信号の経路であるチャネルCh(以降、「対象チャネルTch」という)を特定する。
データ取得部11は、ノードコントローラ151、152、153、154と通信を行い、各ノード110、120、130、140の光チャネルモニタ106に、対象チャネルTchのパワー値を測定させる。ノードコントローラ151、152、153、154は、光チャネルモニタ106および選択器105(図2参照)を制御して、WSS103が出力した対象チャネルTchのパワー値を光チャネルモニタ106に測定させる。ノードコントローラ151、152、153、154は、光チャネルモニタ106の測定値を取得して、データ取得部11に入力する。
図5は、データ取得部11がパワー値を取得する範囲を説明する図である。
データ取得部11は、対象チャネルTchに対して、3つの範囲Ra、Rb、Rcにおけるパワー値IV1、IV2、IV3を、光チャネルモニタ106から取得する。
図5の符号51の図に示すように、データ取得部11は、対象チャネルTchの光信号の波長全体を含む範囲Raのパワー値IV1を取得する。
図5の符号52の図に示すように、データ取得部11は、対象チャネルTchの光信号の波長の一部を含む範囲Rbのパワー値IV2を取得する。
図5の符号53の図に示すように、データ取得部11は、対象チャネルTchの光信号の波長の一部を含み、範囲Rbと位置をずらした範囲Rcのパワー値IV3を取得する。
パワー値IV1は、第1パワー値に対応し、パワー値IV2、IV3は、第2パワー値に対応する。
データ取得部11は、対象チャネルTchに対して、3つの範囲Ra、Rb、Rcにおけるパワー値IV1、IV2、IV3を、光チャネルモニタ106から取得する。
図5の符号51の図に示すように、データ取得部11は、対象チャネルTchの光信号の波長全体を含む範囲Raのパワー値IV1を取得する。
図5の符号52の図に示すように、データ取得部11は、対象チャネルTchの光信号の波長の一部を含む範囲Rbのパワー値IV2を取得する。
図5の符号53の図に示すように、データ取得部11は、対象チャネルTchの光信号の波長の一部を含み、範囲Rbと位置をずらした範囲Rcのパワー値IV3を取得する。
パワー値IV1は、第1パワー値に対応し、パワー値IV2、IV3は、第2パワー値に対応する。
光チャネルモニタ106は、フィルタの分解能を変更して光信号から範囲Ra、Rb、Rcの光を切り出し、それぞれのパワー値IV1、IV2、IV3を測定する。パワー値は、各範囲におけるパワーの合計値、すなわちパワーの積分値を意味する。
範囲Ra、Rb、Rcの幅は、各チャネルChに割り当てられた波長帯域BW(図3参照)に応じて決定される。図5では、一例として、グリッド幅が50GHzである場合に、範囲Ra、Rb、Rcの幅を0.42nmとしている。なお、範囲Rb、Rcの幅は、範囲Raと同じとしても良く、異なるものとしても良い。
範囲Ra、Rb、Rcの幅は、各チャネルChに割り当てられた波長帯域BW(図3参照)に応じて決定される。図5では、一例として、グリッド幅が50GHzである場合に、範囲Ra、Rb、Rcの幅を0.42nmとしている。なお、範囲Rb、Rcの幅は、範囲Raと同じとしても良く、異なるものとしても良い。
範囲Rb、Rcは、互いに位置をずらして設定すれば良く、その位置は限定されない。範囲Rb、Rcの位置は、たとえば、範囲Raを挟んで対称となる位置としても良い。範囲Rb、Rcは、互いの一部が重なるように設定しても良く、あるいは互いに間隔を空けるように設定しても良い。
図5では、一例として、範囲Raの位置を(X)とした場合、範囲Rbの位置を(X+0.315nm)とし、範囲Rcの位置を(X-0.315nm)としている。
図5では、一例として、範囲Raの位置を(X)とした場合、範囲Rbの位置を(X+0.315nm)とし、範囲Rcの位置を(X-0.315nm)としている。
判定部12は、データ取得部11が取得したパワー値IV1、IV2、IV3を、それぞれ閾値TH1、TH2、TH3と比較する。閾値TH1、TH2、TH3は、後述する閾値設定部13において予め設定され、記憶部16に記憶されている。閾値TH1、TH2、TH3は、それぞれ、定常状態における範囲Ra、Rb、Rcのパワー値に基づいて設定される。
判定部12は、パワー値IV1、IV2、IV3と閾値TH1、TH2、TH3との差分D1、D2、D3を、絶対値として算出する。判定部12は、差分D1、D2、D3のいずれかが所定値PDを超えた場合、そのノードに異常が発生していると判定する。判定部12は、判定結果を、入出力部15を介してユーザに報知する。
パワー値IV1~IV3は、ノード110、120、130、140の異常を把握するために取得される。特に、パワー値IV2、IV3は、WSS103のフィルタ機能の異常によって生じた、光信号の波形の異常を把握するために取得される。
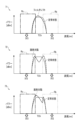
図6は、WSS103のフィルタ機能の異常によって生じる波形の異常の例を説明する図である。
図6の符号61~符号63の図では、定常状態の波形を実線で示し、異常が生じた波形を、破線で示している。
前記したように、定常状態の場合、波形は概ね左右対称の形状を有し、中央になだらかなピークを有する。WSS103のフィルタ機能に異常が生じると、波形に歪みが生じることがある。
図6の符号61の図は、フィルタシフトと呼ばれる波形の異常を示している。符号61の図に示すように、フィルタシフトの波形は左右非対称であり、中央より左側において、ピークが定常状態よりも大きく突出している。
符号62の図および符号63の図は、画素欠陥と呼ばれる波形の異常を示している。画素欠陥は、WSS103において光信号をフィルタリングするLCOSに画素欠陥が生じた状態を意味する。定常状態の波形が中央になだらかなピークを有するのに対し、符号62の図および符号63の図に示すように、画素欠陥の波形はピークとなる部分にパワーの大きな急落が生じている。符号62の図に示すように、パワーの急落は波形の中央に生じることもあれば、符号63の図に示すように、中央より右側、または左側にずれて生じることもある。
図6は、WSS103のフィルタ機能の異常によって生じる波形の異常の例を説明する図である。
図6の符号61~符号63の図では、定常状態の波形を実線で示し、異常が生じた波形を、破線で示している。
前記したように、定常状態の場合、波形は概ね左右対称の形状を有し、中央になだらかなピークを有する。WSS103のフィルタ機能に異常が生じると、波形に歪みが生じることがある。
図6の符号61の図は、フィルタシフトと呼ばれる波形の異常を示している。符号61の図に示すように、フィルタシフトの波形は左右非対称であり、中央より左側において、ピークが定常状態よりも大きく突出している。
符号62の図および符号63の図は、画素欠陥と呼ばれる波形の異常を示している。画素欠陥は、WSS103において光信号をフィルタリングするLCOSに画素欠陥が生じた状態を意味する。定常状態の波形が中央になだらかなピークを有するのに対し、符号62の図および符号63の図に示すように、画素欠陥の波形はピークとなる部分にパワーの大きな急落が生じている。符号62の図に示すように、パワーの急落は波形の中央に生じることもあれば、符号63の図に示すように、中央より右側、または左側にずれて生じることもある。
このような波形の異常は光信号の品質劣化に繋がるため、監視装置1において、波形の異常の原因であるノードを特定することが求められる。たとえば、OSA等の高分解能のモニタを用いれば、図6の符号61~符号63の図のような波形の異常を正確に把握して、ノードの異常を判定することができる。しかしながら、各ノード110、120、130、140にOSAを設けることによって設置コストが増加する。さらにOSAから監視装置1に送信されるデータ量が増加することで、通信負荷が増大する。
本実施形態において、各ノード110、120、130、140に設けられた光チャネルモニタ106は、前記したように、対象チャネルChの波長帯域BWに応じて設定された分解能でパワー値の測定を行う。すなわち、光チャネルモニタ106は、OSAに比べて、低い分解能でパワー値を測定している。光チャネルモニタ106の分解能を低くすることで、OSAに比べて設置コストおよび通信負荷が低減される。しかしながら、光チャネルモニタ106が測定するパワー値から、図6の符号61~符号63の図に示すような正確な波形の異常は把握できない。
本実施形態では、低い分解能に設定した光チャネルモニタ106を用いてノードの異常の判定をするために、複数の範囲Ra、Rb、Rcから取得したパワー値IV1、IV2、IV3のそれぞれを閾値TH1、TH2、TH3と比較する。
まず、波長全体を覆う範囲Raから測定されたパワー値IV1が、定常状態に基づいた閾値TH1と大きく異なっていた場合、ノード110、120、130、140の異常が生じていると判定することができる。
ただし、図6の符号61~符号63の図に示すような、WSS103のフィルタ機能の異常によって生じた波形の異常は、パワー値IV1と閾値TH1との比較では判定できないことがある。
ただし、図6の符号61~符号63の図に示すような、WSS103のフィルタ機能の異常によって生じた波形の異常は、パワー値IV1と閾値TH1との比較では判定できないことがある。
前記したように、ノードコントローラ151、152、153、154は、WSS103のフィルタリングによって生じた損失を補償するようにパワー制御を行う。WSS103のフィルタ機能の異常によって損失が生じた場合も、同様のパワー制御が行われる。
図6の符号61の図に示すように、フィルタシフトの波形は、左側に寄ったパワーのピークが定常状態より大きく突出しているが、右側のパワーは定常状態より小さくなっている。すなわち、波長全体のパワーが同じとなるようにパワー制御が行われている。この場合、波長全体を覆う範囲Raのパワー値IV1と閾値TH1との差分D1が、所定値PDを超えるほど大きくならない可能性がある。
図6の符号62の図および符号63の図に示すように、画素欠陥の波形も、パワーの急落が生じた箇所の両側は、定常状態よりもパワーが大きくなっている。すなわち、波長全体のパワーが同じとなるようにパワー制御が行われている。この場合、波長全体を覆う範囲Raのパワー値IV1と閾値TH1との差分D1が、所定値PDを超えるほど大きくならない可能性がある。
図6の符号61の図に示すように、フィルタシフトの波形は、左側に寄ったパワーのピークが定常状態より大きく突出しているが、右側のパワーは定常状態より小さくなっている。すなわち、波長全体のパワーが同じとなるようにパワー制御が行われている。この場合、波長全体を覆う範囲Raのパワー値IV1と閾値TH1との差分D1が、所定値PDを超えるほど大きくならない可能性がある。
図6の符号62の図および符号63の図に示すように、画素欠陥の波形も、パワーの急落が生じた箇所の両側は、定常状態よりもパワーが大きくなっている。すなわち、波長全体のパワーが同じとなるようにパワー制御が行われている。この場合、波長全体を覆う範囲Raのパワー値IV1と閾値TH1との差分D1が、所定値PDを超えるほど大きくならない可能性がある。
図7は、異常が生じた波形に対して範囲Rb、Rcからパワー値IV2、IV3を取得する態様を説明する図である。
図7の符号71~符号73の図に示すように、波長の一部を含む範囲Rb、Rcを設定することで、異常が生じた波形と定常状態とのパワーの差が大きい箇所が含まれやすくなる。
たとえば、符号71の図に示すように、範囲Rbには、フィルタシフトの波形の右側の、定常状態よりパワーが小さい箇所が含まれる。そのため、範囲Rbのパワー値IV2と閾値TH2との差分D2が大きくなりやすい。範囲Rcには、フィルタシフトの波形の左側の、定常状態よりパワーが大きい箇所が含まれる。そのため、範囲Rcのパワー値IV3と閾値TH3との差分D2が大きくなりやすい。
図7の符号71~符号73の図に示すように、波長の一部を含む範囲Rb、Rcを設定することで、異常が生じた波形と定常状態とのパワーの差が大きい箇所が含まれやすくなる。
たとえば、符号71の図に示すように、範囲Rbには、フィルタシフトの波形の右側の、定常状態よりパワーが小さい箇所が含まれる。そのため、範囲Rbのパワー値IV2と閾値TH2との差分D2が大きくなりやすい。範囲Rcには、フィルタシフトの波形の左側の、定常状態よりパワーが大きい箇所が含まれる。そのため、範囲Rcのパワー値IV3と閾値TH3との差分D2が大きくなりやすい。
図7の符号72の図は、波形の中央にパワーの急落が生じた画素欠陥を示しているが、範囲Rb、Rcには、両端側のパワーが上昇した箇所がそれぞれ含まれている。そのため、範囲Rb、Rcのパワー値IV2、IV3と閾値TH2、TH3との差分D2、D3が大きくなりやすい。
図7の符号73の図は、波形の右側にパワーの急落が生じた画素欠陥を示しているが、範囲Rbは、パワーの急落が生じた箇所と上昇が生じた箇所にまたがっている。この場合、範囲Rbのパワー値IV2と閾値TH2との差分D2が大きくならない可能性がある。しかしながら、範囲Rcでは、パワーが上昇した箇所のみが含まれるため、範囲Rcのパワー値IV3と閾値TH3との差分D3が大きくなりやすい。
このように、波長の一部を含む範囲Rb、Rcを設定することで、定常状態とのパワーの差が大きい箇所を捕捉しやすくなる。図7の符号73の図に示したように、波長の一部を含む範囲Rbであっても、その範囲内でパワーの損失に対する補償が行われていると、定常状態とパワーの差が大きくならないこともある。その場合でも、複数の範囲Rb、Rcを設定することで、定常状態とのパワーの差が大きい箇所が捕捉される可能性を高めることができる。
このような方法により、分解能が低い光チャネルモニタ106から取得した測定値を用いた場合でも、ノード110、120、130、140の異常を判定する精度を高めることができる。
このような方法により、分解能が低い光チャネルモニタ106から取得した測定値を用いた場合でも、ノード110、120、130、140の異常を判定する精度を高めることができる。
さらに、前記したように、パワー値IV1で異常が判定された場合、WSS103以外の構成要素の異常が原因と判定することができ、パワー値IV2、IV3で異常が判定された場合、WSS103の異常が原因と判定することができる。すなわち、パワー値IV1、IV2、IV3を取得することで、異常が発生したノードの特定に加えて、ノードにおける異常個所の切り分けも行うことができる。
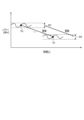
図8は、閾値の設定の一例を説明する図である。
閾値TH1、TH2、TH3の設定は同じ方法で行うことができるため、図8では閾値TH1、TH2、TH3をまとめて閾値THを表記している。
光パスOPで伝送される光信号の増波、減波、経路変更等の切り替えが行われると、切り替えが行われた光信号の経路となるチャネルの定常状態のパワー値に変動が生じる。そのため、閾値設定部13は、光信号の切り替えに応じて、閾値TH1、TH2、TH3を更新する。閾値設定部13は、更新した閾値TH1、TH2、TH3を記憶部16に記憶させる。記憶部16には、チャネルごとに設定された閾値TH1、TH2、TH3が記憶されている。
閾値TH1、TH2、TH3の設定は同じ方法で行うことができるため、図8では閾値TH1、TH2、TH3をまとめて閾値THを表記している。
光パスOPで伝送される光信号の増波、減波、経路変更等の切り替えが行われると、切り替えが行われた光信号の経路となるチャネルの定常状態のパワー値に変動が生じる。そのため、閾値設定部13は、光信号の切り替えに応じて、閾値TH1、TH2、TH3を更新する。閾値設定部13は、更新した閾値TH1、TH2、TH3を記憶部16に記憶させる。記憶部16には、チャネルごとに設定された閾値TH1、TH2、TH3が記憶されている。
閾値設定部13は、各ノード110、120、130、140のノードコントローラ151、152、153、154を介して、光チャネルモニタ106で測定されるWSS103の出力パワーの測定値を一定時間分取得することで、各チャネルの時系列データを取得する。閾値設定部13は、範囲Ra、Rb、Rcのそれぞれについて時系列データを取得する。
図8は、一例として、グリッド幅を50GHzから12.5GHzに変更した場合に得られる時系列データを示している。閾値設定部13は、たとえば、パワーの中央値を閾値THとして設定することができる。さらに、変動幅を所定値PDとして設定する。これにより、閾値THとパワー値との差分が、定常状態の変動幅の範囲内であれば異常は判定されないため、誤判定が低減される。
時系列データにおける変動幅が大きい場合には、変動幅の半分の値を所定値PDとして設定しても良い。また、閾値THは、中央値に限定されず、たとえば、平均値を閾値THとしても良い。閾値THの設定方法は、これらの例に限定されず、光伝送システム100の環境に応じて適宜変更可能である。
図8は、一例として、グリッド幅を50GHzから12.5GHzに変更した場合に得られる時系列データを示している。閾値設定部13は、たとえば、パワーの中央値を閾値THとして設定することができる。さらに、変動幅を所定値PDとして設定する。これにより、閾値THとパワー値との差分が、定常状態の変動幅の範囲内であれば異常は判定されないため、誤判定が低減される。
時系列データにおける変動幅が大きい場合には、変動幅の半分の値を所定値PDとして設定しても良い。また、閾値THは、中央値に限定されず、たとえば、平均値を閾値THとしても良い。閾値THの設定方法は、これらの例に限定されず、光伝送システム100の環境に応じて適宜変更可能である。
光信号の切り替えがあった際に更新の対象となるのは、切り替えられた光信号の経路となるチャネルChと、その両側に隣接するチャネルChである。図5および図7では図示は省略しているが、範囲Rb、Rcには隣接するチャネルChの波形も含まれている。そのため、一つのチャネルChの光信号の定常状態のパワー値が変動すると、隣接するチャネルChの範囲Rb、Rcから測定されるパワー値にも変動が生じる。そのため、隣接するチャネルChも更新対象となる。
たとえば、図3に示すチャネルCh2の光信号に切り換えがあった場合、閾値設定部13は、チャネルCh2の閾値TH1、TH2、TH3を更新する。閾値設定部13は、また、チャネルCh2の左隣に隣接するチャネルCh1の閾値TH3を更新する。閾値設定部13は、また、チャネルCh2の右隣に隣接するチャネルCh3の閾値TH1を更新する。すなわち、閾値設定部13は、合計5点の閾値を更新する。
たとえば、図3に示すチャネルCh2の光信号に切り換えがあった場合、閾値設定部13は、チャネルCh2の閾値TH1、TH2、TH3を更新する。閾値設定部13は、また、チャネルCh2の左隣に隣接するチャネルCh1の閾値TH3を更新する。閾値設定部13は、また、チャネルCh2の右隣に隣接するチャネルCh3の閾値TH1を更新する。すなわち、閾値設定部13は、合計5点の閾値を更新する。
以下に、監視装置1の制御部10における処理を用いて説明する。
図9は、異常判定処理の一例を説明する図である。
図10は、異常判定処理の流れを示すフローチャートである。
図9では、受信端ノード140のトランスポンダ141から信号品質の劣化が通知された例を説明している。
図9は、異常判定処理の一例を説明する図である。
図10は、異常判定処理の流れを示すフローチャートである。
図9では、受信端ノード140のトランスポンダ141から信号品質の劣化が通知された例を説明している。
図10に示すように、トランスポンダ141が光信号の品質の劣化を検出すると、監視装置1に通知が入力される(ステップS01)。通知が、トランスポンダ141自体の異常を含む場合(ステップS02:Yes)、制御部10はトランスポンダ141の異常を判定し(ステップS13)。入出力部15を介して、トランスポンダ141の異常を報知する。
通知が、トランスポンダ141自体の異常を含まない場合(ステップS02:No)、制御部10は、ステップS03に進む。
通知が、トランスポンダ141自体の異常を含まない場合(ステップS02:No)、制御部10は、ステップS03に進む。
データ取得部11は、劣化が検出された光信号の経路である対象チャネルTchを特定する(ステップS03)。データ取得部11は、i番目のノードの対象チャネルTchのパワー値IV1、IV2、IV3を取得する(ステップS04)。
iの初期値は、ノードの個数nに設定され、i番目とは、送信端ノード110側から数えた番号である。図9の例では、n=4である。図9に示すように、異常判定処理は、番号とは逆順に、受信端ノード140側から送信端ノード110側に遡って行われる。図9の例では、4番目の受信端ノード140から異常判定処理が行われる。
データ取得部11は、受信端ノード140のノードコントローラ154を介して、光チャネルモニタ106を制御し、範囲Ra、Rb、Rcのそれぞれで測定したパワー値IV1、IV2、IV3を取得する。
iの初期値は、ノードの個数nに設定され、i番目とは、送信端ノード110側から数えた番号である。図9の例では、n=4である。図9に示すように、異常判定処理は、番号とは逆順に、受信端ノード140側から送信端ノード110側に遡って行われる。図9の例では、4番目の受信端ノード140から異常判定処理が行われる。
データ取得部11は、受信端ノード140のノードコントローラ154を介して、光チャネルモニタ106を制御し、範囲Ra、Rb、Rcのそれぞれで測定したパワー値IV1、IV2、IV3を取得する。
図10に示すように、判定部12は、パワー値IV1と閾値TH1との差分D1と、パワー値IV2と閾値TH2との差分D2と、パワー値IV2と閾値TH3との差分D3と、を算出する(ステップS05)。
判定部12は、差分D1が所定値PDを超えた場合(ステップS06:Yes)、i番目のノードの、WSS103以外の構成要素の異常を判定する(ステップS09)。判定部12は、入出力部15を介して、判定結果をユーザに報知する。
判定部12は、差分D1が所定値PDを超えない場合(ステップS06:No)、ステップS07に進む。
判定部12は、差分D2と差分D3の少なくとも一つが所定値PDを超えた場合(ステップS07:Yes)、i番目のノードの、WSS103の異常を判定する(ステップS08)。判定部12は、入出力部15を介して、判定結果をユーザに報知する。
判定部12は、差分D1が所定値PDを超えない場合(ステップS06:No)、ステップS07に進む。
判定部12は、差分D2と差分D3の少なくとも一つが所定値PDを超えた場合(ステップS07:Yes)、i番目のノードの、WSS103の異常を判定する(ステップS08)。判定部12は、入出力部15を介して、判定結果をユーザに報知する。
判定部12は、差分D2と差分D3のいずれも所定値PDを超えなかった場合(ステップS07:No)、i番目のノードの異常判定処理を終了し、「i=i-1」とする(ステップS10)。
判定部12は、iが1でなければ(ステップS11:No)、ステップS04に戻り、i番目のノードの異常判定処理を行う。すなわち、異常判定処理を終了したノードの、送信端側に隣接するノードに移行して、同様に異常判定処理を行う。
判定部12は、iが1の場合(ステップS11:Yes)、1番目のノード(送信端ノード110)の異常を判定し(ステップS12)、判定結果をユーザに放置する。すなわち、ステップS10でノード120の異常判定処理が終了した場合、ノード140、130、120において異常が判定されなかったこととなる。この場合、残った送信端ノード110に異常が生じていたことになるため、送信端ノード110については、異常判定処理を行わなくても消去法で異常を判定することができる。判定部12は、入出力部15を介して、送信端ノード110の異常をユーザに報知することができる。なお、異常の原因がWSS103か、WSS103以外の要素であるかを判定するために、送信端ノード110についても異常判定処理を行っても良い。
図11は、閾値設定処理の流れを示すフローチャートである。
閾値設定部13は、光パスOPで伝送される光信号の増波、減波、経路変更等の切り替えがあるかを判定する(ステップS21)。そして、閾値設定部13は、切り替えがあると(ステップS21:Yes)、更新対象チャネルを特定する(ステップS22)。更新対象チャネルは、切り替えられた光信号の経路となるチャネル(切り替えチャネル)と、その両側に隣接するチャネルである。
閾値設定処理は、異常判定処理と同様に、受信端ノード140側から送信端ノード110側に遡って行うことができる。
閾値設定部13は、i番目のノードのノードコントローラ154を介して、光チャネルモニタ106を制御し、更新対象チャネルChのパワー値を取得する(ステップS23)。閾値設定部13は、切り替えチャネルについては、範囲Ra、Rb、Rcのパワー値を取得する。隣接するチャネルについては、切り替えチャネルの波形が含まれる範囲Rb、Rcのいずれかの一方のパワー値を取得する。閾値設定部13は、パワー値をそれぞれ一定時間分取得することで、それぞれの時系列データを取得する。
閾値設定部13は、光パスOPで伝送される光信号の増波、減波、経路変更等の切り替えがあるかを判定する(ステップS21)。そして、閾値設定部13は、切り替えがあると(ステップS21:Yes)、更新対象チャネルを特定する(ステップS22)。更新対象チャネルは、切り替えられた光信号の経路となるチャネル(切り替えチャネル)と、その両側に隣接するチャネルである。
閾値設定処理は、異常判定処理と同様に、受信端ノード140側から送信端ノード110側に遡って行うことができる。
閾値設定部13は、i番目のノードのノードコントローラ154を介して、光チャネルモニタ106を制御し、更新対象チャネルChのパワー値を取得する(ステップS23)。閾値設定部13は、切り替えチャネルについては、範囲Ra、Rb、Rcのパワー値を取得する。隣接するチャネルについては、切り替えチャネルの波形が含まれる範囲Rb、Rcのいずれかの一方のパワー値を取得する。閾値設定部13は、パワー値をそれぞれ一定時間分取得することで、それぞれの時系列データを取得する。
閾値設定部13は、範囲Ra、Rb、Rcの時系列データから、閾値TH1、TH2、TH3と、所定値PDを設定する(ステップS24)。閾値設定部13は、閾値TH1、TH2、TH3と所定値PDを記憶部16に記憶させて更新する。
閾値設定部13は、i番目のノードの閾値設定処理を終了し、「i=i-1」とする(ステップS25)。
閾値設定部13は、i番目のノードの閾値設定処理を終了し、「i=i-1」とする(ステップS25)。
閾値設定部13は、iが0でなければ(ステップS26:No)、ステップS23に戻り、i番目のノードの閾値設定処理に移行する。すなわち、閾値設定処理を終了したノードの、送信端側に隣接するノードに移行して、同様に閾値設定処理を行う。
閾値設定部13は、iが0であれば(ステップS26:Yes)、全てのノード110、120、130、140の閾値設定処理が完了しているため、処理を終了する。
閾値設定部13は、iが0であれば(ステップS26:Yes)、全てのノード110、120、130、140の閾値設定処理が完了しているため、処理を終了する。
<ハードウェア構成>
本実施形態に係る監視装置1は、例えば図12に示すようなコンピュータ900によって実現される。
図12は、本実施形態に係る監視装置1の機能を実現するコンピュータ900の一例を示すハードウェア構成図である。
コンピュータ900は、CPU(Central Processing Unit)901、ROM(Read Only Memory)902、RAM(Random Access Memory)903、HDD(Hard Disk Drive)904、入出力I/F(Interface)905、通信I/F906およびメディアI/F907を有する。
本実施形態に係る監視装置1は、例えば図12に示すようなコンピュータ900によって実現される。
図12は、本実施形態に係る監視装置1の機能を実現するコンピュータ900の一例を示すハードウェア構成図である。
コンピュータ900は、CPU(Central Processing Unit)901、ROM(Read Only Memory)902、RAM(Random Access Memory)903、HDD(Hard Disk Drive)904、入出力I/F(Interface)905、通信I/F906およびメディアI/F907を有する。
CPU901は、ROM902またはHDD904に記憶されたプログラム(監視プログラム)に基づき作動し、図4に示す監視装置1の制御部10による制御を行う。ROM902は、コンピュータ900の起動時にCPU901により実行されるブートプログラムや、コンピュータ900のハードウェアに係るプログラム等を記憶する。
CPU901は、入出力I/F905を介して、マウスやキーボード等の入力装置910、および、ディスプレイ等の出力装置911を制御する。CPU901は、入出力I/F905を介して、入力装置910からデータを取得するとともに、生成したデータを出力装置911へ出力する。なお、プロセッサとしてCPU901とともに、GPU(Graphics Processing Unit)等を用いても良い。
HDD904は、CPU901により実行されるプログラムおよび当該プログラムによって使用されるデータ等を記憶する。通信I/F906は、通信網(例えば、NW(Network)920)を介してノードコントローラ151、152、153、154(図1参照)等の他の装置からデータを受信してCPU901へ出力し、また、CPU901が生成したデータを、通信網を介して他の装置へ送信する。
メディアI/F907は、記録媒体912に格納されたプログラムまたはデータを読み取り、RAM903を介してCPU901へ出力する。CPU901は、目的の処理に係るプログラムを、メディアI/F907を介して記録媒体912からRAM903上にロードし、ロードしたプログラムを実行する。記録媒体912は、DVD(Digital Versatile Disc)、PD(Phase change rewritable Disk)等の光学記録媒体、MO(Magneto Optical disk)等の光磁気記録媒体、磁気記録媒体、導体メモリテープ媒体又は半導体メモリ等である。
例えば、コンピュータ900が本実施形態に係る監視装置1として機能する場合、コンピュータ900のCPU901は、RAM903上にロードされたプログラムを実行することにより監視装置1の機能を実現する。また、HDD904には、RAM903内のデータが記憶される。CPU901は、目的の処理に係るプログラムを記録媒体912から読み取って実行する。この他、CPU901は、他の装置から通信網(NW920)を介して目的の処理に係るプログラムを読み込んでもよい。
<上記実施形態の構成とその作用効果>
(1)監視装置1は、複数のチャネルCh1、Ch2、Ch3の光信号を含む光波長多重信号を伝送する伝送装置(ノード110、120、130、140)を監視するものである。
監視装置1は、データ取得部11と、判定部12と、を備える。
データ取得部11は、ノード110、120、130、140が出力する光信号のパワー値を測定する光チャネルモニタ106(モニタ)から、対象チャネルTch(チャネル)の波長全体を含む範囲Ra(第1範囲)のパワー値IV1(第1パワー値)を取得し、対象チャネルTchの波長の一部を含む範囲Rb、Rc(第2範囲)のパワー値IV2、IV3(第2パワー値)を取得する。
判定部12は、パワー値IV1、IV2、IV3を、それぞれノード110、120、130、140の定常状態におけるパワー値に基づいた閾値TH1、TH2、TH3と比較して、ノード110、120、130、140の異常を判定する。
(1)監視装置1は、複数のチャネルCh1、Ch2、Ch3の光信号を含む光波長多重信号を伝送する伝送装置(ノード110、120、130、140)を監視するものである。
監視装置1は、データ取得部11と、判定部12と、を備える。
データ取得部11は、ノード110、120、130、140が出力する光信号のパワー値を測定する光チャネルモニタ106(モニタ)から、対象チャネルTch(チャネル)の波長全体を含む範囲Ra(第1範囲)のパワー値IV1(第1パワー値)を取得し、対象チャネルTchの波長の一部を含む範囲Rb、Rc(第2範囲)のパワー値IV2、IV3(第2パワー値)を取得する。
判定部12は、パワー値IV1、IV2、IV3を、それぞれノード110、120、130、140の定常状態におけるパワー値に基づいた閾値TH1、TH2、TH3と比較して、ノード110、120、130、140の異常を判定する。
本実施形態に係る監視装置1によれば、分解能が低い光チャネルモニタ106から取得した測定値を用いた場合でも、ノード110、120、130、140における異常の判定精度を向上させることができる。これによって、OSA等の分解能が高いモニタを各ノードに設ける場合に比べて、設置コストを低減することができる。さらに、モニタから取得するデータ量が低減されるため、通信負荷を低減することができる。
具体的には、監視装置1は、受信端ノード140のトランスポンダ141で光信号の品質の劣化が検出された際に、通信経路である光パスOP上において異常が発生しているノード110、120、130、140を特定するための処理を行う。
監視装置1のデータ取得部11は、各ノード110、120、130、140の出力側に設けられた光チャネルモニタ106から、異常が検出された対象チャネルTchの光信号のパワー値を取得する。
データ取得部11は、対象チャネルTchの波長全体を覆う範囲Ra(第1範囲)のパワー値IV1(第1パワー値)を取得する。判定部12は、パワー値IV1を定常状態での範囲Raのパワー値に基づいて設定した閾値TH1と比較する。対象チャネルTchの波形に異常によって、パワー値IV1と閾値TH1との差分D1が所定値PDを超えた場合、判定部12は、その光信号を出力したノードの異常を判定することができる。
監視装置1のデータ取得部11は、各ノード110、120、130、140の出力側に設けられた光チャネルモニタ106から、異常が検出された対象チャネルTchの光信号のパワー値を取得する。
データ取得部11は、対象チャネルTchの波長全体を覆う範囲Ra(第1範囲)のパワー値IV1(第1パワー値)を取得する。判定部12は、パワー値IV1を定常状態での範囲Raのパワー値に基づいて設定した閾値TH1と比較する。対象チャネルTchの波形に異常によって、パワー値IV1と閾値TH1との差分D1が所定値PDを超えた場合、判定部12は、その光信号を出力したノードの異常を判定することができる。
ここで、パワー値IV1と閾値TH1の比較処理のみでは、ノード110、120、130、140のWSS103のフィルタ機能の異常は判定できないことがある。
ノードコントローラ151、152、153、154では、WSS103のフィルタリングによって生じた波形の損失が補償されるようにパワー制御が行われる。これは、WSS103のフィルタ機能の異常によって損失が生じた場合も同様である。
そのため、WSS103のフィルタ異常による波形は、定常状態の波形と、波長全体のパワーが同じになることがある。この場合、波長全体を覆う範囲Raから取得されたパワー値IV1と閾値TH1との差分D1が、所定値PDを超えるほど大きくならないことがある。この場合は、ノード110、120、130、140の異常を判定することができない。
ノードコントローラ151、152、153、154では、WSS103のフィルタリングによって生じた波形の損失が補償されるようにパワー制御が行われる。これは、WSS103のフィルタ機能の異常によって損失が生じた場合も同様である。
そのため、WSS103のフィルタ異常による波形は、定常状態の波形と、波長全体のパワーが同じになることがある。この場合、波長全体を覆う範囲Raから取得されたパワー値IV1と閾値TH1との差分D1が、所定値PDを超えるほど大きくならないことがある。この場合は、ノード110、120、130、140の異常を判定することができない。
本実施形態において、データ取得部11は、パワー値IV1に加えて、対象チャネルTchの波長の一部を含む範囲Rb、Rc(第2範囲)におけるパワー値IV2、IV3(第2パワー値)を取得する。判定部12は、パワー値IV2、IV3に対しても、それぞれ定常状態での範囲Rb、Rcに基づいて設定した閾値TH2、TH3との比較を行う。
波長の一部を含む範囲Rb、Rcを設定することで、異常が生じた波形と定常状態との波形の差が大きい箇所が含まれやすくなる。さらに範囲Rb、Rcは波長全体を覆うものではないため、範囲内のパワー値が結果として定常状態と同じになる可能性が、範囲Raよりも低くなる。そのため、範囲Rb、Rcのパワー値IV2、IV3と閾値TH2、TH3との差分D2、D3が所定値PDを超えて異常が判定される可能性を高めることができる。
波長の一部を含む範囲Rb、Rcを設定することで、異常が生じた波形と定常状態との波形の差が大きい箇所が含まれやすくなる。さらに範囲Rb、Rcは波長全体を覆うものではないため、範囲内のパワー値が結果として定常状態と同じになる可能性が、範囲Raよりも低くなる。そのため、範囲Rb、Rcのパワー値IV2、IV3と閾値TH2、TH3との差分D2、D3が所定値PDを超えて異常が判定される可能性を高めることができる。
(2)ノード110、120、130、140は、複数のチャネルCh1、Ch2、Ch3の光信号を多重化して光波長多重信号を生成すると共に、各チャネルCh1、Ch2、Ch3に割り当てられた波長帯域BWに応じて光信号をフィルタリングするWSS103(波長選択スイッチ)を備える。
監視装置1の判定部12は、パワー値IV1と閾値TH1との比較に基づいて、ノード110、120、130、140におけるWSS103以外の構成要素(要素)の異常を判定する。判定部12は、パワー値IV2、IV3と閾値TH2、TH3との比較に基づいて、WSS103の異常を判定する。
監視装置1の判定部12は、パワー値IV1と閾値TH1との比較に基づいて、ノード110、120、130、140におけるWSS103以外の構成要素(要素)の異常を判定する。判定部12は、パワー値IV2、IV3と閾値TH2、TH3との比較に基づいて、WSS103の異常を判定する。
パワー値IV1によって異常が判定された場合はWSS103以外の構成要素が原因の可能性が高く、パワー値IV2、IV3によって異常が判定された場合はWSS103が原因の可能性が高い。データ取得部11が異なる範囲Ra、Rb、Rcから複数のパワー値IV1、IV2、IV3を取得することで、判定部12において、ノード110、120、130、140内の異常の原因の切り分けも行うことができる。これによって、監視装置1の利便性を向上させることができる。
(3)監視装置1のデータ取得部11は、対象チャネルTch(チャネル)の波長の一部を含み、互いに位置をずらした2つの範囲Rb、Rcを第2範囲として設定し、範囲Rb、Rcのそれぞれにおけるパワー値IV2、IV3を、第2パワー値として取得する。
第2パワー値として範囲Rbのパワー値IV2のみを取得した場合、範囲Rb内でパワー制御により波形の損失が補償されると、結果として定常状態と同じパワーとなることがある。この場合、パワー値IV2と閾値TH2との差分D2が所定値PDを超えず、ノード110、120、130、140の異常を判定できない可能性がある。データ取得部11は、第2範囲として、互いに位置をずらした2つの範囲Rb、Rcを設定し、それぞれからパワー値IV2、IV3を第2パワー値として取得する。複数の範囲の設定によってチャネルChの広い範囲がカバーされることになり、範囲Rb、Rcのいずれかで定常状態とのパワーの差が大きい箇所が捕捉される可能性が高くなる。判定部12は、パワー値IV2、IV3の少なくともいずれかが閾値TH2、TH3を超えればノード110、120、130、140の異常を判定することができため、異常判定の精度を向上することができる。
なお、第2範囲として設定する範囲の数は2箇所に限定されず、3箇所以上の範囲を設定し、それぞれの範囲のパワー値を第2パワー値として取得しても良い。
なお、第2範囲として設定する範囲の数は2箇所に限定されず、3箇所以上の範囲を設定し、それぞれの範囲のパワー値を第2パワー値として取得しても良い。
(4)監視装置1は、閾値TH1、TH2、TH3を設定する閾値設定部13を備える。
閾値設定部13は、光信号の切り替えが行われた際に、光チャネルモニタ106から、切り替えが行われた光信号の経路となるチャネルと、隣接するチャネルのパワー値を取得して、閾値TH1、TH2、TH3を設定する。
閾値設定部13は、光信号の切り替えが行われた際に、光チャネルモニタ106から、切り替えが行われた光信号の経路となるチャネルと、隣接するチャネルのパワー値を取得して、閾値TH1、TH2、TH3を設定する。
光伝送システム100において、光信号の切り替えが行われると、切り替えが行われた光信号の経路となるチャネルの定常状態のパワー値に変動が生じる。閾値設定部13は、切り替えのタイミングで閾値TH1、TH2、TH3を更新することで、閾値TH1、TH2、TH3は定常状態のパワー値を反映するものとなり、ノード110、120、130、140の異常を判定する精度を向上させることができる。
上記した効果は、監視装置1が実施する監視方法と、コンピュータ900を監視装置1として機能させるための監視プログラムにも適用することができる。
<変形例1>
本実施形態の変形例1について、図面を参照して説明する。
変形例1の、本実施形態と同じ構成および処理については、詳細な説明は省略する。
図13は、変形例1においてパワー値を取得する範囲を説明する図である。
図14は、比較例を説明する図である。
前記した実施形態では、WSS103のフィルタ機能の異常によって、特定のチャネルの波形に歪みが生じる例を説明したが(図6参照)、図13に示すように、フィルタ機能の異常により、全てのチャネルCh1、Ch2、Ch3の波形に影響を与えることがある。変形例1は、前記した実施形態の処理を変形することにより、全てのチャネルCh1、Ch2、Ch3の波形に異常が生じた際にも、ノード110、120、130、140の異常を判定可能とするものである。
本実施形態の変形例1について、図面を参照して説明する。
変形例1の、本実施形態と同じ構成および処理については、詳細な説明は省略する。
図13は、変形例1においてパワー値を取得する範囲を説明する図である。
図14は、比較例を説明する図である。
前記した実施形態では、WSS103のフィルタ機能の異常によって、特定のチャネルの波形に歪みが生じる例を説明したが(図6参照)、図13に示すように、フィルタ機能の異常により、全てのチャネルCh1、Ch2、Ch3の波形に影響を与えることがある。変形例1は、前記した実施形態の処理を変形することにより、全てのチャネルCh1、Ch2、Ch3の波形に異常が生じた際にも、ノード110、120、130、140の異常を判定可能とするものである。
図13は、全てのチャネルCh1、Ch2、Ch3の波形に、フィルタタイトニングと呼ばれる異常が生じた例を示している。図13は、定常状態の波形を点線で示し、フィルタタイトニングの波形を実線で示している。フィルタタイトニングの波形は、定常状態の波形と比較すると、端部の成分C1のパワーが減少し、中央の成分C2のパワーが増加している。
変形例1における監視装置1の制御部10の構成は図4と同じであるため、図4を参照して説明する。
制御部10は、実施形態と同様に、トランスポンダ111、141から光信号の劣化を検出した通知が入力された場合に、異常判定処理を行う。データ取得部11は、劣化が検出された光信号の経路である対象チャネルTchを特定するが、全てのチャネルCh1、Ch2、Ch3が対象チャネルTchとして特定された場合に、変形例1の異常判定処理を行う。
データ取得部11は、全てのチャネルCh1、Ch2、Ch3の中から、終端チャネルを選択する。終端チャネルは、波形の両端部のいずれかに、他のチャネルが隣接していないチャネルを意味する。図13の例では、チャネルCh3を終端チャネルとして選択している。チャネルCh3は、左側の端部にはチャネルCh2が隣接しているが、右側の端部には他のチャネルが隣接していない。
なお、データ取得部11は、チャネルCh1を終端チャネルとして選択しても良い。チャネルCh1は、右側の端部にはチャネルCh2が隣接しているが、左側の端部には他のチャネルが隣接していない。
制御部10は、実施形態と同様に、トランスポンダ111、141から光信号の劣化を検出した通知が入力された場合に、異常判定処理を行う。データ取得部11は、劣化が検出された光信号の経路である対象チャネルTchを特定するが、全てのチャネルCh1、Ch2、Ch3が対象チャネルTchとして特定された場合に、変形例1の異常判定処理を行う。
データ取得部11は、全てのチャネルCh1、Ch2、Ch3の中から、終端チャネルを選択する。終端チャネルは、波形の両端部のいずれかに、他のチャネルが隣接していないチャネルを意味する。図13の例では、チャネルCh3を終端チャネルとして選択している。チャネルCh3は、左側の端部にはチャネルCh2が隣接しているが、右側の端部には他のチャネルが隣接していない。
なお、データ取得部11は、チャネルCh1を終端チャネルとして選択しても良い。チャネルCh1は、右側の端部にはチャネルCh2が隣接しているが、左側の端部には他のチャネルが隣接していない。
データ取得部11は、実施形態と同様に、チャネルCh3の光信号の波長全体を含む範囲Raにおけるパワー値IV1を取得する。
データ取得部11は、変形例1では、チャネルCh3の波長の、他のチャネルが隣接しない右側の端部を含む範囲Rb’のパワー値IV2’を取得する。範囲Rb’は、波長全体を覆わず、波長の一部のみを含む範囲である。
なお、チャネルCh1を終端チャネルとした場合、データ取得部11は、チャネルCh1の、他のチャネルが隣接しない左側の端部を含む範囲Rb’からパワー値IV2’を取得する。
データ取得部11は、変形例1では、チャネルCh3の波長の、他のチャネルが隣接しない右側の端部を含む範囲Rb’のパワー値IV2’を取得する。範囲Rb’は、波長全体を覆わず、波長の一部のみを含む範囲である。
なお、チャネルCh1を終端チャネルとした場合、データ取得部11は、チャネルCh1の、他のチャネルが隣接しない左側の端部を含む範囲Rb’からパワー値IV2’を取得する。
図14では、比較例として、両側の端部にチャネルCh1、Ch3が隣接しているチャネルCh2に、実施形態と同様に範囲Ra、範囲Rbを設定した場合を示している。
前記したように、ノードコントローラ151、152、153、154では、WSS103のフィルタ機能の異常によって生じた損失が補償されるようにパワー制御が行われる。そのため、図14に示すように、フィルタタイトニングの波形は、端部の成分C1が定常状態よりパワーが減少しているが、中央の成分C2は、定常状態よりパワーが増加している。すなわち、フィルタタイトニングの場合も、範囲Raのパワー値IV1と閾値TH1の差分D1が大きくならず、ノード110、120、130、140の異常が判定されない可能性がある。
前記したように、ノードコントローラ151、152、153、154では、WSS103のフィルタ機能の異常によって生じた損失が補償されるようにパワー制御が行われる。そのため、図14に示すように、フィルタタイトニングの波形は、端部の成分C1が定常状態よりパワーが減少しているが、中央の成分C2は、定常状態よりパワーが増加している。すなわち、フィルタタイトニングの場合も、範囲Raのパワー値IV1と閾値TH1の差分D1が大きくならず、ノード110、120、130、140の異常が判定されない可能性がある。
続いて、図14に示すように、チャネルCh2に範囲Rbを設定した場合、範囲Rbには隣接するチャネルCh3の波形も含まれることとなる。範囲Rbには、チャネルCh2、Ch3のパワーが減少した端部の成分C1が含まれると共に、チャネルCh3のパワーが増加した中央の成分C2が含まれる。範囲Rb内でパワーの増加分とパワーの減少分が近い値となった場合、範囲Rbのパワー値IV2と閾値TH2の差分D2が所定値PDを超えず、ノード110、120、130、140の異常が判定されない可能性がある。
図13に示すように、変形例1では、データ取得部11は、終端チャネルCh3において、範囲Ra、範囲Rb’を設定する。さらに、データ取得部11は、範囲Rb’を、終端チャネルCh3の他のチャネルが隣接しない右側の端部を含むように設定する。これによって、範囲Rb’には、隣接するチャネルの波形が含まれない。すなわちチャネルCh3の端部の成分C1によるパワーの減少分が、隣接するチャネルの中央の成分C2の増加分で減殺されない。そのため、範囲Rb’のパワー値IV2’は端部の成分C1によって小さくなり、閾値TH2’との差分D2’が、所定値PDを超えやすくなる。これによって、ノード110、120、130、140の異常を判定する精度を向上させることができる。
なお、閾値TH2’は、終端チャネルCh3の光信号の切り替えがあった際に、実施形態の閾値設定処理と同様の処理を行うことにより設定することができる。
なお、閾値TH2’は、終端チャネルCh3の光信号の切り替えがあった際に、実施形態の閾値設定処理と同様の処理を行うことにより設定することができる。
図15は、変形例1に係る異常判定処理の流れを示すフローチャートである。
ここでは、受信端ノード140のトランスポンダ141から信号品質の劣化が通知された例を説明する。
図15に示すように、トランスポンダ141が光信号の品質の劣化を検出すると、監視装置1に通知が入力される(ステップS101)。通知が、トランスポンダ141自体の異常を含む場合(ステップS102:Yes)、制御部10はトランスポンダ141の異常を判定し(ステップS114)、入出力部15を介して、トランスポンダ141の異常を報知する。
通知が、トランスポンダ141自体の異常を含まない場合(ステップS102:No)、制御部10は、ステップS103に進む。
ここでは、受信端ノード140のトランスポンダ141から信号品質の劣化が通知された例を説明する。
図15に示すように、トランスポンダ141が光信号の品質の劣化を検出すると、監視装置1に通知が入力される(ステップS101)。通知が、トランスポンダ141自体の異常を含む場合(ステップS102:Yes)、制御部10はトランスポンダ141の異常を判定し(ステップS114)、入出力部15を介して、トランスポンダ141の異常を報知する。
通知が、トランスポンダ141自体の異常を含まない場合(ステップS102:No)、制御部10は、ステップS103に進む。
データ取得部11は、劣化が検出された光信号の経路である対象チャネルTchを特定する(ステップS103)。
対象チャネルTchが全チャネルCh1、Ch2、Ch3でない場合(ステップS104:No)、データ取得部11は、図10のステップS04の処理に進み、実施形態と同じ異常判定処理を行う。
対象チャネルTchが全チャネルCh1、Ch2、Ch3でない場合(ステップS104:No)、データ取得部11は、図10のステップS04の処理に進み、実施形態と同じ異常判定処理を行う。
対象チャネルTchが全チャネルCh1、Ch2、Ch3である場合(ステップS104:Yes)、データ取得部11は、終端チャネルであるチャネルCh3を選択する。データ取得部11は、i番目のノードの終端チャネルCh3の範囲Ra、Rb’のそれぞれから、パワー値IV1、IV2’を取得する(ステップS105)。
図15に示すように、判定部12は、パワー値IV1と閾値TH1との差分D1と、パワー値IV2’と閾値TH2’との差分D2’を算出する(ステップS106)。
判定部12は、差分D1が所定値PDを超えた場合(ステップS107:Yes)、ノードのWSS103以外の構成要素の異常を判定する(ステップS110)。判定部12は、入出力部15を介して、判定結果をユーザに報知する。
判定部12は、差分D1が所定値PDを超えない場合(ステップS107:No)、ステップS108に進む。
判定部12は、差分D2’が所定値PDを超えた場合(ステップS108:Yes)、ノードのWSS103の異常を判定する(ステップS109)。判定部12は、入出力部15を介して、判定結果をユーザに報知する。
判定部12は、差分D1が所定値PDを超えない場合(ステップS107:No)、ステップS108に進む。
判定部12は、差分D2’が所定値PDを超えた場合(ステップS108:Yes)、ノードのWSS103の異常を判定する(ステップS109)。判定部12は、入出力部15を介して、判定結果をユーザに報知する。
判定部12は、差分D2’が所定値PDを超えなかった場合(ステップS108:No)、i番目のノードの異常判定処理を終了し、「i=i-1」とする(ステップS111)。
判定部12は、iが1でなければ(ステップS112:No)、ステップS105に戻り、i番目のノードの異常判定処理を行う。判定部12は、iが1の場合(ステップS112:Yes)、1番目のノードである送信端ノード110の異常を判定する(ステップS113)。
<変形例1の構成とその作用効果>
(5)変形例1において、監視装置1のデータ取得部11は、終端チャネルCh3の波長の、他のチャネルが隣接しない端部を含む範囲Rb’を第2範囲として設定して、パワー値IV2’(第2パワー値)を取得する。
(5)変形例1において、監視装置1のデータ取得部11は、終端チャネルCh3の波長の、他のチャネルが隣接しない端部を含む範囲Rb’を第2範囲として設定して、パワー値IV2’(第2パワー値)を取得する。
全チャネルCh1、Ch2、Ch3の波長にフィルタタイトニングが発生した場合、チャネルChの一部を含むように設定した範囲Rbには、隣接するチャネルChの波長が含まれることがある。隣接するチャネルChの波長にもフィルタタイトニングが生じているため、範囲Rbのパワー値IV2と閾値TH2との差分D2が所定値PDを超えず、ノード110、120、130、140の異常を判定することができない可能性がある。変形例2では、終端チャネルCh1、Ch3の、他のチャネルが隣接していない端部を含むように範囲Rb’を設定する。これによって、範囲Rb’のパワー値IV2’は隣接チャネルの影響を受けないため、フィルタタイトニングが生じた際に、パワー値IV2’と閾値TH2’との差分D2’が所定値PDを超える可能性が大きくなるため、ノード110、120、130、140の異常を判定する精度を向上することができる。
図15では、対象チャネルTchが全チャネルCh1、Ch2、Ch3の場合(ステップS104:YES)、終端チャネルCh3から2点のパワー値IV1、IV2’を取得して異常判定処理を行う例を説明した。図15の例では、パワー値の取得が2点で済むため、異常判定処理の際のデータ処理量を低減することができる。
なお、図15の例に限定されず、対象チャネルが全チャネルCh1、Ch2、Ch3のである場合にも、図10のステップS04に進み、各チャネルに対して、順次範囲Ra、Rb、Rcからパワー値IV1、IV2、IV3の取得を行い、異常判定処理を行っても良い。その場合、範囲Rbはチャネルの端部を含むように設定する。これによって、終端チャネルで範囲Rbからパワー値IV2の取得を行うと、結果的に範囲Rb’におけるIV2’の取得を行うことになるため、フィルタタイトニングによるノードの異常も判定することができる。判定部12は、いずれかのチャネルで異常が判定された時点で、異常判定処理を終了することができる。
なお、図15の例に限定されず、対象チャネルが全チャネルCh1、Ch2、Ch3のである場合にも、図10のステップS04に進み、各チャネルに対して、順次範囲Ra、Rb、Rcからパワー値IV1、IV2、IV3の取得を行い、異常判定処理を行っても良い。その場合、範囲Rbはチャネルの端部を含むように設定する。これによって、終端チャネルで範囲Rbからパワー値IV2の取得を行うと、結果的に範囲Rb’におけるIV2’の取得を行うことになるため、フィルタタイトニングによるノードの異常も判定することができる。判定部12は、いずれかのチャネルで異常が判定された時点で、異常判定処理を終了することができる。
<変形例2>
図16は、変形例2においてパワー値を取得する範囲を説明する図である。
変形例1では、フィルタタイトニングが発生した際に、終端チャネルであるチャネルCh3に範囲Rb’を設定することで、隣接するチャネルの波形が含まれないようにした。
変形例2では、フィルタタイトニングが発生した際に、両側にチャネルが隣接しているチャネルにおいても異常が判定できるように範囲Rb’’を設定する。図16では、チャネルCh2に範囲Rb’’を設定する例を示している。
具体的には、データ取得部11は、波長全体を覆う範囲Raと異なる幅を有し、チャネルCh2の波長の端部を含む範囲Rb’’を設定する。データ取得部11は、光チャネルモニタ106から、範囲Rb’’のパワー値IV2’’を取得する。図16では、範囲Rb’’は右側の端部を含むように設定しているが、左側の端部を含むように設定しても良い。
判定部12は、実施形態と同様に、範囲Rb’’のパワー値IV2’’と閾値TH2’’との差分D2’’を算出する。判定部12は、差分D2’’が所定値PDを超えていればノードの異常を判定する。
閾値TH2’’は、実施形態の閾値設定処理と同様の処理を行うことにより設定することができる。
図16は、変形例2においてパワー値を取得する範囲を説明する図である。
変形例1では、フィルタタイトニングが発生した際に、終端チャネルであるチャネルCh3に範囲Rb’を設定することで、隣接するチャネルの波形が含まれないようにした。
変形例2では、フィルタタイトニングが発生した際に、両側にチャネルが隣接しているチャネルにおいても異常が判定できるように範囲Rb’’を設定する。図16では、チャネルCh2に範囲Rb’’を設定する例を示している。
具体的には、データ取得部11は、波長全体を覆う範囲Raと異なる幅を有し、チャネルCh2の波長の端部を含む範囲Rb’’を設定する。データ取得部11は、光チャネルモニタ106から、範囲Rb’’のパワー値IV2’’を取得する。図16では、範囲Rb’’は右側の端部を含むように設定しているが、左側の端部を含むように設定しても良い。
判定部12は、実施形態と同様に、範囲Rb’’のパワー値IV2’’と閾値TH2’’との差分D2’’を算出する。判定部12は、差分D2’’が所定値PDを超えていればノードの異常を判定する。
閾値TH2’’は、実施形態の閾値設定処理と同様の処理を行うことにより設定することができる。
図16の符号161の図に示すように、範囲Rb’’の幅は、範囲Raよりも狭くしても良い。これによって、範囲Rb’’には、隣接するチャネルCh3のパワーが増加した中央の成分C2が含まれない。これによって、チャネルCh2、Ch3の端部の成分C1によるパワーの減少分が、中央の成分C2による増加分に減殺されないため、範囲Rb’’のパワー値IV2’’が小さくなる。これによって、パワー値IV2’’と閾値TH2’’との差分D2’’が大きくなり、異常が判定されやすくなる。
図16の符号162の図に示すように、範囲Rb’’の幅は、範囲Raよりも広くしても良い。範囲Rb’’を広くすることで、範囲Rb’’においてチャネルCh3の中央の成分C2が含まれる比率が高くなる。範囲Rb’’における中央の成分C2によるパワーの増加分が、端部の成分C1によるパワーの減少分を上回ると、範囲Rb’’のパワー値IV2’’が大きくなる。これによって、パワー値IV2’’と閾値TH2’’との差分D2’’が大きくなり、異常が判定されやすくなる。
データ取得部11は、ノードコントローラ151、152、153、154を介して、光チャネルモニタ106の分解能の設定を変更することで、範囲Raと範囲Rb’’の幅を変更する。光チャネルモニタ106の分解能を細かくすることで、図16の符号161の図に示すように、範囲Rb’’の幅を狭くすることができる。光チャネルモニタ106の分解能を粗くすることで、図16の符号162の図に示すように、範囲Rb’’の幅を広くすることができる。
<変形例2の構成とその作用効果>
(6)監視装置1のデータ取得部11は、範囲Ra(第1範囲)と異なる幅を有し、チャネルの波長の端部を含む範囲Rb’’を第2範囲として設定して、パワー値IV2’’(第2パワー値)を取得する。
(6)監視装置1のデータ取得部11は、範囲Ra(第1範囲)と異なる幅を有し、チャネルの波長の端部を含む範囲Rb’’を第2範囲として設定して、パワー値IV2’’(第2パワー値)を取得する。
波長全体を覆う範囲Raと幅が異なる範囲Rb’’を設定することによって、範囲Rb’’内に含まれる、パワーが減少する成分(成分C1)と、パワーが増加する成分(成分C2)の比率を異ならせることができる。これによって、パワー値IV2’’と閾値TH2’’との差分D2’’が大きくなり、ノードの異常を判定する精度を向上させることができる。
変形例2によれば、終端チャネルに限定されず、両端側にチャネルが隣接しているチャネルChにおいてもノードの異常を判定することができるため、監視装置1の利便性を向上させることができる。
変形例2によれば、終端チャネルに限定されず、両端側にチャネルが隣接しているチャネルChにおいてもノードの異常を判定することができるため、監視装置1の利便性を向上させることができる。
変形例2の処理は、変形例1において図15に示した処理と同様に、対象チャネルTchが全チャネルCh1、Ch2、Ch3の場合(ステップS104:Yes)に行うことができる。その場合、データ取得部11は、全チャネルCh1、Ch2、Ch3から任意のチャネルを選択して、範囲Ra、範囲Rb’’の2点のパワー値IV1、IV2’’を取得して異常判定処理を行うことができる。この場合、変形例1と同様に、パワー値の取得が2点で済むため、監視装置1におけるデータ処理量を低減することができる。なお、データ取得部11は、範囲Rb’’の幅を広くしたパワー値と、狭くしたパワー値の両方を取得しても良い。
また、図15の例に限定されず、対象チャネルが全チャネルCh1、Ch2、Ch3でない場合にも、図10のステップS04に進み、各チャネルに対して、順次異常判定処理を行っても良い。その際、各チャネルに対して、範囲Ra、Rb、Rcからパワー値IV1、IV2、IV3の取得を行うのに加えて、範囲Rb’’のパワー値IV2’’を取得する。判定部12は、いずれかのチャネルで異常が判定された時点で、異常判定処理を終了することができる。
<変形例3>
図17は、変形例3に係る監視装置1Aの構成を示す機能ブロック図である。
図17に示すように、変形例3に係る監視装置1Aは、実施形態で説明した構成に加えて、閾値補正部14を有する。
変形例3において、データ取得部11は、実施形態と同様に、各ノードの対象チャネルTchにおいて、範囲Ra、Rb、Rcのそれぞれから、パワー値IV1、IV2、IV3の取得を行う。データ取得部11は、その際、範囲Raのパワー値IV1のみ、光チャネルモニタ106に所定時間T測定を行わせて、所定時間T分のパワー値IV1のデータを取得する。
閾値設定部13は、データ取得部11が取得した所定時間T分のデータから、パワー値IV1の変動があるかを判定する。閾値設定部13は、パワー値IV1の変動があった場合は、その変動量に基づいてオフセット値を決定する。閾値設定部13は、決定したオフセット値を閾値TH1、TH2、TH3のそれぞれに加えることで、閾値TH1、TH2、TH3を補正する。
判定部12は、パワー値IV1、IV2、IV3と、補正した閾値TH1、TH2、TH3を比較することで、実施形態と同様に異常判定処理を行う。
図17は、変形例3に係る監視装置1Aの構成を示す機能ブロック図である。
図17に示すように、変形例3に係る監視装置1Aは、実施形態で説明した構成に加えて、閾値補正部14を有する。
変形例3において、データ取得部11は、実施形態と同様に、各ノードの対象チャネルTchにおいて、範囲Ra、Rb、Rcのそれぞれから、パワー値IV1、IV2、IV3の取得を行う。データ取得部11は、その際、範囲Raのパワー値IV1のみ、光チャネルモニタ106に所定時間T測定を行わせて、所定時間T分のパワー値IV1のデータを取得する。
閾値設定部13は、データ取得部11が取得した所定時間T分のデータから、パワー値IV1の変動があるかを判定する。閾値設定部13は、パワー値IV1の変動があった場合は、その変動量に基づいてオフセット値を決定する。閾値設定部13は、決定したオフセット値を閾値TH1、TH2、TH3のそれぞれに加えることで、閾値TH1、TH2、TH3を補正する。
判定部12は、パワー値IV1、IV2、IV3と、補正した閾値TH1、TH2、TH3を比較することで、実施形態と同様に異常判定処理を行う。
通常、グリッド幅が変更されていなければ、WSS103からは一定のパワー値IV1が出力されるが、過酷な環境状況等の要因によって、パワー値IV1が一定とならず変動する場合がある。閾値設定部13において、パワー値IV1の変動量に基づいてオフセット値を決定し、閾値TH1、TH2、TH3を補正することで、環境状況に応じた異常判定処理を行うことができる。
図18は、変形例3に係る閾値補正処理の流れを示すフローチャートである。
図18のステップS201~S203の処理は、図10のステップS01~S03の処理と同じであるため、説明を省略する。
ステップS204において、データ取得部11は、i番目のノードの対象チャネルTchにおいて、範囲Ra、Rb、Rcのそれぞれから、パワー値IV1、IV2、IV3の取得を行う。データ取得部11は、パワー値IV1に関しては、所定時間T分のデータを取得する。
図18のステップS201~S203の処理は、図10のステップS01~S03の処理と同じであるため、説明を省略する。
ステップS204において、データ取得部11は、i番目のノードの対象チャネルTchにおいて、範囲Ra、Rb、Rcのそれぞれから、パワー値IV1、IV2、IV3の取得を行う。データ取得部11は、パワー値IV1に関しては、所定時間T分のデータを取得する。
閾値補正部14は、パワー値IV1の所定時間T分のデータを参照して、パワー値IV1に変動があるかを判定する(ステップS205)。閾値補正部14は、パワー値IV1に変動が無ければ(ステップS205:No)、閾値TH1、TH2、TH3を、補正を行わずに判定部12に入力する。
閾値補正部14は、パワー値IV1に変動があれば(ステップS205:Yes)、変動量からオフセット値を決定し、閾値TH1、TH2、TH3にオフセット値を加えて補正する(ステップS206)。閾値補正部14は、補正した閾値TH1、TH2、TH3を判定部12に入力する。
判定部12は、パワー値IV1、IV2、IV3と、閾値補正部14から入力された閾値TH1、TH2、TH3との差分D1、D2、D3をそれぞれ算出する(ステップS207)。
ステップS208~ステップS215の処理は、図10のステップS06~S13の処理と同じであるため、説明を省略する。
閾値補正部14は、パワー値IV1に変動があれば(ステップS205:Yes)、変動量からオフセット値を決定し、閾値TH1、TH2、TH3にオフセット値を加えて補正する(ステップS206)。閾値補正部14は、補正した閾値TH1、TH2、TH3を判定部12に入力する。
判定部12は、パワー値IV1、IV2、IV3と、閾値補正部14から入力された閾値TH1、TH2、TH3との差分D1、D2、D3をそれぞれ算出する(ステップS207)。
ステップS208~ステップS215の処理は、図10のステップS06~S13の処理と同じであるため、説明を省略する。
<変形例3の構成とその作用効果>
(7)監視装置1Aは、データ取得部11が取得した、所定時間Tにおけるパワー値IV1(第1パワー値)の変動量に基づいて、閾値TH1、TH2、TH3を補正する閾値補正部14を備える。
これにより、パワー値IV1、IV2、IV3が変動する環境状況においても、ノードの異常判定の精度を向上させることができる。
(7)監視装置1Aは、データ取得部11が取得した、所定時間Tにおけるパワー値IV1(第1パワー値)の変動量に基づいて、閾値TH1、TH2、TH3を補正する閾値補正部14を備える。
これにより、パワー値IV1、IV2、IV3が変動する環境状況においても、ノードの異常判定の精度を向上させることができる。
前記した実施形態および変形例では、監視装置を光伝送システム100全体の管理を行うネットワークコントローラに適用する例を説明したが、これに限定されない。監視装置は、各ノード110~140を制御するノードコントローラ151~154に適用しても良い。あるいは、監視装置1の一部の機能構成を、ノードコントローラ151、152、153、154で実現しても良い。たとえば、閾値の設定はネットワークコントローラで行い、異常判定処理は各ノードコントローラ151、152、153、154で行っても良い。
なお、本発明は、以上説明した実施形態に限定されるものではなく、多くの変形が本発明の技術的思想内で当分野において通常の知識を有する者により可能である。
1 監視装置
11 データ取得部
12 判定部
13 閾値設定部
14 閾値補正部
15 入出力部
16 記憶部
110、120、130、140 ノード(伝送装置,OXC)
103 波長選択スイッチ(WSS)
106 光チャネルモニタ(モニタ)
Ra 範囲(第1範囲)
Rb、Rb’、Rb’’、Rc 範囲(第2範囲)
IV1 パワー値(第1パワー値)
IV2、IV2’、IV2’’、IV3 パワー値(第2パワー値)
11 データ取得部
12 判定部
13 閾値設定部
14 閾値補正部
15 入出力部
16 記憶部
110、120、130、140 ノード(伝送装置,OXC)
103 波長選択スイッチ(WSS)
106 光チャネルモニタ(モニタ)
Ra 範囲(第1範囲)
Rb、Rb’、Rb’’、Rc 範囲(第2範囲)
IV1 パワー値(第1パワー値)
IV2、IV2’、IV2’’、IV3 パワー値(第2パワー値)
Claims (8)
- 複数のチャネルの光信号を含む光波長多重信号を伝送する伝送装置の監視装置であって、
前記伝送装置が出力する前記光信号のパワー値を測定するモニタから、前記チャネルの波長全体を含む第1範囲の第1パワー値を取得し、前記チャネルの波長の一部を含む第2範囲の第2パワー値を取得するデータ取得部と、
前記第1パワー値および前記第2パワー値を、それぞれ前記伝送装置の定常状態におけるパワー値に基づいた閾値と比較して、前記伝送装置の異常を判定する判定部と、を備えることを特徴とする監視装置。 - 前記伝送装置は、前記複数のチャネルの光信号を多重化して前記光波長多重信号を生成すると共に、各チャネルに割り当てられた波長帯域に応じて前記光信号をフィルタリングする波長選択スイッチを備え、
前記判定部は、前記第1パワー値と前記閾値との比較に基づいて、前記伝送装置における前記波長選択スイッチ以外の要素の異常を判定し、前記第2パワー値と前記閾値との比較に基づいて、前記波長選択スイッチの異常を判定することを特徴とする請求項1記載の監視装置。 - 前記データ取得部は、前記チャネルの波長の一部を含み、互いに位置をずらした2つの範囲を前記第2範囲として設定し、前記2つの範囲のそれぞれにおけるパワー値を、前記第2パワー値として取得することを特徴とする、請求項1または2記載の監視装置。
- 前記データ取得部は、
前記チャネルの波長の、他のチャネルが隣接しない端部を含む範囲を前記第2範囲として設定して、前記第2パワー値を取得することを特徴とする、請求項1または2記載の監視装置。 - 前記データ取得部は、
前記第1範囲と異なる幅を有し、前記チャネルの波長の端部を含む範囲を前記第2範囲として設定して、前記第2パワー値を取得することを特徴とする、請求項1または2記載の監視装置。 - 前記閾値を設定する閾値設定部を備え、
前記閾値設定部は、前記光信号の切り替えが行われた際に、前記モニタから、切り替えが行われた光信号の経路となるチャネルと、隣接するチャネルのパワー値を取得して、前記閾値を設定することを特徴とする請求項2記載の監視装置。 - 複数のチャネルの光信号を含む光波長多重信号を伝送する伝送装置の監視方法であって、
前記伝送装置が出力する前記光信号のパワー値を測定するモニタから、前記チャネルの波長全体を含む第1範囲の第1パワー値を取得し、前記チャネルの波長の一部を含む第2範囲の第2パワー値を取得するステップと、
前記第1パワー値および前記第2パワー値を、それぞれ前記伝送装置の定常状態におけるパワー値に基づいた閾値と比較して、前記伝送装置の異常を判定するステップと、を含むことを特徴とする監視方法。 - コンピュータを、請求項1~6のいずれか一項に記載の監視装置として機能させるための監視プログラム。
Priority Applications (3)
| Application Number | Priority Date | Filing Date | Title |
|---|---|---|---|
| PCT/JP2022/008084 WO2023162185A1 (ja) | 2022-02-25 | 2022-02-25 | 監視装置、監視方法及び監視プログラム |
| US18/839,901 US20250392385A1 (en) | 2022-02-25 | 2022-02-25 | Monitoring device, monitoring method and monitoring program |
| JP2024502413A JP7810249B2 (ja) | 2022-02-25 | 2022-02-25 | 監視装置、監視方法及び監視プログラム |
Applications Claiming Priority (1)
| Application Number | Priority Date | Filing Date | Title |
|---|---|---|---|
| PCT/JP2022/008084 WO2023162185A1 (ja) | 2022-02-25 | 2022-02-25 | 監視装置、監視方法及び監視プログラム |
Publications (1)
| Publication Number | Publication Date |
|---|---|
| WO2023162185A1 true WO2023162185A1 (ja) | 2023-08-31 |
Family
ID=87765176
Family Applications (1)
| Application Number | Title | Priority Date | Filing Date |
|---|---|---|---|
| PCT/JP2022/008084 Ceased WO2023162185A1 (ja) | 2022-02-25 | 2022-02-25 | 監視装置、監視方法及び監視プログラム |
Country Status (3)
| Country | Link |
|---|---|
| US (1) | US20250392385A1 (ja) |
| JP (1) | JP7810249B2 (ja) |
| WO (1) | WO2023162185A1 (ja) |
Citations (4)
| Publication number | Priority date | Publication date | Assignee | Title |
|---|---|---|---|---|
| JP2015019289A (ja) * | 2013-07-11 | 2015-01-29 | 富士通株式会社 | 光伝送装置、光伝送システム、及び光伝送方法 |
| JP2015164264A (ja) * | 2014-02-28 | 2015-09-10 | 富士通株式会社 | 波長多重装置、光伝送装置及び波長多重方法 |
| JP2018133720A (ja) * | 2017-02-16 | 2018-08-23 | 富士通株式会社 | 光伝送装置および波長ずれ検出方法 |
| WO2022009293A1 (ja) * | 2020-07-06 | 2022-01-13 | 日本電信電話株式会社 | 光ノード装置、光トランスポートネットワークシステム、光パストレース方法及びプログラム |
-
2022
- 2022-02-25 WO PCT/JP2022/008084 patent/WO2023162185A1/ja not_active Ceased
- 2022-02-25 US US18/839,901 patent/US20250392385A1/en active Pending
- 2022-02-25 JP JP2024502413A patent/JP7810249B2/ja active Active
Patent Citations (4)
| Publication number | Priority date | Publication date | Assignee | Title |
|---|---|---|---|---|
| JP2015019289A (ja) * | 2013-07-11 | 2015-01-29 | 富士通株式会社 | 光伝送装置、光伝送システム、及び光伝送方法 |
| JP2015164264A (ja) * | 2014-02-28 | 2015-09-10 | 富士通株式会社 | 波長多重装置、光伝送装置及び波長多重方法 |
| JP2018133720A (ja) * | 2017-02-16 | 2018-08-23 | 富士通株式会社 | 光伝送装置および波長ずれ検出方法 |
| WO2022009293A1 (ja) * | 2020-07-06 | 2022-01-13 | 日本電信電話株式会社 | 光ノード装置、光トランスポートネットワークシステム、光パストレース方法及びプログラム |
Non-Patent Citations (1)
| Title |
|---|
| SHARIATI BEHNAM; RUIZ MARC; COMELLAS JAUME; VELASCO LUIS: "Learning From the Optical Spectrum: Failure Detection and Identification", JOURNAL OF LIGHTWAVE TECHNOLOGY, IEEE, USA, vol. 37, no. 2, 15 January 2019 (2019-01-15), USA, pages 433 - 440, XP011710898, ISSN: 0733-8724, DOI: 10.1109/JLT.2018.2859199 * |
Also Published As
| Publication number | Publication date |
|---|---|
| JP7810249B2 (ja) | 2026-02-03 |
| US20250392385A1 (en) | 2025-12-25 |
| JPWO2023162185A1 (ja) | 2023-08-31 |
Similar Documents
| Publication | Publication Date | Title |
|---|---|---|
| JP3798640B2 (ja) | 受信装置及び受信信号の波形劣化補償方法並びに波形劣化検出装置及び方法並びに波形測定装置及び方法 | |
| US6396051B1 (en) | High resolution optical performance monitor for DWDM system | |
| US8811815B2 (en) | Optical network testing | |
| US20100239260A1 (en) | Optical transmission apparatus, optical communication method, and optical communication system | |
| US9876601B2 (en) | Optical transmission system, controller for wavelength tunable filter, and control method of wavelength tunable filter | |
| US8494360B2 (en) | In-service optical network testing | |
| EP3514986A1 (en) | Monitoring system and monitoring method | |
| US20070264010A1 (en) | Self Calibrated Optical Spectrum Monitor | |
| US8254788B2 (en) | High speed in-service optical network testing | |
| US8867922B2 (en) | Control device of node transferring signal light | |
| US20180006717A1 (en) | Network controller, optical transmission system, and method for determining failure | |
| US20140212133A1 (en) | Control device for optical channel monitor, optical transmission device, and method of controlling optical channel monitor | |
| US20190115977A1 (en) | Optical transmission device and optical signal gain control method | |
| JP2006310963A (ja) | 光合分波器及び光アド・ドロップシステム並びに光信号の合分波方法 | |
| EP3493403B1 (en) | A method and apparatus for automatic signal gain setting | |
| US9124382B2 (en) | Transmission device, transmission system, and method for adjusting passband | |
| JP2018133720A (ja) | 光伝送装置および波長ずれ検出方法 | |
| CN110383725A (zh) | 提供无暗段传送网络的系统和方法 | |
| JP7810249B2 (ja) | 監視装置、監視方法及び監視プログラム | |
| US7474854B2 (en) | Optical transmission system | |
| US8837939B2 (en) | Wavelength division multiplexing transmission system, optical channel monitor and optical channel monitoring method | |
| JP2008521304A (ja) | 光信号の監視装置及び方法 | |
| US12580649B2 (en) | Optical signal-to-noise ratio measurement method and apparatus, and computer storage medium | |
| EP3432495B1 (en) | Light transmission device and control method therefor | |
| US6847440B2 (en) | Method for measuring the optical signal-to-noise ratios OSNR in a wavelength division multiplex (WDM) transmission system |
Legal Events
| Date | Code | Title | Description |
|---|---|---|---|
| 121 | Ep: the epo has been informed by wipo that ep was designated in this application |
Ref document number: 22928711 Country of ref document: EP Kind code of ref document: A1 |
|
| ENP | Entry into the national phase |
Ref document number: 2024502413 Country of ref document: JP Kind code of ref document: A |
|
| NENP | Non-entry into the national phase |
Ref country code: DE |
|
| 122 | Ep: pct application non-entry in european phase |
Ref document number: 22928711 Country of ref document: EP Kind code of ref document: A1 |