WO2023149296A1 - Dispositif de traitement d'informations, système d'observation d'échantillon biologique et procédé de production d'image - Google Patents
Dispositif de traitement d'informations, système d'observation d'échantillon biologique et procédé de production d'image Download PDFInfo
- Publication number
- WO2023149296A1 WO2023149296A1 PCT/JP2023/002215 JP2023002215W WO2023149296A1 WO 2023149296 A1 WO2023149296 A1 WO 2023149296A1 JP 2023002215 W JP2023002215 W JP 2023002215W WO 2023149296 A1 WO2023149296 A1 WO 2023149296A1
- Authority
- WO
- WIPO (PCT)
- Prior art keywords
- image
- images
- information
- processing
- unit
- Prior art date
Links
- 230000010365 information processing Effects 0.000 title claims abstract description 122
- 238000000034 method Methods 0.000 title claims description 78
- 239000012472 biological sample Substances 0.000 title claims description 37
- 238000012937 correction Methods 0.000 claims abstract description 82
- 239000000090 biomarker Substances 0.000 claims abstract description 11
- 238000012545 processing Methods 0.000 claims description 296
- 238000004458 analytical method Methods 0.000 claims description 95
- 238000000926 separation method Methods 0.000 claims description 90
- 238000003384 imaging method Methods 0.000 claims description 84
- 230000008569 process Effects 0.000 claims description 38
- 230000003595 spectral effect Effects 0.000 claims description 30
- 206010028980 Neoplasm Diseases 0.000 claims description 20
- 238000005429 filling process Methods 0.000 claims description 10
- 230000009467 reduction Effects 0.000 claims description 8
- 238000001228 spectrum Methods 0.000 abstract description 52
- 239000003153 chemical reaction reagent Substances 0.000 description 94
- 238000002189 fluorescence spectrum Methods 0.000 description 68
- 239000000523 sample Substances 0.000 description 62
- 210000004027 cell Anatomy 0.000 description 61
- 230000005284 excitation Effects 0.000 description 60
- 238000003860 storage Methods 0.000 description 53
- 238000005286 illumination Methods 0.000 description 44
- 230000003287 optical effect Effects 0.000 description 42
- 230000000875 corresponding effect Effects 0.000 description 28
- 230000000694 effects Effects 0.000 description 28
- 210000001519 tissue Anatomy 0.000 description 24
- 238000010586 diagram Methods 0.000 description 22
- 238000010186 staining Methods 0.000 description 17
- 230000007246 mechanism Effects 0.000 description 14
- 230000002708 enhancing effect Effects 0.000 description 13
- 238000004891 communication Methods 0.000 description 12
- 239000007850 fluorescent dye Substances 0.000 description 12
- 238000000701 chemical imaging Methods 0.000 description 11
- 239000000284 extract Substances 0.000 description 11
- 230000006870 function Effects 0.000 description 11
- 238000004519 manufacturing process Methods 0.000 description 11
- 230000001965 increasing effect Effects 0.000 description 9
- 238000005516 engineering process Methods 0.000 description 8
- 238000000605 extraction Methods 0.000 description 8
- 238000005259 measurement Methods 0.000 description 8
- 230000004048 modification Effects 0.000 description 8
- 238000012986 modification Methods 0.000 description 8
- 238000010827 pathological analysis Methods 0.000 description 8
- 230000001575 pathological effect Effects 0.000 description 8
- 239000011159 matrix material Substances 0.000 description 7
- 238000001514 detection method Methods 0.000 description 6
- 239000000975 dye Substances 0.000 description 6
- 238000002073 fluorescence micrograph Methods 0.000 description 6
- 238000010801 machine learning Methods 0.000 description 6
- 239000012528 membrane Substances 0.000 description 6
- 239000000126 substance Substances 0.000 description 6
- 201000010099 disease Diseases 0.000 description 5
- 208000037265 diseases, disorders, signs and symptoms Diseases 0.000 description 5
- 238000009826 distribution Methods 0.000 description 5
- 230000015654 memory Effects 0.000 description 5
- 238000010521 absorption reaction Methods 0.000 description 4
- 210000004369 blood Anatomy 0.000 description 4
- 239000008280 blood Substances 0.000 description 4
- 230000008859 change Effects 0.000 description 4
- 238000001215 fluorescent labelling Methods 0.000 description 4
- 238000009499 grossing Methods 0.000 description 4
- 238000002372 labelling Methods 0.000 description 4
- 239000003550 marker Substances 0.000 description 4
- 230000011218 segmentation Effects 0.000 description 4
- 239000004065 semiconductor Substances 0.000 description 4
- 230000003321 amplification Effects 0.000 description 3
- 238000004364 calculation method Methods 0.000 description 3
- 238000004590 computer program Methods 0.000 description 3
- 238000003199 nucleic acid amplification method Methods 0.000 description 3
- 210000000056 organ Anatomy 0.000 description 3
- 238000005086 pumping Methods 0.000 description 3
- 238000006862 quantum yield reaction Methods 0.000 description 3
- 230000000391 smoking effect Effects 0.000 description 3
- 239000007787 solid Substances 0.000 description 3
- OZLGRUXZXMRXGP-UHFFFAOYSA-N Fluo-3 Chemical compound CC1=CC=C(N(CC(O)=O)CC(O)=O)C(OCCOC=2C(=CC=C(C=2)C2=C3C=C(Cl)C(=O)C=C3OC3=CC(O)=C(Cl)C=C32)N(CC(O)=O)CC(O)=O)=C1 OZLGRUXZXMRXGP-UHFFFAOYSA-N 0.000 description 2
- 241001465754 Metazoa Species 0.000 description 2
- 210000001744 T-lymphocyte Anatomy 0.000 description 2
- 238000000862 absorption spectrum Methods 0.000 description 2
- 230000009471 action Effects 0.000 description 2
- 230000008033 biological extinction Effects 0.000 description 2
- 230000005540 biological transmission Effects 0.000 description 2
- 210000004204 blood vessel Anatomy 0.000 description 2
- 230000002596 correlated effect Effects 0.000 description 2
- 230000037213 diet Effects 0.000 description 2
- 235000005911 diet Nutrition 0.000 description 2
- BFMYDTVEBKDAKJ-UHFFFAOYSA-L disodium;(2',7'-dibromo-3',6'-dioxido-3-oxospiro[2-benzofuran-1,9'-xanthene]-4'-yl)mercury;hydrate Chemical compound O.[Na+].[Na+].O1C(=O)C2=CC=CC=C2C21C1=CC(Br)=C([O-])C([Hg])=C1OC1=C2C=C(Br)C([O-])=C1 BFMYDTVEBKDAKJ-UHFFFAOYSA-L 0.000 description 2
- 239000006185 dispersion Substances 0.000 description 2
- 238000000799 fluorescence microscopy Methods 0.000 description 2
- 238000002594 fluoroscopy Methods 0.000 description 2
- 239000004973 liquid crystal related substance Substances 0.000 description 2
- 239000000463 material Substances 0.000 description 2
- 239000000203 mixture Substances 0.000 description 2
- 230000001915 proofreading effect Effects 0.000 description 2
- 102000004169 proteins and genes Human genes 0.000 description 2
- 108090000623 proteins and genes Proteins 0.000 description 2
- 238000004611 spectroscopical analysis Methods 0.000 description 2
- 210000004895 subcellular structure Anatomy 0.000 description 2
- 238000001356 surgical procedure Methods 0.000 description 2
- FWBHETKCLVMNFS-UHFFFAOYSA-N 4',6-Diamino-2-phenylindol Chemical compound C1=CC(C(=N)N)=CC=C1C1=CC2=CC=C(C(N)=N)C=C2N1 FWBHETKCLVMNFS-UHFFFAOYSA-N 0.000 description 1
- DEXFNLNNUZKHNO-UHFFFAOYSA-N 6-[3-[4-[2-(2,3-dihydro-1H-inden-2-ylamino)pyrimidin-5-yl]piperidin-1-yl]-3-oxopropyl]-3H-1,3-benzoxazol-2-one Chemical compound C1C(CC2=CC=CC=C12)NC1=NC=C(C=N1)C1CCN(CC1)C(CCC1=CC2=C(NC(O2)=O)C=C1)=O DEXFNLNNUZKHNO-UHFFFAOYSA-N 0.000 description 1
- 206010003445 Ascites Diseases 0.000 description 1
- 241000894006 Bacteria Species 0.000 description 1
- 241000282412 Homo Species 0.000 description 1
- 208000002151 Pleural effusion Diseases 0.000 description 1
- 241000700605 Viruses Species 0.000 description 1
- 230000001133 acceleration Effects 0.000 description 1
- 239000000427 antigen Substances 0.000 description 1
- 102000036639 antigens Human genes 0.000 description 1
- 108091007433 antigens Proteins 0.000 description 1
- 238000013473 artificial intelligence Methods 0.000 description 1
- 238000013528 artificial neural network Methods 0.000 description 1
- 238000001574 biopsy Methods 0.000 description 1
- 238000004061 bleaching Methods 0.000 description 1
- 210000000601 blood cell Anatomy 0.000 description 1
- 210000001124 body fluid Anatomy 0.000 description 1
- 239000010839 body fluid Substances 0.000 description 1
- 238000004422 calculation algorithm Methods 0.000 description 1
- 210000004413 cardiac myocyte Anatomy 0.000 description 1
- 230000015556 catabolic process Effects 0.000 description 1
- -1 cell Proteins 0.000 description 1
- 210000000170 cell membrane Anatomy 0.000 description 1
- 210000003855 cell nucleus Anatomy 0.000 description 1
- 239000012916 chromogenic reagent Substances 0.000 description 1
- 239000003086 colorant Substances 0.000 description 1
- 230000000295 complement effect Effects 0.000 description 1
- 210000002808 connective tissue Anatomy 0.000 description 1
- 239000000470 constituent Substances 0.000 description 1
- 230000001276 controlling effect Effects 0.000 description 1
- 238000005520 cutting process Methods 0.000 description 1
- 210000000805 cytoplasm Anatomy 0.000 description 1
- 238000000354 decomposition reaction Methods 0.000 description 1
- 238000006731 degradation reaction Methods 0.000 description 1
- 238000012217 deletion Methods 0.000 description 1
- 230000037430 deletion Effects 0.000 description 1
- 238000003745 diagnosis Methods 0.000 description 1
- 238000001647 drug administration Methods 0.000 description 1
- 235000006694 eating habits Nutrition 0.000 description 1
- 235000013601 eggs Nutrition 0.000 description 1
- 210000003743 erythrocyte Anatomy 0.000 description 1
- 238000005562 fading Methods 0.000 description 1
- 230000003176 fibrotic effect Effects 0.000 description 1
- 239000000834 fixative Substances 0.000 description 1
- GNBHRKFJIUUOQI-UHFFFAOYSA-N fluorescein Chemical compound O1C(=O)C2=CC=CC=C2C21C1=CC=C(O)C=C1OC1=CC(O)=CC=C21 GNBHRKFJIUUOQI-UHFFFAOYSA-N 0.000 description 1
- 102000034287 fluorescent proteins Human genes 0.000 description 1
- 108091006047 fluorescent proteins Proteins 0.000 description 1
- 230000008014 freezing Effects 0.000 description 1
- 238000007710 freezing Methods 0.000 description 1
- 229910052736 halogen Inorganic materials 0.000 description 1
- 150000002367 halogens Chemical class 0.000 description 1
- 238000010191 image analysis Methods 0.000 description 1
- 238000003364 immunohistochemistry Methods 0.000 description 1
- 238000001727 in vivo Methods 0.000 description 1
- 230000010354 integration Effects 0.000 description 1
- 230000003902 lesion Effects 0.000 description 1
- 239000007788 liquid Substances 0.000 description 1
- 230000007774 longterm Effects 0.000 description 1
- 210000001365 lymphatic vessel Anatomy 0.000 description 1
- QSHDDOUJBYECFT-UHFFFAOYSA-N mercury Chemical compound [Hg] QSHDDOUJBYECFT-UHFFFAOYSA-N 0.000 description 1
- 229910052753 mercury Inorganic materials 0.000 description 1
- 229910044991 metal oxide Inorganic materials 0.000 description 1
- 150000004706 metal oxides Chemical class 0.000 description 1
- 230000017074 necrotic cell death Effects 0.000 description 1
- 239000013642 negative control Substances 0.000 description 1
- 210000002569 neuron Anatomy 0.000 description 1
- 238000012758 nuclear staining Methods 0.000 description 1
- 102000039446 nucleic acids Human genes 0.000 description 1
- 108020004707 nucleic acids Proteins 0.000 description 1
- 150000007523 nucleic acids Chemical class 0.000 description 1
- 238000005457 optimization Methods 0.000 description 1
- 230000001151 other effect Effects 0.000 description 1
- 239000012188 paraffin wax Substances 0.000 description 1
- 230000036961 partial effect Effects 0.000 description 1
- 230000007170 pathology Effects 0.000 description 1
- 230000002093 peripheral effect Effects 0.000 description 1
- 239000000049 pigment Substances 0.000 description 1
- 230000010287 polarization Effects 0.000 description 1
- 238000007781 pre-processing Methods 0.000 description 1
- 230000002829 reductive effect Effects 0.000 description 1
- 230000000717 retained effect Effects 0.000 description 1
- 230000002441 reversible effect Effects 0.000 description 1
- 239000002904 solvent Substances 0.000 description 1
- 238000007447 staining method Methods 0.000 description 1
- 239000012128 staining reagent Substances 0.000 description 1
- 239000013076 target substance Substances 0.000 description 1
- 210000002700 urine Anatomy 0.000 description 1
- 230000003313 weakening effect Effects 0.000 description 1
- 229910052724 xenon Inorganic materials 0.000 description 1
- FHNFHKCVQCLJFQ-UHFFFAOYSA-N xenon atom Chemical compound [Xe] FHNFHKCVQCLJFQ-UHFFFAOYSA-N 0.000 description 1
Images


Classifications
-
- G—PHYSICS
- G01—MEASURING; TESTING
- G01N—INVESTIGATING OR ANALYSING MATERIALS BY DETERMINING THEIR CHEMICAL OR PHYSICAL PROPERTIES
- G01N21/00—Investigating or analysing materials by the use of optical means, i.e. using sub-millimetre waves, infrared, visible or ultraviolet light
- G01N21/17—Systems in which incident light is modified in accordance with the properties of the material investigated
- G01N21/25—Colour; Spectral properties, i.e. comparison of effect of material on the light at two or more different wavelengths or wavelength bands
- G01N21/27—Colour; Spectral properties, i.e. comparison of effect of material on the light at two or more different wavelengths or wavelength bands using photo-electric detection ; circuits for computing concentration
-
- G—PHYSICS
- G01—MEASURING; TESTING
- G01N—INVESTIGATING OR ANALYSING MATERIALS BY DETERMINING THEIR CHEMICAL OR PHYSICAL PROPERTIES
- G01N21/00—Investigating or analysing materials by the use of optical means, i.e. using sub-millimetre waves, infrared, visible or ultraviolet light
- G01N21/62—Systems in which the material investigated is excited whereby it emits light or causes a change in wavelength of the incident light
- G01N21/63—Systems in which the material investigated is excited whereby it emits light or causes a change in wavelength of the incident light optically excited
- G01N21/64—Fluorescence; Phosphorescence
Definitions
- the present disclosure relates to an information processing device, a biological sample observation system, and an image generation method.
- color-separated images in multiple fluorescence images may have a small amount of signal and be buried in the background (lower S/N) depending on the types of dyes/antibodies included. This can lead to results that are difficult to understand from a biological point of view.
- CD3, CD5, and CD7 are all markers expressed in the T cell region, but depending on the combination with the dye, some markers may have a low S/N ratio.
- Patent Document 1 in order to remove noise from an image to be processed, a tomographic image before drug administration or a tomographic image subjected to noise removal processing is used as a guidance image, and a guided filter is used to remove noise from the image to be processed.
- a technique for performing noise removal processing is described.
- the acquired signal is divided into coefficients based on the spectrum. If the spectral shapes are close to each other or if the signal is originally small, a color separation image with a low S/N (S/N ratio) will be obtained. Further, even if the obtained image is subjected to NR processing using a general isotropic filter, even the signal required for subsequent cell analysis will be smoothed. For this reason, it is required to obtain necessary signals buried in the background of the image to be processed while maintaining the signal strength necessary for analysis such as cell analysis. This also applies to images to be processed other than color separation images.
- the present disclosure proposes an information processing device, a biological sample observation system, and an image generation method that are capable of acquiring a necessary signal hidden in the background of an image to be processed while maintaining the signal intensity necessary for analysis. .
- An information processing apparatus includes a guide image generation unit that generates a guide image for correction by summing a plurality of images each including spectral information related to biomarkers and dividing by the number of the summed images. .
- a biological sample observation system includes an imaging device that acquires a plurality of images each including spectral information related to biomarkers, and an information processing device that processes the plurality of images, wherein the information processing device has a guide image generation unit that adds up the plurality of images and divides by the total number of images to generate a guide image for correction.
- the image generation method sums up a plurality of images each including spectral information related to biomarkers, divides the sum by the number of summed images, and generates a guide image for correction.
- FIG. 2 is a diagram for explaining the main technical content according to the present disclosure
- FIG. 1 is a diagram illustrating an example of a schematic configuration of an information processing system according to an embodiment of the present disclosure
- FIG. 4 is a flow chart showing an example of a basic processing flow of an information processing apparatus according to an embodiment of the present disclosure
- FIG. 2 is a diagram illustrating an example of a schematic configuration of an analysis unit according to an embodiment of the present disclosure
- FIG. FIG. 3 is a diagram for explaining an example of a method for generating concatenated fluorescence spectra according to embodiments of the present disclosure
- FIG. 7 is a flow chart showing the flow of a first processing example of NR correction using a guide image according to the embodiment of the present disclosure
- FIG. 4 is a diagram illustrating a color map for each Sigma according to a first processing example according to an embodiment of the present disclosure
- FIG. 11 is a flow chart showing the flow of a modification of the first processing example according to the embodiment of the present disclosure
- FIG. 11 is a flow chart showing the flow of a second processing example of NR correction using a guide image according to the embodiment of the present disclosure
- FIG. FIG. 5 is a diagram illustrating a color map for each Sigma according to a second processing example according to an embodiment of the present disclosure
- FIG. 11 illustrates benefits of the second processing example in actual cell analysis according to embodiments of the present disclosure
- FIG. 11 is a flow chart showing the flow of a third processing example of NR correction using a guide image according to the embodiment of the present disclosure
- FIG. 4 is a diagram showing an example of histograms of stained fluorescence component images and unstained fluorescence component images according to an embodiment of the present disclosure
- FIG. 11 is a flow chart showing the flow of a fourth processing example of NR correction using a guide image according to the embodiment of the present disclosure
- FIG. FIG. 4 is a diagram illustrating an example of image processing according to the embodiment of the present disclosure
- FIG. FIG. 4 is a diagram illustrating an example of image processing according to the embodiment of the present disclosure
- FIG. FIG. 12 is a flowchart showing a flow of a fifth processing example of NR correction using a guide image according to the embodiment of the present disclosure
- FIG. 14 is a flow chart showing the flow of a sixth processing example of NR correction using a guide image according to the embodiment of the present disclosure
- FIG. FIG. 14 is a flowchart showing the flow of a seventh processing example of NR correction using a guide image according to the embodiment of the present disclosure
- FIG. 16 is a flow chart showing the flow of an eighth processing example of NR correction using a guide image according to the embodiment of the present disclosure
- FIG. FIG. 21 is a flow chart showing a flow of a ninth processing example of NR correction using a guide image according to an embodiment of the present disclosure
- FIG. FIG. 21 is a flow chart showing the flow of a tenth processing example of NR correction using a guide image according to the embodiment of the present disclosure
- FIG. 4 is an enlarged view showing a region where a sample is irradiated with line illumination; It is a figure which shows roughly the whole structure of a microscope system. It is a figure which shows the example of an imaging system. It is a figure which shows the example of an imaging system. It is a figure which shows an example of the schematic structure of the hardware of an information processing apparatus.
- Each of the one or more embodiments described below can be implemented independently. On the other hand, at least some of the embodiments described below may be implemented in combination with at least some of the other embodiments as appropriate. These multiple embodiments may include novel features that differ from each other. Therefore, these multiple embodiments can contribute to solving different purposes or problems, and can produce different effects.
- Embodiment 2-1 Configuration example of information processing system 2-2.
- Basic processing example of information processing apparatus 2-3 Processing example of fluorescence separation 2-4.
- Ninth processing example 2-4-10 Tenth processing example 2-5. Action and effect 3. Other embodiment4.
- Application example 5 Application example 6.
- FIG. 1 is a diagram for explaining the main technical contents according to the present disclosure.
- the main technical content of the present disclosure is to apply NR (noise reduction: Guided filter) technology using a guide image (Guide) as a filter, and to increase the positive cell rate obtained by cell analysis.
- the present invention relates to image processing technology that makes the image plausible.
- a guide image is created by merging (summing) multiple multispectral images (for example, color separation images) and dividing by the number of merged images.
- NR correction is performed on the image.
- the number of types of guide images is nine from Guide (1) to (9).
- merging is summing up signal intensity values (for example, luminance values or pixel values) of a plurality of multispectral images for each pixel.
- Guide (1) is simply an image that merges multiple multispectral images.
- Guide (2) is an image obtained by subjecting the image of Guide (1) to image processing (for example, median filter, deconv).
- Guide (3) is an image that merges multiple multispectral images with zeros below the positive threshold.
- Guide (4) is an image obtained by subjecting the image of Guide (3) to image processing (for example, median filter, deconv).
- Guide (5) is a merged image of multiple multispectral images corresponding only to membrane staining markers.
- Guide (6) is an image obtained by subjecting the image of Guide (5) to image processing (for example, median filter, deconv).
- Guide (7) is a merged image of multiple multispectral images corresponding only to membrane staining markers, with zeros below the positive threshold.
- Guide (8) is an image obtained by subjecting the image of Guide (7) to image processing (for example, median filter, deconv).
- Guide (9) is an image obtained by weighting the image of Guide (7) by the expression ratio.
- Guide image generation processing such as Guides (1) to (9) and correction processing using the guide image will be described in detail in subsequent embodiments.
- It functions as a guide image.
- an image with a high S/N is used as a guide image.
- NR correction makes it possible to restore the necessary signal buried in the background without weakening the signal strength necessary for cell analysis.
- a guide image with a high S/N ratio may be prepared, signals only at positions where the guide image and the NR target image are spatially correlated may be left, and other signals may be subjected to smoothing processing.
- an NR target image with a low S/N may be corrected based on a guide image composed of cells of the same type (for example, markers specifically expressed in T cell regions).
- a guide image created with markers expressed in a specific cell type it is possible to improve the results of cell analysis limited to that cell type.
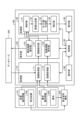
- FIG. 1 is a diagram showing an example of a schematic configuration of an information processing system according to this embodiment.
- An information processing system is an example of a biological sample observation system.
- the information processing system includes an information processing device 100 and a database 200. As inputs to this information processing system, there are a fluorescent reagent 10A, a sample 20A, and a fluorescently stained sample 30A.
- the fluorescent reagent 10A is a chemical used for staining the specimen 20A.
- the fluorescent reagent 10A is, for example, a fluorescent antibody, a fluorescent probe, or a nuclear staining reagent, but the type of the fluorescent reagent 10A is not particularly limited to these.
- Fluorescent antibodies include, for example, primary antibodies used for direct labeling, or secondary antibodies used for indirect labeling.
- the fluorescent reagent 10A is managed with identification information capable of identifying the fluorescent reagent 10A and the manufacturing lot of the fluorescent reagent 10A.
- the identification information is called “reagent identification information 11A.”
- the reagent identification information 11A is, for example, barcode information such as one-dimensional barcode information or two-dimensional barcode information, but is not limited to this.
- the fluorescent reagent 10A even if the product is of the same type, has different properties for each manufacturing lot depending on the manufacturing method, the state of the cells from which the antibody was obtained, and the like. For example, in the fluorescent reagent 10A, spectral information, quantum yield, fluorescence labeling rate, etc. differ for each production lot.
- the fluorescence labeling ratio is also called "F/P value: Fluorescein/Protein" and refers to the number of fluorescent molecules that label an antibody.
- the fluorescent reagent 10A is managed for each production lot by attaching the reagent identification information 11A.
- the reagent information of each fluorescent reagent 10A is managed for each production lot.
- the information processing apparatus 100 can separate the fluorescence signal and the autofluorescence signal while taking into account slight differences in properties that appear in each manufacturing lot.
- the management of the fluorescent reagent 10A in production lot units is merely an example, and the fluorescent reagent 10A may be managed in units smaller than the production lot.
- the specimen 20A is prepared from a specimen or tissue sample collected from a human body for the purpose of pathological diagnosis, clinical examination, or the like.
- the type of tissue used such as organs or cells, the type of target disease, attributes of the subject such as age, sex, blood type, or race, or diet, exercise habits, etc. , or lifestyle habits of subjects such as smoking habits are not particularly limited.
- the specimens 20A are managed with identification information that can identify each specimen 20A.
- the identification information is called "specimen identification information 21A."
- the specimen identification information 21A is, for example, barcode information such as one-dimensional barcode information or two-dimensional barcode information, but is not limited to this.
- the properties of the specimen 20A differ depending on the type of tissue used, the type of target disease, the subject's attributes, or the subject's lifestyle.
- measurement channels or spectral information differ depending on the type of tissue used. Therefore, in the information processing system according to the present embodiment, the specimens 20A are individually managed by attaching specimen identification information 21A. Accordingly, the information processing apparatus 100 can separate the fluorescence signal and the autofluorescence signal while taking into consideration even slight differences in properties that appear in each specimen 20A.
- the fluorescently stained specimen 30A is created by staining the specimen 20A with the fluorescent reagent 10A.
- the fluorescence-stained specimen 30A assumes that the specimen 20A is stained with at least one fluorescent reagent 10A, and the number of fluorescent reagents 10A used for staining is not particularly limited.
- the staining method is determined by the combination of the specimen 20A and the fluorescent reagent 10A, and is not particularly limited.
- the fluorescence-stained specimen 30A is input to the information processing apparatus 100 and imaged.
- the information processing apparatus 100 includes an acquisition unit 110, a storage unit 120, a processing unit 130, a display unit 140, a control unit 150, and an operation unit 160, as shown in FIG.
- the acquisition unit 110 is configured to acquire information used for various processes of the information processing apparatus 100 .
- the acquisition section 110 includes an information acquisition section 111 and an image acquisition section 112 .
- the information acquisition unit 111 is configured to acquire reagent information and sample information. More specifically, the information acquisition unit 111 acquires the reagent identification information 11A attached to the fluorescent reagent 10A and the specimen identification information 21A attached to the specimen 20A used to generate the fluorescently stained specimen 30A. For example, the information acquisition unit 111 acquires the reagent identification information 11A and the specimen identification information 21A using a barcode reader or the like. Then, the information acquisition unit 111 acquires the reagent information based on the reagent identification information 11A and the specimen information based on the specimen identification information 21A from the database 200, respectively. The information acquisition unit 111 stores the acquired information in the information storage unit 121, which will be described later.
- the image acquisition unit 112 is configured to acquire image information of the fluorescently stained specimen 30A and the specimen 20A stained with at least one fluorescent reagent 10A. More specifically, the image acquisition unit 112 includes an arbitrary imaging device such as a CCD or CMOS, and acquires image information by imaging the fluorescence-stained specimen 30A using the imaging device.
- image information is a concept that includes not only the image itself of the fluorescence-stained specimen 30A, but also measured values that are not visualized as images.
- the image information may include information on the wavelength spectrum of fluorescence emitted from the fluorescently stained specimen 30A.
- the wavelength spectrum of the fluorescence will be referred to as fluorescence spectrum.
- the image acquisition unit 112 stores the image information in the image information storage unit 122, which will be described later.
- the storage unit 120 is configured to store information used for various processes of the information processing apparatus 100 or information output by various processes. As shown in FIG. 1 , the storage unit 120 includes an information storage unit 121 , an image information storage unit 122 and an analysis result storage unit 123 .
- the information storage unit 121 is configured to store reagent information and specimen information acquired by the information acquisition unit 111 . Note that after the analysis processing by the analysis unit 131 and the image information generation processing by the image generation unit 132, that is, the image information reconstruction processing, which will be described later, are completed, the information storage unit 121 stores the reagent information and specimen used for the processing. Free space may be increased by deleting information.
- the image information storage unit 122 is configured to store the image information of the fluorescence-stained specimen 30A acquired by the image acquisition unit 112 .
- the image information storage unit 122 Free space may be increased by deleting used image information.
- the analysis result storage unit 123 is configured to store the result of analysis processing performed by the analysis unit 131, which will be described later.
- the analysis result storage unit 123 stores the fluorescence signal of the fluorescent reagent 10A or the autofluorescence signal of the sample 20A separated by the analysis unit 131 .
- the analysis result storage unit 123 separately provides the result of the analysis processing to the database 200 in order to improve the analysis accuracy by machine learning or the like. After providing the analysis result to the database 200, the analysis result saving unit 123 may appropriately delete the analysis result saved by itself to increase the free space.
- the processing unit 130 is a functional configuration that performs various types of processing using image information, reagent information, and specimen information. As shown in FIG. 1, the processing unit 130 includes an analysis unit 131, an image generation unit 132, a guide image generation unit 133, and a correction unit .
- the analysis unit 131 is configured to perform various analysis processes using image information, specimen information, and reagent information. For example, the analysis unit 131 extracts the autofluorescence signal of the sample 20A from the image information based on the sample information and the reagent information, for example, the autofluorescence spectrum, which is an example of an autofluorescence component, and the fluorescence signal of the fluorescent reagent 10A, such as a staining fluorescence component. A process of separating the staining fluorescence spectrum, which is an example, is performed.
- the analysis unit 131 recognizes one or more elements that make up the autofluorescence signal based on the measurement channel included in the specimen information. For example, the analysis unit 131 recognizes one or more autofluorescence components forming the autofluorescence signal. Then, the analysis unit 131 predicts the autofluorescence signal included in the image information using the spectral information of these autofluorescence components included in the specimen information. Then, the analysis unit 131 separates the autofluorescence signal and the fluorescence signal from the image information based on the spectral information of the fluorescent component of the fluorescent reagent 10A and the predicted autofluorescence signal included in the reagent information.
- the analysis unit 131 when the specimen 20A is dyed with two or more fluorescent reagents 10A, the analysis unit 131, based on the specimen information and the reagent information, from the image information or the fluorescence signal separated from the autofluorescence signal, The fluorescent signal of each of these two or more fluorescent reagents 10A is separated.
- the analysis unit 131 uses the spectral information of the fluorescent component of each fluorescent reagent 10A included in the reagent information to separate the fluorescent signal of each fluorescent reagent 10A from the entire fluorescent signal after being separated from the autofluorescent signal. do.
- the analysis unit 131 when the autofluorescence signal is composed of two or more autofluorescence components, the analysis unit 131, based on the specimen information and the reagent information, from the image information or the autofluorescence signal separated from the fluorescence signal, Separate the autofluorescent signal for each individual autofluorescent component. For example, the analysis unit 131 separates the autofluorescence signal of each autofluorescence component from the entire autofluorescence signal separated from the fluorescence signal using the spectrum information of each autofluorescence component included in the specimen information.
- the analysis unit 131 that separates the fluorescence signal and the autofluorescence signal performs various processes using these signals.
- the analysis unit 131 may extract the fluorescence signal from the image information of the other specimen 20A by performing a subtraction process on the image information of the other specimen 20A using the autofluorescence signal after separation. .
- the subtraction process is also called "background subtraction process".
- the similar specimen 20A here means, for example, a tissue section before staining of a tissue section to be stained, a section adjacent to the stained section, a section different from the stained section in the same block, or a section in a different block in the same tissue. , sections taken from different patients, etc.
- the tissue section is hereinafter referred to as section.
- Identical blocks were sampled from the same location as the stained section. Different blocks were sampled from different locations than the stained section. Therefore, when the autofluorescence signal can be extracted from a certain specimen 20A, the analysis unit 131 extracts the fluorescence signal from the image information of the other specimen 20A by removing the autofluorescence signal from the image information of the other specimen 20A. may be extracted. Further, when the analysis unit 131 calculates the S/N value using the image information of the other specimen 20A, the S/N value can be improved by using the background after removing the autofluorescence signal. can.
- the analysis unit 131 can also perform various processes using the separated fluorescence signal or the autofluorescence signal. For example, the analysis unit 131 can use these signals to analyze the immobilization state of the specimen 20A, and to perform segmentation or area division for recognizing object areas included in image information.
- Objects are, for example, cells, subcellular structures, or tissues.
- Subcellular structures are, for example, the cytoplasm, cell membrane, nucleus, and the like.
- Tissues include, for example, tumorous areas, nontumoral areas, connective tissue, blood vessels, blood vessel walls, lymphatic vessels, fibrotic structures, necrosis, and the like.
- the image generation unit 132 is configured to generate, that is, reconstruct image information based on the fluorescence signal or the autofluorescence signal separated by the analysis unit 131 .
- the image generator 132 can generate image information containing only fluorescence signals, or image information containing only autofluorescence signals.
- the image generation unit 132 generates image information for each component. be able to.
- the analysis unit 131 performs various processes using the separated fluorescence signal or autofluorescence signal
- the image generation unit 132 may generate image information indicating the results of those processes.
- Various types of processing include, for example, analysis of the immobilized state of the specimen 20A, segmentation, or calculation of the S/N value.
- the distribution information of the fluorescent reagent 10A labeled on the target molecule or the like that is, the two-dimensional spread and intensity of the fluorescence, the wavelength, and the positional relationship between them can be visualized. It is possible to improve the visibility of the user, such as a doctor or a researcher, in the tissue image analysis area.
- the image generation unit 132 may generate image information by performing control to distinguish the fluorescence signal from the autofluorescence signal based on the fluorescence signal or the autofluorescence signal separated by the analysis unit 131 . Specifically, it improves the brightness of the fluorescent spectrum of the fluorescent reagent 10A labeled with the target molecule or the like, extracts only the fluorescent spectrum of the labeled fluorescent reagent 10A and changes its color, and is labeled with two or more fluorescent reagents 10A.
- Fluorescence spectra of two or more fluorescent reagents 10A are extracted from the sample 20A and each is changed to a different color, only the autofluorescence spectrum of the sample 20A is extracted and divided or subtracted, the dynamic range is improved, and the like are controlled to control the image. information may be generated. As a result, the user can clearly distinguish the color information derived from the fluorescent reagent bound to the target substance of interest, and the user's visibility can be improved.
- the guide image generation unit 133 merges a plurality of color separation images (an example of a multispectral image) and divides by the number of merged images to generate a guide image for correction.
- a color separation image is an image generated by color separation processing.
- Summing and dividing the images means summing the signal intensities of the images and dividing by the total number of images.
- the guide image generating unit 133 can perform image processing after merging/dividing when generating the guide image, or perform zero-filling processing on the color separation image before merging/dividing. In image processing, for example, noise removal filters, edge enhancement filters, and the like are used. Such guide image generation processing and the like will be described in detail later.
- the correction unit 134 performs NR (noise reduction) correction on the color separation image (an example of the image to be processed) using the generated guide image. Further, the correction unit 134 can perform outlier processing on the color separation image before correction processing. Outlier processing is, for example, processing for removing signal intensity values such as red blood cells that greatly deviate from other signal intensity values. Such correction processing and the like will be described in detail later.
- the display unit 140 presents the corrected image information (corrected image information) generated by the correction unit 134 to the user by displaying it on the display.
- the type of display used as display unit 140 is not particularly limited. Further, although not described in detail in this embodiment, the corrected image information generated by the correction unit 134 may be presented to the user by being projected by a projector or printed by a printer. In other words, the method of outputting image information after correction is not particularly limited.
- the control unit 150 is a functional configuration that controls overall processing performed by the information processing apparatus 100 .
- the control unit 150 controls the start and end of various processes as described above based on the user's operation input through the operation unit 160 .
- Various types of processing include, for example, imaging processing, analysis processing, image information generation processing, guide image information generation processing, image information correction processing, and image information display processing for the fluorescently stained specimen 30A.
- Image information generation processing includes, for example, image information reconstruction processing.
- the control content of the control part 150 is not specifically limited.
- the control unit 150 may control processing generally performed in general-purpose computers, PCs, tablet PCs, and the like, for example, processing related to an OS (Operating System).
- OS Operating System
- the operation unit 160 is configured to receive an operation input from the user. More specifically, the operation unit 160 includes various input means such as a keyboard, a mouse, buttons, a touch panel, or a microphone. input can be performed. Information regarding the operation input performed via the operation unit 160 is provided to the control unit 150 .
- the database 200 is a device that manages sample information, reagent information, and analysis processing results. More specifically, the database 200 associates and manages the specimen identification information 21A and the specimen information, and the reagent identification information 11A and the reagent information. Accordingly, the information acquisition unit 111 can acquire specimen information from the database 200 based on the specimen identification information 21A of the specimen 20A to be measured, and reagent information based on the reagent identification information 11A of the fluorescent reagent 10A.
- the specimen information managed by the database 200 is, as described above, information including the measurement channel and spectrum information specific to the autofluorescence component contained in the specimen 20A.
- the specimen information includes target information about each specimen 20A, specifically, types of tissues used such as organs, cells, blood, body fluids, ascites, and pleural effusions, target diseases, and so on.
- type of subject such as age, sex, blood type, or race, or information about the subject's lifestyle, such as diet, exercise habits, or smoking habits.
- the information including the measurement channel and spectrum information unique to the autofluorescence component contained in 20A and the target information may be associated with each specimen 20A.
- tissue used is not particularly limited to the tissue collected from the subject, and includes in vivo tissues such as humans and animals, cell strains, and solutions, solvents, solutes, and materials contained in the subject of measurement. may
- the reagent information managed by the database 200 is, as described above, information including the spectral information of the fluorescent reagent 10A.
- Information about the fluorescent reagent 10A such as labeling rate, quantum yield, bleaching coefficient, and absorption cross-section or molar extinction coefficient may be included.
- the fading coefficient is information indicating how easily the fluorescence intensity of the fluorescent reagent 10A is reduced.
- the specimen information and reagent information managed by the database 200 may be managed in different configurations, and in particular, the information on reagents may be a reagent database that presents the user with the optimum combination of reagents.
- the specimen information and reagent information are either provided by the manufacturer, etc., or measured independently within the information processing system according to the present disclosure.
- the manufacturer of the fluorescent reagent 10A often does not measure and provide spectral information, fluorescence labeling rate, etc. for each manufacturing lot. Therefore, by independently measuring and managing these pieces of information within the information processing system according to the present disclosure, the separation accuracy between the fluorescence signal and the autofluorescence signal can be improved.
- the database 200 may use catalog values published by manufacturers or literature values described in various documents as sample information and reagent information, particularly reagent information. .
- actual specimen information and reagent information often differ from catalog values and literature values, so specimen information and reagent information are measured independently within the information processing system according to the present disclosure as described above. Managed is better.
- the accuracy of analysis processing such as separation processing between fluorescence signals and autofluorescence signals is improved. obtain.
- the analysis unit 131 of the information processing apparatus 100 uses a neural network to perform machine learning using learning data in which the fluorescent signal and autofluorescent signal after separation are associated with the image information, specimen information, and reagent information used for separation. Generate a classifier or estimator.
- the analysis unit 131 inputs the information into the classifier or the estimator, thereby obtaining the fluorescence signal and the autofluorescence signal included in the image information. can be predicted and output.
- a separation process is, for example, a separation process in which similar image information, specimen information, or reagent information is used.
- the contents of processing include, for example, information and parameters used in the processing.
- the machine learning method is not limited to the above, and a known machine learning technique can be used.
- artificial intelligence may be used to separate the fluorescence signal and the autofluorescence signal.
- various processing using the separated fluorescent signal or the autofluorescent signal for example, analysis of the immobilization state of the specimen 20A, segmentation, etc. may be improved by
- the configuration example of the information processing system according to the present embodiment has been described above. Note that the above configuration described with reference to FIG. 2 is merely an example, and the configuration of the information processing system according to this embodiment is not limited to this example.
- the information processing apparatus 100 does not necessarily have all the functional configurations shown in FIG. Further, the information processing apparatus 100 may include the database 200 therein.
- the functional configuration of the information processing apparatus 100 can be flexibly modified according to specifications and operations.
- the information processing apparatus 100 may perform processing other than the processing described above.
- the reagent information includes information such as the quantum yield, fluorescence labeling rate, absorption cross section, or molar extinction coefficient of the fluorescent reagent 10A.
- the reagent information, the number of fluorescent molecules in the image information, the number of antibodies bound to the fluorescent molecules, and the like may be calculated.
- FIG. 3 is a flowchart showing an example of the basic processing flow of the information processing apparatus 100 according to this embodiment.
- step S1001 the user determines the fluorescent reagent 10A and specimen 20A to be used for analysis.
- step S1002 the user creates a fluorescently stained specimen 30A by staining the specimen 20A with the fluorescent reagent 10A.
- step S1003 the image acquisition unit 112 of the information processing apparatus 100 acquires image information (for example, a fluorescently stained specimen image) by imaging the fluorescently stained specimen 30A.
- step S1004 the information acquisition unit 111 acquires the reagent information and specimen information based on the reagent identification information 11A attached to the fluorescent reagent 10A and the specimen identification information 21A attached to the specimen 20A used to generate the fluorescently stained specimen 30A. is obtained from the database 200 .
- step S1005 the analysis unit 131 separates the autofluorescence signal of the specimen 20A and the fluorescence signal of the fluorescent reagent 10A from the image information based on the specimen information and the reagent information.
- the fluorescence signal includes signals of a plurality of fluorochromes (Yes in step S1006)
- the analysis unit 131 separates the fluorescence signals of each fluorochrome in step S1007. If the fluorescent signal does not include signals of a plurality of fluorescent dyes (No in step S1006), separation processing of the fluorescent signals of the respective fluorescent dyes is not performed in step S1007.
- step S1008 the image generation unit 132 uses the fluorescence signals separated by the analysis unit 131 to generate image information. For example, the image generation unit 132 generates image information from which the autofluorescence signal is removed from the image information, or generates image information in which the fluorescence signal is displayed for each fluorescent dye.
- the guide image generation unit 133 generates a guide image
- the correction unit 134 performs NR correction on the color separation image using the guide image, for example.
- step S1010 the display unit 140 displays the image information corrected by the correction unit 134, and the series of processing ends.
- each step in the flowchart of FIG. 3 does not necessarily have to be processed in chronological order according to the described order. That is, each step in the flow chart may be processed in a different order than the order described or in parallel.
- the analysis unit 131 separates the fluorescence signal of each fluorescent dye in step S1007.
- the fluorescence signal of each fluorochrome may be separated directly from the image information.
- the analysis unit 131 may separate the autofluorescence signal of the specimen 20A from the image information after separating the fluorescence signal of each fluorescent dye from the image information.
- the information processing apparatus 100 may also execute processing not shown in FIG.
- the analysis unit 131 may not only separate signals, but may also perform segmentation based on the separated fluorescent signal or autofluorescent signal, or may analyze the immobilization state of the specimen 20A.
- FIG. 4 is a diagram showing an example of a schematic configuration of the analysis unit 131 according to this embodiment.
- FIG. 5 is a diagram for explaining an example of a method for generating a concatenated fluorescence spectrum according to this embodiment.
- the analysis unit 131 includes a connection unit 1311, a color separation unit 1321, and a spectrum extraction unit 1322.
- This analysis unit 131 is configured to perform various types of processing including fluorescence separation processing.
- the analysis unit 131 is configured to concatenate fluorescence spectra as preprocessing for fluorescence separation processing and separate the concatenated fluorescence spectra for each molecule.
- connection unit 1311 is configured to generate a connection fluorescence spectrum by connecting at least part of the plurality of fluorescence spectra acquired by the image acquisition unit 112 in the wavelength direction.
- the connecting unit 1311 extracts data of a predetermined width in each fluorescence spectrum so as to include the maximum fluorescence intensity in each of the four fluorescence spectra (A to D in FIG. 5) acquired by the image acquisition unit 112. .
- the width of the wavelength band from which the connecting part 1311 extracts data may be determined based on reagent information, excitation wavelength, fluorescence wavelength, or the like, and may be different for each fluorescent substance.
- the width of the wavelength band from which the connector 1311 extracts data may be different for each of the fluorescence spectra shown in AD of FIG. Then, as shown in E of FIG. 5, the connecting unit 1311 generates one connected fluorescence spectrum by connecting the extracted data in the wavelength direction. Note that since the concatenated fluorescence spectrum is composed of data extracted from a plurality of fluorescence spectra, the wavelengths are not continuous at the boundaries of each concatenated data.
- the connecting unit 1311 performs the above connection after aligning the intensity of the excitation light corresponding to each of the plurality of fluorescence spectra based on the intensity of the excitation light, in other words, after correcting the plurality of fluorescence spectra. . More specifically, the connecting unit 1311 divides each fluorescence spectrum by the excitation power density, which is the intensity of the excitation light, to equalize the intensity of the excitation light corresponding to each of the plurality of fluorescence spectra, and then perform the above connection. conduct. As a result, fluorescence spectra are obtained when excitation light of the same intensity is applied.
- the intensity of the irradiated excitation light is different, the intensity of the spectrum absorbed by the fluorescence-stained specimen 30A also differs according to the intensity.
- the spectrum is called an "absorption spectrum.” Therefore, as described above, by aligning the intensity of the excitation light corresponding to each of the plurality of fluorescence spectra, the absorption spectra can be appropriately evaluated.
- the fluorescence-stained specimen 30A contains, for example, four types of fluorescent substances, DAPI, CK/AF488, PgR/AF594 and ER/AF647, each having an excitation wavelength of 392 nm (A ), 470 nm (FIG. 5B), 549 nm (FIG. 5C), and 628 nm (FIG. 5D).
- the fluorescence wavelength is shifted to longer wavelengths than the excitation wavelength (Stokes shift) due to the release of energy for fluorescence emission.
- the fluorescent substance contained in the fluorescently stained specimen 30A and the excitation wavelength of the irradiated excitation light are not limited to the above.
- the connecting unit 1311 extracts the fluorescence spectrum SP1 in the wavelength band of 392 nm or more and 591 nm or less of the excitation wavelength from the fluorescence spectrum shown in A of FIG. Extract the fluorescence spectrum SP2 in the wavelength band of , Extract the fluorescence spectrum SP3 in the wavelength band of 549 nm or more and 748 nm or less from the fluorescence spectrum shown in C of FIG. A fluorescence spectrum SP4 in a wavelength band of 827 nm or less is extracted.
- the connecting unit 1311 corrects the wavelength resolution of the extracted fluorescence spectrum SP1 to 16 nm (no intensity correction), corrects the intensity of the fluorescence spectrum SP2 to 1.2 times, and corrects the wavelength resolution to 8 nm,
- the intensity of the fluorescence spectrum SP3 is corrected to 1.5 times (no wavelength resolution correction)
- the intensity of the fluorescence spectrum SP4 is corrected to 4.0 times
- the wavelength resolution is corrected to 4 nm.
- the linking unit 1311 then links the corrected fluorescence spectra SP1 to SP4 in order to generate a linked fluorescence spectrum as shown in E of FIG.
- FIG. 5 shows a case where the connection unit 1311 extracts and connects fluorescence spectra SP1 to SP4 having a predetermined bandwidth (200 nm width in FIG. 5) from the excitation wavelength when each fluorescence spectrum is acquired.
- the bandwidth of the fluorescence spectrum extracted by the connecting part 1311 does not need to be the same for each fluorescence spectrum, and may be different. That is, the region extracted from each fluorescence spectrum by the connecting part 1311 may be a region including the peak wavelength of each fluorescence spectrum, and its wavelength band and bandwidth may be changed as appropriate. At that time, spectral wavelength deviation due to Stokes shift may be taken into consideration. By narrowing down the wavelength band to be extracted in this way, it is possible to reduce the amount of data, so that fluorescence separation processing can be executed at a higher speed.
- the intensity of pumping light in this description may be pumping power or pumping power density, as described above.
- the excitation power or excitation power density may be the power or power density obtained by actually measuring the excitation light emitted from the light source, or the power or power density obtained from the driving voltage applied to the light source.
- the intensity of the excitation light in this description refers to the excitation power density, the absorption rate of the section to be observed for each excitation light, and the detection system that detects the fluorescence emitted from the section, such as the image acquisition unit 112. It may be a value obtained by correcting with the amplification factor of the detection signal or the like.
- the intensity of the excitation light in this description may be the power density of the excitation light that actually contributes to the excitation of the fluorescent substance, or a value obtained by correcting the power density with the amplification factor of the detection system.
- the absorption rate and amplification factor it is possible to appropriately correct the intensity of the excitation light that changes according to changes in the machine state and environment, enabling more accurate color separation.
- a concatenated fluorescence spectrum can be generated.
- the correction value based on the intensity of the excitation light for each fluorescence spectrum is not limited to a value for matching the intensity of the excitation light corresponding to each of the plurality of fluorescence spectra, and may be variously modified.
- the correction value is also called an intensity correction value.
- the signal intensity of fluorescence spectra having intensity peaks on the long wavelength side tends to be lower than the signal intensity of fluorescence spectra having intensity peaks on the short wavelength side. Therefore, when the combined fluorescence spectrum includes both a fluorescence spectrum with an intensity peak on the long wavelength side and a fluorescence spectrum with an intensity peak on the short wavelength side, the fluorescence spectrum with an intensity peak on the long wavelength side is hardly taken into account.
- only fluorescence spectra having intensity peaks on the short wavelength side may be extracted.
- a larger intensity correction value for a fluorescence spectrum having an intensity peak on the long wavelength side it is also possible to improve the separation accuracy of the fluorescence spectrum with an intensity peak on the short wavelength side.
- the color separation unit 1321 includes, for example, a first color separation unit 1321a and a second color separation unit 1321b, and color-separates the connected fluorescence spectra of the stained sections input from the connection unit 1311 for each molecule.
- a stained section is also referred to as a stained sample.
- the first color separation unit 1321a separates the combined fluorescence spectrum of the stained sample input from the linking unit 1311 from the combined fluorescence reference spectrum included in the reagent information input from the information storage unit 121.
- the concatenated fluorescence spectrum is separated into spectra for each molecule.
- LSM least squares method
- WLSM weighted least squares method
- NMF nonnegative matrix factorization
- Gram matrix tAA nonnegative matrix factorization
- the second color separation unit 1321b performs color separation processing on the combined fluorescence spectrum of the stained sample input from the connection unit 1311, using the adjusted combined autofluorescence reference spectrum input from the spectrum extraction unit 1322. This separates the concatenated fluorescence spectra into individual molecule spectra.
- the color separation processing similarly to the first color separation unit 1321a, for example, the least squares method (LSM), the weighted least squares method (WLSM), the non-negative matrix factorization (NMF), and the Gram matrix tAA . Non-negative matrix factorization, etc. may be used.
- the method of least squares calculates the color mixture rate by, for example, fitting the connected fluorescence spectrum generated by the connecting unit 1311 to the reference spectrum.
- weighting is performed so as to give importance to low signal level errors, using the Poisson distribution of the noise of the concatenated fluorescence spectrum (Signal), which is the measured value.
- the offset value is the upper limit value at which weighting is not performed by the weighted least squares method. The offset value is determined by the characteristics of the sensor used for measurement, and requires separate optimization when an imaging device is used as the sensor.
- the spectrum extraction unit 1322 is a configuration for improving the concatenated autofluorescence reference spectrum so as to obtain more accurate color separation results. Based on the color separation result by the color separation unit 1321, the reference spectrum is adjusted so that a more accurate color separation result can be obtained.
- the spectrum extraction unit 1322 performs spectrum extraction processing using the color separation result input from the first color separation unit 1321a on the concatenated autofluorescence reference spectrum input from the information storage unit 121, and based on the result
- the concatenated autofluorescence reference spectrum is adjusted by using the concatenated autofluorescence reference spectrum to improve the concatenated autofluorescence reference spectrum to yield more accurate color separation results.
- NMF non-negative matrix factorization
- SVD singular value decomposition
- FIG. 4 illustrates a case in which the consolidated autofluorescence reference spectrum is adjusted once
- the present invention is not limited to this.
- the final color separation result may be acquired after repeating the process of readjusting the concatenated autofluorescence reference spectrum in the extraction unit 1322 one or more times.
- the first color separation unit 1321a and the second color separation unit 1321b perform fluorescence separation processing using reference spectra (connected autofluorescence reference spectrum and connected fluorescence reference spectrum) connected in the wavelength direction. , can output a unique spectrum as a separation result. Separation results are not separated for each excitation wavelength. Therefore, the practitioner can more easily obtain the correct spectrum.
- a reference spectrum concatenated autofluorescence reference spectrum
- fluorescence separation processing is performed, so that the operator can detect autofluorescence from an appropriate space of the unstained section. It eliminates the need to extract spectra.
- FIG. 6 is a flowchart showing the flow of the first processing example of NR correction using the guide image according to this embodiment.
- FIG. 7 is a diagram showing a color map for each Sigma according to the first processing example according to the present embodiment. Sigma represents the NR intensity.
- step S11 the above-described color separation (generation of color-separated image) is performed in step S11.
- step S12 the guide image generation unit 133 merges all images after color separation (color separation images: Fluo 1, 2, 3, . . . ) and divides by the number of merged images to generate a guide image. do.
- step S13 the correcting unit 134 performs NR correction by smoothing other portions while leaving the brightness of the portions that are spatially correlated between the generated guide image and the processing target image (NR correction target image).
- step S14 cell analysis (for example, calculation of positive cell ratio, etc.) is performed on the image after NR correction.
- the display unit 140 displays an image after NR correction. Thereby, the user can visually recognize the image after the NR correction. Further, the number of processing target images to be processed for NR correction may be one or plural. This image to be processed is selected and set by the user, for example. At this time, the user, for example, performs input operations on the operation unit 160 to select or change the image to be processed.
- the smoothing range can be adjusted by Sigma, and the larger the Sigma, the stronger the NR effect.
- Sigma is information about the standard deviation.
- This sigma may be selected by the user or calculated from the image to be processed, which is the original image. For example, the sigma may be first automatically calculated from the image to be processed and set, and then changed and set by the user as necessary. At this time, the user selects or changes the sigma by performing an input operation on the operation unit 160, for example.
- FIG. 8 is a flow chart showing the flow of a modification of the first processing example according to this embodiment.
- the correction unit 134 determines whether outlier processing is performed.
- outlier processing is, for example, zero-filling processing for zeroing outliers in the image to be processed in advance. In this way, by zeroing outliers in the image to be processed in advance in order to prevent unnecessary artifacts from occurring due to NR correction, it is possible to obtain a more reliable NR correction result.
- FIG. 9 is a flowchart showing the flow of a second processing example of NR correction using a guide image according to this embodiment.
- FIG. 10 is a diagram showing a color map for each Sigma according to the second processing example according to the present embodiment. Sigma represents the NR intensity.
- FIG. 11 is a diagram showing benefits of the second processing example in actual cell analysis according to this embodiment.
- the guide image generation unit 133 performs color separation after color separation in step S31. (color separated images: Fluo 1, 2, 3, 4, 5) are merged and divided by the number of merged images. By executing it, a guide image is generated.
- noise removal processing and edge enhancement processing can be used.
- a median filter, an average filter, a Gaussian filter, etc. can be used as a noise removal filter.
- edge enhancement process for example, Deconvwnr, Deconvreg, Deconvlucy, Deconvblind, primary differential filter, secondary differential filter, etc. can be used as an edge enhancement filter.
- the smoothing range can be adjusted by Sigma, and the larger the Sigma, the stronger the NR effect.
- the sigma is information about the standard deviation, and may be selected by the user or calculated from the processing target image, which is the original image, as in the first processing example.
- the guide image generation unit 133 performs image processing after summing and dividing a plurality of multispectral images. Image processing may be performed after the images are summed and before division.
- FIG. 12 is a flowchart showing the flow of a third processing example of NR correction using a guide image according to this embodiment.
- the guide image generation unit 133 performs color separation after color separation in step S41.
- a plurality of images (color separation images: Fluo 1, 2, 3, 4, 5) are zero-filled to zero pixels below a predetermined positive threshold, and in step S42, each image after zeroing are merged and divided by the number of merged images to generate a guide image.
- a plurality of multispectral images for example, color separation images
- a plurality of multispectral images after zeroing By merging and dividing, the guide image has a higher S/N ratio. Therefore, the NR effect can be enhanced by increasing the S/N ratio of the guide image.
- the guide image generation unit 133 generates a multispectral image, for example, a stained fluorescence component image D2 (see FIG. 13) based on the unstained fluorescence component image D22 (see FIG. 13) derived by the color separation unit 1321 as described above.
- a positivity threshold can be determined.
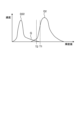
- FIG. 13 is a diagram showing an example of histograms of the stained fluorescence component image D2 and the unstained fluorescence component image D22.
- the X-axis indicates the brightness value and the Y-axis indicates the frequency.
- the positive threshold is determined based on the unstained fluorescence component image D22 obtained from the unstained specimen fluorescence spectrum D21 used as the negative control group. Therefore, in the stained fluorescence component image D2, the image section affected by the fluorescence caused by the fluorescent reagent 10A can be accurately distinguished from the image section not affected by the fluorescence, and can be specified as the positive cell image. can.
- the guide image generation unit 133 may determine, as a positive threshold, a luminance value (see symbol “T1” in FIG. 13) corresponding to an edge (in particular, a high luminance value side edge) of the histogram of the unstained fluorescence component image D22. good. It should be noted that the method of obtaining the edge of the histogram of the unstained fluorescence component image D22 is not limited.
- the guide image generation unit 133 may determine the maximum luminance value in the unstained fluorescence component image D22 as the edge of the histogram of the unstained fluorescence component image D22.
- the guide image generation unit 133 obtains the slope of the gradient of the histogram of the unstained fluorescence component image D22 (see symbol “G” in FIG. 13), and based on the slope, determines the edges of the histogram of the unstained specimen fluorescence spectrum D21. You can decide.
- the method of determining the “gradient point for determining the slope” in the histogram of the unstained fluorescence component image D22 is not limited.
- the guide image generation unit 133 may determine the gradient location based on the frequency of luminance values of the unstained fluorescence component image D22. Specifically, it is possible to determine the gradient location in the same manner as the method of determining the "positive threshold value T2" described later.
- FIG. 14 is a flowchart showing the flow of a fourth processing example of NR correction using a guide image according to this embodiment.
- 15 and 16 are diagrams each showing an example of image processing according to this embodiment.
- the guide image generation unit 133 performs the merging/dividing image in step S43 after steps S41 and S42.
- a guide image is generated by performing image processing on it.
- This image processing is basically the same processing as the second processing example, but may be different processing.
- the guide image generation unit 133 performs image processing using a noise removal filter in step S431, and then performs an edge enhancement filter in step S432. may be used to perform image processing.
- the guide image generation unit 133 executes image processing using an edge enhancement filter in step S432, in reverse to the flow of image processing in FIG. Image processing using a removal filter may be performed.
- the degree of the NR effect varies depending on the type of image to be processed. As for the flow of processing, the flow of image processing in FIG. 15 can obtain a better NR effect.
- FIG. 17 is a flowchart showing the flow of a fifth processing example of NR correction using a guide image according to this embodiment.
- the guide image generation unit 133 does not execute step S41 in FIG.
- a guide image is generated by merging images, for example, only images corresponding to specific cell types such as only membrane staining markers (color separation images: Fluo 3, 4, 5) and dividing by the number of merged images. Although only three color separation images are merged in the example of FIG. 17, the number is not limited.
- the S/N of the guide image is made higher by merging/dividing only the images corresponding to the specific cell type, such as only the membrane staining marker, when creating the guide image. Therefore, the NR effect can be enhanced by increasing the S/N ratio of the guide image.
- FIG. 18 is a flowchart showing the flow of the sixth processing example of NR correction using the guide image according to this embodiment.
- the guide image generation unit 133 performs after step S42 and after merging/division in step S43.
- a guide image is generated by performing image processing on the image of .
- This image processing is basically the same processing as the second processing example, but may be different processing.
- FIG. 19 is a flowchart showing the flow of the seventh processing example of NR correction using the guide image according to this embodiment.
- the guide image generation unit 133 performs the A plurality of specific images, for example, only images corresponding to specific cell types such as membrane staining markers only (color separation images: Fluo 3, 4, 5), pixels below a predetermined positive threshold are zeroed (filled with zero) Further, in step S42, each image after zeroing is merged and divided by the number of merged images to generate a guide image.
- FIG. 20 is a flowchart showing the flow of the eighth processing example of NR correction using the guide image according to this embodiment.
- the guide image generation unit 133 in addition to the processing of the seventh processing example (see FIG. 19), the guide image generation unit 133 generates a guide image in step S43 after steps S41 and S42.
- the image generation unit 133 generates a guide image by performing image processing on the merged/divided image.
- This image processing is basically the same processing as the second processing example, but may be different processing.
- pixels below a predetermined positive threshold value are zeroed only in images corresponding to specific cell types, and only the zeroed images are merged and divided, and then merged and divided.
- image processing such as noise removal processing and edge enhancement processing
- the S/N of the guide image is made higher. Therefore, the NR effect can be enhanced by increasing the S/N ratio of the guide image.
- FIG. 21 is a flowchart showing the flow of the ninth processing example of NR correction using the guide image according to this embodiment.
- the guide image generation unit 133 in addition to the processing of the modification of the first processing example described above, the guide image generation unit 133 generates a cell analysis result (for example, positive cell ratio, number of positive cells, etc.) are used as weights for merging.
- a cell analysis result for example, positive cell ratio, number of positive cells, etc.
- cell analysis results for example, the positive cell rate, the number of positive cells, etc.
- weights and merged are used as weights and merged when creating a guide image.
- FIG. 22 is a flowchart showing the flow of the tenth processing example of NR correction using the guide image according to this embodiment.
- the guide image generation unit 133 in step S51, generates a positive cell rate ( Positive rate) is a positive cell rate similar to that of the same cell type marker, and until the positive cell rate reaches a positive cell rate similar to that of the same cell type marker, in step S12, create a guide image Sometimes the positive cell rate is used as a weight for merging.
- the information processing apparatus 100 sums up a plurality of images (for example, color separation images) each including spectral information related to biomarkers, and divides by the number of the summed images.
- a guide image generation unit 133 that generates a guide image for correction is provided. This makes it possible to perform NR correction on the image to be processed using the guide image, so that necessary signals buried in the background of the image to be processed are acquired while maintaining the signal intensity necessary for analysis. be able to.
- the information processing apparatus 100 may further include a correction unit 134 that performs noise reduction correction on the processing target image using the guide image. As a result, it is possible to reliably acquire the necessary signal buried in the background of the image to be processed while maintaining the signal intensity necessary for analysis.
- the correction unit 134 may perform outlier processing on the processing target image before noise reduction correction. This makes it possible to increase the S/N ratio of the guide image, thereby enhancing the NR effect.
- the guide image generation unit 133 may perform image processing after summing and dividing a plurality of images. This makes it possible to increase the S/N ratio of the guide image, thereby enhancing the NR effect.
- the guide image generation unit 133 may perform image processing after summing a plurality of images and before division. This makes it possible to increase the S/N ratio of the guide image, thereby enhancing the NR effect.
- the guide image generation unit 133 may perform a process of zeroing pixels below a predetermined positive threshold for a plurality of images before summing the plurality of images. This makes it possible to increase the S/N ratio of the guide image, thereby enhancing the NR effect.
- the guide image generation unit 133 may perform processing for zeroing pixels below a predetermined positive threshold for a plurality of images, and perform image processing after summing and dividing the plurality of images. This makes it possible to increase the S/N ratio of the guide image, thereby enhancing the NR effect.
- the guide image generation unit 133 may perform a process of zeroing pixels below a predetermined positive threshold for a plurality of images, and may perform image processing after summing the plurality of images and before division. This makes it possible to increase the S/N ratio of the guide image, thereby enhancing the NR effect.
- the guide image generation unit 133 may sum only the images corresponding to the specific cell tumor among the plurality of images. This makes it possible to increase the S/N ratio of the guide image, thereby enhancing the NR effect.
- the guide image generation unit 133 may perform image processing after summing and dividing only the image corresponding to the specific cell tumor among the plurality of images. This makes it possible to increase the S/N ratio of the guide image, thereby enhancing the NR effect.
- the guide image generation unit 133 may perform image processing after adding only the image corresponding to the specific cell tumor among the plurality of images and before dividing. This makes it possible to increase the S/N ratio of the guide image, thereby enhancing the NR effect.
- the guide image generation unit 133 performs zero-filling processing for zeroing pixels below a predetermined positive threshold for the image corresponding to the specific cell tumor among the plurality of images, and Only corresponding images may be summed. This makes it possible to increase the S/N ratio of the guide image, thereby enhancing the NR effect.
- the guide image generation unit 133 may perform image processing after summing and dividing only the images corresponding to the specific cell tumor after the zero-filling process. This makes it possible to increase the S/N ratio of the guide image, thereby enhancing the NR effect.
- the guide image generation unit 133 may perform image processing after summing only the images corresponding to the specific cell tumor after the zero-filling process and before dividing. This makes it possible to increase the S/N ratio of the guide image, thereby enhancing the NR effect.
- the guide image generation unit 133 may add up a plurality of images using the analysis result for the image to be processed as a weight.
- analysis results for example, cell analysis results
- guide image generation can be reflected in guide image generation.
- the guide image generation unit 133 may repeat summing a plurality of images using the analysis result as a weight until the analysis result is approximately the same as the comparison target analysis result. This eliminates the need for human judgment and realizes automation.
- each of the plurality of images may be a color separation image. Even if each image is a color-separated image, it is possible to acquire the necessary signal hidden in the background of the image to be processed while maintaining the signal strength necessary for analysis.
- the guide image generation unit 133 may perform image processing using a noise removal filter and an edge enhancement filter. This makes it possible to increase the S/N ratio of the guide image, thereby enhancing the NR effect.
- each component of each device illustrated is functionally conceptual and does not necessarily need to be physically configured as illustrated.
- the specific form of distribution and integration of each device is not limited to the one shown in the figure, and all or part of them can be functionally or physically distributed and integrated in arbitrary units according to various loads and usage conditions. Can be integrated and configured.
- FIG. 23 is a diagram showing an example of a schematic configuration of a fluoroscopy apparatus 500 according to this embodiment.
- FIG. 24 is a diagram showing an example of a schematic configuration of the observation unit 1 according to this embodiment.
- the fluorescence observation device 500 has an observation unit 1, a processing unit 2, and a display section 3.
- the observation unit 1 includes an excitation section (irradiation section) 10, a stage 20, a spectral imaging section 30, an observation optical system 40, a scanning mechanism 50, a focus mechanism 60, and a non-fluorescent observation section 70.
- the excitation unit 10 irradiates the observation object with a plurality of irradiation lights with different wavelengths.
- the excitation unit 10 irradiates a pathological specimen (pathological sample), which is an object to be observed, with a plurality of line illuminations with different wavelengths arranged in parallel with different axes.
- the stage 20 is a table for supporting a pathological specimen, and is configured to be movable by the scanning mechanism 50 in a direction perpendicular to the direction of line light from the line illumination.
- the spectroscopic imaging unit 30 includes a spectroscope, and obtains a fluorescence spectrum (spectral data) of a pathological specimen linearly excited by line illumination.
- the observation unit 1 functions as a line spectroscope that acquires spectral data according to line illumination.
- the observation unit 1 captures, for each line, a plurality of fluorescence images generated by an imaging target (pathological specimen) for each of a plurality of fluorescence wavelengths, and acquires data of the captured plurality of fluorescence images in the order of the lines. It also functions as an imaging device.
- different axes parallel means that the multiple line illuminations are different axes and parallel.
- a different axis means not being on the same axis, and the distance between the axes is not particularly limited.
- Parallel is not limited to being parallel in a strict sense, but also includes a state of being substantially parallel. For example, there may be distortion derived from an optical system such as a lens, or deviation from a parallel state due to manufacturing tolerances, and such cases are also regarded as parallel.
- the excitation unit 10 and the spectral imaging unit 30 are connected to the stage 20 via an observation optical system 40.
- the observation optical system 40 has a function of following the optimum focus by the focus mechanism 60 .
- the observation optical system 40 may be connected to a non-fluorescent observation section 70 for performing dark-field observation, bright-field observation, and the like.
- the observation unit 1 may be connected with a control section 80 that controls the excitation section 10, the spectral imaging section 30, the scanning mechanism 50, the focusing mechanism 60, the non-fluorescent observation section 70, and the like.
- the processing unit 2 includes a storage section 21 , a data proofreading section 22 and an image forming section 23 .
- the processing unit 2 Based on the fluorescence spectrum of the pathological specimen (hereinafter also referred to as sample S) acquired by the observation unit 1, the processing unit 2 typically forms an image of the pathological specimen or calculates the distribution of the fluorescence spectrum. Output.
- the image here refers to the composition ratio of pigments that compose the spectrum, the autofluorescence derived from the sample, the waveform converted to RGB (red, green and blue) colors, the luminance distribution of a specific wavelength band, and the like.
- the storage unit 21 includes a non-volatile storage medium such as a hard disk drive or flash memory, and a storage control unit that controls writing and reading of data to and from the storage medium.
- the storage unit 21 stores spectral data indicating the correlation between each wavelength of light emitted by each of the plurality of line illuminations included in the excitation unit 10 and fluorescence received by the camera of the spectral imaging unit 30 .
- the storage unit 21 pre-stores information indicating the standard spectrum of the autofluorescence of the sample (pathological specimen) to be observed and information indicating the standard spectrum of the single dye that stains the sample.
- the data calibration unit 22 configures the spectral data stored in the storage unit 21 based on the captured image captured by the camera of the spectral imaging unit 30 .
- the image forming unit 23 forms a fluorescence image of the sample based on the spectral data and the intervals ⁇ y between the plurality of line illuminations irradiated by the excitation unit 10 .
- the processing unit 2 including the data proofreading unit 22, the image forming unit 23, etc. is a CPU (Central Processing Unit), a RAM (Random Access Memory), a ROM (Read Only Memory), and other hardware elements and necessary components used in a computer. It is realized by a program (software). Instead of or in addition to CPU, PLD (Programmable Logic Device) such as FPGA (Field Programmable Gate Array), DSP (Digital Signal Processor), other ASIC (Application Specific Integrated Circuit), etc. may be used. good.
- the display unit 3 displays various information such as an image based on the fluorescence image formed by the image forming unit 23, for example.
- the display section 3 may be, for example, a monitor integrally attached to the processing unit 2 or a display device connected to the processing unit 2 .
- the display unit 3 includes, for example, a display element such as a liquid crystal device or an organic EL device, and a touch sensor, and is configured as a UI (User Interface) for displaying input settings of imaging conditions, captured images, and the like.
- UI User Interface
- the excitation unit 10 includes two line illuminations Ex1 and Ex2 each emitting light of two wavelengths.
- the line illumination Ex1 emits light with a wavelength of 405 nm and light with a wavelength of 561 nm
- the line illumination Ex2 emits light with a wavelength of 488 nm and light with a wavelength of 645 nm.
- the excitation unit 10 has a plurality of (four in this example) excitation light sources L1, L2, L3, and L4.
- Each of the excitation light sources L1 to L4 is composed of a laser light source that outputs laser light with wavelengths of 405 nm, 488 nm, 561 nm and 645 nm, respectively.
- each of the excitation light sources L1 to L4 is composed of a light emitting diode (LED), a laser diode (LD), or the like.
- the excitation unit 10 includes a plurality of collimator lenses 11, a plurality of laser line filters 12, a plurality of dichroic mirrors 13a, 13b, 13c, a homogenizer 14, and a condenser lens 15 so as to correspond to the respective excitation light sources L1 to L4. , and an entrance slit 16 .
- the laser light emitted from the excitation light source L1 and the laser light emitted from the excitation light source L3 are collimated by a collimator lens 11, respectively, and then transmitted through a laser line filter 12 for cutting the skirt of each wavelength band. and are made coaxial by the dichroic mirror 13a.
- the two coaxial laser beams are further beam-shaped by a homogenizer 14 such as a fly-eye lens and a condenser lens 15 to form line illumination Ex1.
- the laser light emitted from the excitation light source L2 and the laser light emitted from the excitation light source L4 are coaxially coaxial with each other by the dichroic mirrors 13b and 13c, and line illumination is performed so that the line illumination Ex2 has a different axis from the line illumination Ex1. become.
- the line illuminations Ex1 and Ex2 form off-axis line illuminations (primary images) separated by a distance ⁇ y at the entrance slit 16 (slit conjugate) having a plurality of slit portions each passable.
- the primary image is irradiated onto the sample S on the stage 20 via the observation optical system 40 .
- the observation optical system 40 has a condenser lens 41 , dichroic mirrors 42 and 43 , an objective lens 44 , a bandpass filter 45 , and a condenser lens (an example of an imaging lens) 46 .
- the line illuminations Ex1 and Ex2 are collimated by a condenser lens 41 paired with an objective lens 44, reflected by dichroic mirrors 42 and 43, transmitted through the objective lens 44, and irradiated onto the sample S on the stage 20. .
- FIG. 25 is a diagram showing an example of the sample S according to this embodiment.
- FIG. 25 shows a state in which the sample S is viewed from the irradiation directions of the line illuminations Ex1 and Ex2, which are the excitation light.
- the sample S is typically composed of a slide containing an observation object Sa such as a tissue section as shown in FIG.
- the observation target Sa is, for example, a biological sample such as nucleic acid, cell, protein, bacterium, or virus.
- a sample S (observation target Sa) is dyed with a plurality of fluorescent dyes.
- the observation unit 1 enlarges the sample S to a desired magnification and observes it.
- FIG. 26 is an enlarged view of the area A in which the sample S according to the present embodiment is irradiated with the line illuminations Ex1 and Ex2.
- two line illuminations Ex1 and Ex2 are arranged in area A, and imaging areas R1 and R2 of spectral imaging unit 30 are arranged so as to overlap with the respective line illuminations Ex1 and Ex2.
- the two line illuminations Ex1 and Ex2 are each parallel to the Z-axis direction and arranged apart from each other by a predetermined distance ⁇ y in the Y-axis direction.
- line illuminations Ex1 and Ex2 are formed as shown in FIG. Fluorescence excited in the sample S by these line illuminations Ex1 and Ex2 is collected by the objective lens 44 and reflected by the dichroic mirror 43, as shown in FIG. It passes through the pass filter 45 , is condensed again by the condenser lens 46 , and enters the spectral imaging section 30 .
- the spectral imaging unit 30 includes an observation slit (aperture) 31, an imaging element 32, a first prism 33, a mirror 34, a diffraction grating 35 (wavelength dispersion element), and a second prism. 36.
- the imaging element 32 is configured including two imaging elements 32a and 32b.
- the imaging device 32 captures (receives) a plurality of lights (fluorescence, etc.) wavelength-dispersed by the diffraction grating 35 .
- a two-dimensional imager such as a CCD (Charge Coupled Device) or a CMOS (Complementary Metal Oxide Semiconductor) is adopted as the imaging device 32 .
- the observation slit 31 is arranged at the condensing point of the condenser lens 46 and has the same number of slit parts as the number of excitation lines (two in this example).
- the fluorescence spectra derived from the two excitation lines that have passed through the observation slit 31 are separated by the first prism 33 and reflected by the grating surfaces of the diffraction grating 35 via the mirrors 34, respectively, so that the fluorescence spectra of the excitation wavelengths are further divided into separated.
- the four separated fluorescence spectra are incident on the imaging devices 32a and 32b via the mirror 34 and the second prism 36, and the spectral data represented by the position x in the line direction and the wavelength ⁇ (x, ⁇ ).
- the spectral data (x, ⁇ ) is a pixel value of a pixel at position x in the row direction and at wavelength ⁇ in the column direction among the pixels included in the image sensor 32 . Note that the spectroscopic data (x, ⁇ ) may be simply described as spectroscopic data.
- the pixel size (nm/Pixel) of the imaging elements 32a and 32b is not particularly limited, and is set to 2 (nm/Pixel) or more and 20 (nm/Pixel) or less, for example.
- This dispersion value may be realized by the pitch of the diffraction grating 35, optically, or by hardware binning of the imaging elements 32a and 32b.
- a dichroic mirror 42 and a bandpass filter 45 are inserted in the optical path to prevent the excitation light (line illuminations Ex1 and Ex2) from reaching the imaging device 32 .
- Each of the line illuminations Ex1 and Ex2 is not limited to being configured with a single wavelength, and may each be configured with a plurality of wavelengths. If the line illuminations Ex1 and Ex2 each consist of multiple wavelengths, the fluorescence excited by them also contains multiple spectra.
- the spectroscopic imaging unit 30 has a wavelength dispersive element for separating the fluorescence into spectra derived from the excitation wavelengths.
- the wavelength dispersive element is composed of a diffraction grating, a prism, or the like, and is typically arranged on the optical path between the observation slit 31 and the imaging element 32 .
- stage 20 and the scanning mechanism 50 constitute an XY stage, and in order to acquire a fluorescence image of the sample S, the sample S is moved in the X-axis direction and the Y-axis direction.
- WSI whole slide imaging
- the operation of scanning the sample S in the Y-axis direction, moving in the X-axis direction, and then scanning in the Y-axis direction is repeated.
- dye spectra (fluorescence spectra) excited at different excitation wavelengths which are spatially separated by a distance ⁇ y on the sample S (observation object Sa), are continuously scanned in the Y-axis direction. can be obtained.
- the scanning mechanism 50 changes the position of the sample S irradiated with the irradiation light over time. For example, the scanning mechanism 50 scans the stage 20 in the Y-axis direction.
- the scanning mechanism 50 can scan the stage 20 with the plurality of line illuminations Ex1 and Ex2 in the Y-axis direction, that is, in the arrangement direction of the line illuminations Ex1 and Ex2. This is not limited to this example, and a plurality of line illuminations Ex1 and Ex2 may be scanned in the Y-axis direction by a galvanomirror arranged in the middle of the optical system.
- Data derived from each of the line illuminations Ex1 and Ex2 is data whose coordinates are shifted by a distance ⁇ y about the Y axis. Based on the value of the distance ⁇ y calculated from the output, it is corrected and output.
- the non-fluorescent observation section 70 is composed of a light source 71, a dichroic mirror 43, an objective lens 44, a condenser lens 72, an imaging device 73, and the like.
- the example of FIG. 24 shows an observation system using dark field illumination.
- the light source 71 is arranged on the side of the stage 20 facing the objective lens 44, and irradiates the sample S on the stage 20 with illumination light from the side opposite to the line illuminations Ex1 and Ex2.
- the light source 71 illuminates from outside the NA (numerical aperture) of the objective lens 44 , and the light (dark field image) diffracted by the sample S passes through the objective lens 44 , the dichroic mirror 43 and the condenser lens 72 . Then, the image sensor 73 takes a picture.
- dark field illumination even seemingly transparent samples such as fluorescently stained samples can be observed with contrast.
- the non-fluorescent observation unit 70 is not limited to an observation system that acquires a dark field image, but is an observation system capable of acquiring non-fluorescent images such as bright field images, phase contrast images, phase images, and in-line hologram images. may consist of For example, various observation methods such as the Schlieren method, the phase contrast method, the polarizing observation method, and the epi-illumination method can be employed as methods for obtaining non-fluorescent images.
- the position of the illumination light source is also not limited to below the stage 20 , and may be above the stage 20 or around the objective lens 44 . In addition to the method of performing focus control in real time, other methods such as a pre-focus map method in which focus coordinates (Z coordinates) are recorded in advance may be employed.
- the line illumination as excitation light is composed of two line illuminations Ex1 and Ex2, but is not limited to this, and may be three, four, or five or more.
- Each line illumination may also include multiple excitation wavelengths selected to minimize degradation of color separation performance.
- the excitation light source is composed of a plurality of excitation wavelengths, and if each excitation wavelength and the data obtained by the imaging device 32 are linked and recorded, a different axis can be obtained. It does not give as much resolution as parallelism, but it does give a multicolor spectrum.
- the configuration described above with reference to FIGS. 23 and 24 is merely an example, and the configuration of the fluorescence observation apparatus 500 according to this embodiment is not limited to the example.
- the fluoroscopy apparatus 500 may not necessarily include all of the configurations shown in FIGS. 23 and 24, or may include configurations not shown in FIGS.
- the technology according to the present disclosure can be applied to, for example, a microscope system.
- a configuration example of a microscope system 5000 that can be applied will be described below with reference to FIGS. 27 to 29.
- FIG. A microscope device 5100 that is part of the microscope system 5000 functions as an imaging device.
- a configuration example of the microscope system of the present disclosure is shown in FIG.
- a microscope system 5000 shown in FIG. 27 includes a microscope device 5100 , a control section 5110 and an information processing section 5120 .
- a microscope device 5100 includes a light irradiation section 5101 , an optical section 5102 , and a signal acquisition section 5103 .
- the microscope device 5100 may further include a sample placement section 5104 on which the biological sample S is placed. Note that the configuration of the microscope device 5100 is not limited to that shown in FIG. It may be used as the irradiation unit 5101 .
- the light irradiation section 5101 may be arranged such that the sample mounting section 5104 is sandwiched between the light irradiation section 5101 and the optical section 5102, and may be arranged on the side where the optical section 5102 exists, for example.
- the microscope apparatus 5100 may be configured to be able to perform one or more of bright field observation, phase contrast observation, differential interference contrast observation, polarization observation, fluorescence observation, and dark field observation.
- the microscope system 5000 may be configured as a so-called WSI (Whole Slide Imaging) system or a digital pathology imaging system, and can be used for pathological diagnosis.
- Microscope system 5000 may also be configured as a fluorescence imaging system, in particular a multiplex fluorescence imaging system.
- the microscope system 5000 may be used to perform intraoperative pathological diagnosis or remote pathological diagnosis.
- the microscope device 5100 acquires data of the biological sample S obtained from the subject of the surgery, and transfers the data to the information processing unit 5120. can send.
- the microscope device 5100 can transmit the acquired data of the biological sample S to the information processing unit 5120 located in a place (another room, building, or the like) away from the microscope device 5100 .
- the information processing section 5120 receives and outputs the data.
- a user of the information processing unit 5120 can make a pathological diagnosis based on the output data.
- the biological sample S may be a sample containing a biological component.
- the biological components may be tissues, cells, liquid components of a living body (blood, urine, etc.), cultures, or living cells (cardiomyocytes, nerve cells, fertilized eggs, etc.).
- the biological sample may be a solid, a specimen fixed with a fixative such as paraffin, or a solid formed by freezing.
- the biological sample can be a section of the solid.
- a specific example of the biological sample is a section of a biopsy sample.
- the biological sample may be one that has undergone processing such as staining or labeling.
- the treatment may be staining for indicating the morphology of biological components or for indicating substances (surface antigens, etc.) possessed by biological components, examples of which include HE (Hematoxylin-Eosin) staining and immunohistochemistry staining. be able to.
- the biological sample may be treated with one or more reagents, and the reagents may be fluorescent dyes, chromogenic reagents, fluorescent proteins, or fluorescently labeled antibodies.
- the specimen may be one prepared from a tissue sample for the purpose of pathological diagnosis or clinical examination. Moreover, the specimen is not limited to the human body, and may be derived from animals, plants, or other materials.
- the specimen may be the type of tissue used (such as an organ or cell), the type of target disease, the subject's attributes (such as age, sex, blood type, or race), or the subject's lifestyle. The properties differ depending on habits (for example, eating habits, exercise habits, smoking habits, etc.).
- the specimens may be managed with identification information (bar code, QR code (registered trademark), etc.) that allows each specimen to be identified.
- the light irradiation unit 5101 is a light source for illuminating the biological sample S and an optical unit for guiding the light irradiated from the light source to the specimen.
- the light source may irradiate the biological sample with visible light, ultraviolet light, or infrared light, or a combination thereof.
- the light source may be one or more of a halogen light source, a laser light source, an LED light source, a mercury light source, and a xenon light source.
- a plurality of types and/or wavelengths of light sources may be used in fluorescence observation, and may be appropriately selected by those skilled in the art.
- the light irradiation unit 5101 can have a transmissive, reflective, or episcopic (coaxial episcopic or lateral) configuration.
- the optical section 5102 is configured to guide the light from the biological sample S to the signal acquisition section 5103 .
- the optical unit 5102 can be configured to allow the microscope device 5100 to observe or image the biological sample S.
- Optical section 5102 may include an objective lens.
- the type of objective lens may be appropriately selected by those skilled in the art according to the observation method.
- the optical section 5102 may include a relay lens for relaying the image magnified by the objective lens to the signal acquisition section 5103 .
- the optical unit 5102 may further include optical components other than the objective lens and the relay lens, an eyepiece lens, a phase plate, a condenser lens, and the like.
- the optical section 5102 may further include a wavelength separation section configured to separate light having a predetermined wavelength from the light from the biological sample S.
- the wavelength separation section can be configured to selectively allow light of a predetermined wavelength or wavelength range to reach the signal acquisition section 5103 .
- the wavelength separator may include, for example, one or more of a filter that selectively transmits light, a polarizing plate, a prism (Wollaston prism), and a diffraction grating.
- the optical components included in the wavelength separation section may be arranged on the optical path from the objective lens to the signal acquisition section 5103, for example.
- the wavelength separation unit is provided in the microscope device 5100 when fluorescence observation is performed, particularly when an excitation light irradiation unit is included.
- the wavelength separator may be configured to separate fluorescent light from each other or white light and fluorescent light.
- the signal acquisition unit 5103 can be configured to receive light from the biological sample S and convert the light into an electrical signal, particularly a digital electrical signal.
- the signal acquisition unit 5103 may be configured to acquire data regarding the biological sample S based on the electrical signal.
- the signal acquisition unit 5103 may be configured to acquire data of an image (image, particularly a still image, a time-lapse image, or a moving image) of the biological sample S.
- the image magnified by the optical unit 5102 It may be configured to acquire image data.
- the signal acquisition unit 5103 includes one or more image sensors, such as CMOS or CCD, having a plurality of pixels arranged one-dimensionally or two-dimensionally.
- the signal acquisition unit 5103 may include an imaging device for obtaining a low-resolution image and an imaging device for obtaining a high-resolution image, or may include an imaging device for sensing such as AF and an imaging device for image output for observation. element.
- the image pickup device includes a signal processing unit (including one or more of CPU, DSP, and memory) that performs signal processing using pixel signals from each pixel, and pixel signals and an output control unit for controlling the output of the image data generated from and the processed data generated by the signal processing unit.
- An imaging device including the plurality of pixels, the signal processing section, and the output control section may preferably be configured as a one-chip semiconductor device.
- the microscope system 5000 may further include an event detection sensor.
- the event detection sensor includes a pixel that photoelectrically converts incident light, and can be configured to detect, as an event, a change in luminance of the pixel exceeding a predetermined threshold. The event detection sensor can in particular be asynchronous.
- the control unit 5110 controls imaging by the microscope device 5100 .
- the control unit 5110 can drive the movement of the optical unit 5102 and/or the sample placement unit 5104 to adjust the positional relationship between the optical unit 5102 and the sample placement unit 5104 for imaging control.
- the control unit 5110 can move the optical unit 5102 and/or the sample mounting unit 5104 in a direction toward or away from each other (for example, the optical axis direction of the objective lens).
- the control section 5110 may move the optical section 5102 and/or the sample placement section 5104 in any direction on a plane perpendicular to the optical axis direction.
- the control unit 5110 may control the light irradiation unit 5101 and/or the signal acquisition unit 5103 for imaging control.
- the sample mounting section 5104 may be configured such that the position of the biological sample on the sample mounting section 5104 can be fixed, and may be a so-called stage.
- the sample mounting section 5104 can be configured to move the position of the biological sample in the optical axis direction of the objective lens and/or in a direction perpendicular to the optical axis direction.
- the information processing section 5120 can acquire data (such as imaging data) acquired by the microscope device 5100 from the microscope device 5100 .
- the information processing section 5120 can perform image processing on captured data.
- the image processing may include an unmixing process, in particular a spectral unmixing process.
- the unmixing process is a process of extracting data of light components of a predetermined wavelength or wavelength range from the imaging data to generate image data, or removing data of light components of a predetermined wavelength or wavelength range from the imaging data. It can include processing and the like.
- the image processing may include autofluorescence separation processing for separating the autofluorescence component and dye component of the tissue section, and fluorescence separation processing for separating the wavelengths between dyes having different fluorescence wavelengths.
- autofluorescence signals extracted from one may be used to remove autofluorescence components from image information of the other specimen.
- the information processing section 5120 may transmit data for imaging control to the control section 5110, and the control section 5110 receiving the data may control imaging by the microscope apparatus 5100 according to the data.
- the information processing unit 5120 may be configured as an information processing device such as a general-purpose computer, and may include a CPU, RAM, and ROM.
- the information processing section 5120 may be included in the housing of the microscope device 5100 or may be outside the housing.
- Various processing or functions by the information processing section 5120 may be realized by a server computer or cloud connected via a network.
- a method of imaging the biological sample S by the microscope device 5100 may be appropriately selected by a person skilled in the art according to the type of the biological sample and the purpose of imaging. An example of the imaging method will be described below.
- the microscope device 5100 can first identify an imaging target region.
- the imaging target region may be specified so as to cover the entire region where the biological sample exists, or a target portion (target tissue section, target cell, or target lesion portion) of the biological sample. ) may be specified to cover
- the microscope device 5100 divides the imaging target region into a plurality of divided regions of a predetermined size, and the microscope device 5100 sequentially images each divided region. As a result, an image of each divided area is obtained.
- the microscope device 5100 identifies an imaging target region R that covers the entire biological sample S. Then, the microscope device 5100 divides the imaging target region R into 16 divided regions. Then, the microscope device 5100 can image the divided region R1, and then any region included in the imaging target region R, such as a region adjacent to the divided region R1. Then, image capturing of the divided areas is performed until there are no unimaged divided areas. Areas other than the imaging target area R may also be imaged based on the captured image information of the divided areas. After imaging a certain divided area, the positional relationship between the microscope device 5100 and the sample mounting section 5104 is adjusted in order to image the next divided area.
- the adjustment may be performed by moving the microscope device 5100, moving the sample placement section 5104, or moving both of them.
- the image capturing device that captures each divided area may be a two-dimensional image sensor (area sensor) or a one-dimensional image sensor (line sensor).
- the signal acquisition unit 5103 may image each divided area via the optical unit 5102 .
- the imaging of each divided region may be performed continuously while moving the microscope device 5100 and/or the sample mounting unit 5104, or when imaging each divided region, the microscope device 5100 and/or the sample mounting unit Movement of 5104 may be stopped.
- the imaging target area may be divided so that the divided areas partially overlap each other, or the imaging target area may be divided so that the divided areas do not overlap.
- Each divided area may be imaged multiple times by changing imaging conditions such as focal length and/or exposure time.
- the information processing apparatus can stitch a plurality of adjacent divided areas to generate image data of a wider area. By performing the stitching process over the entire imaging target area, it is possible to obtain an image of a wider area of the imaging target area. Also, image data with lower resolution can be generated from the image of the divided area or the image subjected to the stitching process.
- the microscope device 5100 can first identify an imaging target region.
- the imaging target region may be specified so as to cover the entire region where the biological sample exists, or the target portion (target tissue section or target cell-containing portion) of the biological sample. may be specified.
- the microscope device 5100 scans a partial region (also referred to as a “divided scan region”) of the imaging target region in one direction (also referred to as a “scanning direction”) within a plane perpendicular to the optical axis. Take an image. After the scanning of the divided scan area is completed, the next divided scan area next to the scan area is scanned. These scanning operations are repeated until the entire imaging target area is imaged. As shown in FIG.
- the microscope device 5100 identifies a region (gray portion) in which a tissue section exists in the biological sample S as an imaging target region Sa. Then, the microscope device 5100 scans the divided scan area Rs in the imaging target area Sa in the Y-axis direction. After completing scanning of the divided scan region Rs, the microscope device 5100 next scans an adjacent divided scan region in the X-axis direction. This operation is repeated until scanning is completed for the entire imaging target area Sa.
- the positional relationship between the microscope device 5100 and the sample placement section 5104 is adjusted for scanning each divided scan area and for imaging the next divided scan area after imaging a certain divided scan area. The adjustment may be performed by moving the microscope device 5100, moving the sample placement section 5104, or moving both of them.
- the imaging device that captures each divided scan area may be a one-dimensional imaging device (line sensor) or a two-dimensional imaging device (area sensor).
- the signal acquisition unit 5103 may capture an image of each divided area via an enlarging optical system.
- the imaging of each divided scan region may be performed continuously while moving the microscope device 5100 and/or the sample placement unit 5104 .
- the imaging target area may be divided such that the divided scan areas partially overlap each other, or the imaging target area may be divided so that the divided scan areas do not overlap.
- Each divided scan area may be imaged multiple times by changing imaging conditions such as focal length and/or exposure time.
- the information processing apparatus can stitch a plurality of adjacent divided scan areas to generate image data of a wider area. By performing the stitching process over the entire imaging target area, it is possible to obtain an image of a wider area of the imaging target area. Also, image data with lower resolution can be generated from the image of the divided scan area or the image subjected to the stitching process.
- FIG. 30 is a block diagram showing an example of a schematic hardware configuration of the information processing apparatus 100. As shown in FIG. Various types of processing by the information processing apparatus 100 are realized by, for example, cooperation between software and hardware described below.
- the information processing apparatus 100 includes a CPU (Central Processing Unit) 901, a ROM (Read Only Memory) 902, a RAM (Random Access Memory) 903, and a host bus 904a.
- the information processing apparatus 100 also includes a bridge 904 , an external bus 904 b , an interface 905 , an input device 906 , an output device 907 , a storage device 908 , a drive 909 , a connection port 911 , a communication device 913 and a sensor 915 .
- the information processing apparatus 100 may have a processing circuit such as a DSP or ASIC in place of or together with the CPU 901 .
- the CPU 901 functions as an arithmetic processing device and a control device, and controls general operations within the information processing device 100 according to various programs.
- the CPU 901 may be a microprocessor.
- the ROM 902 stores programs, calculation parameters, and the like used by the CPU 901 .
- the RAM 903 temporarily stores programs used in the execution of the CPU 901, parameters that change as appropriate during the execution, and the like.
- the CPU 901 can embody at least the processing unit 130 and the control unit 150 of the information processing apparatus 100, for example.
- the CPU 901, ROM 902 and RAM 903 are interconnected by a host bus 904a including a CPU bus.
- the host bus 904a is connected via a bridge 904 to an external bus 904b such as a PCI (Peripheral Component Interconnect/Interface) bus.
- PCI Peripheral Component Interconnect/Interface
- the host bus 904a, the bridge 904 and the external bus 904b do not necessarily have to be configured separately, and these functions may be implemented in one bus.
- the input device 906 is implemented by a device such as a mouse, keyboard, touch panel, button, microphone, switch, lever, etc., through which information is input by the practitioner.
- the input device 906 may be, for example, a remote control device using infrared rays or other radio waves, or may be an externally connected device such as a mobile phone or PDA corresponding to the operation of the information processing device 100.
- the input device 906 may include, for example, an input control circuit that generates an input signal based on information input by the practitioner using the above input means and outputs the signal to the CPU 901 .
- the input device 906 can embody at least the operation unit 160 of the information processing device 100, for example.
- the output device 907 is formed by a device capable of visually or audibly notifying the practitioner of the acquired information.
- Such devices include display devices such as CRT display devices, liquid crystal display devices, plasma display devices, EL display devices and lamps, audio output devices such as speakers and headphones, and printer devices.
- the output device 907 can embody at least the display unit 140 of the information processing device 100, for example.
- the storage device 908 is a device for storing data.
- the storage device 908 is implemented by, for example, a magnetic storage device such as an HDD, a semiconductor storage device, an optical storage device, a magneto-optical storage device, or the like.
- the storage device 908 may include a storage medium, a recording device that records data on the storage medium, a reading device that reads data from the storage medium, a deletion device that deletes data recorded on the storage medium, and the like.
- the storage device 908 stores programs executed by the CPU 901, various data, and various data acquired from the outside.
- the storage device 908 can embody at least the storage unit 120 of the information processing device 100, for example.
- the drive 909 is a reader/writer for storage media, and is built in or externally attached to the information processing apparatus 100 .
- the drive 909 reads out information recorded on a removable storage medium such as a mounted magnetic disk, optical disk, magneto-optical disk, or semiconductor memory, and outputs the information to the RAM 903 .
- Drive 909 can also write information to a removable storage medium.
- connection port 911 is an interface connected to an external device, and is a connection port with an external device capable of data transmission by, for example, USB (Universal Serial Bus).
- USB Universal Serial Bus
- the communication device 913 is, for example, a communication interface formed by a communication device or the like for connecting to the network 920 .
- the communication device 913 is, for example, a communication card for wired or wireless LAN (Local Area Network), LTE (Long Term Evolution), Bluetooth (registered trademark), or WUSB (Wireless USB).
- the communication device 913 may be a router for optical communication, a router for ADSL (Asymmetric Digital Subscriber Line), a modem for various types of communication, or the like.
- This communication device 913 can transmit and receive signals and the like to and from the Internet and other communication devices, for example, according to a predetermined protocol such as TCP/IP.
- the sensor 915 in this embodiment includes a sensor capable of acquiring a spectrum (e.g., an imaging device, etc.), other sensors (e.g., acceleration sensor, gyro sensor, geomagnetic sensor, pressure sensor, sound sensor, or range sensor, etc.).
- the sensor 915 may embody at least the image acquisition unit 112 of the information processing device 100, for example.
- the network 920 is a wired or wireless transmission path for information transmitted from devices connected to the network 920 .
- the network 920 may include a public network such as the Internet, a telephone network, a satellite communication network, various LANs (Local Area Networks) including Ethernet (registered trademark), WANs (Wide Area Networks), and the like.
- Network 920 may also include a dedicated line network such as IP-VPN (Internet Protocol-Virtual Private Network).
- a hardware configuration example capable of realizing the functions of the information processing apparatus 100 has been shown above.
- Each component described above may be implemented using general-purpose members, or may be implemented by hardware specialized for the function of each component. Therefore, it is possible to appropriately change the hardware configuration to be used according to the technical level at which the present disclosure is implemented.
- a computer-readable recording medium storing such a computer program can also be provided. Recording media include, for example, magnetic disks, optical disks, magneto-optical disks, flash memories, and the like. Also, the above computer program may be distributed, for example, via a network without using a recording medium.
- a guide image generation unit that generates a guide image for correction by summing a plurality of images each containing spectral information related to biomarkers and dividing by the number of the summed images, Information processing equipment.
- (2) further comprising a correction unit that performs noise reduction correction on the image to be processed using the guide image;
- (3) The correction unit performs outlier processing on the processing target image before the noise reduction correction.
- the guide image generation unit performs image processing after summing and dividing the plurality of images.
- the information processing apparatus according to any one of (1) to (3) above.
- the guide image generation unit performs image processing after summing the plurality of images and before dividing.
- the information processing apparatus according to any one of (1) to (3) above.
- the guide image generation unit performs a process of zeroing pixels below a predetermined positive threshold for the plurality of images before summing the plurality of images.
- the information processing apparatus according to any one of (1) to (3) above.
- the guide image generation unit performs processing for zeroing pixels below a predetermined positive threshold for the plurality of images, and performs image processing after summing and dividing the plurality of images.
- the information processing apparatus according to (6) above.
- the guide image generation unit performs processing for zeroing pixels below a predetermined positive threshold for the plurality of images, and performs image processing after summing the plurality of images and before dividing.
- the guide image generation unit sums only the images corresponding to the specific cell tumor among the plurality of images, The information processing apparatus according to any one of (1) to (3) above.
- the guide image generation unit performs image processing after summing and dividing only the image corresponding to the specific cell tumor among the plurality of images.
- the information processing device according to (9) above.
- (11) The guide image generation unit performs image processing after adding only the image corresponding to the specific cell tumor among the plurality of images and before dividing.
- the guide image generation unit performs a zero-filling process for zeroing pixels below a predetermined positive threshold for the image corresponding to the specific cell tumor among the plurality of images, and the specific cell after the zero-filling process. summing only said images corresponding to tumors; The information processing apparatus according to (9) above. (13) The guide image generation unit performs image processing after summing and dividing only the image corresponding to the specific cell tumor after the zero-filling process. The information processing device according to (12) above. (14) The guide image generation unit performs image processing after adding only the image corresponding to the specific cell tumor after the zero-filling process and before dividing. The information processing device according to (12) above.
- the guide image generation unit sums the plurality of images using an analysis result of the image to be processed as a weight.
- the guide image generation unit repeats summing the plurality of images using the analysis result as a weight until the analysis result is approximately the same as the comparison target analysis result.
- the information processing device according to (15) above.
- each of the plurality of images is a color separation image;
- the guide image generation unit performs the image processing using a noise removal filter and an edge enhancement filter.
- an imaging device that acquires a plurality of images each containing spectral information about a biomarker; an information processing device that processes the plurality of images; with The information processing device is a guide image generation unit that generates a guide image for correction by summing the plurality of images and dividing by the number of the summed images; Biological sample observation system. (20) summing a plurality of images each containing spectral information about biomarkers and dividing by the number of summed images to generate a guide image for correction; Image generation method.
- a biological sample observation system comprising the information processing device according to any one of (1) to (18) above.
- observation unit 2 processing unit 3 display unit 10 excitation unit 10A fluorescent reagent 11A reagent identification information 20 stage 20A specimen 21 storage unit 21A specimen identification information 22 data calibration unit 23 image forming unit 30 spectroscopic imaging unit 30A fluorescence-stained specimen 40 observation optical system 50 scanning mechanism 60 focusing mechanism 70 non-fluorescent observation unit 80 control unit 100 information processing device 110 acquisition unit 111 information acquisition unit 112 image acquisition unit 120 storage unit 121 information storage unit 122 image information storage unit 123 analysis result storage unit 130 processing unit 131 Analysis unit 132 Image generation unit 133 Guide image generation unit 134 Correction unit 140 Display unit 150 Control unit 160 Operation unit 200 Database 500 Fluorescence observation device 1311 Connection unit 1321 Color separation unit 1321a First color separation unit 1321b Second color separation unit 1322 Spectrum Extraction unit 5000 Microscope system 5100 Microscope device 5101 Light irradiation unit 5102 Optical unit 5103 Signal acquisition unit 5104 Sample placement unit 5110 Control unit 5120 Information processing unit
Abstract
Un dispositif de traitement d'informations (100) selon un mode de réalisation de cette divulgation est équipé d'une unité de génération d'image de guidage (133) qui accumule des images ayant chacune des informations de spectre de biomarqueur, les divise par le nombre d'images accumulées, et génère une image de guidage pour une correction.
Applications Claiming Priority (2)
| Application Number | Priority Date | Filing Date | Title |
|---|---|---|---|
| JP2022017079 | 2022-02-07 | ||
| JP2022-017079 | 2022-02-07 |
Publications (1)
| Publication Number | Publication Date |
|---|---|
| WO2023149296A1 true WO2023149296A1 (fr) | 2023-08-10 |
Family
ID=87552227
Family Applications (1)
| Application Number | Title | Priority Date | Filing Date |
|---|---|---|---|
| PCT/JP2023/002215 WO2023149296A1 (fr) | 2022-02-07 | 2023-01-25 | Dispositif de traitement d'informations, système d'observation d'échantillon biologique et procédé de production d'image |
Country Status (1)
| Country | Link |
|---|---|
| WO (1) | WO2023149296A1 (fr) |
Citations (3)
| Publication number | Priority date | Publication date | Assignee | Title |
|---|---|---|---|---|
| JP2009042197A (ja) * | 2007-08-13 | 2009-02-26 | Topcon Corp | 光画像計測装置 |
| JP2017208016A (ja) * | 2016-05-20 | 2017-11-24 | 三菱電機株式会社 | 移動体検出装置、観測システム及び移動体検出方法 |
| JP2020504289A (ja) * | 2016-10-20 | 2020-02-06 | オプティナ ダイアグノスティクス,インコーポレイテッド | 生体組織内の異常を検出するための方法及びシステム |
-
2023
- 2023-01-25 WO PCT/JP2023/002215 patent/WO2023149296A1/fr unknown
Patent Citations (3)
| Publication number | Priority date | Publication date | Assignee | Title |
|---|---|---|---|---|
| JP2009042197A (ja) * | 2007-08-13 | 2009-02-26 | Topcon Corp | 光画像計測装置 |
| JP2017208016A (ja) * | 2016-05-20 | 2017-11-24 | 三菱電機株式会社 | 移動体検出装置、観測システム及び移動体検出方法 |
| JP2020504289A (ja) * | 2016-10-20 | 2020-02-06 | オプティナ ダイアグノスティクス,インコーポレイテッド | 生体組織内の異常を検出するための方法及びシステム |
Similar Documents
| Publication | Publication Date | Title |
|---|---|---|
| CA2774422C (fr) | Contraste multi-modalites et rendu de contexte en fond clair pour la determination amelioree d'une pathologie et une detection de multiples analytes dans un tissu | |
| US10580128B2 (en) | Whole slide multispectral imaging systems and methods | |
| US6337472B1 (en) | Light imaging microscope having spatially resolved images | |
| Krafft et al. | Advances in optical biopsy–correlation of malignancy and cell density of primary brain tumors using Raman microspectroscopic imaging | |
| US8013991B2 (en) | Raman difference spectra based disease classification | |
| JP5185151B2 (ja) | 顕微鏡観察システム | |
| US7956996B2 (en) | Distinguishing between invasive ductal carcinoma and invasive lobular carcinoma using raman molecular imaging | |
| US11668653B2 (en) | Raman-based immunoassay systems and methods | |
| JP2021529951A (ja) | 画像データを組み合わせることによる染色組織試料の合成画像の作成 | |
| WO2021177004A1 (fr) | Dispositif de microscope, système d'acquisition d'image et procédé d'acquisition d'image | |
| WO2022004500A1 (fr) | Dispositif de traitement d'informations, procédé de traitement d'informations, programme, système de microscope et système d'analyse | |
| WO2023149296A1 (fr) | Dispositif de traitement d'informations, système d'observation d'échantillon biologique et procédé de production d'image | |
| WO2022249583A1 (fr) | Dispositif de traitement d'informations, système d'observation d'échantillon biologique et procédé de production d'image | |
| WO2023276219A1 (fr) | Dispositif de traitement d'informations, système d'observation d'échantillon biologique et procédé de production d'image | |
| JP7090171B2 (ja) | 画像処理装置の作動方法、画像処理装置、及び画像処理装置の作動プログラム | |
| WO2023157756A1 (fr) | Dispositif de traitement d'informations, système d'analyse d'échantillon biologique et procédé d'analyse d'échantillon biologique | |
| WO2023157755A1 (fr) | Dispositif de traitement d'informations, système d'analyse d'échantillon biologique et procédé d'analyse d'échantillon biologique | |
| WO2023189393A1 (fr) | Système d'observation d'échantillon biologique, dispositif de traitement d'informations et procédé de génération d'image | |
| WO2023248954A1 (fr) | Système d'observation d'échantillon biologique, procédé d'observation d'échantillon biologique et procédé de création d'ensemble de données | |
| WO2022209443A1 (fr) | Dispositif d'analyse d'image médicale, procédé d'analyse d'image médicale et système d'analyse d'image médicale | |
| EP4318402A1 (fr) | Dispositif de traitement d'informations, procédé de traitement d'informations, système de traitement d'informations et modèle de conversion | |
| Bedard | Multi-modal imaging techniques for early cancer diagnostics | |
| CN116887760A (zh) | 医用图像处理设备、医用图像处理方法和程序 |
Legal Events
| Date | Code | Title | Description |
|---|---|---|---|
| 121 | Ep: the epo has been informed by wipo that ep was designated in this application |
Ref document number: 23749612 Country of ref document: EP Kind code of ref document: A1 |