WO2023145953A1 - コンピュータプログラム、情報処理装置及び情報処理方法 - Google Patents
コンピュータプログラム、情報処理装置及び情報処理方法 Download PDFInfo
- Publication number
- WO2023145953A1 WO2023145953A1 PCT/JP2023/002969 JP2023002969W WO2023145953A1 WO 2023145953 A1 WO2023145953 A1 WO 2023145953A1 JP 2023002969 W JP2023002969 W JP 2023002969W WO 2023145953 A1 WO2023145953 A1 WO 2023145953A1
- Authority
- WO
- WIPO (PCT)
- Prior art keywords
- computer
- computer program
- identified
- edema
- displaying
- Prior art date
- Legal status (The legal status is an assumption and is not a legal conclusion. Google has not performed a legal analysis and makes no representation as to the accuracy of the status listed.)
- Ceased
Links
Images







Classifications
-
- A—HUMAN NECESSITIES
- A61—MEDICAL OR VETERINARY SCIENCE; HYGIENE
- A61B—DIAGNOSIS; SURGERY; IDENTIFICATION
- A61B5/00—Measuring for diagnostic purposes; Identification of persons
- A61B5/05—Detecting, measuring or recording for diagnosis by means of electric currents or magnetic fields; Measuring using microwaves or radio waves
- A61B5/055—Detecting, measuring or recording for diagnosis by means of electric currents or magnetic fields; Measuring using microwaves or radio waves involving electronic [EMR] or nuclear [NMR] magnetic resonance, e.g. magnetic resonance imaging
-
- G—PHYSICS
- G16—INFORMATION AND COMMUNICATION TECHNOLOGY [ICT] SPECIALLY ADAPTED FOR SPECIFIC APPLICATION FIELDS
- G16H—HEALTHCARE INFORMATICS, i.e. INFORMATION AND COMMUNICATION TECHNOLOGY [ICT] SPECIALLY ADAPTED FOR THE HANDLING OR PROCESSING OF MEDICAL OR HEALTHCARE DATA
- G16H10/00—ICT specially adapted for the handling or processing of patient-related medical or healthcare data
- G16H10/40—ICT specially adapted for the handling or processing of patient-related medical or healthcare data for data related to laboratory analysis, e.g. patient specimen analysis
Definitions
- the present invention relates to a computer program, an information processing device, and an information processing method.
- Head MRI images taken with an MRI apparatus include T1-weighted images, T2-weighted images, proton density-weighted images, FLAIR (Fluid-Attenuated Inversion Recovery) images, diffusion-weighted images, MRA (Magnetic Resonance Angiography) images, T2 *.
- T2 star There are (T2 star)-weighted images, SWI (Susceptibility-Weighted Imaging) images, and the like, and an optimal image is selected according to the lesion in the brain for diagnosis and examination.
- Patent Document 1 a magnetic susceptibility image indicating the magnetic susceptibility of a tissue is calculated from a plurality of complex images generated based on MRI signals, and the magnetic susceptibility information of gray and white matter is extracted with high accuracy.
- An image processing apparatus is disclosed that can provide an appropriate diagnostic index and can be used for image interpretation.
- the present invention has been made in view of such circumstances, and an object of the present invention is to provide a computer program, an information processing apparatus, and an information processing method that can automatically provide information about an abnormal part.
- the present application includes a plurality of means for solving the above problems.
- a computer program causes a computer to acquire an MRI image, specify a signal value of the acquired MRI image, and obtain the specified signal value to display the abnormal part based on and execute the process.
- information on abnormal parts can be automatically provided from MRI images.
- FIG. 4 is a diagram showing an example of identification of brain tissue by a brain tissue identification unit; It is a figure which shows an example of signal identification by a signal value identification part.
- FIG. 10 is a diagram showing an example of acquiring information about an abnormal part using a learning model; FIG. 3 shows an example of severity of edema. It is a figure which shows the 1st example of the detection result by an information processing apparatus. It is a figure which shows the 2nd example of the detection result by an information processing apparatus. It is a figure which shows the 3rd example of the detection result by an information processing apparatus.
- FIG. 10 is a diagram illustrating an example of abnormal portion detection processing when a clustering method is used;
- FIG. 10 is a diagram illustrating an example of abnormal portion detection processing when using a learning model;
- FIG. 1 is a diagram showing an example of the configuration of an information processing system according to this embodiment.
- the information processing system includes an information processing device 50 .
- An input device 20 and a display device 30 are connected to the information processing device 50 .
- An MRI (Magnetic Resonance Imaging) device 10 and an image data server 100 are connected to the information processing device 50 via the communication network 1 .
- the MRI apparatus 10 is an apparatus that can capture a tomographic image using a magnetic resonance phenomenon, and can obtain an MRI image (also referred to as an MR image). By selecting imaging conditions, an MRI image reflecting tissue density, relaxation time (longitudinal relaxation time T1, transverse relaxation time T2), blood flow, amount of hydrogen atoms (proton density), and the like can be obtained. An MRI image can be generated by performing reconstruction processing on an MRI signal containing position information.
- MRI images are, for example, T2-weighted images, T2 * -weighted images, FLAIR (Fluid-Attenuated Inversion Recovery) images, SWI images, QSM images (quantitative magnetic susceptibility mapping), R2 * (R2 star) images. , and PADRE (Phase Difference Enhanced Imaging) images.
- SWI images can be generated from T2 * -weighted images and are qualitatively susceptibility-enhanced images.
- a QSM image can be generated by performing a predetermined operation on a T2 * weighted image. It is also possible to generate an R2 * (R2 star) image by performing a predetermined operation on the T2 * weighted image.
- the PADRE image uses tissue magnetic information contained in the MRI phase image information, and uses a method of emphasizing the tissue contrast in the brain by emphasizing the phase difference (phase-difference-enhanced imaging method). be.
- phase difference phase-difference-enhanced imaging method
- the predetermined arithmetic processing function may be provided in the MRI apparatus 10, may be provided in the information processing apparatus 50, or may be provided in another apparatus (not shown) connected to the communication network 1.
- the MRI apparatus 10 is installed, for example, in a medical institution such as a hospital. MRI images obtained by the MRI apparatus 10 are accumulated in the image data server 100 .
- the image data server 100 records MRI images for each patient. For example, for each patient, the imaging date of the MRI image, the imaging conditions, the presence or absence of medication at the time of imaging or the number of times of medication, the name and amount of the therapeutic drug at the time of medication, and the like are recorded in association with the MRI image for each patient. Also, the image data server 100 may be provided with a predetermined arithmetic processing function.
- QSM is a method of calculating the local magnetic susceptibility from the MRI phase image, and since the magnetic susceptibility is a physical property value peculiar to the material, it is possible to estimate the material information in the voxel from the magnetic susceptibility.
- a QSM image is an image that quantitatively represents magnetic susceptibility.
- paramagnetic substances with high magnetic susceptibility for example, hemosiderin and deoxyhemoglobin in bleeding
- diamagnetic substances with low magnetic susceptibility are displayed in black. Is displayed.
- the display device 30 includes a liquid crystal display panel, an organic EL display panel, or the like, and can display the processing results of the information processing device 50 .
- the display device 30 can display information on an abnormal part obtained from an MRI image.
- the input device 20 is an input interface such as a keyboard and a mouse that accepts operations of the information processing device 50 .
- the input device 20 may be a touch panel, soft keys, hard keys, or the like provided on the display device 30 .
- a medical worker such as a doctor can operate the input device 20 to display the processing result of the information processing device 50 on the display device 30 .
- the input device 20 and the display device 30 may be incorporated in the information processing device 50 .
- a client device personal computer or the like used by a medical practitioner such as a doctor is connected to the communication network 1, and the information processing device 50 serving as a server is sent from the client device to the information processing device 50.
- the medical staff acquires the MRI image from the MRI apparatus 10 into the client apparatus and uploads it to the information processing apparatus 50 .
- the information processing device 50 may perform processing described later, transmit the processing result to the client device, and display the processing result on the client device.
- FIG. 2 is a diagram showing an example of the configuration of the information processing device 50.
- the information processing device 50 can be configured by a computer, and includes a control unit 51 that controls the entire information processing device 50, a communication unit 52, a memory 53, an interface unit 54, a signal value correction unit 55, a signal value identification unit 56, a brain A tissue identification unit 57 , an abnormal part determination unit 58 , and a storage unit 59 are provided.
- the storage unit 59 stores a computer program 60, a learning model 61, and required information.
- the signal value correction unit 55, the signal value identification unit 56, the brain tissue identification unit 57, and the abnormal portion determination unit 58 may be configured by hardware, or may be realized by software (computer program). Alternatively, it may be composed of both hardware and software.
- the information processing device 50 may be composed of a plurality of devices.
- the control unit 51 can be configured with a CPU (Central Processing Unit), MPU (Micro-Processing Unit), GPU (Graphics Processing Unit), or the like.
- the control unit 51 can execute processing defined by the computer program 60 . That is, the processing by the control unit 51 is also the processing by the computer program 60 .
- the communication unit 52 includes, for example, a communication module, and has a function of communicating with the MRI apparatus 10 and the image data server 100 via the communication network 1.
- the communication unit 52 can acquire MRI images from the MRI apparatus 10 or the image data server 100 .
- the memory 53 can be composed of semiconductor memory such as SRAM (Static Random Access Memory), DRAM (Dynamic Random Access Memory), and flash memory.
- the computer program 60 can be developed in the memory 53 and the control unit 51 can execute the computer program 60 .
- the interface unit 54 provides an interface function between the input device 20 and the display device 30.
- the information processing device 50 (control section 51 ) can exchange data and information with the input device 20 and the display device 30 through the interface section 54 .
- the storage unit 59 can be composed of, for example, a hard disk or a semiconductor memory.
- the signal value correction unit 55 corrects the signal values of the MRI image acquired via the communication unit 52.
- the signal value correction includes, for example, magnetic field inhomogeneity correction, signal intensity normalization, noise reduction, and the like.
- Magnetic field non-uniformity correction is a process of correcting and equalizing signal intensity non-uniformity caused by variations unique to the MRI apparatus 10 (for example, magnetic field non-uniformity, receiving coil sensitivity non-uniformity, etc.).
- Signal intensity normalization is a process of mapping the signal histogram to a standardized histogram to make the amplitude of the signal value constant (eg, 0 to 100).
- Noise reduction is processing for reducing geometric image distortion caused by eddy currents and magnetic field inhomogeneity using affine transformation and the like.
- the signal value correction unit 55 may standardize the MRI image by performing registration (alignment). Registration of MRI images measured at multiple times and multiple modalities can use at least one of affine transformations, non-linear transformations, and rigid transformations such as translation and rotation.
- the brain tissue identifying unit 57 identifies brain tissue by classifying it into a plurality of tissues, for example, white matter, gray matter, and cerebrospinal fluid (CSF).
- a clustering method (grouping method) can be used to specify the brain tissue based on the position and voxel value on the MRI image, for example.
- an appropriate method such as the K-means method, DBSCAN (Density-based Spatial Clustering of Applications with Noise), or hierarchical clustering may be used.
- the brain tissue identifying unit 57 may identify brain tissue using a segmentation method. Specifically, using the Bayesian estimation algorithm from the MRI image, a mask image is generated for each tissue with the probability that the tissue exists in each pixel region in the image as a pixel value, and segmentation is performed using the generated mask image. may be performed. Also, a learning model generated by machine learning other than the Bayesian estimation algorithm may be used. For the learning model, for example, U-Net, GAN (Generative Adversarial Network), SegNet, etc. may be used.
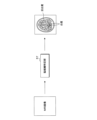
- FIG. 3 is a diagram showing an example of identification of brain tissue by the brain tissue identification unit 57.
- the brain tissue identifying section 57 identifies which tissue each pixel of the MRI image belongs to.
- a region of white matter (without pattern) and a region of gray matter (with pattern) are schematically shown. Note that the actual white matter and gray matter regions may differ.
- the brain tissue identifying unit 57 can also identify a region of cerebrospinal fluid.
- the MRI image input to the brain tissue identification unit 57 may be any of a T2-weighted image, a T2 * -weighted image, a FLAIR image, an SWI image, a QSM image, or an R2 * image.
- the signal value specifying unit 56 specifies signal values of the MRI image.
- the signal value specifying unit 56 may specify the signal value for each brain tissue specified (grouped) by the brain tissue specifying unit 57 . More specifically, the signal value specifying unit 56 specifies high signal portions and low signal portions for T2-weighted images, T2 * -weighted images, FLAIR images, PADRE images, and SWI images.
- High-signal and low-signal areas show the contrast of the MRI image, with high-signal areas appearing white on the MRI image and low-signal areas appearing black.
- microhemorrhage or edema is determined based on high-intensity, low-intensity, and size. As will be described later, a region identified as a high-signal portion can be determined as edema in the abnormal portion, and a region identified as a low-signal portion can be determined as microhemorrhage in the abnormal portion.
- Abnormalities are not limited to edema and microhemorrhages, but also include white matter lesions and amyloid-associated imaging abnormalities (ARIA).
- ARIA includes edema with fluid accumulation (ARIA-E) and small hemorrhages on the brain called cerebral microhemorrhages (ARIA-H). Cerebral microhemorrhages are small hemosiderin deposits.
- ARIA can be specified, for example, on the condition that the magnetic susceptibility is equal to or greater than a predetermined magnetic susceptibility threshold and that the size of the abnormal portion is the specified ARIA size.
- the specified size of ARIA can be ARIA-H if it is 1 cm or less, and ARIA-E if it is over 1 cm. In particular, if the size of the ARIA is 5 cm or less, the severity of the ARIA can be mild, if it is between 5 cm and 9 cm, it is moderate, and if it is greater than 9 cm, it can be severe.
- FLAIR imaging is an imaging method that highlights lesions and suppresses the signal of cerebrospinal fluid, where water-rich areas such as cerebrospinal fluid show low signal.
- a lesion site such as edema where tissue fluid other than water accumulates shows a high signal.
- areas of edema similarly show hyperintensity. That is, edema can be identified (detected) by identifying a high-signal portion in the MRI image with the signal value identifying unit 56 .
- T2-weighted images and T2 * -weighted images areas rich in water show high signal, and bleeding areas with few water molecules show low signal.
- the SWI image is an image in which the magnetic susceptibility is qualitatively emphasized, and like the T2-weighted image, areas with high magnetic susceptibility such as bleeding are indicated by low signals.
- PADRE images and FLAIR images that is, by specifying a low-signal portion in the MRI image by the signal value specifying unit 56, microhemorrhage can be specified (detected).
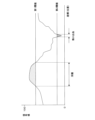
- FIG. 4 is a diagram showing an example of signal identification by the signal value identification unit 56.
- the vertical axis indicates signal values (0 to 100 when normalized), and the horizontal axis indicates coordinates (positions) of pixels (voxels).
- FIG. 4 represents the signal values of the MRI image in one dimension.
- the signal value identifying unit 56 determines whether the signal value of the MRI image is greater than or equal to the first threshold, less than or equal to the second threshold ( ⁇ first threshold), or less than the first threshold and greater than the second threshold. , to identify. As shown in FIG. 4, when the signal value of the MRI image is greater than or equal to the first threshold, it can be determined that the set (region) of pixels having the signal value is edema.
- the signal value of the MRI image is equal to or less than the second threshold, it can be determined that a set (region) of pixels having that signal value is microhemorrhage.
- a set (region) of pixels having that signal value is microhemorrhage.
- the signal intensity can be normalized based on the reference area.
- the distance is greater than a predetermined value based on the normalized signal intensity, it can be determined as a lesion site (microhemorrhage or edema).
- the non-lesioned area as the reference area, the difference from the lesioned area can be clarified, and the bias due to individual differences in subjects can be minimized.
- the signal value specifying unit 56 specifies magnetic susceptibility information for the QSM image and the R2 * image. More specifically, the signal value identifying unit 56 identifies a set (region) of pixels in which the magnetic susceptibility of the MRI image (QSM image and R2 * image) is equal to or greater than a predetermined threshold, and determines the size of the identified region, and the magnetic susceptibility (eg, average magnetic susceptibility) of the region. In this embodiment, when QSM images and R2 * images are used, microhemorrhage or edema is determined based on the magnetic susceptibility quantitative value and size.
- the clustering method is used to classify brain tissue, and the signal value of the MRI image is specified for each brain tissue to determine edema and microhemorrhage. Determination of microhemorrhage is not limited to this.
- a learning model generated by machine learning or a technique based on statistical analysis for example, discriminant analysis, which is one of techniques for automatically obtaining a threshold value may be used.
- FIG. 5 is a diagram showing an example of acquiring information about an abnormal portion using the learning model 61.
- the learning model 61 is generated to output edema region information, microhemorrhage region information, and normal region (neither edema nor microhemorrhage) region information when an MRI image is input.
- the MRI images input to the learning model 61 may be T2-weighted images, T2 * -weighted images, FLAIR images, SWI images, PADRE images, QSM images, or R2 * images.
- the control unit 51 inputs the MRI image corrected by the signal value correction unit 55 to the learning model 61, and acquires the edema region information, the microhemorrhage region information, and the normal region region information output by the learning model 61. do.
- the edema region information includes the position (region) of edema on the MRI image and the number of edema.
- the area information of microbleeds includes the position (area) of microbleeds on the MRI image and the number of microbleeds.
- the normal area information includes the position (area) of the normal area on the MRI image.
- U-Net for example, U-Net, GAN (Generative Adversarial Network), SegNet, etc. can be used.
- GAN Geneative Adversarial Network
- SegNet etc.
- the abnormal part determination unit 58 determines the number and size of edemas based on the edema regions identified by the signal value identification unit 56 .
- the abnormal part determination unit 58 determines the number and size of edema based on the edema area information output by the learning model 61 .
- the size of the edema can be the dimension of the longest segment (long segment) of the edematous area.
- the abnormal part determination unit 58 may calculate the magnetic susceptibility of the edema.
- the abnormal part determination unit 58 may specify the severity of edema based on the size of the edema. Thereby, the information of the abnormal part can be automatically provided from the MRI image.
- Fig. 6 is a diagram showing an example of the severity of edema. As shown in FIG. 6, for example, when the size of the edema is less than 50 mm, the severity of the edema is mild, when it is 50 mm or more and less than 90 mm, it is moderate, and when it is 90 mm or more, it is severe. .
- the abnormal portion determining unit 58 determines the number and size of microbleeds based on the microbleeding regions identified by the signal value identifying unit 56 .
- the abnormal part determination unit 58 determines the number and size of microbleeds based on the region information of microbleeds output by the learning model 61 .
- the abnormal part determination unit 58 may calculate the magnetic susceptibility of minute bleeding.
- the abnormal area determination unit 58 can determine that the input is a T2 * -weighted image, and if the voxel value is a low signal value and the size is 10 mm or less, it is microhemorrhage, and the input is FLAIR.
- the abnormal area determination unit 58 receives a T2 * -weighted image as an input, can determine whether each voxel is normal or microhemorrhage as an output, and receives a FLAIR image as an output. is normal or edematous. Thereby, the information of the abnormal part can be automatically provided from the MRI image.
- the control unit 51 inputs the acquired MRI image to a learning model 61 that outputs information on at least one of edema and microhemorrhage, and acquires information on at least one of edema and microhemorrhage. , at least one of edema and microhemorrhage may be displayed based on the obtained information.
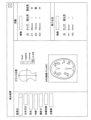
- FIG. 7 is a diagram showing a first example of detection results by the information processing device 50.
- FIG. A detection result is displayed on the display device 30 .
- the detection result screen includes patient ID (which may include a name), date of birth, gender, age, MRI imaging date (imaging date at the time of drug administration), as attribute information about the patient. Information such as the number of doses and therapeutic drugs is displayed.
- the patient ID may be selectable from among multiple patients. Also, if there are multiple shooting dates, the shooting date may be selectable.
- a horizontal bar is displayed on the detection result screen to specify which slice image to display among multiple tomographic images.
- a slice image to be displayed can be selected by moving the horizontal bar along the vertical direction.
- the example in the figure indicates that the 128th slice image of 256 slice images is displayed.
- an axial section (Axial) is selected.
- the displayed MRI images may be T2-weighted, T2 * -weighted, FLAIR, SWI, PADRE, QSM, or R2 * images.
- FLAIR images are displayed in the example of FIG. 7, a plurality of MRI images may be displayed simultaneously.
- edema indicated by symbols E1 to E3
- microhemorrhage indicated by symbols H1 to H2 detected by the information processing apparatus 50 are displayed so as to be identifiable.
- the doctor does not need to observe the MRI image and judge the abnormal part by himself, and the abnormal part is automatically displayed, so that the work time that the doctor had to perform visually at the time of diagnosis can be shortened.
- the abnormal part is automatically determined, it is possible to reduce variations in diagnosis due to the experience of individual doctors. Only one of edema and microhemorrhage may be displayed, and neither edema nor microhemorrhage is displayed when there is no abnormal area.
- the detection result screen may display the number of edema, the size, magnetic susceptibility, and severity of edema for each edema (for each ID).
- the control unit 51 can specify a first region where the specified signal value is a high signal value, and display the specified first region as edema. Also, the control unit 51 may display at least one of the size and the number of the identified first regions. Moreover, the control unit 51 may display the severity of edema based on the size of the specified first region. Thereby, the information of the abnormal part can be automatically provided from the MRI image.
- the detection result screen may display the number of microbleeds, the size of microbleeds for each microbleed (per ID), and the magnetic susceptibility.
- the control unit 51 identifies a second region in which the identified signal value is a low signal value, and displays the identified second region as microhemorrhage. Further, the control unit 51 can determine whether or not there is minute bleeding based on the size of the specified second region. The control unit 51 may display at least one of the size and number of the identified second regions. Thereby, the information of the abnormal part can be automatically provided from the MRI image.
- the control unit 51 can specify the magnetic susceptibility of the acquired MRI image and display at least one of edema and microhemorrhage based on the specified magnetic susceptibility. Also, the control unit 51 may display the magnetic susceptibility of at least one of edema and microhemorrhage. Thereby, the information of the abnormal part can be automatically provided from the MRI image.
- the control unit 51 may identify a plurality of brain tissues based on the acquired MRI image and display an abnormal part based on the signal value of each identified brain tissue. As a result, even when there is a difference in signal value between brain tissues, the signal value can be specified by excluding the difference in signal value, and the detection accuracy of an abnormal portion can be improved.
- FIG. 8 is a diagram showing a second example of detection results by the information processing device 50.
- the number of voxels, volume (volume), Each value of xyz coordinates is displayed in a table format. Also, for edema, the size (length) may be displayed. Although the number of voxels, volume, length, and xyz coordinates are displayed in the example of FIG. 8, only a part of them may be displayed instead of all of them.
- control unit 51 may display at least one of the number of voxels, volume, and coordinates for each identified first region.
- the display format may be a table format as shown in FIG.
- control unit 51 may display at least one of the number of voxels, volume, and coordinates for each identified second region. Thereby, the information of the abnormal part can be automatically provided from the MRI image.
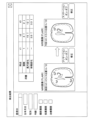
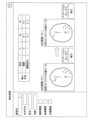
- FIG. 9 is a diagram showing a third example of detection results by the information processing device 50.
- the detection result screen includes a patient ID (which may include a name), date of birth, sex, and age, as well as an imaging history selection button, a medication history selection button, and a treatment history selection button. Is displayed.
- each column of time point, number, length change, and volume change regarding edema is displayed in a table format.
- dates indicated by symbols t1, t2, and t3 are displayed as a plurality of time points.
- three time points are displayed as multiple time points, but the number of multiple time points is not limited to three.
- the imaging history selection button is selected, the plurality of time points are the time points at which MRI images are captured, and when the medication history selection button is selected, different medication time points. is selected, it is a different treatment time point.
- the increase/decrease in the detected number can be represented by an increase/decrease sign such as ⁇ (increase) or ⁇ (decrease), for example.
- ⁇ increase
- ⁇ decrease
- the change in length (change in size) increases by 15 (mm) from time t1 to time t2, and at time t2, since the length increases, ⁇ is given.
- the change in length (change in size) decreases from 15 (mm) to 12 (mm) from time t2 to time t3, and at time t3, since the length decreases, ⁇ is given.
- Volume change is similar.
- MRI images at different time points are displayed on the detection result screen so that they can be compared.
- the previous (time t2) FLAIR image and the current (time t3) FLAIR image are displayed so as to be comparable. This makes it possible to monitor changes in edema at multiple time points before and after drug administration and before and after treatment.
- the previous FLAIR image shows edema at four locations.
- edema is displayed in two places in the FLAIR image this time.
- the edema area in the FLAIR image is displayed in a predetermined color (for example, light blue highlight) or displayed as it is in the brain image (without light blue highlight). can be switched alternately.
- a predetermined color for example, light blue highlight
- FIG. 9 schematically illustrates the annotation-on state.
- an image editing tool (not shown) is displayed. For example, when the doctor determines that part of the edema detected by the information processing device 50 is false detection, the falsely detected edema can be deleted or corrected.
- the previously detected edema and the newly detected edema this time may be displayed in different display modes (for example, color coding) so that they can be compared.
- edema may be displayed in a different display mode (for example, color-coded) for each time point so that it can be compared.
- edema high intensity area
- an alert can be displayed on the image.
- control unit 51 acquires MRI images at multiple time points, displays changes in at least one of the size, volume, and number of the identified first regions at multiple time points, and the first regions are identified. Alternatively, MRI images at different time points may be displayed for comparison.
- the number and size of edema can be automatically monitored quantitatively from MRI images, and the increase and decrease in the number and size of edema can be tracked at multiple time points. This makes it possible to automatically quantify edema without being troublesome and unaffected by the doctor's experience, and monitor changes over time and use it as an index for appropriate dosing decisions.
- FIG. 10 is a diagram showing a fourth example of detection results by the information processing device 50. As shown in FIG. In the fourth example shown in FIG. 10, each column of time, number, and change in number of microbleeds is displayed in a table format on the detection result screen, and the T2 * image of the previous time (time t2) and the current time (time t3) The T2 * image is displayed so that it can be compared. Since other configurations are the same as those in FIG. 9, description thereof will be omitted.
- the increase/decrease in the detected number can be represented by an increase/decrease sign such as ⁇ (increase) or ⁇ (decrease), for example.
- ⁇ increase
- ⁇ decrease
- MRI images at different time points are displayed on the detection result screen so as to be able to be compared.
- the previous (time t2) T2 * image and the current (time t3) T2 * image are displayed so that they can be compared. This makes it possible to monitor changes in microhemorrhage at multiple time points before and after drug administration or treatment.
- the previous T2 * image shows microhemorrhages at 8 locations.
- microhemorrhages are displayed at six locations in the T2 * image this time.
- microbleeding detected previously and microbleeding newly detected this time may be displayed in different display modes (for example, by color coding) so that they can be compared.
- microbleeds may be displayed in different display modes (for example, by color coding) for each time point so that they can be compared.
- control unit 51 acquires MRI images at a plurality of time points, displays changes in the number of the identified second regions for each of the plurality of time points, and compares the MRI images at different time points in which the second regions are identified. can be displayed if possible.
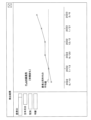
- FIG. 11 is a diagram showing a fifth example of detection results by the information processing device 50.
- FIG. On the detection result screen changes in the volume change of FLAIR high signal (edema or suspected edema) of the patient are displayed in chronological order (for example, graph display).
- the average value of FLAIR high intensity in the same age as the patient is indicated by a dashed line.
- the volume change of the FLAIR high signal is displayed, but it is not limited to the volume change, and the number change, size (long) change, etc. may be displayed in chronological order.
- the predetermined criterion is not limited to the average value of FLAIR hyperintensities of the same age as the patient.
- control unit 51 acquires MRI images at a plurality of time points, and compares at least one transition of the size, volume, and number of the first regions identified at each of the plurality of time points with a predetermined standard. may be displayed. This allows tracking changes over time such as size, volume and number of edema or suspected edema areas.
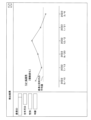
- FIG. 12 is a diagram showing a sixth example of the detection result by the information processing device 50.
- changes in the number of T2 * low signals (microhemorrhages or suspected microhemorrhages) of the patient are displayed in chronological order (for example, graph display).
- the mean value of T2 * hypointense in the same age as the patient is indicated by a dashed line.
- the predetermined criterion is not limited to the mean value of T2 * hypointense in the same age as the patient.
- control unit 51 may acquire MRI images at a plurality of time points, and display the transition in the number of second regions specified at each of the plurality of time points in comparison with a predetermined reference. This makes it possible to track changes over time, such as the number of microhemorrhages or suspected microhemorrhages.
- FIG. 13 is a diagram showing an example of abnormal part detection processing when the clustering method is used.
- the control unit 51 acquires an MRI image (S11) and corrects the signal values of the acquired MRI image (S12).
- the control unit 51 groups brain tissues using a clustering method (S13). Brain tissue can be grouped into, for example, white matter, gray matter, and cerebrospinal fluid. Depending on the position of the brain indicated by the MRI image, it may not be possible to group into three brain tissues.
- the control unit 51 determines whether the MRI image is a QSM image or an R2* image (S14). (S15). If there is a high-intensity region (YES in S15), the controller 51 determines that the region is edematous (S16). The control unit 51 specifies the number and size of edema (S17), and specifies the severity of edema (S18). The control unit 51 outputs the detection result (S19), and performs the process of step S26, which will be described later.
- control unit 51 determines whether or not there is a low-signal region in the MRI image (S20). If there is a low-signal area (YES in S20), the controller 51 determines that the area is microhemorrhage (S21). The control unit 51 specifies the number and size of microbleeds (S22), and performs the process of step S19. If there is no low-signal area (NO in S20), the control unit 51 performs the processes from step S11.
- the control unit 51 determines whether there is an area with magnetic susceptibility equal to or higher than a predetermined threshold (S23). If there is no area where the magnetic susceptibility is equal to or greater than the predetermined threshold (NO in S23), the control unit 51 performs the processes from step S11. If there is an area with magnetic susceptibility equal to or higher than the predetermined threshold (YES in S23), the control unit 51 stratifies edema or microhemorrhage according to the size of the area (S24). The control unit 51 calculates the magnetic susceptibility of edema or microhemorrhage (S25), and performs the process of step S19.
- the control unit 51 determines whether or not to end the process (S26), and if not to end the process (NO in S26), the process from step S11 onwards is performed. When ending the process (YES in S26), the control unit 51 ends the process.
- FIG. 14 is a diagram showing an example of abnormal part detection processing when the learning model 61 is used.
- the control unit 51 acquires an MRI image (S31) and corrects the signal values of the acquired MRI image (S32).
- the control unit 51 inputs the MRI image whose signal value has been corrected to the learning model 61, and the edema information (edema area information), the microhemorrhage information (microhemorrhage area information) output by the learning model 61, and the Normal part information (normal part area information) is acquired (S33).
- the edema information and the microbleeding information is acquired instead of both the edema information and the microbleeding information.
- the control unit 51 identifies the number and size of edema or microhemorrhage (S34), and identifies the severity of edema (S35).
- the control unit 51 determines whether the MRI image is a QSM image or an R2* image (S36).
- the rate is calculated (S37) and the detection result is output (S38).
- control unit 51 performs the process of step S38 without performing the process of step S37.
- the control unit 51 determines whether or not to end the process (S39), and if not to end the process (NO in S39), the process from step S31 onwards is performed. When ending the process (YES in S39), the control unit 51 ends the process.
- the computer program of the present embodiment causes a computer to acquire an MRI image, specify the signal values of the acquired MRI image, and display an abnormal portion based on the specified signal values.
- Appendix 3 In Appendix 2, the computer program of the present embodiment causes the computer to display at least one of the size and the number of the identified first regions.
- Appendix 4 In Appendix 2 or Appendix 3, the computer program of the present embodiment causes the computer to display the severity of edema based on the size of the specified first region.
- Supplementary note 5 In any one of Supplementary notes 2 to 4, the computer program of the present embodiment displays on the computer at least one of the number of voxels, the volume, and the coordinates for each of the identified first regions. let it run.
- the computer program of the present embodiment acquires MRI images at a plurality of time points in the computer, and the size of the first region specified for each of the plurality of time points, A process is performed to display changes in at least one of volume and number and to contrastably display MRI images at different time points in which the first region has been identified.
- Supplementary Note 7 In any one of Supplementary Note 2 to Supplementary Note 6, the computer program of the present embodiment acquires MRI images at a plurality of time points in the computer, and the size of the first region specified for each of the plurality of time points, A process of comparing and displaying changes in at least one of volume and number with a predetermined criterion is executed.
- Supplementary Note 8 In any one of Supplementary Note 1 to Supplementary Note 7, the computer program of the present embodiment specifies a second region in which the specified signal value is a low signal value, and specifies the specified second region Display as microbleeds, let the process run.
- Appendix 9 The computer program of the present embodiment causes the computer to execute the process of determining whether or not there is microhemorrhage based on the size of the specified second region in Appendix 8.
- the computer program of the present embodiment causes the computer to display at least one of the size and the number of the identified second regions.
- the computer program of the present embodiment displays on the computer at least one of the number of voxels, the volume, and the coordinates of each of the identified second regions. let it run.
- the computer program of the present embodiment acquires MRI images at a plurality of time points in the computer, and changes in the number of second regions identified at each of the plurality of time points. is displayed, and MRI images of different time points in which the second region is specified are displayed in a comparable manner.
- the computer program of the present embodiment acquires MRI images at a plurality of time points in the computer, and changes the number of second regions identified at each of the plurality of time points. and a predetermined reference in comparison to each other.
- the computer program of the present embodiment specifies the magnetic susceptibility of the acquired MRI image in the computer, and based on the specified magnetic susceptibility, edema and microhemorrhage Display at least one of them, and cause the process to be executed.
- the computer program of the present embodiment causes the computer to display the magnetic susceptibility of at least one of edema and microhemorrhage.
- the computer program of the present embodiment is such that the computer identifies a plurality of brain tissues based on the acquired MRI image, and the signal value for each identified brain tissue to display the abnormal part based on and execute the process.
- the computer program of the present embodiment has a learning model that outputs information on at least one of edema and microhemorrhage when an MRI image is input to the computer, The acquired MRI image is input, information on at least one of edema and microhemorrhage is acquired, and processing for displaying at least one of edema and microhemorrhage is executed based on the acquired information.
- the information processing apparatus of the present embodiment includes an acquisition unit that acquires an MRI image, a specification unit that specifies the signal value of the acquired MRI image, and a display unit that displays an abnormal portion based on the specified signal value.
- the information processing method of the present embodiment acquires an MRI image, specifies the signal value of the acquired MRI image, and displays an abnormal part based on the specified signal value.
- communication network 10 MRI apparatus 20 input device 30 display device 50 information processing device 51 control unit 52 communication unit 53 memory 54 interface unit 55 signal value correction unit 56 signal value identification unit 57 brain tissue identification unit 58 abnormal part determination unit 59 storage unit 60 computer program 61 learning model 100 image data server
Landscapes
- Health & Medical Sciences (AREA)
- Life Sciences & Earth Sciences (AREA)
- Nuclear Medicine, Radiotherapy & Molecular Imaging (AREA)
- Engineering & Computer Science (AREA)
- General Health & Medical Sciences (AREA)
- Medical Informatics (AREA)
- Public Health (AREA)
- Physics & Mathematics (AREA)
- Radiology & Medical Imaging (AREA)
- High Energy & Nuclear Physics (AREA)
- Primary Health Care (AREA)
- Epidemiology (AREA)
- Biophysics (AREA)
- Pathology (AREA)
- Biomedical Technology (AREA)
- Heart & Thoracic Surgery (AREA)
- Molecular Biology (AREA)
- Surgery (AREA)
- Animal Behavior & Ethology (AREA)
- Veterinary Medicine (AREA)
- Magnetic Resonance Imaging Apparatus (AREA)
Priority Applications (1)
| Application Number | Priority Date | Filing Date | Title |
|---|---|---|---|
| JP2023577082A JPWO2023145953A1 (https=) | 2022-01-31 | 2023-01-31 |
Applications Claiming Priority (2)
| Application Number | Priority Date | Filing Date | Title |
|---|---|---|---|
| JP2022-013199 | 2022-01-31 | ||
| JP2022013199 | 2022-01-31 |
Publications (1)
| Publication Number | Publication Date |
|---|---|
| WO2023145953A1 true WO2023145953A1 (ja) | 2023-08-03 |
Family
ID=87471767
Family Applications (1)
| Application Number | Title | Priority Date | Filing Date |
|---|---|---|---|
| PCT/JP2023/002969 Ceased WO2023145953A1 (ja) | 2022-01-31 | 2023-01-31 | コンピュータプログラム、情報処理装置及び情報処理方法 |
Country Status (2)
| Country | Link |
|---|---|
| JP (1) | JPWO2023145953A1 (https=) |
| WO (1) | WO2023145953A1 (https=) |
Cited By (1)
| Publication number | Priority date | Publication date | Assignee | Title |
|---|---|---|---|---|
| JP2023151303A (ja) * | 2022-03-31 | 2023-10-16 | 富士フイルム株式会社 | 医療支援装置、医療支援装置の作動方法及び作動プログラム |
Citations (1)
| Publication number | Priority date | Publication date | Assignee | Title |
|---|---|---|---|---|
| WO2021132600A1 (ja) * | 2019-12-27 | 2021-07-01 | 株式会社Rainbow | 頭蓋内に安全に細胞を投与するための総合システム |
-
2023
- 2023-01-31 JP JP2023577082A patent/JPWO2023145953A1/ja active Pending
- 2023-01-31 WO PCT/JP2023/002969 patent/WO2023145953A1/ja not_active Ceased
Patent Citations (1)
| Publication number | Priority date | Publication date | Assignee | Title |
|---|---|---|---|---|
| WO2021132600A1 (ja) * | 2019-12-27 | 2021-07-01 | 株式会社Rainbow | 頭蓋内に安全に細胞を投与するための総合システム |
Non-Patent Citations (2)
| Title |
|---|
| KOCH K.M., MEIER T.B., KARR R., NENCKA A.S., MUFTULER L.T., MCCREA M.: "Quantitative Susceptibility Mapping after Sports-Related Concussion", AMERICAN JOURNAL OF NEURORADIOLOGY, US, vol. 39, no. 7, 1 July 2018 (2018-07-01), US , pages 1215 - 1221, XP093082040, ISSN: 0195-6108, DOI: 10.3174/ajnr.A5692 * |
| LIU TIAN, SURAPANENI KRISHNA, LOU MIN, CHENG LIUQUAN, SPINCEMAILLE PASCAL, WANG YI: "Cerebral Microbleeds: Burden Assessment by Using Quantitative Susceptibility Mapping", RADIOLOGY, RADIOLOGICAL SOCIETY OF NORTH AMERICA, INC., US, vol. 262, no. 1, 1 January 2012 (2012-01-01), US , pages 269 - 278, XP093082037, ISSN: 0033-8419, DOI: 10.1148/radiol.11110251 * |
Cited By (2)
| Publication number | Priority date | Publication date | Assignee | Title |
|---|---|---|---|---|
| JP2023151303A (ja) * | 2022-03-31 | 2023-10-16 | 富士フイルム株式会社 | 医療支援装置、医療支援装置の作動方法及び作動プログラム |
| JP7840766B2 (ja) | 2022-03-31 | 2026-04-06 | 富士フイルム株式会社 | 医療支援装置、医療支援装置の作動方法及び作動プログラム |
Also Published As
| Publication number | Publication date |
|---|---|
| JPWO2023145953A1 (https=) | 2023-08-03 |
Similar Documents
| Publication | Publication Date | Title |
|---|---|---|
| Backhausen et al. | Best practices in structural neuroimaging of neurodevelopmental disorders | |
| US12020427B2 (en) | Differentiation device, differentiation method for depression symptoms, determination method for level of depression symptoms, stratification method for depression patients, determination method for effects of treatment of depression symptoms, and brain activity training device | |
| Wilke et al. | Automated detection of gray matter malformations using optimized voxel-based morphometry: a systematic approach | |
| US10307077B2 (en) | Medical image display apparatus | |
| Li et al. | Voxel-based morphometry of the visual-related cortex in primary open angle glaucoma | |
| JP5243865B2 (ja) | 脳疾患診断システム | |
| Zha et al. | Semiautomated ventilation defect quantification in exercise-induced bronchoconstriction using hyperpolarized helium-3 magnetic resonance imaging: a repeatability study | |
| Diamond et al. | Optimizing the accuracy of cortical volumetric analysis in traumatic brain injury | |
| Torrisi et al. | Statistical power comparisons at 3T and 7T with a GO/NOGO task | |
| US8913812B2 (en) | Medical image processing apparatus | |
| JP2017124039A (ja) | 画像処理装置および画像処理プログラム | |
| Jiang et al. | Aberrant dynamic functional network connectivity in cirrhotic patients without overt hepatic encephalopathy | |
| EP1542589A2 (en) | Display of image data information | |
| JP2021518205A (ja) | 神経学的検査システム | |
| Danciut et al. | Understanding the mechanisms of fatigue in multiple sclerosis: linking interoception, metacognition and white matter dysconnectivity | |
| Hu et al. | Abnormal brain functional and structural connectivity between the left supplementary motor area and inferior frontal gyrus in moyamoya disease | |
| WO2023145953A1 (ja) | コンピュータプログラム、情報処理装置及び情報処理方法 | |
| Seibert et al. | Default network correlations analyzed on native surfaces | |
| Liu et al. | Reduced local diffusion homogeneity as a biomarker for temporal lobe epilepsy | |
| Hachaj et al. | CAD system for automatic analysis of CT perfusion maps | |
| Thomas et al. | Fully automated end-to-end neuroimaging workflow for mental health screening | |
| KR20220046060A (ko) | 뇌경색 심각도 기반의 뇌경색 예측 방법 및 그를 위한 장치 | |
| EP4150631B1 (en) | Quality control in medical imaging | |
| Bartlett et al. | Noise contamination from PET blood sampling pump: Effects on structural MRI image quality in simultaneous PET/MR studies | |
| WO2023074509A1 (ja) | コンピュータプログラム、情報処理装置及び情報処理方法 |
Legal Events
| Date | Code | Title | Description |
|---|---|---|---|
| 121 | Ep: the epo has been informed by wipo that ep was designated in this application |
Ref document number: 23747163 Country of ref document: EP Kind code of ref document: A1 |
|
| ENP | Entry into the national phase |
Ref document number: 2023577082 Country of ref document: JP Kind code of ref document: A |
|
| NENP | Non-entry into the national phase |
Ref country code: DE |
|
| 122 | Ep: pct application non-entry in european phase |
Ref document number: 23747163 Country of ref document: EP Kind code of ref document: A1 |