WO2023132155A1 - Prediction line calculating device, and prediction line calculation method - Google Patents
Prediction line calculating device, and prediction line calculation method Download PDFInfo
- Publication number
- WO2023132155A1 WO2023132155A1 PCT/JP2022/043869 JP2022043869W WO2023132155A1 WO 2023132155 A1 WO2023132155 A1 WO 2023132155A1 JP 2022043869 W JP2022043869 W JP 2022043869W WO 2023132155 A1 WO2023132155 A1 WO 2023132155A1
- Authority
- WO
- WIPO (PCT)
- Prior art keywords
- prediction line
- reaction process
- measurement result
- result data
- prediction
- Prior art date
Links
Images


Classifications
-
- G—PHYSICS
- G01—MEASURING; TESTING
- G01N—INVESTIGATING OR ANALYSING MATERIALS BY DETERMINING THEIR CHEMICAL OR PHYSICAL PROPERTIES
- G01N35/00—Automatic analysis not limited to methods or materials provided for in any single one of groups G01N1/00 - G01N33/00; Handling materials therefor
Definitions
- the present invention relates to a technique for calculating prediction lines of results measured by an automatic analyzer that analyzes the components of samples.
- Automated analyzers for clinical testing use a sample dispensing mechanism to dispense samples such as blood and urine from sample containers into reaction containers, and then dispense reagents from reagent containers into the reaction containers into which the samples have been dispensed.
- the reagent is dispensed and stirred by the dosing mechanism. After that, the concentration of the target item contained in the sample is calculated by reacting for a certain period of time and measuring the absorbance, luminescence, etc. obtained from the reaction solution.
- absorbance and luminescence are memorized in chronological order (e.g. absorbance and luminescence are acquired 38 times in 10 minutes and memorized in chronological order (hereafter referred to as reaction described as a process)), and the presence or absence of unintended changes in the time-series changes is determined. If there is an unintended change, the automatic analyzer can inform the user that there was an abnormality in the analysis of the item.
- Patent Document 1 discloses an automatic analyzer that determines the presence or absence of an abnormality from the deviation between the absorbance or luminescence amount obtained for the Nth time and the approximated curve applied in advance to the reaction process.
- Patent Document 2 acquires and stores a chemical reaction model from a sample of known concentration such as a quality control sample, calculates a reference reaction process from the amount of change in absorbance or the rate of change in absorbance of the sample, and calculates the reference reaction process and the sample.
- a chemical reaction model from a sample of known concentration such as a quality control sample
- calculates a reference reaction process from the amount of change in absorbance or the rate of change in absorbance of the sample, and calculates the reference reaction process and the sample.
- an automatic analyzer that determines the presence or absence of an abnormality from the divergence between the reaction process of
- Patent Documents 1 and 2 the presence or absence of an abnormality cannot be determined until the analysis is finished. In order to quickly determine the presence or absence of an abnormality, it is desirable to obtain information that can be used to determine the presence or absence of the abnormality in the analysis process.
- Patent Document 2 it is necessary to prepare a chemical reaction model in advance using a sample of known concentration.
- the time required to prepare a sample of known concentration, the time required to analyze the sample of known concentration, the cost of reagents, and the like are burdensome in clinical testing. Therefore, it is desirable to obtain information that can be used to determine the presence or absence of abnormalities without using a sample of known concentration.
- the present invention has been made in view of the above problems, and is capable of obtaining information used for detecting analysis abnormalities during the analysis process without previously analyzing a sample of known concentration.
- An object is to provide an analyzer.
- the automatic analyzer acquires a standard reaction process model from a plurality of reaction processes, and generates a prediction line by adding data points in the standard reaction process model to measurement result data of the reaction process. .
- the automatic analyzer of the present invention it is possible to obtain information used for detecting analysis abnormalities during the analysis process without previously analyzing a sample of known concentration. Problems, configurations, effects, etc. other than those described above will be clarified by the following description of the embodiments.
- FIG. 1 is an overall configuration diagram of an automatic analyzer 100 according to Embodiment 1.
- FIG. FIG. 2 is a schematic diagram showing a connection relationship between an automatic analyzer 100 and a server 200; It is an example of a standard reaction process model.
- 4 is a flowchart for explaining a procedure for creating a standard reaction process model by a computing unit 210; It is a figure explaining the procedure of creating the prediction line of a reaction process. It is a figure which illustrates the result of having created the prediction line using abnormal measurement result data.
- 7 is a graph showing a result of superimposing a prediction line created using normal measurement result data together with measurement result data.
- 7 is a graph showing a result of superimposing a prediction line created using abnormal measurement result data together with measurement result data.
- 4 is a flowchart for explaining a procedure in which a calculation unit 210 determines the accuracy of measurement result data using prediction lines; 4 is a flowchart for explaining a procedure in which a calculation unit 210 determines the accuracy of measurement result data using prediction lines; It is the example which plotted the time-dependent change of the degree of divergence in S909. A standard reaction course model for two measurements is shown. 4 is a graph illustrating changes in water content over time when subject A used a sample of skin care product A.
- FIG. 10 is a graph illustrating changes in water content over time when subject B used a sample of skin care product A.
- FIG. 1 is an overall configuration diagram of an automatic analyzer 100 according to Embodiment 1 of the present disclosure.
- the automatic analyzer 100 mainly includes a sample disk 101, a reaction disk 104, a sample dispensing mechanism 106, a reagent disk 107, a reagent dispensing mechanism 110, a sound wave irradiation mechanism 111, a stirring mechanism 112, a photometry mechanism 114, and a reaction vessel cleaning mechanism 115. , and an overall control unit 121 .
- a sample container 103 containing a sample 102 is concentrically arranged on the sample disk 101 .
- Reaction vessels 202 are concentrically arranged on the reaction disk 104 , and the arranged reaction vessels 202 are kept at a constant temperature by the constant temperature bath circulating liquid 113 .
- Reagent containers 109 containing various reagents 108 are arranged concentrically on the reagent disk 107 .
- the overall control unit 121 includes a control circuit 116, a photometry circuit 117, and a computer 118.
- the computer 118 includes an input unit 119 (eg, pointing device, keyboard, etc.), a graphical user interface (GUI) for measurement results and various operations. ) and the like are connected.
- GUI graphical user interface
- the control circuit 116 of the overall control unit 121 is connected to each component to control the entire device. You can also
- the analysis by the automatic analyzer 100 is mainly performed as follows. First, the sample 102 placed on the sample disk 101 is dispensed from the sample vessel 103 to the reaction vessel 202 on the reaction disk 104 by the sample dispensing mechanism 106 . After that, the reaction container 202 containing the sample 102 is moved to the reagent dispensing position by the rotation of the reaction disk 104, and the reagent dispensing mechanism 110 transfers the reagent 108 used for analysis from the reagent container 109 to the sample 102. Dispense into reaction vessel 202 containing. A mixed liquid of the sample 102 and the reagent 108 contained in the reaction container 202 is called a reaction liquid 122 .
- reaction liquid 122 in the reaction vessel 202 is degassed by the sound wave irradiation mechanism 111 , the reaction liquid 122 in the reaction vessel 202 is stirred by the stirring mechanism 112 .
- the reaction vessel 202 is maintained at a constant temperature, for example, 37° C., by the constant temperature bath circulating liquid 113 filled in the lower part of the reaction disk 104, thereby promoting the reaction and stabilizing the progress of the reaction.
- reaction liquid 122 in the reaction container 202 passes through the photometry mechanism 114 as the reaction disk 104 rotates, its optical characteristic change is measured via the photometry circuit 117 .
- the photometric data thus obtained are sent to the computer 118, and the concentration of the target component in the sample is obtained by the calculation unit 123 in the computer 118, and the obtained data are stored in the data storage unit 124. , the results are displayed on the output unit 120 .
- the reaction vessel 202 is cleaned by the reaction vessel cleaning mechanism 115 and either used repeatedly for the next reaction or disposed of in a reaction vessel disposal section (not shown).
- FIG. 2 is a schematic diagram showing the connection relationship between the automatic analyzer 100 and the server 200. As shown in FIG. Since there may be a plurality of automatic analyzers 100, they are distinguished by alphabetic suffixes in FIG.
- the automatic analyzer 100A transmits measurement result data (data describing the results of measuring the reaction process of the sample) to the server 200 via the overall control unit 121A, and the automatic analyzer 100B transmits the data via the overall control unit 121B. It transmits measurement result data to the server 200 .
- the server 200 (prediction line calculator) accumulates measurement result data collected from the automatic analyzer 100 .
- Measurement result data includes all absorbance and luminescence amounts obtained in one analysis (e.g., 38 times), measurement items, reagent manufacturing lot numbers, concentration values of measurement results, and existing automatic analyzer 100 recognizable. It suffices if it has the presence or absence of an abnormality (data alarm), and incidental information such as patient information is unnecessary.
- the calculation unit 210 included in the server 200 determines the accuracy of the measurement result data by performing the procedure described later using the accumulated measurement result data.
- the arithmetic unit 210 can be configured by hardware such as a circuit device that implements the function, or by executing software that implements the function by an arithmetic unit such as a CPU (Central Processing Unit). can.
- a CPU Central Processing Unit
- Figure 3 is an example of a standard reaction process model.
- a standard reaction process model is data describing measurement results obtained in a standard reaction process of a sample.
- the calculation unit 210 generates a standard reaction process model for each sample component concentration according to the procedure described later.
- FIG. 3 illustrates four standard reaction process models 301-304.
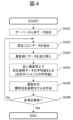
- FIG. 4 is a flow chart explaining the procedure for the calculation unit 210 to create a standard reaction process model. This flowchart can be implemented, for example, at a monthly model update event. Each step in FIG. 4 will be described below.
- the calculation unit 210 acquires measurement result data accumulated in the server 200 (S401).
- the calculation unit 210 extracts the reaction process (time-series measurement results) for each measurement item described in the measurement result data (S402).
- the calculation unit 210 arranges the measurement result data, for example, for each concentration of the sample component (S403). For example, approximately 100 pieces of measurement result data are associated with one sample concentration.
- the calculation unit 210 calculates an average value between measurement result data of similar sample concentrations. For example, assume that 100 reaction process data classified into concentrations A are collected. Each reaction process, as illustrated in FIG. 3, is described, for example, starting from the first absorbance measurement result to the 38th absorbance measurement result. The calculation unit 210 averages the values of the 100 reaction processes for the first measurement result. Similarly, 100 reaction processes are averaged for the 2nd to 38th measurement results. This results in an averaged reaction course for each sample component concentration.
- the calculation unit 210 may exclude the measurement result data from the targets of the averaging process as an outlier.
- the threshold is, for example, a standard deviation that can be calculated when averaging.
- the calculation unit 210 may perform another averaging process on the measurement result data group from which the outliers are excluded. This provides a good mean value (ie a better standard reaction process model).
- the calculation unit 210 saves the reaction process for each concentration obtained as a result of the averaging process in S404 as a standard reaction process model.
- the standard reaction process model for concentration A is standard reaction process model 301 in FIG.
- standard reaction process models are stored for concentration B (standard reaction process model 302), concentration C (standard reaction process model 303), concentration D (standard reaction process model 304), and so on.
- Fig. 5 is a diagram explaining the procedure for creating a prediction line for the reaction process. If the measurement result data is normal, the change over time of the measurement result after a certain measurement point is predicted to be similar to that of the standard reaction process model.
- the calculation unit 210 creates a reaction process prediction line by connecting the data points of the measurement results within a certain measurement point range to the data points of the standard reaction process model at subsequent measurement points. In the example shown in FIG. 5, the procedure for creating prediction lines for the 20th and subsequent measurement points is shown.
- the computing unit 210 identifies the standard reaction process model that best matches the 20th to 23rd data points 501 .
- This standard reaction process model is tentatively referred to as standard reaction process model 1 .
- the calculation unit 210 creates a prediction line 511 by connecting the 24th to 38th data points of the standard reaction process model 1 to the data points 501 .
- the computing unit 210 identifies the standard reaction process model that best matches the 20th to 24th data points 502 .
- This standard reaction process model is tentatively referred to as standard reaction process model 2 .
- the calculation unit 210 creates a prediction line 512 by connecting the 25th to 38th data points of the standard reaction process model 2 to the data points 502 .
- the computing unit 210 identifies the standard reaction process model that best matches the 20th to 25th data points 503 .
- This standard reaction process model is tentatively referred to as standard reaction process model 3 .
- the calculation unit 210 creates a prediction line 513 by connecting the 26th to 38th data points of the standard reaction process model 3 to the data points 503 .
- the computing unit 210 identifies the standard reaction process model that best matches the 20th to 26th data points 504 .
- This standard reaction process model is tentatively referred to as standard reaction process model 4 .
- the calculation unit 210 creates a prediction line 514 by connecting the 27th to 38th data points of the standard reaction process model 4 to the data points 504 .
- FIG. 6 is a diagram illustrating the result of creating a prediction line using abnormal measurement result data.
- computation unit 210 creates the following prediction lines, similar to FIG. 5: (a) creates prediction line 611 for data point 601; (c) generate prediction line 613 for data point 603; (d) generate prediction line 614 for data point 604;
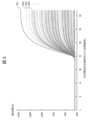
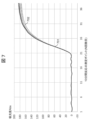
- FIG. 7 is a graph showing the result of superimposing the prediction line created using the normal measurement result data together with the measurement result data.
- Measurement result data 701 (solid line) indicates the actual measurement result.
- a prediction line 702 (dotted line) is each prediction line created by the procedure described in FIGS.
- the calculation unit 210 presents the result of overwriting these on one graph.
- the presentation format may be, for example, screen display on a display provided in the server 200, or output data describing overwritten graphs to an appropriate medium. It can be seen that the prediction lines created using normal measurement result data are grouped within a narrow range as shown in FIG.
- FIG. 8 is a graph showing the result of superimposing the prediction line created using the abnormal measurement result data together with the measurement result data. It can be seen that the prediction lines created using the abnormal measurement result data are scattered over a wide range as shown in FIG.
- the prediction lines are clustered within a narrow range (i.e., each prediction line roughly represents the same reaction process) or scattered over a wide range (i.e., each prediction line It is possible to evaluate whether the measurement result data is normal or not, depending on whether the reaction processes are different from each other). Furthermore, by overwriting as shown in FIGS. 7-8, the evaluation can be performed visually.
- FIGS. 9A and 9B are flowcharts for explaining the procedure by which the calculation unit 210 determines the accuracy of the measurement result data using the prediction line. This flowchart can be implemented in order to determine the accuracy of the measurement result data after the automatic analyzer 100 acquires the measurement result data of the actual sample. Each step in FIG. 9A will be described below.
- the calculation unit 210 acquires sample measurement result data from the automatic analyzer 100 .
- the calculation unit 210 extracts standard reaction process data for each measurement item.
- a measurement item corresponds to, for example, a component contained in a sample.
- the calculation unit 210 sets one of the data points in the measurement result data as (a) the prediction start point, (b) the prediction end point, and (c) the base point.
- the number of data points to be used as these points can be determined in advance.
- the prediction start point is the start point of the data points of the measurement result data compared when creating the prediction line, and is the 20th point in the examples of FIGS.
- the prediction end point is the end point of the data points of the measurement result data compared when creating the prediction line, for example, the 30th point. If it is known in advance that points 1-19 have a low correlation between concentrations and measurements, these data points are unnecessary in constructing the prediction line. Similarly, if the 31st to 38th points are also low in correlation, these data points are unnecessary. To exclude these data points, we decided to set a prediction start point and a prediction end point.
- the base point is, for example, the 23rd point. Base points are used in steps described later.
- FIG. 9A Step S903
- the calculator 210 compares the data points in the measurement results to a standard reaction course model.
- the comparison procedure is the same as that described with reference to FIGS. However, a simplified comparison procedure can also be used, as described below.
- FIGS. 5 and 6 show such an example.
- the number of data points to be compared with the standard reaction process model is gradually increased from the 20th point as the starting point, but the number of data points to be compared with the standard reaction process model is limited to this. not a thing
- the calculation unit 210 may compare the latest measured value of the N-th point and the measured value of the (N-1)-th point one before that with the standard reaction process model.
- FIG. 9A shows such an example.
- Fig. 9A Step S903: Supplement 2
- the standard reaction process model with the highest matching accuracy should be selected through the following S904 to S906.
- the calculation unit 210 calculates the number of the standard reaction process model closest to the specimen (model N B ).
- the reason why the standard reaction process model is specified by the reaction process up to the base point is that it is known in advance that the measurement results up to this point have the highest correlation with the standard reaction process model. NB is used in correction processing, which will be described later.
- the calculation unit 210 identifies the standard reaction process model NS that best matches the measured values from the first point to the prediction start point (20th point). This corresponds to specifying the standard reaction process model 1 described in FIGS.
- the calculation unit 210 similarly selects the standard reaction process model that best matches the measured values of the 1st to 21st points, the standard reaction process model that best matches the measured values of the 1st to 22nd points, . Identify the standard reaction course model NE that best matches the measurements up to point (thirtieth point).
- the calculation unit 210 can specify one or more of each of the models N S to N E in S905. If multiple models are identified, the one that best matches the measurement result data is identified. Specifically, those that best match model N B are identified as models N S to N E , respectively.
- the calculation unit 210 creates a prediction line for each measurement point from the prediction start point to the prediction end point. Specifically, the prediction line is obtained by performing the procedure described with reference to FIG. 5 (or S903: the simplified procedure described in the supplement) for the prediction start point to the prediction end point. This step corresponds to creating the prediction lines described with reference to FIGS.
- Step S908 The calculation unit 210 overwrites the prediction line for each measurement point and the reaction process of the sample at the 1st to 38th points on one screen. This step corresponds to creating the overwritten graph described with reference to FIGS.
- the calculation unit 210 sums (a) the amount of deviation between the prediction lines for each measurement point, and (b) the amount of deviation between the 38th data point and the prediction line in the reaction process of the specimen, and the total The value is calculated as the reaction accuracy for that specimen. If the reaction accuracy exceeds the threshold, an alarm is output to notify that there is an abnormality in the sample.
- a deviation between the standard reaction process model and the prediction line can be used as the threshold in this step.
- the threshold may be three times the standard deviation.
- the server 200 (prediction line calculation device) according to the first embodiment collects a plurality of reaction process data and uses them (for example, by averaging) to acquire a standard reaction process model, and using this, Determine the accuracy of measurement result data. Therefore, the accuracy of measurement result data can be determined without preparing a specific sample such as a known concentration sample in advance. As a result, it is possible to reduce the burden on the manufacturer side for preparing a specific sample.
- the server 200 creates a prediction line by connecting the data points of the standard reaction process model to the data points in the process of acquiring the data points of the measurement result data, and the prediction line and the measurement result An alert can be sent when the degree of divergence between data exceeds a threshold. Therefore, it is possible to determine the presence or absence of an abnormality during the course of the reaction before the analysis is completed. This allows the user to quickly prepare for retesting.
- Embodiment 2 of the present invention describes a specific example of S909. Other configurations are the same as those of the first embodiment.
- FIG. 10 is an example of plotting changes over time in the degree of divergence in S909.
- Plots 1001 to 1003 represent the reaction accuracies (the sum of the discrepancies (a) and (b) calculated in S909) when samples 1 to 3 are analyzed with reagent lot 1 for item A.
- FIG. Plots 1004-1007 represent the reaction accuracy when analytes 4-1 are analyzed with reagent lot 2 for Item A.
- the reaction accuracy of plot 1004 which changed from reagent lot 1 to reagent lot 2 has a large divergence from the reaction accuracy of plot 1003. If this divergence is small, it is suggested that the difference in reagent components is small even if the reagent lot is changed, so it can be said that there is no need to re-execute calibration or the like. On the other hand, if this divergence is large, it suggests that there is a difference in the reagent components when the reagent lot changes, so it is desirable to re-execute the calibration. Therefore, the calculation unit 210 recommends the user to perform calibration.
- the calculation unit 210 suggests to the user the possibility of deterioration of the reagent and recommending its replacement.
- the calculation unit 210 recommends replacing the consumables of the automatic analyzer 100, such as the light source and detector. .
- the calculation unit 210 can also predict future changes in reaction accuracy over time by fitting the plots shown in FIG. This makes it possible to predict when the reaction accuracy will exceed the threshold.
- the server 200 calculates the accuracy of the measurement result data by totaling the deviation between the prediction lines and the deviation between the prediction line and the measurement result data. Whether or not there is an abnormality in the measurement result data is determined according to the change over time. As a result, the accuracy of measurement results can be determined without the need for the time required to prepare samples of known concentrations for quality control in advance, the time required to analyze the samples of known concentrations, the cost of reagents, and the like. .
- the reaction accuracy when the reaction accuracy does not exceed the threshold, but the plot changes over time (for example, the plot 1004 in FIG. 10, the difference between the plot 1004 and the previous plot is smaller than the threshold value on the vertical axis of FIG. 10), calibration can be prompted. Also, if there is only one measurement item whose reaction accuracy exceeds the threshold, it is possible to suggest the possibility of reagent deterioration or the like. Furthermore, if there are two or more measurement items for which the reaction accuracy exceeds the threshold, replacement of the consumable parts provided in the automatic analyzer 100 can be prompted.
- the server 200 determines the content of the alert according to the number of items whose reaction accuracy exceeds the threshold, this number can be set arbitrarily. Therefore, it should be added that the above numerical values regarding the number are an example. However, if the number is large, replacement of the consumables is recommended, and if the number is smaller than that, it suggests reagent deterioration, etc., which is the same regardless of the number.
- Embodiment 3 of the present invention an example of analyzing the water content of human skin will be described as an example of sample components analyzed by the automatic analyzer 100 .
- the configuration of the automatic analyzer 100 is the same as in the first and second embodiments.
- Fig. 11 shows a standard reaction process model for two measurement items.
- a model 901 shows changes in the water content of the basal layer inside the skin of the skin model 1 .
- models 902-907 show changes in water content in the basal layer of skin models 2-7.
- Models 1001 to 1007 show changes in water content of stratum corneum on the skin surface of skin models 1 to 7 . Therefore, model 901 and model 1001 are associated, and similarly models 902 to 907 and models 1002 to 1007 are associated, respectively.
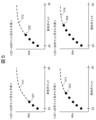
- FIG. 12A is a graph exemplifying changes in water content over time when subject A used a sample of skin care product A.
- FIG. In this example, measurement results are shown at the beginning of use, 5 days after the start of use, and 10 days after the start of use.
- Plot 1501 is the result of measuring the water content of the basal layer inside the skin.
- Plot 1502 is the result of measuring the water content of the stratum corneum on the surface of the skin.
- the calculation unit 210 identifies the one that is closest to the plot 1501 from among the models 901 to 907 of changes in the moisture content of the basal layer inside the skin.
- the model 907 is assumed to be the closest.
- Calculator 210 creates prediction line 1107 by connecting data points from day 10 onwards of model 907 to plot 1501 .
- Calculator 210 similarly creates prediction line 1207 by connecting data points from day 10 onwards of model 907 and corresponding model 1007 to plot 1502 .
- the calculation unit 210 will Subject A can be recommended to purchase skin care product A. Further, the calculation unit 210 indicates to the subject A that it is predicted that the condition of the stratum corneum on the skin surface will improve after one month with continuous use of the skin care product A, and recommends that the subject A purchase the skin care product A. You can justify it. If the subject A can actually feel that the condition of the stratum corneum on the skin surface has improved after one month by actually continuously using the skin care product A, the reliability of the above prediction is indicated. can be done.
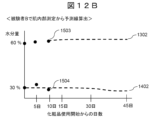
- FIG. 12B is a graph exemplifying changes in water content over time when Subject B used a sample of skin care product A.
- Plot 1503 is the result of measuring the water content of the basal layer inside the skin.
- Plot 1504 is the result of measuring the water content of the stratum corneum on the surface of the skin.
- the computing unit 210 identifies the one that best matches the plot 1503 from among the models 901 to 907.
- the model 902 is assumed to be the closest.
- Calculator 210 creates prediction line 1302 by connecting data points from day 10 onwards of model 902 to plot 1503 .
- Computing unit 210 similarly creates prediction line 1402 by connecting data points from day 10 onwards of model 902 and corresponding model 1002 to plot 1504 .
- the calculation unit 210 can suggest to the subject B that the subject B use or purchase the skin care product B, which has good compatibility with the use effect, instead of the skin care product A. Further, the calculation unit 210 indicates to the subject B that the condition of the stratum corneum on the skin surface is expected to improve after one month by continuously using the skin care product B, and purchases the skin care product B. can provide a rationale for recommending that If the subject B can actually feel that the condition of the stratum corneum on the surface of the skin has improved after one month by continuously using the skin care product B, the reliability of the above prediction is indicated. can be done.
- the prediction line and measurement result data can be overwritten on one screen.
- the prediction error is large if the deviation between the prediction lines is large, and that the prediction error is small if the deviation between the prediction lines is small.
- the calculation unit 210 uses the data used when creating the standard reaction process model or the actually measured measurement result data to calculate the statistics of the probability that the next actually measured measurement result data falls between the prediction lines. You can keep it. As a result, for example, when the user uses a sample of skin care product A for 10 days, it is possible to display the probability that the future measurement result (moisture content) will fall between the prediction lines at the same time as the prediction lines are overlaid.
- the present invention is not limited to the embodiments described above, and includes various modifications.
- the above-described embodiments have been described in detail in order to explain the present disclosure in an easy-to-understand manner, and are not necessarily limited to those having all the described configurations.
- part of the configuration of one embodiment can be replaced with the configuration of another embodiment, and the configuration of another embodiment can be added to the configuration of one embodiment.
- the server 200 determines the accuracy of the measurement result data acquired by the automatic analyzer 100. Accuracy may be determined.
- the overall control unit 121 can be configured in the same manner as the calculation unit 210, and the automatic analysis device 100 functions as a prediction line calculation device.
- the server 200 collects measurement result data through communication from the automatic analyzer 100, but the method of collecting measurement result data is not limited to this. Also, instead of measuring the reaction process of the specimen, the reaction process of a sample of known concentration may be collected. Furthermore, an ideal reaction process may be generated by simulation or the like and collected.
- the device for measuring the moisture content of human skin does not necessarily have to be the automatic analyzer 100 described in the first embodiment.
- the present invention can be applied to the measurement results as long as the measurement results can be acquired from a device capable of measuring at least the moisture content of human skin and analyzed.
Abstract
The objective of the present invention is to provide an automated analyzing device capable of obtaining information to be used for detecting an analysis abnormality in the course of an analysis step, without analyzing in advance a specimen having a known concentration. An automated analyzing device according to the present invention acquires a standard reaction process model from among a plurality of reaction processes, and generates a prediction line by applying a data point in the standard reaction process model to measurement result data of the reaction process (see Fig. 5).
Description
本発明は、試料が有する成分を分析する自動分析装置が計測した結果の予測線を計算する技術に関する。
The present invention relates to a technique for calculating prediction lines of results measured by an automatic analyzer that analyzes the components of samples.
臨床検査用の自動分析装置は、血液や尿などの試料を、試料分注機構によって試料容器から反応容器に対して分注し、試料を分注した反応容器に対して、試薬容器から試薬分注機構によって試薬を分注し、攪拌する。その後、一定の時間反応させ、反応液から得られる吸光度や発光量などを測定することにより、試料中に含まれる対象項目の濃度を演算する。
Automated analyzers for clinical testing use a sample dispensing mechanism to dispense samples such as blood and urine from sample containers into reaction containers, and then dispense reagents from reagent containers into the reaction containers into which the samples have been dispensed. The reagent is dispensed and stirred by the dosing mechanism. After that, the concentration of the target item contained in the sample is calculated by reacting for a certain period of time and measuring the absorbance, luminescence, etc. obtained from the reaction solution.
試料と試薬が反応している間、吸光度や発光量を時系列に記憶し(例:10分間の間に、38回、吸光度や発光量を取得し、時系列的に記憶する(以後、反応過程と記載する))、その時系列変化について意図しない変化の有無を判定する。意図しない変化がある場合、自動分析装置からユーザに対して、当該項目の分析において異常があったことを知らせることができる。
While the sample and the reagent are reacting, absorbance and luminescence are memorized in chronological order (e.g. absorbance and luminescence are acquired 38 times in 10 minutes and memorized in chronological order (hereafter referred to as reaction described as a process)), and the presence or absence of unintended changes in the time-series changes is determined. If there is an unintended change, the automatic analyzer can inform the user that there was an abnormality in the analysis of the item.
特許文献1は、N回目に取得した吸光度または発光量と、反応過程に対してあらかじめ当てはめた近似曲線との間の乖離から、異常の有無を判定する自動分析装置について開示している。
Patent Document 1 discloses an automatic analyzer that determines the presence or absence of an abnormality from the deviation between the absorbance or luminescence amount obtained for the Nth time and the approximated curve applied in advance to the reaction process.
特許文献2は、精度管理試料などの既知濃度の試料から化学反応モデルを取得して記憶しておき、試料の吸光度変化量または吸光度変化率から、基準反応過程を算出し、基準反応過程と試料の反応過程との間の乖離から、異常の有無を判定する自動分析装置について開示している。
Patent Document 2 acquires and stores a chemical reaction model from a sample of known concentration such as a quality control sample, calculates a reference reaction process from the amount of change in absorbance or the rate of change in absorbance of the sample, and calculates the reference reaction process and the sample. Disclosed is an automatic analyzer that determines the presence or absence of an abnormality from the divergence between the reaction process of
特許文献1~2においては、分析が終了しないと異常の有無を判定できない。異常の有無を速やかに判定するためには、分析過程においてその有無を判定するために用いることができる情報を得ることが望ましいといえる。
In Patent Documents 1 and 2, the presence or absence of an abnormality cannot be determined until the analysis is finished. In order to quickly determine the presence or absence of an abnormality, it is desirable to obtain information that can be used to determine the presence or absence of the abnormality in the analysis process.
また特許文献2においては、既知濃度の試料によってあらかじめ化学反応モデルを準備しておく必要がある。しかし、既知濃度試料を準備するための時間、その既知濃度試料を分析するために係る時間、試薬のコスト、などは臨床検査における負担になっている。したがって、既知濃度試料を用いることなく異常の有無を判定するために用いることができる情報を得ることが望ましいといえる。
Also, in Patent Document 2, it is necessary to prepare a chemical reaction model in advance using a sample of known concentration. However, the time required to prepare a sample of known concentration, the time required to analyze the sample of known concentration, the cost of reagents, and the like are burdensome in clinical testing. Therefore, it is desirable to obtain information that can be used to determine the presence or absence of abnormalities without using a sample of known concentration.
本発明は、以上のような課題に鑑みてなされたものであり、既知濃度試料をあらかじめ分析することなく、分析工程の途中において分析の異常を検出するために用いる情報を得ることができる、自動分析装置を提供することを目的とする。
The present invention has been made in view of the above problems, and is capable of obtaining information used for detecting analysis abnormalities during the analysis process without previously analyzing a sample of known concentration. An object is to provide an analyzer.
本発明に係る自動分析装置は、複数の反応過程から標準反応過程モデルを取得し、前記反応過程の計測結果データに対して前記標準反応過程モデル内のデータ点を加えることにより予測線を生成する。
The automatic analyzer according to the present invention acquires a standard reaction process model from a plurality of reaction processes, and generates a prediction line by adding data points in the standard reaction process model to measurement result data of the reaction process. .
本発明に係る自動分析装置によれば、既知濃度試料をあらかじめ分析することなく、分析工程の途中において分析の異常を検出するために用いる情報を得ることができる。上記した以外の課題、構成、効果などについては、以下の実施形態の説明により明らかにされる。
According to the automatic analyzer of the present invention, it is possible to obtain information used for detecting analysis abnormalities during the analysis process without previously analyzing a sample of known concentration. Problems, configurations, effects, etc. other than those described above will be clarified by the following description of the embodiments.
<実施の形態1>
図1は、本開示の実施形態1に係る自動分析装置100の全体構成図である。自動分析装置100は、主として、試料ディスク101、反応ディスク104、試料分注機構106、試薬ディスク107、試薬分注機構110、音波照射機構111、攪拌機構112、測光機構114、反応容器洗浄機構115、全体制御部121を有している。試料ディスク101には、試料102を収容する試料容器103がその同心円状に配置されている。反応ディスク104には、反応容器202がその同心円状に配置されるとともに、配置された反応容器202は恒温槽循環液体113によって一定温度に保たれている。試薬ディスク107には、種々の試薬108を収容する試薬容器109がその同心円状に配置されている。 <Embodiment 1>
FIG. 1 is an overall configuration diagram of anautomatic analyzer 100 according to Embodiment 1 of the present disclosure. The automatic analyzer 100 mainly includes a sample disk 101, a reaction disk 104, a sample dispensing mechanism 106, a reagent disk 107, a reagent dispensing mechanism 110, a sound wave irradiation mechanism 111, a stirring mechanism 112, a photometry mechanism 114, and a reaction vessel cleaning mechanism 115. , and an overall control unit 121 . A sample container 103 containing a sample 102 is concentrically arranged on the sample disk 101 . Reaction vessels 202 are concentrically arranged on the reaction disk 104 , and the arranged reaction vessels 202 are kept at a constant temperature by the constant temperature bath circulating liquid 113 . Reagent containers 109 containing various reagents 108 are arranged concentrically on the reagent disk 107 .
図1は、本開示の実施形態1に係る自動分析装置100の全体構成図である。自動分析装置100は、主として、試料ディスク101、反応ディスク104、試料分注機構106、試薬ディスク107、試薬分注機構110、音波照射機構111、攪拌機構112、測光機構114、反応容器洗浄機構115、全体制御部121を有している。試料ディスク101には、試料102を収容する試料容器103がその同心円状に配置されている。反応ディスク104には、反応容器202がその同心円状に配置されるとともに、配置された反応容器202は恒温槽循環液体113によって一定温度に保たれている。試薬ディスク107には、種々の試薬108を収容する試薬容器109がその同心円状に配置されている。 <
FIG. 1 is an overall configuration diagram of an
全体制御部121は、制御回路116、測光回路117、コンピュータ118を備え、コンピュータ118には、入力部119(例えば、ポインティングデバイス、キーボード、等)、測定結果や各種操作に係るグラフィカルユーザインターフェース(GUI)等を表示する出力部120が接続されている。なお、図1の例では、全体制御部121の制御回路116が各々の構成部と接続され、装置全体を制御する構成となっているが、構成部ごとに独立した制御部を備えるように構成することもできる。
The overall control unit 121 includes a control circuit 116, a photometry circuit 117, and a computer 118. The computer 118 includes an input unit 119 (eg, pointing device, keyboard, etc.), a graphical user interface (GUI) for measurement results and various operations. ) and the like are connected. In the example of FIG. 1, the control circuit 116 of the overall control unit 121 is connected to each component to control the entire device. You can also
自動分析装置100による分析は、主に以下のように実施される。まず、試料ディスク101に設置された試料102が試料容器103から、反応ディスク104上の反応容器202に、試料分注機構106により分注される。その後、試料102が収容された反応容器202は、反応ディスク104の回転動作により、試薬分注位置まで移動し、試薬分注機構110が、分析に使用する試薬108を試薬容器109から試料102の入った反応容器202へと分注する。反応容器202内に収容された試料102と試薬108との混合液を反応液122という。続いて、音波照射機構111により反応容器202内の反応液122が脱気された後、攪拌機構112により反応容器202内の反応液122の攪拌が行われる。反応容器202は反応ディスク104の下部に満たされた恒温槽循環液体113によって、一定の温度、例えば37℃に保たれており、反応の促進と反応の進行の安定化が図られている。
The analysis by the automatic analyzer 100 is mainly performed as follows. First, the sample 102 placed on the sample disk 101 is dispensed from the sample vessel 103 to the reaction vessel 202 on the reaction disk 104 by the sample dispensing mechanism 106 . After that, the reaction container 202 containing the sample 102 is moved to the reagent dispensing position by the rotation of the reaction disk 104, and the reagent dispensing mechanism 110 transfers the reagent 108 used for analysis from the reagent container 109 to the sample 102. Dispense into reaction vessel 202 containing. A mixed liquid of the sample 102 and the reagent 108 contained in the reaction container 202 is called a reaction liquid 122 . Subsequently, after the reaction liquid 122 in the reaction vessel 202 is degassed by the sound wave irradiation mechanism 111 , the reaction liquid 122 in the reaction vessel 202 is stirred by the stirring mechanism 112 . The reaction vessel 202 is maintained at a constant temperature, for example, 37° C., by the constant temperature bath circulating liquid 113 filled in the lower part of the reaction disk 104, thereby promoting the reaction and stabilizing the progress of the reaction.
反応容器202内の反応液122は、反応ディスク104の回転動作に伴い、測光機構114を通過するときにその光学特性変化が測光回路117を介して測定される。このようにして得られた測光データは、コンピュータ118に送られ、コンピュータ118内の演算部123によって、試料中の対象成分の濃度が求められるとともに、得られたデータはデータ記憶部124に記憶され、出力部120に結果が表示される。反応後の反応容器202は、反応容器洗浄機構115により洗浄され、次の反応に繰り返し使用される、あるいは、図示しない反応容器廃棄部に廃棄される。
When the reaction liquid 122 in the reaction container 202 passes through the photometry mechanism 114 as the reaction disk 104 rotates, its optical characteristic change is measured via the photometry circuit 117 . The photometric data thus obtained are sent to the computer 118, and the concentration of the target component in the sample is obtained by the calculation unit 123 in the computer 118, and the obtained data are stored in the data storage unit 124. , the results are displayed on the output unit 120 . After the reaction, the reaction vessel 202 is cleaned by the reaction vessel cleaning mechanism 115 and either used repeatedly for the next reaction or disposed of in a reaction vessel disposal section (not shown).
図2は、自動分析装置100とサーバ200との間の接続関係を示す模式図である。自動分析装置100は複数存在する場合もあるので、図2においてはこれらをアルファベットの添字によって区別している。自動分析装置100Aは全体制御部121Aを介してサーバ200に対して計測結果データ(試料の反応過程を計測した結果を記述したデータ)を送信し、自動分析装置100Bは全体制御部121Bを介してサーバ200に対して計測結果データを送信する。
FIG. 2 is a schematic diagram showing the connection relationship between the automatic analyzer 100 and the server 200. As shown in FIG. Since there may be a plurality of automatic analyzers 100, they are distinguished by alphabetic suffixes in FIG. The automatic analyzer 100A transmits measurement result data (data describing the results of measuring the reaction process of the sample) to the server 200 via the overall control unit 121A, and the automatic analyzer 100B transmits the data via the overall control unit 121B. It transmits measurement result data to the server 200 .
サーバ200(予測線計算装置)は、自動分析装置100から収集した計測結果データを蓄積する。計測結果データは、1回の分析で取得する吸光度や発光量のすべて(例:38回分)、測定項目、試薬の製造ロット番号、測定結果の濃度値、既存の自動分析装置100が認識可能な異常有無(データアラーム)などを有していればよく、患者情報などの付帯的な情報は不要である。
The server 200 (prediction line calculator) accumulates measurement result data collected from the automatic analyzer 100 . Measurement result data includes all absorbance and luminescence amounts obtained in one analysis (e.g., 38 times), measurement items, reagent manufacturing lot numbers, concentration values of measurement results, and existing automatic analyzer 100 recognizable. It suffices if it has the presence or absence of an abnormality (data alarm), and incidental information such as patient information is unnecessary.
サーバ200が備える演算部210は、蓄積した計測結果データを用いて、後述する手順を実施することにより、計測結果データの正確性を判定する。演算部210は、その機能を実装した回路デバイスなどのハードウェアによって構成することもできるし、その機能を実装したソフトウェアをCPU(Central Processing Unit)などの演算装置が実行することによって構成することもできる。
The calculation unit 210 included in the server 200 determines the accuracy of the measurement result data by performing the procedure described later using the accumulated measurement result data. The arithmetic unit 210 can be configured by hardware such as a circuit device that implements the function, or by executing software that implements the function by an arithmetic unit such as a CPU (Central Processing Unit). can.
図3は、標準反応過程モデルの例である。標準反応過程モデルは、試料の標準的な反応過程において得られる計測結果を記述したデータである。演算部210は、後述する手順にしたがって、試料成分の濃度ごとに標準反応過程モデルを生成する。図3においては4つの標準反応過程モデル301~304を例示した。
Figure 3 is an example of a standard reaction process model. A standard reaction process model is data describing measurement results obtained in a standard reaction process of a sample. The calculation unit 210 generates a standard reaction process model for each sample component concentration according to the procedure described later. FIG. 3 illustrates four standard reaction process models 301-304.
図4は、演算部210が標準反応過程モデルを作成する手順を説明するフローチャートである。本フローチャートは、例えば月1回のモデル更新イベントなどにおいて実施することができる。以下図4の各ステップを説明する。
FIG. 4 is a flow chart explaining the procedure for the calculation unit 210 to create a standard reaction process model. This flowchart can be implemented, for example, at a monthly model update event. Each step in FIG. 4 will be described below.
(図4:ステップS401~S403)
演算部210は、サーバ200が蓄積している計測結果データ取得する(S401)。演算部210は、計測結果データが記述している測定項目ごとに、反応過程(時系列に沿った計測結果)を抽出する(S402)。演算部210は、例えば試料成分の濃度毎に、計測結果データを整列する(S403)。例えば100個程度の計測結果データを1つの試料濃度と対応させる。 (Fig. 4: Steps S401 to S403)
Thecalculation unit 210 acquires measurement result data accumulated in the server 200 (S401). The calculation unit 210 extracts the reaction process (time-series measurement results) for each measurement item described in the measurement result data (S402). The calculation unit 210 arranges the measurement result data, for example, for each concentration of the sample component (S403). For example, approximately 100 pieces of measurement result data are associated with one sample concentration.
演算部210は、サーバ200が蓄積している計測結果データ取得する(S401)。演算部210は、計測結果データが記述している測定項目ごとに、反応過程(時系列に沿った計測結果)を抽出する(S402)。演算部210は、例えば試料成分の濃度毎に、計測結果データを整列する(S403)。例えば100個程度の計測結果データを1つの試料濃度と対応させる。 (Fig. 4: Steps S401 to S403)
The
(図4:ステップS404)
演算部210は、近い試料濃度の計測結果データ同士で平均値を計算する。例えば濃度Aに分類された100個の反応過程データを収集したと仮定する。各反応過程は、図3に例示するように、例えば1回目の吸光度計測結果から開始して、38回目の吸光度計測結果までを記述している。演算部210は、1回目の計測結果について、100個の反応過程それぞれの値を平均する。同様に2~38回目の計測結果について、100個の反応過程を平均する。これにより、試料成分の濃度ごとに、平均化された反応過程が得られることになる。 (Fig. 4: Step S404)
Thecalculation unit 210 calculates an average value between measurement result data of similar sample concentrations. For example, assume that 100 reaction process data classified into concentrations A are collected. Each reaction process, as illustrated in FIG. 3, is described, for example, starting from the first absorbance measurement result to the 38th absorbance measurement result. The calculation unit 210 averages the values of the 100 reaction processes for the first measurement result. Similarly, 100 reaction processes are averaged for the 2nd to 38th measurement results. This results in an averaged reaction course for each sample component concentration.
演算部210は、近い試料濃度の計測結果データ同士で平均値を計算する。例えば濃度Aに分類された100個の反応過程データを収集したと仮定する。各反応過程は、図3に例示するように、例えば1回目の吸光度計測結果から開始して、38回目の吸光度計測結果までを記述している。演算部210は、1回目の計測結果について、100個の反応過程それぞれの値を平均する。同様に2~38回目の計測結果について、100個の反応過程を平均する。これにより、試料成分の濃度ごとに、平均化された反応過程が得られることになる。 (Fig. 4: Step S404)
The
(図4:ステップS404:補足)
演算部210は、平均処理によって得られる反応過程と、計測結果データとの間に閾値以上の乖離がある場合は、その計測結果データは外れ値として平均処理の対象から除外してもよい。閾値は、例えば平均化するときに算出できる標準偏差である。演算部210は、外れ値を除外した計測結果データ群に対して、改めて平均処理を実施してもよい。これにより適切な平均値(すなわちより適切な標準反応過程モデル)を得ることができる。 (Fig. 4: Step S404: Supplement)
If there is a deviation of a threshold value or more between the reaction process obtained by the averaging process and the measurement result data, thecalculation unit 210 may exclude the measurement result data from the targets of the averaging process as an outlier. The threshold is, for example, a standard deviation that can be calculated when averaging. The calculation unit 210 may perform another averaging process on the measurement result data group from which the outliers are excluded. This provides a good mean value (ie a better standard reaction process model).
演算部210は、平均処理によって得られる反応過程と、計測結果データとの間に閾値以上の乖離がある場合は、その計測結果データは外れ値として平均処理の対象から除外してもよい。閾値は、例えば平均化するときに算出できる標準偏差である。演算部210は、外れ値を除外した計測結果データ群に対して、改めて平均処理を実施してもよい。これにより適切な平均値(すなわちより適切な標準反応過程モデル)を得ることができる。 (Fig. 4: Step S404: Supplement)
If there is a deviation of a threshold value or more between the reaction process obtained by the averaging process and the measurement result data, the
(図4:ステップS405)
演算部210は、S404における平均処理の結果として得られる濃度ごとの反応過程を、標準反応過程モデルとして保存する。例えば濃度Aの標準反応過程モデルは図3における標準反応過程モデル301である。同様に濃度B(標準反応過程モデル302)、濃度C(標準反応過程モデル303)、濃度D(標準反応過程モデル304)、・・・についても標準反応過程モデルを保存する。 (Fig. 4: Step S405)
Thecalculation unit 210 saves the reaction process for each concentration obtained as a result of the averaging process in S404 as a standard reaction process model. For example, the standard reaction process model for concentration A is standard reaction process model 301 in FIG. Similarly, standard reaction process models are stored for concentration B (standard reaction process model 302), concentration C (standard reaction process model 303), concentration D (standard reaction process model 304), and so on.
演算部210は、S404における平均処理の結果として得られる濃度ごとの反応過程を、標準反応過程モデルとして保存する。例えば濃度Aの標準反応過程モデルは図3における標準反応過程モデル301である。同様に濃度B(標準反応過程モデル302)、濃度C(標準反応過程モデル303)、濃度D(標準反応過程モデル304)、・・・についても標準反応過程モデルを保存する。 (Fig. 4: Step S405)
The
図5は、反応過程の予測線を作成する手順を説明する図である。計測結果データが正常である場合、ある計測ポイント以降の計測結果の経時変化は、標準反応過程モデルと同様であると予測される。演算部210は、ある計測ポイント範囲内の計測結果のデータ点に対してそれ以降の計測ポイントにおける標準反応過程モデルのデータ点を接続することにより、反応過程の予測線を作成する。図5に示す例においては、20回目以降の計測ポイントについて予測線を作成する手順を示した。
Fig. 5 is a diagram explaining the procedure for creating a prediction line for the reaction process. If the measurement result data is normal, the change over time of the measurement result after a certain measurement point is predicted to be similar to that of the standard reaction process model. The calculation unit 210 creates a reaction process prediction line by connecting the data points of the measurement results within a certain measurement point range to the data points of the standard reaction process model at subsequent measurement points. In the example shown in FIG. 5, the procedure for creating prediction lines for the 20th and subsequent measurement points is shown.
演算部210は、20~23ポイント目のデータ点501と最も合致する標準反応過程モデルを特定する。この標準反応過程モデルを仮に標準反応過程モデル1とする。演算部210は、標準反応過程モデル1の24~38ポイント目までのデータ点を、データ点501に対して接続することにより、予測線511を作成する。
The computing unit 210 identifies the standard reaction process model that best matches the 20th to 23rd data points 501 . This standard reaction process model is tentatively referred to as standard reaction process model 1 . The calculation unit 210 creates a prediction line 511 by connecting the 24th to 38th data points of the standard reaction process model 1 to the data points 501 .
演算部210は、20~24ポイント目のデータ点502と最も合致する標準反応過程モデルを特定する。この標準反応過程モデルを仮に標準反応過程モデル2とする。演算部210は、標準反応過程モデル2の25~38ポイント目までのデータ点を、データ点502に対して接続することにより、予測線512を作成する。
The computing unit 210 identifies the standard reaction process model that best matches the 20th to 24th data points 502 . This standard reaction process model is tentatively referred to as standard reaction process model 2 . The calculation unit 210 creates a prediction line 512 by connecting the 25th to 38th data points of the standard reaction process model 2 to the data points 502 .
演算部210は、20~25ポイント目のデータ点503と最も合致する標準反応過程モデルを特定する。この標準反応過程モデルを仮に標準反応過程モデル3とする。演算部210は、標準反応過程モデル3の26~38ポイント目までのデータ点を、データ点503に対して接続することにより、予測線513を作成する。
The computing unit 210 identifies the standard reaction process model that best matches the 20th to 25th data points 503 . This standard reaction process model is tentatively referred to as standard reaction process model 3 . The calculation unit 210 creates a prediction line 513 by connecting the 26th to 38th data points of the standard reaction process model 3 to the data points 503 .
演算部210は、20~26ポイント目のデータ点504と最も合致する標準反応過程モデルを特定する。この標準反応過程モデルを仮に標準反応過程モデル4とする。演算部210は、標準反応過程モデル4の27~38ポイント目までのデータ点を、データ点504に対して接続することにより、予測線514を作成する。
The computing unit 210 identifies the standard reaction process model that best matches the 20th to 26th data points 504 . This standard reaction process model is tentatively referred to as standard reaction process model 4 . The calculation unit 210 creates a prediction line 514 by connecting the 27th to 38th data points of the standard reaction process model 4 to the data points 504 .
正常な計測結果データに対して以上の手順によって予測線を作成した場合、標準反応過程モデル1~4は全て同じものであり、かつ予測線511~514も互いにほぼ同じ反応過程となる。
When a prediction line is created for normal measurement result data by the above procedure, standard reaction process models 1 to 4 are all the same, and prediction lines 511 to 514 are also almost the same reaction process.
図6は、異常な計測結果データを用いて予測線を作成した結果を例示する図である。この例において演算部210は、図5と同様に以下の予測線を作成する:(a)データ点601に対して予測線611を作成する;(b)データ点602に対して予測線612を作成する;(c)データ点603に対して予測線613を作成する;(d)データ点604に対して予測線614を作成する。
FIG. 6 is a diagram illustrating the result of creating a prediction line using abnormal measurement result data. In this example, computation unit 210 creates the following prediction lines, similar to FIG. 5: (a) creates prediction line 611 for data point 601; (c) generate prediction line 613 for data point 603; (d) generate prediction line 614 for data point 604;
異常な計測結果データに対して以上の手順によって予測線を作成した場合、標準反応過程モデル1~4のうち少なくともいずれかは他の標準反応過程モデルとは異なるものであり、かつ予測線611~614のうち少なくともいずれかは他の予測線とは異なる反応過程となる。
When a prediction line is created for abnormal measurement result data by the above procedure, at least one of the standard reaction process models 1 to 4 is different from the other standard reaction process models, and the prediction lines 611 to At least one of 614 has a different reaction process from the other prediction lines.
図7は、正常な計測結果データを用いて作成した予測線を計測結果データとともに重ね書きした結果を示すグラフである。計測結果データ701(実線)は実際の計測結果を示す。予測線702(点線)は図5~図6で説明した手順によって作成した各予測線である。演算部210は、これらを1つのグラフ上に重ね書きした結果を提示する。提示形式は、例えばサーバ200が備えるディスプレイ上で画面表示するものであってもよいし、重ね書きしたグラフを記述したデータを適当な媒体に対して出力するものであってもよい。正常な計測結果データを用いて作成した予測線は、図7に示すように狭い範囲内でまとまっていることが分かる。
FIG. 7 is a graph showing the result of superimposing the prediction line created using the normal measurement result data together with the measurement result data. Measurement result data 701 (solid line) indicates the actual measurement result. A prediction line 702 (dotted line) is each prediction line created by the procedure described in FIGS. The calculation unit 210 presents the result of overwriting these on one graph. The presentation format may be, for example, screen display on a display provided in the server 200, or output data describing overwritten graphs to an appropriate medium. It can be seen that the prediction lines created using normal measurement result data are grouped within a narrow range as shown in FIG.
図8は、異常な計測結果データを用いて作成した予測線を計測結果データとともに重ね書きした結果を示すグラフである。異常な計測結果データを用いて作成した予測線は、図8に示すように広い範囲に散らばっていることが分かる。
FIG. 8 is a graph showing the result of superimposing the prediction line created using the abnormal measurement result data together with the measurement result data. It can be seen that the prediction lines created using the abnormal measurement result data are scattered over a wide range as shown in FIG.
図7~図8に示すように、予測線が狭い範囲内にまとまっている(すなわち各予測線が概ね同じ反応過程を表している)か、あるいは広い範囲に散らばっている(すなわち各予測線が互いに異なる反応過程を表している)かによって、計測結果データが正常であるか否かを評価することができる。さらに図7~図8に示すように重ね書きすることにより、その評価を視覚的に実施できる。
As shown in FIGS. 7-8, the prediction lines are clustered within a narrow range (i.e., each prediction line roughly represents the same reaction process) or scattered over a wide range (i.e., each prediction line It is possible to evaluate whether the measurement result data is normal or not, depending on whether the reaction processes are different from each other). Furthermore, by overwriting as shown in FIGS. 7-8, the evaluation can be performed visually.
図9A~図9Bは、演算部210が予測線を用いて計測結果データの正確性を判定する手順を説明するフローチャートである。本フローチャートは、自動分析装置100が実際の検体の計測結果データを取得した後、その計測結果データの正確性を判定するために実施することができる。以下図9Aの各ステップについて説明する。
FIGS. 9A and 9B are flowcharts for explaining the procedure by which the calculation unit 210 determines the accuracy of the measurement result data using the prediction line. This flowchart can be implemented in order to determine the accuracy of the measurement result data after the automatic analyzer 100 acquires the measurement result data of the actual sample. Each step in FIG. 9A will be described below.
(図9A:ステップS901)
演算部210は、自動分析装置100から検体の計測結果データを取得する。演算部210は、測定項目ごとに、標準反応過程データを抽出する。測定項目は、例えば試料内に含まれる成分に対応する。 (FIG. 9A: Step S901)
Thecalculation unit 210 acquires sample measurement result data from the automatic analyzer 100 . The calculation unit 210 extracts standard reaction process data for each measurement item. A measurement item corresponds to, for example, a component contained in a sample.
演算部210は、自動分析装置100から検体の計測結果データを取得する。演算部210は、測定項目ごとに、標準反応過程データを抽出する。測定項目は、例えば試料内に含まれる成分に対応する。 (FIG. 9A: Step S901)
The
(図9A:ステップS902)
演算部210は、計測結果データ内のデータ点のうちいずれかを、(a)予測開始ポイント、(b)予測終了ポイント、(c)ベースポイント、としてセットする。何番目のデータ点をこれらのポイントとして用いるかは、あらかじめ定めておくことができる。 (FIG. 9A: Step S902)
Thecalculation unit 210 sets one of the data points in the measurement result data as (a) the prediction start point, (b) the prediction end point, and (c) the base point. The number of data points to be used as these points can be determined in advance.
演算部210は、計測結果データ内のデータ点のうちいずれかを、(a)予測開始ポイント、(b)予測終了ポイント、(c)ベースポイント、としてセットする。何番目のデータ点をこれらのポイントとして用いるかは、あらかじめ定めておくことができる。 (FIG. 9A: Step S902)
The
(図9A:ステップS902:補足)
予測開始ポイントは、予測線を作成する際に比較する計測結果データのデータ点の開始点であり、図7~図8の例においては20ポイント目である。予測終了ポイントは、予測線を作成する際に比較する計測結果データのデータ点の終了点であり、例えば30ポイント目である。1~19ポイント目は濃度と測定値との間の相関が低いことがあらかじめ分かっている場合、これらのデータ点は予測線を作成する際に不要である。同様に31~38ポイント目も相関が低い場合、これらのデータ点は不要である。これらのデータ点を除外するために、予測開始ポイントと予測終了ポイントをセットすることとした。ベースポイントは例えば23ポイント目とする。ベースポイントは後述のステップにおいて用いるものである。 (Fig. 9A: Step S902: Supplement)
The prediction start point is the start point of the data points of the measurement result data compared when creating the prediction line, and is the 20th point in the examples of FIGS. The prediction end point is the end point of the data points of the measurement result data compared when creating the prediction line, for example, the 30th point. If it is known in advance that points 1-19 have a low correlation between concentrations and measurements, these data points are unnecessary in constructing the prediction line. Similarly, if the 31st to 38th points are also low in correlation, these data points are unnecessary. To exclude these data points, we decided to set a prediction start point and a prediction end point. The base point is, for example, the 23rd point. Base points are used in steps described later.
(図9A:ステップS903)
演算部210は、計測結果内のデータ点を、標準反応過程モデルと比較する。比較手順は図5~図6で説明したものと同様である。ただし以下に説明するように、簡易化した比較手順を用いることもできる。 (FIG. 9A: Step S903)
Thecalculator 210 compares the data points in the measurement results to a standard reaction course model. The comparison procedure is the same as that described with reference to FIGS. However, a simplified comparison procedure can also be used, as described below.
演算部210は、計測結果内のデータ点を、標準反応過程モデルと比較する。比較手順は図5~図6で説明したものと同様である。ただし以下に説明するように、簡易化した比較手順を用いることもできる。 (FIG. 9A: Step S903)
The
(図9A:ステップS903:補足その1)
図5~図6で説明した例において、20ポイント目を開始点として、標準反応過程モデルと比較するデータ点を次第に増やすことを説明したが、標準反応過程モデルと比較するデータ点はこれに限るものではない。例えば直近の数点のみを標準反応過程モデルと比較してもよい。例えば演算部210は、最新のNポイント目の測定値とその1つ前のN-1ポイント目の測定値を、標準反応過程モデルと比較してもよい。図9Aにおいてはそのような例を示した。 (Fig. 9A: Step S903: Supplement 1)
In the example described in FIGS. 5 and 6, it was explained that the number of data points to be compared with the standard reaction process model is gradually increased from the 20th point as the starting point, but the number of data points to be compared with the standard reaction process model is limited to this. not a thing For example, only the most recent points may be compared with a standard reaction course model. For example, thecalculation unit 210 may compare the latest measured value of the N-th point and the measured value of the (N-1)-th point one before that with the standard reaction process model. FIG. 9A shows such an example.
図5~図6で説明した例において、20ポイント目を開始点として、標準反応過程モデルと比較するデータ点を次第に増やすことを説明したが、標準反応過程モデルと比較するデータ点はこれに限るものではない。例えば直近の数点のみを標準反応過程モデルと比較してもよい。例えば演算部210は、最新のNポイント目の測定値とその1つ前のN-1ポイント目の測定値を、標準反応過程モデルと比較してもよい。図9Aにおいてはそのような例を示した。 (Fig. 9A: Step S903: Supplement 1)
In the example described in FIGS. 5 and 6, it was explained that the number of data points to be compared with the standard reaction process model is gradually increased from the 20th point as the starting point, but the number of data points to be compared with the standard reaction process model is limited to this. not a thing For example, only the most recent points may be compared with a standard reaction course model. For example, the
(図9A:ステップS903:補足その2)
ただし、標準反応過程モデルと比較するデータ点の個数を抑制した場合、標準反応過程モデルとのマッチング精度が低下し、複数の標準反応過程モデルがマッチング候補として抽出される場合がある。そのような場合は、次のS904~S906によって最もマッチング精度が高い標準反応過程モデルを選択すればよい。 (Fig. 9A: Step S903: Supplement 2)
However, if the number of data points to be compared with the standard reaction process model is suppressed, the accuracy of matching with the standard reaction process model may decrease, and multiple standard reaction process models may be extracted as matching candidates. In such a case, the standard reaction process model with the highest matching accuracy should be selected through the following S904 to S906.
(図9A:ステップS904)
演算部210は、1ポイント目~ベースポイント(例えば23ポイント目)までの反応過程と標準反応過程モデルとの間の差分にしたがって、当該検体と最も近い標準反応過程モデルの番号(これをモデルNBと呼ぶ)を特定する。ベースポイント目までの反応過程によって標準反応過程モデルを特定するのは、ここまでの測定結果が標準反応過程モデルと最も相関が高いことがあらかじめ分かっていることによる。NBは後述する補正処理において用いる。 (FIG. 9A: Step S904)
Thecalculation unit 210 calculates the number of the standard reaction process model closest to the specimen (model N B ). The reason why the standard reaction process model is specified by the reaction process up to the base point is that it is known in advance that the measurement results up to this point have the highest correlation with the standard reaction process model. NB is used in correction processing, which will be described later.
演算部210は、1ポイント目~ベースポイント(例えば23ポイント目)までの反応過程と標準反応過程モデルとの間の差分にしたがって、当該検体と最も近い標準反応過程モデルの番号(これをモデルNBと呼ぶ)を特定する。ベースポイント目までの反応過程によって標準反応過程モデルを特定するのは、ここまでの測定結果が標準反応過程モデルと最も相関が高いことがあらかじめ分かっていることによる。NBは後述する補正処理において用いる。 (FIG. 9A: Step S904)
The
(図9B:ステップS905)
演算部210は、1ポイント目から予測開始ポイント(20ポイント目)までの測定値と最も合致する標準反応過程モデルNSを特定する。これは図5~図6において説明した標準反応過程モデル1を特定することに相当する。演算部210は同様に、1~21ポイント目までの測定値と最も合致する標準反応過程モデル、1~22ポイント目までの測定値と最も合致する標準反応過程モデル、・・・1~予測終了ポイント(30ポイント目)までの測定値と最も合致する標準反応過程モデルNEを特定する。 (FIG. 9B: Step S905)
Thecalculation unit 210 identifies the standard reaction process model NS that best matches the measured values from the first point to the prediction start point (20th point). This corresponds to specifying the standard reaction process model 1 described in FIGS. The calculation unit 210 similarly selects the standard reaction process model that best matches the measured values of the 1st to 21st points, the standard reaction process model that best matches the measured values of the 1st to 22nd points, . Identify the standard reaction course model NE that best matches the measurements up to point (thirtieth point).
演算部210は、1ポイント目から予測開始ポイント(20ポイント目)までの測定値と最も合致する標準反応過程モデルNSを特定する。これは図5~図6において説明した標準反応過程モデル1を特定することに相当する。演算部210は同様に、1~21ポイント目までの測定値と最も合致する標準反応過程モデル、1~22ポイント目までの測定値と最も合致する標準反応過程モデル、・・・1~予測終了ポイント(30ポイント目)までの測定値と最も合致する標準反応過程モデルNEを特定する。 (FIG. 9B: Step S905)
The
(図9B:ステップS906)
演算部210は、S905におけるモデルNS~NEをそれぞれ1以上特定することができる。複数のモデルを特定した場合は、そのなかで計測結果データと最も合致するものを特定する。具体的には、モデルNBと最も合致するものを、それぞれモデルNS~NEとして特定する。 (FIG. 9B: Step S906)
Thecalculation unit 210 can specify one or more of each of the models N S to N E in S905. If multiple models are identified, the one that best matches the measurement result data is identified. Specifically, those that best match model N B are identified as models N S to N E , respectively.
演算部210は、S905におけるモデルNS~NEをそれぞれ1以上特定することができる。複数のモデルを特定した場合は、そのなかで計測結果データと最も合致するものを特定する。具体的には、モデルNBと最も合致するものを、それぞれモデルNS~NEとして特定する。 (FIG. 9B: Step S906)
The
(図9B:ステップS907)
演算部210は、予測開始ポイント~予測終了ポイントについて、測定ポイントごとに予測線を作成する。具体的には、予測開始ポイント~予測終了ポイントについて図5で説明した手順(またはS903:補足で説明した簡易化手順)を実施することにより、予測線を求める。本ステップは、図5~図6において説明した予測線を作成することに相当する。 (FIG. 9B: Step S907)
Thecalculation unit 210 creates a prediction line for each measurement point from the prediction start point to the prediction end point. Specifically, the prediction line is obtained by performing the procedure described with reference to FIG. 5 (or S903: the simplified procedure described in the supplement) for the prediction start point to the prediction end point. This step corresponds to creating the prediction lines described with reference to FIGS.
演算部210は、予測開始ポイント~予測終了ポイントについて、測定ポイントごとに予測線を作成する。具体的には、予測開始ポイント~予測終了ポイントについて図5で説明した手順(またはS903:補足で説明した簡易化手順)を実施することにより、予測線を求める。本ステップは、図5~図6において説明した予測線を作成することに相当する。 (FIG. 9B: Step S907)
The
(図9B:ステップS908)
演算部210は、測定ポイントごとの予想線と、当該検体の1~38ポイント目の反応過程を、1つの画面に重ね書きする。本ステップは図7~図8で説明した重ね書きグラフを作成することに相当する。 (FIG. 9B: Step S908)
Thecalculation unit 210 overwrites the prediction line for each measurement point and the reaction process of the sample at the 1st to 38th points on one screen. This step corresponds to creating the overwritten graph described with reference to FIGS.
演算部210は、測定ポイントごとの予想線と、当該検体の1~38ポイント目の反応過程を、1つの画面に重ね書きする。本ステップは図7~図8で説明した重ね書きグラフを作成することに相当する。 (FIG. 9B: Step S908)
The
(図9B:ステップS909)
演算部210は、(a)測定ポイントごとの予測線同士の乖離量、(b)当該検体の反応過程における38ポイント目のデータ点と予測線との間の乖離量、を合計し、当該合計値を当該検体の反応正確度として算出する。当該反応正確度が閾値を超えていた場合、当該検体に異常がある旨を通知するアラームを出力する。 (FIG. 9B: Step S909)
Thecalculation unit 210 sums (a) the amount of deviation between the prediction lines for each measurement point, and (b) the amount of deviation between the 38th data point and the prediction line in the reaction process of the specimen, and the total The value is calculated as the reaction accuracy for that specimen. If the reaction accuracy exceeds the threshold, an alarm is output to notify that there is an abnormality in the sample.
演算部210は、(a)測定ポイントごとの予測線同士の乖離量、(b)当該検体の反応過程における38ポイント目のデータ点と予測線との間の乖離量、を合計し、当該合計値を当該検体の反応正確度として算出する。当該反応正確度が閾値を超えていた場合、当該検体に異常がある旨を通知するアラームを出力する。 (FIG. 9B: Step S909)
The
(図9B:ステップS909:補足)
本ステップにおける閾値としては、標準反応過程モデルと予測線との間の乖離を用いることができる。例えば標準偏差の3倍などを閾値とすればよい。 (FIG. 9B: Step S909: Supplement)
A deviation between the standard reaction process model and the prediction line can be used as the threshold in this step. For example, the threshold may be three times the standard deviation.
本ステップにおける閾値としては、標準反応過程モデルと予測線との間の乖離を用いることができる。例えば標準偏差の3倍などを閾値とすればよい。 (FIG. 9B: Step S909: Supplement)
A deviation between the standard reaction process model and the prediction line can be used as the threshold in this step. For example, the threshold may be three times the standard deviation.
<実施の形態1:まとめ>
本実施形態1に係るサーバ200(予測線計算装置)は、複数の反応過程データを収集してこれを用いて(例えば平均化することにより)標準反応過程モデルを取得し、これを用いて、計測結果データの正確性を判定する。したがって、既知濃度試料などの特定の試料をあらかじめ準備することなく、計測結果データの正確性を判定することができる。これにより、特定の試料を準備するためのメーカ側の負担等を減らすことができる。 <Embodiment 1: Summary>
The server 200 (prediction line calculation device) according to the first embodiment collects a plurality of reaction process data and uses them (for example, by averaging) to acquire a standard reaction process model, and using this, Determine the accuracy of measurement result data. Therefore, the accuracy of measurement result data can be determined without preparing a specific sample such as a known concentration sample in advance. As a result, it is possible to reduce the burden on the manufacturer side for preparing a specific sample.
本実施形態1に係るサーバ200は、計測結果データのデータ点を取得する過程において、データ点に対して標準反応過程モデルのデータ点を接続することにより予測線を作成し、予測線と計測結果データとの間の乖離度が閾値を超えた時点で、アラートを発信することができる。したがって、分析が完了する前の反応途中過程において異常の有無を判定することができる。これにより、ユーザは再テストの準備を早くすることができる。
The server 200 according to the first embodiment creates a prediction line by connecting the data points of the standard reaction process model to the data points in the process of acquiring the data points of the measurement result data, and the prediction line and the measurement result An alert can be sent when the degree of divergence between data exceeds a threshold. Therefore, it is possible to determine the presence or absence of an abnormality during the course of the reaction before the analysis is completed. This allows the user to quickly prepare for retesting.
<実施の形態2>
本発明の実施形態2では、S909の具体例について説明する。その他の構成は実施形態1と同様である。 <Embodiment 2>
Embodiment 2 of the present invention describes a specific example of S909. Other configurations are the same as those of the first embodiment.
本発明の実施形態2では、S909の具体例について説明する。その他の構成は実施形態1と同様である。 <Embodiment 2>
Embodiment 2 of the present invention describes a specific example of S909. Other configurations are the same as those of the first embodiment.
図10は、S909における乖離度の経時変化をプロットした例である。プロット1001~1003は、検体1~3を項目Aについて試薬のロット1で分析したときの反応正確度(S909において計算する乖離度(a)(b)の合計)を表している。プロット1004~1007は、検体4~1を項目Aについて試薬ロット2で分析したときの反応正確度を表している。
FIG. 10 is an example of plotting changes over time in the degree of divergence in S909. Plots 1001 to 1003 represent the reaction accuracies (the sum of the discrepancies (a) and (b) calculated in S909) when samples 1 to 3 are analyzed with reagent lot 1 for item A. FIG. Plots 1004-1007 represent the reaction accuracy when analytes 4-1 are analyzed with reagent lot 2 for Item A.
プロット1001~1003の反応正確度の経時変動は小さいのに対し、試薬ロット1から試薬ロット2に変わったプロット1004の反応正確度は、プロット1003の反応正確度との間の乖離が大きい。この乖離が小さければ、試薬ロットが変わっても試薬成分の差が小さいことが示唆されるので、キャリブレーションなどを再度実行する必要はないといえる。一方、この乖離が大きければ、試薬ロットが変わったときに試薬成分に差があることが示唆されるので、キャリブレーションを再度実行することが望ましい。そこで演算部210は、ユーザに対してキャリブレーションを実行するように推奨する。
While the change over time in the reaction accuracy of plots 1001 to 1003 is small, the reaction accuracy of plot 1004, which changed from reagent lot 1 to reagent lot 2, has a large divergence from the reaction accuracy of plot 1003. If this divergence is small, it is suggested that the difference in reagent components is small even if the reagent lot is changed, so it can be said that there is no need to re-execute calibration or the like. On the other hand, if this divergence is large, it suggests that there is a difference in the reagent components when the reagent lot changes, so it is desirable to re-execute the calibration. Therefore, the calculation unit 210 recommends the user to perform calibration.
プロット1007のように、反応正確度が閾値を超えた場合、演算部210は、ユーザに対して試薬の劣化などの可能性およびその交換を推奨することを示唆する。
As shown in plot 1007, when the reaction accuracy exceeds the threshold, the calculation unit 210 suggests to the user the possibility of deterioration of the reagent and recommending its replacement.
反応正確度の閾値を超える項目が項目Aだけではなく、複数項目について閾値を超える場合、演算部210は、光源や検出器などのような自動分析装置100の消耗品を交換することを推奨する。
If the number of items exceeding the reaction accuracy threshold exceeds the threshold for not only item A but also multiple items, the calculation unit 210 recommends replacing the consumables of the automatic analyzer 100, such as the light source and detector. .
演算部210はさらに、図10に示すプロットをフィッティングすることによって、将来の反応正確度の経時変化を予測することもできる。これにより、反応正確度が閾値を超える時期を予測することができる。
The calculation unit 210 can also predict future changes in reaction accuracy over time by fitting the plots shown in FIG. This makes it possible to predict when the reaction accuracy will exceed the threshold.
<実施の形態2:まとめ>
本実施形態2に係るサーバ200は、予測線間の乖離度、および予測線と計測結果データとの間の乖離度を合計することにより、計測結果データの正確度を計算し、その正確度の経時変化にしたがって、計測結果データの異常の有無を判定する。これにより、あらかじめ精度管理のための既知濃度試料を準備する時間、その既知濃度試料を分析するためにかかる時間、試薬のコスト、などを必要とせず、計測結果の正確度を判定することができる。 <Embodiment 2: Summary>
Theserver 200 according to the second embodiment calculates the accuracy of the measurement result data by totaling the deviation between the prediction lines and the deviation between the prediction line and the measurement result data. Whether or not there is an abnormality in the measurement result data is determined according to the change over time. As a result, the accuracy of measurement results can be determined without the need for the time required to prepare samples of known concentrations for quality control in advance, the time required to analyze the samples of known concentrations, the cost of reagents, and the like. .
本実施形態2に係るサーバ200は、予測線間の乖離度、および予測線と計測結果データとの間の乖離度を合計することにより、計測結果データの正確度を計算し、その正確度の経時変化にしたがって、計測結果データの異常の有無を判定する。これにより、あらかじめ精度管理のための既知濃度試料を準備する時間、その既知濃度試料を分析するためにかかる時間、試薬のコスト、などを必要とせず、計測結果の正確度を判定することができる。 <Embodiment 2: Summary>
The
本実施形態2に係るサーバ200は、反応正確度が閾値を超えていないがその経時変化プロットが急峻に変化した場合(例えば図10のプロット1004、ただしプロット1004とその1つ前のプロットとの間の差分は図10縦軸の閾値よりも小さい)は、キャリブレーションを実施するように促すことができる。また、反応正確度が閾値を超えた測定項目が1つであれば試薬劣化などの可能性を示唆することができる。さらに、反応正確度が閾値を超えた測定項目が2つ以上であれば、自動分析装置100が備える消耗部品を交換するように促すことができる。
In the server 200 according to the second embodiment, when the reaction accuracy does not exceed the threshold, but the plot changes over time (for example, the plot 1004 in FIG. 10, the difference between the plot 1004 and the previous plot is smaller than the threshold value on the vertical axis of FIG. 10), calibration can be prompted. Also, if there is only one measurement item whose reaction accuracy exceeds the threshold, it is possible to suggest the possibility of reagent deterioration or the like. Furthermore, if there are two or more measurement items for which the reaction accuracy exceeds the threshold, replacement of the consumable parts provided in the automatic analyzer 100 can be prompted.
本実施形態2に係るサーバ200は、反応正確度が閾値を超える項目の個数に応じてアラートの内容を定めことを説明したが、この個数は任意に設定することができる。したがって個数に関する上記数値は1例であることを付言しておく。ただし個数が多ければ消耗品を交換することを促し、個数がそれよりも少なければ試薬劣化などを示唆することは、個数が変わっても同じである。
Although it has been described that the server 200 according to the second embodiment determines the content of the alert according to the number of items whose reaction accuracy exceeds the threshold, this number can be set arbitrarily. Therefore, it should be added that the above numerical values regarding the number are an example. However, if the number is large, replacement of the consumables is recommended, and if the number is smaller than that, it suggests reagent deterioration, etc., which is the same regardless of the number.
<実施の形態3>
本発明の実施形態3では、自動分析装置100が分析する試料成分の例として、人間の肌の水分量を分析する例を説明する。自動分析装置100の構成は実施形態1~2と同様である。 <Embodiment 3>
In Embodiment 3 of the present invention, an example of analyzing the water content of human skin will be described as an example of sample components analyzed by theautomatic analyzer 100 . The configuration of the automatic analyzer 100 is the same as in the first and second embodiments.
本発明の実施形態3では、自動分析装置100が分析する試料成分の例として、人間の肌の水分量を分析する例を説明する。自動分析装置100の構成は実施形態1~2と同様である。 <Embodiment 3>
In Embodiment 3 of the present invention, an example of analyzing the water content of human skin will be described as an example of sample components analyzed by the
図11は、2つの測定項目の標準反応過程モデルを示す。モデル901は、肌モデル1の肌内部の基底層の水分量変化を示す。同様にモデル902~907は、肌モデル2~7の基底層の水分量変化を示す。モデル1001~1007は、肌モデル1~7の肌表面の角質層の水分量変化を示す。したがって、モデル901とモデル1001は対応付けられており、同様にモデル902~907とモデル1002~1007はそれぞれ対応付けられている。
Fig. 11 shows a standard reaction process model for two measurement items. A model 901 shows changes in the water content of the basal layer inside the skin of the skin model 1 . Similarly, models 902-907 show changes in water content in the basal layer of skin models 2-7. Models 1001 to 1007 show changes in water content of stratum corneum on the skin surface of skin models 1 to 7 . Therefore, model 901 and model 1001 are associated, and similarly models 902 to 907 and models 1002 to 1007 are associated, respectively.
図12Aは、被験者Aがスキンケア商品Aのサンプルを使用した場合における水分量の経時変化を例示するグラフである。この例においては、使用開始時、使用開始から5日目、使用開始から10日目それぞれにおける計測結果を示す。プロット1501は肌内部の基底層の水分量を測定した結果である。プロット1502は肌表面の角質層の水分量を測定した結果である。
FIG. 12A is a graph exemplifying changes in water content over time when subject A used a sample of skin care product A. FIG. In this example, measurement results are shown at the beginning of use, 5 days after the start of use, and 10 days after the start of use. Plot 1501 is the result of measuring the water content of the basal layer inside the skin. Plot 1502 is the result of measuring the water content of the stratum corneum on the surface of the skin.
演算部210は、肌内部の基底層の水分量変化のモデル901~907のなかからプロット1501と最も近いものを特定する。ここではモデル907が最も近いものとする。演算部210は、モデル907の10日目以降のデータ点をプロット1501に対して接続することにより、予測線1107を作成する。演算部210は同様に、モデル907と対応するモデル1007の10日目以降のデータ点をプロット1502に対して接続することにより、予測線1207を作成する。
The calculation unit 210 identifies the one that is closest to the plot 1501 from among the models 901 to 907 of changes in the moisture content of the basal layer inside the skin. Here, the model 907 is assumed to be the closest. Calculator 210 creates prediction line 1107 by connecting data points from day 10 onwards of model 907 to plot 1501 . Calculator 210 similarly creates prediction line 1207 by connecting data points from day 10 onwards of model 907 and corresponding model 1007 to plot 1502 .
肌モデル7の肌タイプはスキンケア商品Aとの使用効果に関する相性が良いという紐づけデータをあらかじめ作成しておけば、被験者Aがスキンケア商品Aのサンプルを10日使用した時点で、演算部210は被験者Aに対してスキンケア商品Aを購入するように推奨することができる。また演算部210は、スキンケア商品Aの継続使用により1か月後の肌表面の角質層の状態が良くなると予測されることを被験者Aに対して示し、スキンケア商品Aを購入するように推奨する根拠を示すことができる。被験者Aが実際にスキンケア商品Aを継続的に使用することによって、1か月後において肌表面の角質層の状態が向上していることを被験者Aが実感できれば、上記予測の信頼性を示すことができる。
If the linking data indicating that the skin type of the skin model 7 is compatible with the skin care product A in terms of the effect of use is created in advance, the calculation unit 210 will Subject A can be recommended to purchase skin care product A. Further, the calculation unit 210 indicates to the subject A that it is predicted that the condition of the stratum corneum on the skin surface will improve after one month with continuous use of the skin care product A, and recommends that the subject A purchase the skin care product A. You can justify it. If the subject A can actually feel that the condition of the stratum corneum on the skin surface has improved after one month by actually continuously using the skin care product A, the reliability of the above prediction is indicated. can be done.
図12Bは、被験者Bがスキンケア商品Aのサンプルを使用した場合における水分量の経時変化を例示するグラフである。この例においては図12Aと同様に、使用開始時、5日目、10日目それぞれにおける計測結果を示す。プロット1503は肌内部の基底層の水分量を測定した結果である。プロット1504は肌表面の角質層の水分量を測定した結果である。
FIG. 12B is a graph exemplifying changes in water content over time when Subject B used a sample of skin care product A. FIG. Similar to FIG. 12A, this example shows measurement results at the start of use, on the fifth day, and on the tenth day. Plot 1503 is the result of measuring the water content of the basal layer inside the skin. Plot 1504 is the result of measuring the water content of the stratum corneum on the surface of the skin.
演算部210は、モデル901~907のなかからプロット1503と最も合致するものを特定する。ここではモデル902が最も近いものとする。演算部210は、モデル902の10日目以降のデータ点をプロット1503に対して接続することにより、予測線1302を作成する。演算部210は同様に、モデル902と対応するモデル1002の10日目以降のデータ点をプロット1504に対して接続することにより、予測線1402を作成する。
The computing unit 210 identifies the one that best matches the plot 1503 from among the models 901 to 907. Here, the model 902 is assumed to be the closest. Calculator 210 creates prediction line 1302 by connecting data points from day 10 onwards of model 902 to plot 1503 . Computing unit 210 similarly creates prediction line 1402 by connecting data points from day 10 onwards of model 902 and corresponding model 1002 to plot 1504 .
肌モデル2の肌タイプはスキンケア商品Aとの使用効果に関する相性が悪く、スキンケア商品Bとの使用効果に対する相性が良い、という紐づけデータをあらかじめ作成しておけば、被験者Bがスキンケア商品Aのサンプルを10日使用した時点で、演算部210はスキンケア商品Aに代えて、使用効果の相性がよいスキンケア商品Bのサンプル使用または購入を被験者Bに対して提案することができる。また演算部210は、スキンケア商品Bを継続的に使用することによって、1か月後において肌表面の角質層の状態が良くなると予測されることを被験者Bに対して示し、スキンケア商品Bを購入するように推奨する根拠を示すことができる。被験者Bが実際にスキンケア商品Bを継続的に使用することによって、1か月後において肌表面の角質層の状態が向上していることを被験者Bが実感できれば、上記予測の信頼性を示すことができる。
If the link data is created in advance that the skin type of skin model 2 is not compatible with skin care product A in terms of the effects of use, and is compatible with skin care product B in terms of the effects of use, subject B will be able to use skin care product A. When the sample has been used for 10 days, the calculation unit 210 can suggest to the subject B that the subject B use or purchase the skin care product B, which has good compatibility with the use effect, instead of the skin care product A. Further, the calculation unit 210 indicates to the subject B that the condition of the stratum corneum on the skin surface is expected to improve after one month by continuously using the skin care product B, and purchases the skin care product B. can provide a rationale for recommending that If the subject B can actually feel that the condition of the stratum corneum on the surface of the skin has improved after one month by continuously using the skin care product B, the reliability of the above prediction is indicated. can be done.
実施形態1と同様に、予測線と計測結果データは1つの画面に重ね書きすることもできる。この場合、予測線同士の乖離が大きければ予測誤差が多く、予測線同士の乖離が小さければ予測誤差が小さいことを表現することができる。
As in Embodiment 1, the prediction line and measurement result data can be overwritten on one screen. In this case, it can be expressed that the prediction error is large if the deviation between the prediction lines is large, and that the prediction error is small if the deviation between the prediction lines is small.
演算部210は、標準反応過程モデルを作成するとき使用するデータ、または、実際に測定した計測結果データを使って、次に実際に測定する計測結果データが予測線間に入る確率の統計を算出しておいてもよい。これにより、例えばユーザがスキンケア商品Aのサンプルを10日使用した時点で、予測線の重ね書き表示と同時に、将来の計測結果(水分量)が予測線間に入る確率を表示することもできる。
The calculation unit 210 uses the data used when creating the standard reaction process model or the actually measured measurement result data to calculate the statistics of the probability that the next actually measured measurement result data falls between the prediction lines. You can keep it. As a result, for example, when the user uses a sample of skin care product A for 10 days, it is possible to display the probability that the future measurement result (moisture content) will fall between the prediction lines at the same time as the prediction lines are overlaid.
<本発明の変形例について>
本発明は、前述した実施形態に限定されるものではなく、様々な変形例が含まれる。例えば、上記した実施形態は本開示を分かりやすく説明するために詳細に説明したものであり、必ずしも説明した全ての構成を備えるものに限定されるものではない。また、ある実施形態の構成の一部を他の実施形態の構成に置き換えることが可能であり、また、ある実施形態の構成に他の実施形態の構成を加えることも可能である。また、各実施形態の構成の一部について、他の構成の追加・削除・置換をすることが可能である。 <Regarding Modifications of the Present Invention>
The present invention is not limited to the embodiments described above, and includes various modifications. For example, the above-described embodiments have been described in detail in order to explain the present disclosure in an easy-to-understand manner, and are not necessarily limited to those having all the described configurations. Also, part of the configuration of one embodiment can be replaced with the configuration of another embodiment, and the configuration of another embodiment can be added to the configuration of one embodiment. Moreover, it is possible to add, delete, or replace a part of the configuration of each embodiment with another configuration.
以上の実施形態において、サーバ200は自動分析装置100が取得した計測結果データの正確性を判定することを説明したが、自動分析装置100自身(例えば全体制御部121)が自身の計測結果データの正確性を判定してもよい。この場合、全体制御部121は演算部210と同様に構成することができ、自動分析装置100は予測線計算装置としての役割を有する。
In the above embodiment, it was explained that the server 200 determines the accuracy of the measurement result data acquired by the automatic analyzer 100. Accuracy may be determined. In this case, the overall control unit 121 can be configured in the same manner as the calculation unit 210, and the automatic analysis device 100 functions as a prediction line calculation device.
以上の実施形態において、サーバ200が自動分析装置100からの通信によって計測結果データを収集することを説明したが、計測結果データを収集する方法はこれに限らない。また、検体の反応過程を計測する代わりに、既知濃度の試料の反応過程を収集してもよい。さらに、シミュレーションなどで理想的な反応過程を生成してこれを収集してもよい。
In the above embodiment, the server 200 collects measurement result data through communication from the automatic analyzer 100, but the method of collecting measurement result data is not limited to this. Also, instead of measuring the reaction process of the specimen, the reaction process of a sample of known concentration may be collected. Furthermore, an ideal reaction process may be generated by simulation or the like and collected.
以上の実施形態において、説明変数の定義や、最も近い標準反応過程モデルを特定する方法は、1例として提示したものであり、その他の定義や手法を用いることもできる。
In the above embodiments, the definition of explanatory variables and the method of identifying the closest standard reaction process model are presented as an example, and other definitions and methods can also be used.
実施形態3において、人の肌の水分量を計測する装置は、必ずしも実施形態1で説明した自動分析装置100でなくともよい。少なくとも人の肌の水分量を計測対象として計測可能な装置からその計測結果を取得して分析できるのであれば、その計測結果について本発明を適用可能である。
In the third embodiment, the device for measuring the moisture content of human skin does not necessarily have to be the automatic analyzer 100 described in the first embodiment. The present invention can be applied to the measurement results as long as the measurement results can be acquired from a device capable of measuring at least the moisture content of human skin and analyzed.
100:自動分析装置
200:サーバ
210:演算部 100: Automatic analyzer 200: Server 210: Calculation unit
200:サーバ
210:演算部 100: Automatic analyzer 200: Server 210: Calculation unit
Claims (15)
- 試料が有する成分を分析する自動分析装置が計測した計測結果の予測線を計算する予測線計算装置であって、
前記自動分析装置は、前記試料の反応過程を時系列に沿って計測し、
前記予測線計算装置は、前記自動分析装置が計測した結果を記述した計測結果データの予測線を計算する演算部を備え、
前記演算部は、複数の前記反応過程から生成した標準反応過程を表す標準反応過程モデルを取得し、
前記演算部は、前記反応過程内の第1時点における前記計測結果データのデータ点に対して前記標準反応過程モデル内の前記第1時点以後のデータ点を加えることにより、第1予測線を生成し、
前記演算部は、前記反応過程内の前記第1時点よりも後の1つ以上の後続時点における前記計測結果データのデータ点に対して前記標準反応過程モデル内の前記後続時点以後のデータ点を加えることにより、1つ以上の第2予測線を生成し、
前記演算部は、前記第1予測線と前記第2予測線を出力する
ことを特徴とする予測線計算装置。 A prediction line calculation device for calculating a prediction line of a measurement result measured by an automatic analyzer that analyzes the components of a sample,
The automatic analyzer measures the reaction process of the sample in chronological order,
The prediction line calculation device includes a calculation unit for calculating a prediction line of measurement result data describing the results measured by the automatic analysis device,
The computing unit acquires a standard reaction process model representing a standard reaction process generated from a plurality of the reaction processes,
The calculation unit generates a first prediction line by adding data points after the first time point in the standard reaction process model to data points of the measurement result data at the first time point in the reaction process. death,
The calculation unit calculates data points after the subsequent time point in the standard reaction process model for data points of the measurement result data at one or more subsequent time points after the first time point in the reaction process. generating one or more second prediction lines by adding
The prediction line calculation device, wherein the calculation unit outputs the first prediction line and the second prediction line. - 前記演算部は、前記第1予測線または前記第2予測線のうち少なくともいずれかと前記計測結果データとの間の乖離度にしたがって、前記計測結果データの正確性を判定する
ことを特徴とする請求項1記載の予測線計算装置。 The calculation unit determines the accuracy of the measurement result data according to the degree of divergence between at least one of the first prediction line and the second prediction line and the measurement result data. Item 1. The prediction line calculation device according to item 1. - 前記演算部は、前記複数の反応過程それぞれにおける前記計測結果データを前記試料の属性にしたがって1以上のグループへ分類し、
前記演算部は、前記グループごとに統計上の外れ値を除外することにより、前記グループごとに前記標準反応過程モデルを作成し、
前記演算部は、前記グループごとの前記標準反応過程モデルを用いて、前記グループごとに前記第1予測線と前記第2予測線を生成する
ことを特徴とする請求項1記載の予測線計算装置。 The computing unit classifies the measurement result data in each of the plurality of reaction processes into one or more groups according to the attributes of the sample,
The calculation unit creates the standard reaction process model for each group by excluding statistical outliers for each group,
The prediction line calculation device according to claim 1, wherein the calculation unit generates the first prediction line and the second prediction line for each group using the standard reaction process model for each group. . - 前記演算部は、前記試料の属性ごとに前記標準反応過程モデルを取得し、
前記演算部は、前記反応過程内の前記第1時点よりも前の開始時点から前記第1時点までの前記反応過程と合致する前記標準反応過程モデルを第1モデルとして特定し、
前記演算部は、前記第1モデルを用いて前記第1予測線を生成し、
前記演算部は、前記開始時点から前記後続時点までの前記反応過程と合致する前記標準反応過程モデルを第2モデルとして特定し、
前記演算部は、前記第2モデルを用いて前記第2予測線を生成する
ことを特徴とする請求項1記載の予測線計算装置。 The computing unit acquires the standard reaction process model for each attribute of the sample,
The computing unit identifies, as a first model, the standard reaction process model that matches the reaction process from a start point before the first point in the reaction process to the first point, and
The calculation unit generates the first prediction line using the first model,
The computing unit identifies, as a second model, the standard reaction process model that matches the reaction process from the start time point to the subsequent time point,
The prediction line calculation device according to claim 1, wherein the calculation unit generates the second prediction line using the second model. - 前記演算部は、前記反応過程の開始時点から前記反応過程内の基準時点までの前記反応過程と最も合致する前記標準反応過程モデルを基準モデルとして特定し、
前記演算部は、前記第1モデルの候補が複数存在する場合は、そのなかで前記基準モデルと最も近いものを前記第1モデルとして採用し、
前記演算部は、前記第2モデルの候補が複数存在する場合は、そのなかで前記基準モデルと最も近いものを前記第2モデルとして採用する
ことを特徴とする請求項4記載の予測線計算装置。 The computing unit identifies, as a reference model, the standard reaction process model that best matches the reaction process from the start point of the reaction process to a reference point in the reaction process,
When there are a plurality of candidates for the first model, the computing unit adopts the one that is closest to the reference model as the first model,
5. The prediction line calculation device according to claim 4, wherein, when there are a plurality of candidates for the second model, the calculation unit adopts the one that is closest to the reference model as the second model. . - 前記演算部は、前記計測結果データを表示デバイス上に画面表示するとともに、前記第1予測線または前記第2予測線のうち少なくともいずれかを前記計測結果データと同じ画面上に重畳して画面表示する
ことを特徴とする請求項1記載の予測線計算装置。 The calculation unit displays the measurement result data on a display device, and superimposes at least one of the first prediction line and the second prediction line on the same screen as the measurement result data. The prediction line calculation device according to claim 1, characterized in that: - 前記演算部は、前記反応過程内の特定の測定時点における、
前記第1予測線または前記第2予測線のうち少なくともいずれかの前記計測結果データに対する差分、
および、
前記第1予測線と前記第2予測線との間の差分、
を合算することにより、前記第1予測線または前記第2予測線のうち少なくともいずれかと前記計測結果データとの間の乖離度を計算し、
前記演算部は、前記乖離度が第1閾値を超えたとき、前記計測結果データの正確性が基準値に達していない旨のアラートを出力する
ことを特徴とする請求項1記載の予測線計算装置。 At a specific measurement point in the reaction process, the computing unit
difference of at least one of the first prediction line and the second prediction line with respect to the measurement result data;
and,
a difference between the first prediction line and the second prediction line;
Calculate the degree of divergence between at least one of the first prediction line or the second prediction line and the measurement result data,
2. The prediction line calculation according to claim 1, wherein, when the degree of divergence exceeds a first threshold, the calculation unit outputs an alert to the effect that the accuracy of the measurement result data has not reached a reference value. Device. - 前記演算部は、前記試料の測定項目ごとに前記標準反応過程モデルを取得し、
前記演算部は、前記測定項目ごとに前記乖離度を計算し、
前記演算部は、前記乖離度が前記第1閾値を超えた前記測定項目の個数にしたがって、前記アラートの内容をセットする
ことを特徴とする請求項7記載の予測線計算装置。 The computing unit acquires the standard reaction process model for each measurement item of the sample,
The calculation unit calculates the degree of divergence for each measurement item,
8. The prediction line calculation device according to claim 7, wherein the calculation unit sets the content of the alert according to the number of the measurement items for which the degree of divergence exceeds the first threshold. - 前記演算部は、前記乖離度の経時変化量が前記第1閾値よりも小さい第2閾値を超えている場合は、前記自動分析装置のキャリブレーションを実施するように促す前記アラートをセットし、
前記演算部は、前記乖離度が前記第1閾値を超えた前記測定項目の個数が第1個数超かつ第2個数以下である場合は、前記試料と反応させる試薬を交換するように促す前記アラートをセットし、
前記演算部は、前記乖離度が前記第1閾値を超えた前記測定項目の個数が前記第2個数超である場合は、前記自動分析装置が備える消耗部品を交換するように促す前記アラートをセットする
ことを特徴とする請求項8記載の予測線計算装置。 If the amount of change over time in the degree of divergence exceeds a second threshold smaller than the first threshold, the computing unit sets the alert prompting calibration of the automatic analyzer,
When the number of the measurement items for which the degree of deviation exceeds the first threshold is greater than the first number and equal to or less than the second number, the arithmetic unit prompts the alert to replace the reagent to be reacted with the sample. and set
When the number of the measurement items for which the degree of deviation exceeds the first threshold exceeds the second number, the arithmetic unit sets the alert prompting replacement of consumable parts included in the automatic analyzer. The prediction line calculation device according to claim 8, characterized in that: - 前記演算部は、前記試料の測定項目ごとにかつ前記試料のグループごとに前記標準反応過程モデルを取得し、
前記演算部は、第1試料グループの第1測定項目について取得した前記標準反応過程モデルと、前記第1試料グループの第2測定項目について取得した前記標準反応過程モデルとの間の関連付けをあらかじめ特定しておき、
前記演算部は、前記第1測定項目について取得した前記計測結果データと合致する前記標準反応過程モデルを特定することにより、前記第1測定項目について前記第1予測線と前記第2予測線を生成し、
前記演算部は、前記関連付けにしたがって、前記第1測定項目について特定した前記標準反応過程モデルに対応する、前記第2測定項目についての前記標準反応過程モデルを特定し、
前記演算部は、前記第2測定項目について特定した前記標準反応過程モデルを用いて、前記第2測定項目について前記第1予測線と前記第2予測線を生成する
ことを特徴とする請求項1記載の予測線計算装置。 The computing unit acquires the standard reaction process model for each measurement item of the sample and for each group of the sample,
The computing unit specifies in advance an association between the standard reaction process model acquired for the first measurement item of the first sample group and the standard reaction process model acquired for the second measurement item of the first sample group. keep,
The computing unit generates the first prediction line and the second prediction line for the first measurement item by specifying the standard reaction process model that matches the measurement result data acquired for the first measurement item. death,
The computing unit identifies the standard reaction process model for the second measurement item corresponding to the standard reaction process model identified for the first measurement item according to the association,
2. The calculation unit generates the first prediction line and the second prediction line for the second measurement item using the standard reaction process model specified for the second measurement item. Prediction line calculator as described. - 前記第1測定項目は、人の肌内部の基底層の第1水分量であり、
前記第2測定項目は、人の肌表面の角質層の第2水分量であり、
前記試料のグループは、スキンケア製品を使用した日数と前記第1および第2水分量の変化との間の関係が類似する被験者のグループであり、
前記演算部は、前記第1水分量の変化を表す前記標準反応過程モデルと、前記第2水分量の変化を表す前記標準反応過程モデルとの間の対応関係を、前記被験者のグループごとに特定することにより、前記関連付けを特定する
ことを特徴とする請求項10記載の予測線計算装置。 The first measurement item is the first moisture content of the basal layer inside the human skin,
The second measurement item is the second water content of the stratum corneum on the surface of human skin,
The group of samples is a group of subjects with a similar relationship between the number of days of skin care product use and the change in the first and second moisture content;
The computing unit identifies, for each group of subjects, a correspondence relationship between the standard reaction process model representing the change in the first water content and the standard reaction process model representing the change in the second water content. 11. The prediction line calculation device according to claim 10, wherein the association is specified by: - 前記演算部は、前記第1測定項目または前記第2測定項目のうち少なくともいずれかについて、推奨する前記スキンケア製品と前記被験者のグループとの間の対応関係をあらかじめ特定しておき、
前記演算部は、特定のスキンケア製品を使用している特定の被験者について前記計測結果データを取得するとともに、その計測結果データを用いて前記第1予測線と前記第2予測線を生成し、
前記演算部は、前記第1予測線と前記第2予測線がスキンケアによる成果として良好な結果を示す場合は、前記特定のスキンケア製品を推奨する旨を示すデータを出力し、
前記演算部は、前記第1予測線と前記第2予測線がスキンケアによる成果として良好ではない結果を示す場合は、推奨する前記スキンケア製品と前記被験者のグループとの間の対応関係にしたがって、推奨する前記スキンケア製品を示すデータを出力する
ことを特徴とする請求項11記載の予測線計算装置。 The computing unit specifies in advance a correspondence relationship between the recommended skin care product and the group of subjects for at least one of the first measurement item and the second measurement item,
The calculation unit acquires the measurement result data for a specific subject using a specific skin care product, and uses the measurement result data to generate the first prediction line and the second prediction line,
wherein, when the first prediction line and the second prediction line indicate favorable skin care results, the calculation unit outputs data indicating that the specific skin care product is recommended;
If the first prediction line and the second prediction line show poor skin care results, the calculation unit recommends the skin care product according to the correspondence relationship between the recommended skin care product and the subject group. 12. The predictive line calculation device according to claim 11, outputting data indicating the skin care product to be used. - 前記演算部は、前記計測結果データを表示デバイス上に画面表示するとともに、前記第1予測線と前記第2予測線を前記計測結果データと同じ画面上に重畳して画面表示する
ことを特徴とする請求項10記載の予測線計算装置。 The computing unit screen-displays the measurement result data on a display device, and displays the first prediction line and the second prediction line on the same screen as the measurement result data by superimposing them on the same screen. 11. The predictive line calculation device according to claim 10. - 前記演算部は、前記計測結果データが前記第1予測線と前記第2予測線によって形成される領域のなかに入る確率を統計的に計算しておき、
前記演算部は、特定の時点までについて取得した前記計測結果データがその時点以後において前記領域のなかに入る確率を、前記計測結果データと前記第1予測線と前記第2予測線とともに表示する
ことを特徴とする請求項13記載の予測線計算装置。 The calculation unit statistically calculates a probability that the measurement result data falls within the area formed by the first prediction line and the second prediction line,
The calculation unit displays the probability that the measurement result data acquired up to a specific point in time will fall within the area after that point along with the measurement result data, the first prediction line, and the second prediction line. 14. The prediction line calculation device according to claim 13, characterized by: - 試料が有する成分を分析する自動分析装置が計測した計測結果の予測線を計算する予測線計算方法であって、
前記自動分析装置は、前記試料の反応過程を時系列に沿って計測し、
前記予測線計算方法は、前記自動分析装置が計測した結果を記述した計測結果データの予測線を計算するステップを有し、
前記予測線を計算するステップにおいては、複数の前記反応過程から生成した標準反応過程を表す標準反応過程モデルを取得し、
前記予測線を計算するステップにおいては、前記反応過程内の第1時点における前記計測結果データのデータ点に対して前記標準反応過程モデル内の前記第1時点以後のデータ点を加えることにより、第1予測線を生成し、
前記予測線を計算するステップにおいては、前記反応過程内の前記第1時点よりも後の1つ以上の後続時点における前記計測結果データのデータ点に対して前記標準反応過程モデル内の前記後続時点以後のデータ点を加えることにより、1つ以上の第2予測線を生成し、
前記予測線を計算するステップにおいては、前記第1予測線と前記第2予測線を出力する
ことを特徴とする予測線計算方法。 A prediction line calculation method for calculating a prediction line of a measurement result measured by an automatic analyzer that analyzes the components of a sample,
The automatic analyzer measures the reaction process of the sample in chronological order,
The prediction line calculation method has a step of calculating a prediction line of measurement result data describing the results measured by the automatic analyzer,
In the step of calculating the prediction line, obtaining a standard reaction process model representing a standard reaction process generated from a plurality of the reaction processes;
In the step of calculating the prediction line, by adding the data points after the first time point in the standard reaction process model to the data points of the measurement result data at the first time point in the reaction process, 1 generate a prediction line,
In the step of calculating the prediction line, for data points of the measurement result data at one or more subsequent time points after the first time point in the reaction course, the subsequent time points in the standard reaction course model. generating one or more second prediction lines by adding subsequent data points;
The prediction line calculation method, wherein the step of calculating the prediction line outputs the first prediction line and the second prediction line.
Applications Claiming Priority (2)
| Application Number | Priority Date | Filing Date | Title |
|---|---|---|---|
| JP2022000337 | 2022-01-05 | ||
| JP2022-000337 | 2022-01-05 |
Publications (1)
| Publication Number | Publication Date |
|---|---|
| WO2023132155A1 true WO2023132155A1 (en) | 2023-07-13 |
Family
ID=87073388
Family Applications (1)
| Application Number | Title | Priority Date | Filing Date |
|---|---|---|---|
| PCT/JP2022/043869 WO2023132155A1 (en) | 2022-01-05 | 2022-11-29 | Prediction line calculating device, and prediction line calculation method |
Country Status (1)
| Country | Link |
|---|---|
| WO (1) | WO2023132155A1 (en) |
Citations (7)
| Publication number | Priority date | Publication date | Assignee | Title |
|---|---|---|---|---|
| JP2004212120A (en) * | 2002-12-27 | 2004-07-29 | Wako Pure Chem Ind Ltd | Measuring instrument having measured value estimating function and measuring method using the same |
| JP2007010584A (en) * | 2005-07-01 | 2007-01-18 | Shiseido Co Ltd | Method and device for evaluating amount of urea in object, method and device for evaluating amounts of urea and moisture in object, program, and computer-readable recording medium |
| JP2007188484A (en) * | 2005-12-19 | 2007-07-26 | F Hoffmann La Roche Ag | Analytical method and instrument |
| JP2008188302A (en) * | 2007-02-06 | 2008-08-21 | Shiseido Co Ltd | Evaluation method of beauty method |
| WO2011132525A1 (en) * | 2010-04-20 | 2011-10-27 | 株式会社日立ハイテクノロジーズ | Automatic analysis device and automatic analysis method |
| WO2012157386A1 (en) * | 2011-05-16 | 2012-11-22 | 株式会社日立ハイテクノロジーズ | Automatic analysis device and automatic analysis program |
| US20210035184A1 (en) * | 2019-07-31 | 2021-02-04 | L'oreal | Systems and methods for generating personalized skincare formulations based on biomarker analysis |
-
2022
- 2022-11-29 WO PCT/JP2022/043869 patent/WO2023132155A1/en active Search and Examination
Patent Citations (7)
| Publication number | Priority date | Publication date | Assignee | Title |
|---|---|---|---|---|
| JP2004212120A (en) * | 2002-12-27 | 2004-07-29 | Wako Pure Chem Ind Ltd | Measuring instrument having measured value estimating function and measuring method using the same |
| JP2007010584A (en) * | 2005-07-01 | 2007-01-18 | Shiseido Co Ltd | Method and device for evaluating amount of urea in object, method and device for evaluating amounts of urea and moisture in object, program, and computer-readable recording medium |
| JP2007188484A (en) * | 2005-12-19 | 2007-07-26 | F Hoffmann La Roche Ag | Analytical method and instrument |
| JP2008188302A (en) * | 2007-02-06 | 2008-08-21 | Shiseido Co Ltd | Evaluation method of beauty method |
| WO2011132525A1 (en) * | 2010-04-20 | 2011-10-27 | 株式会社日立ハイテクノロジーズ | Automatic analysis device and automatic analysis method |
| WO2012157386A1 (en) * | 2011-05-16 | 2012-11-22 | 株式会社日立ハイテクノロジーズ | Automatic analysis device and automatic analysis program |
| US20210035184A1 (en) * | 2019-07-31 | 2021-02-04 | L'oreal | Systems and methods for generating personalized skincare formulations based on biomarker analysis |
Non-Patent Citations (2)
| Title |
|---|
| AKAZAWA RIO, NAKAYAMA SUGURU, YAMAZAKI AKIKO, HASHIMOTO TOSHIO, HAMADA CHIKUMA: "Statistical selection of an appropriate enzyme-inhibition model", FOLIA PHARMACOLOGICA JAPONICA, vol. 133, no. 6, 1 January 2009 (2009-01-01), pages 313 - 318, XP093076840, DOI: 10.1254/fpj.133.313 * |
| TAKAHASHI MOTOJI: "Non-Invasive Techniques to Measure Physiological Properties of the Skin and Their Application to Efficacy Test of Skin Care Products ", JOURNAL OF SOCIETY OF COSMETIC CHEMISTS OF JAPAN, vol. 34, no. 1, 1 January 2000 (2000-01-01), pages 5 - 24, XP093076846, DOI: 10.5107/sccj.34.5 * |
Similar Documents
| Publication | Publication Date | Title |
|---|---|---|
| Coon et al. | Moving from significance to real-world meaning: methods for interpreting change in clinical outcome assessment scores | |
| Plebani | Performance specifications for the extra-analytical phases of laboratory testing: why and how | |
| JP5800595B2 (en) | Medical diagnosis support apparatus, medical diagnosis support system, medical diagnosis support control method, and program | |
| WO2012157386A1 (en) | Automatic analysis device and automatic analysis program | |
| US20160259899A1 (en) | Clinical decision support system for diagnosing and monitoring of a disease of a patient | |
| Ma et al. | Real-world big-data studies in laboratory medicine: current status, application, and future considerations | |
| EP2457091B1 (en) | System and method for determining sigma of a clinical diagnostic process | |
| US20200168305A1 (en) | Modular patient analytics | |
| CN107407686A (en) | Automatic analysing apparatus | |
| WO2022081926A1 (en) | System and method for providing clinical decision support | |
| EP1156434A1 (en) | Device and method for automating the resource and operating material management of an analysis instrument | |
| EP2597469B1 (en) | Accuracy management system | |
| JP2023507991A (en) | Chromatogram automatic analysis method for blood test evaluation | |
| CN116490929A (en) | Computer-implemented method and apparatus for performing laboratory value analysis of medicine | |
| McLaren et al. | Cost effectiveness of medical devices to diagnose pre-eclampsia in low-resource settings | |
| JP2011090014A (en) | System and method for determining clinical equivalence of test method | |
| CN111406294B (en) | Automatically generating rules for laboratory instruments | |
| CN104755937B (en) | Automatic analysing apparatus | |
| WO2023132155A1 (en) | Prediction line calculating device, and prediction line calculation method | |
| Brankovic et al. | Explainable machine learning for real-time deterioration alert prediction to guide pre-emptive treatment | |
| JP2023169350A (en) | Augmenting measurement values of biological samples | |
| JP5547639B2 (en) | Estimating diagnostic markers | |
| JP5106906B2 (en) | Automatic analyzer | |
| CN108091390A (en) | Supplement automatic analyzer measurement result | |
| WO2020195783A1 (en) | Data analysis method, data analysis system, and computer |
Legal Events
| Date | Code | Title | Description |
|---|---|---|---|
| DPE2 | Request for preliminary examination filed before expiration of 19th month from priority date (pct application filed from 20040101) | ||
| 121 | Ep: the epo has been informed by wipo that ep was designated in this application |
Ref document number: 22918742 Country of ref document: EP Kind code of ref document: A1 |