WO2023113013A1 - 疾患発症の可能性の推定を行う遺伝子の選別方法及び疾患発症の可能性を推定する方法 - Google Patents
疾患発症の可能性の推定を行う遺伝子の選別方法及び疾患発症の可能性を推定する方法 Download PDFInfo
- Publication number
- WO2023113013A1 WO2023113013A1 PCT/JP2022/046394 JP2022046394W WO2023113013A1 WO 2023113013 A1 WO2023113013 A1 WO 2023113013A1 JP 2022046394 W JP2022046394 W JP 2022046394W WO 2023113013 A1 WO2023113013 A1 WO 2023113013A1
- Authority
- WO
- WIPO (PCT)
- Prior art keywords
- disease
- genes
- disease type
- stem cells
- subject
- Prior art date
- Legal status (The legal status is an assumption and is not a legal conclusion. Google has not performed a legal analysis and makes no representation as to the accuracy of the status listed.)
- Ceased
Links
Images





Classifications
-
- C—CHEMISTRY; METALLURGY
- C12—BIOCHEMISTRY; BEER; SPIRITS; WINE; VINEGAR; MICROBIOLOGY; ENZYMOLOGY; MUTATION OR GENETIC ENGINEERING
- C12N—MICROORGANISMS OR ENZYMES; COMPOSITIONS THEREOF; PROPAGATING, PRESERVING, OR MAINTAINING MICROORGANISMS; MUTATION OR GENETIC ENGINEERING; CULTURE MEDIA
- C12N15/00—Mutation or genetic engineering; DNA or RNA concerning genetic engineering, vectors, e.g. plasmids, or their isolation, preparation or purification; Use of hosts therefor
- C12N15/09—Recombinant DNA-technology
-
- C—CHEMISTRY; METALLURGY
- C12—BIOCHEMISTRY; BEER; SPIRITS; WINE; VINEGAR; MICROBIOLOGY; ENZYMOLOGY; MUTATION OR GENETIC ENGINEERING
- C12Q—MEASURING OR TESTING PROCESSES INVOLVING ENZYMES, NUCLEIC ACIDS OR MICROORGANISMS; COMPOSITIONS OR TEST PAPERS THEREFOR; PROCESSES OF PREPARING SUCH COMPOSITIONS; CONDITION-RESPONSIVE CONTROL IN MICROBIOLOGICAL OR ENZYMOLOGICAL PROCESSES
- C12Q1/00—Measuring or testing processes involving enzymes, nucleic acids or microorganisms; Compositions therefor; Processes of preparing such compositions
- C12Q1/68—Measuring or testing processes involving enzymes, nucleic acids or microorganisms; Compositions therefor; Processes of preparing such compositions involving nucleic acids
- C12Q1/6844—Nucleic acid amplification reactions
- C12Q1/6851—Quantitative amplification
-
- G—PHYSICS
- G16—INFORMATION AND COMMUNICATION TECHNOLOGY [ICT] SPECIALLY ADAPTED FOR SPECIFIC APPLICATION FIELDS
- G16B—BIOINFORMATICS, i.e. INFORMATION AND COMMUNICATION TECHNOLOGY [ICT] SPECIALLY ADAPTED FOR GENETIC OR PROTEIN-RELATED DATA PROCESSING IN COMPUTATIONAL MOLECULAR BIOLOGY
- G16B25/00—ICT specially adapted for hybridisation; ICT specially adapted for gene or protein expression
- G16B25/10—Gene or protein expression profiling; Expression-ratio estimation or normalisation
-
- G—PHYSICS
- G16—INFORMATION AND COMMUNICATION TECHNOLOGY [ICT] SPECIALLY ADAPTED FOR SPECIFIC APPLICATION FIELDS
- G16H—HEALTHCARE INFORMATICS, i.e. INFORMATION AND COMMUNICATION TECHNOLOGY [ICT] SPECIALLY ADAPTED FOR THE HANDLING OR PROCESSING OF MEDICAL OR HEALTHCARE DATA
- G16H50/00—ICT specially adapted for medical diagnosis, medical simulation or medical data mining; ICT specially adapted for detecting, monitoring or modelling epidemics or pandemics
- G16H50/50—ICT specially adapted for medical diagnosis, medical simulation or medical data mining; ICT specially adapted for detecting, monitoring or modelling epidemics or pandemics for simulation or modelling of medical disorders
Definitions
- the present disclosure relates to a method for selecting genes suitable for predicting a specific disease type, a selection program, and a computer-readable recording medium recording the selection program. Additionally, the present disclosure relates to methods of determining the likelihood of developing a disease belonging to a particular disease type.
- Non-Patent Document 1 reports that deep learning is used to predict the effects of mutations on tissue-specific expression and disease risk from DNA sequence information.
- the present inventors analyzed the known effects of 20 substances externally exposed to embryonic stem (ES) cells in Non-Patent Document 2, neurotoxicity, genetic carcinogenicity, and non-genetic carcinogenicity, using a gene network. However, they have also reported highly accurate prediction results for chemical substances whose effects are unknown by using a support vector machine (SVM).
- SVM support vector machine
- the disease risk is predicted by perturbing the gene expression of ES cells, which are pluripotent stem cells that can become human fetuses, from the outside.
- the purpose of the present disclosure is to provide a method for selecting genes suitable for high-performance prediction of specific disease types. It is also an object of the present disclosure to provide a sophisticated method for determining the likelihood of developing a disease belonging to a particular disease type.
- the present inventors have found that disease types can be predicted by statistical methods and machine learning based on gene expression information of stem cells produced from individuals. got In particular, the prediction of disease types with genetic disease factors is performed by performing machine learning using support vector machines after determining the ranking using the t-test based on the gene expression information of iPS cells generated from individuals. I found out what I can do. As shown in the examples, the prediction rate is the result of using disease-derived iPS cell data that develops disease in 5 types, with an accuracy of 95.7% in the brain, AUC 1.00, and an accuracy of 82.6% in skeletal muscle, AUC 1.00. The prediction rate was shown. In the brain, skeletal muscle, skin, and metabolic system, the number of characteristic genes used for the highest prediction rate was 17, 1, 58, and 51, and these genes are considered to be important for disease type prediction.
- the present disclosure has been completed through further studies based on these findings. It provides a recording medium, a method for determining the likelihood of developing a disease belonging to a specific disease type, and the like.
- Section 1 A method of selecting genes suitable for predicting a particular disease type, comprising the steps of: (1) Applying gene expression levels in stem cells derived from a subject who has not developed a disease belonging to the disease type and stem cells derived from a subject who has developed a disease belonging to the disease type to statistical methods and machine learning and selecting genes suitable for predicting the disease type.
- Section 2. The step (1) is (1a) A characteristic gene is obtained by using a statistical method on gene expression levels in stem cells derived from a subject who has not developed a disease belonging to the disease type and stem cells derived from a subject who has developed a disease belonging to the disease type. and (1b) selecting a gene suitable for predicting the disease type using machine learning for one or more characteristic genes from the top of the ranking. Method. Item 3.
- Method. Item 5. (0) Item 1, further comprising the step of measuring gene expression levels in a subject-derived stem cell that has not developed a disease belonging to the disease type and a subject-derived stem cell that has developed a disease belonging to the disease type. 5.
- Item 6. A program for selecting genes suitable for predicting a particular disease type that causes the computer to perform the following steps: (1) Applying gene expression levels in stem cells derived from a subject who has not developed a disease belonging to the disease type and stem cells derived from a subject who has developed a disease belonging to the disease type to statistical methods and machine learning and selecting genes suitable for predicting the likelihood of developing said disease type.
- Item 7. Item 7. A computer-readable recording medium recording the selection program according to item 6.
- a method of determining the likelihood of developing a disease belonging to a particular disease type comprising the steps of: (A) A step of determining the possibility of developing a disease belonging to the disease type based on the expression level of one or more genes described in any one of FIGS. 1 to 4 in subject-derived stem cells. Item 9.
- One or more genes described in Figure 1 are selected from the group consisting of MYO19, SKA1, TRIM11, WDR47, LENG8, NAB2, KHDRBS3, SYF2, NSUN5P1, EME2, BRD7, SELENBP1, METTL3, OSER1, and FBXO41 one or more genes, one or more of the genes described in FIG.
- 2 is RP2, 1 or 2 or more genes described in FIG. , MLST8, ZC3H18, PKN1, LSM10, THAP4, AURKAIP1, CD320, WDR4, N4BP3, RPL7P9, TRAF2, ISOC2, SPOUT1, ATP6V0B, ACOT7, RNASEH1-AS1, NUP62, CCDC71, LMNB2, SLC39A3, COG3, SGTA, POLR3E, NCAPH2 , ZSWIM4, MPV17L2, AGPAT1, BRF1, CCDC14, TEDC2, LONP1, C4orf3, UPF1, AL031708, and one or more genes selected from the group consisting of PSMA7, 1 or 2 or more genes described in FIG.
- FIG. 1 are one or more genes selected from the group consisting of MYO19, SKA1, TRIM11, WDR47, LENG8, NAB2, KHDRBS3, SYF2, NSUN5P1, and EME2, one or more of the genes described in FIG. 2 is RP2, 1 or 2 or more genes described in FIG. , MLST8, ZC3H18, PKN1, LSM10, THAP4, AURKAIP1, CD320, WDR4, N4BP3, RPL7P9, TRAF2, ISOC2, SPOUT1, ATP6V0B, and one or more genes selected from the group consisting of ACOT7, 1 or 2 or more genes described in FIG.
- step (A) the gene expression level of stem cells derived from a subject who has not developed a disease belonging to the disease type and the gene expression level of stem cells derived from a subject who has developed a disease belonging to the disease type 11.
- Item 12. 12 The method of any one of paragraphs 8-11, wherein the disease type is a disease in the brain, skeletal muscle, skin, or metabolic system.
- Item 13 (A0) The method according to any one of items 8 to 12, further comprising the step of measuring the expression level of one or more genes described in any one of FIGS. 1 to 4 in the subject-derived stem cells. the method of. Item 14. The method according to any one of Items 1 to 5 and 8 to 13, the program according to Item 6, or the recording medium according to Item 7, wherein the stem cells are pluripotent stem cells. Item 15. The method according to any one of Items 1 to 5 and 8 to 13, the program according to Item 6, or the recording medium according to Item 7, wherein the stem cells are induced pluripotent stem (iPS) cells.
- iPS induced pluripotent stem
- the method of the present disclosure it is possible to select genes suitable for high-performance prediction of specific disease types. Furthermore, according to the method of the present disclosure, it is possible to make a high-performance determination of the possibility of developing a disease belonging to a specific disease type based on the expression information of a specific gene.
- stem cells can be used as they are undifferentiated and there is no need to differentiate them into organs, it is possible to predict the possibility of developing a specific disease type at low cost and in a short period of time.
- FIG. 10 is a diagram showing genes (Ensemble gene IDs, gene names) included in 17 genes, the number of genes in the highest prediction rate of the brain, together with the number of times of use in leave-one-out cross-validation.
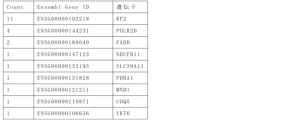
- FIG. 10 is a diagram showing genes (Ensemble gene ID, gene name) included in one gene in the highest prediction rate of skeletal muscle in Examples, together with the number of times of use in leave-one-out cross-validation.
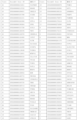
- FIG. 10 is a diagram showing genes (Ensemble gene IDs, gene names) included in 58 genes in the highest skin prediction rate in Examples, together with the number of times they were used in cross-validation without one.
- FIG. 10 is a diagram showing genes (Ensemble gene IDs, gene names) included in 17 genes, the number of genes in the highest prediction rate of the brain, together with the number of times of use in leave-one-out cross-validation.
- FIG. 10 is a diagram showing genes (Ensemble gene ID, gene name) included in one
- FIG. 10 is a diagram showing genes (Ensemble gene IDs, gene names) included in 58 genes in the highest skin prediction rate in Examples, together with the number of times they were used in cross-validation without one.
- FIG. 10 is a diagram showing genes (Ensemble gene IDs, gene names) included in 58 genes in the highest skin prediction rate in Examples, together with the number of times they were used in cross-validation without one.
- FIG. 4 is a diagram showing genes (Ensemble gene IDs, gene names) included in 51 genes in the highest prediction rate of the metabolic system in Examples, along with the number of times of use in cross-validation without one.
- FIG. 4 is a diagram showing genes (Ensemble gene IDs, gene names) included in 51 genes in the highest prediction rate of the metabolic system in Examples, along with the number of times of use in cross-validation without one.
- FIG. 4 is a diagram showing genes (Ensemble gene IDs, gene names) included in 51 genes in the highest prediction rate of the metabolic system in Examples, along with the number of times of use in cross-validation without one. It is a flowchart which shows the processing procedure of a gene selection method.
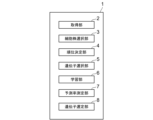
- 1 is a block diagram of a selection device that executes a gene selection method
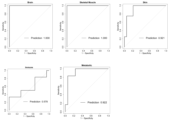
- FIG. 4 is a graph showing AUC in diseases of the brain, skeletal muscle, skin, immune system, and metabolic system in Examples.
- the method for selecting a gene suitable for predicting a specific disease type of the present disclosure (hereinafter sometimes referred to as the “selection method of the present disclosure”) is characterized by including the following steps.
- Disease type in the present disclosure means a general term for diseases that develop in each tissue (eg, immune system disease, skin disease, brain disease, etc.).
- tissue refers to the tissue of animals including humans, and the tissue here means organs and organs.
- the tissue is not particularly limited, and examples include musculoskeletal system, human skeleton, joints, ligaments, muscular system, tendon, digestive system, mouth, teeth, tongue, salivary gland, parotid gland, submandibular gland, sublingual gland.
- the present disclosure is a method of identifying a gene that can be used to predict a specific disease type, where the likelihood of developing a disease in each tissue is predicted regardless of the type of disease, i.e., brain, skin, etc. make predictions about the likelihood that any disease will develop in the tissues of Therefore, the type of disease is not particularly limited as long as the disease can develop in each tissue, and any disease can be used.
- the gene to be selected in the method of the present disclosure may be one or a plurality of genes of two or more, and in the case of a plurality of genes of two or more, each is used alone for prediction , or may be used in combination.
- stem cells instead of iPS cells.
- Stem cells here are not particularly limited as long as the effects of the present disclosure can be obtained, and include, for example, pluripotent stem cells, tissue stem cells (somatic stem cells), and the like.
- tissue stem cells sematic stem cells
- iPS cells are mainly described below, the description can be similarly applied to other stem cells.
- Pluripotent stem cells are stem cells that have the ability (pluripotency) to differentiate into any of the three germ layers (endoderm, mesoderm, and ectoderm) and are capable of self-renewal.
- pluripotent stem cells include embryonic stem (ES) cells, induced pluripotent stem (iPS) cells, embryonic stem (ntES) cells derived from cloned embryos obtained by nuclear transfer, and spermatogonial stem cells (GS cells). , embryonic germ cells (EG cells), cultured fibroblasts, and pluripotent cells derived from bone marrow stem cells (Muse cells).
- tissue stem cells means stem cells that have the ability to differentiate into various cell types (pluripotency), although the tissues to differentiate are limited.
- tissue stem cells include mesenchymal stem cells, neural stem cells, hematopoietic stem cells, liver stem cells, pancreatic stem cells, germ stem cells, epithelial stem cells, gastrointestinal epithelial stem cells, dental pulp stem cells, retinal stem cells, epidermal stem cells, hair follicle stem cells, and the like. be done.
- step (1) subject-derived iPS cells that have not developed a disease belonging to the disease type (hereinafter sometimes referred to as “disease-free iPS cells”) and a disease that belongs to the disease type have developed. Applying statistical methods and machine learning to the gene expression levels in iPS cells derived from a subject with a disease (hereinafter sometimes referred to as “disease-type iPS cells”), suitable for predicting the disease type Select genes that have
- iPS cells can be produced by known methods, for example, by introducing reprogramming factors into arbitrary somatic cells.
- the initialization factors include, for example, Oct3/4, Sox2, Sox1, Sox3, Sox15, Sox17, Klf4, Klf2, c-Myc, N-Myc, L-Myc, Nanog, Lin28, Fbx15, ERas, ECAT15 -2, Tcl1, beta-catenin, Lin28b, Sall1, Sall4, Esrrb, Nr5a2, Tbx3, Glis1, and other genes or gene products, and these reprogramming factors can be used alone or in combination of two or more Available.
- WO2009 /101084 WO2009/101407, WO2009/102983, WO2009/114949, WO2009/117439, WO2009/126250, WO2009/126251, WO2009/126655, WO2009/157593, WO2010/0090 15, WO2010/033906, WO2010/033920, WO2010/042800 , WO2010/050626, WO2010/056831, WO2010/068955, WO2010/098419, WO2010/102267, WO2010/111409, WO2010/111422, WO2010/115050, WO2010/124290, WO20 10/147395, WO2010/147612, Huangfu D et al.
- the somatic cells are not particularly limited, and include fetal (pup) somatic cells, neonatal (pup) somatic cells, and mature healthy and diseased somatic cells. Also included are cells and cell lines.
- tissue stem cells such as neural stem cells, hematopoietic stem cells, mesenchymal stem cells, dental pulp stem cells, (2) tissue progenitor cells, (3) blood cells (peripheral blood cells, umbilical cord blood cells, etc.), lymphocytes, epithelial cells, endothelial cells, muscle cells, fibroblasts (skin cells, etc.), hair cells, hepatocytes, gastric mucosa cells, enterocytes, splenocytes, pancreatic cells (pancreatic exocrine cells, etc.), Differentiated cells such as brain cells, lung cells, renal cells, adipocytes, and the like are included.
- the subject is the target organism of the selection method of the present disclosure, and since the organism derived from the above tissue is the subject, it particularly includes mammals including humans.
- a subject who has not developed a disease belonging to the disease type and a subject who has developed a disease belonging to the disease type are the same organisms in order to select genes capable of high-performance prediction. is desirable.
- the method for classifying the disease in which the subject is developing into the disease type is not particularly limited, and various known disease databases, literature, etc. information (for example, MalaCards (https://www.malacards.org/)).
- the correspondence between diseases and disease types is not limited to 1:1, and one disease is classified into two or more disease types if it develops in multiple tissues depending on the type of disease.
- gene expression refers to the process of converting genetic information encoded by a gene into RNA (e.g., mRNA, rRNA, tRNA, snRNA, ncRNA) through transcription of the gene, or , refers to the process of converting mRNA into protein through “translation”.
- measuring the gene expression level includes measuring the RNA expression level.
- RNA isolated from each iPS cell can be used. Isolation of total RNA from each iPS cell is performed using methods known in the art or by using a commercially available kit (e.g., RNeasy Mini Kit (Qiagen)) according to the manufacturer's instructions. be able to.
- a commercially available kit e.g., RNeasy Mini Kit (Qiagen)
- cDNA synthesized from RNA can also be used.
- RNA expression levels in iPS cells For the measurement of gene expression levels in iPS cells, methods known in the art for measuring gene expression levels can be used. Such methods include, for example, microarray method, real-time PCR method, northern blotting method, EST method, SAGE method (gene expression linkage analysis) method, NGS (next generation sequencer), and sequencing method using nanopore sequencer. be done.
- the gene expression level may be obtained by measuring the amount of total RNA or by measuring the amount of a part of RNA.
- the data obtained about the gene expression level may be subjected to gene ID conversion, missing value processing, normalization, logarithmic conversion, etc. as preprocessing used for subsequent analysis.
- gene expression level data in diseased and disease-free iPS cells is used to analyze by statistical methods and machine learning to select genes suitable for disease type prediction.
- Statistical methods and machine learning are not particularly limited as long as they can select genes suitable for prediction of any disease type, and various known methods can be used.
- step (1) include the following steps.
- the order of characteristic genes is determined by using a statistical method for gene expression levels in diseased and disease-free iPS cells.
- the characteristic gene means a gene with a significant statistic for testing the degree of difference (for example, based on mean value and variance) in the expression level of each gene in diseased-type and disease-free iPS cells. do.
- the degree of expression for example, the magnitude of the difference in expression level
- the degree of expression is obtained by comparing the gene expression level in diseased-type iPS cells and the gene expression level in disease-free iPS cells. ) (eg, ranked in descending order of magnitude of expression level).
- the gene expression level of the diseased type iPS cells is greater than the gene expression level of the disease-free iPS cells, or if the gene expression level of the disease-free iPS cells is greater than that of the diseased type may be greater than the gene expression level of the iPS cells.
- Statistical methods are not particularly limited as long as they are capable of ranking the difference between the gene expression levels of diseased-type iPS cells and disease-free iPS cells.
- a t-test can be used, and a two-sample t-test can be preferably used.
- Wilcoxon, chi-square test, etc. can also be used.
- forward selection, backward selection, and exhaustive search methods for finding combinations of feature quantities can also be used.
- an embedded method that selects features during learning can also be used.
- step (1b) machine learning is used for one or more of the characteristic genes in the order determined in step (1a) to select genes suitable for disease type prediction.
- the feature genes used for machine learning are the feature gene with the highest ranking (hereinafter, the N-th feature gene from the top is sometimes referred to as the N-th feature gene), and the ranking is 1.
- the number of characteristic genes used for machine learning is, for example, 1 to 300, 1 to 200, 1 to 100, etc.
- the specific number of characteristic genes is 1, 2, 3, 4, 5, 6, 7, 8, 9, 10, 11, 12, 13, 14. 15, 16, 17, 18, 19, 20, 21, 22, 23, 24, 25, 26, 27, 28, 29, 30, 31, 32, 33, 34, 35, 36, 37, 38, 39, 40, 41, 42, 43, 44, 45, 46, 47 , 48, 49, 50, 51, 52, 53, 54, 55, 56, 57, 58, 59, 60, 61, 62, 63, 64 65, 66, 67, 68, 69, 70, 71, 72, 73, 74, 75, 76, 77, 78, 79, 80, 81, 82, 83, 84, 85, 86, 87, 88, 89, 90, 91, 92, 93, 94, 95, 96, 97 , 98, 99, 100, and so on.
- Machine learning is not particularly limited as long as it can be used to determine the possibility of developing a disease belonging to a disease type based on the expression level of one or more characteristic genes, such as support vector machines (SVM). , random forest, boosting, bagging, neural network, deep learning, etc. Among them, support vector machines can be preferably used. When using support vector machines, any kernel function such as linear, polynomial, radial basis functions, maximum entropy, etc. can be used.
- SVM support vector machines
- any kernel function such as linear, polynomial, radial basis functions, maximum entropy, etc. can be used.
- the expression level of characteristic genes of diseased iPS cells and the expression level of characteristic genes of disease-free iPS cells are input, and the probability of developing a disease belonging to the disease type is used as an output for learning.
- the number of characteristic genes that give the highest prediction rate can be determined, and the genes included therein can be selected as genes suitable for predicting disease type.
- machine learning is performed using various numbers of feature genes, test data is used to determine the number of feature genes (N) that yield the highest prediction rate, and the ranking is determined. Characteristic genes at positions 1 to N can be regarded as genes suitable for prediction of disease type.
- one or more evaluation indicators of machine learning can be used, such as accuracy, AUC (Area Under the Curve), etc. indicators can be used. Misclassification rate, balanced accuracy, F1 value, Matthews correlation coefficient, etc. can also be used.
- Methods for determining the number of characteristic genes that provide the highest prediction rate include, for example, cross-validation, and cross-validation includes holdout validation, k-fold cross-validation, leave-one-out cross-validation, etc. Any kind of cross-validation can be used.
- Cross-validation may be applied not only to step (1b), but also to both steps (1a) and (1b).
- the types of characteristic genes ranked in step (1a) also change for each cross-validation. is used, and the number of feature genes that yield the highest prediction rate is N, then the leave-one-out cross-validation is performed M times, and N feature genes are determined for each.
- M ⁇ N genes will be selected as genes suitable for predicting the likelihood that a type will develop. There is a possibility that the same gene exists in M ⁇ N genes, and the same gene exists 1 to M times. Therefore, genes that are present in greater numbers are considered to be more suitable for predicting the likelihood of developing a disease type.
- FIG. 5 is a flow chart showing the processing procedure of the gene selection method according to one embodiment of the present invention
- FIG. 6 is a functional block diagram of the selection device 1 that executes the selection method.
- the selection device 1 can be configured with a general-purpose computer, and includes processors such as CPU and GPU, main storage devices such as DRAM and SRAM, and auxiliary storage devices such as HDD and SSD as hardware configurations. Further, the selection device 1 may be composed of a plurality of computers.
- the selection device 1 includes, as functional blocks, an acquisition unit 2, a cell line selection unit 3, a ranking determination unit 4, a gene selection unit 5, a learning unit 6, a prediction rate measurement unit 7, and a gene selection unit 8. , provided. These units can be realized in software by the processor of the selection device 1 reading the selection program according to the present embodiment into the main storage device and executing it.
- the selection program may be downloaded to the selection device 1 via a communication network such as the Internet, or may be downloaded to the selection device 1 via a computer-readable non-temporary recording medium such as a CD-R recording the selection program. may be installed.
- step S1 the acquisition unit 2 obtains the gene expression level data obtained as a result of measuring the gene expression levels of the diseased-type iPS cell line and the disease-free iPS cell line. get. In this embodiment, it is assumed that there are 23 iPS cell lines. Gene expression levels can be measured by the method described above. Measured values and logarithmically normalized data are used as gene expression level data. In addition, as gene expression levels, total RNA and RNA of some genes suitable for use in analysis are used.
- the ranking determination unit 4 uses a statistical method to determine the ranking of characteristic genes from the learning cell lines. That is, the ranking determination unit 4 uses a statistical method on the gene expression levels of the diseased-type iPS cell line and the disease-free iPS cell line, for example, the probability using the two-sample t-test between the two groups to rank feature genes.
- the disease type the disease type assigned based on the disease information of the iPS cell line is used using database information such as MalaCards.
- step S6 N is set to 1, and in step S7, the gene selection unit 5 selects one characteristic gene from the top of the order determined in step S5.
- step S8 the learning unit 6 performs machine learning on the relationship between the expression level of the characteristic gene selected in step S7 and the presence or absence of disease occurrence in the learning cell line, and creates a learned model.
- the learning unit 6 performs machine learning using a support vector machine.
- step S9 the prediction rate measurement unit 7 predicts test cell lines. That is, by inputting the expression level data of the test cell line selected in step S3 into the learned model created in step S8, the presence or absence of disease occurrence in the test cell line is predicted.
- N is less than 100 (NO in step S10), N is incremented by 1 in step S11, and steps S7 to S9 are repeated. That is, steps S3 to S9 are repeated 100 times, which is the number of feature genes.
- N 100 (YES in step S10), if X is less than 23 (NO in step S12), X is incremented by 1 in step S13, and steps S3 to S11 are repeated.
- step S15 the gene selection unit 8 selects genes included in the number of characteristic genes determined in step S14 as genes suitable for disease type prediction.
- the number of characteristic genes is determined to be 17 as described above, 17 genes are included in every 23 times of leave-one-out cross-validation, so 17 ⁇ 23 genes are selected.
- processing for removing duplication of genes is performed as appropriate. Since 1 to 23 of the same genes are present, it can be determined that the more genes are present, the more important the gene is for predicting the disease type.
- genes suitable for prediction are selected for each type.
- Method for determining the possibility of developing a disease belonging to a specific disease type A is characterized by including the following steps.
- (A) A step of determining the possibility of developing a disease belonging to the disease type based on the expression level of one or more genes described in any one of FIGS. 1 to 4 in iPS cells derived from the subject. .
- the terms such as disease type and subject in the determination method of the present disclosure are the same as those described in the selection method of the present disclosure.
- iPS cells are mainly described below, the description can be similarly applied to other stem cells.
- step (A) the possibility of developing a disease belonging to the disease type is determined based on the expression level of one or more genes described in any one of FIGS. make a judgment.
- the expression level of one or more genes described in any one of FIGS. 1 to 4 means the expression level of one or more genes described in FIG. It means the expression level of the above genes, the expression level of one or two or more genes described in FIG. 3, or the expression level of one or two or more genes described in FIG.
- the genes described in Figures 1 to 4 are used to determine the possibility of developing diseases in the brain ( Figure 1), skeletal muscle ( Figure 2), skin ( Figure 3), and metabolic system ( Figure 4), respectively. can do.
- HGNC Human Genome Nomenclature Committee
- Genes described in Figure 1 MYO19, SKA1, TRIM11, WDR47, LENG8, NAB2, KHDRBS3, SYF2, NSUN5P1, EME2, BRD7, SELENBP1, METTL3, OSER1, FBXO41, HEATR5B, SGSM2, SETP14, SRSF2, AGAP1, CTR9, BAHD1, MRPS33, PCMTD2, MTCO1P12, EIF1AXP1, AL391058, AGPAT1, CCNL2, HNRNPA1P12, DMD, L3MBTL3, MT-CO3, MT-CO1, MTCO3P12, ADH5, SLC25A29, TMEM120B, ZDHHC23, BTBD9, NPIPA1, GLDC, KDF1, CLCN5, NUDCD2, SNIP1, ZC3H12A, MAG OH,
- the one or more genes described in Figure 1 are selected from the group consisting of MYO19, SKA1, TRIM11, WDR47, LENG8, NAB2, KHDRBS3, SYF2, NSUN5P1, EME2, BRD7, SELENBP1, METTL3, OSER1, and FBXO41
- the one or more genes described in Figure 2 are preferably RP2.
- One or more genes described in FIG. from PATL1, MOAP1, KDR, PRUNE2, ITPRIPL1, TBK1, UBE2Q1, PTRH2, ABCC4, CPEB4, DDAH2, TCEAL5, PIGO, SLC2A4RG, TMEM14C, CASC15, ATRAID, PSME4, GET1, ANKRD54, FKBP5, FAM89B, CLTB, and DGKK
- one or more genes selected from the group consisting of FASTKD5, DDAH2, UBE2L3, SIAH2, ICE1, ZFPL1, SFR1, ACSL1, TKFC, CREB3L4, INTS7, SLTM, SLC44A2, ZC3H7A, TCERG1, MTRF1L One or more genes selected from the group consisting of C3orf18, TTC38, TUBE1, PATL1, MOAP1, KDR, PRUNE2, ITPRIPL1, TBK1, UBE2Q1, PTRH2, ABCC4, CPEB4, DDAH2, TCE
- genes listed above were selected as genes suitable for predicting the likelihood of developing a specific disease type using the selection method of the present disclosure.
- the number of genes used to determine the likelihood of developing a specific disease type is, for example, 1-300, 1-200, 1-100, etc. Specific numbers of genes are 1, 2, 3, 4, 5, 6, 7, 8, 9, 10, 11, 12, 13, 14. , 15, 16, 17, 18, 19, 20, 21, 22, 23, 24, 25, 26, 27, 28, 29, 30, 31 32, 33, 34, 35, 36, 37, 38, 39, 40, 41, 42, 43, 44, 45, 46, 47, 48, 49, 50, 51, 52, 53, 54, 55, 56, 57, 58, 59, 60, 61, 62, 63, 64 , 65, 66, 67, 68, 69, 70, 71, 72, 73, 74, 75, 76, 77, 78, 79, 80, 81 82, 83, 84, 85, 86, 87, 88, 89, 90, 91, 92, 93, 94, 95, 96, 97, 98, 99, 100 and so on.
- Subject-derived iPS cells can be produced based on the above-described known method using cells contained in a biological sample collected from the subject.
- the biological sample is a cell, tissue, body fluid, or the like collected from a subject, and is not particularly limited as long as it contains cells capable of producing iPS cells.
- Conditions for culturing iPS cells such as medium, culture temperature, culture time, and culture vessel, are not particularly limited, and known conditions can be used as appropriate.
- Gene expression levels can be measured using methods known in the art for measuring gene expression levels. Such methods include, for example, microarray method, real-time PCR method, northern blotting method, EST method, SAGE method (gene expression linkage analysis) method, NGS (next generation sequencer), and sequencing method using nanopore sequencer. be done.
- the gene expression level may be obtained by measuring the amount of total RNA or by measuring the amount of a part of RNA. Furthermore, the data obtained about the gene expression level may be subjected to gene ID conversion, missing value processing, normalization, logarithmic conversion, etc. as preprocessing used for subsequent analysis.
- the possibility of developing a disease belonging to a specific disease type in a subject is determined using the expression level of the above gene as an index.
- the expression level of the gene is higher than a preset cutoff value (when the gene expression level is increased in iPS cells of a diseased type), or when it is lower than a preset cutoff value (When the gene expression level is decreased in disease-prone iPS cells), it is determined that the subject has a possibility of developing a disease belonging to a specific disease type.
- the above cut-off value can be appropriately set by a person skilled in the art, and can be set, for example, from the viewpoint of sensitivity, specificity, positive predictive value, negative predictive value, and the like.
- the cutoff value can be the average value, percentile value, or maximum value of the expression levels of the above genes in disease-free iPS cells.
- cut-off values that are standardized from previously obtained data and values that are set by statistical analysis based on analysis of ROC (Receiver Operating Characteristic) curves, etc. can be used.
- the subject may be determined that there is a possibility that the subject will develop a disease belonging to a specific disease type when one of the above genes is higher or lower than the cutoff value, or two types It may be determined that there is a possibility that the subject will develop a disease belonging to a specific disease type when the above genes are higher or lower than the cutoff value.
- the gene expression level of iPS cells derived from a subject who has not developed a disease belonging to the disease type and the gene expression level of iPS cells derived from a subject who has developed a disease belonging to the disease type can also be determined using a machine-learned model using as learning data.
- the machine learning here is not particularly limited as long as it can be used to determine the possibility of developing a disease belonging to a specific disease type based on the expression level of one or more genes, such as support vectors machine (SVM), random forest, boosting, bagging, neural network, deep learning, etc., among which support vector machine can be preferably used.
- SVM support vectors machine
- any kernel function such as linear, polynomial, radial basis functions, maximum entropy, etc.
- the expression levels of characteristic genes of diseased iPS cells and the expression levels of characteristic genes of disease-free iPS cells are input, and the probability of developing a disease belonging to a specific disease type is learned as output. can be done.
- By inputting a predetermined gene expression level into the model obtained by such learning it is possible to determine the possibility that a subject will develop a disease belonging to a specific disease type.
- genes suitable for high-performance prediction of specific disease types can be selected. Furthermore, according to the determination method of the present disclosure, high-performance determination can be made about the possibility of developing a disease belonging to a specific disease type based on the expression information of a specific gene.
- stem cells can be used as undifferentiated and do not need to be differentiated into organs, it is possible to predict the possibility of developing a disease belonging to a specific disease type at low cost and in a short period of time. .
- the genome sequence is static data and has a problem of low accuracy in predicting diseases with complex gene interactions. becomes possible.
- Table 1 shows the disease category, disease name, strain number, age, sex, tissue origin, etc. of the iPS cell lines and ES cell lines used in the Examples.
- Table 2 shows the classification of each iPS cell line into 5 types of disease onset. MalaCards classifies diseases into subtypes, but RIKEN's disease names are often classified in higher order, so direct correspondence may not be expected. At that time, the first type among the subtypes considered to correspond to the disease names of RIKEN in the MalaCards classification was tentatively used. Using these 23 strains in total, a comprehensive gene expression profile was obtained by the RNA-seq method according to the following procedure.
- iPS cell lines were prepared using prime ES cell medium (ReproCell) or DMEM/F-12 medium (Thermo Fisher Scientific) on SNL cells (mouse fibroblast STO cell line). Both media were supplemented with 5 ng/ml human basic fibroblast growth factor (FUJIFILM Irvine Scientific). Thereafter, the iPS cell lines were cultured in a feeder-free cell medium StemFit AK02N ( Ajinomoto Co., Inc.) and maintained under feeder brie conditions for at least two passages.
- ReproCell prime ES cell medium
- DMEM/F-12 medium Thermo Fisher Scientific
- ES cells were also maintained in StemFit AK02N supplemented with 10 ⁇ M Y-27632 and 0.25 ⁇ g/cm 2 iMatrix-511 for at least two passages. All cell lines were washed with PBS, incubated in 0.5 ⁇ TrypLE Select (Thermo Fisher Scientific) for 3 minutes at 37°C, detached, harvested, counted and then 10 ⁇ M Y-27632 and 0.25 ⁇ g/cm 2 iMartix-511 (Inc. Nippi) was added and seeded again in StemFit AK02N (Ajinomoto Co., Inc.). The medium was changed every 1-2 days.
- RNA-seq protocol Total RNA from all cell lines was isolated using the RNeasy Mini Kit (Qiagen), followed by DNase treatment. RNA seq libraries were prepared from 350 ng of total RNA each in duplicate using the TruSeq Stranded mRNA Library Prep Kit (Illumina). ⁇ 4.2 million of 70-bp single-end reads per sample were sequenced on an illumina Hiseq 2500 sequencer (IIlumina). Nucleotide sequences were obtained from binary RNA-seq data using bcl2fastq v2.20.0.422.
- the adapter sequence was removed using trim_galore 0.4.4-dev, and the cDNA and ncRNA sequences of the Ensembl genome GRCh38r100 were mapped with M_score ⁇ 1 using bowtie2 2.2.5, and the counts were finally summarized by gene name. .
- RNA-seq data From the gene expression data of 23 strains logarithmically normalized, 5 types of disease onset tissue were predicted with 4 or more strains. Characteristic genes used for prediction were ranked according to probability using a two-sample t-test between two groups with or without diseased tissue. Using leave-one-out-cross-validation (LOOCV), we measured the highest predictive rate in the range from 1 to 100 top feature genes. Since the leave-one-out cross-validation yielded training data 23 times, prediction was performed by determining the order of characteristic genes from the training data each time using a two-sample t-test.
- LOCV leave-one-out-cross-validation
- a support vector machine (SVM) was used for learning, and four types of kernels were used: linear, polynomial, radial basis function, and maximum entropy. Since 23 predictions were made in leave-one-out cross-validation, these were aggregated to calculate accuracy and AUC (area under the receiver operating characteristic curve) to obtain the highest accuracy. When there were multiple peaks, the highest AUC was recorded. To evaluate this result, we generated uniform random numbers in a 12,499 ⁇ 23 matrix of gene expression data for 23 strains and compared it with the highest prediction rate obtained by similar cross-validation without one.
- SVM support vector machine
- Table 3 shows the number of positive and negative data, the highest accuracy and its probability of one-sample t-test results, the AUC and its probability of one-sample t-test results, and the number of feature genes.
- AUC is shown in FIG.
- the average value of the highest accuracy obtained from 10 uniform random numbers, the sample standard deviation, and the degree of freedom of 9 were used as the population.
- the T.DIST.RT function of Excel was used for the test.
- the maximum accuracy of 95.7% and AUC1.0 for brain and AUC1.0 for skeletal muscle were significant with p ⁇ 0.05.
- AUC in the skin and metabolic system also showed a high value of 0.92.
- FIGS. 1 to 4 The gene names shown in FIGS. 1 to 4 are those given by the Human Genome Nomenclature Committee (HGNC) of HUGO (Human Genome Organization). This indicates that it is possible to predict disease onset with a small number of gene combinations.
- HGNC Human Genome Nomenclature Committee
Landscapes
- Health & Medical Sciences (AREA)
- Life Sciences & Earth Sciences (AREA)
- Engineering & Computer Science (AREA)
- Chemical & Material Sciences (AREA)
- Genetics & Genomics (AREA)
- Organic Chemistry (AREA)
- Biotechnology (AREA)
- Bioinformatics & Cheminformatics (AREA)
- General Health & Medical Sciences (AREA)
- Wood Science & Technology (AREA)
- Zoology (AREA)
- Physics & Mathematics (AREA)
- General Engineering & Computer Science (AREA)
- Biophysics (AREA)
- Molecular Biology (AREA)
- Medical Informatics (AREA)
- Biomedical Technology (AREA)
- Biochemistry (AREA)
- Public Health (AREA)
- Proteomics, Peptides & Aminoacids (AREA)
- Microbiology (AREA)
- Chemical Kinetics & Catalysis (AREA)
- Data Mining & Analysis (AREA)
- Plant Pathology (AREA)
- Epidemiology (AREA)
- Primary Health Care (AREA)
- Databases & Information Systems (AREA)
- Analytical Chemistry (AREA)
- Pathology (AREA)
- Immunology (AREA)
- Bioinformatics & Computational Biology (AREA)
- Evolutionary Biology (AREA)
- Spectroscopy & Molecular Physics (AREA)
- Theoretical Computer Science (AREA)
- Measuring Or Testing Involving Enzymes Or Micro-Organisms (AREA)
Priority Applications (1)
| Application Number | Priority Date | Filing Date | Title |
|---|---|---|---|
| JP2023567843A JPWO2023113013A1 (https=) | 2021-12-17 | 2022-12-16 |
Applications Claiming Priority (2)
| Application Number | Priority Date | Filing Date | Title |
|---|---|---|---|
| JP2021205495 | 2021-12-17 | ||
| JP2021-205495 | 2021-12-17 |
Publications (1)
| Publication Number | Publication Date |
|---|---|
| WO2023113013A1 true WO2023113013A1 (ja) | 2023-06-22 |
Family
ID=86774448
Family Applications (1)
| Application Number | Title | Priority Date | Filing Date |
|---|---|---|---|
| PCT/JP2022/046394 Ceased WO2023113013A1 (ja) | 2021-12-17 | 2022-12-16 | 疾患発症の可能性の推定を行う遺伝子の選別方法及び疾患発症の可能性を推定する方法 |
Country Status (2)
| Country | Link |
|---|---|
| JP (1) | JPWO2023113013A1 (https=) |
| WO (1) | WO2023113013A1 (https=) |
Citations (3)
| Publication number | Priority date | Publication date | Assignee | Title |
|---|---|---|---|---|
| JP2005323573A (ja) * | 2004-05-17 | 2005-11-24 | Sumitomo Pharmaceut Co Ltd | 遺伝子発現データ解析方法および、疾患マーカー遺伝子の選抜法とその利用 |
| JP2017501137A (ja) * | 2013-12-02 | 2017-01-12 | オンコメッド ファーマシューティカルズ インコーポレイテッド | Wnt経路インヒビターに関連する予測バイオマーカーの同定 |
| JP2021145635A (ja) * | 2020-03-23 | 2021-09-27 | 住友化学株式会社 | 化学物質が有する内分泌系に影響を与える要因の判別方法 |
-
2022
- 2022-12-16 JP JP2023567843A patent/JPWO2023113013A1/ja active Pending
- 2022-12-16 WO PCT/JP2022/046394 patent/WO2023113013A1/ja not_active Ceased
Patent Citations (3)
| Publication number | Priority date | Publication date | Assignee | Title |
|---|---|---|---|---|
| JP2005323573A (ja) * | 2004-05-17 | 2005-11-24 | Sumitomo Pharmaceut Co Ltd | 遺伝子発現データ解析方法および、疾患マーカー遺伝子の選抜法とその利用 |
| JP2017501137A (ja) * | 2013-12-02 | 2017-01-12 | オンコメッド ファーマシューティカルズ インコーポレイテッド | Wnt経路インヒビターに関連する予測バイオマーカーの同定 |
| JP2021145635A (ja) * | 2020-03-23 | 2021-09-27 | 住友化学株式会社 | 化学物質が有する内分泌系に影響を与える要因の判別方法 |
Non-Patent Citations (4)
| Title |
|---|
| BONDER MARC JAN; SMAIL CRAIG; GLOUDEMANS MICHAEL J.; FRéSARD LAURE; JAKUBOSKY DAVID; D’ANTONIO MATTEO; LI XIN; FERRARO : "Identification of rare and common regulatory variants in pluripotent cells using population-scale transcriptomics", NATURE GENETICS, NATURE PUBLISHING GROUP US, NEW YORK, vol. 53, no. 3, 1 January 1900 (1900-01-01), New York, pages 313 - 321, XP037414604, ISSN: 1061-4036, DOI: 10.1038/s41588-021-00800-7 * |
| TAO WENSI, AYALA-HAEDO JUAN A., FIELD MATTHEW G., PELAEZ DANIEL, WESTER SARA T.: "RNA-Sequencing Gene Expression Profiling of Orbital Adipose-Derived Stem Cell Population Implicate HOX Genes and WNT Signaling Dysregulation in the Pathogenesis of Thyroid-Associated Orbitopathy", INVESTIGATIVE OPTHALMOLOGY & VISUAL SCIENCE, ASSOCIATION FOR RESEARCH IN VISION AND OPHTHALMOLOGY, US, vol. 58, no. 14, 6 December 2017 (2017-12-06), US , pages 6146, XP093072117, ISSN: 1552-5783, DOI: 10.1167/iovs.17-22237 * |
| VLASOV IVAN N., ALIEVA ANELYA KH., NOVOSADOVA EKATERINA V., ARSENYEVA ELENA L., ROSINSKAYA ANNA V., PARTEVIAN SUZANNA A., GRIVENNI: "Transcriptome Analysis of Induced Pluripotent Stem Cells and Neuronal Progenitor Cells, Derived from Discordant Monozygotic Twins with Parkinson’s Disease", CELLS, vol. 10, no. 12, 9 December 2021 (2021-12-09), pages 3478, XP093072118, DOI: 10.3390/cells10123478 * |
| YAO FANG, ZHANG CHI, DU WEI, LIU CHAO, XU YING: "Identification of Gene-Expression Signatures and Protein Markers for Breast Cancer Grading and Staging", PLOS ONE, vol. 10, no. 9, 16 September 2015 (2015-09-16), pages e0138213, XP093072123, DOI: 10.1371/journal.pone.0138213 * |
Also Published As
| Publication number | Publication date |
|---|---|
| JPWO2023113013A1 (https=) | 2023-06-22 |
Similar Documents
| Publication | Publication Date | Title |
|---|---|---|
| Dräger et al. | A CRISPRi/a platform in human iPSC-derived microglia uncovers regulators of disease states | |
| Qu et al. | A reference single-cell regulomic and transcriptomic map of cynomolgus monkeys | |
| Islam et al. | A microRNA signature that correlates with cognition and is a target against cognitive decline | |
| Chen et al. | Comparative transcript profiling of gene expression of fresh and frozen–thawed bull sperm | |
| Samarajeewa et al. | Transcriptional response to Wnt activation regulates the regenerative capacity of the mammalian cochlea | |
| Reizel et al. | Colon stem cell and crypt dynamics exposed by cell lineage reconstruction | |
| Ge et al. | Molecular mechanisms detected in yak lung tissue via transcriptome-wide analysis provide insights into adaptation to high altitudes | |
| Carbonell et al. | Haploinsufficiency in the ANKS1B gene encoding AIDA-1 leads to a neurodevelopmental syndrome | |
| US20220254448A1 (en) | Methods of identifying dopaminergic neurons and progenitor cells | |
| Li et al. | Dental stem cell-derived extracellular vesicles transfer miR-330-5p to treat traumatic brain injury by regulating microglia polarization | |
| WO2021096929A1 (en) | Neural-derived human exosomes for alzheimer's disease and co-morbidities thereof | |
| Frausto et al. | Transcriptome analysis of the human corneal endothelium | |
| Ushakov et al. | Genome-wide identification and expression profiling of long non-coding RNAs in auditory and vestibular systems | |
| Spencer et al. | Single-cell insights into epithelial morphogenesis in the neonatal mouse uterus | |
| Singh et al. | Gene regulatory landscape of cerebral cortex folding | |
| Clark et al. | Comprehensive analysis of retinal development at single cell resolution identifies NFI factors as essential for mitotic exit and specification of late-born cells | |
| US20230094922A1 (en) | Methods of therapeutic prognostication | |
| US20240191300A1 (en) | Profiling cell types in circulating nucleic acid liquid biopsy | |
| Napoli et al. | Cephalopod retinal development shows vertebrate-like mechanisms of neurogenesis | |
| Martinez-Fernandez et al. | Natural cardiogenesis-based template predicts cardiogenic potential of induced pluripotent stem cell lines | |
| Kallestad et al. | Tissue-and species-specific patterns of RNA metabolism in post-mortem mammalian retina and retinal pigment epithelium | |
| Agarwal et al. | Bulk RNA sequencing analysis of developing human induced pluripotent cell-derived retinal organoids | |
| Rao et al. | Exome sequencing identifies a novel gene, WNK1, for susceptibility to pelvic organ prolapse (POP) | |
| Deng et al. | Genome‐wide association analysis revealed new QTL and candidate genes affecting the teat number in Dutch Large White pigs | |
| WO2023113013A1 (ja) | 疾患発症の可能性の推定を行う遺伝子の選別方法及び疾患発症の可能性を推定する方法 |
Legal Events
| Date | Code | Title | Description |
|---|---|---|---|
| 121 | Ep: the epo has been informed by wipo that ep was designated in this application |
Ref document number: 22907535 Country of ref document: EP Kind code of ref document: A1 |
|
| WWE | Wipo information: entry into national phase |
Ref document number: 2023567843 Country of ref document: JP |
|
| NENP | Non-entry into the national phase |
Ref country code: DE |
|
| 122 | Ep: pct application non-entry in european phase |
Ref document number: 22907535 Country of ref document: EP Kind code of ref document: A1 |