WO2023105976A1 - Clinical trial assistance apparatus, method for operating clinical trial assistance apparatus, and program for operating clinical trial assistance apparatus - Google Patents
Clinical trial assistance apparatus, method for operating clinical trial assistance apparatus, and program for operating clinical trial assistance apparatus Download PDFInfo
- Publication number
- WO2023105976A1 WO2023105976A1 PCT/JP2022/040265 JP2022040265W WO2023105976A1 WO 2023105976 A1 WO2023105976 A1 WO 2023105976A1 JP 2022040265 W JP2022040265 W JP 2022040265W WO 2023105976 A1 WO2023105976 A1 WO 2023105976A1
- Authority
- WO
- WIPO (PCT)
- Prior art keywords
- clinical trial
- subjects
- target disease
- group
- test drug
- Prior art date
Links
Images


Classifications
-
- G—PHYSICS
- G16—INFORMATION AND COMMUNICATION TECHNOLOGY [ICT] SPECIALLY ADAPTED FOR SPECIFIC APPLICATION FIELDS
- G16H—HEALTHCARE INFORMATICS, i.e. INFORMATION AND COMMUNICATION TECHNOLOGY [ICT] SPECIALLY ADAPTED FOR THE HANDLING OR PROCESSING OF MEDICAL OR HEALTHCARE DATA
- G16H10/00—ICT specially adapted for the handling or processing of patient-related medical or healthcare data
- G16H10/40—ICT specially adapted for the handling or processing of patient-related medical or healthcare data for data related to laboratory analysis, e.g. patient specimen analysis
Definitions
- the technology of the present disclosure relates to a clinical trial support device, a method of operating the clinical trial support device, and an operation program for the clinical trial support device.
- antidementia drugs medicines that prevent the onset of dementia, such as Alzheimer's disease, and delay the progression of dementia (hereinafter sometimes referred to as antidementia drugs) ) are being developed.
- Nootropics are evaluated for efficacy after a period of clinical trials.
- Subjects (also referred to as subjects) for clinical trials of antidementia drugs are preferably those whose dementia progresses relatively quickly. This is because, in the case of a person whose dementia progresses relatively slowly, it is not clear whether the progress is being suppressed by the efficacy of the nootropics, or whether the progress is delayed due to reasons specific to that person. be.
- Clinical trials consist of Phase 1 clinical trials (also called clinical pharmacology trials), which mainly examine the safety and pharmacokinetics of the test drug, in a small number of healthy adults, and relatively small-scale Phase 2 clinical trials. It is divided into three phases: a trial (also called an exploratory trial) and a relatively large Phase 3 clinical trial (also called a confirmatory trial).
- Phase 1 clinical trials also called clinical pharmacology trials
- Phase 2 clinical trials It is divided into three phases: a trial (also called an exploratory trial) and a relatively large Phase 3 clinical trial (also called a confirmatory trial).
- One embodiment of the technology of the present disclosure provides a clinical trial support device that can contribute to valid evaluation of efficacy of a test drug for a target disease, a method of operating the clinical trial support device, and operation of the clinical trial support device. Offer a program.
- the clinical trial support apparatus of the present disclosure includes a processor, the processor predicts the speed of progression of the target disease for subjects of the clinical trial, and selects a plurality of subjects according to the prediction result of the speed of progression of the target disease.
- the subjects are divided into groups, and the subjects are divided into a test drug group to which the test drug is administered and a placebo group to which the placebo is administered for each of a plurality of groups.
- the processor selects subjects whose target disease progresses relatively quickly, and only the selected subjects are grouped according to the prediction results and divided into the test drug group and the placebo group. It is preferable to
- the processor preferably divides subjects into the test drug group and the placebo group using a block randomization method.
- the processor predicts the speed of progression of the target disease using the trained model.
- the trained model extracts multiple anatomical region images, which are images of multiple anatomical regions of organs, from the medical image at the start of the clinical trial, and inputs the anatomical region images to the feature value derivation model prepared for each anatomical region. Then, it is preferable to output the feature quantity of the anatomical region from the feature quantity derivation model.
- the learning input data also includes target disease-related data about the target disease of the target disease patient at the first time point, and the processor also inputs target disease-related data about the target disease of the subject at the start of the clinical trial into the trained model. is preferred.
- the target disease is dementia
- the numerical value is preferably the amount of change in the score of the cognitive function test or the probability of becoming the target disease.
- the target disease is a cranial nerve disease. Moreover, it is preferable that the target disease is dementia.
- the operating method of the clinical trial support device of the present disclosure predicts the speed of progression of the target disease for subjects in clinical trials, and divides the subjects into a plurality of groups according to the prediction results of the speed of progression of the target disease. and dividing subjects into a test drug group to which a test drug is administered and a placebo group to which a placebo is administered for each of a plurality of groups.
- the operation program of the clinical trial support apparatus of the present disclosure predicts the speed of progression of the target disease for the subjects of the clinical trial, and divides the subjects into a plurality of groups according to the prediction results of the speed of progression of the target disease.
- a computer is caused to execute a process including dividing and sorting subjects into a test drug group to which a test drug is administered and a placebo group to which a placebo is administered for each of a plurality of groups.
- a clinical trial support device a method of operating the clinical trial support device, and an operation program for the clinical trial support device that can contribute to valid evaluation of efficacy of a test drug for a target disease are provided. be able to.
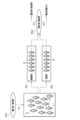
- FIG. 1 is a diagram showing the flow from a clinical phase 1 trial to a clinical phase 2 trial.
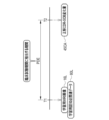
- FIG. 2 is a diagram showing the flow from a clinical phase 2 trial to a clinical phase 3 trial.
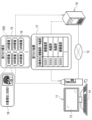
- FIG. 3 is a diagram showing various data transmitted and received between the clinical trial support server and operator terminals, and between the clinical trial support server and operator terminals;
- 2 is a block diagram showing a computer that constitutes a clinical trial support server;
- FIG. 4 is a block diagram showing a processing unit of a CPU of the clinical trial support server;
- FIG. FIG. 4 is a diagram showing the processing of the predictor and the time points of MRI images and prediction results; It is a figure which shows the detail of the process of a progress speed prediction model and a prediction part.
- FIG. 1 is a diagram showing the flow from a clinical phase 1 trial to a clinical phase 2 trial.
- FIG. 2 is a diagram showing the flow from a clinical phase 2 trial to a clinical phase 3 trial.
- FIG. 3 is
- FIG. 2 is a diagram showing the configuration of an autoencoder and the formation of a feature value derivation model
- FIG. 4 is a diagram showing an outline of processing in the learning phase of an autoencoder
- FIG. 10 is a diagram showing an overview of processing in the learning phase of the variation derivation model
- FIG. 10 is a diagram showing learning MRI images and time points of correct CDR-SOB change amounts; It is a figure which shows the process of a grouping part. It is a figure which shows a distribution table. It is a figure which shows the process of a distribution part. It is a figure which shows the process of a distribution part.
- 4 is a flow chart showing a processing procedure of a clinical trial support server; FIG.
- FIG. 5 is a diagram showing details of a simulation for confirming the effects of the technique of the present disclosure
- FIG. 10 is a graph showing the probability of overestimating the efficacy of a study drug in a Phase 2 clinical trial.
- FIG. 10 is a graph showing the probability of underestimating the efficacy of an investigational drug in a Phase 2 clinical trial.
- FIG. It is a graph which shows a clinical trial success probability.
- It is a figure which shows the process part of 2nd Embodiment.
- FIG. 10 is a diagram showing a third embodiment in which dementia-related data are input to a progression speed prediction model in addition to MRI images. It is a figure which shows dementia related data.
- FIG. 13 is a diagram showing an outline of processing in a learning phase of a variation derivation model according to the third embodiment
- FIG. 4 is a diagram showing time points of MRI images for learning, dementia-related data for learning, and correct CDR-SOB variation.
- FIG. 10 is a diagram showing a mode of inputting a clinical trial period into a progression speed prediction model in addition to MRI images and dementia-related data. It is a figure which shows the aspect which outputs the probability of becoming dementia as a prediction result. It is a figure which shows the structure of a multitask CNN and the origin of a feature-value derivation model.
- Phase 1 clinical trial Ph1 is conducted to investigate the safety and pharmacokinetics of the test drug for antidementia.
- a relatively small-scale second phase clinical trial Ph2 is conducted with about several hundred subjects S.
- subjects S Prior to this Phase 2 clinical trial Ph2, subjects S are divided into a test drug group TG (Treatment Group) to which a test drug is administered and a placebo group PG (Placebo Group) to which a placebo is administered.
- Phase 2 clinical trial Ph3 A large scale Phase 3 clinical trial Ph3 will be conducted. As in the case of the clinical phase 2 study Ph2, in the clinical phase 3 study Ph3, the subjects S are divided into the test drug group TG and the placebo group PG. The duration of the clinical phase 2 trial Ph2 and the clinical phase 3 trial Ph3 are both, for example, 18 months.
- Dementia is an example of a "target disease” and a "brain nerve disease” according to the technology of the present disclosure.
- Dementia includes Alzheimer's dementia, Lewy body dementia, vascular dementia, and the like.
- the nootropic drug may be used for Alzheimer's disease other than Alzheimer's dementia.
- antidementia drugs are used to promote the progression of Alzheimer's disease from preclinical Alzheimer's disease (PAD) to mild cognitive impairment (MCI) due to Alzheimer's disease. It may be one that delays progression, or one that delays progression from MCI due to Alzheimer's disease to Alzheimer's disease.
- the target disease is preferably a cranial nerve disease such as dementia.
- Cognitive function test data includes clinical dementia evaluation method (hereinafter abbreviated as CDR-SOB (Clinical Dementia Rating-Sum of Boxes)) score, mini-mental state examination (hereinafter abbreviated as MMSE (Mini-Mental State Examination) ) and Alzheimer's disease assessment scale (hereinafter abbreviated as ADAS-Cog (Alzheimer's Disease Assessment Scale-cognitive subscale)).
- CDR-SOB Clinical Dementia Rating-Sum of Boxes
- MMSE Mini-Mental State Examination
- ADAS-Cog Alzheimer's disease assessment scale
- the morphological imaging test data includes a tomographic image (hereinafter referred to as an MRI image) 16 (hereinafter referred to as an MRI image) 16 (see FIG. 3) of the brain obtained by magnetic resonance imaging (MRI), or a brain image obtained by computed tomography (CT). tomographic images (hereinafter referred to as CT images).
- MRI image magnetic resonance imaging
- CT images computed tomography
- Brain functional imaging test data includes brain tomographic images (hereinafter referred to as PET images) by positron emission tomography (PET), brain tomography by single photon emission tomography (SPECT) images (hereinafter referred to as SPECT images) and the like.
- Blood and cerebrospinal fluid test data include the amount of p-tau (phosphorylated tau protein) 181 in cerebrospinal fluid (hereinafter abbreviated as CSF (Cerebrospinal Fluid)).
- CSF Cerebrospinal Fluid
- the genetic test data includes the genotype test results of the ApoE gene.
- the clinical trial support server 10 is a server that assists in the allocation of the subject S to the test drug group TG and placebo group PG in the clinical phase 2 trial Ph2 and the clinical phase 3 trial Ph3. It is connected to an operator terminal 11 via a network 12 .
- the clinical trial support server 10 is an example of a “clinical trial support device” according to the technology of the present disclosure.
- the operator terminal 11 is installed, for example, in a drug development facility and operated by an operator involved in clinical trials at the drug development facility.
- the operator terminal 11 has a display 13 and input devices 14 such as a keyboard and a mouse.
- the network 12 is, for example, a WAN (Wide Area Network) such as the Internet or a public communication network.
- the operator terminal 11 transmits a distribution request 15 to the clinical trial support server 10.
- the allocation request 15 is a request for causing the clinical trial support server 10 to sort the subject S into the test drug group TG and the placebo group PG in the clinical phase 2 trial Ph2 or the clinical phase 3 trial Ph3.
- the distribution request 15 includes an MRI image group 16G, which is a set of MRI images 16 showing the brain of each subject S.
- a subject ID Identity Data
- the MRI image 16 is an example of a "medical image” according to the technology of the present disclosure.
- the brain is an example of an “organ” according to the technology of the present disclosure.
- the distribution request 15 also includes a terminal ID or the like for uniquely identifying the operator terminal 11 that sent the distribution request 15 .
- the clinical trial support server 10 Upon receiving the allocation request 15, the clinical trial support server 10 derives the allocation result 17.
- the sorting result 17 is data in which the test drug group TG or the placebo group PG, which is the sorting result for each subject ID, is registered.
- the clinical trial support server 10 delivers the sorting result 17 to the operator terminal 11 that sent the sorting request 15 .
- the operator terminal 11 displays the sorting result 17 on the display 13 and provides the sorting result 17 for the operator to view.
- the computer that constitutes the clinical trial support server 10 includes a storage 20, a memory 21, a CPU (Central Processing Unit) 22, a communication section 23, a display 24, and an input device 25. These are interconnected via bus lines 26 .
- the storage 20 is a hard disk drive built into the computer that constitutes the clinical trial support server 10 or connected via a cable or network.
- the storage 20 is a disk array in which a plurality of hard disk drives are connected.
- the storage 20 stores a control program such as an operating system, various application programs, various data associated with these programs, and the like.
- a solid state drive may be used instead of the hard disk drive.
- the memory 21 is a work memory for the CPU 22 to execute processing.
- the CPU 22 loads the program stored in the storage 20 into the memory 21 and executes processing according to the program. Thereby, the CPU 22 comprehensively controls each part of the computer.
- the CPU 22 is an example of a "processor" according to the technology of the present disclosure. Note that the memory 21 may be built in the CPU 22 .
- the communication unit 23 controls transmission of various information with external devices such as the operator terminal 11.
- the display 24 displays various screens. Various screens are provided with operation functions by GUI (Graphical User Interface).
- GUI Graphic User Interface
- the computer that configures the clinical trial support server 10 accepts input of operation instructions from the input device 25 through various screens.
- the input device 25 is a keyboard, mouse, touch panel, microphone for voice input, and the like.
- the operating program 30 is stored in the storage 20 of the clinical trial support server 10 .
- the operating program 30 is an application program for causing the computer to function as the clinical trial support server 10.
- FIG. That is, the operating program 30 is an example of the "clinical trial support device operating program" according to the technology of the present disclosure.
- the storage 20 also stores an MRI image group 16G.
- the storage 20 also stores a progress speed prediction model 31 and a sorting table 32 .
- the progress speed prediction model 31 is an example of a “learned model” according to the technology of the present disclosure.
- the CPU 22 of the computer that constitutes the clinical trial support server 10 cooperates with the memory 21 and the like to operate the reception unit 35, the read/write (hereinafter abbreviated as RW (Read Write)) control unit 36 , a prediction unit 37 , a grouping unit 38 , a distribution unit 39 , and a distribution control unit 40 .
- RW Read Write
- the reception unit 35 receives the distribution request 15 from the operator terminal 11 .
- the distribution request 15 contains the MRI image group 16G. Therefore, by accepting the distribution request 15, the accepting unit 35 acquires the MRI image group 16G.
- the reception unit 35 outputs the MRI image group 16G to the RW control unit 36 .
- the receiving unit 35 also outputs the terminal ID of the operator terminal 11 (not shown) to the distribution control unit 40 .
- the RW control unit 36 controls storage of various data in the storage 20 and reading of various data in the storage 20 .
- the RW control unit 36 stores the MRI image group 16G from the reception unit 35 in the storage 20 .
- the RW control unit 36 also reads out the MRI image group 16G from the storage 20 and outputs the MRI image group 16G to the prediction unit 37 .
- the RW control unit 36 also reads the progress speed prediction model 31 from the storage 20 and outputs the progress speed prediction model 31 to the prediction unit 37 .
- the RW control unit 36 reads the distribution table 32 from the storage 20 and outputs the distribution table 32 to the distribution unit 39 .
- the prediction unit 37 uses the progression speed prediction model 31 to predict the speed of progression of dementia of each subject S from all the MRI images 16 that make up the MRI image group 16G.
- the prediction unit 37 outputs to the grouping unit 38 a prediction result group 45 ⁇ /b>G that is a set of prediction results 45 (see FIG. 6 ) of the rate of progression of dementia of each subject S.
- the grouping unit 38 divides the subject S into a plurality of groups according to the prediction result 45.
- the grouping section 38 outputs the grouping result 46 to the sorting section 39 .
- the sorting unit 39 sorts the subjects S into the test drug group TG and the placebo group PG for each of a plurality of groups.
- the distribution unit 39 outputs the distribution result 17 to the distribution control unit 40 .
- the distribution control unit 40 controls distribution of the distribution result 17 to the operator terminal 11 that sent the distribution request 15 .
- the distribution control unit 40 identifies the operator terminal 11 that is the transmission source of the distribution request 15 based on the terminal ID from the reception unit 35 .
- the prediction unit 37 inputs the MRI image 16 to the progressing speed prediction model 31 . Then, the prediction result 45 is output from the advancing speed prediction model 31 .
- the prediction result 45 is the CDR-SOB score change amount (hereinafter referred to as CDR-SOB change amount).
- the MRI image 16 input to the progression speed prediction model 31 is an image of the brain of the subject S at the start time TS of the clinical trial.
- the prediction result 45 output from the progression speed prediction model 31 predicts the CDR-SOB change amount of the subject S at the end point TE of the clinical trial after the clinical trial period PD from the start point TS. . If the CDR-SOB variation is 0 or more, it can be predicted that dementia has progressed in the subject S at the end of the clinical trial. In addition, it can be predicted that the greater the CDR-SOB change amount, the faster the progress of dementia of the subject S. Note that the prediction result 45 is given the same subject ID as the MRI image 16 .
- the amount of change in CDR-SOB is an example of the “numerical value indicating the degree of progression of the target disease” and the “amount of change in cognitive function test score” according to the technology of the present disclosure.
- the CDR-SOB change amount may be expressed as ⁇ .
- the start time TS may be strictly the start date of the clinical trial, but may be set with a margin such as one week before or after the start date of the clinical trial.
- the progress speed prediction model 31 is composed of a segmentation model 50, a plurality of feature value derivation models 51, and a variation derivation model 52.
- the segmentation model 50 is a trained model that performs so-called semantic segmentation by assigning a label representing each anatomical region of the brain, such as the hippocampus, the anterior temporal lobe, and the amygdala, to each pixel of the brain shown in the MRI image 16 .
- the prediction unit 37 extracts images 53 of a plurality of anatomical regions of the brain (hereinafter referred to as anatomical region images) from the MRI image 16 based on the labels given by the segmentation model 50 .
- Anterior temporal lobe means the front part of the temporal lobe.
- images of anatomical regions such as the frontal lobe, mammary body, corpus callosum, brain arch, and lateral ventricle may be extracted.
- the anatomical region images preferably also include images of other anatomical regions such as the parahippocampal gyrus, occipital lobe, thalamus, and hypothalamus.
- images of other anatomical regions such as the parahippocampal gyrus, occipital lobe, thalamus, and hypothalamus.
- anatomical region image of each of the left and right anatomical regions it is preferable to extract an anatomical region image of each of the left and right anatomical regions.
- the anatomical area image preferably includes at least an image of the hippocampus, and more preferably includes at least an image of the hippocampus and an image of the anterior temporal lobe.
- FIG. 7 illustrates a hippocampus feature amount derivation model 51_1, an anterior temporal lobe feature amount derivation model 51_2, and an amygdala feature amount derivation model 51_3.
- the prediction unit 37 inputs each anatomical region image 53 to the corresponding feature value derivation model 51 .
- the feature quantity 54 of each anatomical region is output from the feature quantity derivation model 51 .
- a feature amount 54_1 of the hippocampus, a feature amount 54_2 of the anterior temporal lobe, a feature amount 54_3 of the amygdala, and the like are illustrated.
- the prediction unit 37 inputs a feature quantity group 54G, which is a set of feature quantities 54 of each anatomical region, to the variation derivation model 52. Then, the prediction result 45 is output from the variation derivation model 52 .
- the variation derivation model 52 is constructed by any one of neural network, support vector machine, and boosting.
- the feature value derivation model 51 uses an encoder unit 61 of an autoencoder (hereinafter abbreviated as AE (Auto Encoder)) 60 .
- AE 60 has an encoder section 61 and a decoder section 62 .
- An anatomical region image 53 is input to the encoder unit 61 .
- the encoder unit 61 converts the anatomical region image 53 into a feature amount 54 by performing well-known convolution operation, pooling processing, and the like.
- the feature values 54 obtained in this manner represent the features of the shape and texture of each anatomical segment, such as the degree of hippocampal atrophy and the presence or absence of decreased blood flow metabolism in the anterior temporal lobe.
- the encoder section 61 transfers the feature amount 54 to the decoder section 62 .
- a decoder unit 62 generates a restored image 63 of the anatomical region image 53 from the feature amount 54 .
- the AE 60 learns by inputting the learning anatomical region image 53L in the learning phase before the encoder unit 61 is diverted to the feature value derivation model 51 .
- the anatomical region image for learning 53L is an image extracted from the MRI image for learning 16L using the segmentation model 50 .
- the learning MRI image 16L is an MRI image 16 of a dementia patient whose MRI image 16 etc. is registered in a database such as ADNI (Alzheimer's Disease Neuroimaging Initiative) and who satisfies the conditions for participating in a clinical trial. . Conditions for participation in clinical trials include, for example, a positive amyloid ⁇ in the CSF test and an MMSE score of 26 or less.
- the learning MRI image 16L is an example of “learning input data” according to the technology of the present disclosure.
- a dementia patient is an example of a “target disease patient” according to the technology of the present disclosure.
- the AE 60 outputs a learning restored image 63L for the learning anatomical region image 53L. Based on these learning anatomical region image 53L and learning restored image 63L, loss calculation of the AE 60 using a loss function is performed. Various coefficients of the AE 60 (such as filter coefficients for convolution calculation) are updated according to the result of the loss calculation, and the AE 60 is updated according to the update settings.
- the above-described series of processing of inputting the learning anatomical region image 53L to the AE 60, outputting the learning restored image 63L from the AE 60, loss calculation, update settings, and updating the AE 60 is performed by the learning anatomy. This is repeated while the area images 53L are exchanged. Repetition of the above series of processes is terminated when the restoration accuracy from the learning anatomical region image 53L to the learning restored image 63L reaches a predetermined set level.
- the encoder unit 61 of the AE 60 whose restoration accuracy reaches the set level in this way is used in the prediction unit 37 as part of the progress speed prediction model 31 . Note that regardless of the restoration accuracy from the learning anatomical region image 53L to the learning restored image 63L, learning may be terminated when the series of processes described above is repeated a set number of times.
- the variation derivation model 52 is learned by learning data 70.
- the learning data 70 is a set of the learning feature quantity group 54GL and the correct CDR-SOB variation 45CA.
- the learning feature quantity group 54GL is obtained by inputting the learning anatomical region image 53L of each anatomical region extracted from the learning MRI image 16L into each learned feature quantity derivation model 51 .
- the correct CDR-SOB change amount 45CA is the actual CDR-SOB change amount of the dementia patient in the learning MRI image 16L from which the learning feature amount group 54GL was obtained.
- the correct CDR-SOB variation 45CA is an example of "correct data" according to the technology of the present disclosure.
- the learning feature group 54GL is input to the variation derivation model 52 .
- the change amount derivation model 52 outputs a learning prediction result 45L for the learning feature amount group 54GL.
- the loss calculation of the variation derivation model 52 using a loss function is performed.
- Various coefficients of the variation derivation model 52 are updated according to the result of the loss calculation, and the variation derivation model 52 is updated according to the update settings.
- the input of the learning feature group 54GL to the variation derivation model 52, the output of the learning prediction result 45L from the variation derivation model 52, the loss calculation, the update setting, and the change The series of processes for updating the quantity derivation model 52 are repeated while the learning data 70 are exchanged.
- the repetition of the above series of processes ends when the prediction accuracy of the learning prediction result 45L with respect to the correct CDR-SOB change amount 45CA reaches a predetermined set level.
- the variation derivation model 52 whose prediction accuracy reaches the set level in this way is used in the prediction unit 37 as part of the progress speed prediction model 31 . Regardless of the prediction accuracy of the learning prediction result 45L with respect to the correct CDR-SOB change amount 45CA, learning may be terminated when the above series of processes are repeated a set number of times.
- the learning MRI image 16L is an image of the dementia patient's brain at the first time point T1.
- the correct CDR-SOB change amount 45CA is the actual CDR-SOB change amount of the dementia patient at the second time point T2 after the period PDE corresponding to the clinical trial period PD from the first time point T1.
- the dementia patient has a CDR-SOB score of 22 at the first time point T1 and a CDR-SOB score of 25 at the second time point T2
- the period PDE corresponding to the clinical trial period PD is a period including the clinical trial period PD and adding an appropriate margin to the clinical trial period PD. For example, if the clinical trial period PD is 18 months, the period PDE corresponding to the clinical trial period PD is 12 months to 24 months plus or minus 6 months in 18 months.
- the grouping unit 38 divides the subject S into one of groups 1 to 18 according to the CDR-SOB change amount of the prediction result 45.
- FIG. For example, the grouping unit 38 assigns subjects S whose CDR-SOB change amount is less than -3.0 ( ⁇ -3.0) to group 1, and assigns subjects S whose CDR-SOB change amount is -3.0 to group 4, for example. A subject S with a score of 2.0 or more and less than -1.5 (-2.0 ⁇ -1.5) was placed. Further, the grouping unit 38 assigns subjects S whose CDR-SOB variation is 3.5 or more and less than 4.0 (3.5 ⁇ 4.0) to group 15, for example. A subject S whose CDR-SOB variation is greater than 5.0 (5.0 ⁇ ) is assigned to . In this way, groups 1 to 18 are defined mainly by the range of CDR-SOB variation between -3.0 and 5.0 set in 0.5 increments.
- the grouping result 46 is data in which the target person ID of the target person S is registered for each group.
- the CDR-SOB change amount of the subject S whose subject ID is S0001 is 4.0, so the grouping unit 38 registers S0001 in the group 16 .
- the CDR-SOB change amount of the subject S whose subject ID is S0004 is ⁇ 1.7, so the grouping unit 38 registers S0004 in group 4.
- the sorting table 32 is a table in which sorting rules for each group are registered.
- the distribution rule is based on a block randomization technique for each two players.
- the group 1 sorting rule is that for pairs of two subjects S, 1st, 2nd and 4th, the first subject S is sorted into the test drug group TG, and the second subject S is placed in placebo. The content is to distribute to the group PG.
- the first subject S is assigned to the placebo group PG, and the second subject S is assigned to the test drug group TG. Content.
- the group 16 sorting rule is that for pairs of two subjects S, 1st to 4th and 6th, the first subject S is sorted into the test drug group TG, and the second subject S is placed in placebo. The content is to distribute to the group PG.
- the first subject S is assigned to the placebo group PG, and the second subject S is assigned to the test drug group TG.
- FIG. 14 shows an example of how the subjects S in Group 1 are sorted into the test drug group TG and the placebo group PG according to the sorting rules of the sorting table 32 .
- FIG. 14 exemplifies a case where eight subjects S whose subject IDs are S0008, S0022, S0034, S0044, S0051, S0068, S0102, and S0116 are sorted.
- the sorting unit 39 sorts the first subject S into the test drug group TG, and sorts the second subject S into the placebo group PG, according to the sorting rule. Of the two subjects S, S0008 is assigned to the test drug group TG, and S0022 is assigned to the placebo group PG.
- the S0034 subject S is assigned to the test drug group TG
- the S0044 subject S is assigned to the placebo group PG.
- the subject S0102 of the two subjects S of the fourth pair S0102 and S0116 is assigned to the test drug group TG
- the subject S0116 is assigned to the placebo group PG.
- the sorting unit 39 sorts the first subject S into the placebo group PG, and sorts the second subject S into the test drug group TG, according to the sorting rule.
- the subject S of S0051 is assigned to the placebo group PG
- the subject S of S0068 is assigned to the test drug group TG.
- FIG. 15 shows an example of how subjects S in group 16 are sorted into test drug group TG and placebo group PG according to the sorting rules of sorting table 32 .
- FIG. 15 illustrates a case where 12 subjects S whose subject IDs are S0001, S0024, S0029, S0056, S0072, S0081, S0105, S0124, S0133, S0148, S0172, and S0181 are sorted.
- the sorting unit 39 sorts the first subject S into the test drug group TG, and sorts the second subject S into the placebo group PG, according to the sorting rule. Of the two subjects S, S0001 is assigned to the test drug group TG, and S0024 is assigned to the placebo group PG.
- the S0029 subject S is assigned to the test drug group TG
- the S0056 subject S is assigned to the placebo group PG.
- the subject S of S0072 is assigned to the test drug group TG
- the subject S of S0081 is assigned to the placebo group PG.
- the subject S of S0105 is assigned to the test drug group TG
- the subject S of S0124 is assigned to the placebo group PG.
- the sorting unit 39 sorts the first subject S into the placebo group PG, and sorts the second subject S into the test drug group TG, according to the sorting rule.
- the subject S of S0133 is assigned to the placebo group PG, and the subject S of S0148 is assigned to the test drug group TG.
- the sorting unit 39 sorts the subjects S of each group 1 to 18 into the test drug group TG and the placebo group PG using the block randomization technique. Such a distribution method is called a stratified randomization method.
- the operator operates the input device 14 of the operator terminal 11 to transmit a sorting request 15 including an MRI image group 16G, which is a set of MRI images 16 of the test drug subject S with dementia, to the clinical trial support server 10. .
- the allocation request 15 from the operator terminal 11 is received by the receiving unit 35 (step ST100).
- the MRI image group 16G included in the distribution request 15 is output from the reception unit 35 to the RW control unit 36 and stored in the storage 20 under the control of the RW control unit 36 (step ST110).
- the MRI image group 16G is read from the storage 20 by the RW control unit 36 (step ST120).
- the MRI image group 16G is output from the RW control section 36 to the prediction section 37 .
- step ST130 the prediction result 45 is output from the progression speed prediction model 31 (step ST130).
- step ST130 The process of step ST130 is repeated until the prediction result 45 is output for all the subjects S (NO in step ST140).
- a prediction result group 45G which is a set of multiple prediction results 45, is output from the prediction unit 37 to the grouping unit 38. Then, as shown in FIG. 12, the grouping unit 38 divides the subject S into one of groups 1 to 18 according to the prediction result 45 (step ST150). The grouping result 46 is output from the grouping section 38 to the sorting section 39 .
- the subject S is sorted into the test drug group TG and the placebo group PG for each of the groups 1 to 18 using the block randomization method (step ST160).
- the distribution result 17 is output from the distribution unit 39 to the distribution control unit 40 .
- the distribution result 17 is distributed to the operator terminal 11 that sent the distribution request 15 under the control of the distribution control section 40 (step ST170).
- a sorting result 17 is displayed on the display 13 of the operator terminal 11 .
- the operator browses the sorting result 17, sorts the subjects S into the test drug group TG and the placebo group PG, and conducts the clinical phase 2 study Ph2 or the clinical phase 3 study Ph3.
- the CPU 22 of the clinical trial support server 10 includes the prediction section 37, the grouping section 38, and the sorting section 39.
- the prediction unit 37 predicts the CDR-SOB change amount for the test drug subject S for dementia using the progression speed prediction model 31 .
- the grouping unit 38 divides the subject S into any one of groups 1 to 18 according to the prediction result 45 of the CDR-SOB change amount.
- the sorting unit 39 sorts the subjects S into the test drug group TG and the placebo group PG for each of the groups 1-18.
- the sorting unit 39 sorts the subjects S into the test drug group TG and the placebo group PG using a block randomization technique. For this reason, the risk of bias between the test drug group TG and the placebo group PG between subjects with relatively fast progression of dementia and subjects with slow progression is further reduced, and as a result, the efficacy of the test drug for dementia is justified. It will be possible to further contribute to a more accurate evaluation.
- the progression speed prediction model 31 uses the learning MRI image 16L of the dementia patient at the first time point T1 as learning input data, and from the first time point T1 to the clinical trial period PD
- This model is trained using the correct CDR-SOB change amount 45CA, which is the CDR-SOB change amount of the dementia patient at the second time point T2 after the corresponding period of PDE, as the correct data.
- the prediction unit 37 inputs the MRI image 16 of the subject S at the start time TS of the clinical trial to the progression speed prediction model 31, and the CDR of the subject S at the end time TE of the clinical trial. - Output the SOB change amount from the advancing speed prediction model 31 as the prediction result 45 .
- MRI images 16 are medical images of the brain. Almost all dementia patients also take the CDR-SOB. For this reason, if the learning MRI image 16L of the dementia patient is used as learning input data and the correct CDR-SOB variation 45CA is used as correct data, the learning data 70 of the progress speed prediction model 31 will not be lacking, and the progress speed will be improved. Learning of the prediction model 31 progresses. Furthermore, the MRI image 16 can be taken in minutes if the equipment is idle. Therefore, the prediction result 45 can be output from the progress speed prediction model 31 relatively easily.
- CDR-SOB changes Changes in cognitive function test scores, especially CDR-SOB changes, have long been used to determine the success or failure of clinical trials. Therefore, if the amount of CDR-SOB change is used as in this example as a numerical value indicating the degree of progression of dementia in the subject S at the end point of the clinical trial TE, the success or failure of the clinical trial can be based on the same standard as before. can be determined.
- the progression speed prediction model 31 uses the segmentation model 50 to extract a plurality of anatomical region images 53, which are images of a plurality of brain anatomical regions, from the MRI image 16 at the start time TS of the clinical trial. Then, the anatomical region image 53 is input to the feature quantity derivation model 51 prepared for each anatomical region, and the feature quantity 54 of the anatomical region is output from the feature quantity derivation model 51 . Therefore, the speed of progression of dementia can be predicted based on the feature values obtained from a plurality of anatomical regions of the brain, and the prediction accuracy of the prediction result 45 can be improved.
- the actual CDR-SOB change amount (true value) ⁇ c registered in ADNI is 0 or less, that is, dementia progresses.
- the CDR-SOB change amount (true value) ⁇ c remains unchanged without correction.
- the CDR-SOB variation (true value) ⁇ c of the subjects S assigned to the placebo group PG remains unchanged without correction.
- the actual CDR-SOB change amount (true value) ⁇ c was greater than 0, that is, the subject S with advanced dementia had the CDR-SOB change amount
- the CDR-SOB variation (corrected value) ⁇ cX corrected by the efficacy Eff of the test drug is defined as the true value) ⁇ c.
- the CDR-SOB variation (correction value) ⁇ cX is obtained by multiplying the CDR-SOB variation (true value) ⁇ c by (1 ⁇ Eff).
- FIG. 18 shows a method of a comparative example, a method according to the technique of the present disclosure in which the subject S is stratified and randomized based on the prediction result 45, and stratified randomization based on the actual CDR-SOB variation (true value) ⁇ c.
- the efficacy Eff of the test drug was changed in increments of 0.05 between 0 and 0.4, P1 ⁇ 0.05 (cleared Phase 2 clinical trial Ph2) and P2 ⁇ 0 Indicates the probability of .01 (not clearing Phase 3 clinical trial Ph3).
- the method of the comparative example divides the subjects S into groups according to the prediction result 45, and sorts the subjects S into the test drug group TG and the placebo group PG for each group, like the method according to the technology of the present disclosure.
- all ungrouped subjects S are randomly assigned to the test drug group TG and the placebo group PG.
- the probability that P1 ⁇ 0.05 and P2 ⁇ 0.01 is, in other words, the probability that the efficacy of the test drug is overestimated in Phase 2 clinical trials Ph2.
- the probability of P1 ⁇ 0.05 and P2 ⁇ 0.01 in the method according to the technique of the present disclosure is higher than the probability of P1 ⁇ 0.05 and P2 ⁇ 0.01 in the method of the comparative example. is also found to be generally low. Therefore, it was confirmed that the technique of the present disclosure reduces the risk of the efficacy of the test drug being overestimated.
- FIG. 19 shows a method of a comparative example, a method according to the technology of the present disclosure in which the subject S is stratified and randomized based on the prediction result 45, and stratified randomization based on the actual CDR-SOB change amount (true value) ⁇ c.
- the efficacy Eff of the test drug was changed in increments of 0.05 between 0 and 0.4
- P1 ⁇ 0.05 without clearing the clinical phase 2 trial Ph2
- P2 The probability of ⁇ 0.01 (clearing Phase 3 clinical trial Ph3) is shown.
- the probability that P1 ⁇ 0.05 and P2 ⁇ 0.01 is, in other words, the probability that the efficacy of the test drug is underestimated in the Phase 2 clinical trial Ph2.
- the probability of P1 ⁇ 0.05 and P2 ⁇ 0.01 in the method according to the technique of the present disclosure is higher than the probability of P1 ⁇ 0.05 and P2 ⁇ 0.01 in the method of the comparative example. is also found to be generally low. Therefore, it was confirmed that the technique of the present disclosure reduces the possibility that the efficacy of the test drug will be underestimated.
- FIG. 20 shows a method of a comparative example, a method according to the technique of the present disclosure in which the subject S is stratified and randomized based on the prediction result 45, and stratified randomization based on the actual CDR-SOB change amount (true value) ⁇ c.
- the efficacy Eff of the test drug was changed in increments of 0.05 between 0 and 0.4, P1 ⁇ 0.05 (cleared Phase 2 clinical trial Ph2) and P2 ⁇ 0 0.01 (clears Phase 3 clinical trial Ph3).
- the probability that P1 ⁇ 0.05 and P2 ⁇ 0.01 is, in other words, the clinical trial success probability.
- the probability of P1 ⁇ 0.05 and P2 ⁇ 0.01 in the method according to the technique of the present disclosure is higher than the probability of P1 ⁇ 0.05 and P2 ⁇ 0.01 in the method of the comparative example. is also found to be generally high. Therefore, according to the technique of the present disclosure, it was confirmed that the efficacy of the test drug was properly evaluated, and the probability of success in clinical trials increased accordingly.
- the conventional method is more effective than the method according to the technology of the present disclosure. be done. Therefore, if the prediction accuracy of the progress speed prediction model 31 is improved, it is considered that the conventional method will be more effective than the method according to the technology of the present disclosure.
- the clinical phase 1 trial Ph1 when the clinical phase 1 trial Ph1 is cleared, the clinical phase 2 trial Ph2 is performed, and when the clinical phase 2 trial Ph2 is cleared, the clinical phase 3 trial Ph3 is performed.
- a clinical phase 1 trial Ph1 and a clinical phase 2 trial Ph2, or a clinical phase 1 trial Ph2 and a clinical phase 3 trial Ph3 may be conducted in parallel.
- the present invention is not limited to this.
- a part of the single-task convolutional neural network or a part of the multi-task convolutional neural network may be used as the feature value derivation model 51 (see FIG. 31).
- the unit of the block randomization method is not limited to the two people shown in the example. For example, it may be four people.
- half of the clinical trial subjects S constituting the group may be simply assigned to the test drug group TG, and the other half may be assigned to the placebo group PG.
- the CPU of the clinical trial support server of the second embodiment includes the processing units 35 to 40 of the first embodiment (in FIG. 21, the prediction unit 37, grouping unit 38, and 39 is shown, others are not shown), and functions as a selection unit 75 .
- the selection unit 75 is provided between the prediction unit 37 and the grouping unit 38 .
- the prediction result group 45 ⁇ /b>G from the prediction section 37 is input to the selection section 75 .
- the selection unit 75 selects the subject S whose dementia progresses relatively quickly according to the selection condition 76 .
- the selection condition 76 is that the CDR-SOB variation is greater than 0 ( ⁇ >0) in this example.
- the selection unit 75 selects only the prediction results 45 that satisfy the selection condition 76 from among the plurality of prediction results 45 forming the prediction result group 45G, thereby generating the selected prediction result group 45GS.
- the selection unit 75 outputs the selection prediction result group 45GS to the grouping unit 38 .
- FIG. 22 shows an example of the processing of the selection unit 75.
- the CDR-SOB variation amounts of the subjects S with subject IDs S0001 and S0003 are greater than 0, and the CDR-SOB variation amounts of the subjects S with subject IDs S0002 and S0004 are 0 or less. Therefore, the selection unit 75 selects the prediction results 45 with the subject IDs S0001 and S0003, excludes the prediction results 45 with the subject IDs S0002 and S0004, and generates a selection prediction result group 45GS.
- the grouping unit 38 groups the subjects S for whom the prediction result 45 is selected in the selection prediction result group 45GS. Based on the grouping result 46, the sorting unit 39 sorts the subjects S for whom the prediction result 45 was selected in the selection prediction result group 45GS into the test drug group TG and the placebo group PG.
- the selection unit 75 selects the subject S whose dementia progresses relatively quickly, such as the subject S whose CDR-SOB change amount is greater than 0, based on the prediction result 45. .
- the grouping unit 38 groups only the selected target person S according to the prediction result 45 .
- the sorting unit 39 sorts only the selected subjects S into the test drug group TG and the placebo group PG. Therefore, a person more suitable for clinical trials of a test drug for dementia can be selected as the subject S, which can further contribute to the proper evaluation of the efficacy of the test drug for dementia.
- the selection condition 76 is not limited to the content of the example.
- the content may be that the CDR-SOB variation is greater than 2 ( ⁇ >2).
- the content may be such that the CDR-SOB variation is greater than 0 and less than or equal to 3 (0 ⁇ 3).
- the prediction unit 37 inputs the dementia-related data 80 to the progression speed prediction model 81 in addition to the MRI images 16 .
- the dementia-related data 80 is data relating to dementia of the subject S at the start time TS of the clinical trial, and includes part of the data relating to the dementia diagnostic criteria described above. More specifically, as shown in FIG. 24 as an example, the dementia-related data 80 includes the subject S's age, sex, genetic test data, and CSF test data, which is blood/cerebrospinal fluid test data. Genetic test data is, for example, genotype test results of the ApoE gene.
- the genotype of the ApoE gene is a combination of two of the three ApoE genes ⁇ 2, ⁇ 3, and ⁇ 4 ( ⁇ 2 and ⁇ 3, ⁇ 3 and ⁇ 4, etc.). Cognition of Alzheimer's disease in persons with genotypes with one or two ⁇ 4 ( ⁇ 2 and ⁇ 4, ⁇ 4 and ⁇ 4, etc.) versus those with genotypes without ⁇ 4 ( ⁇ 2 and ⁇ 3, ⁇ 3 and ⁇ 3, etc.) The risk of developing the disease is estimated to be approximately 3 to 12 times higher.
- CSF test data is, for example, the amount of p-tau (phosphorylated tau protein) 181 in CSF. Gender is expressed numerically as 00 for male and 01 for female. Similarly, the genetic test data are expressed numerically for combinations of ApoE genes.
- the dementia-related data 80 is an example of "target disease-related data" according to the technology of the present disclosure.
- the dementia-related data 80 is input to the change amount derivation model 85 of the progression speed prediction model 81 together with the feature amount group 54G.
- the variation derivation model 85 outputs the prediction result 45 by referring to the dementia-related data 80 as well as the feature quantity group 54G.
- the variation derivation model 85 of the present embodiment includes a principal component analysis (hereinafter abbreviated as PCA (Principal Component Analysis)) layer 150, a quantile normalization unit 151, and a linear discriminant analysis unit. 152.
- a feature quantity group 54G is input to the PCA layer 150 .
- the PCA layer 150 performs PCA on each of the plurality of feature amounts 54 forming the feature amount group 54G, and sets the feature amount 54 as an aggregate feature amount 54A.
- the PCA layer 150 aggregates hundreds to thousands of feature quantities 54 into one aggregated feature quantity 54A.
- the PCA layer 150 outputs an aggregated feature quantity group 54AG, which is a set of aggregated feature quantities 54A of each feature quantity 54, to the quantile normalization unit 151.
- the aggregated feature quantity group 54AG and the dementia-related data 80 are input to the quantile normalization unit 151 .
- the quantile normalization unit 151 aligns the plurality of aggregated feature quantities 54A that make up the aggregated feature quantity group 54AG and the age, sex, genetic test data, and CSF test data of the subject S of the dementia-related data 80. To handle them, Quantile Normalization is performed to transform them into data following a normal distribution.
- the linear discriminant analysis unit 152 performs, for example, support vector regression ( Linear discriminant analysis using SVR (Support Vector Regression) or the like is performed, and a prediction result 45 is output as the result.
- the variation derivation model 85 is learned by learning data 90 .
- the learning data 90 is a set of a learning feature quantity group 54GL, a learning dementia-related data 80L, and a correct CDR-SOB variation 45CA.
- the origin of the learning feature quantity group 54GL and the correct CDR-SOB variation 45CA is the same as in the case of the learning data 70 of the first embodiment.
- the learning dementia-related data 80L is the age, sex, genetic test data, and CSF test data of the dementia patient of the learning MRI image 16L from which the learning feature quantity group 54GL was obtained.
- the learning dementia-related data 80L is an example of "learning input data" according to the technology of the present disclosure.
- the learning feature quantity group 54GL and the learning dementia-related data 80L are input to the variation derivation model 85.
- the variation derivation model 85 outputs learning prediction results 45L for the learning feature quantity group 54GL and the learning dementia-related data 80L.
- the loss calculation of the variation derivation model 85 using a loss function is performed.
- Various coefficients of the variation derivation model 85 are updated according to the result of the loss calculation, and the variation derivation model 85 is updated according to the update settings.
- the input of the learning feature group 54GL and the learning dementia-related data 80L to the variation derivation model 85 the output of the learning prediction result 45L from the variation derivation model 85,
- the series of processes of loss calculation, update setting, and update of the variation derivation model 85 are repeated while the learning data 90 are exchanged.
- the repetition of the above series of processes ends when the prediction accuracy of the learning prediction result 45L with respect to the correct CDR-SOB change amount 45CA reaches a predetermined set level.
- the change amount derivation model 85 whose prediction accuracy reaches the set level in this manner is used in the prediction unit 37 as part of the progress speed prediction model 81 . Regardless of the prediction accuracy of the learning prediction result 45L with respect to the correct CDR-SOB change amount 45CA, learning may be terminated when the above series of processes are repeated a set number of times.
- the learning dementia-related data 80L is data related to dementia of a dementia patient at the first time point T1, like the learning MRI image 16L.
- learning input data also includes learning dementia-related data 80L, which is dementia-related data related to dementia of a dementia patient at first time point T1.
- the prediction unit 37 also inputs dementia-related data 80 regarding dementia of the subject S at the start time TS of the clinical trial to the progression speed prediction model 81 . Since the dementia-related data 80, which is strong data useful for predicting the speed of dementia progression, is added, compared to the case of predicting the speed of dementia progression only with the feature group 54G, the progress of dementia Speed prediction accuracy can be dramatically improved.
- the dementia-related data 80 may include medical history, or whether or not there are relatives who have developed dementia.
- Dementia-related data 80 may include blood test results such as apolipoprotein measurements, complement protein measurements, and transthyretin measurements.
- Hasegawa dementia scale score, MMSE score, Rivermead Behavioral Memory Test (RBMT) score, activities of daily living (ADL: Activities of Daily Living), ADAS-Cog score, etc. related to dementia may be included in the data 80.
- the clinical trial period PD may be input to the progression speed prediction model 95.
- the period PDE corresponding to the clinical test period PD is used as learning input data for the progression speed prediction model. 95.
- the amount of change in CDR-SOB which is the amount of change in the score of the cognitive function test
- the probability of developing dementia may be output as the prediction result 101, like the progression speed prediction model 100 shown in FIG.
- Groups in this case are, for example, group 1 with a probability of becoming dementia of 0% or more and less than 25%, group 2 of 25% or more and less than 50%, group 3 of 50% or more and less than 75%, and 75% or more and 100% Group 4 or the like below may be used.
- a part of a multitask convolutional neural network (hereinafter referred to as a multitask CNN (Convolutional Neural Network)) 200 shown in FIG. 31 may be used as the feature value derivation model 51.
- a multitask CNN Convolutional Neural Network
- the multitasking CNN 200 includes an encoder unit 201, a self-attention (hereinafter referred to as SA (Self-Attention)) mechanism layer 202, a decoder unit 203, and a global average pooling (hereinafter referred to as GAP (Global Average Pooling)) It has a layer 204 , a first fully connected (FC (Fully Connected)) layer 205 , a second FC layer 206 , and a softmax function (SMF (SoftMax Function)) layer 207 .
- SA Self-Attention
- GAP Global Average Pooling
- the encoder unit 201 converts the input anatomical region image 53 into the pre-stage feature amount 54P, like the encoder unit 61 of the AE 60 of the first embodiment.
- the encoder unit 201 outputs the pre-stage feature amount 54 P to the SA mechanism layer 202 .
- the SA mechanism layer 202 performs a convolution operation on the pre-stage feature quantity 54P while changing the filter coefficients for the convolution operation according to the value of the element targeted for the convolution operation.
- the SA mechanism layer 202 outputs the pre-stage feature quantity 54P after the convolution operation to the decoder unit 203 and the GAP layer 204.
- the decoder unit 203 generates a restored image 208 of the anatomical region image 53 from the pre-stage feature quantity 54P after the convolution operation, like the decoder unit 62 of the AE 60 of the first embodiment.
- the GAP layer 204 performs overall average pooling processing on the pre-stage feature quantity 54P after the convolution operation.
- the overall average pooling process is a process of obtaining an average value for each of a plurality of channels of the pre-stage feature quantity 54P. For example, when the number of channels of the pre-stage feature amount 54P is 512, the average value of the 512 pre-stage feature amounts 54P is obtained by the overall average pooling process.
- the GAP layer 204 outputs the obtained average value of the preceding stage feature quantity 54P to the first FC layer 205 and the second FC layer 206 as the feature quantity 54 .
- the first FC layer 205 outputs a first prediction result 209 based on the feature quantity 54.
- the first prediction result 209 is the CDR-SOB change amount.
- the first FC layer 205 has an input layer having units corresponding to the number of features 54 and one output layer for outputting the first prediction result 209 . Each unit in the input layer and the output layer are fully connected to each other, and weights are set for each.
- a feature amount 54 is input to each unit of the input layer.
- the product sum of the feature amount 54 and the weight set between each unit is the output value of the output layer. This output value is the CDR-SOB change amount.
- the second FC layer 206 converts the feature quantity 54 into variables handled by the SMF of the SMF layer 207 .
- the second FC layer 206 has an input layer having units corresponding to the number of feature values 54 and an output layer having units corresponding to the number of variables handled by SMF. Each unit in the input layer and each unit in the output layer are fully connected to each other and weighted.
- a feature amount 54 is input to each unit of the input layer.
- the product sum of the feature amount 54 and the weight set between each unit is the output value of each unit in the output layer. This output value is a variable handled by SMF.
- the second FC layer 206 outputs variables handled by SMF to the SMF layer 207 .
- the SMF layer 207 outputs a second prediction result 210 by applying the variables to the SMF.
- the second prediction result 210 indicates that the CDR-SOB variation is greater than 0 or less than or equal to 0.
- the multitasking CNN 200 performs a total of three tasks: AE, continuous quantity (CDR-SOB variation) prediction, and class classification (whether the CDR-SOB variation is greater than 0 or less than or equal to 0).
- the encoder section 201, the SA mechanism layer 202, and the GAP layer 204 are used for the feature value derivation model 51.
- FIG. 1 A block diagram illustrating an exemplary computing environment in accordance with the present in the CDR-SOB variation.
- part of the multitasking CNN 200 may be used as the feature value derivation model 51.
- the multitasking CNN 200 performs more complicated processing than the AE 60 and the like in order to handle a plurality of tasks. Therefore, there is a high possibility that the feature quantity 54 output from a part of the multitasking CNN 200 more exhaustively represents the features of the anatomical region image 53 . Therefore, if a part of the multitasking CNN 200 is used as the feature value derivation model 51, the prediction result 45 based on the more reliable feature value 54 is output, so the accuracy of predicting the speed of progression of dementia can be improved. can be higher.
- the speed of progression of dementia in subject S may be predicted.
- the medical image is not limited to the MRI image 16 illustrated.
- a PET image or a SPECT image may be used.
- a device other than the test support server 10 may be used. Also, these learnings may be continued after each model is stored in the storage 20 of the clinical trial support server 10 .
- the clinical trial support server 10 may be installed in each drug development facility, or may be installed in a data center independent from the drug development facility.
- the operator terminal 11 may take part or all of the functions of each processing unit of the clinical trial support server 10 .
- the target disease may be, for example, cerebral infarction.
- a CT image or MRI image of the subject's brain is input to the trained model, and the amount of change in the score of the stroke rating scale (NIHSS: National Institutes of Health Stroke Scale) or the Japanese Stroke Rating Scale (JSS : Japan Stroke Scale) output the amount of change in the score from the trained model.
- Target diseases are preferably dementia and cerebral infarction as exemplified, or neurodegenerative diseases such as Parkinson's disease and cranial nerve diseases including cerebrovascular diseases.
- dementia has become a social problem with the advent of an aging society. Therefore, it can be said that this example in which dementia is the target disease is a form that matches the current social problem.
- Target diseases are not limited to cranial nerve diseases, and therefore organs are not limited to the brain.
- the speed of progression of the target disease of subject S may be predicted without using a trained model such as the progression speed prediction model 31 .
- a processing unit Processing As the hardware structure of the Unit, various processors shown below can be used.
- Various processors include, as described above, in addition to the CPU 22 which is a general-purpose processor that executes software (operation program 30) and functions as various processing units, FPGAs (Field Programmable Gate Arrays), etc.
- Programmable Logic Device PLD
- ASIC Application Specific Integrated Circuit
- One processing unit may be configured with one of these various processors, or a combination of two or more processors of the same or different type (for example, a combination of a plurality of FPGAs and/or a CPU and combination with FPGA). Also, a plurality of processing units may be configured by one processor.
- a single processor is configured by combining one or more CPUs and software.
- a processor functions as multiple processing units.
- SoC System On Chip
- a processor that realizes the functions of the entire system including multiple processing units with a single IC (Integrated Circuit) chip. be.
- various processing units are configured using one or more of the above various processors as a hardware structure.
- an electric circuit combining circuit elements such as semiconductor elements can be used.
- the processor Predict the speed of progression of the target disease for subjects in clinical trials, Divide the subjects into multiple groups according to the prediction results of the speed of progression of the target disease, Divide the subjects into a test drug group to which the test drug is administered and a placebo group to which the placebo is administered for each of the plurality of groups; Clinical trial support equipment.
- the clinical trial support device according to claim 1, wherein only the selected subjects are grouped according to the prediction results and sorted into a test drug group and a placebo group.
- the clinical trial support device which uses a block randomization technique to sort subjects into a test drug group and a placebo group.
- the processor Predicting the speed of progression of the target disease using a trained model,
- the trained model uses a medical image of an organ of a target disease patient at a first time point as input data for learning, and the target disease patient at a second time point after a period corresponding to the clinical trial period from the first time point.
- a trained model that has been trained using numerical values indicating the degree of disease progression as correct data
- the processor A medical image showing the subject's organs at the start of the clinical trial is input to the trained model, and a numerical value indicating the degree of progression of the subject's target disease at the end of the clinical trial is used as the prediction result.
- the clinical trial support device according to any one of additional items 1 to 3, which is output from a model.
- the trained model is extracting a plurality of anatomical region images, which are images of a plurality of anatomical regions of an organ, from the medical image at the start of the clinical trial; 5.
- the clinical trial support apparatus wherein the anatomical region image is input to a feature value derivation model prepared for each anatomical region, and the feature value of the anatomical region is output from the feature value derivation model.
- the learning input data also includes target disease-related data related to the target disease of the target disease patient at the first time point, The processor 6.
- the clinical trial support device according to claim 4 or claim 5, wherein target disease-related data relating to the subject's target disease at the start of the clinical trial is also input to the trained model.
- the target disease is dementia, 7.
- the clinical trial support device according to any one of additional items 4 to 6, wherein the numerical value is an amount of change in a cognitive function test score or a probability of developing dementia.
- the technology of the present disclosure can also appropriately combine various embodiments and/or various modifications described above. Moreover, it is needless to say that various configurations can be employed without departing from the scope of the present invention without being limited to the above embodiments. Furthermore, the technology of the present disclosure extends to storage media that non-temporarily store programs in addition to programs.
- a and/or B is synonymous with “at least one of A and B.” That is, “A and/or B” means that only A, only B, or a combination of A and B may be used.
- a and/or B means that only A, only B, or a combination of A and B may be used.
Abstract
This clinical trial assistance apparatus is provided with a processor which: predicts the rate of progress of a disease of interest with respect to the subjects of a clinical trial; divides the subjects into a plurality of groups according to the result of prediction of the rate of progress of the disease of interest; and sorts the subjects, for each of the plurality of groups, into a test drug group for which a test drug is to be administered and a placebo group for which a placebo is to be administered.
Description
本開示の技術は、臨床試験支援装置、臨床試験支援装置の作動方法、および臨床試験支援装置の作動プログラムに関する。
The technology of the present disclosure relates to a clinical trial support device, a method of operating the clinical trial support device, and an operation program for the clinical trial support device.
本格的な高齢化社会の到来により、疾患、例えばアルツハイマー型認知症に代表される認知症の発症を予防したり、認知症の進行を遅らせる医薬(以下、抗認知症薬と表記する場合がある)の開発に力が入れられている。抗認知症薬は、一定期間の臨床試験を経てその効能が評価される。抗認知症薬の臨床試験の対象者(被験者ともいう)としては、認知症の進行が比較的速い者が好ましい。というのは、認知症の進行が比較的遅い者であると、抗認知症薬の効能によって進行が抑えられているのか、その者特有の理由によって進行が遅れているのかが判然としないためである。
With the arrival of a full-fledged aging society, medicines that prevent the onset of dementia, such as Alzheimer's disease, and delay the progression of dementia (hereinafter sometimes referred to as antidementia drugs) ) are being developed. Nootropics are evaluated for efficacy after a period of clinical trials. Subjects (also referred to as subjects) for clinical trials of antidementia drugs are preferably those whose dementia progresses relatively quickly. This is because, in the case of a person whose dementia progresses relatively slowly, it is not clear whether the progress is being suppressed by the efficacy of the nootropics, or whether the progress is delayed due to reasons specific to that person. be.
臨床試験においては、被験薬を投与する被験薬群と、偽薬(プラセボともいう)を投与する偽薬群とに対象者を振り分け、被験薬群と偽薬群との比較により被験薬の効能を確かめるプラセボ対照試験が行われることがある。臨床試験は、少数の健康な成人を対象とした、主に被験薬の安全性およびその体内動態等を調べる臨床第1相試験(臨床薬理試験とも呼ばれる)、比較的小規模な臨床第2相試験(探索的試験とも呼ばれる)、および比較的大規模な臨床第3相試験(検証的試験とも呼ばれる)の3段階の試験に分けて行われる。
In a clinical trial, subjects are divided into a test drug group to which the test drug is administered and a placebo group to which the test drug is administered, and the efficacy of the test drug is confirmed by comparing the test drug group and the placebo group. Controlled trials may be conducted. Clinical trials consist of Phase 1 clinical trials (also called clinical pharmacology trials), which mainly examine the safety and pharmacokinetics of the test drug, in a small number of healthy adults, and relatively small-scale Phase 2 clinical trials. It is divided into three phases: a trial (also called an exploratory trial) and a relatively large Phase 3 clinical trial (also called a confirmatory trial).
<S. Ostrowitzki, et al: A phase III randomized trial of gantenerumab in prodromal Alzheimer’s disease, Alzheimer’s Research & Therapy, 2017.>(以下、文献1と表記する)には、プラセボ対照試験を用いた抗認知症薬の被験薬の臨床試験方法が記載されている。文献1では、臨床試験が終了した後に、回帰モデルを用いて対象者の認知症の進行の速さを予測している。そして、予測結果に応じて対象者を認知症の進行が比較的速いグループと遅いグループとに分け、それぞれのグループに対して被験薬群と偽薬群における認知能力の変化を比較している。
<S. Ostrowitzki, et al: A phase III randomized trial of gantenerumab in prodromal Alzheimer's disease, Alzheimer's Research & Therapy, 2017. > (hereinafter referred to as Document 1) describes a clinical trial method for a test drug for antidementia drugs using a placebo-controlled trial. In Literature 1, a regression model is used to predict the speed of progression of dementia in a subject after a clinical trial is completed. Then, according to the prediction results, the subjects were divided into a group in which dementia progressed relatively quickly and a group in which dementia progressed relatively slowly, and changes in cognitive ability between the test drug group and the placebo group were compared for each group.
プラセボ対照試験では、試験の対象の疾患である対象疾患の進行が比較的速い対象者と遅い対象者の偏りが被験薬群と偽薬群との間にあると、以下のような問題が起こる。例えば臨床第2相試験において、被験薬群に対象疾患の進行が比較的遅い対象者が多く振り分けられ、偽薬群に対象疾患の進行が比較的速い対象者が多く振り分けられた場合を考える。この場合、被験薬の効能が実際には乏しかったとしても被験薬群においては偽薬群と比べて対象疾患の進行が抑えられたかのように見えるので、被験薬の効能が過大に評価される。このため、臨床第2相試験をクリアしたとして臨床第3相試験を行っても、実際は被験薬の効能が乏しいとの結果が出て、臨床第3相試験に掛けた時間と費用が無駄になるおそれがある。
In a placebo-controlled study, if there is a bias between the test drug group and the placebo group, the following problems occur if there is a bias between subjects with relatively fast progression of the target disease, which is the target disease of the study, and subjects with slow progression. For example, in a phase II clinical trial, consider a case in which many subjects with relatively slow progression of the target disease are assigned to the test drug group, and many subjects with relatively fast progression of the target disease are assigned to the placebo group. In this case, even if the efficacy of the test drug is actually poor, it appears that the progression of the target disease was suppressed in the test drug group compared to the placebo group, so the efficacy of the test drug is overestimated. For this reason, even if a Phase 3 clinical trial is conducted on the assumption that the Phase 2 trial has been cleared, the results show that the efficacy of the test drug is actually poor, and the time and money spent on the Phase 3 trial are wasted. may become
反対に、臨床第2相試験において、被験薬群に対象疾患の進行が比較的速い対象者が多く振り分けられ、偽薬群に対象疾患の進行が比較的遅い対象者が多く振り分けられた場合を考える。この場合、被験薬の効能が実際には高かったとしても被験薬群においては偽薬群と比べて対象疾患が進行するので、被験薬の効能が過小に評価される。このため、もし被験薬の効能が実際には高かったとしても、臨床第2相試験をクリアすることができず、臨床第3相試験に移行せずに開発が中止されるおそれがある。
Conversely, in a phase 2 clinical trial, consider the case where many subjects with relatively fast progression of the target disease are assigned to the test drug group, and many subjects with relatively slow progression of the target disease are assigned to the placebo group. . In this case, even if the efficacy of the test drug is actually high, the target disease progresses more in the test drug group than in the placebo group, so the efficacy of the test drug is underestimated. For this reason, even if the efficacy of the investigational drug is actually high, there is a risk that it will not clear the Phase 2 clinical trial and the development will be discontinued without proceeding to the Phase 3 clinical trial.
本開示の技術に係る1つの実施形態は、対象疾患の被験薬の効能の正当な評価に寄与することが可能な臨床試験支援装置、臨床試験支援装置の作動方法、および臨床試験支援装置の作動プログラムを提供する。
One embodiment of the technology of the present disclosure provides a clinical trial support device that can contribute to valid evaluation of efficacy of a test drug for a target disease, a method of operating the clinical trial support device, and operation of the clinical trial support device. Offer a program.
本開示の臨床試験支援装置は、プロセッサを備え、プロセッサは、臨床試験の対象者について対象疾患の進行の速さを予測し、対象疾患の進行の速さの予測結果に応じて対象者を複数のグループに分け、複数のグループ毎に、被験薬を投与する被験薬群と偽薬を投与する偽薬群とに対象者を振り分ける。
The clinical trial support apparatus of the present disclosure includes a processor, the processor predicts the speed of progression of the target disease for subjects of the clinical trial, and selects a plurality of subjects according to the prediction result of the speed of progression of the target disease. The subjects are divided into groups, and the subjects are divided into a test drug group to which the test drug is administered and a placebo group to which the placebo is administered for each of a plurality of groups.
プロセッサは、予測結果に基づいて、対象疾患の進行が比較的速い対象者を選定し、選定した対象者に対してのみ、予測結果に応じたグループ分け、および被験薬群と偽薬群への振り分けを行うことが好ましい。
Based on the prediction results, the processor selects subjects whose target disease progresses relatively quickly, and only the selected subjects are grouped according to the prediction results and divided into the test drug group and the placebo group. It is preferable to
プロセッサは、ブロックランダマイズ手法を用いて被験薬群と偽薬群とに対象者を振り分けることが好ましい。
The processor preferably divides subjects into the test drug group and the placebo group using a block randomization method.
プロセッサは、学習済みモデルを用いて対象疾患の進行の速さの予測を行い、学習済みモデルは、第1時点における対象疾患患者の臓器を写した医用画像を学習用入力データとし、第1時点から臨床試験期間に相当する期間を経た第2時点における対象疾患患者の対象疾患の進行度合いを示す数値を正解データとして学習された学習済みモデルであり、プロセッサは、臨床試験の開始時点における対象者の臓器を写した医用画像を学習済みモデルに入力し、臨床試験の終了時点における対象者の対象疾患の進行度合いを示す数値を、予測結果として学習済みモデルから出力させることが好ましい。
The processor predicts the speed of progression of the target disease using the trained model. is a learned model that has been trained using numerical values indicating the degree of progression of the target disease of the target disease patient at the second time point after a period corresponding to the clinical trial period from It is preferable to input a medical image of the internal organs into a trained model, and output a numerical value indicating the degree of progression of the subject's target disease at the end of the clinical trial from the trained model as a prediction result.
学習済みモデルは、臨床試験の開始時点における医用画像から臓器の複数の解剖区域の画像である複数の解剖区域画像を抽出し、解剖区域毎に用意された特徴量導出モデルに解剖区域画像を入力し、特徴量導出モデルから解剖区域の特徴量を出力させることが好ましい。
The trained model extracts multiple anatomical region images, which are images of multiple anatomical regions of organs, from the medical image at the start of the clinical trial, and inputs the anatomical region images to the feature value derivation model prepared for each anatomical region. Then, it is preferable to output the feature quantity of the anatomical region from the feature quantity derivation model.
学習用入力データは、第1時点における対象疾患患者の対象疾患に関する対象疾患関連データも含み、プロセッサは、臨床試験の開始時点における対象者の対象疾患に関する対象疾患関連データも学習済みモデルに入力することが好ましい。
The learning input data also includes target disease-related data about the target disease of the target disease patient at the first time point, and the processor also inputs target disease-related data about the target disease of the subject at the start of the clinical trial into the trained model. is preferred.
対象疾患は認知症であり、数値は、認知機能検査のスコアの変化量、または対象疾患となる確率であることが好ましい。
The target disease is dementia, and the numerical value is preferably the amount of change in the score of the cognitive function test or the probability of becoming the target disease.
対象疾患は脳神経疾患であることが好ましい。また、対象疾患は認知症であることが好ましい。
It is preferable that the target disease is a cranial nerve disease. Moreover, it is preferable that the target disease is dementia.
本開示の臨床試験支援装置の作動方法は、臨床試験の対象者について対象疾患の進行の速さを予測すること、対象疾患の進行の速さの予測結果に応じて対象者を複数のグループに分けること、並びに、複数のグループ毎に、被験薬を投与する被験薬群と偽薬を投与する偽薬群とに対象者を振り分けること、を含む。
The operating method of the clinical trial support device of the present disclosure predicts the speed of progression of the target disease for subjects in clinical trials, and divides the subjects into a plurality of groups according to the prediction results of the speed of progression of the target disease. and dividing subjects into a test drug group to which a test drug is administered and a placebo group to which a placebo is administered for each of a plurality of groups.
本開示の臨床試験支援装置の作動プログラムは、臨床試験の対象者について対象疾患の進行の速さを予測すること、対象疾患の進行の速さの予測結果に応じて対象者を複数のグループに分けること、並びに、複数のグループ毎に、被験薬を投与する被験薬群と偽薬を投与する偽薬群とに対象者を振り分けること、を含む処理をコンピュータに実行させる。
The operation program of the clinical trial support apparatus of the present disclosure predicts the speed of progression of the target disease for the subjects of the clinical trial, and divides the subjects into a plurality of groups according to the prediction results of the speed of progression of the target disease. A computer is caused to execute a process including dividing and sorting subjects into a test drug group to which a test drug is administered and a placebo group to which a placebo is administered for each of a plurality of groups.
本開示の技術によれば、対象疾患の被験薬の効能の正当な評価に寄与することが可能な臨床試験支援装置、臨床試験支援装置の作動方法、および臨床試験支援装置の作動プログラムを提供することができる。
According to the technology of the present disclosure, a clinical trial support device, a method of operating the clinical trial support device, and an operation program for the clinical trial support device that can contribute to valid evaluation of efficacy of a test drug for a target disease are provided. be able to.
[第1実施形態]
一例として図1に示すように、認知症の発症を予防したり、認知症の進行を遅らせる抗認知症薬の開発に係る臨床試験においては、まず、少数の健康な成人を対象として、主に抗認知症薬の被験薬の安全性およびその体内動態等を調べる臨床第1相試験Ph1が行われる。臨床第1相試験Ph1をクリアした場合、例えば数百人程度の対象者Sによる比較的小規模な臨床第2相試験Ph2が行われる。この臨床第2相試験Ph2に先立ち、被験薬を投与する被験薬群TG(Treatment Group)と、偽薬を投与する偽薬群PG(Placebo Group)とに対象者Sが振り分けられる。 [First embodiment]
As an example, as shown in Figure 1, in clinical trials related to the development of antidementia drugs that prevent the onset of dementia or delay the progression of dementia, first, a small number of healthy adults are mainly APhase 1 clinical trial Ph1 is conducted to investigate the safety and pharmacokinetics of the test drug for antidementia. When the first phase clinical trial Ph1 is cleared, for example, a relatively small-scale second phase clinical trial Ph2 is conducted with about several hundred subjects S. Prior to this Phase 2 clinical trial Ph2, subjects S are divided into a test drug group TG (Treatment Group) to which a test drug is administered and a placebo group PG (Placebo Group) to which a placebo is administered.
一例として図1に示すように、認知症の発症を予防したり、認知症の進行を遅らせる抗認知症薬の開発に係る臨床試験においては、まず、少数の健康な成人を対象として、主に抗認知症薬の被験薬の安全性およびその体内動態等を調べる臨床第1相試験Ph1が行われる。臨床第1相試験Ph1をクリアした場合、例えば数百人程度の対象者Sによる比較的小規模な臨床第2相試験Ph2が行われる。この臨床第2相試験Ph2に先立ち、被験薬を投与する被験薬群TG(Treatment Group)と、偽薬を投与する偽薬群PG(Placebo Group)とに対象者Sが振り分けられる。 [First embodiment]
As an example, as shown in Figure 1, in clinical trials related to the development of antidementia drugs that prevent the onset of dementia or delay the progression of dementia, first, a small number of healthy adults are mainly A
臨床第2相試験Ph2において被験薬の効能なしと判定した場合(図1では「NG」と表記)は、臨床試験が中止される。一方、臨床第2相試験Ph2において被験薬の効能ありと判定した場合(図1では「OK」と表記)は、一例として図2に示すように、例えば数千人程度の対象者Sによる比較的大規模な臨床第3相試験Ph3が行われる。臨床第2相試験Ph2の場合と同様に、臨床第3相試験Ph3においても、被験薬群TGと偽薬群PGとに対象者Sが振り分けられる。臨床第2相試験Ph2および臨床第3相試験Ph3の期間は、いずれも例えば18カ月間である。
If it is determined that the test drug has no efficacy in the Phase 2 clinical trial (indicated as "NG" in Figure 1), the clinical trial will be discontinued. On the other hand, when it is determined that the test drug is efficacious in the Phase 2 clinical trial (denoted as "OK" in FIG. 1), as shown in FIG. A large scale Phase 3 clinical trial Ph3 will be conducted. As in the case of the clinical phase 2 study Ph2, in the clinical phase 3 study Ph3, the subjects S are divided into the test drug group TG and the placebo group PG. The duration of the clinical phase 2 trial Ph2 and the clinical phase 3 trial Ph3 are both, for example, 18 months.
臨床第3相試験Ph3において被験薬の効能なしと判定した場合(図2では「NG」と表記)は、臨床試験が中止される。一方、臨床第3相試験Ph3において被験薬の効能ありと判定した場合(図2では「OK」と表記)は、厚生労働省への薬事申請が行われる。このため、本例における臨床試験は、厚生労働省からの承認を得ることを目的として行われる「治験」である。もちろん、「治験」以外の臨床試験も本開示の技術に含まれる。
If it is determined that the test drug has no efficacy in the Phase 3 clinical trial (indicated as "NG" in Figure 2), the clinical trial will be discontinued. On the other hand, when it is determined that the test drug is efficacious in the Phase 3 clinical trial (denoted as "OK" in FIG. 2), a pharmaceutical application is submitted to the Ministry of Health, Labor and Welfare. Therefore, the clinical trial in this example is a "trial" conducted for the purpose of obtaining approval from the Ministry of Health, Labor and Welfare. Of course, clinical trials other than "clinical trials" are also included in the technology of the present disclosure.
認知症は、本開示の技術に係る「対象疾患」および「脳神経疾患」の一例である。認知症としては、アルツハイマー型認知症、レビー小体型認知症、および血管性認知症等が挙げられる。抗認知症薬は、アルツハイマー型認知症以外のアルツハイマー病に用いるものでもよい。具体的には、抗認知症薬は、アルツハイマー病の発症前段階(PAD:Preclinical Alzheimer’s disease)から、アルツハイマー病による軽度認知障害(MCI(Mild Cognitive Impairment) due to Alzheimer’s disease)への進行を遅らせるものであってもよいし、アルツハイマー病によるMCIからアルツハイマー病への進行を遅らせるものであってもよい。対象疾患としては、例示の認知症のような脳神経疾患が好ましい。
Dementia is an example of a "target disease" and a "brain nerve disease" according to the technology of the present disclosure. Dementia includes Alzheimer's dementia, Lewy body dementia, vascular dementia, and the like. The nootropic drug may be used for Alzheimer's disease other than Alzheimer's dementia. Specifically, antidementia drugs are used to promote the progression of Alzheimer's disease from preclinical Alzheimer's disease (PAD) to mild cognitive impairment (MCI) due to Alzheimer's disease. It may be one that delays progression, or one that delays progression from MCI due to Alzheimer's disease to Alzheimer's disease. The target disease is preferably a cranial nerve disease such as dementia.
なお、認知症の診断基準としては、日本神経学会監修の「認知症疾患診療ガイドライン2017」、「国際疾病分類第11版(ICD(International Statistical Classification of Diseases and Related Health Problems)-11)」、米国精神医学会による「精神疾患の診断・統計マニュアル第5版(Diagnostic and Statistical Manual of Mental Disorders, Fifth Edition(DSM-5))」、および「米国国立老化研究所/アルツハイマー病協会ワークグループ(National Institute on Aging-Alzheimer’s Association workgroup(NIA-AA))基準」に記載された診断基準がある。かかる診断基準は援用することができ、これらの内容は本願明細書に組み込まれる。
As diagnostic criteria for dementia, the "Clinical Guidelines for Dementia Diseases 2017" supervised by the Japanese Society of Neurology, "International Classification of Diseases 11th edition (ICD (International Statistical Classification of Diseases and Related Health Problems)-11)", the United States "Diagnostic and Statistical Manual of Mental Disorders, Fifth Edition (DSM-5)" by the Psychiatric Association and "National Institute on Aging/Alzheimer's Society Workgroup (National Institute) On Aging-Alzheimer's Association workgroup (NIA-AA)) Criteria". Such diagnostic criteria can be cited and their contents are incorporated herein.
認知症の診断基準に係るデータには、認知機能検査データ、形態画像検査データ、脳機能画像検査データ、血液・脳髄液検査データ、および遺伝子検査データ等がある。認知機能検査データには、臨床認知症評価法(以下、CDR-SOB(Clinical Dementia Rating-Sum of Boxes)と略す)のスコア、ミニメンタルステート検査(以下、MMSE(Mini-Mental State Examination)と略す)のスコア、およびアルツハイマー病評価スケール(以下、ADAS-Cog(Alzheimer’s Disease Assessment Scale-cognitive subscale)と略す)のスコア等がある。形態画像検査データには、核磁気共鳴画像法(MRI:Magnetic Resonance Imaging)による脳の断層画像(以下、MRI画像という)16(図3参照)、あるいはコンピュータ断層撮影(CT:Computed Tomography)による脳の断層画像(以下、CT画像という)等がある。
Data related to the diagnostic criteria for dementia include cognitive function test data, morphological image test data, brain function image test data, blood/cerebrospinal fluid test data, and genetic test data. Cognitive function test data includes clinical dementia evaluation method (hereinafter abbreviated as CDR-SOB (Clinical Dementia Rating-Sum of Boxes)) score, mini-mental state examination (hereinafter abbreviated as MMSE (Mini-Mental State Examination) ) and Alzheimer's disease assessment scale (hereinafter abbreviated as ADAS-Cog (Alzheimer's Disease Assessment Scale-cognitive subscale)). The morphological imaging test data includes a tomographic image (hereinafter referred to as an MRI image) 16 (hereinafter referred to as an MRI image) 16 (see FIG. 3) of the brain obtained by magnetic resonance imaging (MRI), or a brain image obtained by computed tomography (CT). tomographic images (hereinafter referred to as CT images).
脳機能画像検査データには、ポジトロン断層法(PET:Positron Emission Tomography)による脳の断層画像(以下、PET画像という)、単一光子放射断層撮影(SPECT:Single Photon Emission Computed Tomography)による脳の断層画像(以下、SPECT画像という)等がある。血液・脳髄液検査データには、脳脊髄液(以下、CSF(Cerebrospinal Fluid)と略す)中のp-tau(リン酸化タウ蛋白)181の量等がある。遺伝子検査データには、ApoE遺伝子の遺伝子型の検査結果等がある。
Brain functional imaging test data includes brain tomographic images (hereinafter referred to as PET images) by positron emission tomography (PET), brain tomography by single photon emission tomography (SPECT) images (hereinafter referred to as SPECT images) and the like. Blood and cerebrospinal fluid test data include the amount of p-tau (phosphorylated tau protein) 181 in cerebrospinal fluid (hereinafter abbreviated as CSF (Cerebrospinal Fluid)). The genetic test data includes the genotype test results of the ApoE gene.
一例として図3に示すように、臨床試験支援サーバ10は、臨床第2相試験Ph2および臨床第3相試験Ph3における対象者Sの被験薬群TGと偽薬群PGへの振り分けを支援するサーバであり、オペレータ端末11にネットワーク12を介して接続されている。臨床試験支援サーバ10は、本開示の技術に係る「臨床試験支援装置」の一例である。オペレータ端末11は、例えば医薬開発施設に設置され、医薬開発施設において臨床試験に携わるオペレータが操作する。オペレータ端末11は、ディスプレイ13、およびキーボード、マウスといった入力デバイス14を有する。ネットワーク12は、例えばインターネットあるいは公衆通信網等のWAN(Wide Area Network)である。なお、図3においては1台のオペレータ端末11しか臨床試験支援サーバ10に接続されていないが、実際には複数の医薬開発施設の複数台のオペレータ端末11が臨床試験支援サーバ10に接続されている。
As an example, as shown in FIG. 3, the clinical trial support server 10 is a server that assists in the allocation of the subject S to the test drug group TG and placebo group PG in the clinical phase 2 trial Ph2 and the clinical phase 3 trial Ph3. It is connected to an operator terminal 11 via a network 12 . The clinical trial support server 10 is an example of a “clinical trial support device” according to the technology of the present disclosure. The operator terminal 11 is installed, for example, in a drug development facility and operated by an operator involved in clinical trials at the drug development facility. The operator terminal 11 has a display 13 and input devices 14 such as a keyboard and a mouse. The network 12 is, for example, a WAN (Wide Area Network) such as the Internet or a public communication network. Although only one operator terminal 11 is connected to the clinical trial support server 10 in FIG. there is
オペレータ端末11は、臨床試験支援サーバ10に振り分け要求15を送信する。振り分け要求15は、臨床第2相試験Ph2または臨床第3相試験Ph3における対象者Sの被験薬群TGと偽薬群PGへの振り分けを、臨床試験支援サーバ10に行わせるための要求である。振り分け要求15は、各対象者Sの脳を写したMRI画像16の集合であるMRI画像群16Gを含む。MRI画像16には、対象者Sを一意に識別するための対象者ID(Identification Data)が付されている。MRI画像16は、本開示の技術に係る「医用画像」の一例である。また、脳は、本開示の技術に係る「臓器」の一例である。なお、図示は省略するが、振り分け要求15は、振り分け要求15の送信元のオペレータ端末11を一意に識別するための端末ID等も含む。
The operator terminal 11 transmits a distribution request 15 to the clinical trial support server 10. The allocation request 15 is a request for causing the clinical trial support server 10 to sort the subject S into the test drug group TG and the placebo group PG in the clinical phase 2 trial Ph2 or the clinical phase 3 trial Ph3. The distribution request 15 includes an MRI image group 16G, which is a set of MRI images 16 showing the brain of each subject S. A subject ID (Identification Data) for uniquely identifying the subject S is attached to the MRI image 16 . The MRI image 16 is an example of a "medical image" according to the technology of the present disclosure. Also, the brain is an example of an “organ” according to the technology of the present disclosure. Although illustration is omitted, the distribution request 15 also includes a terminal ID or the like for uniquely identifying the operator terminal 11 that sent the distribution request 15 .
振り分け要求15を受信した場合、臨床試験支援サーバ10は、振り分け結果17を導出する。振り分け結果17は、対象者ID毎に振り分けの結果である被験薬群TGまたは偽薬群PGが登録されたデータである。臨床試験支援サーバ10は、振り分け要求15の送信元のオペレータ端末11に振り分け結果17を配信する。振り分け結果17を受信した場合、オペレータ端末11は、振り分け結果17をディスプレイ13に表示し、振り分け結果17をオペレータの閲覧に供する。
Upon receiving the allocation request 15, the clinical trial support server 10 derives the allocation result 17. The sorting result 17 is data in which the test drug group TG or the placebo group PG, which is the sorting result for each subject ID, is registered. The clinical trial support server 10 delivers the sorting result 17 to the operator terminal 11 that sent the sorting request 15 . When receiving the sorting result 17, the operator terminal 11 displays the sorting result 17 on the display 13 and provides the sorting result 17 for the operator to view.
一例として図4に示すように、臨床試験支援サーバ10を構成するコンピュータは、ストレージ20、メモリ21、CPU(Central Processing Unit)22、通信部23、ディスプレイ24、および入力デバイス25を備えている。これらはバスライン26を介して相互接続されている。
As shown in FIG. 4 as an example, the computer that constitutes the clinical trial support server 10 includes a storage 20, a memory 21, a CPU (Central Processing Unit) 22, a communication section 23, a display 24, and an input device 25. These are interconnected via bus lines 26 .
ストレージ20は、臨床試験支援サーバ10を構成するコンピュータに内蔵、またはケーブル、ネットワークを通じて接続されたハードディスクドライブである。もしくはストレージ20は、ハードディスクドライブを複数台連装したディスクアレイである。ストレージ20には、オペレーティングシステム等の制御プログラム、各種アプリケーションプログラム、およびこれらのプログラムに付随する各種データ等が記憶されている。なお、ハードディスクドライブに代えてソリッドステートドライブを用いてもよい。
The storage 20 is a hard disk drive built into the computer that constitutes the clinical trial support server 10 or connected via a cable or network. Alternatively, the storage 20 is a disk array in which a plurality of hard disk drives are connected. The storage 20 stores a control program such as an operating system, various application programs, various data associated with these programs, and the like. A solid state drive may be used instead of the hard disk drive.
メモリ21は、CPU22が処理を実行するためのワークメモリである。CPU22は、ストレージ20に記憶されたプログラムをメモリ21へロードして、プログラムにしたがった処理を実行する。これによりCPU22は、コンピュータの各部を統括的に制御する。CPU22は、本開示の技術に係る「プロセッサ」の一例である。なお、メモリ21は、CPU22に内蔵されていてもよい。
The memory 21 is a work memory for the CPU 22 to execute processing. The CPU 22 loads the program stored in the storage 20 into the memory 21 and executes processing according to the program. Thereby, the CPU 22 comprehensively controls each part of the computer. The CPU 22 is an example of a "processor" according to the technology of the present disclosure. Note that the memory 21 may be built in the CPU 22 .
通信部23は、オペレータ端末11等の外部装置との各種情報の伝送制御を行う。ディスプレイ24は各種画面を表示する。各種画面にはGUI(Graphical User Interface)による操作機能が備えられる。臨床試験支援サーバ10を構成するコンピュータは、各種画面を通じて、入力デバイス25からの操作指示の入力を受け付ける。入力デバイス25は、キーボード、マウス、タッチパネル、および音声入力用のマイク等である。
The communication unit 23 controls transmission of various information with external devices such as the operator terminal 11. The display 24 displays various screens. Various screens are provided with operation functions by GUI (Graphical User Interface). The computer that configures the clinical trial support server 10 accepts input of operation instructions from the input device 25 through various screens. The input device 25 is a keyboard, mouse, touch panel, microphone for voice input, and the like.
一例として図5に示すように、臨床試験支援サーバ10のストレージ20には、作動プログラム30が記憶されている。作動プログラム30は、コンピュータを臨床試験支援サーバ10として機能させるためのアプリケーションプログラムである。すなわち、作動プログラム30は、本開示の技術に係る「臨床試験支援装置の作動プログラム」の一例である。ストレージ20には、MRI画像群16Gも記憶される。また、ストレージ20には、進行速さ予測モデル31および振り分けテーブル32も記憶される。進行速さ予測モデル31は、本開示の技術に係る「学習済みモデル」の一例である。
As shown in FIG. 5 as an example, the operating program 30 is stored in the storage 20 of the clinical trial support server 10 . The operating program 30 is an application program for causing the computer to function as the clinical trial support server 10. FIG. That is, the operating program 30 is an example of the "clinical trial support device operating program" according to the technology of the present disclosure. The storage 20 also stores an MRI image group 16G. The storage 20 also stores a progress speed prediction model 31 and a sorting table 32 . The progress speed prediction model 31 is an example of a “learned model” according to the technology of the present disclosure.
作動プログラム30が起動されると、臨床試験支援サーバ10を構成するコンピュータのCPU22は、メモリ21等と協働して、受付部35、リードライト(以下、RW(Read Write)と略す)制御部36、予測部37、グループ分け部38、振り分け部39、および配信制御部40として機能する。
When the operation program 30 is started, the CPU 22 of the computer that constitutes the clinical trial support server 10 cooperates with the memory 21 and the like to operate the reception unit 35, the read/write (hereinafter abbreviated as RW (Read Write)) control unit 36 , a prediction unit 37 , a grouping unit 38 , a distribution unit 39 , and a distribution control unit 40 .
受付部35は、オペレータ端末11からの振り分け要求15を受け付ける。前述のように、振り分け要求15はMRI画像群16Gを含んでいる。このため、受付部35は、振り分け要求15を受け付けることで、MRI画像群16Gを取得していることになる。受付部35は、MRI画像群16GをRW制御部36に出力する。また、受付部35は、図示省略したオペレータ端末11の端末IDを配信制御部40に出力する。
The reception unit 35 receives the distribution request 15 from the operator terminal 11 . As mentioned above, the distribution request 15 contains the MRI image group 16G. Therefore, by accepting the distribution request 15, the accepting unit 35 acquires the MRI image group 16G. The reception unit 35 outputs the MRI image group 16G to the RW control unit 36 . The receiving unit 35 also outputs the terminal ID of the operator terminal 11 (not shown) to the distribution control unit 40 .
RW制御部36は、ストレージ20への各種データの記憶、およびストレージ20内の各種データの読み出しを制御する。例えばRW制御部36は、受付部35からのMRI画像群16Gをストレージ20に記憶する。また、RW制御部36は、MRI画像群16Gをストレージ20から読み出し、MRI画像群16Gを予測部37に出力する。また、RW制御部36は、進行速さ予測モデル31をストレージ20から読み出し、進行速さ予測モデル31を予測部37に出力する。さらに、RW制御部36は、振り分けテーブル32をストレージ20から読み出し、振り分けテーブル32を振り分け部39に出力する。
The RW control unit 36 controls storage of various data in the storage 20 and reading of various data in the storage 20 . For example, the RW control unit 36 stores the MRI image group 16G from the reception unit 35 in the storage 20 . The RW control unit 36 also reads out the MRI image group 16G from the storage 20 and outputs the MRI image group 16G to the prediction unit 37 . The RW control unit 36 also reads the progress speed prediction model 31 from the storage 20 and outputs the progress speed prediction model 31 to the prediction unit 37 . Furthermore, the RW control unit 36 reads the distribution table 32 from the storage 20 and outputs the distribution table 32 to the distribution unit 39 .
予測部37は、進行速さ予測モデル31を用いて、MRI画像群16Gを構成する全てのMRI画像16から、各対象者Sの認知症の進行の速さを予測する。予測部37は、各対象者Sの認知症の進行の速さの予測結果45(図6参照)の集合である予測結果群45Gをグループ分け部38に出力する。
The prediction unit 37 uses the progression speed prediction model 31 to predict the speed of progression of dementia of each subject S from all the MRI images 16 that make up the MRI image group 16G. The prediction unit 37 outputs to the grouping unit 38 a prediction result group 45</b>G that is a set of prediction results 45 (see FIG. 6 ) of the rate of progression of dementia of each subject S.
グループ分け部38は、予測結果45に応じて対象者Sを複数のグループに分ける。グループ分け部38は、グループ分け結果46を振り分け部39に出力する。
The grouping unit 38 divides the subject S into a plurality of groups according to the prediction result 45. The grouping section 38 outputs the grouping result 46 to the sorting section 39 .
振り分け部39は、振り分けテーブル32に基づいて、複数のグループ毎に、被験薬群TGと偽薬群PGとに対象者Sを振り分ける。振り分け部39は、振り分け結果17を配信制御部40に出力する。
Based on the sorting table 32, the sorting unit 39 sorts the subjects S into the test drug group TG and the placebo group PG for each of a plurality of groups. The distribution unit 39 outputs the distribution result 17 to the distribution control unit 40 .
配信制御部40は、振り分け要求15の送信元のオペレータ端末11に振り分け結果17を配信する制御を行う。この際、配信制御部40は、受付部35からの端末IDに基づいて、振り分け要求15の送信元のオペレータ端末11を特定する。
The distribution control unit 40 controls distribution of the distribution result 17 to the operator terminal 11 that sent the distribution request 15 . At this time, the distribution control unit 40 identifies the operator terminal 11 that is the transmission source of the distribution request 15 based on the terminal ID from the reception unit 35 .
一例として図6に示すように、予測部37は、MRI画像16を進行速さ予測モデル31に入力する。そして、進行速さ予測モデル31から予測結果45を出力させる。予測結果45は、本例においては、CDR-SOBのスコアの変化量(以下、CDR-SOB変化量と表記する)である。
As shown in FIG. 6 as an example, the prediction unit 37 inputs the MRI image 16 to the progressing speed prediction model 31 . Then, the prediction result 45 is output from the advancing speed prediction model 31 . In this example, the prediction result 45 is the CDR-SOB score change amount (hereinafter referred to as CDR-SOB change amount).
進行速さ予測モデル31に入力されるMRI画像16は、臨床試験の開始時点TSにおける対象者Sの脳を写した画像である。また、進行速さ予測モデル31から出力される予測結果45は、開始時点TSから臨床試験期間PDを経た、臨床試験の終了時点TEにおける対象者SのCDR-SOB変化量を予測したものである。CDR-SOB変化量が0以上であれば、臨床試験の終了時点において当該対象者Sは認知症が進行しているとの予測が立つ。また、CDR-SOB変化量が大きい程、当該対象者Sの認知症の進行が速いとの予測が立つ。なお、予測結果45には、MRI画像16と同じ対象者IDが付される。CDR-SOB変化量は、本開示の技術に係る「対象疾患の進行度合いを示す数値」、および「認知機能検査のスコアの変化量」の一例である。以下、説明の便宜上、CDR-SOB変化量をΔと表記する場合がある。なお、開始時点TSは、厳密に臨床試験の開始日でもよいが、臨床試験の開始日の1週間前後等のマージンを設けてもよい。
The MRI image 16 input to the progression speed prediction model 31 is an image of the brain of the subject S at the start time TS of the clinical trial. In addition, the prediction result 45 output from the progression speed prediction model 31 predicts the CDR-SOB change amount of the subject S at the end point TE of the clinical trial after the clinical trial period PD from the start point TS. . If the CDR-SOB variation is 0 or more, it can be predicted that dementia has progressed in the subject S at the end of the clinical trial. In addition, it can be predicted that the greater the CDR-SOB change amount, the faster the progress of dementia of the subject S. Note that the prediction result 45 is given the same subject ID as the MRI image 16 . The amount of change in CDR-SOB is an example of the “numerical value indicating the degree of progression of the target disease” and the “amount of change in cognitive function test score” according to the technology of the present disclosure. Hereinafter, for convenience of explanation, the CDR-SOB change amount may be expressed as Δ. The start time TS may be strictly the start date of the clinical trial, but may be set with a margin such as one week before or after the start date of the clinical trial.
一例として図7に示すように、進行速さ予測モデル31は、セグメンテーションモデル50、複数の特徴量導出モデル51、および変化量導出モデル52により構成される。セグメンテーションモデル50は、MRI画像16に写る脳の画素毎に、海馬、前側頭葉、扁桃体といった脳の各解剖区域を表すラベルを付与する、いわゆるセマンティックセグメンテーションを行う学習済みモデルである。予測部37は、セグメンテーションモデル50が付与したラベルに基づいて、MRI画像16から、脳の複数の解剖区域の画像(以下、解剖区域画像という)53を抽出する。図7においては、海馬の解剖区域画像53_1、前側頭葉の解剖区域画像53_2、および扁桃体の解剖区域画像53_3等を抽出した例を示している。前側頭葉とは、側頭葉の前部という意である。これら海馬、前側頭葉、および扁桃体の他にも、例えば、前頭葉、乳頭体、脳梁、脳弓、および側脳室等の解剖区域画像を抽出してもよい。解剖区域画像としては、さらに、海馬傍回、後頭葉、視床、および視床下部等の他の複数の解剖区域の画像を含むことが好ましい。海馬、前側頭葉といった脳の左右に存在する解剖区域については、左右のそれぞれの解剖区域の解剖区域画像を抽出することが好ましい。国際公開第2022/071158号に記載されているように、解剖区域画像としては、少なくとも海馬の画像を含むことが好ましく、少なくとも海馬の画像および前側頭葉の画像を含むことがより好ましい。
As shown in FIG. 7 as an example, the progress speed prediction model 31 is composed of a segmentation model 50, a plurality of feature value derivation models 51, and a variation derivation model 52. The segmentation model 50 is a trained model that performs so-called semantic segmentation by assigning a label representing each anatomical region of the brain, such as the hippocampus, the anterior temporal lobe, and the amygdala, to each pixel of the brain shown in the MRI image 16 . The prediction unit 37 extracts images 53 of a plurality of anatomical regions of the brain (hereinafter referred to as anatomical region images) from the MRI image 16 based on the labels given by the segmentation model 50 . FIG. 7 shows an example of extracting an anatomical area image 53_1 of the hippocampus, an anatomical area image 53_2 of the anterior temporal lobe, an anatomical area image 53_3 of the amygdala, and the like. Anterior temporal lobe means the front part of the temporal lobe. In addition to the hippocampus, anterior temporal lobe, and amygdala, for example, images of anatomical regions such as the frontal lobe, mammary body, corpus callosum, brain arch, and lateral ventricle may be extracted. The anatomical region images preferably also include images of other anatomical regions such as the parahippocampal gyrus, occipital lobe, thalamus, and hypothalamus. For anatomical regions existing on the left and right sides of the brain, such as the hippocampus and the anterior temporal lobe, it is preferable to extract an anatomical region image of each of the left and right anatomical regions. As described in WO2022/071158, the anatomical area image preferably includes at least an image of the hippocampus, and more preferably includes at least an image of the hippocampus and an image of the anterior temporal lobe.
特徴量導出モデル51は、脳の解剖区域毎に1つずつ用意されている。図7においては、海馬の特徴量導出モデル51_1、前側頭葉の特徴量導出モデル51_2、および扁桃体の特徴量導出モデル51_3を例示している。予測部37は、各解剖区域画像53を対応する特徴量導出モデル51に入力する。そして、特徴量導出モデル51から各解剖区域の特徴量54を出力させる。図7においては、海馬の特徴量54_1、前側頭葉の特徴量54_2、および扁桃体の特徴量54_3等を例示している。
One feature value derivation model 51 is prepared for each anatomical region of the brain. FIG. 7 illustrates a hippocampus feature amount derivation model 51_1, an anterior temporal lobe feature amount derivation model 51_2, and an amygdala feature amount derivation model 51_3. The prediction unit 37 inputs each anatomical region image 53 to the corresponding feature value derivation model 51 . Then, the feature quantity 54 of each anatomical region is output from the feature quantity derivation model 51 . In FIG. 7, a feature amount 54_1 of the hippocampus, a feature amount 54_2 of the anterior temporal lobe, a feature amount 54_3 of the amygdala, and the like are illustrated.
予測部37は、各解剖区域の特徴量54の集合である特徴量群54Gを変化量導出モデル52に入力する。そして、変化量導出モデル52から予測結果45を出力させる。変化量導出モデル52は、ニューラルネットワーク、サポートベクターマシン、ブースティングのうちのいずれかの手法によって構築される。
The prediction unit 37 inputs a feature quantity group 54G, which is a set of feature quantities 54 of each anatomical region, to the variation derivation model 52. Then, the prediction result 45 is output from the variation derivation model 52 . The variation derivation model 52 is constructed by any one of neural network, support vector machine, and boosting.
一例として図8に示すように、特徴量導出モデル51には、オートエンコーダ(以下、AE(Auto Encoder)と略す)60のエンコーダ部61が用いられる。AE60は、エンコーダ部61とデコーダ部62とを有する。エンコーダ部61には解剖区域画像53が入力される。エンコーダ部61は、周知の畳み込み演算およびプーリング処理等を行うことで、解剖区域画像53を特徴量54に変換する。こうして得られた特徴量54は、海馬の萎縮の程度、前側頭葉の血流代謝低下の有無といった、各解剖区域の形状およびテクスチャーの特徴を表している。エンコーダ部61は、特徴量54をデコーダ部62に受け渡す。デコーダ部62は、特徴量54から解剖区域画像53の復元画像63を生成する。
As an example, as shown in FIG. 8, the feature value derivation model 51 uses an encoder unit 61 of an autoencoder (hereinafter abbreviated as AE (Auto Encoder)) 60 . AE 60 has an encoder section 61 and a decoder section 62 . An anatomical region image 53 is input to the encoder unit 61 . The encoder unit 61 converts the anatomical region image 53 into a feature amount 54 by performing well-known convolution operation, pooling processing, and the like. The feature values 54 obtained in this manner represent the features of the shape and texture of each anatomical segment, such as the degree of hippocampal atrophy and the presence or absence of decreased blood flow metabolism in the anterior temporal lobe. The encoder section 61 transfers the feature amount 54 to the decoder section 62 . A decoder unit 62 generates a restored image 63 of the anatomical region image 53 from the feature amount 54 .
一例として図9に示すように、AE60は、エンコーダ部61を特徴量導出モデル51に転用する前の学習フェーズにおいて、学習用解剖区域画像53Lが入力されて学習される。学習用解剖区域画像53Lは、セグメンテーションモデル50を用いて学習用MRI画像16Lから抽出された画像である。学習用MRI画像16Lは、ADNI(Alzheimer’s Disease Neuroimaging Initiative)等のデータベースにMRI画像16等が登録された認知症患者のうち、臨床試験の参加条件を満たす認知症患者のMRI画像16である。臨床試験の参加条件は、例えば、CSF検査におけるアミロイドβが陽性で、かつMMSEのスコアが26点以下等である。学習用MRI画像16Lは、本開示の技術に係る「学習用入力データ」の一例である。また、認知症患者は、本開示の技術に係る「対象疾患患者」の一例である。
As an example, as shown in FIG. 9, the AE 60 learns by inputting the learning anatomical region image 53L in the learning phase before the encoder unit 61 is diverted to the feature value derivation model 51 . The anatomical region image for learning 53L is an image extracted from the MRI image for learning 16L using the segmentation model 50 . The learning MRI image 16L is an MRI image 16 of a dementia patient whose MRI image 16 etc. is registered in a database such as ADNI (Alzheimer's Disease Neuroimaging Initiative) and who satisfies the conditions for participating in a clinical trial. . Conditions for participation in clinical trials include, for example, a positive amyloid β in the CSF test and an MMSE score of 26 or less. The learning MRI image 16L is an example of “learning input data” according to the technology of the present disclosure. A dementia patient is an example of a “target disease patient” according to the technology of the present disclosure.
AE60は、学習用解剖区域画像53Lに対して学習用復元画像63Lを出力する。これら学習用解剖区域画像53Lおよび学習用復元画像63Lに基づいて、損失関数を用いたAE60の損失演算がなされる。そして、損失演算の結果に応じてAE60の各種係数(畳み込み演算のフィルタの係数等)の更新設定がなされ、更新設定にしたがってAE60が更新される。
The AE 60 outputs a learning restored image 63L for the learning anatomical region image 53L. Based on these learning anatomical region image 53L and learning restored image 63L, loss calculation of the AE 60 using a loss function is performed. Various coefficients of the AE 60 (such as filter coefficients for convolution calculation) are updated according to the result of the loss calculation, and the AE 60 is updated according to the update settings.
AE60の学習フェーズにおいては、学習用解剖区域画像53LのAE60への入力、AE60からの学習用復元画像63Lの出力、損失演算、更新設定、およびAE60の更新の上記一連の処理が、学習用解剖区域画像53Lが交換されつつ繰り返し行われる。上記一連の処理の繰り返しは、学習用解剖区域画像53Lから学習用復元画像63Lへの復元精度が、予め定められた設定レベルまで達した場合に終了される。こうして復元精度が設定レベルまで達したAE60のエンコーダ部61が、進行速さ予測モデル31の一部として予測部37において用いられる。なお、学習用解剖区域画像53Lから学習用復元画像63Lへの復元精度に関係なく、上記一連の処理を設定回数繰り返した場合に学習を終了してもよい。
In the learning phase of the AE 60, the above-described series of processing of inputting the learning anatomical region image 53L to the AE 60, outputting the learning restored image 63L from the AE 60, loss calculation, update settings, and updating the AE 60 is performed by the learning anatomy. This is repeated while the area images 53L are exchanged. Repetition of the above series of processes is terminated when the restoration accuracy from the learning anatomical region image 53L to the learning restored image 63L reaches a predetermined set level. The encoder unit 61 of the AE 60 whose restoration accuracy reaches the set level in this way is used in the prediction unit 37 as part of the progress speed prediction model 31 . Note that regardless of the restoration accuracy from the learning anatomical region image 53L to the learning restored image 63L, learning may be terminated when the series of processes described above is repeated a set number of times.
一例として図10に示すように、変化量導出モデル52は、学習データ70によって学習される。学習データ70は、学習用特徴量群54GLおよび正解CDR-SOB変化量45CAの組である。学習用特徴量群54GLは、学習用MRI画像16Lから抽出した各解剖区域の学習用解剖区域画像53Lを、学習済みの各特徴量導出モデル51に入力して得られたものである。正解CDR-SOB変化量45CAは、学習用特徴量群54GLを得た学習用MRI画像16Lの認知症患者の実際のCDR-SOB変化量である。正解CDR-SOB変化量45CAは、本開示の技術に係る「正解データ」の一例である。
As shown in FIG. 10 as an example, the variation derivation model 52 is learned by learning data 70. The learning data 70 is a set of the learning feature quantity group 54GL and the correct CDR-SOB variation 45CA. The learning feature quantity group 54GL is obtained by inputting the learning anatomical region image 53L of each anatomical region extracted from the learning MRI image 16L into each learned feature quantity derivation model 51 . The correct CDR-SOB change amount 45CA is the actual CDR-SOB change amount of the dementia patient in the learning MRI image 16L from which the learning feature amount group 54GL was obtained. The correct CDR-SOB variation 45CA is an example of "correct data" according to the technology of the present disclosure.
学習フェーズにおいて、変化量導出モデル52には、学習用特徴量群54GLが入力される。変化量導出モデル52は、学習用特徴量群54GLに対して学習用予測結果45Lを出力する。この学習用予測結果45Lおよび正解CDR-SOB変化量45CAに基づいて、損失関数を用いた変化量導出モデル52の損失演算がなされる。そして、損失演算の結果に応じて変化量導出モデル52の各種係数の更新設定がなされ、更新設定にしたがって変化量導出モデル52が更新される。
In the learning phase, the learning feature group 54GL is input to the variation derivation model 52 . The change amount derivation model 52 outputs a learning prediction result 45L for the learning feature amount group 54GL. Based on the learning prediction result 45L and the correct CDR-SOB variation 45CA, the loss calculation of the variation derivation model 52 using a loss function is performed. Various coefficients of the variation derivation model 52 are updated according to the result of the loss calculation, and the variation derivation model 52 is updated according to the update settings.
変化量導出モデル52の学習フェーズにおいては、学習用特徴量群54GLの変化量導出モデル52への入力、変化量導出モデル52からの学習用予測結果45Lの出力、損失演算、更新設定、および変化量導出モデル52の更新の上記一連の処理が、学習データ70が交換されつつ繰り返し行われる。上記一連の処理の繰り返しは、正解CDR-SOB変化量45CAに対する学習用予測結果45Lの予測精度が、予め定められた設定レベルまで達した場合に終了される。こうして予測精度が設定レベルまで達した変化量導出モデル52が、進行速さ予測モデル31の一部として予測部37において用いられる。なお、正解CDR-SOB変化量45CAに対する学習用予測結果45Lの予測精度に関係なく、上記一連の処理を設定回数繰り返した場合に学習を終了してもよい。
In the learning phase of the variation derivation model 52, the input of the learning feature group 54GL to the variation derivation model 52, the output of the learning prediction result 45L from the variation derivation model 52, the loss calculation, the update setting, and the change The series of processes for updating the quantity derivation model 52 are repeated while the learning data 70 are exchanged. The repetition of the above series of processes ends when the prediction accuracy of the learning prediction result 45L with respect to the correct CDR-SOB change amount 45CA reaches a predetermined set level. The variation derivation model 52 whose prediction accuracy reaches the set level in this way is used in the prediction unit 37 as part of the progress speed prediction model 31 . Regardless of the prediction accuracy of the learning prediction result 45L with respect to the correct CDR-SOB change amount 45CA, learning may be terminated when the above series of processes are repeated a set number of times.
一例として図11に示すように、学習用MRI画像16Lは、第1時点T1における認知症患者の脳を写した画像である。また、正解CDR-SOB変化量45CAは、第1時点T1から臨床試験期間PDに相当する期間PDEを経た、第2時点T2における認知症患者の実際のCDR-SOB変化量である。例えば認知症患者の第1時点T1におけるCDR-SOBのスコアが22で、第2時点T2におけるCDR-SOBのスコアが25であった場合、正解CDR-SOB変化量45CAは25-22=3となる。臨床試験期間PDに相当する期間PDEは、臨床試験期間PDを含み、かつ臨床試験期間PDに適当なマージンを加えた期間である。例えば臨床試験期間PDが18カ月間であった場合、臨床試験期間PDに相当する期間PDEは、18カ月間に±6カ月した12カ月間~24カ月間である。
As an example, as shown in FIG. 11, the learning MRI image 16L is an image of the dementia patient's brain at the first time point T1. Also, the correct CDR-SOB change amount 45CA is the actual CDR-SOB change amount of the dementia patient at the second time point T2 after the period PDE corresponding to the clinical trial period PD from the first time point T1. For example, if the dementia patient has a CDR-SOB score of 22 at the first time point T1 and a CDR-SOB score of 25 at the second time point T2, the correct CDR-SOB change amount 45CA is 25-22=3. Become. The period PDE corresponding to the clinical trial period PD is a period including the clinical trial period PD and adding an appropriate margin to the clinical trial period PD. For example, if the clinical trial period PD is 18 months, the period PDE corresponding to the clinical trial period PD is 12 months to 24 months plus or minus 6 months in 18 months.
一例として図12に示すように、グループ分け部38は、予測結果45のCDR-SOB変化量に応じて、対象者Sをグループ1~18のいずれかに分ける。グループ分け部38は、例えばグループ1にはCDR-SOB変化量が-3.0より小さい(Δ<-3.0)対象者Sを配し、例えばグループ4にはCDR-SOB変化量が-2.0以上で-1.5より小さい(-2.0≦Δ<-1.5)対象者Sを配する。また、グループ分け部38は、例えばグループ15にはCDR-SOB変化量が3.5以上で4.0より小さい(3.5≦Δ<4.0)対象者Sを配し、例えばグループ18にはCDR-SOB変化量が5.0より大きい(5.0<Δ)対象者Sを配する。このように、グループ1~18は、主としてCDR-SOB変化量が-3.0から5.0の間において0.5刻みで設定した範囲により規定される。
As an example, as shown in FIG. 12, the grouping unit 38 divides the subject S into one of groups 1 to 18 according to the CDR-SOB change amount of the prediction result 45. FIG. For example, the grouping unit 38 assigns subjects S whose CDR-SOB change amount is less than -3.0 (Δ<-3.0) to group 1, and assigns subjects S whose CDR-SOB change amount is -3.0 to group 4, for example. A subject S with a score of 2.0 or more and less than -1.5 (-2.0≤Δ<-1.5) was placed. Further, the grouping unit 38 assigns subjects S whose CDR-SOB variation is 3.5 or more and less than 4.0 (3.5≦Δ<4.0) to group 15, for example. A subject S whose CDR-SOB variation is greater than 5.0 (5.0<Δ) is assigned to . In this way, groups 1 to 18 are defined mainly by the range of CDR-SOB variation between -3.0 and 5.0 set in 0.5 increments.
グループ分け結果46は、対象者Sの対象者IDがグループ毎に登録されたデータである。例えば対象者IDがS0001の対象者SのCDR-SOB変化量は4.0であるため、グループ分け部38はS0001をグループ16に登録する。また、例えば対象者IDがS0004の対象者SのCDR-SOB変化量は-1.7であるため、グループ分け部38はS0004をグループ4に登録する。
The grouping result 46 is data in which the target person ID of the target person S is registered for each group. For example, the CDR-SOB change amount of the subject S whose subject ID is S0001 is 4.0, so the grouping unit 38 registers S0001 in the group 16 . Further, for example, the CDR-SOB change amount of the subject S whose subject ID is S0004 is −1.7, so the grouping unit 38 registers S0004 in group 4. FIG.
一例として図13に示すように、振り分けテーブル32は、グループ毎の振り分けルールが登録されたテーブルである。振り分けルールは、2人単位のブロックランダマイズ手法に基づく。例えばグループ1の振り分けルールは、第1、第2、および第4の2人の対象者Sのペアについて、1番目の対象者Sを被験薬群TGに振り分け、2番目の対象者Sを偽薬群PGに振り分ける、という内容である。また、第3、第5、および第6の2人の対象者Sのペアについて、1番目の対象者Sを偽薬群PGに振り分け、2番目の対象者Sを被験薬群TGに振り分ける、という内容である。例えばグループ16の振り分けルールは、第1~第4、および第6の2人の対象者Sのペアについて、1番目の対象者Sを被験薬群TGに振り分け、2番目の対象者Sを偽薬群PGに振り分ける、という内容である。また、第5の2人の対象者Sのペアについて、1番目の対象者Sを偽薬群PGに振り分け、2番目の対象者Sを被験薬群TGに振り分ける、という内容である。
As shown in FIG. 13 as an example, the sorting table 32 is a table in which sorting rules for each group are registered. The distribution rule is based on a block randomization technique for each two players. For example, the group 1 sorting rule is that for pairs of two subjects S, 1st, 2nd and 4th, the first subject S is sorted into the test drug group TG, and the second subject S is placed in placebo. The content is to distribute to the group PG. In addition, for the pairs of the 3rd, 5th, and 6th subjects S, the first subject S is assigned to the placebo group PG, and the second subject S is assigned to the test drug group TG. Content. For example, the group 16 sorting rule is that for pairs of two subjects S, 1st to 4th and 6th, the first subject S is sorted into the test drug group TG, and the second subject S is placed in placebo. The content is to distribute to the group PG. In addition, regarding the fifth pair of two subjects S, the first subject S is assigned to the placebo group PG, and the second subject S is assigned to the test drug group TG.
図14は、振り分けテーブル32の振り分けルールにしたがって、グループ1の対象者Sを被験薬群TGと偽薬群PGとに振り分ける様子の一例を示す。図14においては、対象者IDがS0008、S0022、S0034、S0044、S0051、S0068、S0102、およびS0116の8人の対象者Sを振り分ける場合を例示している。この場合、振り分け部39は、1番目の対象者Sを被験薬群TGに振り分け、2番目の対象者Sを偽薬群PGに振り分ける、という振り分けルールにしたがって、第1のペアであるS0008とS0022の2人の対象者SのうちのS0008の対象者Sを被験薬群TGに振り分け、S0022の対象者Sを偽薬群PGに振り分ける。同様に、第2のペアであるS0034とS0044の2人の対象者SのうちのS0034の対象者Sを被験薬群TGに振り分け、S0044の対象者Sを偽薬群PGに振り分ける。さらに、第4のペアであるS0102とS0116の2人の対象者SのうちのS0102の対象者Sを被験薬群TGに振り分け、S0116の対象者Sを偽薬群PGに振り分ける。また、振り分け部39は、1番目の対象者Sを偽薬群PGに振り分け、2番目の対象者Sを被験薬群TGに振り分ける、という振り分けルールにしたがって、第3のペアであるS0051とS0068の2人の対象者SのうちのS0051の対象者Sを偽薬群PGに振り分け、S0068の対象者Sを被験薬群TGに振り分ける。
FIG. 14 shows an example of how the subjects S in Group 1 are sorted into the test drug group TG and the placebo group PG according to the sorting rules of the sorting table 32 . FIG. 14 exemplifies a case where eight subjects S whose subject IDs are S0008, S0022, S0034, S0044, S0051, S0068, S0102, and S0116 are sorted. In this case, the sorting unit 39 sorts the first subject S into the test drug group TG, and sorts the second subject S into the placebo group PG, according to the sorting rule. Of the two subjects S, S0008 is assigned to the test drug group TG, and S0022 is assigned to the placebo group PG. Similarly, of the two subjects S of the second pair S0034 and S0044, the S0034 subject S is assigned to the test drug group TG, and the S0044 subject S is assigned to the placebo group PG. Further, the subject S0102 of the two subjects S of the fourth pair S0102 and S0116 is assigned to the test drug group TG, and the subject S0116 is assigned to the placebo group PG. In addition, the sorting unit 39 sorts the first subject S into the placebo group PG, and sorts the second subject S into the test drug group TG, according to the sorting rule. Of the two subjects S, the subject S of S0051 is assigned to the placebo group PG, and the subject S of S0068 is assigned to the test drug group TG.
図15は、振り分けテーブル32の振り分けルールにしたがって、グループ16の対象者Sを被験薬群TGと偽薬群PGとに振り分ける様子の一例を示す。図15においては、対象者IDがS0001、S0024、S0029、S0056、S0072、S0081、S0105、S0124、S0133、S0148、S0172、およびS0181の12人の対象者Sを振り分ける場合を例示している。この場合、振り分け部39は、1番目の対象者Sを被験薬群TGに振り分け、2番目の対象者Sを偽薬群PGに振り分ける、という振り分けルールにしたがって、第1のペアであるS0001とS0024の2人の対象者SのうちのS0001の対象者Sを被験薬群TGに振り分け、S0024の対象者Sを偽薬群PGに振り分ける。同様に、第2のペアであるS0029とS0056の2人の対象者SのうちのS0029の対象者Sを被験薬群TGに振り分け、S0056の対象者Sを偽薬群PGに振り分ける。第3のペアであるS0072とS0081の2人の対象者SのうちのS0072の対象者Sを被験薬群TGに振り分け、S0081の対象者Sを偽薬群PGに振り分ける。第4のペアであるS0105とS0124の2人の対象者SのうちのS0105の対象者Sを被験薬群TGに振り分け、S0124の対象者Sを偽薬群PGに振り分ける。さらに、第6のペアであるS0172とS0181の2人の対象者SのうちのS0172の対象者Sを被験薬群TGに振り分け、S0181の対象者Sを偽薬群PGに振り分ける。また、振り分け部39は、1番目の対象者Sを偽薬群PGに振り分け、2番目の対象者Sを被験薬群TGに振り分ける、という振り分けルールにしたがって、第5のペアであるS0133とS0148の2人の対象者SのうちのS0133の対象者Sを偽薬群PGに振り分け、S0148の対象者Sを被験薬群TGに振り分ける。このようにして、振り分け部39は、ブロックランダマイズ手法を用いて、各グループ1~18の対象者Sを被験薬群TGと偽薬群PGとに振り分ける。こうした振り分けの手法は、層別ランダマイズ手法と呼ばれている。
FIG. 15 shows an example of how subjects S in group 16 are sorted into test drug group TG and placebo group PG according to the sorting rules of sorting table 32 . FIG. 15 illustrates a case where 12 subjects S whose subject IDs are S0001, S0024, S0029, S0056, S0072, S0081, S0105, S0124, S0133, S0148, S0172, and S0181 are sorted. In this case, the sorting unit 39 sorts the first subject S into the test drug group TG, and sorts the second subject S into the placebo group PG, according to the sorting rule. Of the two subjects S, S0001 is assigned to the test drug group TG, and S0024 is assigned to the placebo group PG. Similarly, of the two subjects S of the second pair S0029 and S0056, the S0029 subject S is assigned to the test drug group TG, and the S0056 subject S is assigned to the placebo group PG. Of the two subjects S of the third pair S0072 and S0081, the subject S of S0072 is assigned to the test drug group TG, and the subject S of S0081 is assigned to the placebo group PG. Of the two subjects S of the fourth pair S0105 and S0124, the subject S of S0105 is assigned to the test drug group TG, and the subject S of S0124 is assigned to the placebo group PG. Furthermore, of the two subjects S of S0172 and S0181 who are the sixth pair, the subject S of S0172 is assigned to the test drug group TG, and the subject S of S0181 is assigned to the placebo group PG. In addition, the sorting unit 39 sorts the first subject S into the placebo group PG, and sorts the second subject S into the test drug group TG, according to the sorting rule. Of the two subjects S, the subject S of S0133 is assigned to the placebo group PG, and the subject S of S0148 is assigned to the test drug group TG. In this manner, the sorting unit 39 sorts the subjects S of each group 1 to 18 into the test drug group TG and the placebo group PG using the block randomization technique. Such a distribution method is called a stratified randomization method.
次に、上記構成による作用について、図16のフローチャートを参照して説明する。まず、臨床試験支援サーバ10において作動プログラム30が起動されると、図5で示したように、臨床試験支援サーバ10のCPU22は、受付部35、RW制御部36、予測部37、グループ分け部38、振り分け部39、および配信制御部40として機能される。
Next, the action of the above configuration will be described with reference to the flowchart of FIG. First, when the operating program 30 is activated in the clinical trial support server 10, as shown in FIG. 38 , a distribution unit 39 , and a distribution control unit 40 .
オペレータは、オペレータ端末11の入力デバイス14を操作して、認知症の被験薬の対象者SのMRI画像16の集合であるMRI画像群16Gを含む振り分け要求15を臨床試験支援サーバ10に送信する。
The operator operates the input device 14 of the operator terminal 11 to transmit a sorting request 15 including an MRI image group 16G, which is a set of MRI images 16 of the test drug subject S with dementia, to the clinical trial support server 10. .
臨床試験支援サーバ10においては、オペレータ端末11からの振り分け要求15が受付部35にて受け付けられる(ステップST100)。振り分け要求15に含まれるMRI画像群16Gは、受付部35からRW制御部36に出力され、RW制御部36の制御の下、ストレージ20に記憶される(ステップST110)。
In the clinical trial support server 10, the allocation request 15 from the operator terminal 11 is received by the receiving unit 35 (step ST100). The MRI image group 16G included in the distribution request 15 is output from the reception unit 35 to the RW control unit 36 and stored in the storage 20 under the control of the RW control unit 36 (step ST110).
RW制御部36により、ストレージ20からMRI画像群16Gが読み出される(ステップST120)。MRI画像群16Gは、RW制御部36から予測部37に出力される。
The MRI image group 16G is read from the storage 20 by the RW control unit 36 (step ST120). The MRI image group 16G is output from the RW control section 36 to the prediction section 37 .
図6で示したように、予測部37において、MRI画像16が進行速さ予測モデル31に入力され、これにより進行速さ予測モデル31から予測結果45が出力される(ステップST130)。ステップST130の処理は、全ての対象者Sについて予測結果45が出力されない(ステップST140でNO)うちは、繰り返し続けられる。
As shown in FIG. 6, in the prediction unit 37, the MRI image 16 is input to the progression speed prediction model 31, and the prediction result 45 is output from the progression speed prediction model 31 (step ST130). The process of step ST130 is repeated until the prediction result 45 is output for all the subjects S (NO in step ST140).
全ての対象者Sについて予測結果45が出力された場合(ステップST140でYES)、複数の予測結果45の集合である予測結果群45Gが予測部37からグループ分け部38に出力される。そして、図12で示したように、グループ分け部38において、予測結果45に応じて対象者Sがグループ1~18のいずれかに分けられる(ステップST150)。グループ分け結果46は、グループ分け部38から振り分け部39に出力される。
When the prediction results 45 are output for all the subjects S (YES in step ST140), a prediction result group 45G, which is a set of multiple prediction results 45, is output from the prediction unit 37 to the grouping unit 38. Then, as shown in FIG. 12, the grouping unit 38 divides the subject S into one of groups 1 to 18 according to the prediction result 45 (step ST150). The grouping result 46 is output from the grouping section 38 to the sorting section 39 .
続いて、図14および図15で示したように、振り分け部39において、ブロックランダマイズ手法を用いて、グループ1~18毎に、被験薬群TGと偽薬群PGとに対象者Sが振り分けられる(ステップST160)。振り分け結果17は、振り分け部39から配信制御部40に出力される。振り分け結果17は、配信制御部40の制御の下、振り分け要求15の送信元のオペレータ端末11に配信される(ステップST170)。
Subsequently, as shown in FIGS. 14 and 15, in the sorting unit 39, the subject S is sorted into the test drug group TG and the placebo group PG for each of the groups 1 to 18 using the block randomization method ( step ST160). The distribution result 17 is output from the distribution unit 39 to the distribution control unit 40 . The distribution result 17 is distributed to the operator terminal 11 that sent the distribution request 15 under the control of the distribution control section 40 (step ST170).
オペレータ端末11のディスプレイ13には、振り分け結果17が表示される。オペレータは、振り分け結果17を閲覧し、その通りに対象者Sを被験薬群TGと偽薬群PGとに振り分け、臨床第2相試験Ph2または臨床第3相試験Ph3を行う。
A sorting result 17 is displayed on the display 13 of the operator terminal 11 . The operator browses the sorting result 17, sorts the subjects S into the test drug group TG and the placebo group PG, and conducts the clinical phase 2 study Ph2 or the clinical phase 3 study Ph3.
以上説明したように、臨床試験支援サーバ10のCPU22は、予測部37、グループ分け部38、および振り分け部39を備える。予測部37は、進行速さ予測モデル31を用いて、認知症の被験薬の対象者SについてCDR-SOB変化量を予測する。グループ分け部38は、CDR-SOB変化量の予測結果45に応じて対象者Sをグループ1~18のいずれかに分ける。振り分け部39は、グループ1~18毎に、被験薬群TGと偽薬群PGとに対象者Sを振り分ける。
As described above, the CPU 22 of the clinical trial support server 10 includes the prediction section 37, the grouping section 38, and the sorting section 39. The prediction unit 37 predicts the CDR-SOB change amount for the test drug subject S for dementia using the progression speed prediction model 31 . The grouping unit 38 divides the subject S into any one of groups 1 to 18 according to the prediction result 45 of the CDR-SOB change amount. The sorting unit 39 sorts the subjects S into the test drug group TG and the placebo group PG for each of the groups 1-18.
このため、被験薬群TGと偽薬群PGとの間に認知症の進行が比較的速い対象者Sと遅い対象者Sの偏りが生じるおそれが少なくなる。これにより、被験薬群TGに認知症の進行が比較的遅い対象者Sが多く振り分けられ、偽薬群PGに認知症の進行が比較的速い対象者Sが多く振り分けられて、被験薬の効能が過大に評価されるおそれが少なくなる。また、被験薬群TGに認知症の進行が比較的速い対象者Sが多く振り分けられ、偽薬群PGに認知症の進行が比較的遅い対象者Sが多く振り分けられて、被験薬の効能が過小に評価されるおそれも少なくなる。したがって、認知症の被験薬の効能の正当な評価に寄与することが可能となる。
Therefore, there is less risk of bias between the test drug group TG and the placebo group PG between subjects S whose dementia progresses relatively quickly and subjects S whose dementia progresses slowly. As a result, many subjects S with relatively slow progression of dementia were sorted into the test drug group TG, and many subjects S with relatively fast progression of dementia were sorted into the placebo group PG, and the efficacy of the test drug was increased. less likely to be overestimated. In addition, many subjects S with relatively fast progression of dementia were assigned to the test drug group TG, and many subjects S with relatively slow progression of dementia were assigned to the placebo group PG, and the efficacy of the test drug was too small. less likely to be evaluated. Therefore, it becomes possible to contribute to the proper evaluation of the efficacy of the test drug for dementia.
被験薬群TGと偽薬群PGとの間に認知症の進行が比較的速い対象者Sと遅い対象者Sの偏りが生じるおそれは、対象者Sが比較的少ない臨床第2相試験Ph2のほうが高い。このため、臨床第2相試験Ph2に本開示の技術を適用すれば、より顕著な効果を得ることができる。
There is a possibility that there may be a bias between the test drug group TG and the placebo group PG between the subject S whose dementia progresses relatively quickly and the subject S whose dementia progresses slowly. expensive. Therefore, if the technology of the present disclosure is applied to the Phase 2 clinical trial Ph2, a more remarkable effect can be obtained.
振り分け部39は、ブロックランダマイズ手法を用いて被験薬群TGと偽薬群PGとに対象者Sを振り分ける。このため、被験薬群TGと偽薬群PGとの間に認知症の進行が比較的速い対象者と遅い対象者の偏りが生じるおそれがさらに少なくなり、結果として認知症の被験薬の効能の正当な評価にさらに寄与することが可能となる。
The sorting unit 39 sorts the subjects S into the test drug group TG and the placebo group PG using a block randomization technique. For this reason, the risk of bias between the test drug group TG and the placebo group PG between subjects with relatively fast progression of dementia and subjects with slow progression is further reduced, and as a result, the efficacy of the test drug for dementia is justified. It will be possible to further contribute to a more accurate evaluation.
図9~図11で示したように、進行速さ予測モデル31は、第1時点T1における認知症患者の学習用MRI画像16Lを学習用入力データとし、第1時点T1から臨床試験期間PDに相当する期間PDEを経た第2時点T2における認知症患者のCDR-SOB変化量である正解CDR-SOB変化量45CAを正解データとして学習されたモデルである。図6で示したように、予測部37は、臨床試験の開始時点TSにおける対象者SのMRI画像16を進行速さ予測モデル31に入力し、臨床試験の終了時点TEにおける対象者SのCDR-SOB変化量を、予測結果45として進行速さ予測モデル31から出力させる。
As shown in FIGS. 9 to 11, the progression speed prediction model 31 uses the learning MRI image 16L of the dementia patient at the first time point T1 as learning input data, and from the first time point T1 to the clinical trial period PD This model is trained using the correct CDR-SOB change amount 45CA, which is the CDR-SOB change amount of the dementia patient at the second time point T2 after the corresponding period of PDE, as the correct data. As shown in FIG. 6, the prediction unit 37 inputs the MRI image 16 of the subject S at the start time TS of the clinical trial to the progression speed prediction model 31, and the CDR of the subject S at the end time TE of the clinical trial. - Output the SOB change amount from the advancing speed prediction model 31 as the prediction result 45 .
脳を写した医用画像であるMRI画像16は、認知症患者であればほぼ全員が撮影している。また、CDR-SOBも、認知症患者であればほぼ全員が受験している。このため、認知症患者の学習用MRI画像16Lを学習用入力データとし、正解CDR-SOB変化量45CAを正解データとすれば、進行速さ予測モデル31の学習データ70に事欠かず、進行速さ予測モデル31の学習が捗る。さらに、MRI画像16は、装置さえ空いていれば数分で撮影することができる。このため、比較的簡単に進行速さ予測モデル31から予測結果45を出力させることができる。
Almost all dementia patients take MRI images 16, which are medical images of the brain. Almost all dementia patients also take the CDR-SOB. For this reason, if the learning MRI image 16L of the dementia patient is used as learning input data and the correct CDR-SOB variation 45CA is used as correct data, the learning data 70 of the progress speed prediction model 31 will not be lacking, and the progress speed will be improved. Learning of the prediction model 31 progresses. Furthermore, the MRI image 16 can be taken in minutes if the equipment is idle. Therefore, the prediction result 45 can be output from the progress speed prediction model 31 relatively easily.
認知機能検査のスコアの変化量、特にCDR-SOB変化量は、臨床試験の成否を判定するために従前からよく用いられている。このため、臨床試験の終了時点TEにおける対象者Sの認知症の進行度合いを示す数値として、本例のようにCDR-SOB変化量を用いれば、従来と変わらぬ基準に基づいて臨床試験の成否を判定することができる。
Changes in cognitive function test scores, especially CDR-SOB changes, have long been used to determine the success or failure of clinical trials. Therefore, if the amount of CDR-SOB change is used as in this example as a numerical value indicating the degree of progression of dementia in the subject S at the end point of the clinical trial TE, the success or failure of the clinical trial can be based on the same standard as before. can be determined.
進行速さ予測モデル31は、セグメンテーションモデル50によって、臨床試験の開始時点TSにおけるMRI画像16から脳の複数の解剖区域の画像である複数の解剖区域画像53を抽出する。そして、解剖区域毎に用意された特徴量導出モデル51に解剖区域画像53を入力し、特徴量導出モデル51から解剖区域の特徴量54を出力させる。このため、脳の複数の解剖区域から得られた特徴量を元に、認知症の進行の速さを予測することができ、予測結果45の予測精度を高めることができる。
The progression speed prediction model 31 uses the segmentation model 50 to extract a plurality of anatomical region images 53, which are images of a plurality of brain anatomical regions, from the MRI image 16 at the start time TS of the clinical trial. Then, the anatomical region image 53 is input to the feature quantity derivation model 51 prepared for each anatomical region, and the feature quantity 54 of the anatomical region is output from the feature quantity derivation model 51 . Therefore, the speed of progression of dementia can be predicted based on the feature values obtained from a plurality of anatomical regions of the brain, and the prediction accuracy of the prediction result 45 can be improved.
本開示の技術の効果を確かめるため、ADNIに登録された認知症患者のうち、一般的な臨床試験の参加条件を満たす約500名の認知症患者を対象者Sとして選出した。そして、選出した対象者Sについて、臨床第2相試験Ph2および臨床第3相試験Ph3を10000回シミュレーションした。
In order to confirm the effect of the technology disclosed in this disclosure, about 500 dementia patients who met the general clinical trial participation conditions were selected as subjects S from among the dementia patients registered with ADNI. Then, for the selected subject S, the clinical phase 2 test Ph2 and the clinical phase 3 test Ph3 were simulated 10000 times.
一例として図17に示すように、まず、被験薬群TGに振り分けた対象者Sのうち、ADNIに登録された実際のCDR-SOB変化量(真値)Δcが0以下、つまり認知症が進行しなかった対象者Sについては、補正せずにCDR-SOB変化量(真値)Δcのままとする。同様に、偽薬群PGに振り分けた対象者Sについても、補正せずにCDR-SOB変化量(真値)Δcのままとする。一方、被験薬群TGに振り分けた対象者Sのうち、実際のCDR-SOB変化量(真値)Δcが0より大きい、つまり認知症が進行した対象者Sについては、CDR-SOB変化量(真値)Δcを被験薬の効能Effで補正したCDR-SOB変化量(補正値)ΔcXとする。具体的には、CDR-SOB変化量(真値)Δcに(1-Eff)を乗算することで、CDR-SOB変化量(補正値)ΔcXとする。
As an example, as shown in FIG. 17, among the subjects S assigned to the test drug group TG, the actual CDR-SOB change amount (true value) Δc registered in ADNI is 0 or less, that is, dementia progresses. For the subjects S who did not, the CDR-SOB change amount (true value) Δc remains unchanged without correction. Similarly, the CDR-SOB variation (true value) Δc of the subjects S assigned to the placebo group PG remains unchanged without correction. On the other hand, among the subjects S assigned to the test drug group TG, the actual CDR-SOB change amount (true value) Δc was greater than 0, that is, the subject S with advanced dementia had the CDR-SOB change amount ( The CDR-SOB variation (corrected value) ΔcX corrected by the efficacy Eff of the test drug is defined as the true value) Δc. Specifically, the CDR-SOB variation (correction value) ΔcX is obtained by multiplying the CDR-SOB variation (true value) Δc by (1−Eff).
被験薬群TGに振り分けた対象者Sの実際のCDR-SOB変化量(真値)ΔcまたはCDR-SOB変化量(補正値)ΔcXと、偽薬群PGに振り分けた対象者Sの実際のCDR-SOB変化量(真値)Δcとを用いてt検定を行った。そして、臨床第2相試験Ph2のP値であるP1、および臨床第3相試験Ph3のP値であるP2をそれぞれ算出した。P1が0.05よりも小さい場合(P1<0.05)、被験薬の効能あり(臨床第2相試験Ph2をクリア、図17では「OK」と表記、図18~図20も同様)と判定し、P1が0.05以上の場合(P1≧0.05)、被験薬の効能なし(臨床第2相試験Ph2をクリアせず、図17では「NG」と表記、図18~図20も同様)と判定した。また、P2が0.01よりも小さい場合(P2<0.01)、被験薬の効能あり(臨床第3相試験Ph3をクリア、図17では「OK」と表記、図18~図20も同様)と判定し、P2が0.01以上の場合(P2≧0.01)、被験薬の効能なし(臨床第3相試験Ph3をクリアせず、図17では「NG」と表記、図18~図20も同様)と判定した。
Actual CDR-SOB change (true value) Δc or CDR-SOB change (corrected value) ΔcX of subject S assigned to test drug group TG, and actual CDR- of subject S assigned to placebo group PG A t-test was performed using the amount of SOB change (true value) Δc. Then, P1, which is the P value of the clinical phase 2 study Ph2, and P2, which is the P value of the clinical phase 3 study Ph3, were calculated. If P1 is less than 0.05 (P1 < 0.05), the test drug is considered to be efficacious (Ph2 clinical trial cleared, indicated as "OK" in Figure 17, and Figures 18 to 20 are the same). If P1 is 0.05 or more (P1 ≧ 0.05), there is no efficacy of the test drug (Ph2 clinical trial was not cleared, indicated as "NG" in FIG. 17, FIGS. 18 to 20 the same) was determined. In addition, if P2 is less than 0.01 (P2<0.01), the test drug is effective (cleared Phase 3 clinical trial Ph3, indicated as "OK" in Figure 17, and the same applies to Figures 18 to 20 ), and if P2 is 0.01 or more (P2 ≥ 0.01), there is no efficacy of the test drug (Ph3 clinical trial was not cleared, indicated as "NG" in Figure 17, Figure 18- The same applies to FIG. 20).
図18は、比較例の手法、予測結果45に基づいて対象者Sを層別ランダマイズした本開示の技術に係る手法、および実際のCDR-SOB変化量(真値)Δcに基づいて層別ランダマイズした手法のそれぞれについて、被験薬の効能Effを0から0.4の間において0.05刻みで変化させた場合の、P1<0.05(臨床第2相試験Ph2をクリア)でP2≧0.01(臨床第3相試験Ph3をクリアせず)となる確率を示す。比較例の手法は、本開示の技術に係る手法のように、予測結果45に応じて対象者Sをグループ分けし、グループ毎に被験薬群TGと偽薬群PGとに対象者Sを振り分けることをせず、グループ分けしていない全ての対象者Sをランダムに被験薬群TGと偽薬群PGとに振り分ける手法である。P1<0.05でP2≧0.01となる確率は、言い換えれば、臨床第2相試験Ph2において被験薬の効能が過大に評価される確率である。
FIG. 18 shows a method of a comparative example, a method according to the technique of the present disclosure in which the subject S is stratified and randomized based on the prediction result 45, and stratified randomization based on the actual CDR-SOB variation (true value) Δc. For each method, when the efficacy Eff of the test drug was changed in increments of 0.05 between 0 and 0.4, P1 < 0.05 (cleared Phase 2 clinical trial Ph2) and P2 ≥ 0 Indicates the probability of .01 (not clearing Phase 3 clinical trial Ph3). The method of the comparative example divides the subjects S into groups according to the prediction result 45, and sorts the subjects S into the test drug group TG and the placebo group PG for each group, like the method according to the technology of the present disclosure. In this method, all ungrouped subjects S are randomly assigned to the test drug group TG and the placebo group PG. The probability that P1<0.05 and P2≧0.01 is, in other words, the probability that the efficacy of the test drug is overestimated in Phase 2 clinical trials Ph2.
図18によれば、本開示の技術に係る手法においてP1<0.05でP2≧0.01となる確率は、比較例の手法においてP1<0.05でP2≧0.01となる確率よりも全体的に低いことが分かる。したがって、本開示の技術によれば、被験薬の効能が過大に評価されるおそれが少なくなることが確かめられた。
According to FIG. 18, the probability of P1<0.05 and P2≧0.01 in the method according to the technique of the present disclosure is higher than the probability of P1<0.05 and P2≧0.01 in the method of the comparative example. is also found to be generally low. Therefore, it was confirmed that the technique of the present disclosure reduces the risk of the efficacy of the test drug being overestimated.
図19は、比較例の手法、予測結果45に基づいて対象者Sを層別ランダマイズした本開示の技術に係る手法、および実際のCDR-SOB変化量(真値)Δcに基づいて層別ランダマイズした手法のそれぞれについて、被験薬の効能Effを0から0.4の間において0.05刻みで変化させた場合の、P1≧0.05(臨床第2相試験Ph2をクリアせず)でP2<0.01(臨床第3相試験Ph3をクリア)となる確率を示す。P1≧0.05でP2<0.01となる確率は、言い換えれば、臨床第2相試験Ph2において被験薬の効能が過小に評価される確率である。
FIG. 19 shows a method of a comparative example, a method according to the technology of the present disclosure in which the subject S is stratified and randomized based on the prediction result 45, and stratified randomization based on the actual CDR-SOB change amount (true value) Δc. For each method, when the efficacy Eff of the test drug was changed in increments of 0.05 between 0 and 0.4, P1 ≥ 0.05 (without clearing the clinical phase 2 trial Ph2) and P2 The probability of <0.01 (clearing Phase 3 clinical trial Ph3) is shown. The probability that P1≧0.05 and P2<0.01 is, in other words, the probability that the efficacy of the test drug is underestimated in the Phase 2 clinical trial Ph2.
図19によれば、本開示の技術に係る手法においてP1≧0.05でP2<0.01となる確率は、比較例の手法においてP1≧0.05でP2<0.01となる確率よりも大体において低いことが分かる。したがって、本開示の技術によれば、被験薬の効能が過小に評価されるおそれが少なくなることが確かめられた。
According to FIG. 19, the probability of P1≧0.05 and P2<0.01 in the method according to the technique of the present disclosure is higher than the probability of P1≧0.05 and P2<0.01 in the method of the comparative example. is also found to be generally low. Therefore, it was confirmed that the technique of the present disclosure reduces the possibility that the efficacy of the test drug will be underestimated.
図20は、比較例の手法、予測結果45に基づいて対象者Sを層別ランダマイズした本開示の技術に係る手法、および実際のCDR-SOB変化量(真値)Δcに基づいて層別ランダマイズした手法のそれぞれについて、被験薬の効能Effを0から0.4の間において0.05刻みで変化させた場合の、P1<0.05(臨床第2相試験Ph2をクリア)でP2<0.01(臨床第3相試験Ph3をクリア)となる確率を示す。P1<0.05でP2<0.01となる確率は、言い換えれば、臨床試験成功確率である。
FIG. 20 shows a method of a comparative example, a method according to the technique of the present disclosure in which the subject S is stratified and randomized based on the prediction result 45, and stratified randomization based on the actual CDR-SOB change amount (true value) Δc. For each method, when the efficacy Eff of the test drug was changed in increments of 0.05 between 0 and 0.4, P1 < 0.05 (cleared Phase 2 clinical trial Ph2) and P2 < 0 0.01 (clears Phase 3 clinical trial Ph3). The probability that P1<0.05 and P2<0.01 is, in other words, the clinical trial success probability.
図20によれば、本開示の技術に係る手法においてP1<0.05でP2<0.01となる確率は、比較例の手法においてP1<0.05でP2<0.01となる確率よりも大体において高いことが分かる。したがって、本開示の技術によれば、被験薬の効能が正当に評価され、その分臨床試験成功確率が高まることが確かめられた。
According to FIG. 20, the probability of P1<0.05 and P2<0.01 in the method according to the technique of the present disclosure is higher than the probability of P1<0.05 and P2<0.01 in the method of the comparative example. is also found to be generally high. Therefore, according to the technique of the present disclosure, it was confirmed that the efficacy of the test drug was properly evaluated, and the probability of success in clinical trials increased accordingly.
なお、図19および図20の局所において、本開示の技術に係る手法よりも従来の手法のほうが効果ありとの結果が出た原因としては、予測結果45に少々の間違いがあったことが考えられる。このため、進行速さ予測モデル31の予測精度を高めていけば、本開示の技術に係る手法よりも従来の手法のほうが効果ありとの結果が出ると考えられる。
19 and 20, the conventional method is more effective than the method according to the technology of the present disclosure. be done. Therefore, if the prediction accuracy of the progress speed prediction model 31 is improved, it is considered that the conventional method will be more effective than the method according to the technology of the present disclosure.
なお、本例においては、臨床第1相試験Ph1をクリアした場合に臨床第2相試験Ph2を行い、臨床第2相試験Ph2をクリアした場合に臨床第3相試験Ph3を行う例を説明したが、これに限らない。臨床第1相試験Ph1と臨床第2相試験Ph2、あるいは臨床第1相試験Ph2と臨床第3相試験Ph3を並行して行ってもよい。
In this example, when the clinical phase 1 trial Ph1 is cleared, the clinical phase 2 trial Ph2 is performed, and when the clinical phase 2 trial Ph2 is cleared, the clinical phase 3 trial Ph3 is performed. However, it is not limited to this. A clinical phase 1 trial Ph1 and a clinical phase 2 trial Ph2, or a clinical phase 1 trial Ph2 and a clinical phase 3 trial Ph3 may be conducted in parallel.
AE60のエンコーダ部61を特徴量導出モデル51に転用する例を説明したが、これに限らない。シングルタスクの畳み込みニューラルネットワークの一部、あるいはマルチタスクの畳み込みニューラルネットワークの一部を、特徴量導出モデル51として用いてもよい(図31参照)。
Although an example in which the encoder unit 61 of the AE 60 is diverted to the feature value derivation model 51 has been described, the present invention is not limited to this. A part of the single-task convolutional neural network or a part of the multi-task convolutional neural network may be used as the feature value derivation model 51 (see FIG. 31).
ブロックランダマイズ手法の単位は例示の2人に限らない。例えば4人でもよい。また、ブロックランダマイズ手法を用いずに、単純にグループを構成する治験対象者Sの半分を被験薬群TGに振り分け、残り半分を偽薬群PGに振り分けてもよい。
The unit of the block randomization method is not limited to the two people shown in the example. For example, it may be four people. Alternatively, without using the block randomization method, half of the clinical trial subjects S constituting the group may be simply assigned to the test drug group TG, and the other half may be assigned to the placebo group PG.
[第2実施形態]
一例として図21に示すように、第2実施形態の臨床試験支援サーバのCPUは、上記第1実施形態の各処理部35~40(図21においては予測部37、グループ分け部38、および振り分け部39を図示、他は図示省略)に加えて、選定部75として機能する。選定部75は、予測部37とグループ分け部38との間に設けられている。選定部75には、予測部37からの予測結果群45Gが入力される。 [Second embodiment]
As an example, as shown in FIG. 21, the CPU of the clinical trial support server of the second embodiment includes theprocessing units 35 to 40 of the first embodiment (in FIG. 21, the prediction unit 37, grouping unit 38, and 39 is shown, others are not shown), and functions as a selection unit 75 . The selection unit 75 is provided between the prediction unit 37 and the grouping unit 38 . The prediction result group 45</b>G from the prediction section 37 is input to the selection section 75 .
一例として図21に示すように、第2実施形態の臨床試験支援サーバのCPUは、上記第1実施形態の各処理部35~40(図21においては予測部37、グループ分け部38、および振り分け部39を図示、他は図示省略)に加えて、選定部75として機能する。選定部75は、予測部37とグループ分け部38との間に設けられている。選定部75には、予測部37からの予測結果群45Gが入力される。 [Second embodiment]
As an example, as shown in FIG. 21, the CPU of the clinical trial support server of the second embodiment includes the
選定部75は、選定条件76にしたがって、認知症の進行が比較的速い対象者Sを選定する。選定条件76は、本例においては、CDR-SOB変化量が0より大きい(Δ>0)、という内容である。選定部75は、予測結果群45Gを構成する複数の予測結果45のうち、選定条件76を満たす予測結果45だけを選定することで、選定予測結果群45GSを生成する。選定部75は、選定予測結果群45GSをグループ分け部38に出力する。
The selection unit 75 selects the subject S whose dementia progresses relatively quickly according to the selection condition 76 . The selection condition 76 is that the CDR-SOB variation is greater than 0 (Δ>0) in this example. The selection unit 75 selects only the prediction results 45 that satisfy the selection condition 76 from among the plurality of prediction results 45 forming the prediction result group 45G, thereby generating the selected prediction result group 45GS. The selection unit 75 outputs the selection prediction result group 45GS to the grouping unit 38 .
図22は、選定部75の処理の一例を示す。図22においては、対象者IDがS0001およびS0003の対象者SのCDR-SOB変化量が0より大きく、対象者IDがS0002およびS0004の対象者SのCDR-SOB変化量が0以下である。このため、選定部75は、対象者IDがS0001およびS0003の予測結果45を選定し、対象者IDがS0002およびS0004の予測結果45を除外する等して、選定予測結果群45GSを生成する。
FIG. 22 shows an example of the processing of the selection unit 75. FIG. In FIG. 22, the CDR-SOB variation amounts of the subjects S with subject IDs S0001 and S0003 are greater than 0, and the CDR-SOB variation amounts of the subjects S with subject IDs S0002 and S0004 are 0 or less. Therefore, the selection unit 75 selects the prediction results 45 with the subject IDs S0001 and S0003, excludes the prediction results 45 with the subject IDs S0002 and S0004, and generates a selection prediction result group 45GS.
グループ分け部38は、選定予測結果群45GSに予測結果45が選定された対象者Sに対してグループ分けを行う。振り分け部39は、グループ分け結果46に基づいて、選定予測結果群45GSに予測結果45が選定された対象者Sを被験薬群TGと偽薬群PGとに振り分ける。
The grouping unit 38 groups the subjects S for whom the prediction result 45 is selected in the selection prediction result group 45GS. Based on the grouping result 46, the sorting unit 39 sorts the subjects S for whom the prediction result 45 was selected in the selection prediction result group 45GS into the test drug group TG and the placebo group PG.
このように、第2実施形態では、選定部75は、予測結果45に基づいて、CDR-SOB変化量が0より大きい対象者Sといった、認知症の進行が比較的速い対象者Sを選定する。グループ分け部38は、選定した対象者Sに対してのみ、予測結果45に応じたグループ分けを行う。また、振り分け部39は、選定した対象者Sに対してのみ、被験薬群TGと偽薬群PGへの振り分けを行う。このため、認知症の被験薬の臨床試験により相応しい者を対象者Sとすることができ、認知症の被験薬の効能の正当な評価にさらに寄与することができる。
Thus, in the second embodiment, the selection unit 75 selects the subject S whose dementia progresses relatively quickly, such as the subject S whose CDR-SOB change amount is greater than 0, based on the prediction result 45. . The grouping unit 38 groups only the selected target person S according to the prediction result 45 . Further, the sorting unit 39 sorts only the selected subjects S into the test drug group TG and the placebo group PG. Therefore, a person more suitable for clinical trials of a test drug for dementia can be selected as the subject S, which can further contribute to the proper evaluation of the efficacy of the test drug for dementia.
選定条件76は、例示の内容に限らない。例えば、CDR-SOB変化量が2より大きい(Δ>2)、といった内容でもよい。あるいは、CDR-SOB変化量が0より大きく、かつ3以下(0<Δ≦3)、といった内容でもよい。
The selection condition 76 is not limited to the content of the example. For example, the content may be that the CDR-SOB variation is greater than 2 (Δ>2). Alternatively, the content may be such that the CDR-SOB variation is greater than 0 and less than or equal to 3 (0<Δ≦3).
[第3実施形態]
一例として図23に示すように、第3実施形態においては、予測部37は、MRI画像16に加えて認知症関連データ80を進行速さ予測モデル81に入力する。認知症関連データ80は、臨床試験の開始時点TSにおける対象者Sの認知症に関するデータであり、先に説明した認知症の診断基準に係るデータの一部を含む。より詳しくは、一例として図24に示すように、認知症関連データ80は、対象者Sの年齢、性別、遺伝子検査データ、および血液・脳髄液検査データであるCSF検査データを含む。遺伝子検査データは、例えば、ApoE遺伝子の遺伝子型の検査結果である。ApoE遺伝子の遺伝子型は、ε2、ε3、ε4の3種のApoE遺伝子のうちの2種の組み合わせ(ε2とε3、ε3とε4等)である。ε4を全くもたない遺伝子型(ε2とε3、ε3とε3等)の者に対して、ε4を1つないし2つもつ遺伝子型(ε2とε4、ε4とε4等)の者のアルツハイマー型認知症の発症リスクは、およそ3倍~12倍とされている。CSF検査データは、例えば、CSF中のp-tau(リン酸化タウ蛋白)181の量である。性別は、男性を00、女性を01等と数値化して表す。遺伝子検査データも同様に、ApoE遺伝子の組み合わせを数値化して表す。認知症関連データ80は、本開示の技術に係る「対象疾患関連データ」の一例である。 [Third embodiment]
As an example, as shown in FIG. 23 , in the third embodiment, theprediction unit 37 inputs the dementia-related data 80 to the progression speed prediction model 81 in addition to the MRI images 16 . The dementia-related data 80 is data relating to dementia of the subject S at the start time TS of the clinical trial, and includes part of the data relating to the dementia diagnostic criteria described above. More specifically, as shown in FIG. 24 as an example, the dementia-related data 80 includes the subject S's age, sex, genetic test data, and CSF test data, which is blood/cerebrospinal fluid test data. Genetic test data is, for example, genotype test results of the ApoE gene. The genotype of the ApoE gene is a combination of two of the three ApoE genes ε2, ε3, and ε4 (ε2 and ε3, ε3 and ε4, etc.). Cognition of Alzheimer's disease in persons with genotypes with one or two ε4 (ε2 and ε4, ε4 and ε4, etc.) versus those with genotypes without ε4 (ε2 and ε3, ε3 and ε3, etc.) The risk of developing the disease is estimated to be approximately 3 to 12 times higher. CSF test data is, for example, the amount of p-tau (phosphorylated tau protein) 181 in CSF. Gender is expressed numerically as 00 for male and 01 for female. Similarly, the genetic test data are expressed numerically for combinations of ApoE genes. The dementia-related data 80 is an example of "target disease-related data" according to the technology of the present disclosure.
一例として図23に示すように、第3実施形態においては、予測部37は、MRI画像16に加えて認知症関連データ80を進行速さ予測モデル81に入力する。認知症関連データ80は、臨床試験の開始時点TSにおける対象者Sの認知症に関するデータであり、先に説明した認知症の診断基準に係るデータの一部を含む。より詳しくは、一例として図24に示すように、認知症関連データ80は、対象者Sの年齢、性別、遺伝子検査データ、および血液・脳髄液検査データであるCSF検査データを含む。遺伝子検査データは、例えば、ApoE遺伝子の遺伝子型の検査結果である。ApoE遺伝子の遺伝子型は、ε2、ε3、ε4の3種のApoE遺伝子のうちの2種の組み合わせ(ε2とε3、ε3とε4等)である。ε4を全くもたない遺伝子型(ε2とε3、ε3とε3等)の者に対して、ε4を1つないし2つもつ遺伝子型(ε2とε4、ε4とε4等)の者のアルツハイマー型認知症の発症リスクは、およそ3倍~12倍とされている。CSF検査データは、例えば、CSF中のp-tau(リン酸化タウ蛋白)181の量である。性別は、男性を00、女性を01等と数値化して表す。遺伝子検査データも同様に、ApoE遺伝子の組み合わせを数値化して表す。認知症関連データ80は、本開示の技術に係る「対象疾患関連データ」の一例である。 [Third embodiment]
As an example, as shown in FIG. 23 , in the third embodiment, the
一例として図25に示すように、認知症関連データ80は、特徴量群54Gとともに進行速さ予測モデル81の変化量導出モデル85に入力される。変化量導出モデル85は、特徴量群54Gだけでなく認知症関連データ80も参照して予測結果45を出力する。
As an example, as shown in FIG. 25, the dementia-related data 80 is input to the change amount derivation model 85 of the progression speed prediction model 81 together with the feature amount group 54G. The variation derivation model 85 outputs the prediction result 45 by referring to the dementia-related data 80 as well as the feature quantity group 54G.
一例として図26に示すように、本実施形態の変化量導出モデル85は、主成分分析(以下、PCA(Principal Component Analysis)と略す)層150、分位正規化部151、および線形判別分析部152を有する。PCA層150には特徴量群54Gが入力される。PCA層150は、特徴量群54Gを構成する複数の特徴量54の各々に対してPCAを行い、特徴量54を集約特徴量54Aとする。例えばPCA層150は、数百~数千の特徴量54を1つの集約特徴量54Aに集約する。PCA層150は、各特徴量54の集約特徴量54Aの集合である集約特徴量群54AGを分位正規化部151に出力する。
As an example shown in FIG. 26, the variation derivation model 85 of the present embodiment includes a principal component analysis (hereinafter abbreviated as PCA (Principal Component Analysis)) layer 150, a quantile normalization unit 151, and a linear discriminant analysis unit. 152. A feature quantity group 54G is input to the PCA layer 150 . The PCA layer 150 performs PCA on each of the plurality of feature amounts 54 forming the feature amount group 54G, and sets the feature amount 54 as an aggregate feature amount 54A. For example, the PCA layer 150 aggregates hundreds to thousands of feature quantities 54 into one aggregated feature quantity 54A. The PCA layer 150 outputs an aggregated feature quantity group 54AG, which is a set of aggregated feature quantities 54A of each feature quantity 54, to the quantile normalization unit 151. FIG.
分位正規化部151には、集約特徴量群54AGと認知症関連データ80が入力される。分位正規化部151は、集約特徴量群54AGを構成する複数の集約特徴量54Aと、認知症関連データ80の対象者Sの年齢、性別、遺伝子検査データ、およびCSF検査データとを同列に扱うために、これらを正規分布にしたがうデータに変換する分位正規化(Quantile Normalization)を行う。線形判別分析部152は、分位正規化処理後の集約特徴量54Aと認知症関連データ80の対象者Sの年齢、性別、遺伝子検査データ、およびCSF検査データに対して、例えばサポートベクター回帰(SVR:Support Vector Regression)等を用いた線形判別分析(Linear Discriminant Analysis)を行い、その結果として予測結果45を出力する。
The aggregated feature quantity group 54AG and the dementia-related data 80 are input to the quantile normalization unit 151 . The quantile normalization unit 151 aligns the plurality of aggregated feature quantities 54A that make up the aggregated feature quantity group 54AG and the age, sex, genetic test data, and CSF test data of the subject S of the dementia-related data 80. To handle them, Quantile Normalization is performed to transform them into data following a normal distribution. The linear discriminant analysis unit 152 performs, for example, support vector regression ( Linear discriminant analysis using SVR (Support Vector Regression) or the like is performed, and a prediction result 45 is output as the result.
一例として図27に示すように、変化量導出モデル85は、学習データ90によって学習される。学習データ90は、学習用特徴量群54GL、学習用認知症関連データ80L、および正解CDR-SOB変化量45CAの組である。学習用特徴量群54GLおよび正解CDR-SOB変化量45CAの出自は、上記第1実施形態の学習データ70の場合と同じである。学習用認知症関連データ80Lは、学習用特徴量群54GLを得た学習用MRI画像16Lの認知症患者の年齢、性別、遺伝子検査データ、およびCSF検査データである。学習用認知症関連データ80Lは、本開示の技術に係る「学習用入力データ」の一例である。
As shown in FIG. 27 as an example, the variation derivation model 85 is learned by learning data 90 . The learning data 90 is a set of a learning feature quantity group 54GL, a learning dementia-related data 80L, and a correct CDR-SOB variation 45CA. The origin of the learning feature quantity group 54GL and the correct CDR-SOB variation 45CA is the same as in the case of the learning data 70 of the first embodiment. The learning dementia-related data 80L is the age, sex, genetic test data, and CSF test data of the dementia patient of the learning MRI image 16L from which the learning feature quantity group 54GL was obtained. The learning dementia-related data 80L is an example of "learning input data" according to the technology of the present disclosure.
学習フェーズにおいて、変化量導出モデル85には、学習用特徴量群54GLおよび学習用認知症関連データ80Lが入力される。変化量導出モデル85は、学習用特徴量群54GLおよび学習用認知症関連データ80Lに対して学習用予測結果45Lを出力する。この学習用予測結果45Lおよび正解CDR-SOB変化量45CAに基づいて、損失関数を用いた変化量導出モデル85の損失演算がなされる。そして、損失演算の結果に応じて変化量導出モデル85の各種係数の更新設定がなされ、更新設定にしたがって変化量導出モデル85が更新される。
In the learning phase, the learning feature quantity group 54GL and the learning dementia-related data 80L are input to the variation derivation model 85. The variation derivation model 85 outputs learning prediction results 45L for the learning feature quantity group 54GL and the learning dementia-related data 80L. Based on the learning prediction result 45L and the correct CDR-SOB variation 45CA, the loss calculation of the variation derivation model 85 using a loss function is performed. Various coefficients of the variation derivation model 85 are updated according to the result of the loss calculation, and the variation derivation model 85 is updated according to the update settings.
変化量導出モデル85の学習フェーズにおいては、学習用特徴量群54GLおよび学習用認知症関連データ80Lの変化量導出モデル85への入力、変化量導出モデル85からの学習用予測結果45Lの出力、損失演算、更新設定、および変化量導出モデル85の更新の上記一連の処理が、学習データ90が交換されつつ繰り返し行われる。上記一連の処理の繰り返しは、正解CDR-SOB変化量45CAに対する学習用予測結果45Lの予測精度が、予め定められた設定レベルまで達した場合に終了される。こうして予測精度が設定レベルまで達した変化量導出モデル85が、進行速さ予測モデル81の一部として予測部37において用いられる。なお、正解CDR-SOB変化量45CAに対する学習用予測結果45Lの予測精度に関係なく、上記一連の処理を設定回数繰り返した場合に学習を終了してもよい。
In the learning phase of the variation derivation model 85, the input of the learning feature group 54GL and the learning dementia-related data 80L to the variation derivation model 85, the output of the learning prediction result 45L from the variation derivation model 85, The series of processes of loss calculation, update setting, and update of the variation derivation model 85 are repeated while the learning data 90 are exchanged. The repetition of the above series of processes ends when the prediction accuracy of the learning prediction result 45L with respect to the correct CDR-SOB change amount 45CA reaches a predetermined set level. The change amount derivation model 85 whose prediction accuracy reaches the set level in this manner is used in the prediction unit 37 as part of the progress speed prediction model 81 . Regardless of the prediction accuracy of the learning prediction result 45L with respect to the correct CDR-SOB change amount 45CA, learning may be terminated when the above series of processes are repeated a set number of times.
一例として図28に示すように、学習用認知症関連データ80Lは、学習用MRI画像16Lと同じく、第1時点T1における認知症患者の認知症に関するデータである。
As shown in FIG. 28 as an example, the learning dementia-related data 80L is data related to dementia of a dementia patient at the first time point T1, like the learning MRI image 16L.
このように、第3実施形態においては、学習用入力データは、第1時点T1における認知症患者の認知症に関する認知症関連データである学習用認知症関連データ80Lも含む。予測部37は、臨床試験の開始時点TSにおける対象者Sの認知症に関する認知症関連データ80も進行速さ予測モデル81に入力する。認知症関連データ80という認知症の進行の速さの予測に役立つ強力なデータが加わるので、特徴量群54Gだけで認知症の進行の速さを予測する場合と比べて、認知症の進行の速さの予測精度を飛躍的に向上させることができる。
Thus, in the third embodiment, learning input data also includes learning dementia-related data 80L, which is dementia-related data related to dementia of a dementia patient at first time point T1. The prediction unit 37 also inputs dementia-related data 80 regarding dementia of the subject S at the start time TS of the clinical trial to the progression speed prediction model 81 . Since the dementia-related data 80, which is strong data useful for predicting the speed of dementia progression, is added, compared to the case of predicting the speed of dementia progression only with the feature group 54G, the progress of dementia Speed prediction accuracy can be dramatically improved.
なお、年齢、性別に加えて、病歴、あるいは認知症を発症した親類がいるか否か等を認知症関連データ80に含めてもよい。アポリポ蛋白質測定値、補体蛋白質測定値、およびトランスサイレチン測定値といった血液検査結果を認知症関連データ80に含めてもよい。長谷川式認知症スケールのスコア、MMSEのスコア、リバーミード行動記憶検査(RBMT:Rivermead Behavioural Memory Test)のスコア、日常生活動作(ADL:Activities of Daily Living)、およびADAS-Cogのスコア等を認知症関連データ80に含めてもよい。
In addition to age and gender, the dementia-related data 80 may include medical history, or whether or not there are relatives who have developed dementia. Dementia-related data 80 may include blood test results such as apolipoprotein measurements, complement protein measurements, and transthyretin measurements. Hasegawa dementia scale score, MMSE score, Rivermead Behavioral Memory Test (RBMT) score, activities of daily living (ADL: Activities of Daily Living), ADAS-Cog score, etc. related to dementia may be included in the data 80.
一例として図29に示すように、MRI画像16および認知症関連データ80に加えて、臨床試験期間PDを進行速さ予測モデル95に入力してもよい。この場合、図示は省略するが、学習フェーズにおいて、学習用MRI画像16Lおよび学習用認知症関連データ80Lに加えて、臨床試験期間PDに相当する期間PDEが学習用入力データとして進行速さ予測モデル95に入力される。
As an example, as shown in FIG. 29, in addition to the MRI image 16 and dementia-related data 80, the clinical trial period PD may be input to the progression speed prediction model 95. In this case, although illustration is omitted, in the learning phase, in addition to the learning MRI image 16L and the learning dementia-related data 80L, the period PDE corresponding to the clinical test period PD is used as learning input data for the progression speed prediction model. 95.
上記各実施形態では、予測結果45として認知機能検査のスコアの変化量であるCDR-SOB変化量を例示したが、これに限らない。一例として図30に示す進行速さ予測モデル100のように、予測結果101として認知症となる確率を出力してもよい。この場合のグループは、例えば、認知症となる確率が0%以上25%未満のグループ1、25%以上50%未満のグループ2、50%以上75%未満のグループ3、および75%以上100%以下のグループ4等とすればよい。
In each of the above embodiments, the amount of change in CDR-SOB, which is the amount of change in the score of the cognitive function test, was exemplified as the prediction result 45, but the present invention is not limited to this. As an example, the probability of developing dementia may be output as the prediction result 101, like the progression speed prediction model 100 shown in FIG. Groups in this case are, for example, group 1 with a probability of becoming dementia of 0% or more and less than 25%, group 2 of 25% or more and less than 50%, group 3 of 50% or more and less than 75%, and 75% or more and 100% Group 4 or the like below may be used.
一例として図31に示すマルチタスク畳み込みニューラルネットワーク(以下、マルチタスクCNN(Convolutional Neural Network)と表記)200の一部を、特徴量導出モデル51として用いてもよい。
As an example, a part of a multitask convolutional neural network (hereinafter referred to as a multitask CNN (Convolutional Neural Network)) 200 shown in FIG. 31 may be used as the feature value derivation model 51.
図31において、マルチタスクCNN200は、エンコーダ部201、自己注意(以下、SA(Self-Attention)と表記)機構層202、デコーダ部203、全体平均プーリング(以下、GAP(Global Average Pooling)と表記)層204、第1全結合(以下、FC(Fully Connected)と表記)層205、第2FC層206、およびソフトマックス関数(以下、SMF(SoftMax Function)と表記)層207を有する。
In FIG. 31, the multitasking CNN 200 includes an encoder unit 201, a self-attention (hereinafter referred to as SA (Self-Attention)) mechanism layer 202, a decoder unit 203, and a global average pooling (hereinafter referred to as GAP (Global Average Pooling)) It has a layer 204 , a first fully connected (FC (Fully Connected)) layer 205 , a second FC layer 206 , and a softmax function (SMF (SoftMax Function)) layer 207 .
エンコーダ部201は、上記第1実施形態のAE60のエンコーダ部61と同様に、入力された解剖区域画像53を前段特徴量54Pに変換する。エンコーダ部201は、前段特徴量54PをSA機構層202に出力する。
The encoder unit 201 converts the input anatomical region image 53 into the pre-stage feature amount 54P, like the encoder unit 61 of the AE 60 of the first embodiment. The encoder unit 201 outputs the pre-stage feature amount 54 P to the SA mechanism layer 202 .
SA機構層202は、前段特徴量54Pに対して、畳み込み演算の対象の要素の値に応じて、畳み込み演算用のフィルタの係数を変更しつつ畳み込み演算を行う。SA機構層202は、畳み込み演算後の前段特徴量54Pを、デコーダ部203およびGAP層204に出力する。
The SA mechanism layer 202 performs a convolution operation on the pre-stage feature quantity 54P while changing the filter coefficients for the convolution operation according to the value of the element targeted for the convolution operation. The SA mechanism layer 202 outputs the pre-stage feature quantity 54P after the convolution operation to the decoder unit 203 and the GAP layer 204. FIG.
デコーダ部203は、上記第1実施形態のAE60のデコーダ部62と同様に、畳み込み演算後の前段特徴量54Pから解剖区域画像53の復元画像208を生成する。
The decoder unit 203 generates a restored image 208 of the anatomical region image 53 from the pre-stage feature quantity 54P after the convolution operation, like the decoder unit 62 of the AE 60 of the first embodiment.
GAP層204は、畳み込み演算後の前段特徴量54Pに対して、全体平均プーリング処理を施す。全体平均プーリング処理は、前段特徴量54Pの複数のチャンネル毎に、その平均値を求める処理である。例えば前段特徴量54Pのチャンネル数が512であった場合、全体平均プーリング処理によって512個の前段特徴量54Pの平均値が求められる。GAP層204は、求めた前段特徴量54Pの平均値を、特徴量54として第1FC層205および第2FC層206に出力する。
The GAP layer 204 performs overall average pooling processing on the pre-stage feature quantity 54P after the convolution operation. The overall average pooling process is a process of obtaining an average value for each of a plurality of channels of the pre-stage feature quantity 54P. For example, when the number of channels of the pre-stage feature amount 54P is 512, the average value of the 512 pre-stage feature amounts 54P is obtained by the overall average pooling process. The GAP layer 204 outputs the obtained average value of the preceding stage feature quantity 54P to the first FC layer 205 and the second FC layer 206 as the feature quantity 54 .
第1FC層205は、特徴量54に基づいて第1予測結果209を出力する。第1予測結果209は、予測結果45と同じく、CDR-SOB変化量である。第1FC層205は、特徴量54の個数分のユニットをもつ入力層と、第1予測結果209を出力するための1つの出力層とを有する。入力層の各ユニットと出力層とは、互いに全結合されていて、それぞれに重みが設定されている。入力層の各ユニットには、特徴量54が入力される。特徴量54と、各ユニット間に設定された重みとの積和が、出力層の出力値となる。この出力値がCDR-SOB変化量である。
The first FC layer 205 outputs a first prediction result 209 based on the feature quantity 54. The first prediction result 209, like the prediction result 45, is the CDR-SOB change amount. The first FC layer 205 has an input layer having units corresponding to the number of features 54 and one output layer for outputting the first prediction result 209 . Each unit in the input layer and the output layer are fully connected to each other, and weights are set for each. A feature amount 54 is input to each unit of the input layer. The product sum of the feature amount 54 and the weight set between each unit is the output value of the output layer. This output value is the CDR-SOB change amount.
第2FC層206は、特徴量54をSMF層207のSMFで扱う変数に変換する。第2FC層206は、特徴量54の個数分のユニットをもつ入力層と、SMFで扱う変数の個数分のユニットをもつ出力層とを有する。入力層の各ユニットと出力層の各ユニットは、互いに全結合されていて、それぞれに重みが設定されている。入力層の各ユニットには、特徴量54が入力される。特徴量54と、各ユニット間に設定された重みとの積和が、出力層の各ユニットの出力値となる。この出力値がSMFで扱う変数である。第2FC層206は、SMFで扱う変数をSMF層207に出力する。SMF層207は、変数をSMFに適用することで第2予測結果210を出力する。第2予測結果210は、CDR-SOB変化量が0より大きい、または0以下である、のいずれかの内容である。
The second FC layer 206 converts the feature quantity 54 into variables handled by the SMF of the SMF layer 207 . The second FC layer 206 has an input layer having units corresponding to the number of feature values 54 and an output layer having units corresponding to the number of variables handled by SMF. Each unit in the input layer and each unit in the output layer are fully connected to each other and weighted. A feature amount 54 is input to each unit of the input layer. The product sum of the feature amount 54 and the weight set between each unit is the output value of each unit in the output layer. This output value is a variable handled by SMF. The second FC layer 206 outputs variables handled by SMF to the SMF layer 207 . The SMF layer 207 outputs a second prediction result 210 by applying the variables to the SMF. The second prediction result 210 indicates that the CDR-SOB variation is greater than 0 or less than or equal to 0.
つまり、マルチタスクCNN200は、AE、連続量(CDR-SOB変化量)の予測、およびクラス分類(CDR-SOB変化量が0より大きいか、または0以下であるか)の計3つのタスクを行う。特徴量導出モデル51には、エンコーダ部201、SA機構層202、およびGAP層204の部分が用いられる。
In other words, the multitasking CNN 200 performs a total of three tasks: AE, continuous quantity (CDR-SOB variation) prediction, and class classification (whether the CDR-SOB variation is greater than 0 or less than or equal to 0). . The encoder section 201, the SA mechanism layer 202, and the GAP layer 204 are used for the feature value derivation model 51. FIG.
このように、マルチタスクCNN200の一部を特徴量導出モデル51として用いてもよい。マルチタスクCNN200は、AE60等と比べて、複数のタスクを担うためにより複雑な処理を行う。このため、マルチタスクCNN200の一部から出力される特徴量54は、解剖区域画像53の特徴をより網羅的に表したものとなる可能性が高い。したがって、マルチタスクCNN200の一部を特徴量導出モデル51として用いれば、より信頼性の置ける特徴量54に基づいた予測結果45が出力されるので、認知症の進行の速さの予測の精度をより高めることができる。
In this way, part of the multitasking CNN 200 may be used as the feature value derivation model 51. The multitasking CNN 200 performs more complicated processing than the AE 60 and the like in order to handle a plurality of tasks. Therefore, there is a high possibility that the feature quantity 54 output from a part of the multitasking CNN 200 more exhaustively represents the features of the anatomical region image 53 . Therefore, if a part of the multitasking CNN 200 is used as the feature value derivation model 51, the prediction result 45 based on the more reliable feature value 54 is output, so the accuracy of predicting the speed of progression of dementia can be improved. can be higher.
文献1に記載の回帰モデルを用いて、対象者Sの認知症の進行の速さを予測してもよい。
Using the regression model described in Document 1, the speed of progression of dementia in subject S may be predicted.
医用画像は、例示のMRI画像16に限らない。PET画像、またはSPECT画像でもよい。
The medical image is not limited to the MRI image 16 illustrated. A PET image or a SPECT image may be used.
図9で示したAE60の学習、図10で示した変化量導出モデル52の学習、および図27で示した変化量導出モデル85の学習は、臨床試験支援サーバ10において行ってもよいし、臨床試験支援サーバ10とは別の装置で行ってもよい。また、これらの学習は、臨床試験支援サーバ10のストレージ20に各モデルを記憶した後に継続して行ってもよい。
The learning of the AE 60 shown in FIG. 9, the learning of the variation derivation model 52 shown in FIG. 10, and the learning of the variation derivation model 85 shown in FIG. A device other than the test support server 10 may be used. Also, these learnings may be continued after each model is stored in the storage 20 of the clinical trial support server 10 .
臨床試験支援サーバ10は、各医薬開発施設に設置されていてもよいし、医薬開発施設からは独立したデータセンターに設置されていてもよい。また、オペレータ端末11が臨床試験支援サーバ10の各処理部の一部または全ての機能を担ってもよい。
The clinical trial support server 10 may be installed in each drug development facility, or may be installed in a data center independent from the drug development facility. In addition, the operator terminal 11 may take part or all of the functions of each processing unit of the clinical trial support server 10 .
対象疾患として認知症を例示したが、これに限らない。対象疾患は例えば脳梗塞であってもよい。この場合は、対象者の脳を写したCT画像またはMRI画像を学習済みモデルに入力し、脳卒中評価スケール(NIHSS:National Institutes of Health Stroke Scale)のスコアの変化量、または日本脳卒中評価スケール(JSS:Japan Stroke Scale)のスコアの変化量を学習済みモデルから出力させる。対象疾患は、例示した認知症および脳梗塞、あるいはパーキンソン病といった神経変性疾患および脳血管疾患を含む脳神経疾患であることが好ましい。
Dementia was exemplified as a target disease, but it is not limited to this. The target disease may be, for example, cerebral infarction. In this case, a CT image or MRI image of the subject's brain is input to the trained model, and the amount of change in the score of the stroke rating scale (NIHSS: National Institutes of Health Stroke Scale) or the Japanese Stroke Rating Scale (JSS : Japan Stroke Scale) output the amount of change in the score from the trained model. Target diseases are preferably dementia and cerebral infarction as exemplified, or neurodegenerative diseases such as Parkinson's disease and cranial nerve diseases including cerebrovascular diseases.
ただし、認知症は、昨今の高齢化社会の到来とともに社会問題化している。このため、対象疾患を認知症とした本例は、現状の社会問題にマッチした形態であるといえる。
However, dementia has become a social problem with the advent of an aging society. Therefore, it can be said that this example in which dementia is the target disease is a form that matches the current social problem.
対象疾患は脳神経疾患に限らず、したがって臓器も脳に限らない。
Target diseases are not limited to cranial nerve diseases, and therefore organs are not limited to the brain.
進行速さ予測モデル31といった学習済みモデルを用いることなく、対象者Sの対象疾患の進行の速さを予測してもよい。
The speed of progression of the target disease of subject S may be predicted without using a trained model such as the progression speed prediction model 31 .
上記各実施形態において、例えば、受付部35、RW制御部36、予測部37、グループ分け部38、振り分け部39、配信制御部40、および選定部75といった各種の処理を実行する処理部(Processing Unit)のハードウェア的な構造としては、次に示す各種のプロセッサ(Processor)を用いることができる。各種のプロセッサには、上述したように、ソフトウェア(作動プログラム30)を実行して各種の処理部として機能する汎用的なプロセッサであるCPU22に加えて、FPGA(Field Programmable Gate Array)等の製造後に回路構成を変更可能なプロセッサであるプログラマブルロジックデバイス(Programmable Logic Device:PLD)、ASIC(Application Specific Integrated Circuit)等の特定の処理を実行させるために専用に設計された回路構成を有するプロセッサである専用電気回路等が含まれる。
In each of the above-described embodiments, for example, a processing unit (Processing As the hardware structure of the Unit, various processors shown below can be used. Various processors include, as described above, in addition to the CPU 22 which is a general-purpose processor that executes software (operation program 30) and functions as various processing units, FPGAs (Field Programmable Gate Arrays), etc. Programmable Logic Device (PLD), which is a processor whose circuit configuration can be changed, ASIC (Application Specific Integrated Circuit), etc. It includes electrical circuits and the like.
1つの処理部は、これらの各種のプロセッサのうちの1つで構成されてもよいし、同種または異種の2つ以上のプロセッサの組み合わせ(例えば、複数のFPGAの組み合わせ、および/または、CPUとFPGAとの組み合わせ)で構成されてもよい。また、複数の処理部を1つのプロセッサで構成してもよい。
One processing unit may be configured with one of these various processors, or a combination of two or more processors of the same or different type (for example, a combination of a plurality of FPGAs and/or a CPU and combination with FPGA). Also, a plurality of processing units may be configured by one processor.
複数の処理部を1つのプロセッサで構成する例としては、第1に、クライアントおよびサーバ等のコンピュータに代表されるように、1つ以上のCPUとソフトウェアの組み合わせで1つのプロセッサを構成し、このプロセッサが複数の処理部として機能する形態がある。第2に、システムオンチップ(System On Chip:SoC)等に代表されるように、複数の処理部を含むシステム全体の機能を1つのIC(Integrated Circuit)チップで実現するプロセッサを使用する形態がある。このように、各種の処理部は、ハードウェア的な構造として、上記各種のプロセッサの1つ以上を用いて構成される。
As an example of configuring a plurality of processing units with a single processor, first, as represented by computers such as clients and servers, a single processor is configured by combining one or more CPUs and software. There is a form in which a processor functions as multiple processing units. Second, as typified by System On Chip (SoC), etc., there is a form of using a processor that realizes the functions of the entire system including multiple processing units with a single IC (Integrated Circuit) chip. be. In this way, various processing units are configured using one or more of the above various processors as a hardware structure.
さらに、これらの各種のプロセッサのハードウェア的な構造としては、より具体的には、半導体素子等の回路素子を組み合わせた電気回路(circuitry)を用いることができる。
Furthermore, as the hardware structure of these various processors, more specifically, an electric circuit combining circuit elements such as semiconductor elements can be used.
以上の記載から、下記の付記項に記載の技術を把握することができる。
From the above description, the technology described in the additional items below can be understood.
[付記項1]
プロセッサを備え、
前記プロセッサは、
臨床試験の対象者について対象疾患の進行の速さを予測し、
対象疾患の進行の速さの予測結果に応じて対象者を複数のグループに分け、
複数の前記グループ毎に、被験薬を投与する被験薬群と偽薬を投与する偽薬群とに対象者を振り分ける、
臨床試験支援装置。
[付記項2]
前記プロセッサは、
前記予測結果に基づいて、対象疾患の進行が比較的速い対象者を選定し、
選定した対象者に対してのみ、前記予測結果に応じたグループ分け、および被験薬群と偽薬群への振り分けを行う付記項1に記載の臨床試験支援装置。
[付記項3]
前記プロセッサは、
ブロックランダマイズ手法を用いて被験薬群と偽薬群とに対象者を振り分ける付記項1または付記項2に記載の臨床試験支援装置。
[付記項4]
前記プロセッサは、
学習済みモデルを用いて前記対象疾患の進行の速さの予測を行い、
前記学習済みモデルは、第1時点における対象疾患患者の臓器を写した医用画像を学習用入力データとし、前記第1時点から臨床試験期間に相当する期間を経た第2時点における対象疾患患者の対象疾患の進行度合いを示す数値を正解データとして学習された学習済みモデルであり、
前記プロセッサは、
臨床試験の開始時点における対象者の臓器を写した医用画像を前記学習済みモデルに入力し、臨床試験の終了時点における対象者の対象疾患の進行度合いを示す数値を、前記予測結果として前記学習済みモデルから出力させる付記項1から付記項3のいずれか1項に記載の臨床試験支援装置。
[付記項5]
前記学習済みモデルは、
臨床試験の開始時点における前記医用画像から臓器の複数の解剖区域の画像である複数の解剖区域画像を抽出し、
前記解剖区域毎に用意された特徴量導出モデルに前記解剖区域画像を入力し、前記特徴量導出モデルから前記解剖区域の特徴量を出力させる付記項4に記載の臨床試験支援装置。
[付記項6]
前記学習用入力データは、前記第1時点における対象疾患患者の対象疾患に関する対象疾患関連データも含み、
前記プロセッサは、
臨床試験の開始時点における対象者の対象疾患に関する対象疾患関連データも前記学習済みモデルに入力する付記項4または付記項5に記載の臨床試験支援装置。
[付記項7]
前記対象疾患は認知症であり、
前記数値は、認知機能検査のスコアの変化量、または認知症となる確率である付記項4から付記項6のいずれか1項に記載の臨床試験支援装置。
[付記項8]
前記対象疾患は脳神経疾患である付記項1から付記項7のいずれか1項に記載の臨床試験支援装置。
[付記項9]
前記対象疾患は認知症である付記項1から付記項8のいずれか1項に記載の臨床試験支援装置。 [Appendix 1]
with a processor
The processor
Predict the speed of progression of the target disease for subjects in clinical trials,
Divide the subjects into multiple groups according to the prediction results of the speed of progression of the target disease,
Divide the subjects into a test drug group to which the test drug is administered and a placebo group to which the placebo is administered for each of the plurality of groups;
Clinical trial support equipment.
[Appendix 2]
The processor
Based on the prediction result, select a subject whose target disease progresses relatively quickly,
2. The clinical trial support device according toclaim 1, wherein only the selected subjects are grouped according to the prediction results and sorted into a test drug group and a placebo group.
[Appendix 3]
The processor
3. The clinical trial support device according toclaim 1 or claim 2, which uses a block randomization technique to sort subjects into a test drug group and a placebo group.
[Appendix 4]
The processor
Predicting the speed of progression of the target disease using a trained model,
The trained model uses a medical image of an organ of a target disease patient at a first time point as input data for learning, and the target disease patient at a second time point after a period corresponding to the clinical trial period from the first time point. A trained model that has been trained using numerical values indicating the degree of disease progression as correct data,
The processor
A medical image showing the subject's organs at the start of the clinical trial is input to the trained model, and a numerical value indicating the degree of progression of the subject's target disease at the end of the clinical trial is used as the prediction result. The clinical trial support device according to any one ofadditional items 1 to 3, which is output from a model.
[Appendix 5]
The trained model is
extracting a plurality of anatomical region images, which are images of a plurality of anatomical regions of an organ, from the medical image at the start of the clinical trial;
5. The clinical trial support apparatus according toclaim 4, wherein the anatomical region image is input to a feature value derivation model prepared for each anatomical region, and the feature value of the anatomical region is output from the feature value derivation model.
[Appendix 6]
The learning input data also includes target disease-related data related to the target disease of the target disease patient at the first time point,
The processor
6. The clinical trial support device according toclaim 4 or claim 5, wherein target disease-related data relating to the subject's target disease at the start of the clinical trial is also input to the trained model.
[Appendix 7]
The target disease is dementia,
7. The clinical trial support device according to any one ofadditional items 4 to 6, wherein the numerical value is an amount of change in a cognitive function test score or a probability of developing dementia.
[Appendix 8]
8. The clinical trial support device according to any one ofadditional items 1 to 7, wherein the target disease is a cranial nerve disease.
[Appendix 9]
9. The clinical trial support device according to any one ofadditional items 1 to 8, wherein the target disease is dementia.
プロセッサを備え、
前記プロセッサは、
臨床試験の対象者について対象疾患の進行の速さを予測し、
対象疾患の進行の速さの予測結果に応じて対象者を複数のグループに分け、
複数の前記グループ毎に、被験薬を投与する被験薬群と偽薬を投与する偽薬群とに対象者を振り分ける、
臨床試験支援装置。
[付記項2]
前記プロセッサは、
前記予測結果に基づいて、対象疾患の進行が比較的速い対象者を選定し、
選定した対象者に対してのみ、前記予測結果に応じたグループ分け、および被験薬群と偽薬群への振り分けを行う付記項1に記載の臨床試験支援装置。
[付記項3]
前記プロセッサは、
ブロックランダマイズ手法を用いて被験薬群と偽薬群とに対象者を振り分ける付記項1または付記項2に記載の臨床試験支援装置。
[付記項4]
前記プロセッサは、
学習済みモデルを用いて前記対象疾患の進行の速さの予測を行い、
前記学習済みモデルは、第1時点における対象疾患患者の臓器を写した医用画像を学習用入力データとし、前記第1時点から臨床試験期間に相当する期間を経た第2時点における対象疾患患者の対象疾患の進行度合いを示す数値を正解データとして学習された学習済みモデルであり、
前記プロセッサは、
臨床試験の開始時点における対象者の臓器を写した医用画像を前記学習済みモデルに入力し、臨床試験の終了時点における対象者の対象疾患の進行度合いを示す数値を、前記予測結果として前記学習済みモデルから出力させる付記項1から付記項3のいずれか1項に記載の臨床試験支援装置。
[付記項5]
前記学習済みモデルは、
臨床試験の開始時点における前記医用画像から臓器の複数の解剖区域の画像である複数の解剖区域画像を抽出し、
前記解剖区域毎に用意された特徴量導出モデルに前記解剖区域画像を入力し、前記特徴量導出モデルから前記解剖区域の特徴量を出力させる付記項4に記載の臨床試験支援装置。
[付記項6]
前記学習用入力データは、前記第1時点における対象疾患患者の対象疾患に関する対象疾患関連データも含み、
前記プロセッサは、
臨床試験の開始時点における対象者の対象疾患に関する対象疾患関連データも前記学習済みモデルに入力する付記項4または付記項5に記載の臨床試験支援装置。
[付記項7]
前記対象疾患は認知症であり、
前記数値は、認知機能検査のスコアの変化量、または認知症となる確率である付記項4から付記項6のいずれか1項に記載の臨床試験支援装置。
[付記項8]
前記対象疾患は脳神経疾患である付記項1から付記項7のいずれか1項に記載の臨床試験支援装置。
[付記項9]
前記対象疾患は認知症である付記項1から付記項8のいずれか1項に記載の臨床試験支援装置。 [Appendix 1]
with a processor
The processor
Predict the speed of progression of the target disease for subjects in clinical trials,
Divide the subjects into multiple groups according to the prediction results of the speed of progression of the target disease,
Divide the subjects into a test drug group to which the test drug is administered and a placebo group to which the placebo is administered for each of the plurality of groups;
Clinical trial support equipment.
[Appendix 2]
The processor
Based on the prediction result, select a subject whose target disease progresses relatively quickly,
2. The clinical trial support device according to
[Appendix 3]
The processor
3. The clinical trial support device according to
[Appendix 4]
The processor
Predicting the speed of progression of the target disease using a trained model,
The trained model uses a medical image of an organ of a target disease patient at a first time point as input data for learning, and the target disease patient at a second time point after a period corresponding to the clinical trial period from the first time point. A trained model that has been trained using numerical values indicating the degree of disease progression as correct data,
The processor
A medical image showing the subject's organs at the start of the clinical trial is input to the trained model, and a numerical value indicating the degree of progression of the subject's target disease at the end of the clinical trial is used as the prediction result. The clinical trial support device according to any one of
[Appendix 5]
The trained model is
extracting a plurality of anatomical region images, which are images of a plurality of anatomical regions of an organ, from the medical image at the start of the clinical trial;
5. The clinical trial support apparatus according to
[Appendix 6]
The learning input data also includes target disease-related data related to the target disease of the target disease patient at the first time point,
The processor
6. The clinical trial support device according to
[Appendix 7]
The target disease is dementia,
7. The clinical trial support device according to any one of
[Appendix 8]
8. The clinical trial support device according to any one of
[Appendix 9]
9. The clinical trial support device according to any one of
本開示の技術は、上述の種々の実施形態および/または種々の変形例を適宜組み合わせることも可能である。また、上記各実施形態に限らず、要旨を逸脱しない限り種々の構成を採用し得ることはもちろんである。さらに、本開示の技術は、プログラムに加えて、プログラムを非一時的に記憶する記憶媒体にもおよぶ。
The technology of the present disclosure can also appropriately combine various embodiments and/or various modifications described above. Moreover, it is needless to say that various configurations can be employed without departing from the scope of the present invention without being limited to the above embodiments. Furthermore, the technology of the present disclosure extends to storage media that non-temporarily store programs in addition to programs.
以上に示した記載内容および図示内容は、本開示の技術に係る部分についての詳細な説明であり、本開示の技術の一例に過ぎない。例えば、上記の構成、機能、作用、および効果に関する説明は、本開示の技術に係る部分の構成、機能、作用、および効果の一例に関する説明である。よって、本開示の技術の主旨を逸脱しない範囲内において、以上に示した記載内容および図示内容に対して、不要な部分を削除したり、新たな要素を追加したり、置き換えたりしてもよいことはいうまでもない。また、錯綜を回避し、本開示の技術に係る部分の理解を容易にするために、以上に示した記載内容および図示内容では、本開示の技術の実施を可能にする上で特に説明を要しない技術常識等に関する説明は省略されている。
The descriptions and illustrations shown above are detailed descriptions of the parts related to the technology of the present disclosure, and are merely examples of the technology of the present disclosure. For example, the above descriptions of configurations, functions, actions, and effects are descriptions of examples of configurations, functions, actions, and effects of portions related to the technology of the present disclosure. Therefore, unnecessary parts may be deleted, new elements added, or replaced with respect to the above-described description and illustration without departing from the gist of the technology of the present disclosure. Needless to say. In addition, in order to avoid complication and facilitate understanding of the portion related to the technology of the present disclosure, the descriptions and illustrations shown above require no particular explanation in order to enable implementation of the technology of the present disclosure. Descriptions of common technical knowledge, etc., that are not used are omitted.
本明細書において、「Aおよび/またはB」は、「AおよびBのうちの少なくとも1つ」と同義である。つまり、「Aおよび/またはB」は、Aだけであってもよいし、Bだけであってもよいし、AおよびBの組み合わせであってもよい、という意味である。また、本明細書において、3つ以上の事柄を「および/または」で結び付けて表現する場合も、「Aおよび/またはB」と同様の考え方が適用される。
As used herein, "A and/or B" is synonymous with "at least one of A and B." That is, "A and/or B" means that only A, only B, or a combination of A and B may be used. In addition, in this specification, when three or more matters are expressed by connecting with "and/or", the same idea as "A and/or B" is applied.
本明細書に記載された全ての文献、特許出願および技術規格は、個々の文献、特許出願および技術規格が参照により取り込まれることが具体的かつ個々に記された場合と同程度に、本明細書中に参照により取り込まれる。
All publications, patent applications and technical standards mentioned herein are expressly incorporated herein by reference to the same extent as if each individual publication, patent application and technical standard were specifically and individually noted to be incorporated by reference. incorporated by reference into the book.
Claims (11)
- プロセッサを備え、
前記プロセッサは、
臨床試験の対象者について対象疾患の進行の速さを予測し、
対象疾患の進行の速さの予測結果に応じて対象者を複数のグループに分け、
複数の前記グループ毎に、被験薬を投与する被験薬群と偽薬を投与する偽薬群とに対象者を振り分ける、
臨床試験支援装置。 with a processor
The processor
Predict the speed of progression of the target disease for subjects in clinical trials,
Divide the subjects into multiple groups according to the prediction results of the speed of progression of the target disease,
Divide the subjects into a test drug group to which the test drug is administered and a placebo group to which the placebo is administered for each of the plurality of groups;
Clinical trial support equipment. - 前記プロセッサは、
前記予測結果に基づいて、対象疾患の進行が比較的速い対象者を選定し、
選定した対象者に対してのみ、前記予測結果に応じたグループ分け、および被験薬群と偽薬群への振り分けを行う請求項1に記載の臨床試験支援装置。 The processor
Based on the prediction result, select a subject whose target disease progresses relatively quickly,
2. The clinical trial support apparatus according to claim 1, wherein only the selected subjects are grouped according to the prediction results and sorted into a test drug group and a placebo group. - 前記プロセッサは、
ブロックランダマイズ手法を用いて被験薬群と偽薬群とに対象者を振り分ける請求項1に記載の臨床試験支援装置。 The processor
2. The clinical trial support device according to claim 1, wherein subjects are divided into a test drug group and a placebo group using a block randomization technique. - 前記プロセッサは、
学習済みモデルを用いて前記対象疾患の進行の速さの予測を行い、
前記学習済みモデルは、第1時点における対象疾患患者の臓器を写した医用画像を学習用入力データとし、前記第1時点から臨床試験期間に相当する期間を経た第2時点における対象疾患患者の対象疾患の進行度合いを示す数値を正解データとして学習された学習済みモデルであり、
前記プロセッサは、
臨床試験の開始時点における対象者の臓器を写した医用画像を前記学習済みモデルに入力し、臨床試験の終了時点における対象者の対象疾患の進行度合いを示す数値を、前記予測結果として前記学習済みモデルから出力させる請求項1に記載の臨床試験支援装置。 The processor
Predicting the speed of progression of the target disease using a trained model,
The trained model uses a medical image of an organ of a target disease patient at a first time point as input data for learning, and the target disease patient at a second time point after a period corresponding to the clinical trial period from the first time point. A trained model that has been trained using numerical values indicating the degree of disease progression as correct data,
The processor
A medical image showing the subject's organs at the start of the clinical trial is input to the trained model, and a numerical value indicating the degree of progression of the subject's target disease at the end of the clinical trial is used as the prediction result. 2. The clinical trial support device according to claim 1, wherein the model is output. - 前記学習済みモデルは、
臨床試験の開始時点における前記医用画像から臓器の複数の解剖区域の画像である複数の解剖区域画像を抽出し、
前記解剖区域毎に用意された特徴量導出モデルに前記解剖区域画像を入力し、前記特徴量導出モデルから前記解剖区域の特徴量を出力させる請求項4に記載の臨床試験支援装置。 The trained model is
extracting a plurality of anatomical region images, which are images of a plurality of anatomical regions of an organ, from the medical image at the start of the clinical trial;
5. The clinical trial support apparatus according to claim 4, wherein the anatomical region image is input to a feature value derivation model prepared for each anatomical region, and the feature value of the anatomical region is output from the feature value derivation model. - 前記学習用入力データは、前記第1時点における対象疾患患者の対象疾患に関する対象疾患関連データも含み、
前記プロセッサは、
臨床試験の開始時点における対象者の対象疾患に関する対象疾患関連データも前記学習済みモデルに入力する請求項4に記載の臨床試験支援装置。 The learning input data also includes target disease-related data related to the target disease of the target disease patient at the first time point,
The processor
5. The clinical trial support apparatus according to claim 4, wherein target disease-related data relating to the subject's target disease at the start of the clinical trial is also input to the learned model. - 前記対象疾患は認知症であり、
前記数値は、認知機能検査のスコアの変化量、または認知症となる確率である請求項4に記載の臨床試験支援装置。 The target disease is dementia,
5. The clinical test support apparatus according to claim 4, wherein the numerical value is the amount of change in the score of a cognitive function test or the probability of developing dementia. - 前記対象疾患は脳神経疾患である請求項1に記載の臨床試験支援装置。 The clinical trial support device according to claim 1, wherein the target disease is a cranial nerve disease.
- 前記対象疾患は認知症である請求項1に記載の臨床試験支援装置。 The clinical trial support device according to claim 1, wherein the target disease is dementia.
- 臨床試験の対象者について対象疾患の進行の速さを予測すること、
対象疾患の進行の速さの予測結果に応じて対象者を複数のグループに分けること、並びに、
複数の前記グループ毎に、被験薬を投与する被験薬群と偽薬を投与する偽薬群とに対象者を振り分けること、
を含む臨床試験支援装置の作動方法。 Predicting the rate of progression of a target disease in clinical trial subjects;
Dividing subjects into a plurality of groups according to the prediction result of the speed of progression of the target disease, and
Distributing the subjects into a test drug group to which the test drug is administered and a placebo group to which the placebo is administered for each of the plurality of groups;
A method of operating a clinical trial support device comprising: - 臨床試験の対象者について対象疾患の進行の速さを予測すること、
対象疾患の進行の速さの予測結果に応じて対象者を複数のグループに分けること、並びに、
複数の前記グループ毎に、被験薬を投与する被験薬群と偽薬を投与する偽薬群とに対象者を振り分けること、
を含む処理をコンピュータに実行させる臨床試験支援装置の作動プログラム。 Predicting the rate of progression of a target disease in clinical trial subjects;
Dividing subjects into a plurality of groups according to the prediction result of the speed of progression of the target disease, and
Distributing the subjects into a test drug group to which the test drug is administered and a placebo group to which the placebo is administered for each of the plurality of groups;
An operating program of a clinical trial support device that causes a computer to execute processing including
Applications Claiming Priority (4)
| Application Number | Priority Date | Filing Date | Title |
|---|---|---|---|
| JP2021199612 | 2021-12-08 | ||
| JP2021-199612 | 2021-12-08 | ||
| JP2022-118300 | 2022-07-25 | ||
| JP2022118300 | 2022-07-25 |
Publications (1)
| Publication Number | Publication Date |
|---|---|
| WO2023105976A1 true WO2023105976A1 (en) | 2023-06-15 |
Family
ID=86730104
Family Applications (1)
| Application Number | Title | Priority Date | Filing Date |
|---|---|---|---|
| PCT/JP2022/040265 WO2023105976A1 (en) | 2021-12-08 | 2022-10-27 | Clinical trial assistance apparatus, method for operating clinical trial assistance apparatus, and program for operating clinical trial assistance apparatus |
Country Status (1)
| Country | Link |
|---|---|
| WO (1) | WO2023105976A1 (en) |
Citations (5)
| Publication number | Priority date | Publication date | Assignee | Title |
|---|---|---|---|---|
| JP2007524361A (en) * | 2003-02-10 | 2007-08-30 | アジェンシス, インコーポレイテッド | 158P1D7 nucleic acid and corresponding protein useful for the treatment and detection of bladder cancer and other cancers |
| US20100280975A1 (en) * | 2007-11-05 | 2010-11-04 | Wista Laboratories Ltd. | Systems for clinical trials |
| JP2016516007A (en) * | 2013-02-26 | 2016-06-02 | トリアクト セラピューティクス,インク. | Cancer treatment |
| JP2018517781A (en) * | 2015-06-19 | 2018-07-05 | モレキュラー ディフェンシズ コーポレイション | Glutathione preparation and method of use thereof |
| WO2021020198A1 (en) * | 2019-07-26 | 2021-02-04 | 富士フイルム株式会社 | Information processing device, program, learned model, diagnostic assistance device, learning device, and method for generating prediction model |
-
2022
- 2022-10-27 WO PCT/JP2022/040265 patent/WO2023105976A1/en unknown
Patent Citations (5)
| Publication number | Priority date | Publication date | Assignee | Title |
|---|---|---|---|---|
| JP2007524361A (en) * | 2003-02-10 | 2007-08-30 | アジェンシス, インコーポレイテッド | 158P1D7 nucleic acid and corresponding protein useful for the treatment and detection of bladder cancer and other cancers |
| US20100280975A1 (en) * | 2007-11-05 | 2010-11-04 | Wista Laboratories Ltd. | Systems for clinical trials |
| JP2016516007A (en) * | 2013-02-26 | 2016-06-02 | トリアクト セラピューティクス,インク. | Cancer treatment |
| JP2018517781A (en) * | 2015-06-19 | 2018-07-05 | モレキュラー ディフェンシズ コーポレイション | Glutathione preparation and method of use thereof |
| WO2021020198A1 (en) * | 2019-07-26 | 2021-02-04 | 富士フイルム株式会社 | Information processing device, program, learned model, diagnostic assistance device, learning device, and method for generating prediction model |
Similar Documents
| Publication | Publication Date | Title |
|---|---|---|
| Hoenig et al. | Networks of tau distribution in Alzheimer’s disease | |
| Maggi et al. | Nusinersen safety and effects on motor function in adult spinal muscular atrophy type 2 and 3 | |
| Ossenkoppele et al. | Assessment of demographic, genetic, and imaging variables associated with brain resilience and cognitive resilience to pathological tau in patients with Alzheimer disease | |
| Liu et al. | Association between habenula dysfunction and motivational symptoms in unmedicated major depressive disorder | |
| Langdahl et al. | Reduction in fracture rate and back pain and increased quality of life in postmenopausal women treated with teriparatide: 18-month data from the European Forsteo Observational Study (EFOS) | |
| Galvin et al. | Synucleinopathies: clinical and pathological implications | |
| Ebrahimi-Fakhari et al. | Defining the clinical, molecular and imaging spectrum of adaptor protein complex 4-associated hereditary spastic paraplegia | |
| Bak et al. | Clinical, imaging and pathological correlates of a hereditary deficit in verb and action processing | |
| Gomez-Ramirez et al. | Network-based biomarkers in Alzheimer’s disease: review and future directions | |
| Lee et al. | Posterior cingulate cortex network predicts Alzheimer's disease progression | |
| Bertsch et al. | A sensitivity analysis of a mathematical model for the synergistic interplay of amyloid beta and tau on the dynamics of Alzheimer’s disease | |
| Qi et al. | Altered cerebro-cerebellar limbic network in AD spectrum: a resting-state fMRI study | |
| Vidoni et al. | Alzheimer disease alters the relationship of cardiorespiratory fitness with brain activity during the stroop task | |
| WO2023105976A1 (en) | Clinical trial assistance apparatus, method for operating clinical trial assistance apparatus, and program for operating clinical trial assistance apparatus | |
| Duara et al. | The basis for disease-modifying treatments for Alzheimer's disease: the Sixth Annual Mild Cognitive Impairment Symposium | |
| Zhu et al. | Investigating brain aging trajectory deviations in different brain regions of individuals with schizophrenia using multimodal magnetic resonance imaging and brain-age prediction: a multicenter study | |
| Gatica et al. | High-order functional redundancy in ageing explained via alterations in the connectome in a whole-brain model | |
| Łusakowska et al. | Long-term nusinersen treatment across a wide spectrum of spinal muscular atrophy severity: a real-world experience | |
| Smyczynska et al. | Neural network models–a novel tool for predicting the efficacy of growth hormone (GH) therapy in children with short stature | |
| Roy et al. | Behavioural subphenotypes and their anatomic correlates in neurodegenerative disease | |
| Pal et al. | The role of astrocytes in Alzheimer’s disease progression | |
| WO2022071158A1 (en) | Diagnosis assistance device, method for operating diagnosis assistance device, program for operating diagnosis assistance device, dementia diagnosis assistance method, and learned model for deriving dementia findings | |
| Schwab et al. | Sparse pallidal connections shape synchrony in a network model of the basal ganglia | |
| WO2023276977A1 (en) | Medical assistance device, operation method for medical assistance device, and operation program for medical assistance device | |
| Lin et al. | Effects of music therapy on cognition, quality of life, and neuropsychiatric symptoms of patients with dementia: a systematic review and meta-analysis of randomized controlled trials |
Legal Events
| Date | Code | Title | Description |
|---|---|---|---|
| 121 | Ep: the epo has been informed by wipo that ep was designated in this application |
Ref document number: 22903908 Country of ref document: EP Kind code of ref document: A1 |