WO2023058766A1 - 過共晶材料及びその製造方法 - Google Patents
過共晶材料及びその製造方法 Download PDFInfo
- Publication number
- WO2023058766A1 WO2023058766A1 PCT/JP2022/037717 JP2022037717W WO2023058766A1 WO 2023058766 A1 WO2023058766 A1 WO 2023058766A1 JP 2022037717 W JP2022037717 W JP 2022037717W WO 2023058766 A1 WO2023058766 A1 WO 2023058766A1
- Authority
- WO
- WIPO (PCT)
- Prior art keywords
- hypereutectic
- alloy
- sample
- current
- primary crystal
- Prior art date
- Legal status (The legal status is an assumption and is not a legal conclusion. Google has not performed a legal analysis and makes no representation as to the accuracy of the status listed.)
- Ceased
Links
Images






Classifications
-
- B—PERFORMING OPERATIONS; TRANSPORTING
- B22—CASTING; POWDER METALLURGY
- B22D—CASTING OF METALS; CASTING OF OTHER SUBSTANCES BY THE SAME PROCESSES OR DEVICES
- B22D1/00—Treatment of fused masses in the ladle or the supply runners before casting
-
- B—PERFORMING OPERATIONS; TRANSPORTING
- B22—CASTING; POWDER METALLURGY
- B22D—CASTING OF METALS; CASTING OF OTHER SUBSTANCES BY THE SAME PROCESSES OR DEVICES
- B22D21/00—Casting non-ferrous metals or metallic compounds so far as their metallurgical properties are of importance for the casting procedure; Selection of compositions therefor
- B22D21/02—Casting exceedingly oxidisable non-ferrous metals, e.g. in inert atmosphere
- B22D21/04—Casting aluminium or magnesium
-
- C—CHEMISTRY; METALLURGY
- C22—METALLURGY; FERROUS OR NON-FERROUS ALLOYS; TREATMENT OF ALLOYS OR NON-FERROUS METALS
- C22C—ALLOYS
- C22C21/00—Alloys based on aluminium
-
- C—CHEMISTRY; METALLURGY
- C22—METALLURGY; FERROUS OR NON-FERROUS ALLOYS; TREATMENT OF ALLOYS OR NON-FERROUS METALS
- C22C—ALLOYS
- C22C21/00—Alloys based on aluminium
- C22C21/02—Alloys based on aluminium with silicon as the next major constituent
-
- C—CHEMISTRY; METALLURGY
- C22—METALLURGY; FERROUS OR NON-FERROUS ALLOYS; TREATMENT OF ALLOYS OR NON-FERROUS METALS
- C22F—CHANGING THE PHYSICAL STRUCTURE OF NON-FERROUS METALS AND NON-FERROUS ALLOYS
- C22F1/00—Changing the physical structure of non-ferrous metals or alloys by heat treatment or by hot or cold working
- C22F1/04—Changing the physical structure of non-ferrous metals or alloys by heat treatment or by hot or cold working of aluminium or alloys based thereon
-
- C—CHEMISTRY; METALLURGY
- C22—METALLURGY; FERROUS OR NON-FERROUS ALLOYS; TREATMENT OF ALLOYS OR NON-FERROUS METALS
- C22F—CHANGING THE PHYSICAL STRUCTURE OF NON-FERROUS METALS AND NON-FERROUS ALLOYS
- C22F1/00—Changing the physical structure of non-ferrous metals or alloys by heat treatment or by hot or cold working
- C22F1/04—Changing the physical structure of non-ferrous metals or alloys by heat treatment or by hot or cold working of aluminium or alloys based thereon
- C22F1/043—Changing the physical structure of non-ferrous metals or alloys by heat treatment or by hot or cold working of aluminium or alloys based thereon of alloys with silicon as the next major constituent
-
- C—CHEMISTRY; METALLURGY
- C22—METALLURGY; FERROUS OR NON-FERROUS ALLOYS; TREATMENT OF ALLOYS OR NON-FERROUS METALS
- C22F—CHANGING THE PHYSICAL STRUCTURE OF NON-FERROUS METALS AND NON-FERROUS ALLOYS
- C22F1/00—Changing the physical structure of non-ferrous metals or alloys by heat treatment or by hot or cold working
Definitions
- the present invention relates to hypereutectic materials and methods of making the same.
- Solid phase particles Hard intermetallic compounds (hereafter referred to as solid phase particles) that crystallize out during the solidification process of molten metal have various effects on the properties of the metal material produced during the solidification process. In some cases it is essential to obtain the desired material properties and in other cases its removal is necessary. Generally, the former emphasizes the distribution and morphology of particles, while the latter requires the establishment of process technology for separating and removing solid-phase particles.
- Non-Patent Document 1 It has been reported that the solid-phase particles liberated in the molten metal can be separated by applying an electromagnetic force (Non-Patent Document 1). This utilizes the reaction of the electromagnetic force acting on the molten metal.
- electromagnetic separation theory solid-phase particles with low electrical conductivity move in the direction opposite to the electromagnetic force. Since the solid phase particles move to the surface layer of the molten metal, the solid phase particles can be removed.
- the use of electromagnetic separation theory is of interest in solidification structure control and melt cleaning. However, there are many unclear points as to whether or not the theoretical effect can actually be obtained.
- hypereutectic materials containing hypereutectic Al-Fe alloys or hypereutectic Al-Si alloys are known as hypereutectic materials, which are a type of metal material.
- Various material properties are required for these hypereutectic materials.
- One of the factors that determine the material properties of the hypereutectic material is the metallographic structure of the hypereutectic material.
- the metallographic structure includes, for example, a surface layer structure and an internal structure.
- use of the above-mentioned electromagnetic separation theory can be cited, but the hypereutectic material does not necessarily behave according to the electromagnetic separation theory.
- the present invention has been made to solve the above-mentioned problems, and its object is to provide a hypereutectic material having a new metallic structure that has not existed in the past, and a method for producing the same. .
- a hypereutectic material is provided, characterized in that:
- a method for producing a hypereutectic material wherein a hypereutectic Al—Fe alloy or a hypereutectic Al—Si alloy is and applying an electromagnetic force to the molten metal while cooling the molten metal generated by the heating step, thereby turning the primary crystal of the hypereutectic Al-Fe alloy or the hypereutectic Al-Si alloy into hypereutectic and a cooling step causing segregation in the surface layer of the material.
- an electromagnetic force with an electromagnetic force density of 51.5 kN/m 3 or more and 260 kN/m 3 or less may be applied to the molten metal.
- a method for producing a hypereutectic material comprising: and a cooling step of segregating the primary crystals of the hypereutectic Al—Si alloy to the surface layer portion of the hypereutectic material by applying an electric current to the molten metal while cooling the molten metal produced by the step.
- a method for making a hypereutectic material is provided.
- a current with a current density of 255 kA/m 2 or more and 637 kA/m 2 or less may be applied to the molten metal.
- FIG. 3 is an explanatory diagram showing the relationship between the equilibrium diagram of each alloy and the test temperature.
- FIG. 4 is an explanatory diagram showing the arrangement of samples;
- (a) is a perspective view showing a state in which a sample is placed between magnetic poles of permanent magnets (Nd--Fe--B).
- the left diagram of (b) is a graph showing the distribution of the magnitude of the magnetic flux density B when a magnetic field is applied to the sample.
- the right figure of (b) is a graph showing the magnitude of the magnetic flux density B.
- FIG. FIG. 11 is an image showing the macrostructure of longitudinal sections of samples F 950-[1] , F 950-[2] , and F 950-[3] ;
- FIG. 11 is an image showing the macrostructure of longitudinal sections of samples F 750-[2] , F 850-[2] , and F 950-[2] ;
- FIG. It is an X-ray CT image of sample F 950-[1] .
- It is an X-ray CT image of sample F 950-[1] .
- It is an X-ray CT image of sample F 950-[2] .
- It is an X-ray CT image of sample F 950-[3] .
- FIG. 4 is a conceptual diagram showing the process of tissue formation observed in samples F 950-[1] , F 950-[2] and F 950-[3] .
- Figure 10 is an image showing the macrostructure in longitudinal and arbitrary cross-sections of samples S 950-[1] , S 950-[2] , S 950-[3] .
- Figure 10 is an image showing the macrostructure in longitudinal and arbitrary cross-sections of samples S 650-[2] , S 750-[2] , S 850-[2] .
- Fig. 3 is optical micrographs of samples S 950-[1] , S 950-[2] and S 950-[3] .
- FIG. 11 is an image showing Si mapping by X-ray fluorescence of samples S 950-[2] and S 950-[3] ;
- FIG. FIG. 4 is an explanatory diagram showing a coupled zone; It is an image which shows the macro structure of the sample obtained by each experiment of no electric current, application of 80 A of electric currents, and application of 100 A of electric currents.
- FIG. 10 is an image showing the microstructure of a sample obtained by conducting an experiment without current; FIG. It is an image which shows the microstructure of the sample obtained by conducting an experiment of applying a current of 80A. It is an image which shows the microstructure of the sample obtained by conducting an experiment of applying a current of 100A.
- Experimental samples were prepared by cutting each alloy ingot into a cylindrical shape with a diameter of 18 mm and a length of 90 mm. Then, the sample was inserted into a mullite tube having an inner diameter of 20 mm and a length of 120 mm, and both ends of the mullite tube were closed with graphite electrodes. The mullite tube was oriented vertically so that the positive graphite electrode was positioned on the bottom (vertical orientation). The graphite electrode on the positive electrode side was fixed to the mullite tube with a ceramic adhesive, and the graphite electrode on the negative electrode side was movable up and down so as to make sufficient contact with the molten metal of each alloy.
- the copper plate and each graphite electrode were fastened via a copper clamp, and the sample was left still in an electric furnace in that state.
- the copper plate was connected to a cabtyre cable outside the electric furnace, and the copper plate was connected to a DC stabilized power supply (PR10-300 Matsusada Precision) via the cabtyre cable.
- test temperature a predetermined temperature (hereinafter also referred to as "test temperature")
- the sample is taken out of the furnace, and the molten metal of the sample is immediately solidified naturally under the following cooling conditions. rice field.
- FIG. 1 shows the relationship between the equilibrium diagram of each alloy and the test temperature.
- (a) of FIG. 1 shows the relationship between the equilibrium diagram of the hypereutectic Al--Fe alloy and the test temperature
- (b) of FIG. 1 shows the relationship between the equilibrium diagram of the hyper-eutectic Al--Si alloy and the test temperature. Show relationship.
- the straight line L1 indicates the mass % of Fe contained in the Al-10Fe alloy (ie, 10 mass %), and the point P1 indicates the test temperature.
- L indicates a liquid phase
- L+Al 13 Fe 4 indicates a solid-liquid two-phase state of liquid phase and primary crystal Al 13 Fe 4
- ⁇ Al+Al 13 Fe 4 indicates a solid phase of ⁇ Al and primary crystal Al 13 Fe 4 .
- Curves L2 and L3 indicate the liquidus
- point P2 indicates the eutectic point.
- the straight line L4 indicates the mass % of Si contained in the Al-25Si alloy (ie, 25 mass %), and the point P3 indicates the test temperature.
- L indicates a liquid phase
- L+Si indicates a solid-liquid two-phase state of liquid phase and primary crystal Si
- ⁇ Al+Si indicates a solid phase of ⁇ Al and primary crystal Si.
- Lines L5 and L6 indicate liquidus lines
- point P4 indicates the eutectic point.
- the solid-liquid two-phase state means a state in which the primary crystal Al 13 Fe 4 or primary crystal Si is undissolved and liberated in the liquid phase (L). do.
- the Al-10Fe alloy and the Al-25Si alloy are completely in the liquid phase (L) or in a solid-liquid two-phase state. is.
- an electromagnetic force was applied to each sample by the following method. Specifically, a magnetic field was applied to each sample by passing a direct current through the sample and placing the sample between the magnetic poles of a permanent magnet (Nd--Fe--B) (see FIG. 3(a)). The direction of the magnetic field (the direction of the magnetic flux density B (bold letters indicate vectors; the same shall apply hereinafter)) was perpendicular to the longitudinal direction of the sample (see FIG. 2(a)). Note that the magnitude of the magnetic field was constant (approximately 0.54 T). After cooling the sample to room temperature, the sample was removed from the mullite tube, and the sample was subjected to macrostructural observation (visual observation.
- the cross section of the sample was read with a scanner, and the resulting image was visually observed. ), optical microscope tissue observation, and observation by X-ray computed tomography (X-ray CT).
- X-ray CT X-ray computed tomography
- the Al-10Fe alloy is referred to as "F”
- the Al-25Si alloy is referred to as "S”
- the sample after cooling treatment is indicated by "F” or "S” with the test temperature and cooling conditions added.
- a test temperature of 950° C. and a sample obtained under cooling conditions [1] are expressed as “F 950-[1] ” .
- FIG. 2(a) shows the arrangement of the samples.
- B in (a) of FIG. 2 indicates magnetic flux density
- J indicates current density
- F indicates electromagnetic force density.
- FIG. 2(b) is a diagram showing a state in which the sample is arranged horizontally (the sample is arranged such that the longitudinal direction of the sample coincides with the horizontal direction and is perpendicular to the direction of the magnetic flux density B).
- FIG. 3 (a) of FIG. 3 is a perspective view showing a state in which a sample is placed between magnetic poles of permanent magnets (Nd--Fe--B).
- the left diagram of FIG. 3(b) is a graph showing the distribution of the magnitude of the magnetic flux density B when a magnetic field is applied to the sample.
- the horizontal axis w indicates the distance from one end of the magnetic pole (the left end in FIG. 3(a)) in the horizontal direction
- the vertical axis H indicates the distance from the lower end of the magnetic pole in the vertical direction.
- the right diagram of FIG. 3(b) is a graph showing the magnitude of the magnetic flux density B.
- FIG. 3(b) the magnetic field is uniformly applied to the entire sample.
- ⁇ L is the electrical conductivity of the molten metal (molten metal)
- ⁇ P is the electrical conductivity of the solid-phase particles
- V is the volume of the solid-phase particles
- F is the magnitude of the electromagnetic force density.
- the primary crystal Al 13 Fe 4 is an intermetallic compound and the primary crystal Si is a semiconductor, and the electrical conductivity of both of them at high temperatures is unknown.
- Al in the molten metal is a good conductor and has a large electrical conductivity of 4.0 ⁇ 10 6 ⁇ ⁇ 1 m ⁇ 1 just above the melting point (Non-Patent Document 2).
- both the primary crystal Al 13 Fe 4 and the primary crystal Si segregate in the direction opposite to the direction of the electromagnetic force density F. It is expected that For example, if the electromagnetic force density F is acting from right to left on the sample as seen by the observer, each primary crystal that is free in the melt will be induced by the force F in the opposite direction to the electromagnetic force density F, i.e. It is presumed to be distributed biased toward the right half.
- the eutectic Al 13 Fe 4 was fine and difficult to observe.
- the Si phase in the Al-25Si alloy also has a density close to that of ⁇ Al and the difference in X-ray absorption coefficient is small, the contrast required for X-ray observation could not be obtained for both the primary Si and the eutectic Si. Therefore, the Al-25Si alloy was observed macroscopically and microscopically.
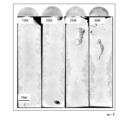
- FIG. 4 shows macrostructures of longitudinal cross sections of samples F 950-[1] , F 950-[2] and F 950-[3] .
- coarse acicular primary crystal Al 13 Fe 4 was distributed over the entire cross section.
- FIG. 5 shows the macrostructures of longitudinal sections of samples F 750-[2] , F 850-[2] , and F 950-[2] .
- samples F 750-[2] and F 850-[2] cooling and electromagnetic force application are performed from the solid-liquid two-phase state.
- FIG. 5 when an electromagnetic force is applied to a sample in a solid-liquid two-phase state, it has been clarified that the segregation of primary crystals as shown in FIG. 4 does not occur.
- the segregation of the primary crystal Al 13 Fe 4 is that the force F P represented by the formula (1) acts on the primary crystal Al 13 Fe 4 isolated in the molten metal, and the primary crystal Al 13 Fe 4 moves. It is not thought that it was formed by doing.
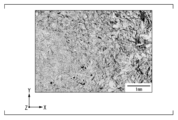
- FIG. 6A and 6B are X-ray CT images of sample F 950-[1] .
- the scanning directions are the X, Y and Z directions shown in the figure.
- the Z axis is the direction perpendicular to the longitudinal cross section of the sample
- the Y axis is the direction parallel to the longitudinal direction of the sample
- the X axis is the direction perpendicular to both the Y and Z axes (parallel to the radial direction of the sample). direction).
- FIG. 6A shows a cross-sectional image with the maximum area in each direction.
- the primary crystals of Al 13 Fe 4 looked like isolated needle crystals. However, by scanning images from each direction, it is clear that the primary crystal Al 13 Fe 4 grows from the surface in contact with the inner wall of the mullite tube and the graphite electrode (hereinafter also referred to as the “sample surface”) toward the center of the sample. became. A large number of coarse crystals that crossed the sample were also observed.
- FIG. 6B shows the results of stereoscopic observation of the sample. As is clear from the figure, as a result of three-dimensional observation, it was confirmed that the primary crystal Al 13 Fe 4 was plate-like.
- FIGS. 7 and 8 show X-ray CT images of F 950-[2] and F 950-[3] , respectively.
- the images shown in FIGS. 7A and 8A, 7B and 8B are similar to FIG.
- primary crystals of Al 13 Fe 4 grew from the entire sample surface toward the center in all samples.
- the number of primary crystals of Al 13 Fe 4 was large, the width and length of the crystals were reduced, and the morphology of the crystals changed from plate-like to sword-like.
- the primary crystal Al 13 Fe 4 was segregated in the surface layer of the sample. This tendency was particularly noticeable in sample F 950-[3] .
- FIG. 9 is a conceptual diagram showing an enlarged part of a cross section perpendicular to the Z-axis (see FIG. 6, etc.).
- reference numeral 100 indicates a mullite tube
- reference numeral 200 indicates a primary crystal.
- crystal nuclei of primary crystal Al 13 Fe 4 are first generated over the entire sample surface, and then the primary crystal Al 13 Fe 4 is not separated from the sample surface and is located at the center of the sample.
- sample F 950-[1] the primary crystal Al 13 Fe 4 has a wide crystal width and grows over a long distance toward the center of the sample.
- samples F 950-[2] and F 950-[3] a larger number of narrow crystals are generated from the sample surface and grow densely in a narrow range near the sample surface. This tendency is more pronounced in sample F 950-[3] .
- primary crystal Al 13 Fe 4 segregation is formed in the sample surface layer.
- the “surface layer portion” of the sample or the like means the region where the primary crystals are present (the surface of the sample and its vicinity) when the primary crystals are segregated. Also, the "inside” of a sample or the like means a portion other than the "surface layer portion”.
- the electromagnetic force affects the nucleation and growth of primary Al 13 Fe 4 .
- the primary crystal Al 13 Fe 4 may be refined by an increase in nucleation frequency due to electromagnetic force. Physical stimulation is generally known to promote nucleation.
- the primary Al 13 Fe 4 nucleated on the surface of the sample may have been affected by the electromagnetic force to make it difficult to grow toward the center of the sample.
- the electromagnetic force acts in one direction according to the theory of electromagnetic separation. Therefore, it is necessary to investigate why the effect of the electromagnetic force was observed over the entire sample surface.
- FIG. 10 shows the macrostructure in longitudinal and arbitrary cross sections of samples S 950-[1] , S 950-[2] , S 950-[3] .
- sample S 950-[1] the primary Si was irregularly dispersed in the sample, but in samples S 950-[2] and S 950-[3], it was clearly segregated at the edge of the cross section. .
- FIG. 10 shows the macrostructure in longitudinal and arbitrary cross sections of samples S 950-[1] , S 950-[2] , S 950-[3] .
- FIG. 11 shows the macrostructure in longitudinal and arbitrary cross sections of samples S 650-[2] , S 750-[2] , S 850-[2] . That is, the figure shows the relationship between the distribution of the primary crystal Si and the test temperature.
- the electromagnetic force is applied from the solid-liquid two-phase state, and in the other samples, from the liquid phase state.
- a comparison of the respective structures reveals that the segregation of primary Si is observed only in samples other than sample S650-[2] , that is, only when an electromagnetic force is applied from the liquid phase state.
- the influence of the electromagnetic force is basically the same as in the case of the primary crystal Al 13 Fe 4 .
- the electromagnetic force does not act on free primary crystal Al 13 Fe 4 or primary crystal Si, and affects their nucleation and crystal growth.
- an electromagnetic force is applied to an Al-10Fe alloy or an Al-25Si alloy in a complete liquid phase state (in other words, heated to a temperature equal to or higher than the temperature of the eutectic point and the temperature equal to or higher than the liquidus line).
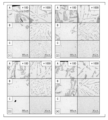
- FIG. 12 is an optical micrograph of samples S 950-[1] , S 950-[2] and S 950-[3] . As shown in the upper right illustration of FIG. 12, the observation regions were the surface layer portion A, the intermediate portion B and the central portion C of the longitudinal central cross section (cross section perpendicular to the longitudinal direction) of the sample.
- a circular region of radius (1/3) ⁇ r (r is the radius of the observation region) including the center of the observation region is defined as the central portion C
- a circular region of radius (2/3) ⁇ r A region excluding the central portion C was defined as an intermediate portion B
- a circular region having a radius of r, excluding the intermediate portion B and the central portion C was defined as a surface layer portion A.
- sample S 950-[1] primary crystal Si was observed in the entire region of the surface layer portion A, intermediate portion B, and central portion C.
- samples S 950-[2] and S 950-[3] primary crystal Si was observed only in the surface layer portion A microscopically.
- primary crystal Si was densely distributed on the surface of the sample. This is considered to be the result of growth in a narrow range including the sample surface without primary crystal Si being liberated from the sample surface.
- the cross-sectional shape of the primary crystal Si is rod-like, needle-like, or polygonal, and its size varies. In the surface layer portion A, coarse massive Si with one side exceeding 1 mm was also observed. This suggests the possibility that adjacent crystals coalesced during solidification.
- Sample S 950-[1] has a typical hypereutectic structure consisting of primary Si and eutectic, while samples S 950-[2] and S 950-[3] have intermediate B and central A eutectic or hypoeutectic structure was observed in a wide area such as part C. These textures closely resemble those modified by rapid coagulation or strontium (Sr) addition.
- FIG. 13 shows Si mapping by fluorescent X-rays of samples S 950-[2] and S 950-[3] .
- Si concentration 12.6 mass% Si
- FIG. 13 shows Si mapping by fluorescent X-rays of samples S 950-[2] and S 950-[3] .
- the intermediate portion B and the central portion C were homogeneous in composition.
- the concentration of Si is higher than the eutectic composition (12.6 mass% Si) shown in the equilibrium diagram. there were.
- Non-Patent Document 3 Kofler revealed that in organic eutectic systems, a perfect eutectic structure is formed from a supercooled liquid over a fairly wide compositional range. Scheil also demonstrated it in a metal eutectic system, and called such a composition region (a composition region where a complete eutectic structure is formed from a supercooled liquid) a coupled zone (Non-Patent Document 4, 5). It has been reported that in the coupled zone, each phase of the eutectic has an equal growth rate and the eutectic is regularly layered. For the hypereutectic Al—Si alloy system, coupled zones are shown as shown in FIG. 14 (Non-Patent Document 6).
- the primary Si is the eutectic leading phase (Non-Patent Document 7). Therefore, if the primary crystal Si is dispersed in the molten metal, the eutectic Si grows from the primary crystal Si without supercooling required for the nucleation of the eutectic during solidification. On the other hand, if a region where no primary crystal Si exists is formed in the molten metal, supercooling is required for the crystallization of the eutectic in that region. In samples S 950-[2] and S 950-[3] , primary crystal Si was segregated in surface layer portion A, and primary crystal Si was not observed in intermediate portion B and central portion C.
- a graphite electrode was produced.
- a graphite round bar with a length of 100 mm and a diameter of 20 mm was prepared and cut into two round bars with a length of 50 mm.
- a portion having a length of 30 mm was used as a threaded portion for connecting to the heating device.
- a sample fixing device was made.
- a mullite tube (length 600 mm, outer diameter 25 mm, inner diameter 20 mm) was cut to a length of 120 mm, and the sample prepared above was inserted into the mullite tube.
- a diamond cutter was used for cutting the mullite tube.
- both ends of the mullite tube were plugged with graphite electrodes.
- the portion of the graphite electrode where the threaded portion was not provided was inserted into the mullite tube.
- the mullite tube was then oriented vertically and the lower graphite electrode was bonded to the mullite tube with Aron ceramic.
- the graphite electrode on the upper side was movable up and down.
- each graphite electrode was connected to a stainless steel long nut to complete the sample fixing device. A clearance was provided in the vertical direction of the upper graphite electrode so that the upper graphite electrode could contact the sample even if the liquid level of the upper graphite electrode fell as the sample melted.
- the sample fixing device was connected to the DC power supply. Specifically, a graphite electrode was connected to a stainless steel rod via upper and lower long nuts. These stainless bars were then connected to a DC power supply.
- the sample fixing device was installed in an electric furnace, and the sample fixing device was heated so that the temperature of the sample reached 950°C. This dissolved the sample. The temperature of the sample was measured with a radiation thermometer.
- the sample fixing device was removed from the electric furnace, and an electric current was applied to the sample using the DC power supply.
- the lower graphite electrode was used as a positive electrode
- the upper graphite electrode was used as a negative electrode. In other words, the current flowed upward.
- the magnitude of the current was as shown in Table 2. After 10 minutes had passed since the current was started to flow through the sample, the DC power supply was turned off, and the sample was allowed to spontaneously coagulate.
- a sample for macrostructure observation was prepared. Specifically, the sample is taken out from the sample fixing device after the experiment, and the sample is measured in a longitudinal section (parallel to the longitudinal direction of the sample and a central axis in the longitudinal direction (passing through the center of the cross section perpendicular to the longitudinal direction). was cut in two at a cross-section through an axis parallel to ). A fine cutter was used for cutting. One of the cut samples was used as a sample for macrostructure observation.
- a sample for microstructure observation was prepared.
- the other cut sample was cut into four equal parts in the longitudinal direction.
- a fine cutter was used for cutting.
- the cut samples were numbered sequentially from the negative electrode side (1 to 4).
- the cross section of these samples on the positive electrode side was used as an observation surface.
- each sample was rough-polished with emery paper (#120 to #2000). Polishing was performed in order from the abrasive paper with the lowest particle size. Polishing with each abrasive paper was performed so as to be perpendicular to the previous grain size polishing marks until the previous polishing marks disappeared. A desktop polisher (Marumoto Struers S-5629) was used for polishing the samples. Then, the sample for microstructure observation was buffed and mirror-finished.
- macrostructural observation and microstructural observation were performed.
- macrostructure observation was performed by the following method. That is, the sample that had been subjected to rough polishing was read with a scanner, and the structure was visually observed.
- microstructure observation was performed by the following method. That is, observation was performed at 100 times and 1000 times using an optical microscope. Specifically, the observation surface was divided into a surface layer portion A, an intermediate portion B, and a central portion C in the same manner as in FIG. 12, and any region of each portion was observed at a magnification of 100 times. Further, the center of the 100-fold observation area was observed at 1000-fold magnification.
- FIG. 15 shows the macrostructures of the samples obtained by conducting experiments without current, applying a current of 80 A, and applying a current of 100 A, respectively. Under the condition of no electric current, primary crystal Si was observed uniformly throughout the sample. At 80A, the segregation of primary crystal Si to the surface layer was observed, and at 100A, the segregation of primary crystal Si to the surface layer was more remarkably confirmed. By comparing these three samples, it was confirmed that the segregation of the primary crystal Si to the surface layer portion can occur even by applying a DC current alone.
- Figures 16-18 show the microstructures of samples obtained by conducting experiments without current ( Figure 16), with a current of 80 A ( Figure 17), and with a current of 100 A ( Figure 18).
- Symbols A, B, and C in the drawing indicate a surface layer portion A, an intermediate portion B, and a central portion C, respectively.
- the numbers 1 to 4 indicate the numbers assigned to the four equally divided samples.
- Both the primary crystal Si and the eutectic Si were cooled while applying a DC current of 100 A compared to the sample cooled while applying a DC current of 100 A (normal solidification) and the sample cooled while applying a DC current of 80 A. had a finer organization.
- a DC current of 100 A normal solidification
- a DC current of 80 A normal solidification
- significant eutectic refinement is evident in the sample allowed to cool while applying 100A of direct current. From the above, it is presumed that there is a correlation between the segregation of primary crystal Si and the eutectic refinement.
- FIG. 19 shows the macrostructures of the samples obtained by applying a current of 150 A, applying a current of 200 A, applying a current of 250 A, and applying a current of 300 A, respectively.
- Al-10Fe alloy and Al-25Si alloy were used in the above experiments, but it is speculated that other types of hypereutectic Al-Fe alloys and hypereutectic Al-Si alloys exhibit similar behavior.
- the present inventor has conceived of the hypereutectic material and the method for producing the same described below.
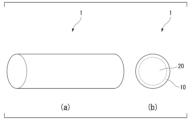
- FIG. 24(a) is a conceptual diagram showing the appearance of the hypereutectic material
- FIG. 24(b) is a conceptual diagram showing a cross section perpendicular to the longitudinal direction of the hypereutectic material.
- the hypereutectic material 1 includes a hypereutectic Al-Fe alloy or a hypereutectic Al-Si alloy.
- the hypereutectic material 1 consists of a hypereutectic Al—Fe alloy or a hypereutectic Al—Si alloy.
- a hypereutectic Al--Fe alloy contains 1.8% by mass or more and 36.5% by mass or less of Fe relative to the total mass of the alloy.
- a hypereutectic Al-Fe alloy is an Al-10Fe alloy.
- a hypereutectic Al—Si alloy contains Si in an amount of 12% by mass or more and less than 100% by mass with respect to the total mass of the alloy.
- a hypereutectic Al-Si alloy is an Al-25Si alloy.
- the shape of the hypereutectic material 1 is not particularly limited. Although it is cylindrical in FIG. 1, it can take any shape such as a square bar.
- the hypereutectic Al—Fe alloy or the hypereutectic Al—Si alloy by applying an electromagnetic force to the molten hypereutectic Al—Fe alloy or the hypereutectic Al—Si alloy (in the case of the hypereutectic Al—Si alloy, it is possible to apply only a current), Primary crystals of a hypereutectic Al—Fe alloy or a hypereutectic Al—Si alloy can be segregated in the surface layer portion 10 . As a result, the surface layer portion 10 of the hypereutectic material 1 can be given primary crystal characteristics. Moreover, when the primary crystal is unnecessary, the primary crystal can be easily removed. For example, since primary crystal Si is excellent in sliding resistance and wear resistance, the hypereutectic material 1 made of hypereutectic Al—Si alloy is applied to devices (for example, pistons) that require these characteristics. good too.
- the primary crystal of the hypereutectic Al—Fe alloy or the hypereutectic Al—Si alloy grows from the surface of the hypereutectic material 1 toward the center of the hypereutectic material 1.
- the shape of the primary crystal of the hypereutectic Al—Fe alloy or the hypereutectic Al—Si alloy is, for example, a sword-like, rod-like, needle-like, or polygonal shape, and the surface layer portion 10 (without applying an electromagnetic force to the molten metal) are finely and densely distributed).
- the eutectic of the hypereutectic Al-Fe alloy or the hypereutectic Al-Si alloy is distributed.
- an electromagnetic force to the molten hypereutectic Al—Fe alloy or the hypereutectic Al—Si alloy (in the case of the hypereutectic Al—Si alloy, it is possible to apply only a current)
- a eutectic of a hypereutectic Al—Fe alloy or a hypereutectic Al—Si alloy can be distributed in the interior 20 .
- the eutectic is preferably as fine as possible.
- the hypereutectic Al—Fe alloy or the hypereutectic Al—Si alloy was manufactured by the same manufacturing method as the method for manufacturing the hypereutectic material except that no electromagnetic force was applied to the molten metal. It is preferred that the eutectic is reduced compared to the hypereutectic material. Thereby, ductility and plastic deformability can be imparted to the hypereutectic material 1 .
- the metal structure of the hypereutectic material 1 can be identified by macrostructure observation, microstructure observation, and X-ray CT observation, as described above.
- the opening of the production container is sealed with electrodes, and each electrode is connected to a DC power supply.
- the hypereutectic Al—Fe alloy or the hypereutectic Al—Si alloy is heated to a temperature above the eutectic point and above the liquidus line. That is, the hypereutectic Al-Fe alloy or the hypereutectic Al-Si alloy is heated (heated process).
- the hypereutectic material 1 according to the present embodiment can be manufactured.
- the specific magnitude of the electromagnetic force or current applied to the hypereutectic Al--Fe alloy or hypereutectic Al--Si alloy depends on the composition of the hyper-eutectic Al--Fe alloy or hyper-eutectic Al--Si alloy. expected to fluctuate. Therefore, by preparing a test piece of a hypereutectic Al—Fe alloy or a hypereutectic Al—Si alloy and applying the method for producing a hypereutectic material according to the present embodiment to this test piece, the primary crystal is A specific magnitude of the electromagnetic force (or current) segregated in the surface layer portion may be determined. As the electromagnetic force or electric current increases, segregation of the primary crystal and refinement of the eutectic tend to occur remarkably.
- a specific example of the magnitude of the electromagnetic force is an electromagnetic force with an electromagnetic force density of 51.5 kN/m 3 or more and 260 kN/m 3 or less.
- the electromagnetic force density means the electromagnetic force acting per unit volume of the hypereutectic Al—Fe alloy or the hypereutectic Al—Si alloy. If the electromagnetic force density is less than 51.5 kN/m 3 , primary crystal segregation may not occur. If the electromagnetic force density is greater than 260 kN/m 3 , the electrodes will heat up and may adversely affect the metallographic structure of the hypereutectic material.
- the magnitude of the current density may be 255 kA/m 2 or more and 637 kA/m 2 or less. Note that the current density means the current flowing per unit area of a cross section perpendicular to the direction in which the current flows.
- the hypereutectic material 1 can be obtained simply by applying an electromagnetic force (or current) to the molten hypereutectic Al—Fe alloy or hypereutectic Al—Si alloy. can be produced, the hypereutectic material 1 can be produced easily.
- the hypereutectic material 1 can be manufactured by applying only a current, so that the manufacturing apparatus can be simplified.
- each alloy ingot was cut into a cylindrical shape with a diameter of 18 mm and a length of 90 mm to prepare an experimental sample. Then, the sample was inserted into a mullite tube having an inner diameter of 20 mm and a length of 120 mm, and both ends of the mullite tube were closed with graphite electrodes. The mullite tube was oriented vertically so that the positive graphite electrode was positioned on the bottom (vertical orientation). The graphite electrode on the positive electrode side was fixed to the mullite tube with a ceramic adhesive, and the graphite electrode on the negative electrode side was movable up and down so as to make sufficient contact with the molten metal of each alloy.
- the copper plate and each graphite electrode were fastened via a copper clamp, and the sample was left still in an electric furnace in that state.
- the copper plate was connected to a cabtyre cable outside the electric furnace, and the copper plate was connected to a DC stabilized power supply (PR10-300 Matsusada Precision) via the cabtyre cable.
- the sample is removed from the mullite tube, and the sample is subjected to macrostructural observation (visual observation. Specifically, the cross section of the sample is read with a scanner, and the resulting image is visually observed. ), and subjected to observation by optical microscope tissue observation and X-ray computed tomography (X-ray CT).
- X-ray CT X-ray computed tomography
- the hypereutectic Al-Fe alloy by applying an electromagnetic force (or current) to the molten hypereutectic Al-Fe alloy or hypereutectic Al-Si alloy, the hypereutectic Al-Fe alloy Alternatively, it was found that the primary crystal of the hypereutectic Al—Si alloy can be segregated and the eutectic can be distributed inside the hypereutectic material. That is, it became clear that the hypereutectic material 1 according to this embodiment can be produced.
Landscapes
- Chemical & Material Sciences (AREA)
- Engineering & Computer Science (AREA)
- Mechanical Engineering (AREA)
- Materials Engineering (AREA)
- Metallurgy (AREA)
- Organic Chemistry (AREA)
- Physics & Mathematics (AREA)
- Thermal Sciences (AREA)
- Crystallography & Structural Chemistry (AREA)
- Crystals, And After-Treatments Of Crystals (AREA)
Priority Applications (2)
| Application Number | Priority Date | Filing Date | Title |
|---|---|---|---|
| JP2023552974A JPWO2023058766A1 (https=) | 2021-10-07 | 2022-10-07 | |
| JP2025114755A JP2025138863A (ja) | 2021-10-07 | 2025-07-07 | 過共晶材料の製造方法 |
Applications Claiming Priority (2)
| Application Number | Priority Date | Filing Date | Title |
|---|---|---|---|
| US202163253131P | 2021-10-07 | 2021-10-07 | |
| US63/253,131 | 2021-10-07 |
Publications (1)
| Publication Number | Publication Date |
|---|---|
| WO2023058766A1 true WO2023058766A1 (ja) | 2023-04-13 |
Family
ID=85804392
Family Applications (1)
| Application Number | Title | Priority Date | Filing Date |
|---|---|---|---|
| PCT/JP2022/037717 Ceased WO2023058766A1 (ja) | 2021-10-07 | 2022-10-07 | 過共晶材料及びその製造方法 |
Country Status (2)
| Country | Link |
|---|---|
| JP (2) | JPWO2023058766A1 (https=) |
| WO (1) | WO2023058766A1 (https=) |
Citations (6)
| Publication number | Priority date | Publication date | Assignee | Title |
|---|---|---|---|---|
| JPH08323461A (ja) * | 1995-06-02 | 1996-12-10 | Asahi Tec Corp | Al−Si系過共晶合金製成形品の製造方法 |
| JPH11285793A (ja) * | 1998-03-31 | 1999-10-19 | Honda Motor Co Ltd | Al合金の攪拌連続鋳造法 |
| JP2010121164A (ja) * | 2008-11-19 | 2010-06-03 | Nippon Light Metal Co Ltd | 成形性に優れたアルミニウム合金板およびその製造方法 |
| JP2015205340A (ja) * | 2014-04-23 | 2015-11-19 | 株式会社Lafジャパン | 合金の析出物微細化方法及びこれに用いる析出物微細化装置 |
| CN210996367U (zh) * | 2019-12-09 | 2020-07-14 | 泰州市金鹰精密铸造有限公司 | 一种过共晶铝硅合金连铸过程中的熔体处理装置 |
| KR20210111534A (ko) * | 2020-03-03 | 2021-09-13 | 한국생산기술연구원 | 다중 가변 전극 주조 장치 및 다중 가변 전극 주조 방법 |
-
2022
- 2022-10-07 WO PCT/JP2022/037717 patent/WO2023058766A1/ja not_active Ceased
- 2022-10-07 JP JP2023552974A patent/JPWO2023058766A1/ja active Pending
-
2025
- 2025-07-07 JP JP2025114755A patent/JP2025138863A/ja active Pending
Patent Citations (6)
| Publication number | Priority date | Publication date | Assignee | Title |
|---|---|---|---|---|
| JPH08323461A (ja) * | 1995-06-02 | 1996-12-10 | Asahi Tec Corp | Al−Si系過共晶合金製成形品の製造方法 |
| JPH11285793A (ja) * | 1998-03-31 | 1999-10-19 | Honda Motor Co Ltd | Al合金の攪拌連続鋳造法 |
| JP2010121164A (ja) * | 2008-11-19 | 2010-06-03 | Nippon Light Metal Co Ltd | 成形性に優れたアルミニウム合金板およびその製造方法 |
| JP2015205340A (ja) * | 2014-04-23 | 2015-11-19 | 株式会社Lafジャパン | 合金の析出物微細化方法及びこれに用いる析出物微細化装置 |
| CN210996367U (zh) * | 2019-12-09 | 2020-07-14 | 泰州市金鹰精密铸造有限公司 | 一种过共晶铝硅合金连铸过程中的熔体处理装置 |
| KR20210111534A (ko) * | 2020-03-03 | 2021-09-13 | 한국생산기술연구원 | 다중 가변 전극 주조 장치 및 다중 가변 전극 주조 방법 |
Non-Patent Citations (1)
| Title |
|---|
| KOSUGE HARUMI: "Intermetallic compounds in Al-Fe alloys", MEETING OF THE JAPAN INSTITUTE OF LIGHT METALS, vol. 30, no. 4, 1 January 1980 (1980-01-01), pages 217 - 226, XP093055399 * |
Also Published As
| Publication number | Publication date |
|---|---|
| JPWO2023058766A1 (https=) | 2023-04-13 |
| JP2025138863A (ja) | 2025-09-25 |
Similar Documents
| Publication | Publication Date | Title |
|---|---|---|
| Dahle et al. | Eutectic modification and microstructure development in Al–Si Alloys | |
| Tash et al. | Effect of metallurgical parameters on the hardness and microstructural characterization of as-cast and heat-treated 356 and 319 aluminum alloys | |
| Knipling et al. | Nucleation and precipitation strengthening in dilute Al-Ti and Al-Zr alloys | |
| Sun et al. | Eutectic microstructures in dilute Al-Ce and Al-Co alloys | |
| Patakham et al. | Modification mechanism of eutectic silicon in Al–6Si–0.3 Mg alloy with scandium | |
| Jung et al. | Mechanism of ultrasound-induced microstructure modification in Al–Zr alloys | |
| Dobrzański et al. | The effect of cast Al-Si-Cu alloy solidification rate on alloy thermal characteristics | |
| Dobrzañski et al. | The effect of cooling rate on microstructure and mechanical properties of AC AlSi9Cu alloy | |
| Samuel et al. | A metallographic study of grain refining of Sr-modified 356 alloy | |
| Samuel et al. | New method of eutectic silicon modification in cast Al–Si alloys | |
| Xu et al. | In-situ X-radiographic study of nucleation and growth behaviour of primary silicon particles during solidification of a hypereutectic Al-Si alloy | |
| Hu et al. | Solidification behavior, microstructure and silicon twinning of Al-10Si alloys with ytterbium addition | |
| Bagaber et al. | The effect of lanthanum addition on the microstructure and mechanical properties of A390 aluminium alloy | |
| Shen et al. | Effects of novel Mg-RE master alloys prepared via ultrasonic assisted cast on the microstructure and properties of Mg-Gd-Y alloy | |
| Gao et al. | A new Al–Fe–P master alloy designed for application in low pressure casting and its refinement performance on primary Si in A390 alloy at low temperature | |
| Guldberg et al. | Microstructure and crystallographic orientation relationship in directionally solidified Mg–Mg17Al12-eutectic | |
| Zhao et al. | In-situ synchrotron X-ray radiography study of primary Fe-rich phases growth in Al-Fe (Cu) alloys | |
| Heiberg et al. | Investigation of the microstructure of the Al–Si eutectic in binary aluminium–7 wt% silicon alloys by electron backscatter diffraction (EBSD) | |
| Farahany et al. | Flake-fibrous transition of silicon in near-eutectic Al-11.7 Si-1.8 Cu-0.8 Zn-0.6 Fe-0.3 Mg alloy treated with combined effect of bismuth and strontium | |
| WO2023058766A1 (ja) | 過共晶材料及びその製造方法 | |
| Piątkowski | Influence of overheating temperature on the shape of primary silicon crystals in hypereutectic Al-Si cast alloys | |
| Liu et al. | Crystal orientation and grain alignment in a hypoeutectic Mn–Sb alloy under high magnetic field conditions | |
| Li et al. | A microstructural and crystallographic investigation of the precipitation behaviour of a primary Al3Zr phase under a high magnetic field | |
| Li et al. | Influence of Sc on microstructure and mechanical properties of Al–Si–Mg–Cu–Zr alloy | |
| Ahmad et al. | Impact of Y and Er on recrystallization behavior and mechanical properties of AA7085/Al2O3+ ZrB2 composites |
Legal Events
| Date | Code | Title | Description |
|---|---|---|---|
| 121 | Ep: the epo has been informed by wipo that ep was designated in this application |
Ref document number: 22878633 Country of ref document: EP Kind code of ref document: A1 |
|
| WWE | Wipo information: entry into national phase |
Ref document number: 2023552974 Country of ref document: JP |
|
| NENP | Non-entry into the national phase |
Ref country code: DE |
|
| 32PN | Ep: public notification in the ep bulletin as address of the adressee cannot be established |
Free format text: NOTING OF LOSS OF RIGHTS PURSUANT TO RULE 112(1) EPC (EPO FORM 1205A DATED 17/07/2024) |
|
| 122 | Ep: pct application non-entry in european phase |
Ref document number: 22878633 Country of ref document: EP Kind code of ref document: A1 |