WO2022270179A1 - Information processing device, information processing method, and program - Google Patents
Information processing device, information processing method, and program Download PDFInfo
- Publication number
- WO2022270179A1 WO2022270179A1 PCT/JP2022/020253 JP2022020253W WO2022270179A1 WO 2022270179 A1 WO2022270179 A1 WO 2022270179A1 JP 2022020253 W JP2022020253 W JP 2022020253W WO 2022270179 A1 WO2022270179 A1 WO 2022270179A1
- Authority
- WO
- WIPO (PCT)
- Prior art keywords
- cell
- information processing
- differentiation
- cells
- success
- Prior art date
Links
- 230000010365 information processing Effects 0.000 title claims abstract description 57
- 238000003672 processing method Methods 0.000 title claims abstract description 9
- 238000003384 imaging method Methods 0.000 claims abstract description 63
- 238000012545 processing Methods 0.000 claims abstract description 47
- 230000024245 cell differentiation Effects 0.000 claims abstract description 36
- 239000000284 extract Substances 0.000 claims abstract description 13
- 210000004027 cell Anatomy 0.000 claims description 147
- 230000004069 differentiation Effects 0.000 claims description 61
- 210000003855 cell nucleus Anatomy 0.000 claims description 35
- 238000000034 method Methods 0.000 claims description 33
- 210000000805 cytoplasm Anatomy 0.000 claims description 9
- 210000000130 stem cell Anatomy 0.000 claims description 7
- 238000000605 extraction Methods 0.000 description 34
- 238000003860 storage Methods 0.000 description 25
- 230000006698 induction Effects 0.000 description 23
- 210000001778 pluripotent stem cell Anatomy 0.000 description 23
- 238000009826 distribution Methods 0.000 description 14
- 238000012986 modification Methods 0.000 description 14
- 230000004048 modification Effects 0.000 description 14
- 238000010586 diagram Methods 0.000 description 8
- 238000005516 engineering process Methods 0.000 description 8
- 230000006870 function Effects 0.000 description 8
- 239000002609 medium Substances 0.000 description 8
- 239000003814 drug Substances 0.000 description 7
- 230000001172 regenerating effect Effects 0.000 description 6
- 210000003981 ectoderm Anatomy 0.000 description 5
- 210000001900 endoderm Anatomy 0.000 description 5
- 230000014509 gene expression Effects 0.000 description 5
- 210000003716 mesoderm Anatomy 0.000 description 5
- 101150050780 nodal gene Proteins 0.000 description 5
- 238000005286 illumination Methods 0.000 description 4
- 230000035945 sensitivity Effects 0.000 description 4
- 238000004891 communication Methods 0.000 description 3
- 239000003112 inhibitor Substances 0.000 description 3
- 210000002490 intestinal epithelial cell Anatomy 0.000 description 3
- 238000004519 manufacturing process Methods 0.000 description 3
- 210000004165 myocardium Anatomy 0.000 description 3
- 238000012360 testing method Methods 0.000 description 3
- 238000004113 cell culture Methods 0.000 description 2
- 230000003203 everyday effect Effects 0.000 description 2
- 210000001654 germ layer Anatomy 0.000 description 2
- 210000005260 human cell Anatomy 0.000 description 2
- 239000000411 inducer Substances 0.000 description 2
- 230000001939 inductive effect Effects 0.000 description 2
- 239000004065 semiconductor Substances 0.000 description 2
- 210000001082 somatic cell Anatomy 0.000 description 2
- 238000010186 staining Methods 0.000 description 2
- 108010059616 Activins Proteins 0.000 description 1
- 108091093088 Amplicon Proteins 0.000 description 1
- 108010049955 Bone Morphogenetic Protein 4 Proteins 0.000 description 1
- 102100024505 Bone morphogenetic protein 4 Human genes 0.000 description 1
- 108090000695 Cytokines Proteins 0.000 description 1
- 102000004127 Cytokines Human genes 0.000 description 1
- 102000003974 Fibroblast growth factor 2 Human genes 0.000 description 1
- 108090000379 Fibroblast growth factor 2 Proteins 0.000 description 1
- 102100026818 Inhibin beta E chain Human genes 0.000 description 1
- 108700021430 Kruppel-Like Factor 4 Proteins 0.000 description 1
- 101710135898 Myc proto-oncogene protein Proteins 0.000 description 1
- 102100038895 Myc proto-oncogene protein Human genes 0.000 description 1
- 101100247004 Rattus norvegicus Qsox1 gene Proteins 0.000 description 1
- 101150086694 SLC22A3 gene Proteins 0.000 description 1
- 101710150448 Transcriptional regulator Myc Proteins 0.000 description 1
- 238000010521 absorption reaction Methods 0.000 description 1
- 239000000488 activin Substances 0.000 description 1
- 238000004115 adherent culture Methods 0.000 description 1
- 238000013528 artificial neural network Methods 0.000 description 1
- 230000005540 biological transmission Effects 0.000 description 1
- 230000010261 cell growth Effects 0.000 description 1
- 239000003153 chemical reaction reagent Substances 0.000 description 1
- 230000000295 complement effect Effects 0.000 description 1
- 238000013527 convolutional neural network Methods 0.000 description 1
- 238000012258 culturing Methods 0.000 description 1
- 230000002950 deficient Effects 0.000 description 1
- 238000009795 derivation Methods 0.000 description 1
- 238000011161 development Methods 0.000 description 1
- 230000018109 developmental process Effects 0.000 description 1
- 239000006185 dispersion Substances 0.000 description 1
- 229940079593 drug Drugs 0.000 description 1
- 238000007876 drug discovery Methods 0.000 description 1
- 238000011156 evaluation Methods 0.000 description 1
- 239000012737 fresh medium Substances 0.000 description 1
- 230000002068 genetic effect Effects 0.000 description 1
- 239000003102 growth factor Substances 0.000 description 1
- 239000001963 growth medium Substances 0.000 description 1
- 238000011534 incubation Methods 0.000 description 1
- 238000010801 machine learning Methods 0.000 description 1
- 239000003550 marker Substances 0.000 description 1
- 210000002901 mesenchymal stem cell Anatomy 0.000 description 1
- 229910044991 metal oxide Inorganic materials 0.000 description 1
- 150000004706 metal oxides Chemical class 0.000 description 1
- 238000000491 multivariate analysis Methods 0.000 description 1
- 210000004940 nucleus Anatomy 0.000 description 1
- 239000013612 plasmid Substances 0.000 description 1
- 230000003389 potentiating effect Effects 0.000 description 1
- 108090000623 proteins and genes Proteins 0.000 description 1
- 230000008672 reprogramming Effects 0.000 description 1
- 230000028327 secretion Effects 0.000 description 1
- 230000011218 segmentation Effects 0.000 description 1
- 239000007787 solid Substances 0.000 description 1
- 238000004114 suspension culture Methods 0.000 description 1
- 210000001519 tissue Anatomy 0.000 description 1
Images


Classifications
-
- G—PHYSICS
- G06—COMPUTING; CALCULATING OR COUNTING
- G06V—IMAGE OR VIDEO RECOGNITION OR UNDERSTANDING
- G06V20/00—Scenes; Scene-specific elements
- G06V20/60—Type of objects
- G06V20/69—Microscopic objects, e.g. biological cells or cellular parts
- G06V20/695—Preprocessing, e.g. image segmentation
-
- C—CHEMISTRY; METALLURGY
- C12—BIOCHEMISTRY; BEER; SPIRITS; WINE; VINEGAR; MICROBIOLOGY; ENZYMOLOGY; MUTATION OR GENETIC ENGINEERING
- C12M—APPARATUS FOR ENZYMOLOGY OR MICROBIOLOGY; APPARATUS FOR CULTURING MICROORGANISMS FOR PRODUCING BIOMASS, FOR GROWING CELLS OR FOR OBTAINING FERMENTATION OR METABOLIC PRODUCTS, i.e. BIOREACTORS OR FERMENTERS
- C12M1/00—Apparatus for enzymology or microbiology
- C12M1/34—Measuring or testing with condition measuring or sensing means, e.g. colony counters
-
- C—CHEMISTRY; METALLURGY
- C12—BIOCHEMISTRY; BEER; SPIRITS; WINE; VINEGAR; MICROBIOLOGY; ENZYMOLOGY; MUTATION OR GENETIC ENGINEERING
- C12M—APPARATUS FOR ENZYMOLOGY OR MICROBIOLOGY; APPARATUS FOR CULTURING MICROORGANISMS FOR PRODUCING BIOMASS, FOR GROWING CELLS OR FOR OBTAINING FERMENTATION OR METABOLIC PRODUCTS, i.e. BIOREACTORS OR FERMENTERS
- C12M3/00—Tissue, human, animal or plant cell, or virus culture apparatus
-
- C—CHEMISTRY; METALLURGY
- C12—BIOCHEMISTRY; BEER; SPIRITS; WINE; VINEGAR; MICROBIOLOGY; ENZYMOLOGY; MUTATION OR GENETIC ENGINEERING
- C12M—APPARATUS FOR ENZYMOLOGY OR MICROBIOLOGY; APPARATUS FOR CULTURING MICROORGANISMS FOR PRODUCING BIOMASS, FOR GROWING CELLS OR FOR OBTAINING FERMENTATION OR METABOLIC PRODUCTS, i.e. BIOREACTORS OR FERMENTERS
- C12M41/00—Means for regulation, monitoring, measurement or control, e.g. flow regulation
- C12M41/46—Means for regulation, monitoring, measurement or control, e.g. flow regulation of cellular or enzymatic activity or functionality, e.g. cell viability
-
- G—PHYSICS
- G01—MEASURING; TESTING
- G01N—INVESTIGATING OR ANALYSING MATERIALS BY DETERMINING THEIR CHEMICAL OR PHYSICAL PROPERTIES
- G01N33/00—Investigating or analysing materials by specific methods not covered by groups G01N1/00 - G01N31/00
- G01N33/48—Biological material, e.g. blood, urine; Haemocytometers
- G01N33/483—Physical analysis of biological material
-
- G—PHYSICS
- G06—COMPUTING; CALCULATING OR COUNTING
- G06V—IMAGE OR VIDEO RECOGNITION OR UNDERSTANDING
- G06V10/00—Arrangements for image or video recognition or understanding
- G06V10/70—Arrangements for image or video recognition or understanding using pattern recognition or machine learning
- G06V10/77—Processing image or video features in feature spaces; using data integration or data reduction, e.g. principal component analysis [PCA] or independent component analysis [ICA] or self-organising maps [SOM]; Blind source separation
- G06V10/774—Generating sets of training patterns; Bootstrap methods, e.g. bagging or boosting
-
- G—PHYSICS
- G06—COMPUTING; CALCULATING OR COUNTING
- G06V—IMAGE OR VIDEO RECOGNITION OR UNDERSTANDING
- G06V20/00—Scenes; Scene-specific elements
- G06V20/60—Type of objects
- G06V20/69—Microscopic objects, e.g. biological cells or cellular parts
- G06V20/698—Matching; Classification
-
- G—PHYSICS
- G16—INFORMATION AND COMMUNICATION TECHNOLOGY [ICT] SPECIALLY ADAPTED FOR SPECIFIC APPLICATION FIELDS
- G16B—BIOINFORMATICS, i.e. INFORMATION AND COMMUNICATION TECHNOLOGY [ICT] SPECIALLY ADAPTED FOR GENETIC OR PROTEIN-RELATED DATA PROCESSING IN COMPUTATIONAL MOLECULAR BIOLOGY
- G16B20/00—ICT specially adapted for functional genomics or proteomics, e.g. genotype-phenotype associations
- G16B20/20—Allele or variant detection, e.g. single nucleotide polymorphism [SNP] detection
Definitions
- the technology of the present disclosure relates to an information processing device, an information processing method, and a program.
- Pluripotent stem cells such as iPS (induced pluripotent stem) cells and ES (embryonic stem) cells are cells that potentially have the ability to differentiate into various tissues in the body, and all of endoderm, mesoderm, and ectoderm. can be differentiated into Thus, the ability of a cell to differentiate into different cell types is called differentiation potential.
- pluripotent stem cells have different differentiation potentials depending on clones, and in some cases, cannot be differentiated into specific cells. Such heterogeneity in differentiation potency becomes apparent only after a process of inducing differentiation into pluripotent stem cells.
- differentiated cells such as endoderm, mesoderm, and ectoderm (hereinafter referred to as differentiated cells).
- differentiated cells such as endoderm, mesoderm, and ectoderm
- heterogeneity in the differentiation potential of pluripotent stem cells is one of the factors that significantly reduce productivity. Therefore, if the success or failure of differentiation of stem cells such as pluripotent stem cells can be predicted at a stage before induction of differentiation, it is considered possible to improve the productivity and quality of regenerative medicine products.
- human cell-derived intestinal epithelial cells are drug discovery support products for evaluating the absorption of drugs. It takes about 1 to 2 months to produce intestinal epithelial cells derived from human cells, and the cost of inducing differentiation from human iPS cells to intestinal epithelial cells is high. It is important to detect and not to introduce the detected defective products to the next process.
- Patent Document 1 discloses a technique for estimating the differentiation potential of pluripotent stem cells before the pluripotent stem cells are differentiated into specific differentiated cells by induction of differentiation. Specifically, in Patent Document 1, cell information indicating the state of cells from the generation of pluripotent stem cells until the pluripotent stem cells differentiate into specific differentiated cells by differentiation induction, and methods for obtaining differentiated cells Acquisition of process history information indicating the history of treatment steps, and derivation of differentiation potential information indicating the differentiation potential of pluripotent stem cells based on the obtained cell information and process history information are disclosed.
- Cell information includes appearance information, gene information, secretion information, donor information, and the like.
- the process history information includes operator information, equipment information, medium and reagent identification information, environment information, and the like.
- the technique described in Patent Literature 1 requires a variety of information in order to predict the success or failure of differentiation, so development of a simpler prediction method is desired.
- the technology of the present disclosure aims to provide an information processing device, an information processing method, and a program that make it possible to easily predict the success or failure of cell differentiation.
- An information processing apparatus of the present disclosure is an information processing apparatus that predicts success or failure of cell differentiation based on an imaged image of a cell population cultured in a culture vessel, and includes at least one processor, wherein the processor captures By performing image processing on the image, a feature quantity based on the appearance of the cell is extracted, and the success or failure of cell differentiation is predicted based on the extracted feature quantity.
- the processor preferably predicts the success or failure of cell differentiation based only on feature values based on cell appearance.
- the processor preferably detects cell nuclei from at least one captured image and extracts information about the cell nuclei as feature quantities.
- the feature quantity preferably includes the number of cells corresponding to the number of cell nuclei, the area of the cell nuclei, the area ratio of the cell nuclei and the cytoplasm, or the cell occupied area ratio in the culture vessel.
- the feature quantity includes the rate of increase in the number of cells calculated based on a plurality of captured images captured at different times.
- the processor detects cell nuclei from the captured image using a learned model that has been machine-learned using fluorescent images of stained cell nuclei as teacher data.
- the processor predict success or failure of cell differentiation for each area, using each of a plurality of area images obtained by imaging the entire culture vessel divided into a plurality of areas as a captured image.
- the processor calculates the percentage of the area of the culture area that is successfully differentiated based on the results of predicting the success or failure of cell differentiation for each area.
- the cells are preferably stem cells.
- Stem cells are preferably in an undifferentiated state.
- the information processing method of the present disclosure is an information processing method for predicting the success or failure of cell differentiation based on a captured image of a cell population cultured in a culture vessel, wherein the captured image is subjected to image processing to determine the appearance of the cell. and predicting success or failure of cell differentiation based on the extracted feature amount.
- the program of the present disclosure is a program that causes a computer to execute a process of predicting the success or failure of cell differentiation based on an image obtained by imaging a cell population cultured in a culture vessel, wherein the captured image is image-processed to A computer is made to execute processing including extracting feature amounts based on the appearance of cells and predicting success or failure of cell differentiation based on the extracted feature amounts.
- FIG. 1 is a schematic diagram showing an example of a configuration of a microscope observation system; FIG. It is a figure which shows an example of the imaging target range. It is a block diagram which shows an example of an internal configuration of an information processing apparatus. It is a block diagram which shows an example of the functional structure of an information processing apparatus. It is a figure which shows an example of the process by a process part. It is a figure which shows an example of the process by a feature-value extraction part. It is a figure which shows an example of the determination method of a criterion. It is a figure which shows an example of a ROC curve. It is a flowchart which shows an example of the flow of a differentiation prediction process.
- FIG. 4 is a block diagram showing an example of a configuration of a learning section
- FIG. FIG. 2 is a diagram showing an example of steps performed to obtain differentiated cells from pluripotent stem cells. It is a figure which shows an example of the process which concerns on a 1st modification. It is a figure which shows an example of the process concerning a 2nd modification. It is a figure which shows an example of the feature-value extraction process which concerns on a 2nd modification. It is a figure which shows an example of the feature-value extraction process which concerns on a 3rd modification.
- FIG. 13 is a diagram showing a display example of a prediction result according to the third modified example; FIG.
- FIG. 4 is a diagram showing an example of the relationship between various feature values immediately before induction of differentiation and AUC, sensitivity, and specificity.
- 2 is a graph illustrating the frequency distribution of confluency before and after induction of differentiation.
- 2 is a graph illustrating the frequency distribution of confluency before and after induction of differentiation.
- FIG. 4 is a diagram illustrating the relationship between the Nodal gene expression level and the nuclear area when iPS cells are induced to differentiate into myocardium.
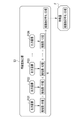
- the microscope observation system 2 is composed of an information processing device 10 and a microscope device 20 .
- the information processing device 10 is, for example, a desktop personal computer.
- a display 11 , a keyboard 12 , a mouse 13 and the like are connected to the information processing device 10 .
- the keyboard 12 and mouse 13 constitute an input device 14 for the user to enter information.
- the input device 14 also includes a touch panel and the like.
- the microscope device 20 includes a mounting section 21, a light source 22, an imaging device 23, and a driving section 24.
- the microscope device 20 is a phase-contrast microscope or a bright-field microscope.
- a culture vessel 25 for culturing cells 30 is mounted on the mounting portion 21 .
- the culture container 25 is, for example, a flask.
- Cells 30 are cultured using medium 33 filled in culture vessel 25 .
- the cells 30 are undifferentiated pluripotent stem cells such as iPS cells and ES cells.
- the culture container 25 is not limited to a flask, and may be a Petri dish, a dish, a well plate, or the like.
- the light source 22 and the imaging device 23 are held by an arm 26.
- the mounting section 21 is arranged between the light source 22 and the imaging device 23 .
- the light source 22 is arranged above the culture container 25 mounted on the mounting portion 21 .
- the imaging device 23 is arranged below the mounting section 21 and at a position facing the light source 22 .
- the light source 22 emits illumination light L toward the culture container 25 .
- the emission direction of the illumination light L will be referred to as the Z direction
- one direction orthogonal to the Z direction will be referred to as the X direction
- the Z direction and the direction orthogonal to the X direction will be referred to as the Y direction.
- the imaging device 23 is, for example, a CMOS (Complementary Metal-Oxide Semiconductor) image sensor.
- the imaging device 23 may be an image sensor provided with a color filter, or may be a monochrome image sensor.
- the imaging device 23 captures an image of a plurality of cells 30 (also referred to as a cell population 30A) irradiated with the illumination light L from the light source 22, and outputs the captured image obtained by imaging to the information processing device 10 as an input image PI. do.
- the drive unit 24 is connected to the imaging device 23 and moves the imaging device 23 in two-dimensional directions.
- the light source 22 moves as the imaging device 23 moves.
- the drive unit 24 is an XY stage that moves the imaging device 23 in the X and Y directions.
- the information processing device 10 comprehensively controls the operations of the light source 22, the imaging device 23, and the driving section 24. As shown in FIG. 2 as an example, the information processing apparatus 10 sequentially changes the imaging target range IR within the imaging region R corresponding to the entire culture container 25 by controlling the driving unit 24, and The cell population 30A is imaged for each IR range.
- the imaging target range IR is an area that is imaged by the imaging device 23 in one imaging operation.
- the imaging region R is divided into N imaging target ranges IR. For example, N is thousands. That is, the microscope device 20 outputs each of a plurality of area images obtained by dividing the entire culture container 25 into a plurality of areas and capturing the images as the input image PI to the information processing device 10 .
- the imaging target range IR is an example of the “area” according to the technology of the present disclosure.
- the input image PI is an example of a “captured image” and an “area image” according to the technology of the present disclosure.
- the computer that configures the information processing apparatus 10 includes a storage device 40, a memory 41, a CPU (Central Processing Unit) 42, a communication section 43, a display 11, and an input device 14. These are interconnected via bus lines 46 .
- a storage device 40 a memory 41, a CPU (Central Processing Unit) 42, a communication section 43, a display 11, and an input device 14. These are interconnected via bus lines 46 .
- CPU Central Processing Unit
- the storage device 40 is a hard disk drive built into the computer that constitutes the information processing apparatus 10 or connected via a cable or network. Also, the storage device 40 may be a disk array in which a plurality of hard disk drives are connected. The storage device 40 stores a control program such as an operating system, various application programs, various data associated with these programs, and the like. A solid state drive may be used instead of the hard disk drive.
- the memory 41 is a work memory for the CPU 42 to execute processing.
- the CPU 42 loads a program stored in the storage device 40 into the memory 41 and executes processing according to the program, thereby comprehensively controlling each section of the computer.
- the communication unit 43 is a network interface that controls transmission of various information via a network such as a LAN (Local Area Network).
- the display 11 displays various screens.
- a computer that configures the information processing apparatus 10 receives input of operation instructions from the input device 14 through various screens.
- the information processing device 10 controls the microscope device 20 to perform so-called time-lapse imaging, in which the imaging region R is imaged at regular intervals during the culture of the cell population 30A.
- the information processing apparatus 10 determines whether the cell population 30A succeeds in differentiation when the differentiation is induced in the stage before differentiation induction (i.e., the cells (success or failure of differentiation).
- pluripotent stem cells When producing regenerative medicine products, pluripotent stem cells are induced to differentiate into differentiated cells (germ layers). Differentiate. However, the differentiation potential of pluripotent stem cells is not uniform, and some do not differentiate into endoderm, mesoderm, or ectoderm. In this embodiment, in order to improve the productivity and quality of regenerative medicine products, the success or failure of cell differentiation is predicted in the stage before induction of differentiation, and cells that are predicted to succeed in differentiation are used to produce regenerative medicine products. I do.
- the storage device 40 of the information processing apparatus 10 stores an operating program 44 .
- the operating program 44 is an application program for causing the computer to function as the information processing device 10 . That is, the operating program 44 is an example of a "program" according to the technology of the present disclosure.
- the storage device 40 stores the learned model LM and the criterion K in addition to the operating program 44 .
- the storage device 40 also stores the input image PI, the output image PO, and the feature amount F generated during the operation of the microscope observation system 2 .
- the CPU 42 of the computer constituting the information processing apparatus 10 cooperates with the memory 41 and the like to operate the imaging control section 50, the read/write (hereinafter abbreviated as RW) control section 51, the processing It functions as a unit 52 , a feature extraction unit 53 , a prediction unit 54 and a display control unit 55 .
- the imaging control unit 50 causes the imaging region R representing the entire incubation container 25 to be imaged for each imaging target range IR, and generates a plurality of captured images (input images PI). output.
- the RW control unit 51 controls writing of various data to the storage device 40 and reading of various data from within the storage device 40 .
- the RW control unit 51 receives the input image PI output from the microscope device 20 and writes it to the storage device 40 .
- the RW control unit 51 also reads the input image PI and the learned model LM from the storage device 40 and outputs them to the processing unit 52 .
- the trained model LM is, for example, a convolutional neural network such as U-Net (U-Shaped Neural Network), SegNet, ResNet (Residual Network).
- the processing unit 52 outputs an output image PO by performing image processing on the input image PI. Specifically, the processing unit 52 applies the input image PI to the trained model LM, and performs semantic segmentation for determining the class, which is the type of object appearing in the input image PI, on a pixel-by-pixel basis. For example, the processing unit 52 classifies each pixel of the input image PI into three classes of cell nucleus, cytoplasm, and medium. Each pixel is labeled with a class. The processing unit 52 outputs an image in which each pixel of the input image PI is classified by the learned model LM to the RW control unit 51 as an output image PO. The processing unit 52 generates and outputs an output image PO for each of a plurality of input images PI obtained from one imaging region R. The RW control unit 51 writes the plurality of output images PO output from the processing unit 52 to the storage device 40 .
- the RW control unit 51 reads the output image PO from the storage device 40 and outputs it to the feature amount extraction unit 53 .
- the feature quantity extraction unit 53 extracts a feature quantity F based on the appearance of the cell 30 using the output image PO.
- the feature amount extraction unit 53 detects individual cell nuclei from the output image PO based on the label attached to each pixel of the output image PO, and counts the number of detected cell nuclei to obtain the unit The number of cells 30 per area (hereinafter referred to as cell number) is derived. Further, the feature amount extraction unit 53 obtains the number of cells for each of the plurality of output images PO, and derives the average number of cells per output image PO.
- the feature amount extraction unit 53 outputs the derived average of the number of cells as the feature amount F.
- FIG. The RW control unit 51 writes the feature amount F output from the feature amount extraction unit 53 to the storage device 40 .
- the number of cells means the number of cells 30 per unit area.
- the RW control unit 51 reads the feature quantity F and the criterion K from the storage device 40 and outputs them to the prediction unit 54 .
- the prediction unit 54 predicts success or failure of differentiation of the cell population 30A based on the feature amount F and the criterion K.
- the prediction unit 54 predicts that the differentiation will be successful when the feature amount F (that is, the average number of cells) is equal to or greater than the criterion K.
- the prediction unit 54 predicts that the differentiation will fail.
- the prediction unit 54 outputs a prediction result PR of success or failure of differentiation of the cell population 30A to the display control unit 55 .
- the display control unit 55 controls the display of various screens on the display 11.
- the display control unit 55 causes the display 11 to display the prediction result PR by the prediction unit 54 .
- the display control unit 55 may cause the display 11 to display the feature amount F and the output image PO together with the prediction result PR.
- the processing unit 52 generates the output image PO by giving the input image PI to the learned model LM.
- the output image PO is an image in which the cell nucleus 31 classified into class 1, the cytoplasm 32 classified into class 2, and the medium 33 classified into class 3 are color-coded.
- a cell 30 is composed of a cell nucleus 31 and a cytoplasm 32 that correspond to each other.
- the feature quantity extraction unit 53 extracts information about the cell nucleus 31 as the feature quantity F. More specifically, the feature quantity extraction unit 53 extracts the number of cells corresponding to the number of cell nuclei 31 as the feature quantity F as information about the cell nuclei 31 .
- the feature amount extraction unit 53 counts the number of cells for each of the plurality of output images PO1 to PON corresponding to the plurality of imaging target ranges IR shown in FIG.
- the output image POn represents the output image PO corresponding to the n-th imaging target range IR.
- n 1, 2, 3, . . . N.
- the feature quantity extraction unit 53 obtains the total number of cells for the plurality of output images PO1 to PON, and divides the total number of cells by N to derive the average number of cells.
- the criterion K used by the prediction unit 54 is a value determined based on past culture test results.
- DP represents the distribution of the cell population that was successfully differentiated by induction of differentiation in the past culture test with respect to the feature value F.
- DN represents the distribution with respect to the feature amount F of the cell population that failed to differentiate due to induction of differentiation in the past culture test.
- the criterion K is set to a boundary value at which the distribution DP and the distribution DN intersect.
- the criterion K is a so-called cutoff value.
- TP represents the number of true positives, which is the number of cell populations contained in the area of the distribution DP that is equal to or greater than the criterion K.
- TN represents the number of true negatives, which is the number of cell populations contained in the area below the criterion K in the distribution DN.
- FN represents the number of false negatives, which is the number of cell populations contained in the area below the criterion K in the distribution DP.
- FP represents the number of false positives, which is the number of cell populations contained in a region of the distribution DN that satisfies the criterion K or more.
- Fig. 8 shows an example of an ROC (Receiver Operating Characteristic) curve obtained from the true positive rate and the false positive rate.
- the ROC curve is a curve representing the relationship between the true positive rate (TPR) and the false positive rate (FPR) when the criterion K is changed.
- True positive rate is also called sensitivity.
- TPR true positive rate
- FPR false positive rate
- AUC Absolute Under the Curve
- AUC represents the prediction accuracy of cell differentiation performed based on the feature value F.
- AUC takes a value of 0 or more and less than 1. The closer the AUC is to 1, the higher the prediction accuracy of cell differentiation. The applicant has confirmed that when the average number of cells is used as the feature quantity F, the AUC is "0.948202", which is close to 1, and the prediction accuracy is achieved.
- the CPU 42 executes processing based on the operation program 44, so that the CPU 42 includes the imaging control unit 50, the RW control unit 51, the processing unit 52, the feature amount, as shown in FIG. It functions as an extraction unit 53 , a prediction unit 54 and a display control unit 55 .
- the imaging control unit 50 controls the microscope device 20 to image the imaging region R shown in FIG. 2 for each imaging target range IR, and N captured images (input images PI) is output (step S10).
- the information processing apparatus 10 acquires N input images PI output from the microscope apparatus 20, and writes them to the storage device 40 via the RW control unit 51 (step S11).
- the N input images PI written in the storage device 40 are read by the RW control section 51 and output to the processing section 52 .
- the processing unit 52 generates and outputs N output images PO by sequentially inputting the N input images PI to the trained model LM (step S12).
- the N output images PO output from the processing unit 52 are written to the storage device 40 via the RW control unit 51 .
- the N output images PO written in the storage device 40 are read by the RW control section 51 and output to the feature quantity extraction section 53 .
- the feature quantity extraction unit 53 counts the number of cells for each of the N output images PO (step S13). Then, the feature amount extracting unit 53 divides the total number of cells by N to derive the average number of cells per output image PO (step S14). The feature amount extraction unit 53 outputs the average number of cells as the feature amount F.
- FIG. The feature quantity F output from the feature quantity extraction unit 53 is written to the storage device 40 via the RW control unit 51 . The feature quantity F written in the storage device 40 is read by the RW control unit 51 and output to the prediction unit 54 .
- the prediction unit 54 determines whether or not the average number of cells as the feature quantity F is equal to or greater than the criterion K (step S15). If the average cell count is equal to or greater than the criterion K (step S15: YES), the cell population 30A is predicted to successfully differentiate (step S16). On the other hand, when the average number of cells is less than the criterion K (step S15: NO), the cell population 30A is predicted to fail in differentiation (step S17).
- the prediction unit 54 outputs the prediction result PR of step S16 or step S17 (step S18).
- the prediction result PR is displayed on the display 11 by the display control section 55 . With this, the series of differentiation prediction processing ends.
- the learned model LM used by the processing unit 52 is constructed by machine learning using teacher data in the learning phase.
- the CPU 42 functions as a learning unit 60 by executing processing based on the operation program 44 .
- the learning section 60 includes an adjustment section 62 .
- the teacher data TD consists of a cell-stained image TD1, which is a fluorescent image obtained by staining cell nuclei, and a non-stained cell image TD2, which is obtained by decolorizing the cell-stained image TD1.
- the cell-stained image TD1 is an annotation image in which each pixel is assigned a correct label (in this embodiment, a label indicating which of classes 1 to 3 it belongs to).
- the learning unit 60 inputs the unstained cell image TD2 as an input image to the learning model M, and outputs the output image PO.
- the learning unit 60 inputs the output image PO output from the learning model M and the cell staining image TD1 to the adjustment unit 62 .
- the adjustment unit 62 evaluates the class discrimination accuracy by comparing the output image PO and the stained cell image TD1. Specifically, the adjustment unit 62 evaluates the class discrimination accuracy of the learning model M using a loss function. In addition, the adjustment unit 62 adjusts the values of various parameters of the learning model M by stochastic gradient descent or the like based on the evaluation result.
- the learning unit 60 uses a plurality of teacher data TD to input the unstained cell image TD2 to the learning model M, evaluate the output image PO and the stained cell image TD1 by the adjustment unit 62, and adjust the learning model M. repeat.
- the learning unit 60 writes the learning model M to the storage device 40 as a learned model LM via the RW control unit 51 when the class discrimination accuracy of the learning model M reaches a preset level.
- the processing unit 52 In the differentiation prediction process as the operation phase described above, the processing unit 52 generates the output image PO using the learned model LM machine-learned by the learning unit 60 .
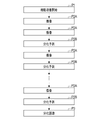
- expansion culture is started to proliferate pluripotent stem cells established from somatic cells collected from living organisms.
- somatic cells are treated to introduce reprogramming factors (Oct3/4, Sox2, c-Myc, Klf4) using, for example, episomal plasmids, thereby increasing multipotency.
- reprogramming factors Oct3/4, Sox2, c-Myc, Klf4
- Potent stem cells are established.
- expansion culture is performed by an adherent culture method in which the cells are cultured on the culture container 25 .
- a medium replacement process is performed to replace the used medium with a fresh medium at an appropriate time during the culture period.
- the expansion culture is not limited to adhesion culture, and a suspension culture method using a spinner flask or the like can also be adopted.
- the information processing device 10 After starting the cell culture in the first step P1, the information processing device 10 performs the above-described differentiation prediction processing as the second step P2 during the culture period.
- the second step P2 is performed periodically (for example, every day).
- the second step P2 is performed at least immediately before differentiation induction as the third step P3.
- the culture is stopped, and the cell population 30A being cultured in the culture container 25 is not input to the third step P3.
- differentiation induction is performed to differentiate the pluripotent stem cells into differentiated cells.
- a treatment of adding a differentiation inducer to the pluripotent stem cells is performed.
- various growth factors/cytokines such as FGF-2, Activin and BMP-4, or various signal inhibitors such as BMP signal inhibitors and Wnt signal inhibitors are used.
- Pluripotent stem cells are usually differentiated into endoderm, mesoderm, or ectoderm through the above steps.
- the information processing apparatus 10 extracts and extracts a feature amount based on the appearance of the cells by performing image processing on the captured image obtained by capturing the cell population cultured in the culture vessel before differentiation induction. Since the success or failure of cell differentiation is predicted based on the feature amount, the productivity and quality of regenerative medicine products can be improved. In addition, the information processing apparatus 10 predicts the success or failure of cell differentiation based only on the appearance of cells without using genetic information, process history information, etc., as in the conventional art. can be predicted.
- the processing unit 52 divides each pixel of the input image PI into three classes, cell nucleus, cytoplasm, and medium, using the trained model LM. It may be divided into four classes including "central region”.
- the output image PO includes cell nuclei 31 classified into class 1, cytoplasm 32 classified into class 2, medium 33 classified into class 3, and class 4 2 is an image in which the center regions 31C of the cells classified into are respectively color-coded.
- the feature amount extraction unit 53 counts the number of cells from the output image PO based on the central region 31C of cells classified into class 4.
- the cell nucleus 31 may appear in the output image PO while overlapping the cell nucleus 31 of the adjacent cell 30 .
- the feature quantity extraction unit 53 may erroneously count the number of cells by recognizing them as one cell nucleus 31 . By counting the number of cells based on the central region 31 ⁇ /b>C smaller than the cell nucleus 31 , the feature amount extraction unit 53 can count the number of cells more accurately.
- the feature amount F is extracted based on a plurality of captured images (input images PI) having the same image capturing time.
- a plurality of captured images captured at the same imaging time refers to a plurality of captured images obtained by a series of capturing of one imaging region R as a target.
- the feature amount F is extracted based on a plurality of captured images captured at different times.
- the feature amount F is the rate of increase in the number of cells.
- a second A step P2A of imaging the imaging region R with the microscope device 20 is performed during the culture period.
- the 2nd A step P2A is performed periodically (for example, every day).
- N input images PI are obtained by the second A process P2A.
- the 2B step P2B for differentiation prediction is performed each time the 2A step P2A is performed once after the 2A step P2A is performed twice.
- the rate of increase in the number of cells is calculated as the feature quantity F based on the 2N input images PI obtained in the last two 2A processes P2A.
- differentiation prediction is performed based on the cell number increase rate.
- the second B step P2B is performed at least immediately before differentiation induction as the third step P3.
- the information processing apparatus 10 predicts the success or failure of cell differentiation for the entire imaging region R.
- FIG. in the third modification the information processing apparatus 10 predicts the success or failure of cell differentiation for each imaging target range IR. That is, in this modified example, success or failure of cell differentiation is predicted for each area based on each of a plurality of area images obtained by imaging the entire culture vessel divided into a plurality of areas.
- the feature quantity extraction unit 53 extracts the feature quantity F from each of the output images PO1 to PON.
- the feature amount extraction unit 53 obtains the number of cells from each of the output images PO1 to PON, and uses each cell number as the feature amount F.
- the prediction unit 54 predicts success or failure of cell differentiation for each imaging target range IR based on each feature amount F.
- the prediction result PR by the prediction unit 54 is displayed on the display 11 by the display control unit 55 for each imaging target range IR. This allows the user to discriminate between regions in which cell differentiation is predicted to succeed and regions in which cell differentiation is predicted to fail in the culture container 25 .
- the prediction unit 54 calculates the ratio of the successful differentiation area to the culture area (that is, the area of the imaging region R) based on the prediction result PR regarding the success or failure of cell differentiation for each imaging target range IR. good too.
- the percentage of the culture area that is successfully differentiated is about 26%.
- the feature quantity extraction unit 53 extracts the number of cells or the rate of increase in the number of cells as the feature quantity F from the information on the cell nucleus 31 .
- the feature quantity extraction unit 53 extracts the area of the cell nucleus 31 (hereinafter referred to as the nucleus area), the area ratio between the cell nucleus 31 and the cytoplasm 32 (hereinafter referred to as the N/C ratio), or the cell occupied area ratio in the culture vessel 25. (hereinafter referred to as confluency) may be extracted as the feature amount F.
- the feature quantity extraction unit 53 may extract the circularity of the cell nucleus 31 (hereinafter simply referred to as circularity) as the feature quantity F.
- FIG. 17 shows an example of the relationship between various feature quantities F immediately before induction of differentiation and AUC, sensitivity, and specificity. Sensitivity is the true positive rate described above. Specificity is also called true negative rate.
- the "increase rate” is a value calculated based on a plurality of captured images captured at different times. Also, “whole” represents the increase rate of the value obtained for the entire imaging region R.
- FIG. “Average” represents an average value in the entire imaging region R.
- FIG. “Standard deviation” represents the degree of dispersion of values in the entire imaging region R.
- various feature quantities F are arranged in descending order of AUC. According to FIG. 17, the rate of increase in the number of cells (total), the number of cells (average), the nuclear area (average), and the N/C ratio (average) have an AUD of 0.8 or more, so the determination accuracy is high. , is preferably used as the feature quantity F for predicting cell differentiation.
- FIG. 18 and 19 illustrate the frequency distribution of confluency before and after induction of differentiation.
- FIG. 18 shows a comparison of frequency distributions before and after induction of differentiation when confluency varies greatly before induction of differentiation.
- FIG. 19 shows a comparison of the frequency distribution before and after induction of differentiation when the variation in confluency is small before induction of differentiation.
- the vertical axis indicates the number of areas (that is, the number of imaging target ranges IR).
- cell differentiation can be predicted by using variations in confluency (for example, standard deviation) as the feature quantity F.
- variations in confluency for example, standard deviation
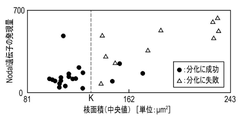
- FIG. 20 illustrates the relationship between the Nodal gene expression level and the nuclear area when iPS cells are induced to differentiate into myocardium.
- FIG. 20 shows experimental results for 29 batches (culture vessel 25). Filled circles indicate batches that were successfully differentiated. Open triangles indicate batches that failed to differentiate.
- the Nodal gene is a marker that enables determination of the ability of iPS cells to differentiate into myocardium (see International Publication No. 2020/203712).
- the expression level of the Nodal gene is a value measured by the Targeted Amplicon Sequence method (the unit is the number of counted data).
- the nuclear area means the area of a nuclear cell per cell.
- FIG. 20 it can be seen that there is a correlation between the Nodal gene expression level and the nuclear area.
- the nuclear area as the feature quantity F and appropriately setting the criterion K, cell differentiation can be predicted with high accuracy.
- cell differentiation can be accurately predicted by setting K to about 142 ⁇ m 2 . That is, if the nuclear area is about 142 ⁇ m 2 or less, differentiation is likely to succeed.
- the determination success rate of cells successfully differentiated is 89.7%.
- the feature amount extraction unit 53 extracts one type of feature amount F (for example, the average number of cells), but multiple types of feature amounts F (for example, the average number of cells, mean nuclear area, and mean N/C ratio) may be extracted.
- the prediction unit 54 may predict the success or failure of the differentiation by performing multivariate analysis or the like using the multiple types of feature quantities F extracted by the feature quantity extraction unit 53 .
- the cells 30 are undifferentiated pluripotent stem cells such as iPS cells and ES cells, but the cells 30 are undifferentiated stem cells such as mesenchymal stem cells. There may be.
- the hardware configuration of the computer that constitutes the information processing device 10 can be modified in various ways.
- the information processing apparatus 10 can be configured with a plurality of computers separated as hardware for the purpose of improving processing capability and reliability.
- the hardware configuration of the computer of the information processing device 10 can be appropriately changed according to required performance such as processing power, safety, and reliability.
- application programs such as the operation program 44 can be duplicated or distributed and stored in multiple storage devices for the purpose of ensuring safety and reliability. .
- a processing unit that executes various processes such as the imaging control unit 50, the RW control unit 51, the processing unit 52, the feature amount extraction unit 53, the prediction unit 54, and the display control unit 55
- various processors shown below can be used.
- the various processors include, as described above, a CPU, which is a general-purpose processor that executes software (the operation program 44) and functions as various processing units, as well as FPGAs and the like whose circuit configuration can be changed after manufacture.
- Programmable Logic Device which is a processor, ASIC (Application Specific Integrated Circuit), etc. Includes a dedicated electric circuit, which is a processor with a circuit configuration specially designed to execute specific processing. .
- One processing unit may be configured with one of these various processors, or a combination of two or more processors of the same or different type (for example, a combination of a plurality of FPGAs and/or a CPU and combination with FPGA). Also, a plurality of processing units may be configured by one processor.
- a single processor is configured by combining one or more CPUs and software.
- a processor functions as multiple processing units.
- SoC System On Chip
- a processor that realizes the functions of the entire system including multiple processing units with a single IC (Integrated Circuit) chip. be.
- the various processing units are configured using one or more of the above various processors as a hardware structure.
- microscope observation system 10 information processing device 11 display 12 keyboard 13 mouse 14 input device 20 microscope device 21 placement unit 22 light source 23 imaging device 24 drive unit 25 culture vessel 26 arm 30 cell 30A cell population 31 cell nucleus 31C central region 32 cytoplasm 33 Culture medium 40 Storage device 41 Memory 42 CPU 43 communication unit 44 operating program 46 bus line 50 imaging control unit 51 RW control unit 52 processing unit 53 feature amount extraction unit 54 prediction unit 55 display control unit 60 learning unit 62 adjustment unit DN, DP distribution F feature amount IR imaging target range K Judgment Criterion L Illumination Light LM Learned Model M Learning Model PI Input Image PO Output Image PR Prediction Result R Imaging Region TD Teacher Data TD1 Stained Cell Image TD2 Unstained Cell Image
Landscapes
- Engineering & Computer Science (AREA)
- Life Sciences & Earth Sciences (AREA)
- Health & Medical Sciences (AREA)
- Chemical & Material Sciences (AREA)
- Bioinformatics & Cheminformatics (AREA)
- General Health & Medical Sciences (AREA)
- Biomedical Technology (AREA)
- Zoology (AREA)
- Organic Chemistry (AREA)
- Wood Science & Technology (AREA)
- Physics & Mathematics (AREA)
- Biotechnology (AREA)
- Theoretical Computer Science (AREA)
- General Physics & Mathematics (AREA)
- Molecular Biology (AREA)
- Genetics & Genomics (AREA)
- Biochemistry (AREA)
- Multimedia (AREA)
- Analytical Chemistry (AREA)
- General Engineering & Computer Science (AREA)
- Sustainable Development (AREA)
- Microbiology (AREA)
- Cell Biology (AREA)
- Medicinal Chemistry (AREA)
- Medical Informatics (AREA)
- Biophysics (AREA)
- Computing Systems (AREA)
- Evolutionary Computation (AREA)
- Spectroscopy & Molecular Physics (AREA)
- Evolutionary Biology (AREA)
- Bioinformatics & Computational Biology (AREA)
- Artificial Intelligence (AREA)
- Computer Vision & Pattern Recognition (AREA)
- Proteomics, Peptides & Aminoacids (AREA)
- Databases & Information Systems (AREA)
- Software Systems (AREA)
- Virology (AREA)
- Immunology (AREA)
- Hematology (AREA)
- Urology & Nephrology (AREA)
Abstract
Description
上記実施形態では、処理部52は、学習済みモデルLMにより入力画像PIの各画素を、細胞核、細胞質、及び培地の3つのクラスに分けているが、さらに、細胞核の中心に位置する「細胞核の中心領域」を加えた4つのクラスに分けてもよい。 [First modification]
In the above-described embodiment, the
上記実施形態では、撮像時刻が同一の複数の撮像画像(入力画像PI)に基づいて特徴量Fを抽出している。なお、撮像時刻が同一の複数の撮像画像とは、1つの撮像領域Rを対象とした一連の撮像により得られた複数の撮像画像をいう。第2変形例では、撮像時刻が異なる複数の撮像画像に基づいて特徴量Fを抽出する。本変形例では、細胞数の増加率を特徴量Fとする。 [Second modification]
In the above embodiment, the feature amount F is extracted based on a plurality of captured images (input images PI) having the same image capturing time. Note that a plurality of captured images captured at the same imaging time refers to a plurality of captured images obtained by a series of capturing of one imaging region R as a target. In the second modification, the feature amount F is extracted based on a plurality of captured images captured at different times. In this modified example, the feature amount F is the rate of increase in the number of cells.
上記実施形態では、情報処理装置10は、撮像領域Rの全体に対して細胞の分化の成否を予測している。第3変形例では、情報処理装置10は、撮像対象範囲IRごとに細胞の分化の成否を予測する。すなわち、本変形例では、培養容器の全体を複数のエリアに分割して撮像することにより得られる複数のエリア画像のそれぞれに基づき、エリアごとに細胞の分化の成否を予測する。 [Third modification]
In the above embodiment, the
上記実施形態及び各変形例では、特徴量抽出部53は、細胞核31に関する情報のうち、細胞数又は細胞数の増加率を特徴量Fとして抽出している。特徴量抽出部53は、細胞核31の面積(以下、核面積という。)、細胞核31と細胞質32との面積比(以下、N/C比という。)、又は培養容器25中の細胞占有面積率(以下、コンフルエンシーという。)を特徴量Fとして抽出してもよい。さらに、特徴量抽出部53は、細胞核31の円形度(以下、単に円形度という。)を特徴量Fとして抽出してもよい。 [Other Modifications]
In the embodiment and each modified example described above, the feature
10 情報処理装置
11 ディスプレイ
12 キーボード
13 マウス
14 入力デバイス
20 顕微鏡装置
21 載置部
22 光源
23 撮像装置
24 駆動部
25 培養容器
26 アーム
30 細胞
30A 細胞集団
31 細胞核
31C 中心領域
32 細胞質
33 培地
40 ストレージデバイス
41 メモリ
42 CPU
43 通信部
44 作動プログラム
46 バスライン
50 撮像制御部
51 RW制御部
52 処理部
53 特徴量抽出部
54 予測部
55 表示制御部
60 学習部
62 調整部
DN,DP 分布
F 特徴量
IR 撮像対象範囲
K 判定基準
L 照明光
LM 学習済みモデル
M 学習モデル
PI 入力画像
PO 出力画像
PR 予測結果
R 撮像領域
TD 教師データ
TD1 細胞染色画像
TD2 細胞非染色画像 2
43
Claims (12)
- 培養容器に培養された細胞集団を撮像した撮像画像に基づいて細胞の分化の成否を予測する情報処理装置であって、
少なくとも1つのプロセッサを備え、
前記プロセッサは、
前記撮像画像を画像処理することにより前記細胞の外観に基づく特徴量を抽出し、
抽出した前記特徴量に基づいて前記細胞の分化の成否を予測する、
情報処理装置。 An information processing device that predicts the success or failure of cell differentiation based on an imaged image of a cell population cultured in a culture vessel,
comprising at least one processor;
The processor
extracting a feature amount based on the appearance of the cell by image processing the captured image;
predicting success or failure of differentiation of the cell based on the extracted feature amount;
Information processing equipment. - 前記プロセッサは、前記細胞の外観に基づく前記特徴量のみに基づいて細胞の分化の成否を予測する、
請求項1に記載の情報処理装置。 The processor predicts the success or failure of cell differentiation based only on the feature value based on the appearance of the cell.
The information processing device according to claim 1 . - 前記プロセッサは、少なくとも1つの前記撮像画像から細胞核を検出し、細胞核に関する情報を前記特徴量として抽出する、
請求項1又は請求項2に記載の情報処理装置。 The processor detects a cell nucleus from at least one of the captured images and extracts information about the cell nucleus as the feature amount.
The information processing apparatus according to claim 1 or 2. - 前記特徴量には、細胞核の数に対応する細胞数、細胞核の面積、細胞核と細胞質との面積比、又は前記培養容器中の細胞占有面積率が含まれる、
請求項3に記載の情報処理装置。 The feature amount includes the number of cells corresponding to the number of cell nuclei, the area of cell nuclei, the area ratio of cell nuclei and cytoplasm, or the cell occupied area ratio in the culture vessel.
The information processing apparatus according to claim 3. - 前記特徴量には、撮像時刻が異なる複数の前記撮像画像に基づいて算出される細胞数の増加率が含まれる、
請求項3に記載の情報処理装置。 The feature amount includes a rate of increase in the number of cells calculated based on a plurality of the captured images with different imaging times,
The information processing apparatus according to claim 3. - 前記プロセッサは、細胞核を染色した蛍光画像を教師データとして機械学習した学習済みモデルを用いて、前記撮像画像から細胞核を検出する、
請求項3から請求項5のうちいずれか1項に記載の情報処理装置。 The processor detects the cell nucleus from the captured image using a learned model machine-learned using fluorescent images stained with cell nuclei as teacher data.
The information processing apparatus according to any one of claims 3 to 5. - 前記プロセッサは、前記培養容器の全体を複数のエリアに分割して撮像することにより得られる複数のエリア画像のそれぞれを前記撮像画像として、前記エリアごとに前記細胞の分化の成否を予測する、
請求項1から請求項6のうちいずれか1項に記載の情報処理装置。 The processor uses each of a plurality of area images obtained by imaging the entire culture vessel divided into a plurality of areas as the captured image, and predicts the success or failure of differentiation of the cell for each area.
The information processing apparatus according to any one of claims 1 to 6. - 前記プロセッサは、前記エリアごとの前記細胞の分化の成否についての予測結果に基づき、培養面積のうちの分化に成功する面積の割合を算出する、
請求項7に記載の情報処理装置。 The processor calculates the ratio of the area of the culture area that is successfully differentiated based on the prediction result of the success or failure of the cell differentiation for each area.
The information processing apparatus according to claim 7. - 前記細胞は、幹細胞である、
請求項1から請求項8のうちいずれか1項に記載の情報処理装置。 the cells are stem cells;
The information processing apparatus according to any one of claims 1 to 8. - 前記幹細胞は、未分化状態である、
請求項9に記載の情報処理装置。 the stem cells are in an undifferentiated state;
The information processing apparatus according to claim 9 . - 培養容器に培養された細胞集団を撮像した撮像画像に基づいて細胞の分化の成否を予測する情報処理方法であって、
前記撮像画像を画像処理することにより前記細胞の外観に基づく特徴量を抽出し、
抽出した前記特徴量に基づいて前記細胞の分化の成否を予測すること、
を含む情報処理方法。 An information processing method for predicting the success or failure of cell differentiation based on a captured image of a cell population cultured in a culture vessel,
extracting a feature value based on the appearance of the cell by image processing the captured image;
Predicting the success or failure of differentiation of the cell based on the extracted feature amount;
Information processing method including. - 培養容器に培養された細胞集団を撮像した撮像画像に基づいて細胞の分化の成否を予測する処理をコンピュータに実行させるプログラムであって、
前記撮像画像を画像処理することにより前記細胞の外観に基づく特徴量を抽出し、
抽出した前記特徴量に基づいて前記細胞の分化の成否を予測すること、
を含む処理を前記コンピュータに実行させるプログラム。 A program that causes a computer to execute a process of predicting the success or failure of cell differentiation based on an image obtained by imaging a cell population cultured in a culture vessel,
extracting a feature amount based on the appearance of the cell by image processing the captured image;
Predicting the success or failure of differentiation of the cell based on the extracted feature amount;
A program that causes the computer to execute a process including
Priority Applications (3)
| Application Number | Priority Date | Filing Date | Title |
|---|---|---|---|
| JP2023529688A JPWO2022270179A1 (en) | 2021-06-24 | 2022-05-13 | |
| EP22828098.8A EP4361243A1 (en) | 2021-06-24 | 2022-05-13 | Information processing device, information processing method, and program |
| US18/534,721 US20240112479A1 (en) | 2021-06-24 | 2023-12-11 | Information processing apparatus, information processing method, and program |
Applications Claiming Priority (2)
| Application Number | Priority Date | Filing Date | Title |
|---|---|---|---|
| JP2021-104817 | 2021-06-24 | ||
| JP2021104817 | 2021-06-24 |
Related Child Applications (1)
| Application Number | Title | Priority Date | Filing Date |
|---|---|---|---|
| US18/534,721 Continuation US20240112479A1 (en) | 2021-06-24 | 2023-12-11 | Information processing apparatus, information processing method, and program |
Publications (1)
| Publication Number | Publication Date |
|---|---|
| WO2022270179A1 true WO2022270179A1 (en) | 2022-12-29 |
Family
ID=84544507
Family Applications (1)
| Application Number | Title | Priority Date | Filing Date |
|---|---|---|---|
| PCT/JP2022/020253 WO2022270179A1 (en) | 2021-06-24 | 2022-05-13 | Information processing device, information processing method, and program |
Country Status (4)
| Country | Link |
|---|---|
| US (1) | US20240112479A1 (en) |
| EP (1) | EP4361243A1 (en) |
| JP (1) | JPWO2022270179A1 (en) |
| WO (1) | WO2022270179A1 (en) |
Cited By (1)
| Publication number | Priority date | Publication date | Assignee | Title |
|---|---|---|---|---|
| WO2024185572A1 (en) * | 2023-03-07 | 2024-09-12 | キヤノン株式会社 | Cell image analysis method and program |
Citations (11)
| Publication number | Priority date | Publication date | Assignee | Title |
|---|---|---|---|---|
| WO2015133185A1 (en) * | 2014-03-04 | 2015-09-11 | 富士フイルム株式会社 | Device, method, and program for cell image acquisition |
| WO2016088243A1 (en) * | 2014-12-05 | 2016-06-09 | 株式会社ニコン | Determination device, observation system, observation method, program for same, method for manufacturing cell, and cell |
| WO2018101004A1 (en) * | 2016-12-01 | 2018-06-07 | 富士フイルム株式会社 | Cell image evaluation system and program for controlling cell image evaluation |
| WO2019163802A1 (en) * | 2018-02-20 | 2019-08-29 | 国立大学法人大阪大学 | Method for evaluating embryoid body |
| WO2019240008A1 (en) | 2018-06-13 | 2019-12-19 | 富士フイルム株式会社 | Information processing device, derivation method, and derivation program |
| WO2020203712A1 (en) | 2019-03-29 | 2020-10-08 | 富士フイルム株式会社 | Method for producing pluripotent stem cells capable of differentiating into specific cells, and application thereof |
| WO2021059572A1 (en) * | 2019-09-27 | 2021-04-01 | 富士フイルム株式会社 | Information processing device, method for operating information processing device, and program for operating information processing device |
| WO2021085034A1 (en) * | 2019-10-28 | 2021-05-06 | 富士フイルム株式会社 | Method for selecting pluripotent stem cells, method for predicting result of differentiation induction, and method for producing cell product |
| WO2021085033A1 (en) * | 2019-10-28 | 2021-05-06 | 富士フイルム株式会社 | Method for sorting pluripotent stem cells, method for predicting differentiation induction results, and method for manufacturing cell product |
| WO2021145402A1 (en) * | 2020-01-16 | 2021-07-22 | 富士フイルム株式会社 | Method for producing pluripotent stem cells capable of differentiating into specific cells, and application thereof |
| WO2022044167A1 (en) * | 2020-08-26 | 2022-03-03 | オリンパス株式会社 | System, method, and program for evaluating stem cell differentiation |
-
2022
- 2022-05-13 JP JP2023529688A patent/JPWO2022270179A1/ja active Pending
- 2022-05-13 EP EP22828098.8A patent/EP4361243A1/en active Pending
- 2022-05-13 WO PCT/JP2022/020253 patent/WO2022270179A1/en active Application Filing
-
2023
- 2023-12-11 US US18/534,721 patent/US20240112479A1/en active Pending
Patent Citations (11)
| Publication number | Priority date | Publication date | Assignee | Title |
|---|---|---|---|---|
| WO2015133185A1 (en) * | 2014-03-04 | 2015-09-11 | 富士フイルム株式会社 | Device, method, and program for cell image acquisition |
| WO2016088243A1 (en) * | 2014-12-05 | 2016-06-09 | 株式会社ニコン | Determination device, observation system, observation method, program for same, method for manufacturing cell, and cell |
| WO2018101004A1 (en) * | 2016-12-01 | 2018-06-07 | 富士フイルム株式会社 | Cell image evaluation system and program for controlling cell image evaluation |
| WO2019163802A1 (en) * | 2018-02-20 | 2019-08-29 | 国立大学法人大阪大学 | Method for evaluating embryoid body |
| WO2019240008A1 (en) | 2018-06-13 | 2019-12-19 | 富士フイルム株式会社 | Information processing device, derivation method, and derivation program |
| WO2020203712A1 (en) | 2019-03-29 | 2020-10-08 | 富士フイルム株式会社 | Method for producing pluripotent stem cells capable of differentiating into specific cells, and application thereof |
| WO2021059572A1 (en) * | 2019-09-27 | 2021-04-01 | 富士フイルム株式会社 | Information processing device, method for operating information processing device, and program for operating information processing device |
| WO2021085034A1 (en) * | 2019-10-28 | 2021-05-06 | 富士フイルム株式会社 | Method for selecting pluripotent stem cells, method for predicting result of differentiation induction, and method for producing cell product |
| WO2021085033A1 (en) * | 2019-10-28 | 2021-05-06 | 富士フイルム株式会社 | Method for sorting pluripotent stem cells, method for predicting differentiation induction results, and method for manufacturing cell product |
| WO2021145402A1 (en) * | 2020-01-16 | 2021-07-22 | 富士フイルム株式会社 | Method for producing pluripotent stem cells capable of differentiating into specific cells, and application thereof |
| WO2022044167A1 (en) * | 2020-08-26 | 2022-03-03 | オリンパス株式会社 | System, method, and program for evaluating stem cell differentiation |
Cited By (1)
| Publication number | Priority date | Publication date | Assignee | Title |
|---|---|---|---|---|
| WO2024185572A1 (en) * | 2023-03-07 | 2024-09-12 | キヤノン株式会社 | Cell image analysis method and program |
Also Published As
| Publication number | Publication date |
|---|---|
| US20240112479A1 (en) | 2024-04-04 |
| EP4361243A1 (en) | 2024-05-01 |
| JPWO2022270179A1 (en) | 2022-12-29 |
Similar Documents
| Publication | Publication Date | Title |
|---|---|---|
| US20240112479A1 (en) | Information processing apparatus, information processing method, and program | |
| Leha et al. | A high-content platform to characterise human induced pluripotent stem cell lines | |
| JP5243535B2 (en) | How to aggregate and classify virus granules in an image | |
| Scherf et al. | On the symmetry of siblings: automated single-cell tracking to quantify the behavior of hematopoietic stem cells in a biomimetic setup | |
| US12094571B2 (en) | Systems and methods for predictive molecular biomarker identification and quantification from morphology changes in histopathology tissue | |
| WO2011113924A1 (en) | A system and method for automated extraction of multi-cellular physiological parameters | |
| Lee et al. | A brief history of artificial intelligence embryo selection: from black-box to glass-box | |
| EP3808834A1 (en) | Information processing device, derivation method, and derivation program | |
| Sasaki et al. | Non-invasive quality evaluation of confluent cells by image-based orientation heterogeneity analysis | |
| Ong et al. | Digitalized organoids: integrated pipeline for 3D high-speed analysis of organoid structures using multilevel segmentation and cellular topology | |
| JP2024515512A (en) | Rapid, automated, image-based viral plaque and potency assays | |
| US20240054761A1 (en) | Imaging system and method of use thereof | |
| CN117377772A (en) | Rapid, automated image-based virus plaque and efficacy assays | |
| Zehtabian et al. | Automated analysis of neuronal morphology through an unsupervised classification model of neurites | |
| Asmar et al. | High-volume, label-free imaging for quantifying single-cell dynamics in induced pluripotent stem cell colonies | |
| JPWO2020148956A1 (en) | Cell production support devices, methods, and programs | |
| Nanda et al. | A dynamic network model predicts the phenotypes of multicellular clusters from cellular properties | |
| TWI828009B (en) | Method of lable-free cell viability monitoring and method of training ai for the same | |
| Sasaki et al. | Image-based cell quality assessment: modeling of cell morphology and quality for clinical cell therapy | |
| Mukhopadhyay et al. | Machine learning aided single cell image analysis improves understanding of morphometric heterogeneity of human mesenchymal stem cells | |
| Wang et al. | De-noising spatial expression profiling data based on in situ position and image information | |
| Wieland et al. | Methodological approaches in aggregate formation and microscopic analysis to assess pseudoislet morphology and cellular interactions | |
| US20240046478A1 (en) | Imaging-based system for monitoring quality of cells in culture | |
| Ochs et al. | Fully automated cultivation of adipose-derived stem cells in the StemCellDiscovery—a robotic laboratory for small-scale, high-throughput cell production including deep learning-based confluence estimation. Processes. 2021; 9 (4): 575 | |
| EP4357446A1 (en) | State inference system and state inference method |
Legal Events
| Date | Code | Title | Description |
|---|---|---|---|
| 121 | Ep: the epo has been informed by wipo that ep was designated in this application |
Ref document number: 22828098 Country of ref document: EP Kind code of ref document: A1 |
|
| WWE | Wipo information: entry into national phase |
Ref document number: 2023529688 Country of ref document: JP |
|
| WWE | Wipo information: entry into national phase |
Ref document number: 2022828098 Country of ref document: EP |
|
| NENP | Non-entry into the national phase |
Ref country code: DE |
|
| ENP | Entry into the national phase |
Ref document number: 2022828098 Country of ref document: EP Effective date: 20240124 |