WO2022249583A1 - Information processing device, biological sample observation system, and image generation method - Google Patents
Information processing device, biological sample observation system, and image generation method Download PDFInfo
- Publication number
- WO2022249583A1 WO2022249583A1 PCT/JP2022/006169 JP2022006169W WO2022249583A1 WO 2022249583 A1 WO2022249583 A1 WO 2022249583A1 JP 2022006169 W JP2022006169 W JP 2022006169W WO 2022249583 A1 WO2022249583 A1 WO 2022249583A1
- Authority
- WO
- WIPO (PCT)
- Prior art keywords
- image
- dye
- unit
- information processing
- information
- Prior art date
Links
- 230000010365 information processing Effects 0.000 title claims abstract description 121
- 238000000034 method Methods 0.000 title claims description 68
- 239000012472 biological sample Substances 0.000 title claims description 38
- 238000000926 separation method Methods 0.000 claims abstract description 170
- 238000001228 spectrum Methods 0.000 claims abstract description 95
- 238000011156 evaluation Methods 0.000 claims abstract description 46
- 239000000049 pigment Substances 0.000 claims abstract description 35
- 239000000975 dye Substances 0.000 claims description 162
- 238000003384 imaging method Methods 0.000 claims description 139
- 239000003153 chemical reaction reagent Substances 0.000 claims description 105
- 239000007850 fluorescent dye Substances 0.000 claims description 44
- 230000003595 spectral effect Effects 0.000 claims description 27
- 230000008569 process Effects 0.000 claims description 25
- 238000004364 calculation method Methods 0.000 claims description 14
- 239000011159 matrix material Substances 0.000 claims description 12
- BFMYDTVEBKDAKJ-UHFFFAOYSA-L disodium;(2',7'-dibromo-3',6'-dioxido-3-oxospiro[2-benzofuran-1,9'-xanthene]-4'-yl)mercury;hydrate Chemical compound O.[Na+].[Na+].O1C(=O)C2=CC=CC=C2C21C1=CC(Br)=C([O-])C([Hg])=C1OC1=C2C=C(Br)C([O-])=C1 BFMYDTVEBKDAKJ-UHFFFAOYSA-L 0.000 claims description 10
- 238000002156 mixing Methods 0.000 claims description 3
- 238000012545 processing Methods 0.000 description 107
- 238000004458 analytical method Methods 0.000 description 76
- 230000005284 excitation Effects 0.000 description 65
- 238000002189 fluorescence spectrum Methods 0.000 description 65
- 239000000523 sample Substances 0.000 description 59
- 238000003860 storage Methods 0.000 description 53
- 238000005286 illumination Methods 0.000 description 44
- 230000003287 optical effect Effects 0.000 description 42
- 238000010586 diagram Methods 0.000 description 39
- 210000001519 tissue Anatomy 0.000 description 32
- 210000004027 cell Anatomy 0.000 description 19
- 238000011158 quantitative evaluation Methods 0.000 description 18
- 238000010186 staining Methods 0.000 description 18
- 238000005259 measurement Methods 0.000 description 17
- 230000007246 mechanism Effects 0.000 description 13
- 238000004891 communication Methods 0.000 description 12
- 239000000284 extract Substances 0.000 description 12
- 238000000701 chemical imaging Methods 0.000 description 11
- 238000004519 manufacturing process Methods 0.000 description 11
- 230000006870 function Effects 0.000 description 10
- 238000004422 calculation algorithm Methods 0.000 description 8
- 238000000605 extraction Methods 0.000 description 8
- 238000002073 fluorescence micrograph Methods 0.000 description 8
- 238000002372 labelling Methods 0.000 description 8
- 238000010827 pathological analysis Methods 0.000 description 8
- 230000001575 pathological effect Effects 0.000 description 8
- 238000001514 detection method Methods 0.000 description 7
- 230000000694 effects Effects 0.000 description 7
- 238000005516 engineering process Methods 0.000 description 7
- 238000010801 machine learning Methods 0.000 description 7
- 239000000126 substance Substances 0.000 description 6
- FWBHETKCLVMNFS-UHFFFAOYSA-N 4',6-Diamino-2-phenylindol Chemical compound C1=CC(C(=N)N)=CC=C1C1=CC2=CC=C(C(N)=N)C=C2N1 FWBHETKCLVMNFS-UHFFFAOYSA-N 0.000 description 5
- 239000000427 antigen Substances 0.000 description 5
- 102000036639 antigens Human genes 0.000 description 5
- 108091007433 antigens Proteins 0.000 description 5
- 238000012937 correction Methods 0.000 description 5
- 201000010099 disease Diseases 0.000 description 5
- 208000037265 diseases, disorders, signs and symptoms Diseases 0.000 description 5
- 238000009826 distribution Methods 0.000 description 5
- 230000015654 memory Effects 0.000 description 5
- 238000012986 modification Methods 0.000 description 5
- 230000004048 modification Effects 0.000 description 5
- 230000011218 segmentation Effects 0.000 description 5
- 238000010521 absorption reaction Methods 0.000 description 4
- 230000009471 action Effects 0.000 description 4
- 210000004369 blood Anatomy 0.000 description 4
- 239000008280 blood Substances 0.000 description 4
- 230000008859 change Effects 0.000 description 4
- 238000004043 dyeing Methods 0.000 description 4
- 238000000799 fluorescence microscopy Methods 0.000 description 4
- 239000004065 semiconductor Substances 0.000 description 4
- 230000003321 amplification Effects 0.000 description 3
- 238000006243 chemical reaction Methods 0.000 description 3
- 239000003086 colorant Substances 0.000 description 3
- 239000002131 composite material Substances 0.000 description 3
- 238000004590 computer program Methods 0.000 description 3
- 238000013461 design Methods 0.000 description 3
- 238000001215 fluorescent labelling Methods 0.000 description 3
- 238000002594 fluoroscopy Methods 0.000 description 3
- 239000000203 mixture Substances 0.000 description 3
- 238000003199 nucleic acid amplification method Methods 0.000 description 3
- 210000000056 organ Anatomy 0.000 description 3
- 238000005086 pumping Methods 0.000 description 3
- 238000006862 quantum yield reaction Methods 0.000 description 3
- 230000000391 smoking effect Effects 0.000 description 3
- 239000007787 solid Substances 0.000 description 3
- 241001465754 Metazoa Species 0.000 description 2
- 206010028980 Neoplasm Diseases 0.000 description 2
- 238000000862 absorption spectrum Methods 0.000 description 2
- 230000008033 biological extinction Effects 0.000 description 2
- 230000005540 biological transmission Effects 0.000 description 2
- 210000004204 blood vessel Anatomy 0.000 description 2
- 239000006185 dispersion Substances 0.000 description 2
- 235000006694 eating habits Nutrition 0.000 description 2
- 238000000684 flow cytometry Methods 0.000 description 2
- 238000001727 in vivo Methods 0.000 description 2
- 239000004973 liquid crystal related substance Substances 0.000 description 2
- 239000000463 material Substances 0.000 description 2
- 230000001915 proofreading effect Effects 0.000 description 2
- 102000004169 proteins and genes Human genes 0.000 description 2
- 108090000623 proteins and genes Proteins 0.000 description 2
- 238000004611 spectroscopical analysis Methods 0.000 description 2
- 238000001356 surgical procedure Methods 0.000 description 2
- 206010003445 Ascites Diseases 0.000 description 1
- 241000894006 Bacteria Species 0.000 description 1
- 241000282412 Homo Species 0.000 description 1
- VCUFZILGIRCDQQ-KRWDZBQOSA-N N-[[(5S)-2-oxo-3-(2-oxo-3H-1,3-benzoxazol-6-yl)-1,3-oxazolidin-5-yl]methyl]-2-[[3-(trifluoromethoxy)phenyl]methylamino]pyrimidine-5-carboxamide Chemical compound O=C1O[C@H](CN1C1=CC2=C(NC(O2)=O)C=C1)CNC(=O)C=1C=NC(=NC=1)NCC1=CC(=CC=C1)OC(F)(F)F VCUFZILGIRCDQQ-KRWDZBQOSA-N 0.000 description 1
- 208000002151 Pleural effusion Diseases 0.000 description 1
- 241000700605 Viruses Species 0.000 description 1
- 230000001133 acceleration Effects 0.000 description 1
- 238000013473 artificial intelligence Methods 0.000 description 1
- 238000013528 artificial neural network Methods 0.000 description 1
- 238000001574 biopsy Methods 0.000 description 1
- 238000004061 bleaching Methods 0.000 description 1
- 210000000601 blood cell Anatomy 0.000 description 1
- 210000001124 body fluid Anatomy 0.000 description 1
- 239000010839 body fluid Substances 0.000 description 1
- 210000004413 cardiac myocyte Anatomy 0.000 description 1
- 230000015556 catabolic process Effects 0.000 description 1
- -1 cell Proteins 0.000 description 1
- 210000000170 cell membrane Anatomy 0.000 description 1
- 239000012916 chromogenic reagent Substances 0.000 description 1
- 230000000295 complement effect Effects 0.000 description 1
- 210000002808 connective tissue Anatomy 0.000 description 1
- 239000000470 constituent Substances 0.000 description 1
- 238000005520 cutting process Methods 0.000 description 1
- 210000000805 cytoplasm Anatomy 0.000 description 1
- 238000000354 decomposition reaction Methods 0.000 description 1
- 230000007423 decrease Effects 0.000 description 1
- 238000006731 degradation reaction Methods 0.000 description 1
- 238000012217 deletion Methods 0.000 description 1
- 230000037430 deletion Effects 0.000 description 1
- 230000037213 diet Effects 0.000 description 1
- 235000005911 diet Nutrition 0.000 description 1
- 235000013601 eggs Nutrition 0.000 description 1
- 230000003176 fibrotic effect Effects 0.000 description 1
- 239000000834 fixative Substances 0.000 description 1
- GNBHRKFJIUUOQI-UHFFFAOYSA-N fluorescein Chemical compound O1C(=O)C2=CC=CC=C2C21C1=CC=C(O)C=C1OC1=CC(O)=CC=C21 GNBHRKFJIUUOQI-UHFFFAOYSA-N 0.000 description 1
- 102000034287 fluorescent proteins Human genes 0.000 description 1
- 108091006047 fluorescent proteins Proteins 0.000 description 1
- 230000008014 freezing Effects 0.000 description 1
- 238000007710 freezing Methods 0.000 description 1
- 229910052736 halogen Inorganic materials 0.000 description 1
- 150000002367 halogens Chemical class 0.000 description 1
- 238000010191 image analysis Methods 0.000 description 1
- 238000003364 immunohistochemistry Methods 0.000 description 1
- 230000010354 integration Effects 0.000 description 1
- 230000003834 intracellular effect Effects 0.000 description 1
- 230000003902 lesion Effects 0.000 description 1
- 239000007788 liquid Substances 0.000 description 1
- 230000007774 longterm Effects 0.000 description 1
- 210000001365 lymphatic vessel Anatomy 0.000 description 1
- QSHDDOUJBYECFT-UHFFFAOYSA-N mercury Chemical compound [Hg] QSHDDOUJBYECFT-UHFFFAOYSA-N 0.000 description 1
- 229910052753 mercury Inorganic materials 0.000 description 1
- 229910044991 metal oxide Inorganic materials 0.000 description 1
- 150000004706 metal oxides Chemical class 0.000 description 1
- AYOOGWWGECJQPI-NSHDSACASA-N n-[(1s)-1-(5-fluoropyrimidin-2-yl)ethyl]-3-(3-propan-2-yloxy-1h-pyrazol-5-yl)imidazo[4,5-b]pyridin-5-amine Chemical compound N1C(OC(C)C)=CC(N2C3=NC(N[C@@H](C)C=4N=CC(F)=CN=4)=CC=C3N=C2)=N1 AYOOGWWGECJQPI-NSHDSACASA-N 0.000 description 1
- 230000017074 necrotic cell death Effects 0.000 description 1
- 210000002569 neuron Anatomy 0.000 description 1
- 238000012758 nuclear staining Methods 0.000 description 1
- 102000039446 nucleic acids Human genes 0.000 description 1
- 108020004707 nucleic acids Proteins 0.000 description 1
- 150000007523 nucleic acids Chemical class 0.000 description 1
- 210000004940 nucleus Anatomy 0.000 description 1
- 238000005457 optimization Methods 0.000 description 1
- 230000001151 other effect Effects 0.000 description 1
- 239000012188 paraffin wax Substances 0.000 description 1
- 230000007170 pathology Effects 0.000 description 1
- 230000002093 peripheral effect Effects 0.000 description 1
- 230000010287 polarization Effects 0.000 description 1
- 238000007781 pre-processing Methods 0.000 description 1
- 238000004088 simulation Methods 0.000 description 1
- 239000002904 solvent Substances 0.000 description 1
- 238000007447 staining method Methods 0.000 description 1
- 239000012128 staining reagent Substances 0.000 description 1
- 230000002194 synthesizing effect Effects 0.000 description 1
- 239000013076 target substance Substances 0.000 description 1
- 238000012546 transfer Methods 0.000 description 1
- 210000002700 urine Anatomy 0.000 description 1
- 230000000007 visual effect Effects 0.000 description 1
- 229910052724 xenon Inorganic materials 0.000 description 1
- FHNFHKCVQCLJFQ-UHFFFAOYSA-N xenon atom Chemical compound [Xe] FHNFHKCVQCLJFQ-UHFFFAOYSA-N 0.000 description 1
Images


Classifications
-
- G—PHYSICS
- G01—MEASURING; TESTING
- G01N—INVESTIGATING OR ANALYSING MATERIALS BY DETERMINING THEIR CHEMICAL OR PHYSICAL PROPERTIES
- G01N21/00—Investigating or analysing materials by the use of optical means, i.e. using sub-millimetre waves, infrared, visible or ultraviolet light
- G01N21/62—Systems in which the material investigated is excited whereby it emits light or causes a change in wavelength of the incident light
- G01N21/63—Systems in which the material investigated is excited whereby it emits light or causes a change in wavelength of the incident light optically excited
- G01N21/64—Fluorescence; Phosphorescence
Definitions
- the present disclosure relates to an information processing device, a biological sample observation system, and an image generation method.
- In vivo fluorescence imaging requires a color separation technology that separates staining fluorescence from unintended autofluorescence derived from living tissue.
- color separation techniques using techniques such as the least squares method and non-negative matrix factorization have been developed in order to spectrally separate the autofluorescence and extract the target staining fluorescence ( For example, see Patent Document 1).
- the present disclosure proposes an information processing device, a biological sample observation system, and an image generation method capable of appropriately evaluating the degree of fluorescence separation.
- An information processing apparatus superimposes an unstained image including an autofluorescence component and a dye tile image in which a reference spectrum of a first fluorescent dye and imaging noise for each pixel of the unstained image are associated.
- a simulated image generator that generates a simulated image;
- a fluorescence separator that separates the component of the first fluorescent dye and the autofluorescent component based on the simulated image to generate a separated image; and the separated image.
- an evaluation unit for evaluating the degree of separation of the
- a biological sample observation system includes an imaging device that acquires an unstained image containing an autofluorescent component, and an information processing device that processes the unstained image, wherein the information processing device includes the a simulated image generation unit that superimposes an unstained image and a dye tile image associated with a reference spectrum of a first fluorescent dye and imaging noise for each pixel of the unstained image to generate a simulated image; a fluorescence separating unit that separates the component of the first fluorescent dye and the autofluorescent component and generates a separated image based on the above, and an evaluating unit that evaluates the degree of separation of the separated image.
- An image generation method superimposes an unstained image containing an autofluorescent component and a dye tile image in which a reference spectrum of a first fluorescent dye and imaging noise for each pixel of the unstained image are associated. and generating a simulated image.
- FIG. 1 is a diagram illustrating an example of a schematic configuration of an information processing system according to a first embodiment
- FIG. 4 is a flow chart showing an example of the flow of processing by the information processing apparatus according to the first embodiment; It is a figure which shows an example of a schematic structure of the analysis part which concerns on 1st Embodiment.
- FIG. 4 is a diagram for explaining an example of a method for generating a concatenated fluorescence spectrum according to the first embodiment;
- FIG. It is a figure which shows an example of a schematic structure of the analysis part which concerns on 1st Embodiment.
- FIG. 4 is a diagram for explaining generation of a simulated image according to the first embodiment;
- FIG. 4 is a flowchart showing an example of the flow of simulated image generation processing according to the first embodiment;
- FIG. 4 is a diagram for explaining shot noise superimposition processing according to the first embodiment;
- 6 is a flowchart showing an example of the flow of quantitative evaluation processing according to the first embodiment;
- 4A and 4B are diagrams showing an example of a separated image and a histogram according to the first embodiment;
- FIG. FIG. 4 is a diagram for explaining calculation of a signal separation value based on a histogram according to the first embodiment;
- FIG. FIG. 4 is a diagram showing an example of a separated image according to the first embodiment;
- FIG. FIG. 4 is a diagram showing an example of a separated image according to the first embodiment;
- FIG. FIG. 4 is a diagram showing an example of a separated image according to the first embodiment;
- FIG. FIG. 4 is a diagram showing an example of a separated image according to the first embodiment;
- FIG. 4 is a diagram showing an example of a separated image according to the first embodiment;
- FIG. 4 is a bar graph showing signal separation values for each dye according to the first embodiment;
- 4 is a scatter diagram showing signal separation values for each dye according to the first embodiment;
- FIG. 1 is a diagram showing an example of a schematic configuration of a fluoroscopy apparatus according to a first embodiment;
- FIG. 3 is a diagram showing an example of a schematic configuration of an observation unit according to the first embodiment;
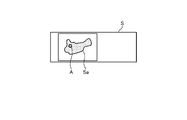
- FIG. FIG. 4 is a diagram showing an example of a sample according to the first embodiment;
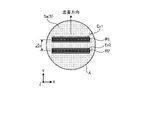
- FIG 4 is an enlarged view showing a region where the sample according to the first embodiment is irradiated with line illumination; It is a figure which shows an example of a schematic structure of the analysis part which concerns on 2nd Embodiment. It is a figure which shows roughly the whole structure of a microscope system. It is a figure which shows the example of an imaging system. It is a figure which shows the example of an imaging system. It is a figure which shows an example of the schematic structure of the hardware of an information processing apparatus.
- First Embodiment 1-1 Configuration example of information processing system 1-2. Processing example of information processing apparatus 1-3. Processing example of fluorescence separation 1-4. Configuration example of analysis unit related to quantitative evaluation 1-5. Processing example of simulated image creation 1-6. Processing example of quantitative evaluation 1-7. Image example of separated image 1-8. Image example of evaluation result image 1-9. Application example 1-10. Action and effect 2. Second Embodiment 2-1. Configuration example of analysis unit related to quantitative evaluation 2-2. Action and effect 3. Other embodiment4. Application example 5 . Hardware configuration example6. Supplementary note
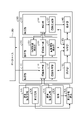
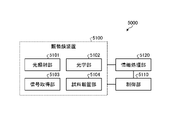
- FIG. 1 is a diagram showing an example of a schematic configuration of an information processing system according to this embodiment.
- An information processing system is an example of a biological sample observation system.
- the information processing system includes an information processing device 100 and a database 200. As inputs to this information processing system, there are a fluorescent reagent 10A, a sample 20A, and a fluorescently stained sample 30A.
- the fluorescent reagent 10A is a chemical used for staining the specimen 20A.
- the fluorescent reagent 10A is, for example, a fluorescent antibody (including a primary antibody used for direct labeling or a secondary antibody used for indirect labeling), a fluorescent probe, or a nuclear staining reagent. The type is not particularly limited to these.
- the fluorescent reagent 10A is managed with identification information (hereinafter referred to as "reagent identification information 11A") that can identify the fluorescent reagent 10A (and the production lot of the fluorescent reagent 10A).
- the reagent identification information 11A is, for example, barcode information (one-dimensional barcode information, two-dimensional barcode information, etc.), but is not limited to this.
- the fluorescent reagent 10A is the same (same type) product, its properties differ for each manufacturing lot depending on the manufacturing method, the state of the cells from which the antibody was obtained, and the like.
- spectral information, quantum yield, or fluorescent labeling rate also referred to as “F/P value: Fluorescein/Protein”, which indicates the number of fluorescent molecules that label the antibody
- F/P value Fluorescein/Protein
- the fluorescent reagent 10A is managed for each production lot by attaching reagent identification information 11A (in other words, the reagent information of each fluorescent reagent 10A is stored for each production lot). managed).
- the information processing apparatus 100 can separate the fluorescence signal and the autofluorescence signal while taking into account slight differences in properties that appear in each manufacturing lot.
- the management of the fluorescent reagent 10A in production lot units is merely an example, and the fluorescent reagent 10A may be managed in units smaller than the production lot.
- the specimen 20A is prepared from a specimen or tissue sample collected from a human body for the purpose of pathological diagnosis, clinical examination, or the like.
- the type of tissue used eg, organ or cell
- the type of target disease e.g., the type of target disease
- the subject's attributes e.g, age, sex, blood type, race, etc.
- the subject's lifestyle Habits e.g, eating habits, exercise habits, smoking habits, etc.
- the specimens 20A are managed with identification information (hereinafter referred to as "specimen identification information 21A") by which each specimen 20A can be identified.
- the specimen identification information 21A is, for example, barcode information (one-dimensional barcode information, two-dimensional barcode information, etc.), but is not limited to this.
- the properties of the specimen 20A differ depending on the type of tissue used, the type of target disease, the subject's attributes, or the subject's lifestyle.
- measurement channels or spectral information differ depending on the type of tissue used. Therefore, in the information processing system according to the present embodiment, the specimens 20A are individually managed by attaching specimen identification information 21A. Accordingly, the information processing apparatus 100 can separate the fluorescence signal and the autofluorescence signal while taking into consideration even slight differences in properties that appear in each specimen 20A.
- the fluorescently stained specimen 30A is created by staining the specimen 20A with the fluorescent reagent 10A.
- the fluorescence-stained specimen 30A assumes that the specimen 20A is stained with at least one fluorescent reagent 10A, and the number of fluorescent reagents 10A used for staining is not particularly limited.
- the staining method is determined by the combination of the specimen 20A and the fluorescent reagent 10A, and is not particularly limited.
- the fluorescence-stained specimen 30A is input to the information processing apparatus 100 and imaged.
- the information processing apparatus 100 includes an acquisition unit 110, a storage unit 120, a processing unit 130, a display unit 140, a control unit 150, and an operation unit 160, as shown in FIG.
- the acquisition unit 110 is configured to acquire information used for various processes of the information processing apparatus 100 .
- the acquisition section 110 includes an information acquisition section 111 and an image acquisition section 112 .
- the information acquisition unit 111 is configured to acquire reagent information and sample information. More specifically, the information acquisition unit 111 acquires the reagent identification information 11A attached to the fluorescent reagent 10A and the specimen identification information 21A attached to the specimen 20A used to generate the fluorescently stained specimen 30A. For example, the information acquisition unit 111 acquires the reagent identification information 11A and the specimen identification information 21A using a barcode reader or the like. Then, the information acquisition unit 111 acquires the reagent information based on the reagent identification information 11A and the specimen information based on the specimen identification information 21A from the database 200, respectively. The information acquisition unit 111 stores the acquired information in the information storage unit 121, which will be described later.
- the image acquisition unit 112 is configured to acquire image information of the fluorescently stained specimen 30A (the specimen 20A stained with at least one fluorescent reagent 10A). More specifically, the image acquisition unit 112 includes an arbitrary imaging device (for example, CCD, CMOS, etc.), and acquires image information by imaging the fluorescence-stained specimen 30A using the imaging device.
- image information is a concept that includes not only the image itself of the fluorescence-stained specimen 30A, but also measured values that are not visualized as images.
- the image information may include information on the wavelength spectrum of fluorescence emitted from the fluorescently stained specimen 30A (hereinafter referred to as fluorescence spectrum).
- the image acquisition unit 112 stores the image information in the image information storage unit 122, which will be described later.
- the storage unit 120 is configured to store (store) information used for various processes of the information processing apparatus 100 or information output by various processes. As shown in FIG. 1 , the storage unit 120 includes an information storage unit 121 , an image information storage unit 122 and an analysis result storage unit 123 .
- the information storage unit 121 is configured to store reagent information and specimen information acquired by the information acquisition unit 111 . Note that after the analysis processing by the analysis unit 131 and the image information generation processing (image information reconstruction processing) by the image generation unit 132, which will be described later, are completed, the information storage unit 121 stores the reagent information and specimen used for the processing. Free space may be increased by deleting information.
- the image information storage unit 122 is configured to store the image information of the fluorescence-stained specimen 30A acquired by the image acquisition unit 112 .
- the image information storage unit 122 Free space may be increased by deleting used image information.
- the analysis result storage unit 123 is configured to store the result of analysis processing performed by the analysis unit 131, which will be described later.
- the analysis result storage unit 123 stores the fluorescence signal of the fluorescent reagent 10A or the autofluorescence signal of the sample 20A separated by the analysis unit 131 .
- the analysis result storage unit 123 separately provides the result of the analysis processing to the database 200 in order to improve the analysis accuracy by machine learning or the like. After providing the analysis result to the database 200, the analysis result saving unit 123 may appropriately delete the analysis result saved by itself to increase the free space.
- the processing unit 130 is a functional configuration that performs various types of processing using image information, reagent information, and specimen information. As shown in FIG. 1 , the processing section 130 includes an analysis section 131 and an image generation section 132 .
- the analysis unit 131 is configured to perform various analysis processes using image information, specimen information, and reagent information. For example, the analysis unit 131 performs processing for separating the autofluorescence signal of the specimen 20A and the fluorescence signal of the fluorescent reagent 10A from the image information based on the specimen information and the reagent information.
- the analysis unit 131 recognizes one or more elements that make up the autofluorescence signal based on the measurement channel included in the specimen information. For example, the analysis unit 131 recognizes one or more autofluorescence components forming the autofluorescence signal. Then, the analysis unit 131 predicts the autofluorescence signal included in the image information using the spectral information of these autofluorescence components included in the specimen information. Then, the analysis unit 131 separates the autofluorescence signal and the fluorescence signal from the image information based on the spectral information of the fluorescent component of the fluorescent reagent 10A and the predicted autofluorescence signal included in the reagent information.
- the analysis unit 131 extracts from the image information (or the fluorescence signal separated from the autofluorescence signal) based on the specimen information and the reagent information.
- the fluorescent signal of each of these two or more fluorescent reagents 10A is separated.
- the analysis unit 131 uses the spectral information of the fluorescent component of each fluorescent reagent 10A included in the reagent information to separate the fluorescent signal of each fluorescent reagent 10A from the entire fluorescent signal after being separated from the autofluorescent signal. do.
- the analysis unit 131 extracts the image information (or the autofluorescence signal separated from the fluorescence signal) based on the specimen information and the reagent information. Separate the autofluorescent signal for each individual autofluorescent component. For example, the analysis unit 131 separates the autofluorescence signal of each autofluorescence component from the entire autofluorescence signal separated from the fluorescence signal using the spectral information of each autofluorescence component included in the specimen information.
- the analysis unit 131 that separates the fluorescence signal and the autofluorescence signal performs various processes using these signals. For example, the analysis unit 131 performs subtraction processing (also referred to as “background subtraction processing”) on the image information of the other specimen 20A using the autofluorescence signal after separation, thereby A fluorescent signal may be extracted from the image information.
- subtraction processing also referred to as “background subtraction processing”
- the autofluorescence signal of these specimens 20A are likely to be similar.
- the similar specimen 20A here is, for example, a tissue section before staining of a tissue section to be stained (hereinafter referred to as section), a section adjacent to the stained section, the same block (sampled from the same place as the stained section) ), or sections from different blocks in the same tissue (sampled from different locations than the stained sections), sections taken from different patients, and the like. Therefore, when the autofluorescence signal can be extracted from a certain specimen 20A, the analysis unit 131 extracts the fluorescence signal from the image information of the other specimen 20A by removing the autofluorescence signal from the image information of the other specimen 20A. may be extracted. Further, when the analysis unit 131 calculates the S/N value using the image information of the other specimen 20A, the S/N value can be improved by using the background after removing the autofluorescence signal. can.
- the analysis unit 131 can also perform various processes using the separated fluorescence signal or the autofluorescence signal. For example, the analysis unit 131 uses these signals to analyze the immobilization state of the specimen 20A, objects included in the image information (e.g., cells, intracellular structures (cytoplasm, cell membrane, nucleus, etc.), or Segmentation (or region division) for recognizing tissue regions (tumor regions, non-tumor regions, connective tissue, blood vessels, blood vessel walls, lymphatic vessels, fibrotic structures, necrosis, etc.) can be performed.
- tissue regions tumor regions, non-tumor regions, connective tissue, blood vessels, blood vessel walls, lymphatic vessels, fibrotic structures, necrosis, etc.
- the analysis and segmentation of the immobilized state of the specimen 20A will be detailed later.
- the image generation unit 132 is configured to generate (reconstruct) image information based on the fluorescence signal or the autofluorescence signal separated by the analysis unit 131 .
- the image generator 132 can generate image information containing only fluorescence signals, or image information containing only autofluorescence signals.
- the image generation unit 132 generates image information for each component. be able to.
- image generation The unit 132 may generate image information indicating the results of those processes.
- the distribution information of the fluorescent reagent 10A labeled on the target molecule or the like that is, the two-dimensional spread and intensity of the fluorescence, the wavelength, and the positional relationship between them can be visualized. It is possible to improve the visibility of the user, such as a doctor or a researcher, in the tissue image analysis area.
- the image generation unit 132 may control to distinguish the fluorescence signal from the autofluorescence signal based on the fluorescence signal or the autofluorescence signal separated by the analysis unit 131, and generate image information. Specifically, it improves the brightness of the fluorescent spectrum of the fluorescent reagent 10A labeled with the target molecule or the like, extracts only the fluorescent spectrum of the labeled fluorescent reagent 10A and changes its color, and is labeled with two or more fluorescent reagents 10A.
- Fluorescence spectra of two or more fluorescent reagents 10A are extracted from the sample 20A and each is changed to a different color, only the autofluorescence spectrum of the sample 20A is extracted and divided or subtracted, the dynamic range is improved, and the like are controlled to control the image. information may be generated. As a result, the user can clearly distinguish the color information derived from the fluorescent reagent bound to the target substance of interest, and the user's visibility can be improved.
- Display unit 140 presents the image information generated by the image generation unit 132 to the user by displaying it on the display.
- the type of display used as display unit 140 is not particularly limited. Further, although not described in detail in this embodiment, the image information generated by the image generation unit 132 may be presented to the user by being projected by a projector or printed by a printer (in other words, image information is not particularly limited).
- control unit 150 The control unit 150 is a functional configuration that controls overall processing performed by the information processing apparatus 100 .
- the control unit 150 performs various processes such as those described above (for example, imaging processing, analysis processing, and image information generation processing of the fluorescently stained specimen 30A) based on the operation input by the user performed via the operation unit 160. (reconstruction processing of image information), display processing of image information, etc.).
- the control content of the control part 150 is not specifically limited.
- the control unit 150 may control processing (for example, processing related to an OS (Operating System)) generally performed in general-purpose computers, PCs, tablet PCs, and the like.
- OS Operating System
- the operation unit 160 is configured to receive an operation input from the user. More specifically, the operation unit 160 includes various input means such as a keyboard, mouse, buttons, touch panel, or microphone. input can be performed. Information regarding the operation input performed via the operation unit 160 is provided to the control unit 150 .
- the database 200 is a device that manages sample information, reagent information, and analysis processing results. More specifically, the database 200 associates and manages the specimen identification information 21A and the specimen information, and the reagent identification information 11A and the reagent information. Accordingly, the information acquisition unit 111 can acquire specimen information from the database 200 based on the specimen identification information 21A of the specimen 20A to be measured, and reagent information based on the reagent identification information 11A of the fluorescent reagent 10A.
- the specimen information managed by the database 200 is, as described above, information including the measurement channel and spectrum information specific to the autofluorescence component contained in the specimen 20A.
- the specimen information includes target information about each specimen 20A, specifically, the type of tissue used (eg, organ, cell, blood, body fluid, ascites, pleural effusion, etc.) Include information about the type of disease, attributes of the subject (e.g. age, gender, blood type, or race), or lifestyle habits of the subject (e.g. diet, exercise habits, smoking habits, etc.)
- the information including the measurement channel and spectrum information specific to the autofluorescent component contained in the specimen 20A and the target information may be associated with each specimen 20A.
- tissue used is not particularly limited to the tissue collected from the subject, and includes in vivo tissues such as humans and animals, cell strains, and solutions, solvents, solutes, and materials contained in the subject of measurement. may
- the reagent information managed by the database 200 is, as described above, information including the spectral information of the fluorescent reagent 10A.
- Information about the fluorescent reagent 10A such as labeling rate, quantum yield, bleaching coefficient (information indicating how easily the fluorescence intensity of the fluorescent reagent 10A decreases), and absorption cross-section (or molar extinction coefficient) may be included.
- the specimen information and reagent information managed by the database 200 may be managed in different configurations, and in particular, the information on reagents may be a reagent database that presents the user with the optimum combination of reagents.
- the specimen information and reagent information are provided by the manufacturer (manufacturer) or the like, or are independently measured within the information processing system according to the present disclosure.
- the manufacturer of the fluorescent reagent 10A often does not measure and provide spectral information, fluorescence labeling rate, etc. for each manufacturing lot. Therefore, by independently measuring and managing these pieces of information within the information processing system according to the present disclosure, the separation accuracy between the fluorescence signal and the autofluorescence signal can be improved.
- the database 200 stores specimen information and reagent information (especially reagent information) such as catalog values published by manufacturers (manufacturers) or literature values described in various literatures. may be used as However, in general, actual specimen information and reagent information often differ from catalog values and literature values, so specimen information and reagent information are measured independently within the information processing system according to the present disclosure as described above. Managed is better.
- the accuracy of analysis processing is improved by machine learning techniques that use specimen information, reagent information, and analysis processing results managed in the database 200.
- machine learning techniques that use specimen information, reagent information, and analysis processing results managed in the database 200.
- the analysis unit 131 of the information processing apparatus 100 performs learning will be described as an example.
- the analysis unit 131 uses a neural network to perform machine learning using learning data in which the fluorescent signal and autofluorescent signal after separation are associated with the image information, specimen information, and reagent information used for separation. Generate a classifier or estimator.
- the analysis unit 131 inputs the information to the classifier or the estimator, thereby obtaining the fluorescence signal and the autofluorescence signal included in the image information. can be predicted and output.
- the configuration example of the information processing system according to the present embodiment has been described above. Note that the above configuration described with reference to FIG. 1 is merely an example, and the configuration of the information processing system according to this embodiment is not limited to the example.
- the information processing apparatus 100 does not necessarily have all the functional configurations shown in FIG. Further, the information processing apparatus 100 may include the database 200 therein.
- the functional configuration of the information processing apparatus 100 can be flexibly modified according to specifications and operations.
- the information processing apparatus 100 may perform processing other than the processing described above.
- the reagent information includes information such as the quantum yield, fluorescence labeling rate, and absorption cross section (or molar extinction coefficient) of the fluorescent reagent 10A.
- Information and reagent information may be used to calculate the number of fluorescent molecules in image information, the number of antibodies bound to fluorescent molecules, and the like.
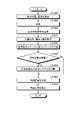
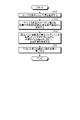
- FIG. 2 is a flowchart showing an example of the processing flow of the information processing apparatus 100 according to this embodiment.
- step S1000 the user determines the fluorescent reagent 10A and specimen 20A to be used for analysis.
- step S1004 the user creates a fluorescently stained specimen 30A by staining the specimen 20A with the fluorescent reagent 10A.
- step S1008 the image acquisition unit 112 of the information processing apparatus 100 acquires image information by imaging the fluorescence-stained specimen 30A.
- step S1012 the information acquisition unit 111 acquires the reagent information and specimen information based on the reagent identification information 11A attached to the fluorescent reagent 10A and the specimen identification information 21A attached to the specimen 20A used to generate the fluorescently stained specimen 30A. is obtained from the database 200 .
- step S1016 the analysis unit 131 separates the autofluorescence signal of the specimen 20A and the fluorescence signal of the fluorescent reagent 10A from the image information based on the specimen information and the reagent information.
- the fluorescence signal includes signals of a plurality of fluorochromes (step S1020/Yes)
- the analysis unit 131 separates the fluorescence signals of each fluorochrome in step S1024. Note that if the fluorescent signal does not include signals of a plurality of fluorescent dyes (step S1020/No), separation processing of the fluorescent signals of the respective fluorescent dyes is not performed in step S1024.
- step S1028 the image generation unit 132 uses the fluorescence signals separated by the analysis unit 131 to generate image information. For example, the image generation unit 132 generates image information from which the autofluorescence signal is removed from the image information, or generates image information in which the fluorescence signal is displayed for each fluorescent dye.
- step S1032 the display unit 140 displays the image information generated by the image generation unit 132, and the series of processing ends.
- each step in the flowchart of FIG. 2 does not necessarily have to be processed in chronological order according to the described order. That is, each step in the flow chart may be processed in a different order than the order described or in parallel.
- the analysis unit 131 separates the fluorescence signal of each fluorescent dye in step S1024.
- the fluorescence signal of each fluorochrome may be separated directly from the image information.
- the analysis unit 131 may separate the autofluorescence signal of the specimen 20A from the image information after separating the fluorescence signal of each fluorescent dye from the image information.
- the information processing apparatus 100 may also perform processing not shown in FIG.
- the analysis unit 131 may not only separate signals, but may also perform segmentation based on the separated fluorescent signal or autofluorescent signal, or may analyze the immobilization state of the specimen 20A.
- FIG. 3 is a diagram showing an example of a schematic configuration of the analysis unit 131 according to this embodiment.
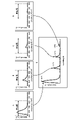
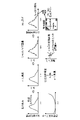
- FIG. 4 is a diagram for explaining an example of a method for generating a concatenated fluorescence spectrum according to this embodiment.
- the analysis unit 131 includes a connection unit 1311, a color separation unit 1321, and a spectrum extraction unit 1322.
- This analysis unit 131 is configured to perform various types of processing including fluorescence separation processing.
- the analysis unit 131 is configured to concatenate fluorescence spectra as preprocessing for fluorescence separation processing and separate the concatenated fluorescence spectra for each molecule.
- connection unit 1311 is configured to generate a connection fluorescence spectrum by connecting at least part of the plurality of fluorescence spectra acquired by the image acquisition unit 112 in the wavelength direction.
- the connecting unit 1311 extracts data of a predetermined width in each fluorescence spectrum so as to include the maximum fluorescence intensity in each of the four fluorescence spectra (A to D in FIG. 4) acquired by the image acquisition unit 112. .
- the width of the wavelength band from which the connection unit 1311 extracts data can be determined based on the reagent information, the excitation wavelength, the fluorescence wavelength, or the like, and may be different for each fluorescent substance (in other words, the connection unit 1311 extracts the data.
- the width of the wavelength band to be extracted may be different for each of the fluorescence spectra shown in FIGS. 4A to 4D). Then, as shown in E of FIG. 4, the connecting unit 1311 generates one connected fluorescence spectrum by connecting the extracted data in the wavelength direction. Note that since the concatenated fluorescence spectrum is composed of data extracted from a plurality of fluorescence spectra, the wavelengths are not continuous at the boundaries of each concatenated data.
- the connecting unit 1311 performs the above connection after aligning the intensity of the excitation light corresponding to each of the plurality of fluorescence spectra based on the intensity of the excitation light (in other words, after correcting the plurality of fluorescence spectra). . More specifically, the connecting unit 1311 divides each fluorescence spectrum by the excitation power density, which is the intensity of the excitation light, to equalize the intensity of the excitation light corresponding to each of the plurality of fluorescence spectra, and then perform the above connection. conduct. As a result, fluorescence spectra are obtained when excitation light of the same intensity is applied.
- the intensity of the irradiated excitation light when the intensity of the irradiated excitation light is different, the intensity of the spectrum absorbed by the fluorescence-stained specimen 30A (hereinafter referred to as "absorption spectrum”) also differs according to the intensity. Therefore, as described above, by aligning the intensity of the excitation light corresponding to each of the plurality of fluorescence spectra, the absorption spectra can be appropriately evaluated.
- the fluorescently stained sample 30A contains, for example, four types of fluorescent substances, DAPI, CK/AF488, PgR/AF594 and ER/AF647, each of which has an excitation wavelength of 392 [nm] (Fig. 4 A), 470 [nm] (B in FIG. 4), 549 [nm] (C in FIG. 4), and 628 [nm] (D in FIG. 4) were irradiated. Specific examples of fluorescence spectra are shown.
- the fluorescence wavelength is shifted to longer wavelengths than the excitation wavelength (Stokes shift) due to the release of energy for fluorescence emission.
- the fluorescent substance contained in the fluorescently stained specimen 30A and the excitation wavelength of the irradiated excitation light are not limited to the above.
- the connecting part 1311 extracts the fluorescence spectrum SP1 in the wavelength band of 392 nm or more and 591 nm or less of the excitation wavelength from the fluorescence spectrum shown in A of FIG. Extract the fluorescence spectrum SP2 in the wavelength band of, extract the fluorescence spectrum SP3 in the wavelength band of 549 nm or more and 748 nm or less from the fluorescence spectrum shown in C of FIG. A fluorescence spectrum SP4 in a wavelength band of 827 nm or less is extracted.
- the connecting unit 1311 corrects the wavelength resolution of the extracted fluorescence spectrum SP1 to 16 nm (no intensity correction), corrects the intensity of the fluorescence spectrum SP2 to 1.2 times, and corrects the wavelength resolution to 8 nm,
- the intensity of the fluorescence spectrum SP3 is corrected to 1.5 times (no wavelength resolution correction)
- the intensity of the fluorescence spectrum SP4 is corrected to 4.0 times
- the wavelength resolution is corrected to 4 nm.
- the linking unit 1311 then links the corrected fluorescence spectra SP1 to SP4 in order to generate a linked fluorescence spectrum as shown in FIG. 4E.
- FIG. 4 shows a case where the connection unit 1311 extracts and connects the fluorescence spectra SP1 to SP4 with a predetermined bandwidth (200 nm width in FIG. 4) from the excitation wavelength when each fluorescence spectrum is acquired.
- the bandwidth of the fluorescence spectrum extracted by the connecting part 1311 does not need to be the same for each fluorescence spectrum, and may be different. That is, the region extracted from each fluorescence spectrum by the connecting part 1311 may be a region including the peak wavelength of each fluorescence spectrum, and its wavelength band and bandwidth may be changed as appropriate. At that time, spectral wavelength deviation due to Stokes shift may be taken into consideration. By narrowing down the wavelength band to be extracted in this way, it is possible to reduce the amount of data, so that fluorescence separation processing can be executed at a higher speed.
- the intensity of pumping light in this description may be pumping power or pumping power density, as described above.
- the excitation power or excitation power density may be the power or power density obtained by actually measuring the excitation light emitted from the light source, or the power or power density obtained from the driving voltage applied to the light source. It should be noted that the intensity of the excitation light in this description refers to the excitation power density, the absorption rate of the section to be observed for each excitation light, and the detection system (image acquisition unit 112, etc.) that detects the fluorescence emitted from the section. It may be a value obtained by correcting with a signal amplification factor or the like.
- the intensity of the excitation light in this description may be the power density of the excitation light that actually contributes to the excitation of the fluorescent substance, or a value obtained by correcting the power density with the amplification factor of the detection system.
- the absorption rate and amplification factor it is possible to appropriately correct the intensity of the excitation light that changes according to changes in the machine state and environment, enabling more accurate color separation.
- a concatenated fluorescence spectrum can be generated.
- the correction value based on the intensity of the excitation light for each fluorescence spectrum is not limited to a value for matching the intensity of the excitation light corresponding to each of the plurality of fluorescence spectra, and can be variously modified. good.
- the signal intensity of fluorescence spectra having intensity peaks on the long wavelength side tends to be lower than the signal intensity of fluorescence spectra having intensity peaks on the short wavelength side. Therefore, when the combined fluorescence spectrum includes both a fluorescence spectrum with an intensity peak on the long wavelength side and a fluorescence spectrum with an intensity peak on the short wavelength side, the fluorescence spectrum with an intensity peak on the long wavelength side is hardly taken into account.
- only fluorescence spectra having intensity peaks on the short wavelength side may be extracted.
- a larger intensity correction value for a fluorescence spectrum having an intensity peak on the long wavelength side it is also possible to improve the separation accuracy of the fluorescence spectrum with an intensity peak on the short wavelength side.
- the color separation unit 1321 includes, for example, a first color separation unit 1321a and a second color separation unit 1321b. do.
- the first color separation unit 1321a separates the combined fluorescence spectrum of the stained sample input from the connection unit 1311 from the combined fluorescence reference spectrum included in the reagent information input from the information storage unit 121 into By executing color separation processing using the concatenated autofluorescence reference spectrum included in the specimen information, the concatenated fluorescence spectrum is separated into spectra for each molecule.
- color separation processing for example, least squares method (LSM), weighted least squares method (WLSM), nonnegative matrix factorization (NMF), nonnegative matrix factorization using Gram matrix tAA , and the like are used.
- LSM least squares method
- WLSM weighted least squares method
- NMF nonnegative matrix factorization
- Gram matrix tAA nonnegative matrix factorization using Gram matrix tAA
- the second color separation unit 1321b performs color separation processing on the combined fluorescence spectrum of the stained sample input from the connection unit 1311, using the adjusted combined autofluorescence reference spectrum input from the spectrum extraction unit 1322. This separates the concatenated fluorescence spectra into individual molecule spectra.
- the color separation processing similarly to the first color separation unit 1321a, for example, the least squares method (LSM), the weighted least squares method (WLSM), the non-negative matrix factorization (NMF), and the Gram matrix tAA . Non-negative matrix factorization, etc. may be used.
- the method of least squares calculates the color mixture rate by, for example, fitting the connected fluorescence spectrum generated by the connecting unit 1311 to the reference spectrum.
- weighting is performed so as to give importance to low signal level errors, using the Poisson distribution of the noise of the concatenated fluorescence spectrum (Signal), which is the measured value.
- the offset value is the upper limit value at which weighting is not performed by the weighted least squares method. The offset value is determined by the characteristics of the sensor used for measurement, and requires separate optimization when an imaging device is used as the sensor.
- the spectrum extraction unit 1322 is a configuration for improving the concatenated autofluorescence reference spectrum so as to obtain more accurate color separation results. Based on the color separation result by the color separation unit 1321, the reference spectrum is adjusted so that a more accurate color separation result can be obtained.
- the spectrum extraction unit 1322 performs spectrum extraction processing using the color separation result input from the first color separation unit 1321a on the concatenated autofluorescence reference spectrum input from the information storage unit 121, and based on the result
- the concatenated autofluorescence reference spectrum is adjusted by using the concatenated autofluorescence reference spectrum to improve the concatenated autofluorescence reference spectrum to yield more accurate color separation results.
- NMF non-negative matrix factorization
- SVD singular value decomposition
- FIG. 3 exemplifies the case where the connected autofluorescence reference spectrum is adjusted once, the present invention is not limited to this.
- the final color separation result may be acquired after repeating the process of readjusting the concatenated autofluorescence reference spectrum in the extraction unit 1322 one or more times.
- the first color separation unit 1321a and the second color separation unit 1321b perform fluorescence separation processing using reference spectra (connected autofluorescence reference spectrum and connected fluorescence reference spectrum) connected in the wavelength direction.
- reference spectra connected autofluorescence reference spectrum and connected fluorescence reference spectrum
- a unique spectrum can be output as a separation result (separation results are not separated for each excitation wavelength). Therefore, the practitioner can more easily obtain the correct spectrum.
- a reference spectrum (concatenated autofluorescence reference spectrum) related to autofluorescence used for separation is automatically acquired, and fluorescence separation processing is performed, so that the operator can detect autofluorescence from an appropriate space of the unstained section. It eliminates the need to extract spectra.
- the panel is determined based on the antigen expression rate, antibody dye labeling rate, dye brightness, and excitation efficiency, the characteristics of autofluorescence differ depending on the tissue site, so it cannot be used spatially. 4. In the above two systems, the spectral shape of the measured autofluorescence, the level to be imparted, and the noise level of the measurement system are unknown and cannot be considered at the time of panel design. .
- a dye tile image (fluorescence image) is generated by superimposing, in a tile shape, a dye spectrum to which noise characteristics corresponding to the imaging parameters are given on an unstained image obtained by imaging. And the non-stained image is synthesized to create an image simulating the actual measurement (simulated image).
- the accuracy of color separation can be quantitatively obtained as a signal separation value from the mean and variance of pixels.
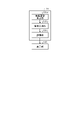
- FIG. 5 is a diagram showing an example of a schematic configuration of the analysis unit 131 according to this embodiment.
- FIG. 6 is a diagram for explaining generation of a simulated image according to this embodiment.
- the analysis unit 131 includes a simulated image generation unit 131a, a fluorescence separation unit 131b, and an evaluation unit 131c.
- the fluorescence separation section 131 b corresponds to the color separation section 1321 .
- the simulated image generation unit 131a generates a simulated image by superimposing an unstained image (background image) containing an autofluorescent component and a dye tile image (fluorescent image).
- a dye tile image is a group of dye tiles having a plurality of dye tiles. This dye tile image is, for example, an image in which a standard spectrum (reference spectrum) of a fluorescent dye (first fluorescent dye) is associated with imaging noise for each pixel of an unstained image.
- the intensity of the dye applied to the autofluorescence intensity of the unstained image is determined from the antigen expression rate, antibody labeling rate, dye excitation efficiency, dye emission efficiency, and the like.
- the autofluorescence component is intrinsic noise inherent in tissue samples. Intrinsic noise includes, for example, the standard spectrum of another fluorescent dye (second fluorescent dye) in the unstained image, in addition to the autofluorescence component of the unstained image.
- Imaging noise is, for example, noise that changes according to the imaging conditions of the non-stained image. The degree of this imaging noise will be quantified and visualized for each pixel. Imaging conditions for non-stained images include, for example, laser power, gain, exposure time, and the like.
- Imaging noise includes, for example, “1. unwanted signal noise due to autofluorescence”, “2. .Shot noise (random) that increases in accordance with the square root of the detected charge amount.
- the noise associated with, that is, given to the standard spectrum (tile image) is mainly the shot noise of 3 above. This is because 1 and 2 above are included in the background unstained image (autofluorescent image).
- the amount of shot noise to be imparted in 3 above can be determined from the number of photons (or the amount of charge) of the dye signal imparted to the tile.
- the charge amount of the background unstained image is calculated, the dye charge amount is determined from the calculated value, and the shot noise amount is further determined.
- Shot noise also called photon noise, is caused by physical fluctuations of the amount of photons that reach the sensor without taking a constant value. This shot noise cannot be eliminated no matter how much the circuit of the measurement system is improved.
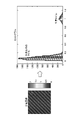
- the pigment tile is composed of 10 ⁇ 10 pixels (pixels for display) (approximately 0.3 ⁇ m/pixel). This is a case where an unstained image is taken at a magnification of 20 times, and when the magnification is changed, it is necessary to change the size of the dye tile according to the cell size.
- the size (size) of one pigment tile corresponds to the size of a cell
- the number of pixels in the pigment tile image corresponds to the number of pixels in the cell size.
- the smallest pixel unit is equal to the cell size.
- a dye tile image includes a plurality of types of dye tiles with different dyes, that is, standard spectra for each of a plurality of fluorescent dyes. It is also possible to evaluate the color separation performance under double dyeing conditions or triple dyeing conditions by mixing a plurality of dyes in one dye tile instead of one dye in one dye tile.
- the coloration pattern of the pigment tiles of nine colors is a pattern in which pigment tiles of the same color are arranged in diagonal stripes, but is not limited to this.
- the coloration pattern of each pigment tile may be a pattern in which pigment tiles of the same color are arranged in a vertical stripe pattern, a horizontal stripe pattern, a checkered pattern, or the like. Any color pattern may be used.
- the simulated image generation unit 131a acquires an unstained image (unstained tissue image) and imaging parameters as input parameters.
- Imaging parameters are an example of imaging conditions, and include, for example, laser power, gain, exposure time, and the like.
- the simulated image generation unit 131a generates dye tiles by adding noise characteristics corresponding to imaging parameters to the dye spectrum, repeatedly arranges the dye tiles for the number of dyes that the user wants to dye, and sets dye tile images as data. Generate.
- the fluorescence separating unit 131b separates the component of the first fluorescent dye and the autofluorescent component based on the simulated image generated by the simulated image generating unit 131a to generate a separated image.
- the fluorescence separator 131b performs color separation calculation on the simulated image (data set) to generate a separated image. Note that the fluorescence separation unit 131b is the color separation unit 1321 and performs the same processing as the color separation unit 1321 does.
- Color separation methods include, for example, LSM and NMF.
- the evaluation unit 131c evaluates the degree of separation of the separated images generated by the fluorescence separation unit 131b.
- the evaluation unit 131c determines the degree of separation of the separated images (the quality of the panel) from the average and variance of the color separation calculation results. For example, the evaluation unit 131c generates a histogram from the separated image, calculates a signal separation value between pigment and non-pigment from the histogram, and evaluates the degree of separation based on the signal separation value.
- the evaluation unit 131c expresses the color-separated positive and negative pixels in a histogram, and generates a graph showing the signal separation value, which is the numerical value of the calculation result of the color separation accuracy.
- the display unit 140 displays information and images indicating the evaluation results of the evaluation unit 131c (for example, the signal separation value for each dye). For example, the display unit 140 displays a graph, diagram, or the like showing the signal separation value for each dye generated by the evaluation unit 131c. Thereby, the user can grasp the evaluation result of the evaluation unit 131c.
- FIG. 7 is a flowchart showing an example of the flow of simulated image generation processing according to this embodiment.
- FIG. 8 is a diagram for explaining shot noise superimposition processing according to the present embodiment.
- step S11 the user selects a combination of antibodies and dyes that the user wants to stain.
- the simulated image generator 131a determines the spectral intensity of the dye to be applied from the autofluorescence intensity of the unstained image to be superimposed.
- the simulated image generation unit 131a creates a fluorescent image (dye tile image) by repeatedly arranging the dye tiles while adding noise (imaging noise) considering the noise level at the time of imaging and measurement to each pixel. do.
- the simulated image generator 131a superimposes the created fluorescence image on the unstained image. This completes the simulated image.
- the spectral intensity of the dye to be applied to the autofluorescence intensity of the non-stained image is determined.
- the brightness of the dye spectrum given to the autofluorescence intensity of the non-stained image is determined by the flow of (a) to (c) below.
- the simulated image generator 131a acquires the intensity of the peak position of 16 nm (two channels from the maximum value) of each dye spectrum, and integrates the values.
- the simulated image generator 131a acquires the autofluorescence intensity of the background image.
- the simulated image generator 131a integrates spectral intensities of background images corresponding to two channels of peak positions of each dye.
- the spectral intensity of the wavelength channel of the background image is the average value of all pixels.
- the simulated image generation unit 131a gives the autofluorescence intensity of the background image from the antigen expression rate, the antibody labeling rate, the dye excitation efficiency, the dye emission efficiency, and the like. Determine dye intensity.
- the simulated image generator 131a obtains and adjusts the magnification of the dye spectrum from the spectrum intensities obtained in (a) and (b) above so as to obtain the set dye intensity. Note that the magnification is obtained from the following formula (1).
- Formula (1) is a formula relating to how to determine the dye intensity for the autofluorescence.
- noise superimposition corresponding to the imaging parameters is performed.
- the noise characteristics of a CMOS which is a recording device, consist of dark current and readout noise that increase in proportion to the exposure time, and shot noise that is proportional to the square root of the signal intensity.
- dark current noise and readout noise components are already included in the unstained image actually measured, so only the shot noise component needs to be added to the dye spectrum to be superimposed. Shot noise superimposition is performed in the following flow from (a) to (d).
- the simulated image generation unit 131a divides the dye spectrum by the wavelength calibration data (the conversion coefficient from the camera output value to the spectral radiance) to restore the AD value.
- the simulated image generation unit 131a converts the AD value into the charge amount e ⁇ from the gain and the pixel saturation charge amount when the background image is captured.
- Formula (2) is a charge amount conversion formula.
- F( ⁇ ) standard spectrum of dye
- Cor( ⁇ ) wavelength calibration data
- H conversion coefficient
- E( ⁇ ) charge amount
- Equation (3) is a shot noise superposition equation.
- FIG. 8 shows the flow of (a) to (d) above. Since the dye spectrum created in the flow of (a) to (d) above corresponds to one pixel of the image, it is repeatedly arranged as a dye tile of 10 ⁇ 10 pixels to create a fluorescence image (dye tile image). .
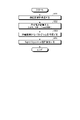
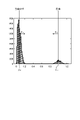
- FIG. 9 is a flowchart showing an example of the flow of quantitative evaluation processing according to this embodiment.
- FIG. 10 is a diagram showing an example of separated images and histograms according to this embodiment.
- FIG. 11 is a diagram for explaining calculation of a signal separation value based on a histogram according to this embodiment.
- step S21 the fluorescence separator 131b receives the simulated image.
- step S22 the fluorescence separator 131b performs color separation calculation on the simulated image.
- step S23 the evaluation unit 131c creates a histogram from the separated images.
- step S24 the evaluation unit 131c calculates a signal separation value.
- the fluorescence separation unit 131b performs color separation using a color separation algorithm (for example, LSM, NMF, etc.) to be evaluated using the dye spectrum set and the autofluorescence spectrum set used as input values. do.
- a color separation algorithm for example, LSM, NMF, etc.
- step S23 after the color separation calculation, the evaluation unit 131c generates a histogram from the separated image for each dye, as shown in FIG.
- step S24 above the evaluation unit 131c regards the average brightness of 10 ⁇ 10 pixels corresponding to one cell and one tile as one signal, and calculates the average brightness of all tiles as shown in FIG.
- Formula (4) is a formula for calculating a signal separation value.
- ⁇ _0 average value of tiles other than dye to be evaluated
- ⁇ _1 average value of tiles of dye to be evaluated
- ⁇ _1 standard deviation of tiles of dye to be evaluated
- ⁇ _2 standard deviation of tiles other than dye to be evaluated (Fig. 11 reference).
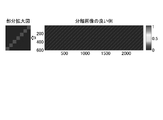
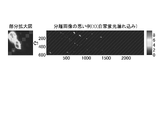
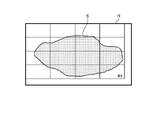
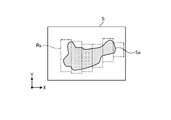
- FIGS. 12 to 14 are diagrams each showing an example of a separated image according to this embodiment.
- FIG. 12 is a good example of the separated image
- FIG. 13 is a bad example 1 of the separated image (autofluorescence leakage)
- FIG. 14 is a bad example 2 of the separated image (autofluorescence leakage).
- These images are displayed by the display unit 140 as needed. The presence or absence of this display may be selectable by the user's input operation on the operation unit 160 .
- FIG. 12 there is no autofluorescence leakage in the separated images.
- a partially enlarged view is shown, but even in this partially enlarged view there is no leakage of autofluorescence.
- FIG. 13 there is autofluorescence leakage in the separated images.
- a partially enlarged view of a portion with autofluorescence leakage is shown, and there is strong autofluorescence leakage.
- FIG. 14 there is autofluorescence leakage in the separated images.
- FIG. 14 similar to FIG. 13, a partially enlarged view of the portion where autofluorescence leaks in is shown, but there is strong autofluorescence leak.
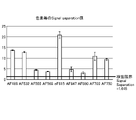
- FIG. 15 is a bar graph showing signal separation values for each dye according to this embodiment.
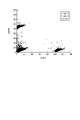
- FIG. 16 is a scatter diagram showing signal separation values for each dye according to this embodiment.
- the display unit 140 displays a bar graph showing the signal separation value for each dye. Further, as shown in FIG. 16, the display unit 140 displays a scatter diagram showing the signal separation value for each dye. This scatter diagram is a scatter diagram showing leakage between dyes having similar excitations. These bar flags and scatter diagrams are generated by the evaluation unit 131 c and output to the display unit 140 .
- the bar graph and the scatter diagram are images showing the evaluation result of the evaluation unit 131c, and are only examples. The presence or absence of this display and the display mode (for example, the display mode of a bar graph, a scatter diagram, etc.) may be selectable by a user's input operation on the operation unit 160 .
- the cell size is increased by the number of dyes to be stained.
- a stained image (simulated image) simulating the actual measurement is created by repeatedly arranging the dye tiles of the number corresponding to the number of pixels and superimposing them on the unstained image. This makes it possible to reflect the characteristics of the spectrum shape and noise level of the measured autofluorescence, so that a simulated image can be created under all imaging conditions.
- the simulated image generating unit 131a generates a dye tile image by superimposing, in a tile shape, a dye spectrum to which noise characteristics corresponding to the imaging parameters are given on an unstained image obtained by imaging, and generates a dye tile image and a non-stained image.
- An image (simulated image) that simulates the actual measurement is created by synthesizing the stained images.
- the accuracy of the color separation algorithm is a numerical value called the signal separation value obtained from the variance and average.
- evaluation of combinations of dyes and combinations of dyes and reagents can also be obtained quantitatively as numerical values.
- quantitative evaluation can be performed on tissue sites (different tissues) having different autofluorescence spectra, and composite evaluation is also possible.
- the accuracy of a color separation algorithm is visually evaluated qualitatively, but according to this embodiment, a quantitative evaluation can be performed to select the optimum color separation algorithm.
- the accuracy of color separation can be quantitatively evaluated under any staining conditions.
- composite evaluation since composite evaluation is possible, it is possible to design a more optimal panel. Furthermore, evaluation can be performed even when the influence of overlap of dyes and autofluorescence is large.
- the autofluorescence characteristics differ depending on the tissue site, spatial composite evaluation can also be performed. The panel design can be simulated while considering the noise level of the measurement system.
- DAPI 4,',6-Diamidino-2-phenylindole, dihydrochloride
- the color separation algorithm can be evaluated and the panel can be designed, taking DAPI leakage into consideration.
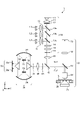
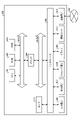
- FIG. 17 is a diagram showing an example of a schematic configuration of a fluoroscopy apparatus 500 according to this embodiment.
- FIG. 18 is a diagram showing an example of a schematic configuration of the observation unit 1 according to this embodiment.
- the fluorescence observation device 500 has an observation unit 1, a processing unit 2, and a display section 3.
- the observation unit 1 includes an excitation section (irradiation section) 10, a stage 20, a spectral imaging section 30, an observation optical system 40, a scanning mechanism 50, a focus mechanism 60, and a non-fluorescent observation section 70.
- the excitation unit 10 irradiates the observation object with a plurality of irradiation lights with different wavelengths.
- the excitation unit 10 irradiates a pathological specimen (pathological sample), which is an object to be observed, with a plurality of line illuminations with different wavelengths arranged in parallel with different axes.
- the stage 20 is a table for supporting a pathological specimen, and is configured to be movable by the scanning mechanism 50 in a direction perpendicular to the direction of line light from the line illumination.
- the spectroscopic imaging unit 30 includes a spectroscope, and obtains a fluorescence spectrum (spectral data) of a pathological specimen linearly excited by line illumination.
- the observation unit 1 functions as a line spectroscope that acquires spectral data according to line illumination.
- the observation unit 1 captures, for each line, a plurality of fluorescence images generated by an imaging target (pathological specimen) for each of a plurality of fluorescence wavelengths, and acquires data of the captured plurality of fluorescence images in the order of the lines. It also functions as an imaging device.
- different axes parallel means that the multiple line illuminations are different axes and parallel.
- a different axis means not coaxial, and the distance between the axes is not particularly limited.
- Parallel is not limited to being parallel in a strict sense, but also includes a state of being substantially parallel. For example, there may be distortion derived from an optical system such as a lens, or deviation from a parallel state due to manufacturing tolerances, and such cases are also regarded as parallel.
- the excitation unit 10 and the spectral imaging unit 30 are connected to the stage 20 via an observation optical system 40.
- the observation optical system 40 has a function of following the optimum focus by the focus mechanism 60 .
- the observation optical system 40 may be connected to a non-fluorescent observation section 70 for performing dark-field observation, bright-field observation, and the like.
- the observation unit 1 may be connected with a control section 80 that controls the excitation section 10, the spectral imaging section 30, the scanning mechanism 50, the focusing mechanism 60, the non-fluorescent observation section 70, and the like.
- the processing unit 2 includes a storage section 21 , a data proofreading section 22 and an image forming section 23 .
- the processing unit 2 Based on the fluorescence spectrum of the pathological specimen (hereinafter also referred to as sample S) acquired by the observation unit 1, the processing unit 2 typically forms an image of the pathological specimen or calculates the distribution of the fluorescence spectrum. Output.
- the image here refers to the composition ratio of pigments that compose the spectrum, the autofluorescence derived from the sample, the waveform converted to RGB (red, green and blue) colors, the luminance distribution of a specific wavelength band, and the like.
- the storage unit 21 includes a nonvolatile storage medium such as a hard disk drive or flash memory, and a storage control unit that controls writing and reading of data to and from the storage medium.
- the storage unit 21 stores spectral data indicating the correlation between each wavelength of light emitted by each of the plurality of line illuminations included in the excitation unit 10 and fluorescence received by the camera of the spectral imaging unit 30 .
- the storage unit 21 stores in advance information indicating the standard spectrum of autofluorescence of a sample (pathological specimen) to be observed, and information indicating the standard spectrum of a single dye that stains the sample.
- the data calibration unit 22 configures the spectral data stored in the storage unit 21 based on the captured image captured by the camera of the spectral imaging unit 30 .
- the image forming unit 23 forms a fluorescence image of the sample based on the spectral data and the intervals ⁇ y between the plurality of line illuminations irradiated by the excitation unit 10 .
- the processing unit 2 including the data proofreading unit 22, the image forming unit 23, etc. is a CPU (Central Processing Unit), a RAM (Random Access Memory), a ROM (Read Only Memory), and other hardware elements and necessary components used in a computer. It is realized by a program (software). Instead of or in addition to CPU, PLD (Programmable Logic Device) such as FPGA (Field Programmable Gate Array), DSP (Digital Signal Processor), other ASIC (Application Specific Integrated Circuit), etc. may be used. good.
- the display unit 3 displays various information such as an image based on the fluorescence image formed by the image forming unit 23, for example.
- the display section 3 may be configured by, for example, a monitor integrally attached to the processing unit 2 or may be a display device connected to the processing unit 2 .
- the display unit 3 includes, for example, a display element such as a liquid crystal device or an organic EL device, and a touch sensor, and is configured as a UI (User Interface) for displaying input settings of imaging conditions, captured images, and the like.
- UI User Interface
- the excitation unit 10 includes two line illuminations Ex1 and Ex2 each emitting light of two wavelengths.
- the line illumination Ex1 emits light with a wavelength of 405 nm and light with a wavelength of 561 nm
- the line illumination Ex2 emits light with a wavelength of 488 nm and light with a wavelength of 645 nm.
- the excitation unit 10 has a plurality of (four in this example) excitation light sources L1, L2, L3, and L4.
- Each of the excitation light sources L1 to L4 is composed of a laser light source that outputs laser light with wavelengths of 405 nm, 488 nm, 561 nm and 645 nm, respectively.
- each of the excitation light sources L1 to L4 is composed of a light emitting diode (LED), a laser diode (LD), or the like.
- the excitation unit 10 includes a plurality of collimator lenses 11, a plurality of laser line filters 12, a plurality of dichroic mirrors 13a, 13b, 13c, a homogenizer 14, and a condenser lens 15 so as to correspond to the respective excitation light sources L1 to L4. , and an entrance slit 16 .
- the laser light emitted from the excitation light source L1 and the laser light emitted from the excitation light source L3 are collimated by a collimator lens 11, respectively, and then transmitted through a laser line filter 12 for cutting the skirt of each wavelength band. and are made coaxial by the dichroic mirror 13a.
- the two coaxial laser beams are further beam-shaped by a homogenizer 14 such as a fly-eye lens and a condenser lens 15 to form line illumination Ex1.
- the laser light emitted from the excitation light source L2 and the laser light emitted from the excitation light source L4 are coaxially coaxial with each other by the dichroic mirrors 13b and 13c, and line illumination is performed so that the line illumination Ex2 has a different axis from the line illumination Ex1. become.
- the line illuminations Ex1 and Ex2 form off-axis line illuminations (primary images) separated by a distance ⁇ y at the entrance slit 16 (slit conjugate) having a plurality of slit portions each passable.
- the primary image is irradiated onto the sample S on the stage 20 via the observation optical system 40 .
- the observation optical system 40 has a condenser lens 41 , dichroic mirrors 42 and 43 , an objective lens 44 , a bandpass filter 45 , and a condenser lens (an example of an imaging lens) 46 .
- the line illuminations Ex1 and Ex2 are collimated by a condenser lens 41 paired with an objective lens 44, reflected by dichroic mirrors 42 and 43, transmitted through the objective lens 44, and irradiated onto the sample S on the stage 20. .
- FIG. 19 is a diagram showing an example of the sample S according to this embodiment.
- FIG. 19 shows a state in which the sample S is viewed from the irradiation directions of line illuminations Ex1 and Ex2, which are excitation lights.
- the sample S is typically composed of a slide containing an observation object Sa such as a tissue section as shown in FIG.
- the observation target Sa is, for example, a biological sample such as nucleic acid, cell, protein, bacterium, or virus.
- a sample S (observation target Sa) is dyed with a plurality of fluorescent dyes.
- the observation unit 1 enlarges the sample S to a desired magnification and observes it.
- FIG. 20 is an enlarged view of the area A in which the sample S according to the present embodiment is irradiated with the line illuminations Ex1 and Ex2.
- two line illuminations Ex1 and Ex2 are arranged in area A, and imaging areas R1 and R2 of spectral imaging section 30 are arranged so as to overlap with the respective line illuminations Ex1 and Ex2.
- the two line illuminations Ex1 and Ex2 are each parallel to the Z-axis direction and arranged apart from each other by a predetermined distance ⁇ y in the Y-axis direction.
- line illuminations Ex1 and Ex2 are formed as shown in FIG. Fluorescence excited in the sample S by these line illuminations Ex1 and Ex2 is collected by the objective lens 44 and reflected by the dichroic mirror 43, as shown in FIG. It passes through the pass filter 45 , is condensed again by the condenser lens 46 , and enters the spectral imaging section 30 .
- the spectral imaging unit 30 includes an observation slit (aperture) 31, an image sensor 32, a first prism 33, a mirror 34, a diffraction grating 35 (wavelength dispersion element), and a second prism. 36.
- the imaging element 32 is configured including two imaging elements 32a and 32b.
- the imaging device 32 captures (receives) a plurality of lights (fluorescence, etc.) wavelength-dispersed by the diffraction grating 35 .
- a two-dimensional imager such as a CCD (Charge Coupled Device) or a CMOS (Complementary Metal Oxide Semiconductor) is adopted as the imaging device 32 .
- the observation slit 31 is arranged at the condensing point of the condenser lens 46 and has the same number of slit parts as the number of excitation lines (two in this example).
- the fluorescence spectra derived from the two excitation lines that have passed through the observation slit 31 are separated by the first prism 33 and reflected by the grating surfaces of the diffraction grating 35 via the mirrors 34, respectively, so that the fluorescence spectra of the excitation wavelengths are further divided into separated.
- the four separated fluorescence spectra are incident on the imaging devices 32a and 32b via the mirror 34 and the second prism 36, and the spectral data represented by the position x in the line direction and the wavelength ⁇ (x, ⁇ ).
- the spectral data (x, ⁇ ) is a pixel value of a pixel at position x in the row direction and at wavelength ⁇ in the column direction among the pixels included in the image sensor 32 . Note that the spectroscopic data (x, ⁇ ) may be simply described as spectroscopic data.
- the pixel size [nm/Pixel] of the imaging elements 32a and 32b is not particularly limited, and is set to, for example, 2 [nm/Pixel] or more and 20 [nm/Pixel] or less.
- This dispersion value may be realized by the pitch of the diffraction grating 35, optically, or by hardware binning of the imaging elements 32a and 32b.
- a dichroic mirror 42 and a bandpass filter 45 are inserted in the optical path to prevent the excitation light (line illuminations Ex1 and Ex2) from reaching the imaging device 32 .
- Each of the line illuminations Ex1 and Ex2 is not limited to being configured with a single wavelength, and may each be configured with a plurality of wavelengths. If the line illuminations Ex1 and Ex2 each consist of multiple wavelengths, the fluorescence excited by them also contains multiple spectra.
- the spectroscopic imaging unit 30 has a wavelength dispersive element for separating the fluorescence into spectra derived from the excitation wavelengths.
- the wavelength dispersive element is composed of a diffraction grating, a prism, or the like, and is typically arranged on the optical path between the observation slit 31 and the imaging element 32 .
- stage 20 and the scanning mechanism 50 constitute an XY stage, and in order to acquire a fluorescence image of the sample S, the sample S is moved in the X-axis direction and the Y-axis direction.
- WSI whole slide imaging
- the operation of scanning the sample S in the Y-axis direction, moving in the X-axis direction, and then scanning in the Y-axis direction is repeated.
- dye spectra (fluorescence spectra) excited at different excitation wavelengths which are spatially separated by a distance ⁇ y on the sample S (observation object Sa), are continuously scanned in the Y-axis direction. can be obtained.
- the scanning mechanism 50 changes the position of the sample S irradiated with the irradiation light over time. For example, the scanning mechanism 50 scans the stage 20 in the Y-axis direction.
- the scanning mechanism 50 can scan the stage 20 with the plurality of line illuminations Ex1 and Ex2 in the Y-axis direction, that is, in the arrangement direction of the line illuminations Ex1 and Ex2. This is not limited to this example, and a plurality of line illuminations Ex1 and Ex2 may be scanned in the Y-axis direction by a galvanomirror arranged in the middle of the optical system.
- Data derived from each of the line illuminations Ex1 and Ex2 is data whose coordinates are shifted by a distance ⁇ y about the Y axis. Based on the value of the distance ⁇ y calculated from the output, it is corrected and output.
- the non-fluorescent observation section 70 is composed of a light source 71, a dichroic mirror 43, an objective lens 44, a condenser lens 72, an imaging device 73, and the like.
- the example of FIG. 18 shows an observation system using dark field illumination.
- the light source 71 is arranged on the side of the stage 20 facing the objective lens 44, and irradiates the sample S on the stage 20 with illumination light from the side opposite to the line illuminations Ex1 and Ex2.
- the light source 71 illuminates from outside the NA (numerical aperture) of the objective lens 44 , and the light (dark field image) diffracted by the sample S passes through the objective lens 44 , the dichroic mirror 43 and the condenser lens 72 . Then, the image sensor 73 takes a picture.
- dark field illumination even seemingly transparent samples such as fluorescently stained samples can be observed with contrast.
- the non-fluorescent observation unit 70 is not limited to an observation system that acquires a dark field image, but is an observation system capable of acquiring non-fluorescent images such as bright field images, phase contrast images, phase images, and in-line hologram images. may consist of For example, various observation methods such as the Schlieren method, the phase contrast method, the polarizing observation method, and the epi-illumination method can be employed as methods for obtaining non-fluorescent images.
- the position of the illumination light source is also not limited to below the stage 20 , and may be above the stage 20 or around the objective lens 44 . In addition to the method of performing focus control in real time, other methods such as a pre-focus map method in which focus coordinates (Z coordinates) are recorded in advance may be employed.
- the line illumination as excitation light is composed of two line illuminations Ex1 and Ex2, but is not limited to this, and may be three, four, or five or more.
- Each line illumination may also include multiple excitation wavelengths selected to minimize degradation of color separation performance.
- the excitation light source is composed of a plurality of excitation wavelengths, and if each excitation wavelength and the data obtained by the imaging device 32 are linked and recorded, a different axis can be obtained. It does not give as much resolution as parallelism, but it does give a multicolor spectrum.
- FIGS. 17 and 18 An application example in which the technology according to the present disclosure is applied to the fluorescence observation device 500 has been described above.
- the configuration described above with reference to FIGS. 17 and 18 is merely an example, and the configuration of the fluorescence observation apparatus 500 according to this embodiment is not limited to the example.
- the fluoroscopy apparatus 500 does not necessarily have all of the configurations shown in FIGS. 17 and 18, and may have configurations not shown in FIGS.
- the non-stained image containing the autofluorescent component, the standard spectrum (reference spectrum) of the first fluorescent dye, and the imaging noise for each pixel of the non-stained image are associated.
- a simulated image generator 131a that superimposes the dye tile image to generate a simulated image
- a fluorescence separator 131b that separates the component of the first fluorescent dye and the autofluorescent component based on the simulated image to generate a separated image.
- an evaluation unit 131c for evaluating the degree of separation of the separated image.
- a simulated image is generated, color separation processing is performed on the simulated image to generate a separated image, and the degree of separation of the separated image is evaluated.
- the dye tile image includes the standard spectrum of the second fluorescent dye in addition to the first fluorescent dye, and the individual standard spectra of the first and second fluorescent dyes and the imaging noise of each pixel of the unstained image are combined. It may be an associated image. Thereby, simulated images corresponding to a plurality of fluorescent dyes can be generated.
- the imaging noise may be noise that changes according to the imaging conditions of the non-stained image. This makes it possible to generate a simulated image corresponding to the imaging conditions of the non-stained image.
- the imaging conditions for the non-stained image may include at least one or all of laser power, gain, and exposure time. This makes it possible to generate a simulated image corresponding to those pieces of information.
- the pigment tile image may be a pigment tile group having a plurality of pigment tiles. Thereby, a simulated image corresponding to each dye tile can be generated.
- each of the multiple pigment tiles may be the same as the size of the cell. This allows a simulated image to be generated corresponding to each dye tile that is the same size as the cell.
- a plurality of pigment tiles may be arranged in a predetermined color scheme pattern. As a result, it is possible to perform color separation processing on the simulated image corresponding to each dye tile based on the predetermined coloration pattern, so that the color separation processing can be performed efficiently.
- the degree of imaging noise may be quantified or visualized for each dye tile. Accordingly, when the degree of imaging noise is quantified, a simulated image corresponding to the quantified degree of imaging noise can be generated. Also, if the degree of imaging noise is visualized, the user can grasp the degree of imaging noise.
- the simulated image generation unit 131a may generate a dye tile image by repeatedly arranging pigment tiles for the number of pigments specified by the user. As a result, it is possible to generate a simulated image corresponding to the number of dye tiles specified by the user.
- the simulated image generation unit 131a may mix a plurality of pigments to create pigment tiles. This makes it possible to evaluate the color separation performance (for example, color separation accuracy) under double dyeing conditions, triple dyeing conditions, and the like.
- the simulated image generation unit 131a may also determine the spectral intensity of the dye to be applied to the autofluorescence intensity of the non-stained image. This makes it possible to reproduce staining conditions where the dye brightness level is not large relative to the autofluorescence intensity, and to distinguish between dyes and pixels with autofluorescence.
- the simulated image generator 131a may superimpose imaging noise on the standard spectrum of the first fluorescent dye. This allows the dye tile image to be generated by associating the standard spectrum with the imaging noise.
- the imaging noise to be superimposed may be shot noise.
- a dye tile image corresponding to shot noise can be generated.
- the fluorescence separation unit 131b performs color separation calculation including at least one of the least squares method, weighted least squares method, and non-negative matrix factorization to separate the components of the first fluorescent dye and the autofluorescence components. good. Accordingly, color separation processing can be performed with high accuracy.
- the evaluation unit 131c may generate a histogram from the separated image, calculate the signal separation value between the pigment and the non-pigment from the histogram, and evaluate the degree of separation based on the signal separation value. This makes it possible to evaluate the degree of separation with high accuracy. For example, when the signal separation value exceeds a predetermined value (for example, 1.645), the degree of separation is evaluated as good.
- a predetermined value for example, 1.645
- FIG. 21 is a diagram showing an example of a schematic configuration of the analysis unit 131 according to this embodiment.
- the analysis unit 131 includes a recommendation unit 131d in addition to the simulation image generation unit 131a, the fluorescence separation unit 131b, and the evaluation unit 131c according to the first embodiment.
- the recommendation unit 131d recommends the optimum reagent (fluorescent reagent 10A) from among the dyes specified by the user, based on the degree of separation evaluated by the evaluation unit 131c. For example, the recommendation unit 131d generates and displays an image (e.g., a table, a diagram, etc.) for presenting the user with spatial information evaluation by tissues with different autofluorescence spectra and the optimal combination of dyes for the tissue.
- the unit 140 displays the image generated by the recommendation unit 131d. This allows the user to view the displayed image and grasp the optimum combination of dyes.
- the evaluation unit 131c calculates a signal separation value for a combination of dyes used for staining or a combination of a dye and a reagent.
- the recommending unit 131d generates an image for presenting to the user which combination is optimal based on the calculation result (for example, the signal separation value for each combination).
- the recommendation unit 131d excludes dyes whose signal separation value does not exceed 1.645, and generates an image showing the optimum combination.
- an image eg, table, diagram, etc.
- a plurality of recommended combinations together with color separation performance eg, signal separation value
- an image (eg, a table, etc.) showing matrix information showing combinations of antibodies and dyes may be displayed for reference.
- a recommendation unit 131d that recommends the optimum reagent (fluorescent reagent 10A) corresponding to the pigment specified by the user based on the degree of separation. As a result, the user can grasp the optimum reagent, so that the user's convenience can be improved.
- the recommendation unit 131d may generate an image (for example, a table, a diagram, etc.) showing a combination of dyes or a combination of dyes and reagents.
- an image for example, a table, a diagram, etc.
- the user can grasp the combination of dyes or the combination of dyes and reagents, thereby improving convenience for the user.
- the recommendation unit 131d may generate an image (for example, a diagram) showing the combination of the antibody and the dye. As a result, the user can grasp the combination of the antibody and the dye, so that the user's convenience can be improved.
- each component of each device illustrated is functionally conceptual and does not necessarily need to be physically configured as illustrated.
- the specific form of distribution and integration of each device is not limited to the one shown in the figure, and all or part of them can be functionally or physically distributed and integrated in arbitrary units according to various loads and usage conditions. Can be integrated and configured.
- the technology according to the present disclosure can be applied to, for example, a microscope system.
- a configuration example of a microscope system 5000 that can be applied will be described below with reference to FIGS. 22 to 24.
- FIG. A microscope device 5100 that is part of the microscope system 5000 functions as an imaging device.
- a configuration example of the microscope system of the present disclosure is shown in FIG.
- a microscope system 5000 shown in FIG. 22 includes a microscope device 5100 , a control section 5110 and an information processing section 5120 .
- a microscope device 5100 includes a light irradiation section 5101 , an optical section 5102 , and a signal acquisition section 5103 .
- the microscope device 5100 may further include a sample placement section 5104 on which the biological sample S is placed.
- the configuration of the microscope apparatus is not limited to that shown in FIG. 22.
- the light irradiation unit 5101 may exist outside the microscope apparatus 5100. It may be used as the unit 5101 .
- the light irradiation section 5101 may be arranged such that the sample mounting section 5104 is sandwiched between the light irradiation section 5101 and the optical section 5102, and may be arranged on the side where the optical section 5102 exists, for example.
- the microscope apparatus 5100 may be configured to be able to perform one or more of bright field observation, phase contrast observation, differential interference contrast observation, polarization observation, fluorescence observation, and dark field observation.
- the microscope system 5000 may be configured as a so-called WSI (Whole Slide Imaging) system or a digital pathology imaging system, and can be used for pathological diagnosis.
- Microscope system 5000 may also be configured as a fluorescence imaging system, in particular a multiplex fluorescence imaging system.
- the microscope system 5000 may be used to perform intraoperative pathological diagnosis or remote pathological diagnosis.
- the microscope device 5100 acquires data of the biological sample S obtained from the subject of the surgery, and transfers the data to the information processing unit 5120. can send.
- the microscope device 5100 can transmit the acquired data of the biological sample S to the information processing unit 5120 located in a place (another room, building, or the like) away from the microscope device 5100 .
- the information processing section 5120 receives and outputs the data.
- a user of the information processing unit 5120 can make a pathological diagnosis based on the output data.
- the biological sample S may be a sample containing a biological component.
- the biological components may be tissues, cells, liquid components of a living body (blood, urine, etc.), cultures, or living cells (cardiomyocytes, nerve cells, fertilized eggs, etc.).
- the biological sample may be a solid, a specimen fixed with a fixative such as paraffin, or a solid formed by freezing.
- the biological sample can be a section of the solid.
- a specific example of the biological sample is a section of a biopsy sample.
- the biological sample may be one that has undergone processing such as staining or labeling.
- the treatment may be staining for indicating the morphology of biological components or for indicating substances (surface antigens, etc.) possessed by biological components, examples of which include HE (Hematoxylin-Eosin) staining and immunohistochemistry staining. be able to.
- the biological sample may be treated with one or more reagents, and the reagents may be fluorescent dyes, chromogenic reagents, fluorescent proteins, or fluorescently labeled antibodies.
- the specimen may be one prepared from a tissue sample for the purpose of pathological diagnosis or clinical examination. Moreover, the specimen is not limited to the human body, and may be derived from animals, plants, or other materials.
- the specimen may be the type of tissue used (such as an organ or cell), the type of target disease, the subject's attributes (such as age, sex, blood type, or race), or the subject's lifestyle. The properties differ depending on habits (for example, eating habits, exercise habits, smoking habits, etc.).
- the specimens may be managed with identification information (bar code, QR code (registered trademark), etc.) that allows each specimen to be identified.
- the light irradiation unit 5101 is a light source for illuminating the biological sample S and an optical unit for guiding the light irradiated from the light source to the specimen.
- the light source may irradiate the biological sample with visible light, ultraviolet light, or infrared light, or a combination thereof.
- the light source may be one or more of a halogen light source, a laser light source, an LED light source, a mercury light source, and a xenon light source.
- a plurality of types and/or wavelengths of light sources may be used in fluorescence observation, and may be appropriately selected by those skilled in the art.
- the light irradiator may have a transmissive, reflective, or episcopic (coaxial or lateral) configuration.
- the optical section 5102 is configured to guide the light from the biological sample S to the signal acquisition section 5103 .
- the optical section can be configured to allow the microscope device 5100 to observe or image the biological sample S.
- Optical section 5102 may include an objective lens.
- the type of objective lens may be appropriately selected by those skilled in the art according to the observation method.
- the optical section may include a relay lens for relaying the image magnified by the objective lens to the signal acquisition section.
- the optical unit may further include optical components other than the objective lens and the relay lens, an eyepiece lens, a phase plate, a condenser lens, and the like.
- the optical section 5102 may further include a wavelength separation section configured to separate light having a predetermined wavelength from the light from the biological sample S.
- the wavelength separation section can be configured to selectively allow light of a predetermined wavelength or wavelength range to reach the signal acquisition section.
- the wavelength separator may include, for example, one or more of a filter that selectively transmits light, a polarizing plate, a prism (Wollaston prism), and a diffraction grating.
- the optical components included in the wavelength separation section may be arranged, for example, on the optical path from the objective lens to the signal acquisition section.
- the wavelength separation unit is provided in the microscope apparatus when fluorescence observation is performed, particularly when an excitation light irradiation unit is included.
- the wavelength separator may be configured to separate fluorescent light from each other or white light and fluorescent light.
- the signal acquisition unit 5103 can be configured to receive light from the biological sample S and convert the light into an electrical signal, particularly a digital electrical signal.
- the signal acquisition unit may be configured to acquire data on the biological sample S based on the electrical signal.
- the signal acquisition unit may be configured to acquire data of an image (image, particularly a still image, a time-lapse image, or a moving image) of the biological sample S, particularly an image magnified by the optical unit. It can be configured to acquire data.
- the signal acquisition unit includes one or more imaging elements, such as CMOS or CCD, having a plurality of pixels arranged one-dimensionally or two-dimensionally.
- the signal acquisition unit may include an image sensor for acquiring a low-resolution image and an image sensor for acquiring a high-resolution image, or an image sensor for sensing such as AF and an image sensor for image output for observation. and may include
- the image pickup device includes a signal processing unit (including one or more of CPU, DSP, and memory) that performs signal processing using pixel signals from each pixel, and pixel signals and an output control unit for controlling the output of the image data generated from and the processed data generated by the signal processing unit.
- An imaging device including the plurality of pixels, the signal processing section, and the output control section may preferably be configured as a one-chip semiconductor device.
- the microscope system 5000 may further include an event detection sensor.
- the event detection sensor includes a pixel that photoelectrically converts incident light, and can be configured to detect, as an event, a change in luminance of the pixel exceeding a predetermined threshold.
- the event detection sensor can in particular be asynchronous.
- the control unit 5110 controls imaging by the microscope device 5100 .
- the control unit can drive the movement of the optical unit 5102 and/or the sample placement unit 5104 to adjust the positional relationship between the optical unit and the sample placement unit.
- the control unit 5110 can move the optical unit and/or the sample placement unit in a direction toward or away from each other (for example, the optical axis direction of the objective lens). Further, the control section may move the optical section and/or the sample placement section in any direction on a plane perpendicular to the optical axis direction.
- the control unit may control the light irradiation unit 5101 and/or the signal acquisition unit 5103 for imaging control.
- the sample mounting section 5104 may be configured such that the position of the biological sample on the sample mounting section can be fixed, and may be a so-called stage.
- the sample mounting section 5104 can be configured to move the position of the biological sample in the optical axis direction of the objective lens and/or in a direction perpendicular to the optical axis direction.
- the information processing section 5120 can acquire data (such as imaging data) acquired by the microscope device 5100 from the microscope device 5100 .
- the information processing section can perform image processing on the imaging data.
- the image processing may include an unmixing process, in particular a spectral unmixing process.
- the unmixing process is a process of extracting data of light components of a predetermined wavelength or wavelength range from the imaging data to generate image data, or removing data of light components of a predetermined wavelength or wavelength range from the imaging data. It can include processing and the like.
- the image processing may include autofluorescence separation processing for separating the autofluorescence component and dye component of the tissue section, and fluorescence separation processing for separating the wavelengths between dyes having different fluorescence wavelengths.
- autofluorescence signals extracted from one may be used to remove autofluorescence components from image information of the other specimen.
- the information processing section 5120 may transmit data for imaging control to the control section 5110, and the control section 5110 receiving the data may control imaging by the microscope apparatus 5100 according to the data.
- the information processing section 5120 may be configured as an information processing device such as a general-purpose computer, and may include a CPU, RAM, and ROM.
- the information processing section may be included in the housing of the microscope device 5100 or may be outside the housing. Also, various processes or functions by the information processing unit may be realized by a server computer or cloud connected via a network.
- a method of imaging the biological sample S by the microscope device 5100 may be appropriately selected by a person skilled in the art according to the type of the biological sample and the purpose of imaging. An example of the imaging method will be described below.
- the microscope device can first identify an imaging target region.
- the imaging target region may be specified so as to cover the entire region where the biological sample exists, or a target portion (target tissue section, target cell, or target lesion portion) of the biological sample. ) may be specified to cover
- the microscope device divides the imaging target region into a plurality of divided regions of a predetermined size, and the microscope device sequentially images each divided region. As a result, an image of each divided area is obtained.
- the microscope device specifies an imaging target region R that covers the entire biological sample S. Then, the microscope device divides the imaging target region R into 16 divided regions. The microscope device can then image the segmented region R1, and then image any region included in the imaging target region R, such as a region adjacent to the segmented region R1. Then, image capturing of the divided areas is performed until there are no unimaged divided areas. Areas other than the imaging target area R may also be imaged based on the captured image information of the divided areas. After imaging a certain divided area, the positional relationship between the microscope device and the sample mounting section is adjusted in order to image the next divided area. The adjustment may be performed by moving the microscope device, moving the sample placement unit, or moving both of them.
- the image capturing device that captures each divided area may be a two-dimensional image sensor (area sensor) or a one-dimensional image sensor (line sensor).
- the signal acquisition section may capture an image of each divided area via the optical section.
- the imaging of each divided area may be performed continuously while moving the microscope device and/or the sample mounting section, or the movement of the microscope apparatus and/or the sample mounting section may be performed when imaging each divided area. may be stopped.
- the imaging target area may be divided so that the divided areas partially overlap each other, or the imaging target area may be divided so that the divided areas do not overlap.
- Each divided area may be imaged multiple times by changing imaging conditions such as focal length and/or exposure time.
- the information processing apparatus can stitch a plurality of adjacent divided areas to generate image data of a wider area. By performing the stitching process over the entire imaging target area, it is possible to obtain an image of a wider area of the imaging target area. Also, image data with lower resolution can be generated from the image of the divided area or the image subjected to the stitching process.
- the microscope device can first identify an imaging target region.
- the imaging target region may be specified so as to cover the entire region where the biological sample exists, or the target portion (target tissue section or target cell-containing portion) of the biological sample. may be specified.
- the microscope device scans a part of the imaging target area (also referred to as a "divided scan area") in one direction (also referred to as a "scanning direction”) in a plane perpendicular to the optical axis to capture an image. do.
- the scanning of the divided scan area is completed, the next divided scan area next to the scan area is scanned. These scanning operations are repeated until the entire imaging target area is imaged. As shown in FIG.
- the microscope device identifies a region (gray portion) in which a tissue section exists in the biological sample S as an imaging target region Sa. Then, the microscope device scans the divided scan area Rs in the imaging target area Sa in the Y-axis direction. After completing the scanning of the divided scan region Rs, the microscope device scans the next divided scan region in the X-axis direction. This operation is repeated until scanning is completed for the entire imaging target area Sa.
- the positional relationship between the microscope device and the sample placement section is adjusted for scanning each divided scan area and for imaging the next divided scan area after imaging a certain divided scan area. The adjustment may be performed by moving the microscope device, moving the sample placement unit, or moving both of them.
- the imaging device that captures each divided scan area may be a one-dimensional imaging device (line sensor) or a two-dimensional imaging device (area sensor).
- the signal acquisition section may capture an image of each divided area via an enlarging optical system.
- the imaging of each divided scan area may be performed continuously while moving the microscope device and/or the sample placement unit.
- the imaging target area may be divided so that the divided scan areas partially overlap each other, or the imaging target area may be divided so that the divided scan areas do not overlap.
- Each divided scan area may be imaged multiple times by changing imaging conditions such as focal length and/or exposure time.
- the information processing apparatus can stitch a plurality of adjacent divided scan areas to generate image data of a wider area. By performing the stitching process over the entire imaging target area, it is possible to obtain an image of a wider area of the imaging target area.
- image data with lower resolution can be generated from images of divided scan regions or images subjected to stitching processing.
- FIG. 25 is a block diagram showing an example of a schematic hardware configuration of the information processing apparatus 100. As shown in FIG. Various types of processing by the information processing apparatus 100 are realized by, for example, cooperation between software and hardware described below.
- the information processing apparatus 100 includes a CPU (Central Processing Unit) 901, a ROM (Read Only Memory) 902, a RAM (Random Access Memory) 903, and a host bus 904a.
- the information processing apparatus 100 also includes a bridge 904 , an external bus 904 b , an interface 905 , an input device 906 , an output device 907 , a storage device 908 , a drive 909 , a connection port 911 , a communication device 913 and a sensor 915 .
- the information processing apparatus 100 may have a processing circuit such as a DSP or ASIC in place of or together with the CPU 901 .
- the CPU 901 functions as an arithmetic processing device and a control device, and controls general operations within the information processing device 100 according to various programs.
- the CPU 901 may be a microprocessor.
- the ROM 902 stores programs, calculation parameters, and the like used by the CPU 901 .
- the RAM 903 temporarily stores programs used in the execution of the CPU 901, parameters that change as appropriate during the execution, and the like.
- the CPU 901 can embody at least the processing unit 130 and the control unit 150 of the information processing apparatus 100, for example.
- the CPU 901, ROM 902 and RAM 903 are interconnected by a host bus 904a including a CPU bus.
- the host bus 904a is connected via a bridge 904 to an external bus 904b such as a PCI (Peripheral Component Interconnect/Interface) bus.
- PCI Peripheral Component Interconnect/Interface
- the host bus 904a, the bridge 904 and the external bus 904b do not necessarily have to be configured separately, and these functions may be implemented in one bus.
- the input device 906 is implemented by a device such as a mouse, keyboard, touch panel, button, microphone, switch, lever, etc., through which information is input by the practitioner. Further, the input device 906 may be, for example, a remote control device using infrared rays or other radio waves, or may be an externally connected device such as a mobile phone or PDA corresponding to the operation of the information processing device 100. . Furthermore, the input device 906 may include, for example, an input control circuit that generates an input signal based on information input by the practitioner using the above input means and outputs the signal to the CPU 901 . By operating the input device 906, the practitioner can input various data to the information processing apparatus 100 and instruct processing operations. The input device 906 can embody at least the operation unit 160 of the information processing device 100, for example.
- the output device 907 is formed by a device capable of visually or audibly notifying the practitioner of the acquired information.
- Such devices include display devices such as CRT display devices, liquid crystal display devices, plasma display devices, EL display devices and lamps, audio output devices such as speakers and headphones, and printer devices.
- the output device 907 can embody at least the display unit 140 of the information processing device 100, for example.
- the storage device 908 is a device for storing data.
- the storage device 908 is implemented by, for example, a magnetic storage device such as an HDD, a semiconductor storage device, an optical storage device, a magneto-optical storage device, or the like.
- the storage device 908 may include a storage medium, a recording device that records data on the storage medium, a reading device that reads data from the storage medium, a deletion device that deletes data recorded on the storage medium, and the like.
- the storage device 908 stores programs executed by the CPU 901, various data, and various data acquired from the outside.
- the storage device 908 can embody at least the storage unit 120 of the information processing device 100, for example.
- the drive 909 is a reader/writer for storage media, and is built in or externally attached to the information processing apparatus 100 .
- the drive 909 reads out information recorded on a removable storage medium such as a mounted magnetic disk, optical disk, magneto-optical disk, or semiconductor memory, and outputs the information to the RAM 903 .
- Drive 909 can also write information to a removable storage medium.
- connection port 911 is an interface connected to an external device, and is a connection port with an external device capable of data transmission by, for example, USB (Universal Serial Bus).
- USB Universal Serial Bus
- the communication device 913 is, for example, a communication interface formed by a communication device or the like for connecting to the network 920 .
- the communication device 913 is, for example, a communication card for wired or wireless LAN (Local Area Network), LTE (Long Term Evolution), Bluetooth (registered trademark), or WUSB (Wireless USB).
- the communication device 913 may be a router for optical communication, a router for ADSL (Asymmetric Digital Subscriber Line), a modem for various types of communication, or the like.
- This communication device 913 can transmit and receive signals and the like to and from the Internet and other communication devices, for example, according to a predetermined protocol such as TCP/IP.
- the sensor 915 in this embodiment includes a sensor capable of acquiring a spectrum (e.g., an imaging device, etc.), other sensors (e.g., acceleration sensor, gyro sensor, geomagnetic sensor, pressure sensor, sound sensor, or range sensor, etc.).
- the sensor 915 may embody at least the image acquisition unit 112 of the information processing device 100, for example.
- the network 920 is a wired or wireless transmission path for information transmitted from devices connected to the network 920 .
- the network 920 may include a public network such as the Internet, a telephone network, a satellite communication network, various LANs (Local Area Networks) including Ethernet (registered trademark), WANs (Wide Area Networks), and the like.
- Network 920 may also include a dedicated line network such as IP-VPN (Internet Protocol-Virtual Private Network).
- a hardware configuration example capable of realizing the functions of the information processing apparatus 100 has been shown above.
- Each component described above may be implemented using general-purpose members, or may be implemented by hardware specialized for the function of each component. Therefore, it is possible to appropriately change the hardware configuration to be used according to the technical level at which the present disclosure is implemented.
- a computer-readable recording medium storing such a computer program can also be provided. Recording media include, for example, magnetic disks, optical disks, magneto-optical disks, flash memories, and the like. Also, the above computer program may be distributed, for example, via a network without using a recording medium.
- the present technology can also take the following configuration.
- the dye tile image includes a reference spectrum of a second fluorochrome in addition to the first fluorochrome, and a pixel-by-pixel imaging of the individual reference spectra of the first fluorochrome and the second fluorochrome and the unstained image. is an image associated with noise, The information processing apparatus according to (1) above.
- the imaging noise is noise that changes according to the imaging conditions of the unstained image.
- the imaging conditions for the non-stained image include at least one or all of laser power, gain and exposure time, The information processing device according to (3) above. (5) wherein the dye tile image is a dye tile group having a plurality of dye tiles; The information processing apparatus according to any one of (1) to (4) above.
- the individual size of the plurality of dye tiles is the same as the size of a cell;
- the plurality of pigment tiles are arranged in a predetermined color scheme pattern, The information processing apparatus according to (5) or (6) above.
- the degree of imaging noise is quantified or visualized for each dye tile;
- the simulated image generation unit repeatedly arranges the pigment tiles for the number of pigments specified by the user to generate the pigment tile image.
- the simulated image generation unit creates the dye tile by mixing multiple dyes.
- the simulated image generation unit determines the spectral intensity of the dye to be applied to the autofluorescence intensity of the unstained image, The information processing apparatus according to any one of (1) to (10) above. (12) The simulated image generator superimposes the imaging noise on the reference spectrum of the first fluorescent dye. The information processing apparatus according to any one of (1) to (11) above. (13) The imaging noise is shot noise, The information processing device according to (12) above. (14) The fluorescence separation unit separates the first fluorescent dye component and the autofluorescence component by color separation calculation including at least one of a least squares method, a weighted least squares method, and a non-negative matrix factorization. The information processing apparatus according to any one of (1) to (13) above.
- the evaluation unit generating a histogram from the separated images; Calculate the signal separation value between the dye and the non-dye from the histogram, assessing the degree of separation based on the signal separation value;
- the information processing apparatus according to any one of (1) to (14) above.
- the recommendation unit generates an image showing a combination of dyes or a combination of dyes and the reagent.
- the recommender generates an image showing the antibody and dye combination.
- an imaging device that acquires an unstained image containing an autofluorescent component
- an information processing device that processes the unstained image
- the information processing device is a simulated image generator that generates a simulated image by superimposing the unstained image and a dye tile image in which the reference spectrum of the first fluorescent dye and the imaging noise for each pixel of the unstained image are associated; a fluorescence separation unit that separates the component of the first fluorescent dye and the autofluorescence component based on the simulated image to generate a separated image; an evaluation unit that evaluates the degree of separation of the separated image;
- a biological sample observation system is a simulated image generator that generates a simulated image by superimposing the unstained image and a dye tile image in which the reference spectrum of the first fluorescent dye and the imaging noise for each pixel of the unstained image are associated
- a fluorescence separation unit that separates the component of the first fluorescent dye and the autofluorescence component based on the simulated image to generate a separated image
- an evaluation unit that evaluates the degree of separation
- image generation comprising superimposing an unstained image containing an autofluorescence component and a dye tile image associated with a reference spectrum of a first fluorescent dye and imaging noise for each pixel of the unstained image to generate a simulated image;
- Method. A biological sample observation system comprising the information processing device according to any one of (1) to (18) above.
- observation unit 2 processing unit 3 display unit 10 excitation unit 10A fluorescent reagent 11A reagent identification information 20 stage 20A specimen 21 storage unit 21A specimen identification information 22 data calibration unit 23 image forming unit 30 spectroscopic imaging unit 30A fluorescence-stained specimen 40 observation optical system 50 scanning mechanism 60 focusing mechanism 70 non-fluorescent observation unit 80 control unit 100 information processing device 110 acquisition unit 111 information acquisition unit 112 image acquisition unit 120 storage unit 121 information storage unit 122 image information storage unit 123 analysis result storage unit 130 processing unit 131 Analysis unit 131a Simulated image generation unit 131b Fluorescence separation unit 131c Evaluation unit 131d Recommendation unit 132 Image generation unit 140 Display unit 150 Control unit 160 Operation unit 200 Database 500 Fluorescence observation device 1311 Connection unit 1321 Color separation unit 1321a First color separation unit 1321b Second color separation unit 1322 spectrum extraction unit 5000 microscope system 5100 microscope device 5101 light irradiation unit 5102 optical unit 5103 signal acquisition unit 5104 sample placement unit 5110 control unit 5120 information processing unit
Abstract
An information processing device according to one embodiment of this disclosure comprises a simulated image generation unit (131a) that generates a simulated image by superimposing an unstained image including an autofluorescence component and a pigment tile image in which a reference spectrum of a first fluorescent pigment and the image noise of each pixel of the unstained image are associated, a fluorescence separation unit (131b) that generates a separated image from the simulated image by separating a first fluorescent pigment component and the autofluorescence component, and an evaluation unit (131c) that evaluates the degree of the separation of the separated image.
Description
本開示は、情報処理装置、生体試料観察システム及び画像生成方法に関する。
The present disclosure relates to an information processing device, a biological sample observation system, and an image generation method.
生体蛍光イメージングでは、染色蛍光と生体組織由来の意図しない自家蛍光を分離する色分離技術が必要である。例えば、マルチプレックス蛍光イメージング技術では、自家蛍光をスペクトル分離して目的の染色蛍光を抽出するために、最小二乗法や非負値行列因子分解などの手法を用いた色分離技術が開発されている(例えば、特許文献1参照)。
In vivo fluorescence imaging requires a color separation technology that separates staining fluorescence from unintended autofluorescence derived from living tissue. For example, in multiplex fluorescence imaging technology, color separation techniques using techniques such as the least squares method and non-negative matrix factorization have been developed in order to spectrally separate the autofluorescence and extract the target staining fluorescence ( For example, see Patent Document 1).
しかしながら、色分離精度の評価は目視による定性評価のみであるため、アルゴリズム間の評価が難しく、定量的に評価をすることができない。この定量評価ができない理由としては、色素同士の重なり合いや自家蛍光に対して色素輝度レベルが大きくない染色条件において正しい評価ができないことや、自家蛍光スペクトルが生体組織部位によって異なるために異なるサンプル間での比較が困難であることが挙げられる。このため、色分離精度を定量的に、すなわち、蛍光分離の程度を適切に評価する評価系が求められる。
However, since the evaluation of color separation accuracy is only a qualitative evaluation by visual observation, evaluation between algorithms is difficult and quantitative evaluation is not possible. The reason why this quantitative evaluation is not possible is that it is not possible to make a correct evaluation under staining conditions where the dye overlaps with each other and the dye brightness level is not large with respect to the autofluorescence, and that the autofluorescence spectrum differs depending on the tissue site, so that different samples cannot be evaluated. is difficult to compare. Therefore, an evaluation system that quantitatively evaluates the color separation accuracy, that is, appropriately evaluates the degree of fluorescence separation is required.
そこで、本開示では、蛍光分離の程度を適切に評価することが可能な情報処理装置、生体試料観察システム及び画像生成方法を提案する。
Therefore, the present disclosure proposes an information processing device, a biological sample observation system, and an image generation method capable of appropriately evaluating the degree of fluorescence separation.
本開示の実施形態に係る情報処理装置は、自家蛍光成分を含む非染色画像と、第一蛍光色素の参照スペクトル及び前記非染色画像の画素毎の撮像ノイズが関連付けられた色素タイル画像とを重畳し、模擬画像を生成する模擬画像生成部と、前記模擬画像に基づいて、前記第一蛍光色素の成分と前記自家蛍光成分とを分離し、分離画像を生成する蛍光分離部と、前記分離画像の分離の程度を評価する評価部と、を備える。
An information processing apparatus according to an embodiment of the present disclosure superimposes an unstained image including an autofluorescence component and a dye tile image in which a reference spectrum of a first fluorescent dye and imaging noise for each pixel of the unstained image are associated. a simulated image generator that generates a simulated image; a fluorescence separator that separates the component of the first fluorescent dye and the autofluorescent component based on the simulated image to generate a separated image; and the separated image. and an evaluation unit for evaluating the degree of separation of the
本開示の実施形態に係る生体試料観察システムは、自家蛍光成分を含む非染色画像を取得する撮像装置と、前記非染色画像を処理する情報処理装置と、を備え、前記情報処理装置は、前記非染色画像と、第一蛍光色素の参照スペクトル及び前記非染色画像の画素毎の撮像ノイズが関連付けられた色素タイル画像とを重畳し、模擬画像を生成する模擬画像生成部と、前記模擬画像に基づいて、前記第一蛍光色素の成分と前記自家蛍光成分とを分離し、分離画像を生成する蛍光分離部と、前記分離画像の分離の程度を評価する評価部と、を有する。
A biological sample observation system according to an embodiment of the present disclosure includes an imaging device that acquires an unstained image containing an autofluorescent component, and an information processing device that processes the unstained image, wherein the information processing device includes the a simulated image generation unit that superimposes an unstained image and a dye tile image associated with a reference spectrum of a first fluorescent dye and imaging noise for each pixel of the unstained image to generate a simulated image; a fluorescence separating unit that separates the component of the first fluorescent dye and the autofluorescent component and generates a separated image based on the above, and an evaluating unit that evaluates the degree of separation of the separated image.
本開示の実施形態に係る画像生成方法は、自家蛍光成分を含む非染色画像と、第一蛍光色素の参照スペクトル及び前記非染色画像の画素毎の撮像ノイズが関連付けられた色素タイル画像とを重畳し、模擬画像を生成することを含む。
An image generation method according to an embodiment of the present disclosure superimposes an unstained image containing an autofluorescent component and a dye tile image in which a reference spectrum of a first fluorescent dye and imaging noise for each pixel of the unstained image are associated. and generating a simulated image.
以下に、本開示の実施形態について図面に基づいて詳細に説明する。なお、この実施形態により本開示に係る装置、システム及び方法等が限定されるものではない。また、本明細書及び図面において、実質的に同一の機能構成を有する構成要素については、基本的に同一の符号を付することにより重複説明を省略する。
Below, embodiments of the present disclosure will be described in detail based on the drawings. Note that the apparatus, system, method, and the like according to the present disclosure are not limited by this embodiment. In addition, in the present specification and drawings, constituent elements having substantially the same functional configuration are basically given the same reference numerals to omit redundant description.
以下に説明される1又は複数の実施形態(実施例、変形例を含む)は、各々が独立に実施されることが可能である。一方で、以下に説明される複数の実施形態は少なくとも一部が他の実施形態の少なくとも一部と適宜組み合わせて実施されてもよい。これら複数の実施形態は、互いに異なる新規な特徴を含み得る。したがって、これら複数の実施形態は、互いに異なる目的又は課題を解決することに寄与し得、互いに異なる効果を奏し得る。
Each of one or more embodiments (including examples and modifications) described below can be implemented independently. On the other hand, at least some of the embodiments described below may be implemented in combination with at least some of the other embodiments as appropriate. These multiple embodiments may include novel features that differ from each other. Therefore, these multiple embodiments can contribute to solving different purposes or problems, and can produce different effects.
以下に示す項目順序に従って本開示を説明する。
1.第1の実施形態
1-1.情報処理システムの構成例
1-2.情報処理装置の処理例
1-3.蛍光分離の処理例
1-4.定量評価に係る解析部の構成例
1-5.模擬画像作成の処理例
1-6.定量評価の処理例
1-7.分離画像の画像例
1-8.評価結果画像の画像例
1-9.適用例
1-10.作用・効果
2.第2の実施形態
2-1.定量評価に係る解析部の構成例
2-2.作用・効果
3.他の実施形態
4.応用例
5.ハードウェアの構成例
6.付記 The present disclosure will be described according to the order of items shown below.
1. First Embodiment 1-1. Configuration example of information processing system 1-2. Processing example of information processing apparatus 1-3. Processing example of fluorescence separation 1-4. Configuration example of analysis unit related to quantitative evaluation 1-5. Processing example of simulated image creation 1-6. Processing example of quantitative evaluation 1-7. Image example of separated image 1-8. Image example of evaluation result image 1-9. Application example 1-10. Action andeffect 2. Second Embodiment 2-1. Configuration example of analysis unit related to quantitative evaluation 2-2. Action and effect 3. Other embodiment4. Application example 5 . Hardware configuration example6. Supplementary note
1.第1の実施形態
1-1.情報処理システムの構成例
1-2.情報処理装置の処理例
1-3.蛍光分離の処理例
1-4.定量評価に係る解析部の構成例
1-5.模擬画像作成の処理例
1-6.定量評価の処理例
1-7.分離画像の画像例
1-8.評価結果画像の画像例
1-9.適用例
1-10.作用・効果
2.第2の実施形態
2-1.定量評価に係る解析部の構成例
2-2.作用・効果
3.他の実施形態
4.応用例
5.ハードウェアの構成例
6.付記 The present disclosure will be described according to the order of items shown below.
1. First Embodiment 1-1. Configuration example of information processing system 1-2. Processing example of information processing apparatus 1-3. Processing example of fluorescence separation 1-4. Configuration example of analysis unit related to quantitative evaluation 1-5. Processing example of simulated image creation 1-6. Processing example of quantitative evaluation 1-7. Image example of separated image 1-8. Image example of evaluation result image 1-9. Application example 1-10. Action and
<1.第1の実施形態>
<1-1.情報処理システムの構成例>
本実施形態に係る情報処理システムの構成例について図1を参照して説明する。図1は、本実施形態に係る情報処理システムの概略構成の一例を示す図である。情報処理システムは、生体試料観察システムの一例である。 <1. First Embodiment>
<1-1. Configuration example of information processing system>
A configuration example of an information processing system according to this embodiment will be described with reference to FIG. FIG. 1 is a diagram showing an example of a schematic configuration of an information processing system according to this embodiment. An information processing system is an example of a biological sample observation system.
図1に示すように、本実施形態に係る情報処理システムは、情報処理装置100と、データベース200とを備える。この情報処理システムへの入力として、蛍光試薬10Aと、標本20Aと、蛍光染色標本30Aとが存在する。
As shown in FIG. 1, the information processing system according to the present embodiment includes an information processing device 100 and a database 200. As inputs to this information processing system, there are a fluorescent reagent 10A, a sample 20A, and a fluorescently stained sample 30A.
(蛍光試薬10A)
蛍光試薬10Aは、標本20Aの染色に使用される薬品である。蛍光試薬10Aは、例えば、蛍光抗体(直接標識に使用される一次抗体、または間接標識に使用される二次抗体が含まれる)、蛍光プローブ、または核染色試薬などであるが、蛍光試薬10Aの種類はこれらに特に限定されない。また、蛍光試薬10Aは、蛍光試薬10A(および蛍光試薬10Aの製造ロット)を識別可能な識別情報(以降「試薬識別情報11A」と呼称する)を付されて管理される。試薬識別情報11Aは、例えばバーコード情報など(一次元バーコード情報や二次元バーコード情報など)であるが、これに限定されない。蛍光試薬10Aは、同一(同種類)の製品であっても、製造方法や抗体が取得された細胞の状態などに応じて製造ロット毎にその性質が異なる。例えば、蛍光試薬10Aにおいて、製造ロット毎にスペクトル情報、量子収率、または蛍光標識率(「F/P値:Fluorescein/Protein」とも呼称される。抗体を標識する蛍光分子数を指す)などが異なる。そこで、本実施形態に係る情報処理システムにおいて、蛍光試薬10Aは、試薬識別情報11Aを付されることによって製造ロット毎に管理される(換言すると、各蛍光試薬10Aの試薬情報は製造ロット毎に管理される)。これによって、情報処理装置100は、製造ロット毎に現れる僅かな性質の違いも考慮した上で蛍光シグナルと自家蛍光シグナルとを分離することができる。なお、蛍光試薬10Aが製造ロット単位で管理されることはあくまで一例であり、蛍光試薬10Aは製造ロットよりも細かい単位で管理されてもよい。 (Fluorescent reagent 10A)
The fluorescent reagent 10A is a chemical used for staining the specimen 20A. The fluorescent reagent 10A is, for example, a fluorescent antibody (including a primary antibody used for direct labeling or a secondary antibody used for indirect labeling), a fluorescent probe, or a nuclear staining reagent. The type is not particularly limited to these. In addition, the fluorescent reagent 10A is managed with identification information (hereinafter referred to as "reagent identification information 11A") that can identify the fluorescent reagent 10A (and the production lot of the fluorescent reagent 10A). The reagent identification information 11A is, for example, barcode information (one-dimensional barcode information, two-dimensional barcode information, etc.), but is not limited to this. Even if the fluorescent reagent 10A is the same (same type) product, its properties differ for each manufacturing lot depending on the manufacturing method, the state of the cells from which the antibody was obtained, and the like. For example, in the fluorescent reagent 10A, spectral information, quantum yield, or fluorescent labeling rate (also referred to as “F/P value: Fluorescein/Protein”, which indicates the number of fluorescent molecules that label the antibody) for each production lot, etc. different. Therefore, in the information processing system according to the present embodiment, the fluorescent reagent 10A is managed for each production lot by attaching reagent identification information 11A (in other words, the reagent information of each fluorescent reagent 10A is stored for each production lot). managed). With this, theinformation processing apparatus 100 can separate the fluorescence signal and the autofluorescence signal while taking into account slight differences in properties that appear in each manufacturing lot. The management of the fluorescent reagent 10A in production lot units is merely an example, and the fluorescent reagent 10A may be managed in units smaller than the production lot.
蛍光試薬10Aは、標本20Aの染色に使用される薬品である。蛍光試薬10Aは、例えば、蛍光抗体(直接標識に使用される一次抗体、または間接標識に使用される二次抗体が含まれる)、蛍光プローブ、または核染色試薬などであるが、蛍光試薬10Aの種類はこれらに特に限定されない。また、蛍光試薬10Aは、蛍光試薬10A(および蛍光試薬10Aの製造ロット)を識別可能な識別情報(以降「試薬識別情報11A」と呼称する)を付されて管理される。試薬識別情報11Aは、例えばバーコード情報など(一次元バーコード情報や二次元バーコード情報など)であるが、これに限定されない。蛍光試薬10Aは、同一(同種類)の製品であっても、製造方法や抗体が取得された細胞の状態などに応じて製造ロット毎にその性質が異なる。例えば、蛍光試薬10Aにおいて、製造ロット毎にスペクトル情報、量子収率、または蛍光標識率(「F/P値:Fluorescein/Protein」とも呼称される。抗体を標識する蛍光分子数を指す)などが異なる。そこで、本実施形態に係る情報処理システムにおいて、蛍光試薬10Aは、試薬識別情報11Aを付されることによって製造ロット毎に管理される(換言すると、各蛍光試薬10Aの試薬情報は製造ロット毎に管理される)。これによって、情報処理装置100は、製造ロット毎に現れる僅かな性質の違いも考慮した上で蛍光シグナルと自家蛍光シグナルとを分離することができる。なお、蛍光試薬10Aが製造ロット単位で管理されることはあくまで一例であり、蛍光試薬10Aは製造ロットよりも細かい単位で管理されてもよい。 (Fluorescent reagent 10A)
The fluorescent reagent 10A is a chemical used for staining the specimen 20A. The fluorescent reagent 10A is, for example, a fluorescent antibody (including a primary antibody used for direct labeling or a secondary antibody used for indirect labeling), a fluorescent probe, or a nuclear staining reagent. The type is not particularly limited to these. In addition, the fluorescent reagent 10A is managed with identification information (hereinafter referred to as "reagent identification information 11A") that can identify the fluorescent reagent 10A (and the production lot of the fluorescent reagent 10A). The reagent identification information 11A is, for example, barcode information (one-dimensional barcode information, two-dimensional barcode information, etc.), but is not limited to this. Even if the fluorescent reagent 10A is the same (same type) product, its properties differ for each manufacturing lot depending on the manufacturing method, the state of the cells from which the antibody was obtained, and the like. For example, in the fluorescent reagent 10A, spectral information, quantum yield, or fluorescent labeling rate (also referred to as “F/P value: Fluorescein/Protein”, which indicates the number of fluorescent molecules that label the antibody) for each production lot, etc. different. Therefore, in the information processing system according to the present embodiment, the fluorescent reagent 10A is managed for each production lot by attaching reagent identification information 11A (in other words, the reagent information of each fluorescent reagent 10A is stored for each production lot). managed). With this, the
(標本20A)
標本20Aは、人体から採取された検体または組織サンプルから病理診断または臨床検査などを目的に作製されたものである。標本20Aについて、使用される組織(例えば臓器または細胞など)の種類、対象となる疾病の種類、対象者の属性(例えば、年齢、性別、血液型、または人種など)、または対象者の生活習慣(例えば、食生活、運動習慣、または喫煙習慣など)は特に限定されない。また、標本20Aは、各標本20Aを識別可能な識別情報(以降、「標本識別情報21A」と呼称する)を付されて管理される。標本識別情報21Aは、試薬識別情報11Aと同様に、例えばバーコード情報など(一次元バーコード情報や二次元バーコード情報など)であるが、これに限定されない。標本20Aは、使用される組織の種類、対象となる疾病の種類、対象者の属性、または対象者の生活習慣などに応じてその性質が異なる。例えば、標本20Aにおいて、使用される組織の種類などに応じて計測チャネルまたはスペクトル情報などが異なる。そこで、本実施形態に係る情報処理システムにおいて、標本20Aは、標本識別情報21Aを付されることによって個々に管理される。これによって、情報処理装置100は、標本20A毎に現れる僅かな性質の違いも考慮した上で蛍光シグナルと自家蛍光シグナルとを分離することができる。 (specimen 20A)
The specimen 20A is prepared from a specimen or tissue sample collected from a human body for the purpose of pathological diagnosis, clinical examination, or the like. For the specimen 20A, the type of tissue used (eg, organ or cell), the type of target disease, the subject's attributes (eg, age, sex, blood type, race, etc.), or the subject's lifestyle Habits (eg, eating habits, exercise habits, smoking habits, etc.) are not particularly limited. In addition, the specimens 20A are managed with identification information (hereinafter referred to as "specimen identification information 21A") by which each specimen 20A can be identified. Like the reagent identification information 11A, the specimen identification information 21A is, for example, barcode information (one-dimensional barcode information, two-dimensional barcode information, etc.), but is not limited to this. The properties of the specimen 20A differ depending on the type of tissue used, the type of target disease, the subject's attributes, or the subject's lifestyle. For example, in the specimen 20A, measurement channels or spectral information differ depending on the type of tissue used. Therefore, in the information processing system according to the present embodiment, the specimens 20A are individually managed by attaching specimen identification information 21A. Accordingly, theinformation processing apparatus 100 can separate the fluorescence signal and the autofluorescence signal while taking into consideration even slight differences in properties that appear in each specimen 20A.
標本20Aは、人体から採取された検体または組織サンプルから病理診断または臨床検査などを目的に作製されたものである。標本20Aについて、使用される組織(例えば臓器または細胞など)の種類、対象となる疾病の種類、対象者の属性(例えば、年齢、性別、血液型、または人種など)、または対象者の生活習慣(例えば、食生活、運動習慣、または喫煙習慣など)は特に限定されない。また、標本20Aは、各標本20Aを識別可能な識別情報(以降、「標本識別情報21A」と呼称する)を付されて管理される。標本識別情報21Aは、試薬識別情報11Aと同様に、例えばバーコード情報など(一次元バーコード情報や二次元バーコード情報など)であるが、これに限定されない。標本20Aは、使用される組織の種類、対象となる疾病の種類、対象者の属性、または対象者の生活習慣などに応じてその性質が異なる。例えば、標本20Aにおいて、使用される組織の種類などに応じて計測チャネルまたはスペクトル情報などが異なる。そこで、本実施形態に係る情報処理システムにおいて、標本20Aは、標本識別情報21Aを付されることによって個々に管理される。これによって、情報処理装置100は、標本20A毎に現れる僅かな性質の違いも考慮した上で蛍光シグナルと自家蛍光シグナルとを分離することができる。 (specimen 20A)
The specimen 20A is prepared from a specimen or tissue sample collected from a human body for the purpose of pathological diagnosis, clinical examination, or the like. For the specimen 20A, the type of tissue used (eg, organ or cell), the type of target disease, the subject's attributes (eg, age, sex, blood type, race, etc.), or the subject's lifestyle Habits (eg, eating habits, exercise habits, smoking habits, etc.) are not particularly limited. In addition, the specimens 20A are managed with identification information (hereinafter referred to as "specimen identification information 21A") by which each specimen 20A can be identified. Like the reagent identification information 11A, the specimen identification information 21A is, for example, barcode information (one-dimensional barcode information, two-dimensional barcode information, etc.), but is not limited to this. The properties of the specimen 20A differ depending on the type of tissue used, the type of target disease, the subject's attributes, or the subject's lifestyle. For example, in the specimen 20A, measurement channels or spectral information differ depending on the type of tissue used. Therefore, in the information processing system according to the present embodiment, the specimens 20A are individually managed by attaching specimen identification information 21A. Accordingly, the
(蛍光染色標本30A)
蛍光染色標本30Aは、標本20Aが蛍光試薬10Aによって染色されることで作成されたものである。本実施形態において、蛍光染色標本30Aは、標本20Aが少なくとも1つの蛍光試薬10Aによって染色されることを想定しているところ、染色に用いられる蛍光試薬10Aの数は特に限定されない。また、染色方法は、標本20Aおよび蛍光試薬10Aそれぞれの組み合わせなどによって決まり、特に限定されるものではない。蛍光染色標本30Aは、情報処理装置100に対して入力され、撮像される。 (Fluorescent stained specimen 30A)
The fluorescently stained specimen 30A is created by staining the specimen 20A with the fluorescent reagent 10A. In this embodiment, the fluorescence-stained specimen 30A assumes that the specimen 20A is stained with at least one fluorescent reagent 10A, and the number of fluorescent reagents 10A used for staining is not particularly limited. Also, the staining method is determined by the combination of the specimen 20A and the fluorescent reagent 10A, and is not particularly limited. The fluorescence-stained specimen 30A is input to theinformation processing apparatus 100 and imaged.
蛍光染色標本30Aは、標本20Aが蛍光試薬10Aによって染色されることで作成されたものである。本実施形態において、蛍光染色標本30Aは、標本20Aが少なくとも1つの蛍光試薬10Aによって染色されることを想定しているところ、染色に用いられる蛍光試薬10Aの数は特に限定されない。また、染色方法は、標本20Aおよび蛍光試薬10Aそれぞれの組み合わせなどによって決まり、特に限定されるものではない。蛍光染色標本30Aは、情報処理装置100に対して入力され、撮像される。 (Fluorescent stained specimen 30A)
The fluorescently stained specimen 30A is created by staining the specimen 20A with the fluorescent reagent 10A. In this embodiment, the fluorescence-stained specimen 30A assumes that the specimen 20A is stained with at least one fluorescent reagent 10A, and the number of fluorescent reagents 10A used for staining is not particularly limited. Also, the staining method is determined by the combination of the specimen 20A and the fluorescent reagent 10A, and is not particularly limited. The fluorescence-stained specimen 30A is input to the
(情報処理装置100)
情報処理装置100は、図1に示すように、取得部110と、保存部120と、処理部130と、表示部140と、制御部150と、操作部160と、を備える。 (Information processing device 100)
Theinformation processing apparatus 100 includes an acquisition unit 110, a storage unit 120, a processing unit 130, a display unit 140, a control unit 150, and an operation unit 160, as shown in FIG.
情報処理装置100は、図1に示すように、取得部110と、保存部120と、処理部130と、表示部140と、制御部150と、操作部160と、を備える。 (Information processing device 100)
The
(取得部110)
取得部110は、情報処理装置100の各種処理に使用される情報を取得する構成である。図1に示すように、取得部110は、情報取得部111と、画像取得部112と、を備える。 (Acquisition unit 110)
The acquisition unit 110 is configured to acquire information used for various processes of theinformation processing apparatus 100 . As shown in FIG. 1 , the acquisition section 110 includes an information acquisition section 111 and an image acquisition section 112 .
取得部110は、情報処理装置100の各種処理に使用される情報を取得する構成である。図1に示すように、取得部110は、情報取得部111と、画像取得部112と、を備える。 (Acquisition unit 110)
The acquisition unit 110 is configured to acquire information used for various processes of the
(情報取得部111)
情報取得部111は、試薬情報および標本情報を取得する構成である。より具体的には、情報取得部111は、蛍光染色標本30Aの生成に使用された蛍光試薬10Aに付された試薬識別情報11A、および標本20Aに付された標本識別情報21Aを取得する。例えば、情報取得部111は、バーコードリーダーなどを用いて試薬識別情報11Aおよび標本識別情報21Aを取得する。そして、情報取得部111は、試薬識別情報11Aに基づいて試薬情報を、標本識別情報21Aに基づいて標本情報をそれぞれデータベース200から取得する。情報取得部111は、取得したこれらの情報を後述する情報保存部121に保存する。 (Information acquisition unit 111)
The information acquisition unit 111 is configured to acquire reagent information and sample information. More specifically, the information acquisition unit 111 acquires the reagent identification information 11A attached to the fluorescent reagent 10A and the specimen identification information 21A attached to the specimen 20A used to generate the fluorescently stained specimen 30A. For example, the information acquisition unit 111 acquires the reagent identification information 11A and the specimen identification information 21A using a barcode reader or the like. Then, the information acquisition unit 111 acquires the reagent information based on the reagent identification information 11A and the specimen information based on the specimen identification information 21A from thedatabase 200, respectively. The information acquisition unit 111 stores the acquired information in the information storage unit 121, which will be described later.
情報取得部111は、試薬情報および標本情報を取得する構成である。より具体的には、情報取得部111は、蛍光染色標本30Aの生成に使用された蛍光試薬10Aに付された試薬識別情報11A、および標本20Aに付された標本識別情報21Aを取得する。例えば、情報取得部111は、バーコードリーダーなどを用いて試薬識別情報11Aおよび標本識別情報21Aを取得する。そして、情報取得部111は、試薬識別情報11Aに基づいて試薬情報を、標本識別情報21Aに基づいて標本情報をそれぞれデータベース200から取得する。情報取得部111は、取得したこれらの情報を後述する情報保存部121に保存する。 (Information acquisition unit 111)
The information acquisition unit 111 is configured to acquire reagent information and sample information. More specifically, the information acquisition unit 111 acquires the reagent identification information 11A attached to the fluorescent reagent 10A and the specimen identification information 21A attached to the specimen 20A used to generate the fluorescently stained specimen 30A. For example, the information acquisition unit 111 acquires the reagent identification information 11A and the specimen identification information 21A using a barcode reader or the like. Then, the information acquisition unit 111 acquires the reagent information based on the reagent identification information 11A and the specimen information based on the specimen identification information 21A from the
(画像取得部112)
画像取得部112は、蛍光染色標本30A(少なくとも1つの蛍光試薬10Aで染色された標本20A)の画像情報を取得する構成である。より具体的には、画像取得部112は、任意の撮像素子(例えば、CCDやCMOSなど)を備えており、当該撮像素子を用いて蛍光染色標本30Aを撮像することで画像情報を取得する。ここで、「画像情報」は、蛍光染色標本30Aの画像自体だけでなく、像として視覚化されていない測定値なども含む概念であることに留意されたい。例えば、画像情報には、蛍光染色標本30Aから放射した蛍光の波長スペクトル(以下、蛍光スペクトルという)に関する情報が含まれていてもよい。画像取得部112は、画像情報を後述する画像情報保存部122に保存する。 (Image acquisition unit 112)
The image acquisition unit 112 is configured to acquire image information of the fluorescently stained specimen 30A (the specimen 20A stained with at least one fluorescent reagent 10A). More specifically, the image acquisition unit 112 includes an arbitrary imaging device (for example, CCD, CMOS, etc.), and acquires image information by imaging the fluorescence-stained specimen 30A using the imaging device. Here, it should be noted that "image information" is a concept that includes not only the image itself of the fluorescence-stained specimen 30A, but also measured values that are not visualized as images. For example, the image information may include information on the wavelength spectrum of fluorescence emitted from the fluorescently stained specimen 30A (hereinafter referred to as fluorescence spectrum). The image acquisition unit 112 stores the image information in the image information storage unit 122, which will be described later.
(保存部120)
保存部120は、情報処理装置100の各種処理に使用される情報、または各種処理によって出力された情報を保存(記憶)する構成である。図1に示すように、保存部120は、情報保存部121と、画像情報保存部122と、解析結果保存部123と、を備える。 (storage unit 120)
Thestorage unit 120 is configured to store (store) information used for various processes of the information processing apparatus 100 or information output by various processes. As shown in FIG. 1 , the storage unit 120 includes an information storage unit 121 , an image information storage unit 122 and an analysis result storage unit 123 .
保存部120は、情報処理装置100の各種処理に使用される情報、または各種処理によって出力された情報を保存(記憶)する構成である。図1に示すように、保存部120は、情報保存部121と、画像情報保存部122と、解析結果保存部123と、を備える。 (storage unit 120)
The
(情報保存部121)
情報保存部121は、情報取得部111によって取得された試薬情報および標本情報を保存する構成である。なお、後述する解析部131による解析処理および画像生成部132による画像情報の生成処理(画像情報の再構築処理)が終了した後には、情報保存部121は、処理に用いられた試薬情報および標本情報を削除することで空き容量を増やしてもよい。 (Information storage unit 121)
The information storage unit 121 is configured to store reagent information and specimen information acquired by the information acquisition unit 111 . Note that after the analysis processing by theanalysis unit 131 and the image information generation processing (image information reconstruction processing) by the image generation unit 132, which will be described later, are completed, the information storage unit 121 stores the reagent information and specimen used for the processing. Free space may be increased by deleting information.
情報保存部121は、情報取得部111によって取得された試薬情報および標本情報を保存する構成である。なお、後述する解析部131による解析処理および画像生成部132による画像情報の生成処理(画像情報の再構築処理)が終了した後には、情報保存部121は、処理に用いられた試薬情報および標本情報を削除することで空き容量を増やしてもよい。 (Information storage unit 121)
The information storage unit 121 is configured to store reagent information and specimen information acquired by the information acquisition unit 111 . Note that after the analysis processing by the
(画像情報保存部122)
画像情報保存部122は、画像取得部112によって取得された蛍光染色標本30Aの画像情報を保存する構成である。なお、情報保存部121と同様に、解析部131による解析処理および画像生成部132による画像情報の生成処理(画像情報の再構築処理)が終了した後には、画像情報保存部122は、処理に用いられた画像情報を削除することで空き容量を増やしてもよい。 (Image information storage unit 122)
The image information storage unit 122 is configured to store the image information of the fluorescence-stained specimen 30A acquired by the image acquisition unit 112 . As with the information storage unit 121, after the analysis processing by theanalysis unit 131 and the image information generation processing (image information reconstruction processing) by the image generation unit 132 are completed, the image information storage unit 122 Free space may be increased by deleting used image information.
画像情報保存部122は、画像取得部112によって取得された蛍光染色標本30Aの画像情報を保存する構成である。なお、情報保存部121と同様に、解析部131による解析処理および画像生成部132による画像情報の生成処理(画像情報の再構築処理)が終了した後には、画像情報保存部122は、処理に用いられた画像情報を削除することで空き容量を増やしてもよい。 (Image information storage unit 122)
The image information storage unit 122 is configured to store the image information of the fluorescence-stained specimen 30A acquired by the image acquisition unit 112 . As with the information storage unit 121, after the analysis processing by the
(解析結果保存部123)
解析結果保存部123は、後述する解析部131によって行われた解析処理の結果を保存する構成である。例えば、解析結果保存部123は、解析部131によって分離された、蛍光試薬10Aの蛍光シグナルまたは標本20Aの自家蛍光シグナルを保存する。また、解析結果保存部123は、別途、機械学習などによって解析精度を向上させるために、解析処理の結果をデータベース200へ提供する。なお、解析結果保存部123は、解析処理の結果をデータベース200へ提供した後には、自らが保存している解析処理の結果を適宜削除することで空き容量を増やしてもよい。 (Analysis result storage unit 123)
The analysis result storage unit 123 is configured to store the result of analysis processing performed by theanalysis unit 131, which will be described later. For example, the analysis result storage unit 123 stores the fluorescence signal of the fluorescent reagent 10A or the autofluorescence signal of the sample 20A separated by the analysis unit 131 . In addition, the analysis result storage unit 123 separately provides the result of the analysis processing to the database 200 in order to improve the analysis accuracy by machine learning or the like. After providing the analysis result to the database 200, the analysis result saving unit 123 may appropriately delete the analysis result saved by itself to increase the free space.
解析結果保存部123は、後述する解析部131によって行われた解析処理の結果を保存する構成である。例えば、解析結果保存部123は、解析部131によって分離された、蛍光試薬10Aの蛍光シグナルまたは標本20Aの自家蛍光シグナルを保存する。また、解析結果保存部123は、別途、機械学習などによって解析精度を向上させるために、解析処理の結果をデータベース200へ提供する。なお、解析結果保存部123は、解析処理の結果をデータベース200へ提供した後には、自らが保存している解析処理の結果を適宜削除することで空き容量を増やしてもよい。 (Analysis result storage unit 123)
The analysis result storage unit 123 is configured to store the result of analysis processing performed by the
(処理部130)
処理部130は、画像情報、試薬情報、および標本情報を用いて各種処理を行う機能構成である。図1に示すように、処理部130は、解析部131と、画像生成部132と、を備える。 (Processing unit 130)
The processing unit 130 is a functional configuration that performs various types of processing using image information, reagent information, and specimen information. As shown in FIG. 1 , the processing section 130 includes ananalysis section 131 and an image generation section 132 .
処理部130は、画像情報、試薬情報、および標本情報を用いて各種処理を行う機能構成である。図1に示すように、処理部130は、解析部131と、画像生成部132と、を備える。 (Processing unit 130)
The processing unit 130 is a functional configuration that performs various types of processing using image information, reagent information, and specimen information. As shown in FIG. 1 , the processing section 130 includes an
(解析部131)
解析部131は、画像情報、標本情報、および試薬情報を用いて各種解析処理を行う構成である。例えば、解析部131は、標本情報および試薬情報に基づいて画像情報から標本20Aの自家蛍光シグナルと蛍光試薬10Aの蛍光シグナルとを分離する処理を行う。 (analysis unit 131)
Theanalysis unit 131 is configured to perform various analysis processes using image information, specimen information, and reagent information. For example, the analysis unit 131 performs processing for separating the autofluorescence signal of the specimen 20A and the fluorescence signal of the fluorescent reagent 10A from the image information based on the specimen information and the reagent information.
解析部131は、画像情報、標本情報、および試薬情報を用いて各種解析処理を行う構成である。例えば、解析部131は、標本情報および試薬情報に基づいて画像情報から標本20Aの自家蛍光シグナルと蛍光試薬10Aの蛍光シグナルとを分離する処理を行う。 (analysis unit 131)
The
より具体的には、解析部131は、標本情報に含まれる計測チャネルに基づいて自家蛍光シグナルを構成する1以上の要素を認識する。例えば、解析部131は、自家蛍光シグナルを構成する1以上の自家蛍光成分を認識する。そして、解析部131は、標本情報に含まれる、これらの自家蛍光成分のスペクトル情報を用いて画像情報に含まれる自家蛍光シグナルを予想する。そして、解析部131は、試薬情報に含まれる、蛍光試薬10Aの蛍光成分のスペクトル情報、および予想した自家蛍光シグナルに基づいて画像情報から自家蛍光シグナルと蛍光シグナルとを分離する。
More specifically, the analysis unit 131 recognizes one or more elements that make up the autofluorescence signal based on the measurement channel included in the specimen information. For example, the analysis unit 131 recognizes one or more autofluorescence components forming the autofluorescence signal. Then, the analysis unit 131 predicts the autofluorescence signal included in the image information using the spectral information of these autofluorescence components included in the specimen information. Then, the analysis unit 131 separates the autofluorescence signal and the fluorescence signal from the image information based on the spectral information of the fluorescent component of the fluorescent reagent 10A and the predicted autofluorescence signal included in the reagent information.
ここで、標本20Aが2以上の蛍光試薬10Aで染色されている場合、解析部131は、標本情報および試薬情報に基づいて画像情報(または、自家蛍光シグナルと分離された後の蛍光シグナル)からこれら2以上の蛍光試薬10Aそれぞれの蛍光シグナルを分離する。例えば、解析部131は、試薬情報に含まれる、各蛍光試薬10Aの蛍光成分のスペクトル情報を用いて、自家蛍光シグナルと分離された後の蛍光シグナル全体から各蛍光試薬10Aそれぞれの蛍光シグナルを分離する。
Here, when the specimen 20A is stained with two or more fluorescent reagents 10A, the analysis unit 131 extracts from the image information (or the fluorescence signal separated from the autofluorescence signal) based on the specimen information and the reagent information. The fluorescent signal of each of these two or more fluorescent reagents 10A is separated. For example, the analysis unit 131 uses the spectral information of the fluorescent component of each fluorescent reagent 10A included in the reagent information to separate the fluorescent signal of each fluorescent reagent 10A from the entire fluorescent signal after being separated from the autofluorescent signal. do.
また、自家蛍光シグナルが2以上の自家蛍光成分によって構成されている場合、解析部131は、標本情報および試薬情報に基づいて画像情報(または、蛍光シグナルと分離された後の自家蛍光シグナル)から各自家蛍光成分それぞれの自家蛍光シグナルを分離する。例えば、解析部131は、標本情報に含まれる各自家蛍光成分のスペクトル情報を用いて、蛍光シグナルと分離された後の自家蛍光シグナル全体から各自家蛍光成分それぞれの自家蛍光シグナルを分離する。
Further, when the autofluorescence signal is composed of two or more autofluorescence components, the analysis unit 131 extracts the image information (or the autofluorescence signal separated from the fluorescence signal) based on the specimen information and the reagent information. Separate the autofluorescent signal for each individual autofluorescent component. For example, the analysis unit 131 separates the autofluorescence signal of each autofluorescence component from the entire autofluorescence signal separated from the fluorescence signal using the spectral information of each autofluorescence component included in the specimen information.
蛍光シグナルおよび自家蛍光シグナルを分離した解析部131は、これらのシグナルを用いて各種処理を行う。例えば、解析部131は、分離後の自家蛍光シグナルを用いて、他の標本20Aの画像情報に対して減算処理(「バックグラウンド減算処理」とも呼称する)を行うことで当該他の標本20Aの画像情報から蛍光シグナルを抽出してもよい。標本20Aに使用される組織、対象となる疾病の種類、対象者の属性、および対象者の生活習慣などの観点で同一または類似の標本20Aが複数存在する場合、これらの標本20Aの自家蛍光シグナルは類似している可能性が高い。ここでいう類似の標本20Aとは、例えば染色される組織切片(以下切片)の染色前の組織切片、染色された切片に隣接する切片、同一ブロック(染色切片と同一の場所からサンプリングされたもの)における染色切片と異なる切片、又は同一組織における異なるブロック(染色切片と異なる場所からサンプリングされたもの)における切片等)、異なる患者から採取した切片などが含まれる。そこで、解析部131は、ある標本20Aから自家蛍光シグナルを抽出できた場合、他の標本20Aの画像情報から当該自家蛍光シグナルを除去することで、当該他の標本20Aの画像情報から蛍光シグナルを抽出してもよい。また、解析部131は、他の標本20Aの画像情報を用いてS/N値を算出する際に、自家蛍光シグナルを除去した後のバックグラウンドを用いることでS/N値を改善することができる。
The analysis unit 131 that separates the fluorescence signal and the autofluorescence signal performs various processes using these signals. For example, the analysis unit 131 performs subtraction processing (also referred to as “background subtraction processing”) on the image information of the other specimen 20A using the autofluorescence signal after separation, thereby A fluorescent signal may be extracted from the image information. When there are multiple identical or similar specimens 20A in terms of tissues used for the specimen 20A, the type of target disease, the attributes of the subject, and the lifestyle of the subject, the autofluorescence signal of these specimens 20A are likely to be similar. The similar specimen 20A here is, for example, a tissue section before staining of a tissue section to be stained (hereinafter referred to as section), a section adjacent to the stained section, the same block (sampled from the same place as the stained section) ), or sections from different blocks in the same tissue (sampled from different locations than the stained sections), sections taken from different patients, and the like. Therefore, when the autofluorescence signal can be extracted from a certain specimen 20A, the analysis unit 131 extracts the fluorescence signal from the image information of the other specimen 20A by removing the autofluorescence signal from the image information of the other specimen 20A. may be extracted. Further, when the analysis unit 131 calculates the S/N value using the image information of the other specimen 20A, the S/N value can be improved by using the background after removing the autofluorescence signal. can.
また、解析部131は、バックグラウンド減算処理以外にも分離後の蛍光シグナルまたは自家蛍光シグナルを用いて様々な処理を行うことができる。例えば、解析部131は、これらのシグナルを用いて標本20Aの固定化状態の解析を行ったり、画像情報に含まれる物体(例えば、細胞、細胞内構造(細胞質、細胞膜、核、など)、または組織(腫瘍部、非腫瘍部、結合組織、血管、血管壁、リンパ管、繊維化構造、壊死、など))の領域を認識するセグメンテーション(または領域分割)を行ったりすることができる。標本20Aの固定化状態の解析およびセグメンテーションについては後段にて詳述する。
In addition to the background subtraction process, the analysis unit 131 can also perform various processes using the separated fluorescence signal or the autofluorescence signal. For example, the analysis unit 131 uses these signals to analyze the immobilization state of the specimen 20A, objects included in the image information (e.g., cells, intracellular structures (cytoplasm, cell membrane, nucleus, etc.), or Segmentation (or region division) for recognizing tissue regions (tumor regions, non-tumor regions, connective tissue, blood vessels, blood vessel walls, lymphatic vessels, fibrotic structures, necrosis, etc.) can be performed. The analysis and segmentation of the immobilized state of the specimen 20A will be detailed later.
(画像生成部132)
画像生成部132は、解析部131によって分離された蛍光シグナルまたは自家蛍光シグナルに基づいて画像情報を生成(再構成)する構成である。例えば、画像生成部132は、蛍光シグナルのみが含まれる画像情報を生成したり、自家蛍光シグナルのみが含まれる画像情報を生成したりすることができる。その際、蛍光シグナルが複数の蛍光成分によって構成されていたり、自家蛍光シグナルが複数の自家蛍光成分によって構成されたりしている場合、画像生成部132は、それぞれの成分単位で画像情報を生成することができる。さらに、解析部131が分離後の蛍光シグナルまたは自家蛍光シグナルを用いた各種処理(例えば、標本20Aの固定化状態の解析、セグメンテーション、またはS/N値の算出など)を行った場合、画像生成部132は、それらの処理の結果を示す画像情報を生成してもよい。本構成によれば、標的分子等に標識された蛍光試薬10Aの分布情報、つまり蛍光の二次元的な広がりや強度、波長、及びそれぞれの位置関係が可視化され、特に標的物質の情報が複雑な組織画像解析領域においてユーザである医師や研究者の視認性を向上させることができる。 (Image generator 132)
The image generation unit 132 is configured to generate (reconstruct) image information based on the fluorescence signal or the autofluorescence signal separated by theanalysis unit 131 . For example, the image generator 132 can generate image information containing only fluorescence signals, or image information containing only autofluorescence signals. At that time, when the fluorescence signal is composed of a plurality of fluorescence components, or the autofluorescence signal is composed of a plurality of autofluorescence components, the image generation unit 132 generates image information for each component. be able to. Furthermore, when the analysis unit 131 performs various processes using the fluorescent signal or the autofluorescent signal after separation (for example, analysis of the immobilization state of the specimen 20A, segmentation, calculation of the S/N value, etc.), image generation The unit 132 may generate image information indicating the results of those processes. According to this configuration, the distribution information of the fluorescent reagent 10A labeled on the target molecule or the like, that is, the two-dimensional spread and intensity of the fluorescence, the wavelength, and the positional relationship between them can be visualized. It is possible to improve the visibility of the user, such as a doctor or a researcher, in the tissue image analysis area.
画像生成部132は、解析部131によって分離された蛍光シグナルまたは自家蛍光シグナルに基づいて画像情報を生成(再構成)する構成である。例えば、画像生成部132は、蛍光シグナルのみが含まれる画像情報を生成したり、自家蛍光シグナルのみが含まれる画像情報を生成したりすることができる。その際、蛍光シグナルが複数の蛍光成分によって構成されていたり、自家蛍光シグナルが複数の自家蛍光成分によって構成されたりしている場合、画像生成部132は、それぞれの成分単位で画像情報を生成することができる。さらに、解析部131が分離後の蛍光シグナルまたは自家蛍光シグナルを用いた各種処理(例えば、標本20Aの固定化状態の解析、セグメンテーション、またはS/N値の算出など)を行った場合、画像生成部132は、それらの処理の結果を示す画像情報を生成してもよい。本構成によれば、標的分子等に標識された蛍光試薬10Aの分布情報、つまり蛍光の二次元的な広がりや強度、波長、及びそれぞれの位置関係が可視化され、特に標的物質の情報が複雑な組織画像解析領域においてユーザである医師や研究者の視認性を向上させることができる。 (Image generator 132)
The image generation unit 132 is configured to generate (reconstruct) image information based on the fluorescence signal or the autofluorescence signal separated by the
また、画像生成部132は解析部131によって分離された蛍光シグナルまたは自家蛍光シグナルに基づいて自家蛍光シグナルに対する蛍光シグナルを区別するよう制御し、画像情報を生成しても良い。具体的には、標的分子等に標識された蛍光試薬10Aの蛍光スペクトルの輝度を向上させる、標識された蛍光試薬10Aの蛍光スペクトルのみを抽出し変色させる、2以上の蛍光試薬10Aによって標識された標本20Aから2以上の蛍光試薬10Aの蛍光スペクトルを抽出しそれぞれを別の色に変色する、標本20Aの自家蛍光スペクトルのみを抽出し除算または減算する、ダイナミックレンジを向上させる、等を制御し画像情報を生成してもよい。これによりユーザは目的となる標的物質に結合した蛍光試薬由来の色情報を明確に区別することが可能となり、ユーザの視認性を向上させることができる。
Further, the image generation unit 132 may control to distinguish the fluorescence signal from the autofluorescence signal based on the fluorescence signal or the autofluorescence signal separated by the analysis unit 131, and generate image information. Specifically, it improves the brightness of the fluorescent spectrum of the fluorescent reagent 10A labeled with the target molecule or the like, extracts only the fluorescent spectrum of the labeled fluorescent reagent 10A and changes its color, and is labeled with two or more fluorescent reagents 10A. Fluorescence spectra of two or more fluorescent reagents 10A are extracted from the sample 20A and each is changed to a different color, only the autofluorescence spectrum of the sample 20A is extracted and divided or subtracted, the dynamic range is improved, and the like are controlled to control the image. information may be generated. As a result, the user can clearly distinguish the color information derived from the fluorescent reagent bound to the target substance of interest, and the user's visibility can be improved.
(表示部140)
表示部140は、画像生成部132によって生成された画像情報をディスプレイに表示することでユーザへ提示する構成である。なお、表示部140として用いられるディスプレイの種類は特に限定されない。また、本実施形態では詳細に説明しないが、画像生成部132によって生成された画像情報がプロジェクターによって投影されたり、プリンタによってプリントされたりすることでユーザへ提示されてもよい(換言すると、画像情報の出力方法は特に限定されない)。 (Display unit 140)
Thedisplay unit 140 presents the image information generated by the image generation unit 132 to the user by displaying it on the display. The type of display used as display unit 140 is not particularly limited. Further, although not described in detail in this embodiment, the image information generated by the image generation unit 132 may be presented to the user by being projected by a projector or printed by a printer (in other words, image information is not particularly limited).
表示部140は、画像生成部132によって生成された画像情報をディスプレイに表示することでユーザへ提示する構成である。なお、表示部140として用いられるディスプレイの種類は特に限定されない。また、本実施形態では詳細に説明しないが、画像生成部132によって生成された画像情報がプロジェクターによって投影されたり、プリンタによってプリントされたりすることでユーザへ提示されてもよい(換言すると、画像情報の出力方法は特に限定されない)。 (Display unit 140)
The
(制御部150)
制御部150は、情報処理装置100が行う処理全般を統括的に制御する機能構成である。例えば、制御部150は、操作部160を介して行われるユーザによる操作入力に基づいて、上記で説明したような各種処理(例えば、蛍光染色標本30Aの撮像処理、解析処理、画像情報の生成処理(画像情報の再構築処理)、および画像情報の表示処理など)の開始や終了などを制御する。なお、制御部150の制御内容は特に限定されない。例えば、制御部150は、汎用コンピュータ、PC、タブレットPCなどにおいて一般的に行われる処理(例えば、OS(Operating System)に関する処理)を制御してもよい。 (control unit 150)
Thecontrol unit 150 is a functional configuration that controls overall processing performed by the information processing apparatus 100 . For example, the control unit 150 performs various processes such as those described above (for example, imaging processing, analysis processing, and image information generation processing of the fluorescently stained specimen 30A) based on the operation input by the user performed via the operation unit 160. (reconstruction processing of image information), display processing of image information, etc.). In addition, the control content of the control part 150 is not specifically limited. For example, the control unit 150 may control processing (for example, processing related to an OS (Operating System)) generally performed in general-purpose computers, PCs, tablet PCs, and the like.
制御部150は、情報処理装置100が行う処理全般を統括的に制御する機能構成である。例えば、制御部150は、操作部160を介して行われるユーザによる操作入力に基づいて、上記で説明したような各種処理(例えば、蛍光染色標本30Aの撮像処理、解析処理、画像情報の生成処理(画像情報の再構築処理)、および画像情報の表示処理など)の開始や終了などを制御する。なお、制御部150の制御内容は特に限定されない。例えば、制御部150は、汎用コンピュータ、PC、タブレットPCなどにおいて一般的に行われる処理(例えば、OS(Operating System)に関する処理)を制御してもよい。 (control unit 150)
The
(操作部160)
操作部160は、ユーザからの操作入力を受ける構成である。より具体的には、操作部160は、キーボード、マウス、ボタン、タッチパネル、またはマイクロフォンなどの各種入力手段を備えており、ユーザはこれらの入力手段を操作することで情報処理装置100に対して様々な入力を行うことができる。操作部160を介して行われた操作入力に関する情報は制御部150へ提供される。 (Operation unit 160)
Theoperation unit 160 is configured to receive an operation input from the user. More specifically, the operation unit 160 includes various input means such as a keyboard, mouse, buttons, touch panel, or microphone. input can be performed. Information regarding the operation input performed via the operation unit 160 is provided to the control unit 150 .
操作部160は、ユーザからの操作入力を受ける構成である。より具体的には、操作部160は、キーボード、マウス、ボタン、タッチパネル、またはマイクロフォンなどの各種入力手段を備えており、ユーザはこれらの入力手段を操作することで情報処理装置100に対して様々な入力を行うことができる。操作部160を介して行われた操作入力に関する情報は制御部150へ提供される。 (Operation unit 160)
The
(データベース200)
データベース200は、標本情報、試薬情報、および解析処理の結果を管理する装置である。より具体的に説明すると、データベース200は、標本識別情報21Aと標本情報、試薬識別情報11Aと試薬情報をそれぞれ紐づけて管理する。これによって、情報取得部111は、計測対象である標本20Aの標本識別情報21Aに基づいて標本情報を、蛍光試薬10Aの試薬識別情報11Aに基づいて試薬情報をデータベース200から取得することができる。 (Database 200)
Thedatabase 200 is a device that manages sample information, reagent information, and analysis processing results. More specifically, the database 200 associates and manages the specimen identification information 21A and the specimen information, and the reagent identification information 11A and the reagent information. Accordingly, the information acquisition unit 111 can acquire specimen information from the database 200 based on the specimen identification information 21A of the specimen 20A to be measured, and reagent information based on the reagent identification information 11A of the fluorescent reagent 10A.
データベース200は、標本情報、試薬情報、および解析処理の結果を管理する装置である。より具体的に説明すると、データベース200は、標本識別情報21Aと標本情報、試薬識別情報11Aと試薬情報をそれぞれ紐づけて管理する。これによって、情報取得部111は、計測対象である標本20Aの標本識別情報21Aに基づいて標本情報を、蛍光試薬10Aの試薬識別情報11Aに基づいて試薬情報をデータベース200から取得することができる。 (Database 200)
The
データベース200が管理する標本情報は、上記のとおり、標本20Aに含まれる自家蛍光成分固有の計測チャネルおよびスペクトル情報を含む情報である。しかし、これら以外にも、標本情報には、各標本20Aについての対象情報、具体的には、使用される組織(例えば臓器、細胞、血液、体液、腹水、胸水など)の種類、対象となる疾病の種類、対象者の属性(例えば、年齢、性別、血液型、または人種など)、または対象者の生活習慣(例えば、食生活、運動習慣、または喫煙習慣など)に関する情報が含まれてもよく、標本20Aに含まれる自家蛍光成分固有の計測チャネルおよびスペクトル情報を含む情報及び対象情報は標本20Aごとに紐づけられてもよい。これにより、対象情報から標本20Aに含まれる自家蛍光成分固有の計測チャネルおよびスペクトル情報を含む情報を容易にたどることができ、例えば複数の標本20Aにおける対象情報の類似性から解析部131に過去に行われた類似の分離処理を実行させ、測定時間を短縮することが可能となる。なお、「使用される組織」は対象から採取された組織には特に限定されず、ヒトや動物等の生体内組織や細胞株、測定の対象物に含まれる溶液、溶剤、溶質、材料も含めてもよい。
The specimen information managed by the database 200 is, as described above, information including the measurement channel and spectrum information specific to the autofluorescence component contained in the specimen 20A. However, in addition to these, the specimen information includes target information about each specimen 20A, specifically, the type of tissue used (eg, organ, cell, blood, body fluid, ascites, pleural effusion, etc.) Include information about the type of disease, attributes of the subject (e.g. age, gender, blood type, or race), or lifestyle habits of the subject (e.g. diet, exercise habits, smoking habits, etc.) Alternatively, the information including the measurement channel and spectrum information specific to the autofluorescent component contained in the specimen 20A and the target information may be associated with each specimen 20A. As a result, information including measurement channels and spectrum information unique to the autofluorescence component contained in the specimen 20A can be easily traced from the target information. It is possible to reduce the measurement time by executing a similar separation process that has been performed. In addition, the "tissue used" is not particularly limited to the tissue collected from the subject, and includes in vivo tissues such as humans and animals, cell strains, and solutions, solvents, solutes, and materials contained in the subject of measurement. may
また、データベース200が管理する試薬情報は、上記のとおり、蛍光試薬10Aのスペクトル情報を含む情報であり、しかし、これ以外にも、試薬情報には、製造ロット、蛍光成分、抗体、クローン、蛍光標識率、量子収率、褪色係数(蛍光試薬10Aの蛍光強度の低減し易さを示す情報)、および吸収断面積(またはモル吸光係数)などの蛍光試薬10Aに関する情報が含まれてもよい。さらに、データベース200が管理する標本情報および試薬情報は異なる構成で管理されていてもよく、特に試薬に関する情報はユーザに最適な試薬の組み合わせを提示する試薬データベースであってもよい。
In addition, the reagent information managed by the database 200 is, as described above, information including the spectral information of the fluorescent reagent 10A. Information about the fluorescent reagent 10A, such as labeling rate, quantum yield, bleaching coefficient (information indicating how easily the fluorescence intensity of the fluorescent reagent 10A decreases), and absorption cross-section (or molar extinction coefficient) may be included. Furthermore, the specimen information and reagent information managed by the database 200 may be managed in different configurations, and in particular, the information on reagents may be a reagent database that presents the user with the optimum combination of reagents.
ここで、標本情報および試薬情報は、製造者(メーカー)などから提供されるか、本開示に係る情報処理システム内で独自に計測されることを想定している。例えば、蛍光試薬10Aの製造者は、製造ロット毎にスペクトル情報や蛍光標識率などを計測し提供することなどをしない場合が多い。したがって、本開示に係る情報処理システム内で独自にこれらの情報を計測し、管理することで蛍光シグナルと自家蛍光シグナルの分離精度が向上され得る。また、管理の簡略化のために、データベース200は、製造者(メーカー)などによって公開されているカタログ値、または各種文献に記載されている文献値などを標本情報および試薬情報(特に試薬情報)として用いてもよい。しかし、一般的に、実際の標本情報および試薬情報はカタログ値や文献値とは異なる場合が多いため、上記のように標本情報および試薬情報が本開示に係る情報処理システム内で独自に計測され管理される方がより好ましい。
Here, it is assumed that the specimen information and reagent information are provided by the manufacturer (manufacturer) or the like, or are independently measured within the information processing system according to the present disclosure. For example, the manufacturer of the fluorescent reagent 10A often does not measure and provide spectral information, fluorescence labeling rate, etc. for each manufacturing lot. Therefore, by independently measuring and managing these pieces of information within the information processing system according to the present disclosure, the separation accuracy between the fluorescence signal and the autofluorescence signal can be improved. In addition, in order to simplify management, the database 200 stores specimen information and reagent information (especially reagent information) such as catalog values published by manufacturers (manufacturers) or literature values described in various literatures. may be used as However, in general, actual specimen information and reagent information often differ from catalog values and literature values, so specimen information and reagent information are measured independently within the information processing system according to the present disclosure as described above. Managed is better.
また、データベース200にて管理されている標本情報、試薬情報、および解析処理の結果を用いる機械学習技術などによって、解析処理(例えば、蛍光シグナルと自家蛍光シグナルとの分離処理など)の精度が向上され得る。機械学習技術などを用いて学習を行う主体は特に限定されないところ、本実施形態では情報処理装置100の解析部131が学習を行う場合を一例として説明する。例えば、解析部131は、ニューラルネットワークを用いて、分離後の蛍光シグナルおよび自家蛍光シグナルと、分離に用いられた画像情報、標本情報および試薬情報とが紐づけられた学習データによって機械学習された分類器または推定器を生成する。そして、画像情報、標本情報および試薬情報が新たに取得された場合、解析部131は、それらの情報を分類器または推定器に入力することで、当該画像情報に含まれる蛍光シグナルおよび自家蛍光シグナルを予測して出力することができる。
In addition, the accuracy of analysis processing (for example, separation processing between fluorescence signals and autofluorescence signals, etc.) is improved by machine learning techniques that use specimen information, reagent information, and analysis processing results managed in the database 200. can be Although there is no particular limitation on the entity that performs learning using a machine learning technique or the like, in the present embodiment, a case where the analysis unit 131 of the information processing apparatus 100 performs learning will be described as an example. For example, the analysis unit 131 uses a neural network to perform machine learning using learning data in which the fluorescent signal and autofluorescent signal after separation are associated with the image information, specimen information, and reagent information used for separation. Generate a classifier or estimator. Then, when the image information, specimen information, and reagent information are newly acquired, the analysis unit 131 inputs the information to the classifier or the estimator, thereby obtaining the fluorescence signal and the autofluorescence signal included in the image information. can be predicted and output.
また、予測される蛍光シグナルおよび自家蛍光シグナルよりも精度の高い、過去に行われた類似の分離処理(類似の画像情報、標本情報、または試薬情報が用いられる分離処理)を算出し、それらの処理における処理の内容(処理に用いられる情報やパラメータなど)を統計的または回帰的に分析し、分析結果に基づいて蛍光シグナルと自家蛍光シグナルの分離処理を改善する方法が出力されてもよい。なお、機械学習の方法は上記に限定されず、公知の機械学習技術が用いられ得る。また、人工知能によって蛍光シグナルと自家蛍光シグナルの分離処理が行われてもよい。また、蛍光シグナルと自家蛍光シグナルとの分離処理だけでなく、分離後の蛍光シグナルまたは自家蛍光シグナルを用いた各種処理(例えば、標本20Aの固定化状態の解析、またはセグメンテーションなど)が機械学習技術などによって改善されてもよい。
In addition, similar separation processes performed in the past (separation processes using similar image information, sample information, or reagent information) with higher accuracy than the predicted fluorescence signal and autofluorescence signal are calculated, and their Statistically or recursively analyze the contents of the processing in the processing (information and parameters used in the processing, etc.), a method for improving the separation processing of the fluorescence signal and the autofluorescence signal based on the analysis results may be output. Note that the machine learning method is not limited to the above, and a known machine learning technique can be used. Also, artificial intelligence may be used to separate the fluorescence signal and the autofluorescence signal. In addition, not only the separation processing of the fluorescent signal and the autofluorescent signal, but also various processing using the separated fluorescent signal or the autofluorescent signal (for example, analysis of the immobilization state of the specimen 20A, segmentation, etc.) is a machine learning technology. etc., may be improved.
以上、本実施形態に係る情報処理システムの構成例について説明した。なお、図1を参照して説明した上記の構成はあくまで一例であり、本実施形態に係る情報処理システムの構成は係る例に限定されない。例えば、情報処理装置100は、図1に示す機能構成の全てを必ずしも備えなくてもよい。また、情報処理装置100は、データベース200を内部に備えていてもよい。情報処理装置100の機能構成は、仕様や運用に応じて柔軟に変形可能である。
The configuration example of the information processing system according to the present embodiment has been described above. Note that the above configuration described with reference to FIG. 1 is merely an example, and the configuration of the information processing system according to this embodiment is not limited to the example. For example, the information processing apparatus 100 does not necessarily have all the functional configurations shown in FIG. Further, the information processing apparatus 100 may include the database 200 therein. The functional configuration of the information processing apparatus 100 can be flexibly modified according to specifications and operations.
また、情報処理装置100は、上記で説明してきた処理以外の処理を行ってもよい。例えば、蛍光試薬10Aに関する量子収率、蛍光標識率、および吸収断面積(もしくはモル吸光係数)などの情報が試薬情報に含まれることによって、情報処理装置100は、自家蛍光シグナルが除去された画像情報、および試薬情報を用いて画像情報における蛍光分子数や、蛍光分子と結合している抗体数などを算出してもよい。
Also, the information processing apparatus 100 may perform processing other than the processing described above. For example, the reagent information includes information such as the quantum yield, fluorescence labeling rate, and absorption cross section (or molar extinction coefficient) of the fluorescent reagent 10A. Information and reagent information may be used to calculate the number of fluorescent molecules in image information, the number of antibodies bound to fluorescent molecules, and the like.
<1-2.情報処理装置の処理例>
本実施形態に係る情報処理装置100の処理例について図2を参照して説明する。図2は、本実施形態に係る情報処理装置100の処理の流れの一例を示すフローチャートである。 <1-2. Processing example of information processing device>
A processing example of theinformation processing apparatus 100 according to the present embodiment will be described with reference to FIG. FIG. 2 is a flowchart showing an example of the processing flow of the information processing apparatus 100 according to this embodiment.
本実施形態に係る情報処理装置100の処理例について図2を参照して説明する。図2は、本実施形態に係る情報処理装置100の処理の流れの一例を示すフローチャートである。 <1-2. Processing example of information processing device>
A processing example of the
図2に示すように、ステップS1000では、ユーザが解析に用いる蛍光試薬10Aおよび標本20Aを決定する。ステップS1004では、ユーザが蛍光試薬10Aを用いて標本20Aを染色することで蛍光染色標本30Aを作成する。
As shown in FIG. 2, in step S1000, the user determines the fluorescent reagent 10A and specimen 20A to be used for analysis. In step S1004, the user creates a fluorescently stained specimen 30A by staining the specimen 20A with the fluorescent reagent 10A.
ステップS1008では、情報処理装置100の画像取得部112が蛍光染色標本30Aを撮像することで画像情報を取得する。ステップS1012では、情報取得部111が蛍光染色標本30Aの生成に使用された蛍光試薬10Aに付された試薬識別情報11A、および標本20Aに付された標本識別情報21Aに基づいて試薬情報および標本情報をデータベース200から取得する。
In step S1008, the image acquisition unit 112 of the information processing apparatus 100 acquires image information by imaging the fluorescence-stained specimen 30A. In step S1012, the information acquisition unit 111 acquires the reagent information and specimen information based on the reagent identification information 11A attached to the fluorescent reagent 10A and the specimen identification information 21A attached to the specimen 20A used to generate the fluorescently stained specimen 30A. is obtained from the database 200 .
ステップS1016では、解析部131が、標本情報および試薬情報に基づいて画像情報から標本20Aの自家蛍光シグナルと蛍光試薬10Aの蛍光シグナルとを分離する。ここで、蛍光シグナルに複数の蛍光色素のシグナルが含まれる場合(ステップS1020/Yes)、ステップS1024にて、解析部131が各蛍光色素の蛍光シグナルを分離する。なお、蛍光シグナルに複数の蛍光色素のシグナルが含まれない場合(ステップS1020/No)には、ステップS1024にて各蛍光色素の蛍光シグナルの分離処理は行われない。
In step S1016, the analysis unit 131 separates the autofluorescence signal of the specimen 20A and the fluorescence signal of the fluorescent reagent 10A from the image information based on the specimen information and the reagent information. Here, if the fluorescence signal includes signals of a plurality of fluorochromes (step S1020/Yes), the analysis unit 131 separates the fluorescence signals of each fluorochrome in step S1024. Note that if the fluorescent signal does not include signals of a plurality of fluorescent dyes (step S1020/No), separation processing of the fluorescent signals of the respective fluorescent dyes is not performed in step S1024.
ステップS1028では、画像生成部132が解析部131によって分離された蛍光シグナルを用いて画像情報を生成する。例えば、画像生成部132は、画像情報から自家蛍光シグナルが除去された画像情報を生成したり、蛍光シグナルを蛍光色素ごとに表示した画像情報を生成したりする。ステップS1032では、表示部140が画像生成部132によって生成された画像情報を表示することで一連の処理が終了する。
In step S1028, the image generation unit 132 uses the fluorescence signals separated by the analysis unit 131 to generate image information. For example, the image generation unit 132 generates image information from which the autofluorescence signal is removed from the image information, or generates image information in which the fluorescence signal is displayed for each fluorescent dye. In step S1032, the display unit 140 displays the image information generated by the image generation unit 132, and the series of processing ends.
なお、図2のフローチャートにおける各ステップは、必ずしも記載された順序に沿って時系列に処理される必要はない。すなわち、フローチャートにおける各ステップは、記載された順序と異なる順序で処理されても、並列的に処理されてもよい。
It should be noted that each step in the flowchart of FIG. 2 does not necessarily have to be processed in chronological order according to the described order. That is, each step in the flow chart may be processed in a different order than the order described or in parallel.
例えば、解析部131は、ステップS1016にて画像情報から標本20Aの自家蛍光シグナルと蛍光試薬10Aの蛍光シグナルとを分離した後に、ステップS1024にて各蛍光色素の蛍光シグナルを分離するのではなく、直に画像情報から各蛍光色素の蛍光シグナルを分離してもよい。また、解析部131は、画像情報から各蛍光色素の蛍光シグナルを分離した後に、画像情報から標本20Aの自家蛍光シグナルを分離してもよい。
For example, after separating the autofluorescence signal of the sample 20A and the fluorescence signal of the fluorescent reagent 10A from the image information in step S1016, the analysis unit 131 separates the fluorescence signal of each fluorescent dye in step S1024. The fluorescence signal of each fluorochrome may be separated directly from the image information. Further, the analysis unit 131 may separate the autofluorescence signal of the specimen 20A from the image information after separating the fluorescence signal of each fluorescent dye from the image information.
また、情報処理装置100は、図2には示されていない処理を併せて実行してもよい。例えば、解析部131はシグナルを分離するだけでなく、分離した蛍光シグナルまたは自家蛍光シグナルに基づいてセグメンテーションを行ったり、標本20Aの固定化状態の解析を行ったりしてもよい。
In addition, the information processing apparatus 100 may also perform processing not shown in FIG. For example, the analysis unit 131 may not only separate signals, but may also perform segmentation based on the separated fluorescent signal or autofluorescent signal, or may analyze the immobilization state of the specimen 20A.
<1-3.蛍光分離の処理例>
本実施形態に係る蛍光分離の処理例について図3及び図4を参照して説明する。図3は、本実施形態に係る解析部131の概略構成の一例を示す図である。図4は、本実施形態に係る連結蛍光スペクトルの生成方法の一例を説明するための図である。 <1-3. Processing example of fluorescence separation>
A processing example of fluorescence separation according to the present embodiment will be described with reference to FIGS. 3 and 4. FIG. FIG. 3 is a diagram showing an example of a schematic configuration of theanalysis unit 131 according to this embodiment. FIG. 4 is a diagram for explaining an example of a method for generating a concatenated fluorescence spectrum according to this embodiment.
本実施形態に係る蛍光分離の処理例について図3及び図4を参照して説明する。図3は、本実施形態に係る解析部131の概略構成の一例を示す図である。図4は、本実施形態に係る連結蛍光スペクトルの生成方法の一例を説明するための図である。 <1-3. Processing example of fluorescence separation>
A processing example of fluorescence separation according to the present embodiment will be described with reference to FIGS. 3 and 4. FIG. FIG. 3 is a diagram showing an example of a schematic configuration of the
図3に示すように、解析部131は、連結部1311と、色分離部1321と、スペクトル抽出部1322とを備える。この解析部131は、蛍光分離処理を含む各種処理を行う構成になっている。例えば、解析部131は、蛍光分離処理の前処理として蛍光スペクトルを連結し、その連結蛍光スペクトルを分子毎に分離する構成になっている。
As shown in FIG. 3, the analysis unit 131 includes a connection unit 1311, a color separation unit 1321, and a spectrum extraction unit 1322. This analysis unit 131 is configured to perform various types of processing including fluorescence separation processing. For example, the analysis unit 131 is configured to concatenate fluorescence spectra as preprocessing for fluorescence separation processing and separate the concatenated fluorescence spectra for each molecule.
(連結部1311)
連結部1311は、画像取得部112によって取得された複数の蛍光スペクトルの少なくとも一部を波長方向に連結することで連結蛍光スペクトルを生成する構成になっている。例えば、連結部1311は、画像取得部112によって取得された4つの蛍光スペクトル(図4のA~D)それぞれにおける蛍光強度の最大値を含むように、各蛍光スペクトルにおける所定幅のデータを抽出する。連結部1311がデータを抽出する波長帯域の幅は、試薬情報、励起波長又は蛍光波長等に基づいて決定され得、各蛍光物質についてそれぞれ異なっていてもよい(換言すると、連結部1311がデータを抽出する波長帯域の幅は、図4のA~Dに示された蛍光スペクトルそれぞれで異なっていてもよい)。そして図4のEに示すように、連結部1311は、抽出したデータを波長方向に互いに連結することで一つの連結蛍光スペクトルを生成する。なお、連結蛍光スペクトルは、複数の蛍光スペクトルから抽出されたデータによって構成されるため、連結された各データの境界では波長が連続していない点に留意されたい。 (Connecting part 1311)
Theconnection unit 1311 is configured to generate a connection fluorescence spectrum by connecting at least part of the plurality of fluorescence spectra acquired by the image acquisition unit 112 in the wavelength direction. For example, the connecting unit 1311 extracts data of a predetermined width in each fluorescence spectrum so as to include the maximum fluorescence intensity in each of the four fluorescence spectra (A to D in FIG. 4) acquired by the image acquisition unit 112. . The width of the wavelength band from which the connection unit 1311 extracts data can be determined based on the reagent information, the excitation wavelength, the fluorescence wavelength, or the like, and may be different for each fluorescent substance (in other words, the connection unit 1311 extracts the data. The width of the wavelength band to be extracted may be different for each of the fluorescence spectra shown in FIGS. 4A to 4D). Then, as shown in E of FIG. 4, the connecting unit 1311 generates one connected fluorescence spectrum by connecting the extracted data in the wavelength direction. Note that since the concatenated fluorescence spectrum is composed of data extracted from a plurality of fluorescence spectra, the wavelengths are not continuous at the boundaries of each concatenated data.
連結部1311は、画像取得部112によって取得された複数の蛍光スペクトルの少なくとも一部を波長方向に連結することで連結蛍光スペクトルを生成する構成になっている。例えば、連結部1311は、画像取得部112によって取得された4つの蛍光スペクトル(図4のA~D)それぞれにおける蛍光強度の最大値を含むように、各蛍光スペクトルにおける所定幅のデータを抽出する。連結部1311がデータを抽出する波長帯域の幅は、試薬情報、励起波長又は蛍光波長等に基づいて決定され得、各蛍光物質についてそれぞれ異なっていてもよい(換言すると、連結部1311がデータを抽出する波長帯域の幅は、図4のA~Dに示された蛍光スペクトルそれぞれで異なっていてもよい)。そして図4のEに示すように、連結部1311は、抽出したデータを波長方向に互いに連結することで一つの連結蛍光スペクトルを生成する。なお、連結蛍光スペクトルは、複数の蛍光スペクトルから抽出されたデータによって構成されるため、連結された各データの境界では波長が連続していない点に留意されたい。 (Connecting part 1311)
The
このとき、連結部1311は、励起光の強度に基づいて、複数の蛍光スペクトルそれぞれに対応する励起光の強度を揃えた後に(換言すると、複数の蛍光スペクトルを補正した後に)上記の連結を行う。より具体的には、連結部1311は、励起光の強度である励起パワー密度で各蛍光スペクトルを除算することで、複数の蛍光スペクトルそれぞれに対応する励起光の強度を揃えた後に上記の連結を行う。これによって、同一強度の励起光が照射された場合の蛍光スペクトルが求められる。また、照射される励起光の強度が異なる場合、その強度に応じて蛍光染色標本30Aに吸収されるスペクトル(以降、「吸収スペクトル」と呼称する)の強度も異なる。したがって、上記のように、複数の蛍光スペクトルそれぞれに対応する励起光の強度が揃えられることで、吸収スペクトルを適切に評価することができる。
At this time, the connecting unit 1311 performs the above connection after aligning the intensity of the excitation light corresponding to each of the plurality of fluorescence spectra based on the intensity of the excitation light (in other words, after correcting the plurality of fluorescence spectra). . More specifically, the connecting unit 1311 divides each fluorescence spectrum by the excitation power density, which is the intensity of the excitation light, to equalize the intensity of the excitation light corresponding to each of the plurality of fluorescence spectra, and then perform the above connection. conduct. As a result, fluorescence spectra are obtained when excitation light of the same intensity is applied. Further, when the intensity of the irradiated excitation light is different, the intensity of the spectrum absorbed by the fluorescence-stained specimen 30A (hereinafter referred to as "absorption spectrum") also differs according to the intensity. Therefore, as described above, by aligning the intensity of the excitation light corresponding to each of the plurality of fluorescence spectra, the absorption spectra can be appropriately evaluated.
ここで、図4のA~Dは、画像取得部112によって取得された蛍光スペクトルの具体例である。図4のA~Dでは、蛍光染色標本30Aに、例えば、DAPI、CK/AF488、PgR/AF594及びER/AF647という4種の蛍光物質が含まれ、それぞれの励起波長として392[nm](図4のA)、470[nm](図4のB)、549[nm](図4のC)、628[nm](図4のD)を有する励起光が照射された場合に取得された蛍光スペクトルの具体例が示されている。なお、蛍光発光のためにエネルギーが放出されることにより、蛍光波長は励起波長よりも長波長側にシフトしている点に留意されたい(ストークスシフト)。また、蛍光染色標本30Aに含まれる蛍光物質、及び照射される励起光の励起波長は上記に限定されない。
Here, A to D in FIG. 4 are specific examples of fluorescence spectra acquired by the image acquisition unit 112. FIG. 4A to 4D, the fluorescently stained sample 30A contains, for example, four types of fluorescent substances, DAPI, CK/AF488, PgR/AF594 and ER/AF647, each of which has an excitation wavelength of 392 [nm] (Fig. 4 A), 470 [nm] (B in FIG. 4), 549 [nm] (C in FIG. 4), and 628 [nm] (D in FIG. 4) were irradiated. Specific examples of fluorescence spectra are shown. Note that the fluorescence wavelength is shifted to longer wavelengths than the excitation wavelength (Stokes shift) due to the release of energy for fluorescence emission. Further, the fluorescent substance contained in the fluorescently stained specimen 30A and the excitation wavelength of the irradiated excitation light are not limited to the above.
詳細には、連結部1311は、図4のAに示す蛍光スペクトルから励起波長392nm以上591nm以下の波長帯域の蛍光スペクトルSP1を抽出し、図4のBに示す蛍光スペクトルから励起波長470nm以上669nm以下の波長帯域の蛍光スペクトルSP2を抽出し、図4のCに示す蛍光スペクトルから励起波長549nm以上748nm以下の波長帯域の蛍光スペクトルSP3を抽出し、図4のDに示す蛍光スペクトルから励起波長628nm以上827nm以下の波長帯域の蛍光スペクトルSP4を抽出する。次に、連結部1311は、抽出した蛍光スペクトルSP1の波長分解能を16nmに補正し(強度補正は無し)、蛍光スペクトルSP2の強度を1.2倍に補正するとともに波長分解能を8nmに補正し、蛍光スペクトルSP3の強度を1.5倍に補正し(波長分解能の補正は無し)、蛍光スペクトルSP4の強度を4.0倍に補正するとともに波長分解能を4nmに補正する。そして、連結部1311は、補正後の蛍光スペクトルSP1~SP4を順番に連結することで、図4のEに示すような連結蛍光スペクトルを生成する。
Specifically, the connecting part 1311 extracts the fluorescence spectrum SP1 in the wavelength band of 392 nm or more and 591 nm or less of the excitation wavelength from the fluorescence spectrum shown in A of FIG. Extract the fluorescence spectrum SP2 in the wavelength band of, extract the fluorescence spectrum SP3 in the wavelength band of 549 nm or more and 748 nm or less from the fluorescence spectrum shown in C of FIG. A fluorescence spectrum SP4 in a wavelength band of 827 nm or less is extracted. Next, the connecting unit 1311 corrects the wavelength resolution of the extracted fluorescence spectrum SP1 to 16 nm (no intensity correction), corrects the intensity of the fluorescence spectrum SP2 to 1.2 times, and corrects the wavelength resolution to 8 nm, The intensity of the fluorescence spectrum SP3 is corrected to 1.5 times (no wavelength resolution correction), the intensity of the fluorescence spectrum SP4 is corrected to 4.0 times, and the wavelength resolution is corrected to 4 nm. The linking unit 1311 then links the corrected fluorescence spectra SP1 to SP4 in order to generate a linked fluorescence spectrum as shown in FIG. 4E.
なお、図4には、連結部1311が各蛍光スペクトルを取得した際の励起波長から所定帯域幅(図4では200nm幅)の蛍光スペクトルSP1~SP4を抽出して連結した場合が示されているが、連結部1311が抽出する蛍光スペクトルの帯域幅は、各蛍光スペクトルで一致している必要はなく、異なっていてもよい。すなわち、連結部1311が各蛍光スペクトルから抽出する領域は、各蛍光スペクトルのピーク波長を含む領域であればよく、その波長帯域及び帯域幅については適宜変更されてよい。その際、ストークスシフトによるスペクトル波長のズレが考慮されてもよい。このように、抽出する波長帯域を絞り込むことで、データ量を削減することが可能となるため、より高速に蛍光分離処理を実行することが可能となる。
FIG. 4 shows a case where the connection unit 1311 extracts and connects the fluorescence spectra SP1 to SP4 with a predetermined bandwidth (200 nm width in FIG. 4) from the excitation wavelength when each fluorescence spectrum is acquired. However, the bandwidth of the fluorescence spectrum extracted by the connecting part 1311 does not need to be the same for each fluorescence spectrum, and may be different. That is, the region extracted from each fluorescence spectrum by the connecting part 1311 may be a region including the peak wavelength of each fluorescence spectrum, and its wavelength band and bandwidth may be changed as appropriate. At that time, spectral wavelength deviation due to Stokes shift may be taken into consideration. By narrowing down the wavelength band to be extracted in this way, it is possible to reduce the amount of data, so that fluorescence separation processing can be executed at a higher speed.
また、本説明における励起光の強度は、上述したように、励起パワーや励起パワー密度であってよい。励起パワー又は励起パワー密度は、光源から出射した励起光を実測することで得られたパワー又はパワー密度であってもよいし、光源に与える駆動電圧から求まるパワー又はパワー密度であってもよい。なお、本説明における励起光の強度は、上記励起パワー密度を、観測対象である切片の各励起光に対する吸収率や、切片から放射した蛍光を検出する検出系(画像取得部112等)における検出信号の増幅率等で補正することで得られた値であってもよい。すなわち、本説明における励起光の強度は、蛍光物質の励起に実際に寄与した励起光のパワー密度や、そのパワー密度を検出系の増幅率等で補正した値等であってもよい。吸収率や増幅率等を考慮することで、マシン状態や環境等の変化に応じて変化する励起光の強度を適切に補正することが可能となるため、より高い精度の色分離を可能にする連結蛍光スペクトルを生成することが可能となる。
Also, the intensity of pumping light in this description may be pumping power or pumping power density, as described above. The excitation power or excitation power density may be the power or power density obtained by actually measuring the excitation light emitted from the light source, or the power or power density obtained from the driving voltage applied to the light source. It should be noted that the intensity of the excitation light in this description refers to the excitation power density, the absorption rate of the section to be observed for each excitation light, and the detection system (image acquisition unit 112, etc.) that detects the fluorescence emitted from the section. It may be a value obtained by correcting with a signal amplification factor or the like. That is, the intensity of the excitation light in this description may be the power density of the excitation light that actually contributes to the excitation of the fluorescent substance, or a value obtained by correcting the power density with the amplification factor of the detection system. By considering the absorption rate and amplification factor, it is possible to appropriately correct the intensity of the excitation light that changes according to changes in the machine state and environment, enabling more accurate color separation. A concatenated fluorescence spectrum can be generated.
なお、各蛍光スペクトルに対する励起光の強度に基づいた補正値(強度補正値ともいう)は、複数の蛍光スペクトルそれぞれに対応する励起光の強度を揃えるための値に限定されず、種々変形されてよい。例えば、長波長側に強度ピークを持つ蛍光スペクトルのシグナル強度は、短波長側に強度ピークを蛍光スペクトルのシグナル強度よりも低い傾向にある。そのため、連結蛍光スペクトルに長波長側に強度ピークを持つ蛍光スペクトルと短波長側に強度ピークを持つ蛍光スペクトルとの両方が含まれる場合、長波長側に強度ピークを持つ蛍光スペクトルが殆加味されず、短波長側に強度ピークを持つ蛍光スペクトルだけが抽出されてしまう場合がある。そのような場合、例えば、長波長側に強度ピークを持つ蛍光スペクトルに対する強度補正値をより大きな値とすることで、短波長側に強度ピークを蛍光スペクトルの分離精度を高めることも可能である。
In addition, the correction value based on the intensity of the excitation light for each fluorescence spectrum (also referred to as the intensity correction value) is not limited to a value for matching the intensity of the excitation light corresponding to each of the plurality of fluorescence spectra, and can be variously modified. good. For example, the signal intensity of fluorescence spectra having intensity peaks on the long wavelength side tends to be lower than the signal intensity of fluorescence spectra having intensity peaks on the short wavelength side. Therefore, when the combined fluorescence spectrum includes both a fluorescence spectrum with an intensity peak on the long wavelength side and a fluorescence spectrum with an intensity peak on the short wavelength side, the fluorescence spectrum with an intensity peak on the long wavelength side is hardly taken into account. , only fluorescence spectra having intensity peaks on the short wavelength side may be extracted. In such a case, for example, by setting a larger intensity correction value for a fluorescence spectrum having an intensity peak on the long wavelength side, it is also possible to improve the separation accuracy of the fluorescence spectrum with an intensity peak on the short wavelength side.
(色分離部1321)
色分離部1321は、例えば、第1色分離部1321aと第2色分離部1321bとを備え、連結部1311から入力された染色切片(染色サンプルともいう)の連結蛍光スペクトルを分子毎に色分離する。 (Color separation unit 1321)
Thecolor separation unit 1321 includes, for example, a first color separation unit 1321a and a second color separation unit 1321b. do.
色分離部1321は、例えば、第1色分離部1321aと第2色分離部1321bとを備え、連結部1311から入力された染色切片(染色サンプルともいう)の連結蛍光スペクトルを分子毎に色分離する。 (Color separation unit 1321)
The
より具体的には、第1色分離部1321aは、連結部1311から入力された染色サンプルの連結蛍光スペクトルに対して、情報保存部121から入力された、試薬情報に含まれる連結蛍光参照スペクトルと標本情報に含まれる連結自家蛍光参照スペクトルとを用いた色分離処理を実行することで、連結蛍光スペクトルを分子ごとのスペクトルに分離する。なお、色分離処理には、例えば、最小二乗法(LSM)や重み付き最小二乗法(WLSM)、非負値行列因子分解(NMF)、グラム行列tAAを用いた非負値行列因子分解等が用いられてもよい。
More specifically, the first color separation unit 1321a separates the combined fluorescence spectrum of the stained sample input from the connection unit 1311 from the combined fluorescence reference spectrum included in the reagent information input from the information storage unit 121 into By executing color separation processing using the concatenated autofluorescence reference spectrum included in the specimen information, the concatenated fluorescence spectrum is separated into spectra for each molecule. For color separation processing, for example, least squares method (LSM), weighted least squares method (WLSM), nonnegative matrix factorization (NMF), nonnegative matrix factorization using Gram matrix tAA , and the like are used. may be
第2色分離部1321bは、連結部1311から入力された染色サンプルの連結蛍光スペクトルに対して、スペクトル抽出部1322から入力された調整後の連結自家蛍光参照スペクトルを用いた色分離処理を実行することで、連結蛍光スペクトルを分子ごとのスペクトルに分離する。なお、色分離処理には、第1色分離部1321aと同様に、例えば、最小二乗法(LSM)や重み付き最小二乗法(WLSM)、非負値行列因子分解(NMF)、グラム行列tAAを用いた非負値行列因子分解等が用いられてもよい。
The second color separation unit 1321b performs color separation processing on the combined fluorescence spectrum of the stained sample input from the connection unit 1311, using the adjusted combined autofluorescence reference spectrum input from the spectrum extraction unit 1322. This separates the concatenated fluorescence spectra into individual molecule spectra. For the color separation processing, similarly to the first color separation unit 1321a, for example, the least squares method (LSM), the weighted least squares method (WLSM), the non-negative matrix factorization (NMF), and the Gram matrix tAA . Non-negative matrix factorization, etc. may be used.
ここで、最小二乗法は、例えば、連結部1311によって生成された連結蛍光スペクトルを参照スペクトルにフィッティングすることで、混色率を算出するものである。また、重み付き最小二乗法においては、測定値である連結蛍光スペクトル(Signal)のノイズがポアソン分布になることを利用して、低いシグナルレベルの誤差を重視するように重みが付けられる。ただし、重み付き最小二乗法で加重が行われない上限値をOffset値とする。Offset値は測定に使用されるセンサの特性によって決まり、センサとして撮像素子が使用される場合には別途最適化が必要である。
Here, the method of least squares calculates the color mixture rate by, for example, fitting the connected fluorescence spectrum generated by the connecting unit 1311 to the reference spectrum. In addition, in the weighted least squares method, weighting is performed so as to give importance to low signal level errors, using the Poisson distribution of the noise of the concatenated fluorescence spectrum (Signal), which is the measured value. However, the offset value is the upper limit value at which weighting is not performed by the weighted least squares method. The offset value is determined by the characteristics of the sensor used for measurement, and requires separate optimization when an imaging device is used as the sensor.
(スペクトル抽出部1322)
スペクトル抽出部1322は、連結自家蛍光参照スペクトルをより精度の高い色分離結果を得ることができるように改良するための構成であり、情報保存部121から入力された標本情報に含まれる連結自家蛍光参照スペクトルを、色分離部1321による色分離結果に基づいて、より精度の高い色分離結果を得られるものに調整する。 (Spectrum extractor 1322)
Thespectrum extraction unit 1322 is a configuration for improving the concatenated autofluorescence reference spectrum so as to obtain more accurate color separation results. Based on the color separation result by the color separation unit 1321, the reference spectrum is adjusted so that a more accurate color separation result can be obtained.
スペクトル抽出部1322は、連結自家蛍光参照スペクトルをより精度の高い色分離結果を得ることができるように改良するための構成であり、情報保存部121から入力された標本情報に含まれる連結自家蛍光参照スペクトルを、色分離部1321による色分離結果に基づいて、より精度の高い色分離結果を得られるものに調整する。 (Spectrum extractor 1322)
The
スペクトル抽出部1322は、情報保存部121から入力された連結自家蛍光参照スペクトルに対して、第1色分離部1321aから入力された色分離結果を用いたスペクトル抽出処理を実行し、その結果に基づいて連結自家蛍光参照スペクトルを調整することで、連結自家蛍光参照スペクトルをより精度の高い色分離結果を得られるものに改良する。なお、スペクトル抽出処理には、例えば、非負値行列因子分解(NMF)や特異値分解(SVD)等が用いられてもよい。
The spectrum extraction unit 1322 performs spectrum extraction processing using the color separation result input from the first color separation unit 1321a on the concatenated autofluorescence reference spectrum input from the information storage unit 121, and based on the result The concatenated autofluorescence reference spectrum is adjusted by using the concatenated autofluorescence reference spectrum to improve the concatenated autofluorescence reference spectrum to yield more accurate color separation results. Note that, for example, non-negative matrix factorization (NMF), singular value decomposition (SVD), or the like may be used for the spectrum extraction process.
なお、図3では、連結自家蛍光参照スペクトルの調整を1回とした場合を例示したが、これに限定されず、第2色分離部1321bによる色分離結果をスペクトル抽出部1322に入力し、スペクトル抽出部1322において連結自家蛍光参照スペクトルの調整を再度実行する処理を1回以上繰り返した後に、最終的な色分離結果を取得するようにしてもよい。
Although FIG. 3 exemplifies the case where the connected autofluorescence reference spectrum is adjusted once, the present invention is not limited to this. The final color separation result may be acquired after repeating the process of readjusting the concatenated autofluorescence reference spectrum in the extraction unit 1322 one or more times.
上記のように、第1色分離部1321aや第2色分離部1321bは、波長方向に連結された参照スペクトル(連結自家蛍光参照スペクトル及び連結蛍光参照スペクトル)を用いて蛍光分離処理を行うことで、分離結果として一意のスペクトルを出力することができる(励起波長毎に分離結果が分かれない)。したがって、実施者は、より容易に正しいスペクトルを得ることができる。また、分離に用いられる自家蛍光に関する参照スペクトル(連結自家蛍光参照スペクトル)が自動的に取得され、蛍光分離処理が行われることにより、実施者が非染色切片の適切な空間から自家蛍光に相当するスペクトルを抽出しなくてもよくなる。
As described above, the first color separation unit 1321a and the second color separation unit 1321b perform fluorescence separation processing using reference spectra (connected autofluorescence reference spectrum and connected fluorescence reference spectrum) connected in the wavelength direction. , a unique spectrum can be output as a separation result (separation results are not separated for each excitation wavelength). Therefore, the practitioner can more easily obtain the correct spectrum. In addition, a reference spectrum (concatenated autofluorescence reference spectrum) related to autofluorescence used for separation is automatically acquired, and fluorescence separation processing is performed, so that the operator can detect autofluorescence from an appropriate space of the unstained section. It eliminates the need to extract spectra.
ここで、従来、上記のような色分離アルゴリズム(例えば、色分離精度など)を定量評価するため、実際に染色した画像では定量評価をする方法がなかった。この理由としては、「1.生体サンプルを実際に染色して撮影した画像だと、どこの場所に色素が染まったかが分からず、色素と自家蛍光を上手く分離できたかの判断ができない(正解が分からない)」、「2.FCM(フローサイトメトリー)で用いられる、色素のスペクトルや検出系の波長分解能特性をつかって色素の分離性の良いパネルを作成する系だと、色素の重なりあいや自家蛍光の影響が大きい場合に使うことができない」、「3.抗原発現率、抗体色素標識率、色素輝度、励起効率からパネルを決定する系だと、組織部位によって自家蛍光の特性が異なるため空間的な複合評価に使うことができない」、「4.上記二つの系では、測定自家蛍光のスペクトル形状、付与すべきレベル及び測定系のノイズレベルがパネル設計時に不明であり考慮できない」という理由がある。
Here, conventionally, in order to quantitatively evaluate the above color separation algorithm (for example, color separation accuracy, etc.), there was no method for quantitative evaluation using the actually stained image. The reasons for this are as follows: 1. With an image of a biological sample actually stained and photographed, it is not possible to determine where the dye has been stained, and it is not possible to determine whether the dye and autofluorescence have been successfully separated (the correct answer is not known). )”, “2. FCM (flow cytometry), which uses the spectrum of the dye and the wavelength resolution characteristics of the detection system to create a panel with good separation of the dye, the overlap of the dye and the autofluorescence 3. If the panel is determined based on the antigen expression rate, antibody dye labeling rate, dye brightness, and excitation efficiency, the characteristics of autofluorescence differ depending on the tissue site, so it cannot be used spatially. 4. In the above two systems, the spectral shape of the measured autofluorescence, the level to be imparted, and the noise level of the measurement system are unknown and cannot be considered at the time of panel design. .
そこで、色分離アルゴリズムなどの定量評価を行うためには、模擬画像を用いることが有効である。例えば、本実施形態では、撮影で取得した非染色画像の上に撮影パラメータに対応したノイズ特性を付与した色素スペクトルをタイル状に重畳して色素タイル画像(蛍光画像)を生成し、色素タイル画像及び非染色画像を合成し、実測を模擬した画像(模擬画像)を作成する。これにより、自家蛍光に対して色素輝度レベルが大きくない染色条件等も再現でき、色素と自家蛍光のある画素とを区別できる。その結果、色分離の精度を画素の平均と分散から信号分離値(Signal separation値)として定量的に求めることができる。この定量評価について、以下で詳しく説明する。
Therefore, it is effective to use simulated images for quantitative evaluation of color separation algorithms. For example, in the present embodiment, a dye tile image (fluorescence image) is generated by superimposing, in a tile shape, a dye spectrum to which noise characteristics corresponding to the imaging parameters are given on an unstained image obtained by imaging. And the non-stained image is synthesized to create an image simulating the actual measurement (simulated image). As a result, it is possible to reproduce staining conditions where the dye brightness level is not large with respect to the autofluorescence, and to distinguish between the dye and the pixels with autofluorescence. As a result, the accuracy of color separation can be quantitatively obtained as a signal separation value from the mean and variance of pixels. This quantitative evaluation will be described in detail below.
<1-4.定量評価に係る解析部の構成例>
本実施形態に係る定量評価に係る解析部131の構成例について図5及び図6を参照して説明する。図5は、本実施形態に係る解析部131の概略構成の一例を示す図である。図6は、本実施形態に係る模擬画像の生成を説明するための図である。 <1-4. Configuration example of analysis unit related to quantitative evaluation>
A configuration example of theanalysis unit 131 related to quantitative evaluation according to the present embodiment will be described with reference to FIGS. 5 and 6. FIG. FIG. 5 is a diagram showing an example of a schematic configuration of the analysis unit 131 according to this embodiment. FIG. 6 is a diagram for explaining generation of a simulated image according to this embodiment.
本実施形態に係る定量評価に係る解析部131の構成例について図5及び図6を参照して説明する。図5は、本実施形態に係る解析部131の概略構成の一例を示す図である。図6は、本実施形態に係る模擬画像の生成を説明するための図である。 <1-4. Configuration example of analysis unit related to quantitative evaluation>
A configuration example of the
図5に示すように、解析部131は、模擬画像生成部131aと、蛍光分離部131bと、評価部131cとを備える。蛍光分離部131bは、色分離部1321に相当する。
As shown in FIG. 5, the analysis unit 131 includes a simulated image generation unit 131a, a fluorescence separation unit 131b, and an evaluation unit 131c. The fluorescence separation section 131 b corresponds to the color separation section 1321 .
模擬画像生成部131aは、図6に示すように、自家蛍光成分を含む非染色画像(背景画像)と、色素タイル画像(蛍光画像)とを重畳し、模擬画像を生成する。色素タイル画像は、複数の色素タイルを有する色素タイル群である。この色素タイル画像は、例えば、蛍光色素(第一蛍光色素)の標準スペクトル(参照スペクトル)と、非染色画像の画素毎の撮像ノイズとが関連付けられた画像である。
As shown in FIG. 6, the simulated image generation unit 131a generates a simulated image by superimposing an unstained image (background image) containing an autofluorescent component and a dye tile image (fluorescent image). A dye tile image is a group of dye tiles having a plurality of dye tiles. This dye tile image is, for example, an image in which a standard spectrum (reference spectrum) of a fluorescent dye (first fluorescent dye) is associated with imaging noise for each pixel of an unstained image.
例えば、非染色画像の自家蛍光強度に対して付与する色素の強度は、抗原発現率、抗体標識率、色素励起効率、色素発光効率などから決定される。自家蛍光成分は、組織サンプルに内因される内因性ノイズである。内因性ノイズとしては、非染色画像の自家蛍光成分以外にも、例えば、非染色画像の他の蛍光色素(第二蛍光色素)の標準スペクトルも挙げられる。また、撮像ノイズは、例えば、非染色画像の撮像条件等に応じて変化するノイズである。この撮像ノイズの程度は画素毎に定量化また可視化されることになる。非染色画像の撮像条件は、例えば、レーザーパワーやゲイン、露光時間等を含む。
For example, the intensity of the dye applied to the autofluorescence intensity of the unstained image is determined from the antigen expression rate, antibody labeling rate, dye excitation efficiency, dye emission efficiency, and the like. The autofluorescence component is intrinsic noise inherent in tissue samples. Intrinsic noise includes, for example, the standard spectrum of another fluorescent dye (second fluorescent dye) in the unstained image, in addition to the autofluorescence component of the unstained image. Imaging noise is, for example, noise that changes according to the imaging conditions of the non-stained image. The degree of this imaging noise will be quantified and visualized for each pixel. Imaging conditions for non-stained images include, for example, laser power, gain, exposure time, and the like.
撮像ノイズ(測定系ノイズ)としては、例えば、「1.自家蛍光による不要信号ノイズ」、「2.COMS等のセンサ回路起因のランダムノイズ(例えば、読出しノイズや暗電流ノイズ等)」、「3.検出電荷量の平方根に応じて増えるショットノイズ(ランダム)」等が挙げられる。撮像ノイズを模擬するため、標準スペクトル(タイル画像)に関連付ける、すなわち付与するノイズは、主に上記3のショットノイズである。これは、上記1及び2は背景の非染色画像(自家蛍光画像)に含まれるためである。タイルと背景を重畳することで、模擬したい撮像ノイズ(測定系ノイズ)の上記1~3すべてを表現することが可能である。上記3で付与すべきショットノイズ量は、タイルに付与する色素信号の光子数(または電荷量)から決めることが可能である。例えば、本実施形態では、背景の非染色画像の電荷量を計算し、その値から色素の電荷量を決めて、さらにショットノイズ量を決める。なお、ショットノイズは、フォトンノイズとも呼ばれ、センサに到達する光子量が一定値を取ることがなく物理的に揺らぐことに起因するものである。このショットノイズは、測定系の回路をいくら改善してもなくらならないものである。
Imaging noise (measurement system noise) includes, for example, “1. unwanted signal noise due to autofluorescence”, “2. .Shot noise (random) that increases in accordance with the square root of the detected charge amount. In order to simulate imaging noise, the noise associated with, that is, given to the standard spectrum (tile image) is mainly the shot noise of 3 above. This is because 1 and 2 above are included in the background unstained image (autofluorescent image). By superimposing the tiles and the background, it is possible to express all of the above 1 to 3 of the imaging noise (measurement system noise) to be simulated. The amount of shot noise to be imparted in 3 above can be determined from the number of photons (or the amount of charge) of the dye signal imparted to the tile. For example, in the present embodiment, the charge amount of the background unstained image is calculated, the dye charge amount is determined from the calculated value, and the shot noise amount is further determined. Shot noise, also called photon noise, is caused by physical fluctuations of the amount of photons that reach the sensor without taking a constant value. This shot noise cannot be eliminated no matter how much the circuit of the measurement system is improved.
ここで、図6の例では、色素タイルは、10×10画素(表示用の画素)分で構成されている(約0.3μm/pixel)。これは非染色画像を撮影倍率20倍で撮った場合であり、倍率を変えた場合、細胞サイズに合わせて色素タイルの大きさを変更する必要がある。一つの色素タイルのサイズ(大きさ)は細胞のサイズに相当し、色素タイル画像の画素数は細胞サイズの画素数に相当する。画素の最小単位は細胞のサイズに等しい。色素タイル画像は、色素が異なる複数種の色素タイル、すなわち、複数の蛍光色素毎の標準スペクトルを含む。なお、一つの色素タイルに一つの色素ではなく、一つの色素タイルに複数の色素を混ぜることで、二重染色条件や三重染色条件での色分離性能を評価することも可能である。
Here, in the example of FIG. 6, the pigment tile is composed of 10×10 pixels (pixels for display) (approximately 0.3 μm/pixel). This is a case where an unstained image is taken at a magnification of 20 times, and when the magnification is changed, it is necessary to change the size of the dye tile according to the cell size. The size (size) of one pigment tile corresponds to the size of a cell, and the number of pixels in the pigment tile image corresponds to the number of pixels in the cell size. The smallest pixel unit is equal to the cell size. A dye tile image includes a plurality of types of dye tiles with different dyes, that is, standard spectra for each of a plurality of fluorescent dyes. It is also possible to evaluate the color separation performance under double dyeing conditions or triple dyeing conditions by mixing a plurality of dyes in one dye tile instead of one dye in one dye tile.
図6の例では、9色の色素(色素タイル)が用いられている。9色の色素タイルの配色パターンは、同色の色素タイルが斜めストライプ状に並ぶパターンであるが、これに限られるものではない。例えば、各色素タイルの配色パターンは、同色の色素タイルが縦ストライプ状や横ストライプ状、市松模様状などに並ぶパターンであってもよく、どの色素タイルがどの個所にあるのかを規定する所定の配色パターンであればよい。
In the example of FIG. 6, nine colors of dyes (pigment tiles) are used. The coloration pattern of the pigment tiles of nine colors is a pattern in which pigment tiles of the same color are arranged in diagonal stripes, but is not limited to this. For example, the coloration pattern of each pigment tile may be a pattern in which pigment tiles of the same color are arranged in a vertical stripe pattern, a horizontal stripe pattern, a checkered pattern, or the like. Any color pattern may be used.
具体的には、模擬画像生成部131aは、非染色画像(未染色組織画像)と撮影パラメータを入力パラメータとして取得する。撮像パラメータは、撮像条件の一例であり、例えば、レーザーパワーやゲイン、露光時間等を含む。模擬画像生成部131aは、撮影パラメータに対応したノイズ特性を色素スペクトルに加えて色素タイルを生成し、ユーザが染色したい色素数分の色素タイルを繰り返し配置して、色素タイル画像をデータセットして生成する。
Specifically, the simulated image generation unit 131a acquires an unstained image (unstained tissue image) and imaging parameters as input parameters. Imaging parameters are an example of imaging conditions, and include, for example, laser power, gain, exposure time, and the like. The simulated image generation unit 131a generates dye tiles by adding noise characteristics corresponding to imaging parameters to the dye spectrum, repeatedly arranges the dye tiles for the number of dyes that the user wants to dye, and sets dye tile images as data. Generate.
蛍光分離部131bは、模擬画像生成部131aにより生成された模擬画像に基づいて、第一蛍光色素の成分と自家蛍光成分を分離し、分離画像を生成する。この蛍光分離部131bは、模擬画像(データセット)に対して色分離計算を行い、分離画像を生成する。なお、蛍光分離部131bは、色分離部1321であり、色分離部1321と同様の処理を行う。色分離の手法は、例えば、LSMやNMF等を含む。
The fluorescence separating unit 131b separates the component of the first fluorescent dye and the autofluorescent component based on the simulated image generated by the simulated image generating unit 131a to generate a separated image. The fluorescence separator 131b performs color separation calculation on the simulated image (data set) to generate a separated image. Note that the fluorescence separation unit 131b is the color separation unit 1321 and performs the same processing as the color separation unit 1321 does. Color separation methods include, for example, LSM and NMF.
評価部131cは、蛍光分離部131bにより生成された分離画像の分離の程度を評価する。この評価部131cは、色分離計算結果の平均と分散から分離画像の分離の程度(パネルの良否)を判定する。例えば、評価部131cは、分離画像からヒストグラムを生成し、そのヒストグラムから色素と色素以外との信号分離値(Signal Separation値)を算出し、信号分離値に基づいて分離の程度を評価する。一例として、評価部131cは、色分離した陽性と陰性のピクセルをヒストグラムで表し、色分離精度の計算結果の数値である信号分離値を示すグラフを生成する。
The evaluation unit 131c evaluates the degree of separation of the separated images generated by the fluorescence separation unit 131b. The evaluation unit 131c determines the degree of separation of the separated images (the quality of the panel) from the average and variance of the color separation calculation results. For example, the evaluation unit 131c generates a histogram from the separated image, calculates a signal separation value between pigment and non-pigment from the histogram, and evaluates the degree of separation based on the signal separation value. As an example, the evaluation unit 131c expresses the color-separated positive and negative pixels in a histogram, and generates a graph showing the signal separation value, which is the numerical value of the calculation result of the color separation accuracy.
表示部140は、評価部131cの評価結果(例えば、色素ごとの信号分離値)を示す情報や画像を表示する。例えば、表示部140は、評価部131cにより生成された色素ごとの信号分離値を示すグラフや図などを表示する。これにより、ユーザは評価部131cの評価結果を把握することができる。
The display unit 140 displays information and images indicating the evaluation results of the evaluation unit 131c (for example, the signal separation value for each dye). For example, the display unit 140 displays a graph, diagram, or the like showing the signal separation value for each dye generated by the evaluation unit 131c. Thereby, the user can grasp the evaluation result of the evaluation unit 131c.
<1-5.模擬画像作成の処理例>
本実施形態に係る模擬画像作成の処理例について図7及び図8を参照して説明する。図7は、本実施形態に係る模擬画像生成処理の流れの一例を示すフローチャートである。図8は、本実施形態に係るショットノイズ重畳処理を説明するための図である。 <1-5. Processing example of simulated image creation>
A processing example of creating a simulated image according to the present embodiment will be described with reference to FIGS. 7 and 8. FIG. FIG. 7 is a flowchart showing an example of the flow of simulated image generation processing according to this embodiment. FIG. 8 is a diagram for explaining shot noise superimposition processing according to the present embodiment.
図7に示すように、ステップS11において、ユーザが染色したい抗体及び色素の組み合わせを選定する。ステップS12において、模擬画像生成部131aは、付与する色素のスペクトル強度を、重畳する非染色画像の自家蛍光強度から決定する。ステップS13において、模擬画像生成部131aは、1画素ごとに撮影測定時のノイズレベルを考慮したノイズ(撮像ノイズ)を付与しながら、色素タイルを繰り返し配置し、蛍光画像(色素タイル画像)を作成する。模擬画像生成部131aは、作成した蛍光画像を非染色画像に重畳する。これにより、模擬画像が完成する。
As shown in FIG. 7, in step S11, the user selects a combination of antibodies and dyes that the user wants to stain. In step S12, the simulated image generator 131a determines the spectral intensity of the dye to be applied from the autofluorescence intensity of the unstained image to be superimposed. In step S13, the simulated image generation unit 131a creates a fluorescent image (dye tile image) by repeatedly arranging the dye tiles while adding noise (imaging noise) considering the noise level at the time of imaging and measurement to each pixel. do. The simulated image generator 131a superimposes the created fluorescence image on the unstained image. This completes the simulated image.
詳細には、上記のステップS12では、非染色画像(背景画像)の自家蛍光強度に対して付与する色素のスペクトル強度が決定される。例えば、非染色画像の自家蛍光強度に対して付与する色素スペクトルの輝度は、以下(a)から(c)の流れで決定される。
Specifically, in step S12 above, the spectral intensity of the dye to be applied to the autofluorescence intensity of the non-stained image (background image) is determined. For example, the brightness of the dye spectrum given to the autofluorescence intensity of the non-stained image is determined by the flow of (a) to (c) below.
(a)色素のピーク位置強度の算出
模擬画像生成部131aは、各色素スペクトルのピーク位置16nm分(最大値から2チャネル分)の強度を取得し、値を積算する。 (a) Calculation of Peak Position Intensity of Dye Thesimulated image generator 131a acquires the intensity of the peak position of 16 nm (two channels from the maximum value) of each dye spectrum, and integrates the values.
模擬画像生成部131aは、各色素スペクトルのピーク位置16nm分(最大値から2チャネル分)の強度を取得し、値を積算する。 (a) Calculation of Peak Position Intensity of Dye The
(b)自家蛍光のピーク位置強度
模擬画像生成部131aは、背景画像の自家蛍光強度を取得する。例えば、模擬画像生成部131aは、各色素のピーク位置の2チャネル分に対応する背景画像のスペクトル強度を積算する。このとき、背景画像の波長チャネルのスペクトル強度は全画素の平均値である。 (b) Peak Position Intensity of Autofluorescence Thesimulated image generator 131a acquires the autofluorescence intensity of the background image. For example, the simulated image generator 131a integrates spectral intensities of background images corresponding to two channels of peak positions of each dye. At this time, the spectral intensity of the wavelength channel of the background image is the average value of all pixels.
模擬画像生成部131aは、背景画像の自家蛍光強度を取得する。例えば、模擬画像生成部131aは、各色素のピーク位置の2チャネル分に対応する背景画像のスペクトル強度を積算する。このとき、背景画像の波長チャネルのスペクトル強度は全画素の平均値である。 (b) Peak Position Intensity of Autofluorescence The
(c)自家蛍光強度に対して付与する色素強度の決定
模擬画像生成部131aは、背景画像の自家蛍光強度に対して抗原発現率や抗体標識率、色素励起効率、色素発光効率などから付与する色素強度を決定する。模擬画像生成部131aは、設定した色素強度になるように、上記(a)と(b)で求めたスペクトル強度から色素スペクトルの倍率を求めて調整する。なお、下記の式(1)から倍率が求められる。式(1)は、自家蛍光に対する色素強度の求め方に係る式である。 (c) Determination of Dye Intensity Given to Autofluorescence Intensity The simulatedimage generation unit 131a gives the autofluorescence intensity of the background image from the antigen expression rate, the antibody labeling rate, the dye excitation efficiency, the dye emission efficiency, and the like. Determine dye intensity. The simulated image generator 131a obtains and adjusts the magnification of the dye spectrum from the spectrum intensities obtained in (a) and (b) above so as to obtain the set dye intensity. Note that the magnification is obtained from the following formula (1). Formula (1) is a formula relating to how to determine the dye intensity for the autofluorescence.
模擬画像生成部131aは、背景画像の自家蛍光強度に対して抗原発現率や抗体標識率、色素励起効率、色素発光効率などから付与する色素強度を決定する。模擬画像生成部131aは、設定した色素強度になるように、上記(a)と(b)で求めたスペクトル強度から色素スペクトルの倍率を求めて調整する。なお、下記の式(1)から倍率が求められる。式(1)は、自家蛍光に対する色素強度の求め方に係る式である。 (c) Determination of Dye Intensity Given to Autofluorescence Intensity The simulated

また、上記のステップS13では、撮影パラメータに対応したノイズ重畳が行われる。例えば、記録デバイスであるCMOSのノイズ特性は露光時間に比例して大きくなる暗電流と読出しノイズ、信号強度の平方根に比例するショットノイズから構成される。本評価系において、暗電流ノイズと読出しノイズ成分は実測の非染色画像にすでに含まれるので、重畳する色素スペクトルにはショットノイズ成分のみ付与すればよい。ショットノイズ重畳は、以下(a)から(d)の流れで行われる。
Also, in the above step S13, noise superimposition corresponding to the imaging parameters is performed. For example, the noise characteristics of a CMOS, which is a recording device, consist of dark current and readout noise that increase in proportion to the exposure time, and shot noise that is proportional to the square root of the signal intensity. In this evaluation system, dark current noise and readout noise components are already included in the unstained image actually measured, so only the shot noise component needs to be added to the dye spectrum to be superimposed. Shot noise superimposition is performed in the following flow from (a) to (d).
(a)模擬画像生成部131aは、色素スペクトルを波長校正データ(カメラ出力値から分光放射輝度への変換係数)で除算し、AD値に戻す。
(a) The simulated image generation unit 131a divides the dye spectrum by the wavelength calibration data (the conversion coefficient from the camera output value to the spectral radiance) to restore the AD value.
(b)模擬画像生成部131aは、背景画像撮影時のゲイン、ピクセル飽和電荷量からAD値を電荷量e-に換算する。
(b) The simulated image generation unit 131a converts the AD value into the charge amount e − from the gain and the pixel saturation charge amount when the background image is captured.

式(2)は、電荷量変換式である。F(λ):色素の標準スペクトル、Cor(λ):波長校正データ、H:変換係数、E(λ):電荷量である。
Formula (2) is a charge amount conversion formula. F(λ): standard spectrum of dye, Cor(λ): wavelength calibration data, H: conversion coefficient, E(λ): charge amount.
(c)模擬画像生成部131aは、σ=S1/2(S:ピクセルあたりの電荷量e-)のランダムノイズをショットノイズとして重畳する。
(c) The simulated image generator 131a superimposes random noise of σ=S 1/2 (S: charge amount e − per pixel) as shot noise.

式(3)は、ショットノイズ重畳式である。newE(λ):ショットノイズを重畳した色素の標準スペクトル、Nrand:σ=1の正規乱数、S:ピクセルあたりの電荷量e-である。
Equation (3) is a shot noise superposition equation. newE(λ): standard spectrum of a dye superimposed with shot noise, Nrand: normal random number with σ=1, S: charge amount per pixel e − .
(d)模擬画像生成部131aは、上記(c)でショットノイズを重畳した後、(a)~(b)と逆の流れで色素スペクトルを分光放射輝度に戻す。
(d) After superimposing shot noise in (c) above, the simulated image generation unit 131a restores the pigment spectrum to spectral radiance in the reverse flow of (a) to (b).
図8は、上記の(a)~(d)の流れを示す。上記の(a)~(d)の流れで作成した色素スペクトルが画像の1画素分に相当するため、10×10画素の色素タイルとして繰り返し配置され、蛍光画像(色素タイル画像)が作成される。
FIG. 8 shows the flow of (a) to (d) above. Since the dye spectrum created in the flow of (a) to (d) above corresponds to one pixel of the image, it is repeatedly arranged as a dye tile of 10 × 10 pixels to create a fluorescence image (dye tile image). .
<1-6.定量評価の処理例>
本実施形態に係る定量評価の処理例について図9から図11を参照して説明する。図9は、本実施形態に係る定量評価処理の流れの一例を示すフローチャートである。図10は、本実施形態に係る分離画像及びヒストグラムの一例を示す図である。図11は、本実施形態に係るヒストグラムに基づく信号分離値の算出を説明するための図である。 <1-6. Processing example of quantitative evaluation>
An example of quantitative evaluation processing according to the present embodiment will be described with reference to FIGS. 9 to 11. FIG. FIG. 9 is a flowchart showing an example of the flow of quantitative evaluation processing according to this embodiment. FIG. 10 is a diagram showing an example of separated images and histograms according to this embodiment. FIG. 11 is a diagram for explaining calculation of a signal separation value based on a histogram according to this embodiment.
図9に示すように、ステップS21において、蛍光分離部131bは模擬画像を受領する。ステップS22において、蛍光分離部131bは模擬画像に対して色分離計算を実行する。ステップS23において、評価部131cは分離画像からヒストグラムを作成する。ステップS24において、評価部131cは、信号分離値(Signal separation値)を算出する。
As shown in FIG. 9, in step S21, the fluorescence separator 131b receives the simulated image. In step S22, the fluorescence separator 131b performs color separation calculation on the simulated image. In step S23, the evaluation unit 131c creates a histogram from the separated images. In step S24, the evaluation unit 131c calculates a signal separation value.
詳細には、上記のステップS22では、蛍光分離部131bは、使用した色素スペクトルのセットと自家蛍光スペクトルのセットを入力値として評価したい色分離アルゴリズム(例えば、LSMやNMF等)で色分離を実施する。
Specifically, in step S22 described above, the fluorescence separation unit 131b performs color separation using a color separation algorithm (for example, LSM, NMF, etc.) to be evaluated using the dye spectrum set and the autofluorescence spectrum set used as input values. do.
また、上記のステップS23では、評価部131cは、色分離計算後、色素毎に、図10に示すように、分離画像からヒストグラムを生成する。
Also, in step S23 above, after the color separation calculation, the evaluation unit 131c generates a histogram from the separated image for each dye, as shown in FIG.
また、上記のステップS24では、評価部131cは、一つの細胞に相当する10×10pixel、1タイルの平均値輝度を1つの信号ととらえ、図11に示すように、全タイルの輝度の平均値μ、標準偏差σから、信号分離値を算出する。例えば、信号分離値が、検出限界値である3.29σ=1.645を超えれば、色分解性能(例えば、色分解精度)が十分である。
In step S24 above, the evaluation unit 131c regards the average brightness of 10×10 pixels corresponding to one cell and one tile as one signal, and calculates the average brightness of all tiles as shown in FIG. A signal separation value is calculated from μ and standard deviation σ. For example, if the signal separation value exceeds the detection limit value of 3.29σ=1.645, the color separation performance (for example, color separation accuracy) is sufficient.
式(4)は、信号分離値(Signal separation値)の算出式である。μ_0:評価する色素以外のタイルの平均値、μ_1:評価する色素のタイルの平均値、σ_1:評価する色素のタイルの標準偏差、σ_2:評価する色素以外のタイルの標準偏差である(図11参照)。
Formula (4) is a formula for calculating a signal separation value. μ_0: average value of tiles other than dye to be evaluated, μ_1: average value of tiles of dye to be evaluated, σ_1: standard deviation of tiles of dye to be evaluated, σ_2: standard deviation of tiles other than dye to be evaluated (Fig. 11 reference).
<1-7.分離画像の画像例>
本実施形態に係る分離画像の画像例について図12から図14を参照して説明する。図12から14は、それぞれ本実施形態に係る分離画像の一例を示す図である。 <1-7. Image example of separated image>
Image examples of separated images according to the present embodiment will be described with reference to FIGS. 12 to 14 . 12 to 14 are diagrams each showing an example of a separated image according to this embodiment.
図12は分離画像の良い例であり、図13は分離画像の悪い例1(自家蛍光漏れ込み)であり、図14は分離画像の悪い例2(自家蛍光漏れ込み)である。これらの画像は、必要に応じて、表示部140により表示される。この表示の有無は、操作部160に対するユーザの入力操作によって選択可能であってもよい。
FIG. 12 is a good example of the separated image, FIG. 13 is a bad example 1 of the separated image (autofluorescence leakage), and FIG. 14 is a bad example 2 of the separated image (autofluorescence leakage). These images are displayed by the display unit 140 as needed. The presence or absence of this display may be selectable by the user's input operation on the operation unit 160 .
図12に示すように、分離画像において自家蛍光漏れ込みがない。図12の例では、部分拡大図が示されているが、この部分拡大図でも自家蛍光漏れ込みがない。一方、図13に示すように、分離画像において自家蛍光漏れ込みがある。図13の例では、自家蛍光漏れ込みがある箇所の部分拡大図が示されているが、強い自家蛍光漏れ込みがある。また、図13と同様、図14に示すように、分離画像において自家蛍光漏れ込みがある。図14の例では、図13と同様、自家蛍光漏れ込みがある箇所の部分拡大図が示されているが、強い自家蛍光漏れ込みがある。
As shown in FIG. 12, there is no autofluorescence leakage in the separated images. In the example of FIG. 12, a partially enlarged view is shown, but even in this partially enlarged view there is no leakage of autofluorescence. On the other hand, as shown in FIG. 13, there is autofluorescence leakage in the separated images. In the example of FIG. 13, a partially enlarged view of a portion with autofluorescence leakage is shown, and there is strong autofluorescence leakage. Also, as in FIG. 13, as shown in FIG. 14, there is autofluorescence leakage in the separated images. In the example of FIG. 14, similar to FIG. 13, a partially enlarged view of the portion where autofluorescence leaks in is shown, but there is strong autofluorescence leak.
<1-8.評価結果画像の画像例>
本実施形態に係る評価結果画像の画像例について図15及び図16を参照して説明する。図15は、本実施形態に係る色素ごとの信号分離値を示す棒グラフである。図16は、本実施形態に係る色素ごとの信号分離値を示す散布図である。 <1-8. Image example of evaluation result image>
An image example of the evaluation result image according to the present embodiment will be described with reference to FIGS. 15 and 16. FIG. FIG. 15 is a bar graph showing signal separation values for each dye according to this embodiment. FIG. 16 is a scatter diagram showing signal separation values for each dye according to this embodiment.
図15に示すように、色素ごとの信号分離値を示す棒グラフが表示部140により表示される。また、図16に示すように、色素ごとの信号分離値を示す散布図が表示部140により表示される。この散布図は、励起が近い色素同士の漏れ込みを示す散布図である。これらの棒フラグや分散図は、評価部131cにより生成されて表示部140に出力される。棒グラフや分散図は、評価部131cの評価結果を示す画像であり、あくまでも一例である。この表示の有無や表示態様(例えば、棒グラフや分散図等の表示態様)は、操作部160に対するユーザの入力操作によって選択可能であってもよい。
As shown in FIG. 15, the display unit 140 displays a bar graph showing the signal separation value for each dye. Further, as shown in FIG. 16, the display unit 140 displays a scatter diagram showing the signal separation value for each dye. This scatter diagram is a scatter diagram showing leakage between dyes having similar excitations. These bar flags and scatter diagrams are generated by the evaluation unit 131 c and output to the display unit 140 . The bar graph and the scatter diagram are images showing the evaluation result of the evaluation unit 131c, and are only examples. The presence or absence of this display and the display mode (for example, the display mode of a bar graph, a scatter diagram, etc.) may be selectable by a user's input operation on the operation unit 160 .
以上、本実施形態に係る情報処理システムによれば、ゲインや露光時間などの撮影パラメータに対応するノイズ特性を画素毎の色素スペクトルに重畳する工夫を施しながら、染色したい色素数分、細胞の大きさに相応する画素数の色素タイルを繰り返し配置し、非染色画像に重畳することで実測を模擬した染色画像(模擬画像)を作成する。これにより、測定自家蛍光のスペクトル形状やノイズレベルの特性を反映することが可能となるので、あらゆる撮影条件において模擬画像を作成することができる。
As described above, according to the information processing system according to the present embodiment, while devising to superimpose the noise characteristics corresponding to the imaging parameters such as the gain and the exposure time on the dye spectrum of each pixel, the cell size is increased by the number of dyes to be stained. A stained image (simulated image) simulating the actual measurement is created by repeatedly arranging the dye tiles of the number corresponding to the number of pixels and superimposing them on the unstained image. This makes it possible to reflect the characteristics of the spectrum shape and noise level of the measured autofluorescence, so that a simulated image can be created under all imaging conditions.
また、色素タイルを繰り返し配置した模擬画像を作成することにより、色素を重畳した画素と自家蛍光を含むそれ以外の画素を区別できるようになるので、色分離の精度をそれぞれの画素の平均と標準偏差から信号分離値(Signal separation値)として定量的に算出することができる。加えて、抗原発現率、抗体標識率、色素励起効率、色素発光効率などから非染色画像の自家蛍光スペクトルに対して付与する色素強度を設定することができるため、あらゆる染色条件でも色分離精度を評価することが可能である。
In addition, by creating a simulated image in which the dye tiles are repeatedly arranged, it becomes possible to distinguish between the pixels superimposed with the dye and the other pixels containing autofluorescence. It can be quantitatively calculated as a signal separation value from the deviation. In addition, since the intensity of the dye applied to the autofluorescence spectrum of the unstained image can be set from the antigen expression rate, antibody labeling rate, dye excitation efficiency, dye emission efficiency, etc., color separation accuracy can be achieved under any staining conditions. It is possible to evaluate
つまり、模擬画像生成部131aは、撮影で取得した非染色画像の上に撮影パラメータに対応したノイズ特性を付与した色素スペクトルをタイル状に重畳して色素タイル画像を生成し、色素タイル画像及び非染色画像を合成し、実測を模擬した画像(模擬画像)を作成する。これにより、自家蛍光に対して色素輝度レベルが大きくない染色条件等も再現でき、色素と自家蛍光のある画素とを区別できる。その結果、色分離の精度を画素の平均と分散から信号分離値(Signal separation値)として定量的に求めることができる。
That is, the simulated image generating unit 131a generates a dye tile image by superimposing, in a tile shape, a dye spectrum to which noise characteristics corresponding to the imaging parameters are given on an unstained image obtained by imaging, and generates a dye tile image and a non-stained image. An image (simulated image) that simulates the actual measurement is created by synthesizing the stained images. As a result, it is possible to reproduce staining conditions where the dye brightness level is not large with respect to the autofluorescence, and to distinguish between the dye and the pixels with autofluorescence. As a result, the accuracy of color separation can be quantitatively obtained as a signal separation value from the mean and variance of pixels.
例えば、色分離アルゴリズムの精度について、分散と平均から求めた信号分離値という数値として定量的に求めることが可能になる。また、色素同士の組み合わせや色素と試薬の組み合わせの評価についても、数値として定量的に求めることができる。また、異なる自家蛍光スペクトルをもつ組織部位(異なる組織)でも定量評価ができ、複合的な評価も可能となる。
For example, it is possible to quantitatively determine the accuracy of the color separation algorithm as a numerical value called the signal separation value obtained from the variance and average. In addition, evaluation of combinations of dyes and combinations of dyes and reagents can also be obtained quantitatively as numerical values. In addition, quantitative evaluation can be performed on tissue sites (different tissues) having different autofluorescence spectra, and composite evaluation is also possible.
通常、色分離アルゴリズムの精度を目視による定性評価であるが、本実施形態によれば、最適な色分離アルゴリズムを選定するために定量評価を行うことができる。また、上記1~4で述べた課題があるが、あらゆる染色条件でも色分離の精度を定量評価することができる。また、複合的な評価が可能となるので、より最適なパネル設計をすることができる。さらに、色素の重なり合いや自家蛍光の影響が大きい場合でも評価を行うことができる。また、組織部位によって自家蛍光の特性が異なるが、空間的な複合評価を行うこともできる。測定系のノイズレベルも考慮した上でパネル設計のシミュレーションを行うことができる。
Normally, the accuracy of a color separation algorithm is visually evaluated qualitatively, but according to this embodiment, a quantitative evaluation can be performed to select the optimum color separation algorithm. In addition, although there are the problems described in 1 to 4 above, the accuracy of color separation can be quantitatively evaluated under any staining conditions. Moreover, since composite evaluation is possible, it is possible to design a more optimal panel. Furthermore, evaluation can be performed even when the influence of overlap of dyes and autofluorescence is large. In addition, although the autofluorescence characteristics differ depending on the tissue site, spatial composite evaluation can also be performed. The panel design can be simulated while considering the noise level of the measurement system.
例えば、重畳する非染色画像をDAPI(4',6-Diamidino-2-phenylindole,dihydrochloride)染色のみにすれば、ユーザが選択した色素+DAPIでのシミュレーションが可能になる。また、DAPIの漏れ込み等も考慮した上で、色分離アルゴリズムの評価やパネル設計ができる。
For example, if the non-stained image to be superimposed is dyed only with DAPI (4',6-Diamidino-2-phenylindole, dihydrochloride), it becomes possible to simulate with the dye + DAPI selected by the user. In addition, the color separation algorithm can be evaluated and the panel can be designed, taking DAPI leakage into consideration.
<1-9.適用例>
本開示に係る技術は、例えば、蛍光観察装置500(顕微鏡システムの一例)等に適用され得る。以下、図17及び図18を参照して、適用され得る蛍光観察装置500の構成例について説明する。図17は、本実施形態に係る蛍光観察装置500の概略構成の一例を示す図である。図18は、本実施形態に係る観察ユニット1の概略構成の一例を示す図である。 <1-9. Application example>
The technology according to the present disclosure can be applied, for example, to a fluorescence observation device 500 (an example of a microscope system). A configuration example of an applicablefluorescence observation apparatus 500 will be described below with reference to FIGS. 17 and 18. FIG. FIG. 17 is a diagram showing an example of a schematic configuration of a fluoroscopy apparatus 500 according to this embodiment. FIG. 18 is a diagram showing an example of a schematic configuration of the observation unit 1 according to this embodiment.
本開示に係る技術は、例えば、蛍光観察装置500(顕微鏡システムの一例)等に適用され得る。以下、図17及び図18を参照して、適用され得る蛍光観察装置500の構成例について説明する。図17は、本実施形態に係る蛍光観察装置500の概略構成の一例を示す図である。図18は、本実施形態に係る観察ユニット1の概略構成の一例を示す図である。 <1-9. Application example>
The technology according to the present disclosure can be applied, for example, to a fluorescence observation device 500 (an example of a microscope system). A configuration example of an applicable
図17に示すように、蛍光観察装置500は、観察ユニット1と、処理ユニット2と、表示部3とを有する。
As shown in FIG. 17, the fluorescence observation device 500 has an observation unit 1, a processing unit 2, and a display section 3.
観察ユニット1は、励起部(照射部)10と、ステージ20と、分光イメージング部30と、観察光学系40と、走査機構50と、フォーカス機構60と、非蛍光観察部70とを含む。
The observation unit 1 includes an excitation section (irradiation section) 10, a stage 20, a spectral imaging section 30, an observation optical system 40, a scanning mechanism 50, a focus mechanism 60, and a non-fluorescent observation section 70.
励起部10は、波長が異なる複数の照射光を観察対象物に照射する。励起部10は、例えば、異軸平行に配置された波長の異なる複数のライン照明を観察対象物である病理標本(病理サンプル)に照射する。ステージ20は、病理標本を支持する台であって、走査機構50により、ライン照明によるライン光の方向に対して垂直方向に移動可能に構成されている。分光イメージング部30は、分光器を含み、ライン照明によりライン状に励起された病理標本の蛍光スペクトル(分光データ)を取得する。
The excitation unit 10 irradiates the observation object with a plurality of irradiation lights with different wavelengths. For example, the excitation unit 10 irradiates a pathological specimen (pathological sample), which is an object to be observed, with a plurality of line illuminations with different wavelengths arranged in parallel with different axes. The stage 20 is a table for supporting a pathological specimen, and is configured to be movable by the scanning mechanism 50 in a direction perpendicular to the direction of line light from the line illumination. The spectroscopic imaging unit 30 includes a spectroscope, and obtains a fluorescence spectrum (spectral data) of a pathological specimen linearly excited by line illumination.
すなわち、観察ユニット1は、ライン照明に応じた分光データを取得するライン分光器として機能する。また、観察ユニット1は、複数の蛍光波長それぞれについて撮像対象(病理標本)により生成された複数の蛍光画像をライン毎に撮像し、撮像した複数の蛍光画像のデータをラインの並び順で取得する撮像装置としても機能する。
That is, the observation unit 1 functions as a line spectroscope that acquires spectral data according to line illumination. In addition, the observation unit 1 captures, for each line, a plurality of fluorescence images generated by an imaging target (pathological specimen) for each of a plurality of fluorescence wavelengths, and acquires data of the captured plurality of fluorescence images in the order of the lines. It also functions as an imaging device.
ここで、異軸平行とは、複数のライン照明が異軸かつ平行であることをいう。異軸とは、同軸上に無いことをいい、軸間の距離は特に限定されない。平行とは、厳密な意味での平行に限られず、ほぼ平行である状態も含む。例えば、レンズ等の光学系由来のディストーションや製造公差による平行状態からの逸脱があってもよく、この場合も平行とみなす。
Here, "different axes parallel" means that the multiple line illuminations are different axes and parallel. A different axis means not coaxial, and the distance between the axes is not particularly limited. Parallel is not limited to being parallel in a strict sense, but also includes a state of being substantially parallel. For example, there may be distortion derived from an optical system such as a lens, or deviation from a parallel state due to manufacturing tolerances, and such cases are also regarded as parallel.
励起部10と分光イメージング部30は、ステージ20に対し、観察光学系40を介して接続されている。観察光学系40は、フォーカス機構60によって最適な焦点に追従する機能を有している。観察光学系40には、暗視野観察、明視野観察などを行うための非蛍光観察部70が接続されてもよい。また、観察ユニット1には、励起部10、分光イメージング部30、走査機構50、フォーカス機構60、非蛍光観察部70などを制御する制御部80が接続されてもよい。
The excitation unit 10 and the spectral imaging unit 30 are connected to the stage 20 via an observation optical system 40. The observation optical system 40 has a function of following the optimum focus by the focus mechanism 60 . The observation optical system 40 may be connected to a non-fluorescent observation section 70 for performing dark-field observation, bright-field observation, and the like. Further, the observation unit 1 may be connected with a control section 80 that controls the excitation section 10, the spectral imaging section 30, the scanning mechanism 50, the focusing mechanism 60, the non-fluorescent observation section 70, and the like.
処理ユニット2は、記憶部21と、データ校正部22と、画像形成部23とを含む。この処理ユニット2は、観察ユニット1によって取得された病理標本(以下、サンプルSともいう。)の蛍光スペクトルに基づいて、典型的には、病理標本の画像を形成し、あるいは蛍光スペクトルの分布を出力する。ここでいう画像とは、そのスペクトルを構成する色素やサンプル由来の自家蛍光などの構成比率、波形からRGB(赤緑青)カラーに変換されたものや、特定の波長帯の輝度分布などをいう。
The processing unit 2 includes a storage section 21 , a data proofreading section 22 and an image forming section 23 . Based on the fluorescence spectrum of the pathological specimen (hereinafter also referred to as sample S) acquired by the observation unit 1, the processing unit 2 typically forms an image of the pathological specimen or calculates the distribution of the fluorescence spectrum. Output. The image here refers to the composition ratio of pigments that compose the spectrum, the autofluorescence derived from the sample, the waveform converted to RGB (red, green and blue) colors, the luminance distribution of a specific wavelength band, and the like.
記憶部21は、例えばハードディスクドライブやフラッシュメモリといった不揮発性の記憶媒体と、当該記憶媒体に対するデータの書き込みおよび読み出しを制御する記憶制御部と、を含む。記憶部21は、励起部10が含む複数のライン照明それぞれにより射出される光の各波長と、分光イメージング部30のカメラで受光された蛍光との相関を示す分光データが記憶される。また、記憶部21には、観察対象となるサンプル(病理標本)に関する自家蛍光の標準スペクトルを示す情報や、サンプルを染色する色素単体の標準スペクトルを示す情報が予め記憶される。
The storage unit 21 includes a nonvolatile storage medium such as a hard disk drive or flash memory, and a storage control unit that controls writing and reading of data to and from the storage medium. The storage unit 21 stores spectral data indicating the correlation between each wavelength of light emitted by each of the plurality of line illuminations included in the excitation unit 10 and fluorescence received by the camera of the spectral imaging unit 30 . In addition, the storage unit 21 stores in advance information indicating the standard spectrum of autofluorescence of a sample (pathological specimen) to be observed, and information indicating the standard spectrum of a single dye that stains the sample.
データ校正部22は、分光イメージング部30のカメラで撮像された撮像画像に基づき記憶部21に記憶された分光データの構成を行う。画像形成部23は、分光データと、励起部10により照射された複数のライン照明の間隔Δyとに基づき、サンプルの蛍光画像を形成する。例えば、データ校正部22や画像形成部23等を含む処理ユニット2は、CPU(Central Processing Unit)、RAM(Random Access Memory)、ROM(Read Only Memory)等のコンピュータに用いられるハードウェア要素および必要なプログラム(ソフトウェア)により実現される。CPUに代えて、またはこれに加えて、FPGA(Field Programmable Gate Array)等のPLD(Programmable Logic Device)、あるいは、DSP(Digital Signal Processor)、その他ASIC(Application Specific Integrated Circuit)等が用いられてもよい。
The data calibration unit 22 configures the spectral data stored in the storage unit 21 based on the captured image captured by the camera of the spectral imaging unit 30 . The image forming unit 23 forms a fluorescence image of the sample based on the spectral data and the intervals Δy between the plurality of line illuminations irradiated by the excitation unit 10 . For example, the processing unit 2 including the data proofreading unit 22, the image forming unit 23, etc. is a CPU (Central Processing Unit), a RAM (Random Access Memory), a ROM (Read Only Memory), and other hardware elements and necessary components used in a computer. It is realized by a program (software). Instead of or in addition to CPU, PLD (Programmable Logic Device) such as FPGA (Field Programmable Gate Array), DSP (Digital Signal Processor), other ASIC (Application Specific Integrated Circuit), etc. may be used. good.
表示部3は、例えば、画像形成部23で形成された蛍光画像に基づく画像等の各種情報を表示する。この表示部3は、例えば、処理ユニット2に一体的に取り付けられたモニタで構成されてもよいし、処理ユニット2に接続された表示装置であってもよい。表示部3は、例えば、液晶デバイスあるいは有機ELデバイス等の表示素子と、タッチセンサとを備え、撮影条件の入力設定や撮影画像等を表示するUI(User Interface)として構成される。
The display unit 3 displays various information such as an image based on the fluorescence image formed by the image forming unit 23, for example. The display section 3 may be configured by, for example, a monitor integrally attached to the processing unit 2 or may be a display device connected to the processing unit 2 . The display unit 3 includes, for example, a display element such as a liquid crystal device or an organic EL device, and a touch sensor, and is configured as a UI (User Interface) for displaying input settings of imaging conditions, captured images, and the like.
次に、観察ユニット1の詳細について図18を参照して説明する。ここでは、励起部10がそれぞれ2波長の発光を行う2つのライン照明Ex1およびEx2を含むものとして説明する。例えば、ライン照明Ex1が波長405nmの光と波長561nmの光とを発光し、ライン照明Ex2が波長488nmの光と波長645nmの光とを発光する。
Next, details of the observation unit 1 will be described with reference to FIG. Here, it is assumed that the excitation unit 10 includes two line illuminations Ex1 and Ex2 each emitting light of two wavelengths. For example, the line illumination Ex1 emits light with a wavelength of 405 nm and light with a wavelength of 561 nm, and the line illumination Ex2 emits light with a wavelength of 488 nm and light with a wavelength of 645 nm.
図18に示すように、励起部10は、複数(本例では4つ)の励起光源L1、L2、L3、L4を有する。各励起光源L1~L4は、波長がそれぞれ405nm、488nm、561nm及び645nmのレーザ光を出力するレーザ光源で構成される。例えば、各励起光源L1~L4は、発光ダイオード(LED)やレーザダイオード(LD)などで構成される。
As shown in FIG. 18, the excitation unit 10 has a plurality of (four in this example) excitation light sources L1, L2, L3, and L4. Each of the excitation light sources L1 to L4 is composed of a laser light source that outputs laser light with wavelengths of 405 nm, 488 nm, 561 nm and 645 nm, respectively. For example, each of the excitation light sources L1 to L4 is composed of a light emitting diode (LED), a laser diode (LD), or the like.
さらに、励起部10は、各励起光源L1~L4に対応するよう、複数のコリメータレンズ11、複数のレーザラインフィルタ12、複数のダイクロイックミラー13a、13b、13cと、ホモジナイザ14と、コンデンサレンズ15と、入射スリット16とを有する。
Furthermore, the excitation unit 10 includes a plurality of collimator lenses 11, a plurality of laser line filters 12, a plurality of dichroic mirrors 13a, 13b, 13c, a homogenizer 14, and a condenser lens 15 so as to correspond to the respective excitation light sources L1 to L4. , and an entrance slit 16 .
励起光源L1から出射されるレーザ光と励起光源L3から出射されるレーザ光は、それぞれコリメータレンズ11によって平行光になった後、各々の波長帯域の裾野をカットするためのレーザラインフィルタ12を透過し、ダイクロイックミラー13aによって同軸にされる。同軸化された2つのレーザ光は、さらに、ライン照明Ex1となるべくフライアイレンズなどのホモジナイザ14とコンデンサレンズ15によってビーム成形される。
The laser light emitted from the excitation light source L1 and the laser light emitted from the excitation light source L3 are collimated by a collimator lens 11, respectively, and then transmitted through a laser line filter 12 for cutting the skirt of each wavelength band. and are made coaxial by the dichroic mirror 13a. The two coaxial laser beams are further beam-shaped by a homogenizer 14 such as a fly-eye lens and a condenser lens 15 to form line illumination Ex1.
励起光源L2から出射されるレーザ光と励起光源L4から出射されるレーザ光も同様に各ダイクロイックミラー13b、13cによって同軸化され、ライン照明Ex1とは異軸のライン照明Ex2となるようにライン照明化される。ライン照明Ex1およびEx2は、各々が通過可能な複数のスリット部を有する入射スリット16(スリット共役)において距離Δyだけ離れた異軸ライン照明(1次像)を形成する。
Similarly, the laser light emitted from the excitation light source L2 and the laser light emitted from the excitation light source L4 are coaxially coaxial with each other by the dichroic mirrors 13b and 13c, and line illumination is performed so that the line illumination Ex2 has a different axis from the line illumination Ex1. become. The line illuminations Ex1 and Ex2 form off-axis line illuminations (primary images) separated by a distance Δy at the entrance slit 16 (slit conjugate) having a plurality of slit portions each passable.
なお、本実施形態では、4つのレーザを2つの同軸、2つの異軸とした例について説明するが、このほかに、2つのレーザを2つの異軸構成にしたり、4つのレーザを4つの異軸構成にしたりしてもよい。
In this embodiment, an example in which four lasers are arranged with two coaxial and two different axes will be described. An axis configuration may be used.
1次像は、観察光学系40を介してステージ20上のサンプルSに照射される。観察光学系40は、コンデンサレンズ41と、ダイクロイックミラー42,43と、対物レンズ44と、バンドパスフィルタ45と、コンデンサレンズ(結像レンズの一例)46とを有する。ライン照明Ex1、Ex2は、対物レンズ44と対になったコンデンサレンズ41で平行光にされ、ダイクロイックミラー42、43により反射されて対物レンズ44を透過し、ステージ20上のサンプルSに照射される。
The primary image is irradiated onto the sample S on the stage 20 via the observation optical system 40 . The observation optical system 40 has a condenser lens 41 , dichroic mirrors 42 and 43 , an objective lens 44 , a bandpass filter 45 , and a condenser lens (an example of an imaging lens) 46 . The line illuminations Ex1 and Ex2 are collimated by a condenser lens 41 paired with an objective lens 44, reflected by dichroic mirrors 42 and 43, transmitted through the objective lens 44, and irradiated onto the sample S on the stage 20. .
ここで、図19は、本実施形態に係るサンプルSの一例を示す図である。図19では、サンプルSを励起光であるライン照明Ex1およびEx2の照射方向から見た様子が示されている。サンプルSは、典型的には、図19に示すような組織切片等の観察対象物Saを含むスライドで構成されるが、勿論それ以外であってもよい。観察対象物Saは、例えば、核酸、細胞、タンパク、菌、ウイルスなどの生体試料である。サンプルS(観察対象物Sa)は、複数の蛍光色素によって染色されている。観察ユニット1は、サンプルSを所望の倍率に拡大して観察する。
Here, FIG. 19 is a diagram showing an example of the sample S according to this embodiment. FIG. 19 shows a state in which the sample S is viewed from the irradiation directions of line illuminations Ex1 and Ex2, which are excitation lights. The sample S is typically composed of a slide containing an observation object Sa such as a tissue section as shown in FIG. The observation target Sa is, for example, a biological sample such as nucleic acid, cell, protein, bacterium, or virus. A sample S (observation target Sa) is dyed with a plurality of fluorescent dyes. The observation unit 1 enlarges the sample S to a desired magnification and observes it.
図20は、本実施形態に係るサンプルSにライン照明Ex1およびEx2が照射される領域Aを拡大して示す図である。図20の例では、領域Aに2つのライン照明Ex1およびEx2が配置されており、それぞれのライン照明Ex1およびEx2に重なるように、分光イメージング部30の撮影エリアR1およびR2が配置される。2つのライン照明Ex1およびEx2は、それぞれZ軸方向に平行であり、Y軸方向に所定の距離Δyだけ離れて配置される。
FIG. 20 is an enlarged view of the area A in which the sample S according to the present embodiment is irradiated with the line illuminations Ex1 and Ex2. In the example of FIG. 20, two line illuminations Ex1 and Ex2 are arranged in area A, and imaging areas R1 and R2 of spectral imaging section 30 are arranged so as to overlap with the respective line illuminations Ex1 and Ex2. The two line illuminations Ex1 and Ex2 are each parallel to the Z-axis direction and arranged apart from each other by a predetermined distance Δy in the Y-axis direction.
サンプルSの表面において、図20に示したようにライン照明Ex1およびEx2が形成される。これらのライン照明Ex1およびEx2によってサンプルSにおいて励起された蛍光は、図18に示すように、対物レンズ44によって集光され、ダイクロイックミラー43に反射され、ダイクロイックミラー42と、励起光をカットするバンドパスフィルタ45とを透過し、コンデンサレンズ46で再び集光されて、分光イメージング部30に入射する。
On the surface of sample S, line illuminations Ex1 and Ex2 are formed as shown in FIG. Fluorescence excited in the sample S by these line illuminations Ex1 and Ex2 is collected by the objective lens 44 and reflected by the dichroic mirror 43, as shown in FIG. It passes through the pass filter 45 , is condensed again by the condenser lens 46 , and enters the spectral imaging section 30 .
分光イメージング部30は、図18に示すように、観測スリット(開口部)31と、撮像素子32と、第1プリズム33と、ミラー34と、回折格子35(波長分散素子)と、第2プリズム36とを有する。
As shown in FIG. 18, the spectral imaging unit 30 includes an observation slit (aperture) 31, an image sensor 32, a first prism 33, a mirror 34, a diffraction grating 35 (wavelength dispersion element), and a second prism. 36.
図18の例では、撮像素子32は、2つの撮像素子32a、32bを含んで構成されている。この撮像素子32は、回折格子35によって波長分散された複数の光(蛍光等)を撮像(受光)する。撮像素子32には、例えば、CCD(Charge Coupled Device)、CMOS(Complementary Metal Oxide Semiconductor)などの2次元イメージャが採用される。
In the example of FIG. 18, the imaging element 32 is configured including two imaging elements 32a and 32b. The imaging device 32 captures (receives) a plurality of lights (fluorescence, etc.) wavelength-dispersed by the diffraction grating 35 . A two-dimensional imager such as a CCD (Charge Coupled Device) or a CMOS (Complementary Metal Oxide Semiconductor) is adopted as the imaging device 32 .
観測スリット31は、コンデンサレンズ46の集光点に配置され、励起ライン数と同じ数(この例では2本)のスリット部を有する。観測スリット31を通過した2つの励起ライン由来の蛍光スペクトルは、第1プリズム33で分離され、それぞれミラー34を介して回折格子35の格子面で反射することにより、励起波長各々の蛍光スペクトルにさらに分離される。分離された4つの蛍光スペクトルは、ミラー34および第2プリズム36を介して撮像素子32aおよび32bに入射され、分光データとして、ライン方向の位置xと、波長λにより表現される分光データ(x,λ)に展開される。分光データ(x,λ)は、撮像素子32に含まれる画素のうち、行方向において位置x、列方向において波長λの位置の画素の画素値である。なお、分光データ(x,λ)は、単に分光データとして記述されることがある。
The observation slit 31 is arranged at the condensing point of the condenser lens 46 and has the same number of slit parts as the number of excitation lines (two in this example). The fluorescence spectra derived from the two excitation lines that have passed through the observation slit 31 are separated by the first prism 33 and reflected by the grating surfaces of the diffraction grating 35 via the mirrors 34, respectively, so that the fluorescence spectra of the excitation wavelengths are further divided into separated. The four separated fluorescence spectra are incident on the imaging devices 32a and 32b via the mirror 34 and the second prism 36, and the spectral data represented by the position x in the line direction and the wavelength λ (x, λ). The spectral data (x, λ) is a pixel value of a pixel at position x in the row direction and at wavelength λ in the column direction among the pixels included in the image sensor 32 . Note that the spectroscopic data (x, λ) may be simply described as spectroscopic data.
なお、撮像素子32aおよび32bの画素サイズ[nm/Pixel]は特に限定されず、例えば、2[nm/Pixel]以上20[nm/Pixel]以下に設定される。この分散値は、回折格子35のピッチや光学的に実現しても良いし、撮像素子32aおよび32bのハードウェアビニングを使って実現しても良い。また、光路の途中にダイクロイックミラー42やバンドパスフィルタ45が挿入され、励起光(ライン照明Ex1およびEx2)が撮像素子32に到達しないようにされている。
The pixel size [nm/Pixel] of the imaging elements 32a and 32b is not particularly limited, and is set to, for example, 2 [nm/Pixel] or more and 20 [nm/Pixel] or less. This dispersion value may be realized by the pitch of the diffraction grating 35, optically, or by hardware binning of the imaging elements 32a and 32b. Also, a dichroic mirror 42 and a bandpass filter 45 are inserted in the optical path to prevent the excitation light (line illuminations Ex1 and Ex2) from reaching the imaging device 32 .
各ライン照明Ex1およびEx2は、それぞれ単一の波長で構成される場合に限られず、それぞれが複数の波長で構成されてもよい。ライン照明Ex1およびEx2がそれぞれ複数の波長で構成される場合、これらで励起される蛍光もそれぞれ複数のスペクトルを含む。この場合、分光イメージング部30は、当該蛍光を励起波長に由来するスペクトルに分離するための波長分散素子を有する。波長分散素子は、回折格子やプリズムなどで構成され、典型的には、観測スリット31と撮像素子32との間の光路上に配置される。
Each of the line illuminations Ex1 and Ex2 is not limited to being configured with a single wavelength, and may each be configured with a plurality of wavelengths. If the line illuminations Ex1 and Ex2 each consist of multiple wavelengths, the fluorescence excited by them also contains multiple spectra. In this case, the spectroscopic imaging unit 30 has a wavelength dispersive element for separating the fluorescence into spectra derived from the excitation wavelengths. The wavelength dispersive element is composed of a diffraction grating, a prism, or the like, and is typically arranged on the optical path between the observation slit 31 and the imaging element 32 .
なお、ステージ20および走査機構50は、X-Yステージを構成し、サンプルSの蛍光画像を取得するため、サンプルSをX軸方向およびY軸方向へ移動させる。WSI(Whole slide imaging)では、Y軸方向にサンプルSをスキャンし、その後、X軸方向に移動し、さらにY軸方向へのスキャンを行うといった動作が繰り返される。走査機構50を用いることで、サンプルS(観察対象物Sa)上において空間的に距離Δyだけ離れた、それぞれ異なる励起波長で励起された色素スペクトル(蛍光スペクトル)を、Y軸方向に連続的に取得することができる。
Note that the stage 20 and the scanning mechanism 50 constitute an XY stage, and in order to acquire a fluorescence image of the sample S, the sample S is moved in the X-axis direction and the Y-axis direction. In WSI (whole slide imaging), the operation of scanning the sample S in the Y-axis direction, moving in the X-axis direction, and then scanning in the Y-axis direction is repeated. By using the scanning mechanism 50, dye spectra (fluorescence spectra) excited at different excitation wavelengths, which are spatially separated by a distance Δy on the sample S (observation object Sa), are continuously scanned in the Y-axis direction. can be obtained.
走査機構50は、サンプルSにおける照射光の照射される位置を経時的に変化させる。例えば、走査機構50は、ステージ20をY軸方向に走査する。この走査機構50によって、ステージ20に対して複数のライン照明Ex1,Ex2をY軸方向、つまり、各ライン照明Ex1,Ex2の配列方向に走査させることができる。これは、この例に限定されず、光学系の途中に配置されたガルバノミラーによって複数のライン照明Ex1およびEx2がY軸方向に走査されてもよい。各ライン照明Ex1およびEx2由来のデータ(例えば、2次元データ又は3次元データ)は、Y軸について距離Δyだけ座標がシフトしたデータになるので、予め記憶された距離Δy、または、撮像素子32の出力から計算される距離Δyの値に基づいて、補正され出力される。
The scanning mechanism 50 changes the position of the sample S irradiated with the irradiation light over time. For example, the scanning mechanism 50 scans the stage 20 in the Y-axis direction. The scanning mechanism 50 can scan the stage 20 with the plurality of line illuminations Ex1 and Ex2 in the Y-axis direction, that is, in the arrangement direction of the line illuminations Ex1 and Ex2. This is not limited to this example, and a plurality of line illuminations Ex1 and Ex2 may be scanned in the Y-axis direction by a galvanomirror arranged in the middle of the optical system. Data derived from each of the line illuminations Ex1 and Ex2 (for example, two-dimensional data or three-dimensional data) is data whose coordinates are shifted by a distance Δy about the Y axis. Based on the value of the distance Δy calculated from the output, it is corrected and output.
図18に示すように、非蛍光観察部70は、光源71、ダイクロイックミラー43、対物レンズ44、コンデンサレンズ72、撮像素子73などにより構成される。非蛍光観察部70においては、図18の例では、暗視野照明による観察系を示している。
As shown in FIG. 18, the non-fluorescent observation section 70 is composed of a light source 71, a dichroic mirror 43, an objective lens 44, a condenser lens 72, an imaging device 73, and the like. In the non-fluorescent observation unit 70, the example of FIG. 18 shows an observation system using dark field illumination.
光源71は、ステージ20に対して対物レンズ44と対向する側に配置され、ステージ20上のサンプルSに対して、ライン照明Ex1、Ex2とは反対側から照明光を照射する。暗視野照明の場合、光源71は、対物レンズ44のNA(開口数)の外側から照明し、サンプルSで回折した光(暗視野像)を対物レンズ44、ダイクロイックミラー43およびコンデンサレンズ72を介して撮像素子73で撮影する。暗視野照明を用いることで、蛍光染色サンプルのような一見透明なサンプルであってもコントラストを付けて観察することができる。
The light source 71 is arranged on the side of the stage 20 facing the objective lens 44, and irradiates the sample S on the stage 20 with illumination light from the side opposite to the line illuminations Ex1 and Ex2. In the case of dark field illumination, the light source 71 illuminates from outside the NA (numerical aperture) of the objective lens 44 , and the light (dark field image) diffracted by the sample S passes through the objective lens 44 , the dichroic mirror 43 and the condenser lens 72 . Then, the image sensor 73 takes a picture. By using dark field illumination, even seemingly transparent samples such as fluorescently stained samples can be observed with contrast.
なお、この暗視野像を蛍光と同時に観察して、リアルタイムのフォーカスに使ってもよい。この場合、照明波長は、蛍光観察に影響のない波長を選択すればよい。非蛍光観察部70は、暗視野画像を取得する観察系に限られず、明視野画像、位相差画像、位相像、インラインホログラム(In-line hologram)画像などの非蛍光画像を取得可能な観察系で構成されてもよい。例えば、非蛍光画像の取得方法として、シュリーレン法、位相差コントラスト法、偏光観察法、落射照明法などの種々の観察法が採用可能である。照明用光源の位置もステージ20の下方に限られず、ステージ20の上方や対物レンズ44の周りにあってもよい。また、リアルタイムでフォーカス制御を行う方式だけでなく、予めフォーカス座標(Z座標)を記録しておくプレフォーカスマップ方式等の他の方式が採用されてもよい。
Note that this dark field image may be observed simultaneously with fluorescence and used for real-time focusing. In this case, an illumination wavelength may be selected that does not affect fluorescence observation. The non-fluorescent observation unit 70 is not limited to an observation system that acquires a dark field image, but is an observation system capable of acquiring non-fluorescent images such as bright field images, phase contrast images, phase images, and in-line hologram images. may consist of For example, various observation methods such as the Schlieren method, the phase contrast method, the polarizing observation method, and the epi-illumination method can be employed as methods for obtaining non-fluorescent images. The position of the illumination light source is also not limited to below the stage 20 , and may be above the stage 20 or around the objective lens 44 . In addition to the method of performing focus control in real time, other methods such as a pre-focus map method in which focus coordinates (Z coordinates) are recorded in advance may be employed.
なお、上述では、励起光としてのライン照明は、ライン照明Ex1およびEx2の2本で構成されたが、これに限定されず、3本、4本あるいは5本以上であってもよい。またそれぞれのライン照明は、色分離性能がなるべく劣化しないように選択された複数の励起波長を含んでもよい。また、ライン照明が1本であっても、複数の励起波長から構成される励起光源で、かつそれぞれの励起波長と、撮像素子32で所得されるデータとを紐づけて記録すれば、異軸平行ほどの分離能は得られないが、多色スペクトルを得ることができる。
In the above description, the line illumination as excitation light is composed of two line illuminations Ex1 and Ex2, but is not limited to this, and may be three, four, or five or more. Each line illumination may also include multiple excitation wavelengths selected to minimize degradation of color separation performance. In addition, even if there is only one line illumination, if the excitation light source is composed of a plurality of excitation wavelengths, and if each excitation wavelength and the data obtained by the imaging device 32 are linked and recorded, a different axis can be obtained. It does not give as much resolution as parallelism, but it does give a multicolor spectrum.
以上、本開示に係る技術を蛍光観察装置500に適用した適用例について説明した。なお、図17及び図18を参照して説明した上記の構成はあくまで一例であり、本実施形態に係る蛍光観察装置500の構成は係る例に限定されない。例えば、蛍光観察装置500は、図17及び図18に示す構成の全てを必ずしも備えなくてもよいし、図17及び図18に示されていない構成を備えてもよい。
An application example in which the technology according to the present disclosure is applied to the fluorescence observation device 500 has been described above. The configuration described above with reference to FIGS. 17 and 18 is merely an example, and the configuration of the fluorescence observation apparatus 500 according to this embodiment is not limited to the example. For example, the fluoroscopy apparatus 500 does not necessarily have all of the configurations shown in FIGS. 17 and 18, and may have configurations not shown in FIGS.
<1-10.作用・効果>
以上説明したように、第1の実施形態によれば、自家蛍光成分を含む非染色画像と、第一蛍光色素の標準スペクトル(参照スペクトル)及び非染色画像の画素毎の撮像ノイズが関連付けられた色素タイル画像とを重畳し、模擬画像を生成する模擬画像生成部131aと、模擬画像に基づいて、第一蛍光色素の成分と自家蛍光成分とを分離し、分離画像を生成する蛍光分離部131bと、分離画像の分離の程度を評価する評価部131cが設けられる。これにより、模擬画像が生成され、その模擬画像に対して色分離処理が行われて分離画像が生成され、分離画像の分離の程度が評価される。このように模擬画像を用いることで、色分離精度を定量的に評価することが可能になるので、蛍光分離の程度を適切に評価することができる。 <1-10. Action/Effect>
As described above, according to the first embodiment, the non-stained image containing the autofluorescent component, the standard spectrum (reference spectrum) of the first fluorescent dye, and the imaging noise for each pixel of the non-stained image are associated. Asimulated image generator 131a that superimposes the dye tile image to generate a simulated image, and a fluorescence separator 131b that separates the component of the first fluorescent dye and the autofluorescent component based on the simulated image to generate a separated image. and an evaluation unit 131c for evaluating the degree of separation of the separated image. As a result, a simulated image is generated, color separation processing is performed on the simulated image to generate a separated image, and the degree of separation of the separated image is evaluated. By using the simulated image in this way, it becomes possible to quantitatively evaluate the accuracy of color separation, so that the degree of fluorescence separation can be appropriately evaluated.
以上説明したように、第1の実施形態によれば、自家蛍光成分を含む非染色画像と、第一蛍光色素の標準スペクトル(参照スペクトル)及び非染色画像の画素毎の撮像ノイズが関連付けられた色素タイル画像とを重畳し、模擬画像を生成する模擬画像生成部131aと、模擬画像に基づいて、第一蛍光色素の成分と自家蛍光成分とを分離し、分離画像を生成する蛍光分離部131bと、分離画像の分離の程度を評価する評価部131cが設けられる。これにより、模擬画像が生成され、その模擬画像に対して色分離処理が行われて分離画像が生成され、分離画像の分離の程度が評価される。このように模擬画像を用いることで、色分離精度を定量的に評価することが可能になるので、蛍光分離の程度を適切に評価することができる。 <1-10. Action/Effect>
As described above, according to the first embodiment, the non-stained image containing the autofluorescent component, the standard spectrum (reference spectrum) of the first fluorescent dye, and the imaging noise for each pixel of the non-stained image are associated. A
また、色素タイル画像は、第一蛍光色素に加え、第二蛍光色素の標準スペクトルを含み、第一蛍光色素及び第二蛍光色素の個々の標準スペクトルと非染色画像の画素毎の撮像ノイズとが関連付けられた画像であってもよい。これにより、複数の蛍光色素に対応する模擬画像を生成することができる。
In addition, the dye tile image includes the standard spectrum of the second fluorescent dye in addition to the first fluorescent dye, and the individual standard spectra of the first and second fluorescent dyes and the imaging noise of each pixel of the unstained image are combined. It may be an associated image. Thereby, simulated images corresponding to a plurality of fluorescent dyes can be generated.
また、撮像ノイズは、非染色画像の撮像条件に応じて変化するノイズであってもよい。これにより、非染色画像の撮像条件に対応する模擬画像を生成することができる。
Also, the imaging noise may be noise that changes according to the imaging conditions of the non-stained image. This makes it possible to generate a simulated image corresponding to the imaging conditions of the non-stained image.
また、非染色画像の撮像条件は、レーザーパワー、ゲイン及び露光時間のうち少なくとも1つ又は全てを含んでもよい。これにより、それらの情報に対応する模擬画像を生成することができる。
Also, the imaging conditions for the non-stained image may include at least one or all of laser power, gain, and exposure time. This makes it possible to generate a simulated image corresponding to those pieces of information.
また、色素タイル画像は、複数の色素タイルを有する色素タイル群であってもよい。これにより、各色素タイルに対応する模擬画像を生成することができる。
Also, the pigment tile image may be a pigment tile group having a plurality of pigment tiles. Thereby, a simulated image corresponding to each dye tile can be generated.
また、複数の色素タイルの個々のサイズは、細胞のサイズと同じであってもよい。これにより、細胞のサイズと同じサイズの各色素タイルに対応する模擬画像を生成することができる。
Also, the size of each of the multiple pigment tiles may be the same as the size of the cell. This allows a simulated image to be generated corresponding to each dye tile that is the same size as the cell.
また、複数の色素タイルは、所定の配色パターンで並ぶように配置されてもよい。これにより、所定の配色パターンに基づいて、各色素タイルに対応する模擬画像に対する色分離処理を行うことが可能になるので、色分離処理を効率よく実行することができる。
Also, a plurality of pigment tiles may be arranged in a predetermined color scheme pattern. As a result, it is possible to perform color separation processing on the simulated image corresponding to each dye tile based on the predetermined coloration pattern, so that the color separation processing can be performed efficiently.
また、撮像ノイズの程度は、色素タイル毎に定量化又は可視化されてもよい。これにより、撮像ノイズの程度が定量化されると、定量化された撮像ノイズの程度に対応する模擬画像を生成することができる。また、撮像ノイズの程度が可視化されると、ユーザは撮像ノイズの程度を把握することができる。
Also, the degree of imaging noise may be quantified or visualized for each dye tile. Accordingly, when the degree of imaging noise is quantified, a simulated image corresponding to the quantified degree of imaging noise can be generated. Also, if the degree of imaging noise is visualized, the user can grasp the degree of imaging noise.
また、模擬画像生成部131aは、ユーザが指定した色素数分の色素タイルを繰り返し配置し、色素タイル画像を生成してもよい。これにより、ユーザが指定した色素数分の色素タイルに対応する模擬画像を生成することができる。
In addition, the simulated image generation unit 131a may generate a dye tile image by repeatedly arranging pigment tiles for the number of pigments specified by the user. As a result, it is possible to generate a simulated image corresponding to the number of dye tiles specified by the user.
また、模擬画像生成部131aは、複数の色素を混ぜて色素タイルを作成してもよい。これにより、二重染色条件や三重染色条件等での色分離性能(例えば、色分離精度)を評価することができる。
Also, the simulated image generation unit 131a may mix a plurality of pigments to create pigment tiles. This makes it possible to evaluate the color separation performance (for example, color separation accuracy) under double dyeing conditions, triple dyeing conditions, and the like.
また、模擬画像生成部131aは、非染色画像の自家蛍光強度に対して付与する色素のスペクトル強度を決定してもよい。これにより、自家蛍光強度に対して色素輝度レベルが大きくない染色条件等も再現でき、色素と自家蛍光のある画素とを区別することができる。
The simulated image generation unit 131a may also determine the spectral intensity of the dye to be applied to the autofluorescence intensity of the non-stained image. This makes it possible to reproduce staining conditions where the dye brightness level is not large relative to the autofluorescence intensity, and to distinguish between dyes and pixels with autofluorescence.
また、模擬画像生成部131aは、第一蛍光色素の標準スペクトルに撮像ノイズを重畳してもよい。これにより、標準スペクトルと撮像ノイズとを関連付けて色素タイル画像を生成することができる。
Also, the simulated image generator 131a may superimpose imaging noise on the standard spectrum of the first fluorescent dye. This allows the dye tile image to be generated by associating the standard spectrum with the imaging noise.
また、重畳する撮像ノイズは、ショットノイズであってもよい。これにより、ショットノイズに対応する色素タイル画像を生成することができる。
Also, the imaging noise to be superimposed may be shot noise. Thus, a dye tile image corresponding to shot noise can be generated.
また、蛍光分離部131bは、最小二乗法や重み付最小二乗法、非負値行列因子分解のうち少なくとも一つを含む色分離計算により、第一蛍光色素の成分と自家蛍光成分を分離してもよい。これにより、精度よく色分離処理を行うことができる。
In addition, the fluorescence separation unit 131b performs color separation calculation including at least one of the least squares method, weighted least squares method, and non-negative matrix factorization to separate the components of the first fluorescent dye and the autofluorescence components. good. Accordingly, color separation processing can be performed with high accuracy.
また、評価部131cは、分離画像からヒストグラムを生成し、ヒストグラムから色素と色素以外との信号分離値を算出し、信号分離値に基づいて分離の程度を評価してもよい。これにより、精度よく分離の程度を評価することができる。例えば、信号分離値が所定値(例えば、1.645)を超えている場合には、分離の程度が良いと評価する。
Further, the evaluation unit 131c may generate a histogram from the separated image, calculate the signal separation value between the pigment and the non-pigment from the histogram, and evaluate the degree of separation based on the signal separation value. This makes it possible to evaluate the degree of separation with high accuracy. For example, when the signal separation value exceeds a predetermined value (for example, 1.645), the degree of separation is evaluated as good.
<2.第2の実施形態>
<2-1.定量評価に係る解析部の構成例>
本実施形態に係る定量評価に係る解析部131の構成例について図21を参照して説明する。図21は、本実施形態に係る解析部131の概略構成の一例を示す図である。 <2. Second Embodiment>
<2-1. Configuration example of analysis unit related to quantitative evaluation>
A configuration example of theanalysis unit 131 related to quantitative evaluation according to this embodiment will be described with reference to FIG. 21 . FIG. 21 is a diagram showing an example of a schematic configuration of the analysis unit 131 according to this embodiment.
<2-1.定量評価に係る解析部の構成例>
本実施形態に係る定量評価に係る解析部131の構成例について図21を参照して説明する。図21は、本実施形態に係る解析部131の概略構成の一例を示す図である。 <2. Second Embodiment>
<2-1. Configuration example of analysis unit related to quantitative evaluation>
A configuration example of the
図21に示すように、解析部131は、第1の実施形態に係る模擬画像生成部131a、蛍光分離部131b及び評価部131cに加え、推奨部131dを備える。
As shown in FIG. 21, the analysis unit 131 includes a recommendation unit 131d in addition to the simulation image generation unit 131a, the fluorescence separation unit 131b, and the evaluation unit 131c according to the first embodiment.
推奨部131dは、評価部131cで評価された分離の程度から、ユーザが指定した色素の中から最適な試薬(蛍光試薬10A)を推奨する。例えば、推奨部131dは、自家蛍光スペクトルが異なる組織による空間的な情報評価や組織に対して最適な色素の組み合わせをユーザに提示するための画像(例えば、表や図など)を生成し、表示部140は、推奨部131dにより生成された画像を表示する。これにより、ユーザは、表示画像を視認し、最適な色素の組み合わせを把握することができる。
The recommendation unit 131d recommends the optimum reagent (fluorescent reagent 10A) from among the dyes specified by the user, based on the degree of separation evaluated by the evaluation unit 131c. For example, the recommendation unit 131d generates and displays an image (e.g., a table, a diagram, etc.) for presenting the user with spatial information evaluation by tissues with different autofluorescence spectra and the optimal combination of dyes for the tissue. The unit 140 displays the image generated by the recommendation unit 131d. This allows the user to view the displayed image and grasp the optimum combination of dyes.
例えば、評価部131cは、染色に使用する色素の組み合わせや、色素と試薬との組み合わせについて、信号分離値(Signal Separation値)を算出する。推奨部131dは、算出結果(例えば、組み合わせ毎の信号分離値)に基づいて、どの組み合わせが最適であるかをユーザに提示するための画像を生成する。例えば、推奨部131dは、信号分離値が1.645を超えていない色素を除外し、最適な組み合わせを示す画像を生成する。なお、最適な組み合わせを生成する以外にも、例えば、推奨する複数の組み合わせを色分離性能(例えば、信号分離値)と共に示す画像(例えば、表や図など)を生成してもよい。また、抗体及び色素の組み合わせを示すマトリックス情報を示す画像(例えば、表など)を参照用に表示してもよい。
For example, the evaluation unit 131c calculates a signal separation value for a combination of dyes used for staining or a combination of a dye and a reagent. The recommending unit 131d generates an image for presenting to the user which combination is optimal based on the calculation result (for example, the signal separation value for each combination). For example, the recommendation unit 131d excludes dyes whose signal separation value does not exceed 1.645, and generates an image showing the optimum combination. In addition to generating the optimum combination, for example, an image (eg, table, diagram, etc.) showing a plurality of recommended combinations together with color separation performance (eg, signal separation value) may be generated. Also, an image (eg, a table, etc.) showing matrix information showing combinations of antibodies and dyes may be displayed for reference.
<2-2.作用・効果>
以上説明したように、第2の実施形態によれば、第1の実施形態と同様の効果を得ることができる。また、分離の程度に基づいて、ユーザが指定した色素に対応する最適な試薬(蛍光試薬10A)を推奨する推奨部131dが設けられる。これにより、ユーザは最適な試薬を把握することが可能となるので、ユーザの利便性を向上させることができる。 <2-2. Action/Effect>
As described above, according to the second embodiment, the same effects as those of the first embodiment can be obtained. Further, a recommendation unit 131d is provided that recommends the optimum reagent (fluorescent reagent 10A) corresponding to the pigment specified by the user based on the degree of separation. As a result, the user can grasp the optimum reagent, so that the user's convenience can be improved.
また、推奨部131dは、色素の組み合わせ又は色素と試薬との組み合わせを示す画像(例えば、表や図など)を生成してもよい。これにより、ユーザは色素の組み合わせ又は色素と試薬との組み合わせを把握することが可能となるので、ユーザの利便性を向上させることができる。
In addition, the recommendation unit 131d may generate an image (for example, a table, a diagram, etc.) showing a combination of dyes or a combination of dyes and reagents. As a result, the user can grasp the combination of dyes or the combination of dyes and reagents, thereby improving convenience for the user.
また、推奨部131dは、抗体及び色素の組み合わせを示す画像(例えば、図など)を生成してもよい。これにより、ユーザは抗体及び色素の組み合わせを把握することが可能となるので、ユーザの利便性を向上させることができる。
Also, the recommendation unit 131d may generate an image (for example, a diagram) showing the combination of the antibody and the dye. As a result, the user can grasp the combination of the antibody and the dye, so that the user's convenience can be improved.
<3.他の実施形態>
上述した実施形態(又は変形例)に係る処理は、上記実施形態以外にも種々の異なる形態(変形例)にて実施されてよい。例えば、上記実施形態において説明した各処理のうち、自動的に行われるものとして説明した処理の全部または一部を手動的に行うこともでき、あるいは、手動的に行われるものとして説明した処理の全部または一部を公知の方法で自動的に行うこともできる。この他、上記文書中や図面中で示した処理手順、具体的名称、各種のデータやパラメータを含む情報については、特記する場合を除いて任意に変更することができる。例えば、各図に示した各種情報は、図示した情報に限られない。 <3. Other Embodiments>
The processing according to the above-described embodiments (or modifications) may be implemented in various different forms (modifications) other than the above embodiments. For example, among the processes described in the above embodiments, all or part of the processes described as being automatically performed can be manually performed, or the processes described as being performed manually can be performed manually. All or part of this can also be done automatically by known methods. In addition, information including processing procedures, specific names, various data and parameters shown in the above documents and drawings can be arbitrarily changed unless otherwise specified. For example, the various information shown in each drawing is not limited to the illustrated information.
また、図示した各装置の各構成要素は機能概念的なものであり、必ずしも物理的に図示の如く構成されていることを要しない。すなわち、各装置の分散・統合の具体的形態は図示のものに限られず、その全部または一部を、各種の負荷や使用状況などに応じて、任意の単位で機能的または物理的に分散・統合して構成することができる。
Also, each component of each device illustrated is functionally conceptual and does not necessarily need to be physically configured as illustrated. In other words, the specific form of distribution and integration of each device is not limited to the one shown in the figure, and all or part of them can be functionally or physically distributed and integrated in arbitrary units according to various loads and usage conditions. Can be integrated and configured.
また、上述した実施形態(又は変形例)は、処理内容を矛盾させない範囲で適宜組み合わせることが可能である。また、本明細書に記載された効果はあくまで例示であって限定されるものでは無く、他の効果があってもよい。
In addition, the above-described embodiments (or modifications) can be appropriately combined within a range that does not contradict the processing content. Also, the effects described in this specification are only examples and are not limited, and other effects may be provided.
<4.応用例>
本開示に係る技術は、例えば、顕微鏡システム等に応用されることができる。以下、図22から図24を参照して、応用され得る顕微鏡システム5000の構成例について説明する。顕微鏡システム5000の一部である顕微鏡装置5100は、撮像装置として機能する。 <4. Application example>
The technology according to the present disclosure can be applied to, for example, a microscope system. A configuration example of amicroscope system 5000 that can be applied will be described below with reference to FIGS. 22 to 24. FIG. A microscope device 5100 that is part of the microscope system 5000 functions as an imaging device.
本開示に係る技術は、例えば、顕微鏡システム等に応用されることができる。以下、図22から図24を参照して、応用され得る顕微鏡システム5000の構成例について説明する。顕微鏡システム5000の一部である顕微鏡装置5100は、撮像装置として機能する。 <4. Application example>
The technology according to the present disclosure can be applied to, for example, a microscope system. A configuration example of a
本開示の顕微鏡システムの構成例を図22に示す。図22に示される顕微鏡システム5000は、顕微鏡装置5100、制御部5110、及び情報処理部5120を含む。顕微鏡装置5100は、光照射部5101、光学部5102、及び信号取得部5103を備えている。顕微鏡装置5100はさらに、生体由来試料Sが配置される試料載置部5104を備えていてよい。なお、顕微鏡装置の構成は図22に示されるものに限定されず、例えば、光照射部5101は、顕微鏡装置5100の外部に存在してもよく、例えば顕微鏡装置5100に含まれない光源が光照射部5101として利用されてもよい。また、光照射部5101は、光照射部5101と光学部5102とによって試料載置部5104が挟まれるように配置されていてよく、例えば、光学部5102が存在する側に配置されてもよい。顕微鏡装置5100は、明視野観察、位相差観察、微分干渉観察、偏光観察、蛍光観察、及び暗視野観察のうちの1又は2以上を実行することができるように構成されてよい。
A configuration example of the microscope system of the present disclosure is shown in FIG. A microscope system 5000 shown in FIG. 22 includes a microscope device 5100 , a control section 5110 and an information processing section 5120 . A microscope device 5100 includes a light irradiation section 5101 , an optical section 5102 , and a signal acquisition section 5103 . The microscope device 5100 may further include a sample placement section 5104 on which the biological sample S is placed. The configuration of the microscope apparatus is not limited to that shown in FIG. 22. For example, the light irradiation unit 5101 may exist outside the microscope apparatus 5100. It may be used as the unit 5101 . Further, the light irradiation section 5101 may be arranged such that the sample mounting section 5104 is sandwiched between the light irradiation section 5101 and the optical section 5102, and may be arranged on the side where the optical section 5102 exists, for example. The microscope apparatus 5100 may be configured to be able to perform one or more of bright field observation, phase contrast observation, differential interference contrast observation, polarization observation, fluorescence observation, and dark field observation.
顕微鏡システム5000は、いわゆるWSI(Whole Slide Imaging)システム又はデジタルパソロジーイメージングシステムとして構成されてよく、病理診断のために用いられうる。また、顕微鏡システム5000は、蛍光イメージングシステム、特には多重蛍光イメージングシステムとして構成されてもよい。
The microscope system 5000 may be configured as a so-called WSI (Whole Slide Imaging) system or a digital pathology imaging system, and can be used for pathological diagnosis. Microscope system 5000 may also be configured as a fluorescence imaging system, in particular a multiplex fluorescence imaging system.
例えば、顕微鏡システム5000は、術中病理診断又は遠隔病理診断を行うために用いられてよい。当該術中病理診断では、手術が行われている間に、顕微鏡装置5100が、当該手術の対象者から取得された生体由来試料Sのデータを取得し、そして、当該データを情報処理部5120へと送信しうる。当該遠隔病理診断では、顕微鏡装置5100は、取得した生体由来試料Sのデータを、顕微鏡装置5100とは離れた場所(別の部屋又は建物など)に存在する情報処理部5120へと送信しうる。そして、これらの診断において、情報処理部5120は、当該データを受信し、出力する。出力されたデータに基づき、情報処理部5120のユーザが、病理診断を行いうる。
For example, the microscope system 5000 may be used to perform intraoperative pathological diagnosis or remote pathological diagnosis. In the intraoperative pathological diagnosis, while the surgery is being performed, the microscope device 5100 acquires data of the biological sample S obtained from the subject of the surgery, and transfers the data to the information processing unit 5120. can send. In the remote pathological diagnosis, the microscope device 5100 can transmit the acquired data of the biological sample S to the information processing unit 5120 located in a place (another room, building, or the like) away from the microscope device 5100 . In these diagnoses, the information processing section 5120 receives and outputs the data. A user of the information processing unit 5120 can make a pathological diagnosis based on the output data.
(生体由来試料)
生体由来試料Sは、生体成分を含む試料であってよい。前記生体成分は、生体の組織、細胞、生体の液状成分(血液や尿等)、培養物、又は生細胞(心筋細胞、神経細胞、及び受精卵など)であってよい。前記生体由来試料は、固形物であってよく、パラフィンなどの固定試薬によって固定された標本又は凍結により形成された固形物であってよい。前記生体由来試料は、当該固形物の切片でありうる。前記生体由来試料の具体的な例として、生検試料の切片を挙げることができる。 (Biological sample)
The biological sample S may be a sample containing a biological component. The biological components may be tissues, cells, liquid components of a living body (blood, urine, etc.), cultures, or living cells (cardiomyocytes, nerve cells, fertilized eggs, etc.). The biological sample may be a solid, a specimen fixed with a fixative such as paraffin, or a solid formed by freezing. The biological sample can be a section of the solid. A specific example of the biological sample is a section of a biopsy sample.
前記生体由来試料は、染色又は標識などの処理が施されたものであってよい。当該処理は、生体成分の形態を示すための又は生体成分が有する物質(表面抗原など)を示すための染色であってよく、HE(Hematoxylin-Eosin)染色、免疫組織化学(Immunohistochemistry)染色を挙げることができる。前記生体由来試料は、1又は2以上の試薬により前記処理が施されたものであってよく、当該試薬は、蛍光色素、発色試薬、蛍光タンパク質、又は蛍光標識抗体でありうる。
The biological sample may be one that has undergone processing such as staining or labeling. The treatment may be staining for indicating the morphology of biological components or for indicating substances (surface antigens, etc.) possessed by biological components, examples of which include HE (Hematoxylin-Eosin) staining and immunohistochemistry staining. be able to. The biological sample may be treated with one or more reagents, and the reagents may be fluorescent dyes, chromogenic reagents, fluorescent proteins, or fluorescently labeled antibodies.
前記標本は、組織サンプルから病理診断または臨床検査などを目的に作製されたものであってよい。また、前記標本は、人体に限らず、動物、植物、又は他の材料に由来するものであってもよい。前記標本は、使用される組織(例えば臓器または細胞など)の種類、対象となる疾病の種類、対象者の属性(例えば、年齢、性別、血液型、または人種など)、または対象者の生活習慣(例えば、食生活、運動習慣、または喫煙習慣など)などにより性質が異なる。前記標本は、各標本それぞれ識別可能な識別情報(バーコード又はQRコード(登録商標)等)を付されて管理されてよい。
The specimen may be one prepared from a tissue sample for the purpose of pathological diagnosis or clinical examination. Moreover, the specimen is not limited to the human body, and may be derived from animals, plants, or other materials. The specimen may be the type of tissue used (such as an organ or cell), the type of target disease, the subject's attributes (such as age, sex, blood type, or race), or the subject's lifestyle. The properties differ depending on habits (for example, eating habits, exercise habits, smoking habits, etc.). The specimens may be managed with identification information (bar code, QR code (registered trademark), etc.) that allows each specimen to be identified.
(光照射部)
光照射部5101は、生体由来試料Sを照明するための光源、および光源から照射された光を標本に導く光学部である。光源は、可視光、紫外光、若しくは赤外光、又はこれらの組合せを生体由来試料に照射しうる。光源は、ハロゲン光源、レーザ光源、LED光源、水銀光源、及びキセノン光源のうちの1又は2以上であってよい。蛍光観察における光源の種類及び/又は波長は、複数でもよく、当業者により適宜選択されてよい。光照射部は、透過型、反射型又は落射型(同軸落射型若しくは側射型)の構成を有しうる。 (light irradiation part)
Thelight irradiation unit 5101 is a light source for illuminating the biological sample S and an optical unit for guiding the light irradiated from the light source to the specimen. The light source may irradiate the biological sample with visible light, ultraviolet light, or infrared light, or a combination thereof. The light source may be one or more of a halogen light source, a laser light source, an LED light source, a mercury light source, and a xenon light source. A plurality of types and/or wavelengths of light sources may be used in fluorescence observation, and may be appropriately selected by those skilled in the art. The light irradiator may have a transmissive, reflective, or episcopic (coaxial or lateral) configuration.
光照射部5101は、生体由来試料Sを照明するための光源、および光源から照射された光を標本に導く光学部である。光源は、可視光、紫外光、若しくは赤外光、又はこれらの組合せを生体由来試料に照射しうる。光源は、ハロゲン光源、レーザ光源、LED光源、水銀光源、及びキセノン光源のうちの1又は2以上であってよい。蛍光観察における光源の種類及び/又は波長は、複数でもよく、当業者により適宜選択されてよい。光照射部は、透過型、反射型又は落射型(同軸落射型若しくは側射型)の構成を有しうる。 (light irradiation part)
The
(光学部)
光学部5102は、生体由来試料Sからの光を信号取得部5103へと導くように構成される。光学部は、顕微鏡装置5100が生体由来試料Sを観察又は撮像することを可能とするように構成されうる。光学部5102は、対物レンズを含みうる。対物レンズの種類は、観察方式に応じて当業者により適宜選択されてよい。また、光学部は、対物レンズによって拡大された像を信号取得部に中継するためのリレーレンズを含んでもよい。光学部は、前記対物レンズ及び前記リレーレンズ以外の光学部品、接眼レンズ、位相板、及びコンデンサレンズなど、をさらに含みうる。また、光学部5102は、生体由来試料Sからの光のうちから所定の波長を有する光を分離するように構成された波長分離部をさらに含んでよい。波長分離部は、所定の波長又は波長範囲の光を選択的に信号取得部に到達させるように構成されうる。波長分離部は、例えば、光を選択的に透過させるフィルタ、偏光板、プリズム(ウォラストンプリズム)、及び回折格子のうちの1又は2以上を含んでよい。波長分離部に含まれる光学部品は、例えば対物レンズから信号取得部までの光路上に配置されてよい。波長分離部は、蛍光観察が行われる場合、特に励起光照射部を含む場合に、顕微鏡装置内に備えられる。波長分離部は、蛍光同士を互いに分離し又は白色光と蛍光とを分離するように構成されうる。 (Optical part)
Theoptical section 5102 is configured to guide the light from the biological sample S to the signal acquisition section 5103 . The optical section can be configured to allow the microscope device 5100 to observe or image the biological sample S. Optical section 5102 may include an objective lens. The type of objective lens may be appropriately selected by those skilled in the art according to the observation method. Also, the optical section may include a relay lens for relaying the image magnified by the objective lens to the signal acquisition section. The optical unit may further include optical components other than the objective lens and the relay lens, an eyepiece lens, a phase plate, a condenser lens, and the like. In addition, the optical section 5102 may further include a wavelength separation section configured to separate light having a predetermined wavelength from the light from the biological sample S. The wavelength separation section can be configured to selectively allow light of a predetermined wavelength or wavelength range to reach the signal acquisition section. The wavelength separator may include, for example, one or more of a filter that selectively transmits light, a polarizing plate, a prism (Wollaston prism), and a diffraction grating. The optical components included in the wavelength separation section may be arranged, for example, on the optical path from the objective lens to the signal acquisition section. The wavelength separation unit is provided in the microscope apparatus when fluorescence observation is performed, particularly when an excitation light irradiation unit is included. The wavelength separator may be configured to separate fluorescent light from each other or white light and fluorescent light.
光学部5102は、生体由来試料Sからの光を信号取得部5103へと導くように構成される。光学部は、顕微鏡装置5100が生体由来試料Sを観察又は撮像することを可能とするように構成されうる。光学部5102は、対物レンズを含みうる。対物レンズの種類は、観察方式に応じて当業者により適宜選択されてよい。また、光学部は、対物レンズによって拡大された像を信号取得部に中継するためのリレーレンズを含んでもよい。光学部は、前記対物レンズ及び前記リレーレンズ以外の光学部品、接眼レンズ、位相板、及びコンデンサレンズなど、をさらに含みうる。また、光学部5102は、生体由来試料Sからの光のうちから所定の波長を有する光を分離するように構成された波長分離部をさらに含んでよい。波長分離部は、所定の波長又は波長範囲の光を選択的に信号取得部に到達させるように構成されうる。波長分離部は、例えば、光を選択的に透過させるフィルタ、偏光板、プリズム(ウォラストンプリズム)、及び回折格子のうちの1又は2以上を含んでよい。波長分離部に含まれる光学部品は、例えば対物レンズから信号取得部までの光路上に配置されてよい。波長分離部は、蛍光観察が行われる場合、特に励起光照射部を含む場合に、顕微鏡装置内に備えられる。波長分離部は、蛍光同士を互いに分離し又は白色光と蛍光とを分離するように構成されうる。 (Optical part)
The
(信号取得部)
信号取得部5103は、生体由来試料Sからの光を受光し、当該光を電気信号、特にはデジタル電気信号へと変換することができるように構成されうる。信号取得部は、当該電気信号に基づき、生体由来試料Sに関するデータを取得することができるように構成されてよい。信号取得部は、生体由来試料Sの像(画像、特には静止画像、タイムラプス画像、又は動画像)のデータを取得することができるように構成されてよく、特に光学部によって拡大された画像のデータを取得するように構成されうる。信号取得部は、1次元又は2次元に並んで配列された複数の画素を備えている1つ又は複数の撮像素子、CMOS又はCCDなど、を含む。信号取得部は、低解像度画像取得用の撮像素子と高解像度画像取得用の撮像素子とを含んでよく、又は、AFなどのためのセンシング用撮像素子と観察などのための画像出力用撮像素子とを含んでもよい。撮像素子は、前記複数の画素に加え、各画素からの画素信号を用いた信号処理を行う信号処理部(CPU、DSP、及びメモリのうちの1つ、2以上を含む)、及び、画素信号から生成された画像データ及び信号処理部により生成された処理データの出力の制御を行う出力制御部を含みうる。前記複数の画素、前記信号処理部、及び前記出力制御部を含む撮像素子は、好ましくは1チップの半導体装置として構成されうる。なお、顕微鏡システム5000は、イベント検出センサをさらに具備してもよい。当該イベント検出センサは、入射光を光電変換する画素を含み、当該画素の輝度変化が所定の閾値を超えたことをイベントとして検出するように構成されうる。当該イベント検出センサは、特には非同期型でありうる。 (Signal acquisition part)
Thesignal acquisition unit 5103 can be configured to receive light from the biological sample S and convert the light into an electrical signal, particularly a digital electrical signal. The signal acquisition unit may be configured to acquire data on the biological sample S based on the electrical signal. The signal acquisition unit may be configured to acquire data of an image (image, particularly a still image, a time-lapse image, or a moving image) of the biological sample S, particularly an image magnified by the optical unit. It can be configured to acquire data. The signal acquisition unit includes one or more imaging elements, such as CMOS or CCD, having a plurality of pixels arranged one-dimensionally or two-dimensionally. The signal acquisition unit may include an image sensor for acquiring a low-resolution image and an image sensor for acquiring a high-resolution image, or an image sensor for sensing such as AF and an image sensor for image output for observation. and may include In addition to the plurality of pixels, the image pickup device includes a signal processing unit (including one or more of CPU, DSP, and memory) that performs signal processing using pixel signals from each pixel, and pixel signals and an output control unit for controlling the output of the image data generated from and the processed data generated by the signal processing unit. An imaging device including the plurality of pixels, the signal processing section, and the output control section may preferably be configured as a one-chip semiconductor device. Note that the microscope system 5000 may further include an event detection sensor. The event detection sensor includes a pixel that photoelectrically converts incident light, and can be configured to detect, as an event, a change in luminance of the pixel exceeding a predetermined threshold. The event detection sensor can in particular be asynchronous.
信号取得部5103は、生体由来試料Sからの光を受光し、当該光を電気信号、特にはデジタル電気信号へと変換することができるように構成されうる。信号取得部は、当該電気信号に基づき、生体由来試料Sに関するデータを取得することができるように構成されてよい。信号取得部は、生体由来試料Sの像(画像、特には静止画像、タイムラプス画像、又は動画像)のデータを取得することができるように構成されてよく、特に光学部によって拡大された画像のデータを取得するように構成されうる。信号取得部は、1次元又は2次元に並んで配列された複数の画素を備えている1つ又は複数の撮像素子、CMOS又はCCDなど、を含む。信号取得部は、低解像度画像取得用の撮像素子と高解像度画像取得用の撮像素子とを含んでよく、又は、AFなどのためのセンシング用撮像素子と観察などのための画像出力用撮像素子とを含んでもよい。撮像素子は、前記複数の画素に加え、各画素からの画素信号を用いた信号処理を行う信号処理部(CPU、DSP、及びメモリのうちの1つ、2以上を含む)、及び、画素信号から生成された画像データ及び信号処理部により生成された処理データの出力の制御を行う出力制御部を含みうる。前記複数の画素、前記信号処理部、及び前記出力制御部を含む撮像素子は、好ましくは1チップの半導体装置として構成されうる。なお、顕微鏡システム5000は、イベント検出センサをさらに具備してもよい。当該イベント検出センサは、入射光を光電変換する画素を含み、当該画素の輝度変化が所定の閾値を超えたことをイベントとして検出するように構成されうる。当該イベント検出センサは、特には非同期型でありうる。 (Signal acquisition part)
The
(制御部)
制御部5110は、顕微鏡装置5100による撮像を制御する。制御部は、撮像制御のために、光学部5102及び/又は試料載置部5104の移動を駆動して、光学部と試料載置部との間の位置関係を調節しうる。制御部5110は、光学部及び/又は試料載置部を、互いに近づく又は離れる方向(例えば対物レンズの光軸方向)に移動させうる。また、制御部は、光学部及び/又は試料載置部を、前記光軸方向と垂直な面におけるいずれかの方向に移動させてもよい。制御部は、撮像制御のために、光照射部5101及び/又は信号取得部5103を制御してもよい。 (control part)
Thecontrol unit 5110 controls imaging by the microscope device 5100 . For imaging control, the control unit can drive the movement of the optical unit 5102 and/or the sample placement unit 5104 to adjust the positional relationship between the optical unit and the sample placement unit. The control unit 5110 can move the optical unit and/or the sample placement unit in a direction toward or away from each other (for example, the optical axis direction of the objective lens). Further, the control section may move the optical section and/or the sample placement section in any direction on a plane perpendicular to the optical axis direction. The control unit may control the light irradiation unit 5101 and/or the signal acquisition unit 5103 for imaging control.
制御部5110は、顕微鏡装置5100による撮像を制御する。制御部は、撮像制御のために、光学部5102及び/又は試料載置部5104の移動を駆動して、光学部と試料載置部との間の位置関係を調節しうる。制御部5110は、光学部及び/又は試料載置部を、互いに近づく又は離れる方向(例えば対物レンズの光軸方向)に移動させうる。また、制御部は、光学部及び/又は試料載置部を、前記光軸方向と垂直な面におけるいずれかの方向に移動させてもよい。制御部は、撮像制御のために、光照射部5101及び/又は信号取得部5103を制御してもよい。 (control part)
The
(試料載置部)
試料載置部5104は、生体由来試料の試料載置部上における位置が固定できるように構成されてよく、いわゆるステージであってよい。試料載置部5104は、生体由来試料の位置を、対物レンズの光軸方向及び/又は当該光軸方向と垂直な方向に移動させることができるように構成されうる。 (Sample placement section)
Thesample mounting section 5104 may be configured such that the position of the biological sample on the sample mounting section can be fixed, and may be a so-called stage. The sample mounting section 5104 can be configured to move the position of the biological sample in the optical axis direction of the objective lens and/or in a direction perpendicular to the optical axis direction.
試料載置部5104は、生体由来試料の試料載置部上における位置が固定できるように構成されてよく、いわゆるステージであってよい。試料載置部5104は、生体由来試料の位置を、対物レンズの光軸方向及び/又は当該光軸方向と垂直な方向に移動させることができるように構成されうる。 (Sample placement section)
The
(情報処理部)
情報処理部5120は、顕微鏡装置5100が取得したデータ(撮像データなど)を、顕微鏡装置5100から取得しうる。情報処理部は、撮像データに対する画像処理を実行しうる。当該画像処理は、アンミキシング処理、特にはスペクトラルアンミキシング処理を含んでよい。当該アンミキシング処理は、撮像データから所定の波長又は波長範囲の光成分のデータを抽出して画像データを生成する処理、又は、撮像データから所定の波長又は波長範囲の光成分のデータを除去する処理などを含みうる。また、当該画像処理は、組織切片の自家蛍光成分と色素成分を分離する自家蛍光分離処理や互いに蛍光波長が異なる色素間の波長を分離する蛍光分離処理を含みうる。前記自家蛍光分離処理では、同一ないし性質が類似する前記複数の標本のうち、一方から抽出された自家蛍光シグナルを用いて他方の標本の画像情報から自家蛍光成分を除去する処理を行ってもよい。情報処理部5120は、制御部5110に撮像制御のためのデータを送信してよく、当該データを受信した制御部5110が、当該データに従い顕微鏡装置5100による撮像を制御してもよい。 (Information processing department)
The information processing section 5120 can acquire data (such as imaging data) acquired by themicroscope device 5100 from the microscope device 5100 . The information processing section can perform image processing on the imaging data. The image processing may include an unmixing process, in particular a spectral unmixing process. The unmixing process is a process of extracting data of light components of a predetermined wavelength or wavelength range from the imaging data to generate image data, or removing data of light components of a predetermined wavelength or wavelength range from the imaging data. It can include processing and the like. Further, the image processing may include autofluorescence separation processing for separating the autofluorescence component and dye component of the tissue section, and fluorescence separation processing for separating the wavelengths between dyes having different fluorescence wavelengths. In the autofluorescence separation processing, out of the plurality of specimens having the same or similar properties, autofluorescence signals extracted from one may be used to remove autofluorescence components from image information of the other specimen. . The information processing section 5120 may transmit data for imaging control to the control section 5110, and the control section 5110 receiving the data may control imaging by the microscope apparatus 5100 according to the data.
情報処理部5120は、顕微鏡装置5100が取得したデータ(撮像データなど)を、顕微鏡装置5100から取得しうる。情報処理部は、撮像データに対する画像処理を実行しうる。当該画像処理は、アンミキシング処理、特にはスペクトラルアンミキシング処理を含んでよい。当該アンミキシング処理は、撮像データから所定の波長又は波長範囲の光成分のデータを抽出して画像データを生成する処理、又は、撮像データから所定の波長又は波長範囲の光成分のデータを除去する処理などを含みうる。また、当該画像処理は、組織切片の自家蛍光成分と色素成分を分離する自家蛍光分離処理や互いに蛍光波長が異なる色素間の波長を分離する蛍光分離処理を含みうる。前記自家蛍光分離処理では、同一ないし性質が類似する前記複数の標本のうち、一方から抽出された自家蛍光シグナルを用いて他方の標本の画像情報から自家蛍光成分を除去する処理を行ってもよい。情報処理部5120は、制御部5110に撮像制御のためのデータを送信してよく、当該データを受信した制御部5110が、当該データに従い顕微鏡装置5100による撮像を制御してもよい。 (Information processing department)
The information processing section 5120 can acquire data (such as imaging data) acquired by the
情報処理部5120は、汎用のコンピュータなどの情報処理装置として構成されてよく、CPU、RAM、及びROMを備えていてよい。情報処理部は、顕微鏡装置5100の筐体内に含まれていてよく、又は、当該筐体の外にあってもよい。また、情報処理部による各種処理又は機能は、ネットワークを介して接続されたサーバコンピュータ又はクラウドにより実現されてもよい。
The information processing section 5120 may be configured as an information processing device such as a general-purpose computer, and may include a CPU, RAM, and ROM. The information processing section may be included in the housing of the microscope device 5100 or may be outside the housing. Also, various processes or functions by the information processing unit may be realized by a server computer or cloud connected via a network.
顕微鏡装置5100による生体由来試料Sの撮像の方式は、生体由来試料の種類及び撮像の目的などに応じて、当業者により適宜選択されてよい。当該撮像方式の例を以下に説明する。
A method of imaging the biological sample S by the microscope device 5100 may be appropriately selected by a person skilled in the art according to the type of the biological sample and the purpose of imaging. An example of the imaging method will be described below.
撮像方式の一つの例は以下のとおりである。顕微鏡装置は、まず、撮像対象領域を特定しうる。当該撮像対象領域は、生体由来試料が存在する領域全体をカバーするように特定されてよく、又は、生体由来試料のうちの目的部分(目的組織切片、目的細胞、又は目的病変部が存在する部分)をカバーするように特定されてもよい。次に、顕微鏡装置は、当該撮像対象領域を、所定サイズの複数の分割領域へと分割し、顕微鏡装置は各分割領域を順次撮像する。これにより、各分割領域の画像が取得される。
An example of the imaging method is as follows. The microscope device can first identify an imaging target region. The imaging target region may be specified so as to cover the entire region where the biological sample exists, or a target portion (target tissue section, target cell, or target lesion portion) of the biological sample. ) may be specified to cover Next, the microscope device divides the imaging target region into a plurality of divided regions of a predetermined size, and the microscope device sequentially images each divided region. As a result, an image of each divided area is obtained.
図23に示されるように、顕微鏡装置は、生体由来試料S全体をカバーする撮像対象領域Rを特定する。そして、顕微鏡装置は、撮像対象領域Rを16の分割領域へと分割する。そして、顕微鏡装置は分割領域R1の撮像を行い、そして次に、その分割領域R1に隣接する領域など、撮像対象領域Rに含まれる領域の内いずれか領域を撮像しうる。そして、未撮像の分割領域がなくなるまで、分割領域の撮像が行われる。なお、撮像対象領域R以外の領域についても、分割領域の撮像画像情報に基づき、撮像しても良い。或る分割領域を撮像した後に次の分割領域を撮像するために、顕微鏡装置と試料載置部との位置関係が調整される。当該調整は、顕微鏡装置の移動、試料載置部の移動、又は、これらの両方の移動により行われてよい。この例において、各分割領域の撮像を行う撮像装置は、2次元撮像素子(エリアセンサ)又は1次元撮像素子(ラインセンサ)であってよい。信号取得部は、光学部を介して各分割領域を撮像してよい。また、各分割領域の撮像は、顕微鏡装置及び/又は試料載置部を移動させながら連続的に行われてよく、又は、各分割領域の撮像に際して顕微鏡装置及び/又は試料載置部の移動が停止されてもよい。各分割領域の一部が重なり合うように、前記撮像対象領域の分割が行われてよく、又は、重なり合わないように前記撮像対象領域の分割が行われてもよい。各分割領域は、焦点距離及び/又は露光時間などの撮像条件を変えて複数回撮像されてもよい。また、情報処理装置は、隣り合う複数の分割領域をスティッチングして、より広い領域の画像データを生成しうる。当該スティッチング処理を、撮像対象領域全体にわたって行うことで、撮像対象領域について、より広い領域の画像を取得することができる。また、分割領域の画像、またはスティッチング処理を行った画像から、より解像度の低い画像データを生成しうる。
As shown in FIG. 23, the microscope device specifies an imaging target region R that covers the entire biological sample S. Then, the microscope device divides the imaging target region R into 16 divided regions. The microscope device can then image the segmented region R1, and then image any region included in the imaging target region R, such as a region adjacent to the segmented region R1. Then, image capturing of the divided areas is performed until there are no unimaged divided areas. Areas other than the imaging target area R may also be imaged based on the captured image information of the divided areas. After imaging a certain divided area, the positional relationship between the microscope device and the sample mounting section is adjusted in order to image the next divided area. The adjustment may be performed by moving the microscope device, moving the sample placement unit, or moving both of them. In this example, the image capturing device that captures each divided area may be a two-dimensional image sensor (area sensor) or a one-dimensional image sensor (line sensor). The signal acquisition section may capture an image of each divided area via the optical section. Further, the imaging of each divided area may be performed continuously while moving the microscope device and/or the sample mounting section, or the movement of the microscope apparatus and/or the sample mounting section may be performed when imaging each divided area. may be stopped. The imaging target area may be divided so that the divided areas partially overlap each other, or the imaging target area may be divided so that the divided areas do not overlap. Each divided area may be imaged multiple times by changing imaging conditions such as focal length and/or exposure time. Also, the information processing apparatus can stitch a plurality of adjacent divided areas to generate image data of a wider area. By performing the stitching process over the entire imaging target area, it is possible to obtain an image of a wider area of the imaging target area. Also, image data with lower resolution can be generated from the image of the divided area or the image subjected to the stitching process.
撮像方式の他の例は以下のとおりである。顕微鏡装置は、まず、撮像対象領域を特定しうる。当該撮像対象領域は、生体由来試料が存在する領域全体をカバーするように特定されてよく、又は、生体由来試料のうちの目的部分(目的組織切片又は目的細胞が存在する部分)をカバーするように特定されてもよい。次に、顕微鏡装置は、撮像対象領域の一部の領域(「分割スキャン領域」ともいう)を、光軸と垂直な面内における一つの方向(「スキャン方向」ともいう)へスキャンして撮像する。当該分割スキャン領域のスキャンが完了したら、次に、前記スキャン領域の隣の分割スキャン領域を、スキャンする。これらのスキャン動作が、撮像対象領域全体が撮像されるまで繰り返される。図24に示されるように、顕微鏡装置は、生体由来試料Sのうち、組織切片が存在する領域(グレーの部分)を撮像対象領域Saとして特定する。そして、顕微鏡装置は、撮像対象領域Saのうち、分割スキャン領域Rsを、Y軸方向へスキャンする。顕微鏡装置は、分割スキャン領域Rsのスキャンが完了したら、次に、X軸方向における隣の分割スキャン領域をスキャンする。撮像対象領域Saの全てについてスキャンが完了するまで、この動作が繰り返しされる。各分割スキャン領域のスキャンのために、及び、或る分割スキャン領域を撮像した後に次の分割スキャン領域を撮像するために、顕微鏡装置と試料載置部との位置関係が調整される。当該調整は、顕微鏡装置の移動、試料載置部の移動、又は、これらの両方の移動により行われてよい。この例において、各分割スキャン領域の撮像を行う撮像装置は、1次元撮像素子(ラインセンサ)又は2次元撮像素子(エリアセンサ)であってよい。信号取得部は、拡大光学系を介して各分割領域を撮像してよい。また、各分割スキャン領域の撮像は、顕微鏡装置及び/又は試料載置部を移動させながら連続的に行われてよい。各分割スキャン領域の一部が重なり合うように、前記撮像対象領域の分割が行われてよく、又は、重なり合わないように前記撮像対象領域の分割が行われてもよい。各分割スキャン領域は、焦点距離及び/又は露光時間などの撮像条件を変えて複数回撮像されてもよい。また、情報処理装置は、隣り合う複数の分割スキャン領域をスティッチングして、より広い領域の画像データを生成しうる。当該スティッチング処理を、撮像対象領域全体にわたって行うことで、撮像対象領域について、より広い領域の画像を取得することができる。また、分割スキャン領域の画像、またはスティッチング処理を行った画像から、より解像度の低い画像データを生成しうる。
Other examples of imaging methods are as follows. The microscope device can first identify an imaging target region. The imaging target region may be specified so as to cover the entire region where the biological sample exists, or the target portion (target tissue section or target cell-containing portion) of the biological sample. may be specified. Next, the microscope device scans a part of the imaging target area (also referred to as a "divided scan area") in one direction (also referred to as a "scanning direction") in a plane perpendicular to the optical axis to capture an image. do. After the scanning of the divided scan area is completed, the next divided scan area next to the scan area is scanned. These scanning operations are repeated until the entire imaging target area is imaged. As shown in FIG. 24 , the microscope device identifies a region (gray portion) in which a tissue section exists in the biological sample S as an imaging target region Sa. Then, the microscope device scans the divided scan area Rs in the imaging target area Sa in the Y-axis direction. After completing the scanning of the divided scan region Rs, the microscope device scans the next divided scan region in the X-axis direction. This operation is repeated until scanning is completed for the entire imaging target area Sa. The positional relationship between the microscope device and the sample placement section is adjusted for scanning each divided scan area and for imaging the next divided scan area after imaging a certain divided scan area. The adjustment may be performed by moving the microscope device, moving the sample placement unit, or moving both of them. In this example, the imaging device that captures each divided scan area may be a one-dimensional imaging device (line sensor) or a two-dimensional imaging device (area sensor). The signal acquisition section may capture an image of each divided area via an enlarging optical system. Also, the imaging of each divided scan area may be performed continuously while moving the microscope device and/or the sample placement unit. The imaging target area may be divided so that the divided scan areas partially overlap each other, or the imaging target area may be divided so that the divided scan areas do not overlap. Each divided scan area may be imaged multiple times by changing imaging conditions such as focal length and/or exposure time. Also, the information processing apparatus can stitch a plurality of adjacent divided scan areas to generate image data of a wider area. By performing the stitching process over the entire imaging target area, it is possible to obtain an image of a wider area of the imaging target area. In addition, image data with lower resolution can be generated from images of divided scan regions or images subjected to stitching processing.
<5.ハードウェアの構成例>
各実施形態(又は各変形例)に係る情報処理装置100のハードウェアの構成例について図25を参照して説明する。図25は、情報処理装置100のハードウェアの概略構成の一例を示すブロック図である。情報処理装置100による各種処理は、例えば、ソフトウェアと、以下に説明するハードウェアとの協働により実現される。 <5. Hardware configuration example>
A hardware configuration example of theinformation processing apparatus 100 according to each embodiment (or each modification) will be described with reference to FIG. 25 . FIG. 25 is a block diagram showing an example of a schematic hardware configuration of the information processing apparatus 100. As shown in FIG. Various types of processing by the information processing apparatus 100 are realized by, for example, cooperation between software and hardware described below.
各実施形態(又は各変形例)に係る情報処理装置100のハードウェアの構成例について図25を参照して説明する。図25は、情報処理装置100のハードウェアの概略構成の一例を示すブロック図である。情報処理装置100による各種処理は、例えば、ソフトウェアと、以下に説明するハードウェアとの協働により実現される。 <5. Hardware configuration example>
A hardware configuration example of the
図25に示すように、情報処理装置100は、CPU(Central Processing Unit)901、ROM(Read Only Memory)902、RAM(Random Access Memory)903及びホストバス904aを備える。また、情報処理装置100は、ブリッジ904、外部バス904b、インタフェース905、入力装置906、出力装置907、ストレージ装置908、ドライブ909、接続ポート911、通信装置913及びセンサ915を備える。情報処理装置100は、CPU901に代えて、又はこれとともに、DSP若しくはASICなどの処理回路を有してもよい。
As shown in FIG. 25, the information processing apparatus 100 includes a CPU (Central Processing Unit) 901, a ROM (Read Only Memory) 902, a RAM (Random Access Memory) 903, and a host bus 904a. The information processing apparatus 100 also includes a bridge 904 , an external bus 904 b , an interface 905 , an input device 906 , an output device 907 , a storage device 908 , a drive 909 , a connection port 911 , a communication device 913 and a sensor 915 . The information processing apparatus 100 may have a processing circuit such as a DSP or ASIC in place of or together with the CPU 901 .
CPU901は、演算処理装置および制御装置として機能し、各種プログラムに従って情報処理装置100内の動作全般を制御する。また、CPU901は、マイクロプロセッサであってもよい。ROM902は、CPU901が使用するプログラムや演算パラメータ等を記憶する。RAM903は、CPU901の実行において使用するプログラムや、その実行において適宜変化するパラメータ等を一時記憶する。CPU901は、例えば、情報処理装置100の少なくとも処理部130及び制御部150を具現し得る。
The CPU 901 functions as an arithmetic processing device and a control device, and controls general operations within the information processing device 100 according to various programs. Alternatively, the CPU 901 may be a microprocessor. The ROM 902 stores programs, calculation parameters, and the like used by the CPU 901 . The RAM 903 temporarily stores programs used in the execution of the CPU 901, parameters that change as appropriate during the execution, and the like. The CPU 901 can embody at least the processing unit 130 and the control unit 150 of the information processing apparatus 100, for example.
CPU901、ROM902及びRAM903は、CPUバスなどを含むホストバス904aにより相互に接続されている。ホストバス904aは、ブリッジ904を介して、PCI(Peripheral Component Interconnect/Interface)バス等の外部バス904bに接続されている。なお、必ずしもホストバス904a、ブリッジ904および外部バス904bを分離構成する必要はなく、1つのバスにこれらの機能を実装してもよい。
The CPU 901, ROM 902 and RAM 903 are interconnected by a host bus 904a including a CPU bus. The host bus 904a is connected via a bridge 904 to an external bus 904b such as a PCI (Peripheral Component Interconnect/Interface) bus. Note that the host bus 904a, the bridge 904 and the external bus 904b do not necessarily have to be configured separately, and these functions may be implemented in one bus.
入力装置906は、例えば、マウス、キーボード、タッチパネル、ボタン、マイクロフォン、スイッチ及びレバー等、実施者によって情報が入力される装置によって実現される。また、入力装置906は、例えば、赤外線やその他の電波を利用したリモートコントロール装置であってもよいし、情報処理装置100の操作に対応した携帯電話やPDA等の外部接続機器であってもよい。さらに、入力装置906は、例えば、上記の入力手段を用いて実施者により入力された情報に基づいて入力信号を生成し、CPU901に出力する入力制御回路などを含んでいてもよい。実施者は、この入力装置906を操作することにより、情報処理装置100に対して各種のデータを入力したり処理動作を指示したりすることができる。入力装置906は、例えば、情報処理装置100の少なくとも操作部160を具現し得る。
The input device 906 is implemented by a device such as a mouse, keyboard, touch panel, button, microphone, switch, lever, etc., through which information is input by the practitioner. Further, the input device 906 may be, for example, a remote control device using infrared rays or other radio waves, or may be an externally connected device such as a mobile phone or PDA corresponding to the operation of the information processing device 100. . Furthermore, the input device 906 may include, for example, an input control circuit that generates an input signal based on information input by the practitioner using the above input means and outputs the signal to the CPU 901 . By operating the input device 906, the practitioner can input various data to the information processing apparatus 100 and instruct processing operations. The input device 906 can embody at least the operation unit 160 of the information processing device 100, for example.
出力装置907は、取得した情報を実施者に対して視覚的又は聴覚的に通知することが可能な装置で形成される。このような装置として、CRTディスプレイ装置、液晶ディスプレイ装置、プラズマディスプレイ装置、ELディスプレイ装置及びランプ等の表示装置や、スピーカ及びヘッドホン等の音響出力装置や、プリンタ装置等がある。出力装置907は、例えば、情報処理装置100の少なくとも表示部140を具現し得る。
The output device 907 is formed by a device capable of visually or audibly notifying the practitioner of the acquired information. Such devices include display devices such as CRT display devices, liquid crystal display devices, plasma display devices, EL display devices and lamps, audio output devices such as speakers and headphones, and printer devices. The output device 907 can embody at least the display unit 140 of the information processing device 100, for example.
ストレージ装置908は、データ格納用の装置である。ストレージ装置908は、例えば、HDD等の磁気記憶部デバイス、半導体記憶デバイス、光記憶デバイス又は光磁気記憶デバイス等により実現される。ストレージ装置908は、記憶媒体、記憶媒体にデータを記録する記録装置、記憶媒体からデータを読み出す読出し装置および記憶媒体に記録されたデータを削除する削除装置などを含んでもよい。このストレージ装置908は、CPU901が実行するプログラムや各種データ及び外部から取得した各種のデータ等を格納する。ストレージ装置908は、例えば、情報処理装置100の少なくとも保存部120を具現し得る。
The storage device 908 is a device for storing data. The storage device 908 is implemented by, for example, a magnetic storage device such as an HDD, a semiconductor storage device, an optical storage device, a magneto-optical storage device, or the like. The storage device 908 may include a storage medium, a recording device that records data on the storage medium, a reading device that reads data from the storage medium, a deletion device that deletes data recorded on the storage medium, and the like. The storage device 908 stores programs executed by the CPU 901, various data, and various data acquired from the outside. The storage device 908 can embody at least the storage unit 120 of the information processing device 100, for example.
ドライブ909は、記憶媒体用リーダライタであり、情報処理装置100に内蔵、あるいは外付けされる。ドライブ909は、装着されている磁気ディスク、光ディスク、光磁気ディスク、または半導体メモリ等のリムーバブル記憶媒体に記録されている情報を読み出して、RAM903に出力する。また、ドライブ909は、リムーバブル記憶媒体に情報を書き込むこともできる。
The drive 909 is a reader/writer for storage media, and is built in or externally attached to the information processing apparatus 100 . The drive 909 reads out information recorded on a removable storage medium such as a mounted magnetic disk, optical disk, magneto-optical disk, or semiconductor memory, and outputs the information to the RAM 903 . Drive 909 can also write information to a removable storage medium.
接続ポート911は、外部機器と接続されるインタフェースであって、例えばUSB(Universal Serial Bus)などによりデータ伝送可能な外部機器との接続口である。
The connection port 911 is an interface connected to an external device, and is a connection port with an external device capable of data transmission by, for example, USB (Universal Serial Bus).
通信装置913は、例えば、ネットワーク920に接続するための通信デバイス等で形成された通信インタフェースである。通信装置913は、例えば、有線若しくは無線LAN(Local Area Network)、LTE(Long Term Evolution)、Bluetooth(登録商標)又はWUSB(Wireless USB)用の通信カード等である。また、通信装置913は、光通信用のルータ、ADSL(Asymmetric Digital Subscriber Line)用のルータ又は各種通信用のモデム等であってもよい。この通信装置913は、例えば、インターネットや他の通信機器との間で、例えばTCP/IP等の所定のプロトコルに則して信号等を送受信することができる。
The communication device 913 is, for example, a communication interface formed by a communication device or the like for connecting to the network 920 . The communication device 913 is, for example, a communication card for wired or wireless LAN (Local Area Network), LTE (Long Term Evolution), Bluetooth (registered trademark), or WUSB (Wireless USB). Also, the communication device 913 may be a router for optical communication, a router for ADSL (Asymmetric Digital Subscriber Line), a modem for various types of communication, or the like. This communication device 913 can transmit and receive signals and the like to and from the Internet and other communication devices, for example, according to a predetermined protocol such as TCP/IP.
センサ915は、本実施形態においては、スペクトルを取得可能なセンサ(例えば、撮像素子等)を含むところ、他のセンサ(例えば、加速度センサ、ジャイロセンサ、地磁気センサ、感圧センサ、音センサ、または測距センサ等)を含んでもよい。センサ915は、例えば、情報処理装置100の少なくとも画像取得部112を具現し得る。
The sensor 915 in this embodiment includes a sensor capable of acquiring a spectrum (e.g., an imaging device, etc.), other sensors (e.g., acceleration sensor, gyro sensor, geomagnetic sensor, pressure sensor, sound sensor, or range sensor, etc.). The sensor 915 may embody at least the image acquisition unit 112 of the information processing device 100, for example.
なお、ネットワーク920は、ネットワーク920に接続されている装置から送信される情報の有線、または無線の伝送路である。例えば、ネットワーク920は、インターネット、電話回線網、衛星通信網などの公衆回線網や、Ethernet(登録商標)を含む各種のLAN(Local Area Network)、WAN(Wide Area Network)などを含んでもよい。また、ネットワーク920は、IP-VPN(Internet Protocol-Virtual Private Network)などの専用回線網を含んでもよい。
Note that the network 920 is a wired or wireless transmission path for information transmitted from devices connected to the network 920 . For example, the network 920 may include a public network such as the Internet, a telephone network, a satellite communication network, various LANs (Local Area Networks) including Ethernet (registered trademark), WANs (Wide Area Networks), and the like. Network 920 may also include a dedicated line network such as IP-VPN (Internet Protocol-Virtual Private Network).
以上、情報処理装置100の機能を実現可能なハードウェア構成例を示した。上記の各構成要素は、汎用的な部材を用いて実現されていてもよいし、各構成要素の機能に特化したハードウェアにより実現されていてもよい。従って、本開示を実施する時々の技術レベルに応じて、適宜、利用するハードウェア構成を変更することが可能である。
A hardware configuration example capable of realizing the functions of the information processing apparatus 100 has been shown above. Each component described above may be implemented using general-purpose members, or may be implemented by hardware specialized for the function of each component. Therefore, it is possible to appropriately change the hardware configuration to be used according to the technical level at which the present disclosure is implemented.
なお、上記のような情報処理装置100の各機能を実現するためのコンピュータプログラムを作製し、PC等に実装することが可能である。また、このようなコンピュータプログラムが格納された、コンピュータで読み取り可能な記録媒体も提供することができる。記録媒体は、例えば、磁気ディスク、光ディスク、光磁気ディスク、フラッシュメモリ等を含む。また、上記のコンピュータプログラムは、記録媒体を用いずに、例えばネットワークを介して配信されてもよい。
It should be noted that it is possible to create a computer program for realizing each function of the information processing apparatus 100 as described above and implement it in a PC or the like. A computer-readable recording medium storing such a computer program can also be provided. Recording media include, for example, magnetic disks, optical disks, magneto-optical disks, flash memories, and the like. Also, the above computer program may be distributed, for example, via a network without using a recording medium.
<6.付記>
なお、本技術は以下のような構成も取ることができる。
(1)
自家蛍光成分を含む非染色画像と、第一蛍光色素の参照スペクトル及び前記非染色画像の画素毎の撮像ノイズが関連付けられた色素タイル画像とを重畳し、模擬画像を生成する模擬画像生成部と、
前記模擬画像に基づいて、前記第一蛍光色素の成分と前記自家蛍光成分とを分離し、分離画像を生成する蛍光分離部と、
前記分離画像の分離の程度を評価する評価部と、
を備える情報処理装置。
(2)
前記色素タイル画像は、前記第一蛍光色素に加え、第二蛍光色素の参照スペクトルを含み、前記第一蛍光色素及び前記第二蛍光色素の個々の参照スペクトルと前記非染色画像の画素毎の撮像ノイズとが関連付けられた画像である、
上記(1)に記載の情報処理装置。
(3)
前記撮像ノイズは、前記非染色画像の撮像条件に応じて変化するノイズである、
上記(1)又は(2)に記載の情報処理装置。
(4)
前記非染色画像の撮像条件は、レーザーパワー、ゲイン及び露光時間のうち少なくとも1つ又は全てを含む、
上記(3)に記載の情報処理装置。
(5)
前記色素タイル画像は、複数の色素タイルを有する色素タイル群である、
上記(1)から(4)のいずれか一つに記載の情報処理装置。
(6)
前記複数の色素タイルの個々のサイズは、細胞のサイズと同じである、
上記(5)に記載の情報処理装置。
(7)
前記複数の色素タイルは、所定の配色パターンで並ぶように配置されている、
上記(5)又は(6)に記載の情報処理装置。
(8)
前記撮像ノイズの程度は、前記色素タイル毎に定量化又は可視化される、
上記(5)から(7)のいずれか一つに記載の情報処理装置。
(9)
前記模擬画像生成部は、ユーザが指定した色素数分の前記色素タイルを繰り返し配置し、前記色素タイル画像を生成する、
上記(5)から(8)のいずれか一つに記載の情報処理装置。
(10)
前記模擬画像生成部は、複数の色素を混ぜて前記色素タイルを作成する、
上記(5)から(9)のいずれか一つに記載の情報処理装置。
(11)
前記模擬画像生成部は、前記非染色画像の自家蛍光強度に対して付与する色素のスペクトル強度を決定する、
上記(1)から(10)のいずれか一つに記載の情報処理装置。
(12)
前記模擬画像生成部は、前記第一蛍光色素の参照スペクトルに前記撮像ノイズを重畳する、
上記(1)から(11)のいずれか一つに記載の情報処理装置。
(13)
前記撮像ノイズは、ショットノイズである、
上記(12)に記載の情報処理装置。
(14)
前記蛍光分離部は、最小二乗法や重み付最小二乗法、非負値行列因子分解のうち少なくとも一つを含む色分離計算により、前記第一蛍光色素の成分と前記自家蛍光成分を分離する、
上記(1)から(13)のいずれか一つに記載の情報処理装置。
(15)
前記評価部は、
前記分離画像からヒストグラムを生成し、
前記ヒストグラムから色素と色素以外との信号分離値を算出し、
前記信号分離値に基づいて前記分離の程度を評価する、
上記(1)から(14)のいずれか一つに記載の情報処理装置。
(16)
前記分離の程度に基づいて、ユーザが指定した色素に対応する最適な試薬を推奨する推奨部をさらに備える、
上記(1)から(15)のいずれか一つに記載の情報処理装置。
(17)
前記推奨部は、色素の組み合わせ又は色素と前記試薬との組み合わせを示す画像を生成する、
上記(16)に記載の情報処理装置。
(18)
前記推奨部は、抗体及び色素の組み合わせを示す画像を生成する、
上記(16)に記載の情報処理装置。
(19)
自家蛍光成分を含む非染色画像を取得する撮像装置と、
前記非染色画像を処理する情報処理装置と、
を備え、
前記情報処理装置は、
前記非染色画像と、第一蛍光色素の参照スペクトル及び前記非染色画像の画素毎の撮像ノイズが関連付けられた色素タイル画像とを重畳し、模擬画像を生成する模擬画像生成部と、
前記模擬画像に基づいて、前記第一蛍光色素の成分と前記自家蛍光成分とを分離し、分離画像を生成する蛍光分離部と、
前記分離画像の分離の程度を評価する評価部と、
を有する生体試料観察システム。
(20)
自家蛍光成分を含む非染色画像と、第一蛍光色素の参照スペクトル及び前記非染色画像の画素毎の撮像ノイズが関連付けられた色素タイル画像とを重畳し、模擬画像を生成することを含む画像生成方法。
(21)
上記(1)から(18)のいずれか一つに記載の情報処理装置を備える生体試料観察システム。
(22)
上記(1)から(18)のいずれか一つに記載の情報処理装置により画像を生成する画像生成方法。 <6. Note>
Note that the present technology can also take the following configuration.
(1)
a simulated image generation unit that superimposes an unstained image containing an autofluorescent component and a dye tile image associated with a reference spectrum of a first fluorescent dye and imaging noise for each pixel of the unstained image to generate a simulated image; ,
a fluorescence separation unit that separates the component of the first fluorescent dye and the autofluorescence component based on the simulated image to generate a separated image;
an evaluation unit that evaluates the degree of separation of the separated image;
Information processing device.
(2)
The dye tile image includes a reference spectrum of a second fluorochrome in addition to the first fluorochrome, and a pixel-by-pixel imaging of the individual reference spectra of the first fluorochrome and the second fluorochrome and the unstained image. is an image associated with noise,
The information processing apparatus according to (1) above.
(3)
The imaging noise is noise that changes according to the imaging conditions of the unstained image.
The information processing apparatus according to (1) or (2) above.
(4)
The imaging conditions for the non-stained image include at least one or all of laser power, gain and exposure time,
The information processing device according to (3) above.
(5)
wherein the dye tile image is a dye tile group having a plurality of dye tiles;
The information processing apparatus according to any one of (1) to (4) above.
(6)
the individual size of the plurality of dye tiles is the same as the size of a cell;
The information processing apparatus according to (5) above.
(7)
The plurality of pigment tiles are arranged in a predetermined color scheme pattern,
The information processing apparatus according to (5) or (6) above.
(8)
the degree of imaging noise is quantified or visualized for each dye tile;
The information processing apparatus according to any one of (5) to (7) above.
(9)
The simulated image generation unit repeatedly arranges the pigment tiles for the number of pigments specified by the user to generate the pigment tile image.
The information processing apparatus according to any one of (5) to (8) above.
(10)
The simulated image generation unit creates the dye tile by mixing multiple dyes.
The information processing apparatus according to any one of (5) to (9) above.
(11)
The simulated image generation unit determines the spectral intensity of the dye to be applied to the autofluorescence intensity of the unstained image,
The information processing apparatus according to any one of (1) to (10) above.
(12)
The simulated image generator superimposes the imaging noise on the reference spectrum of the first fluorescent dye.
The information processing apparatus according to any one of (1) to (11) above.
(13)
The imaging noise is shot noise,
The information processing device according to (12) above.
(14)
The fluorescence separation unit separates the first fluorescent dye component and the autofluorescence component by color separation calculation including at least one of a least squares method, a weighted least squares method, and a non-negative matrix factorization.
The information processing apparatus according to any one of (1) to (13) above.
(15)
The evaluation unit
generating a histogram from the separated images;
Calculate the signal separation value between the dye and the non-dye from the histogram,
assessing the degree of separation based on the signal separation value;
The information processing apparatus according to any one of (1) to (14) above.
(16)
Further comprising a recommendation unit that recommends an optimal reagent corresponding to the dye specified by the user based on the degree of separation,
The information processing apparatus according to any one of (1) to (15) above.
(17)
The recommendation unit generates an image showing a combination of dyes or a combination of dyes and the reagent.
The information processing device according to (16) above.
(18)
The recommender generates an image showing the antibody and dye combination.
The information processing device according to (16) above.
(19)
an imaging device that acquires an unstained image containing an autofluorescent component;
an information processing device that processes the unstained image;
with
The information processing device is
a simulated image generator that generates a simulated image by superimposing the unstained image and a dye tile image in which the reference spectrum of the first fluorescent dye and the imaging noise for each pixel of the unstained image are associated;
a fluorescence separation unit that separates the component of the first fluorescent dye and the autofluorescence component based on the simulated image to generate a separated image;
an evaluation unit that evaluates the degree of separation of the separated image;
A biological sample observation system.
(20)
image generation comprising superimposing an unstained image containing an autofluorescence component and a dye tile image associated with a reference spectrum of a first fluorescent dye and imaging noise for each pixel of the unstained image to generate a simulated image; Method.
(21)
A biological sample observation system comprising the information processing device according to any one of (1) to (18) above.
(22)
An image generation method for generating an image by the information processing apparatus according to any one of (1) to (18) above.
1 観察ユニット
2 処理ユニット
3 表示部
10 励起部
10A 蛍光試薬
11A 試薬識別情報
20 ステージ
20A 標本
21 記憶部
21A 標本識別情報
22 データ校正部
23 画像形成部
30 分光イメージング部
30A 蛍光染色標本
40 観察光学系
50 走査機構
60 フォーカス機構
70 非蛍光観察部
80 制御部
100 情報処理装置
110 取得部
111 情報取得部
112 画像取得部
120 保存部
121 情報保存部
122 画像情報保存部
123 解析結果保存部
130 処理部
131 解析部
131a 模擬画像生成部
131b 蛍光分離部
131c 評価部
131d 推奨部
132 画像生成部
140 表示部
150 制御部
160 操作部
200 データベース
500 蛍光観察装置
1311 連結部
1321 色分離部
1321a 第1色分離部
1321b 第2色分離部
1322 スペクトル抽出部
5000 顕微鏡システム
5100 顕微鏡装置
5101 光照射部
5102 光学部
5103 信号取得部
5104 試料載置部
5110 制御部
5120 情報処理部 1observation unit 2 processing unit 3 display unit 10 excitation unit 10A fluorescent reagent 11A reagent identification information 20 stage 20A specimen 21 storage unit 21A specimen identification information 22 data calibration unit 23 image forming unit 30 spectroscopic imaging unit 30A fluorescence-stained specimen 40 observation optical system 50 scanning mechanism 60 focusing mechanism 70 non-fluorescent observation unit 80 control unit 100 information processing device 110 acquisition unit 111 information acquisition unit 112 image acquisition unit 120 storage unit 121 information storage unit 122 image information storage unit 123 analysis result storage unit 130 processing unit 131 Analysis unit 131a Simulated image generation unit 131b Fluorescence separation unit 131c Evaluation unit 131d Recommendation unit 132 Image generation unit 140 Display unit 150 Control unit 160 Operation unit 200 Database 500 Fluorescence observation device 1311 Connection unit 1321 Color separation unit 1321a First color separation unit 1321b Second color separation unit 1322 spectrum extraction unit 5000 microscope system 5100 microscope device 5101 light irradiation unit 5102 optical unit 5103 signal acquisition unit 5104 sample placement unit 5110 control unit 5120 information processing unit
2 処理ユニット
3 表示部
10 励起部
10A 蛍光試薬
11A 試薬識別情報
20 ステージ
20A 標本
21 記憶部
21A 標本識別情報
22 データ校正部
23 画像形成部
30 分光イメージング部
30A 蛍光染色標本
40 観察光学系
50 走査機構
60 フォーカス機構
70 非蛍光観察部
80 制御部
100 情報処理装置
110 取得部
111 情報取得部
112 画像取得部
120 保存部
121 情報保存部
122 画像情報保存部
123 解析結果保存部
130 処理部
131 解析部
131a 模擬画像生成部
131b 蛍光分離部
131c 評価部
131d 推奨部
132 画像生成部
140 表示部
150 制御部
160 操作部
200 データベース
500 蛍光観察装置
1311 連結部
1321 色分離部
1321a 第1色分離部
1321b 第2色分離部
1322 スペクトル抽出部
5000 顕微鏡システム
5100 顕微鏡装置
5101 光照射部
5102 光学部
5103 信号取得部
5104 試料載置部
5110 制御部
5120 情報処理部 1
Claims (20)
- 自家蛍光成分を含む非染色画像と、第一蛍光色素の参照スペクトル及び前記非染色画像の画素毎の撮像ノイズが関連付けられた色素タイル画像とを重畳し、模擬画像を生成する模擬画像生成部と、
前記模擬画像に基づいて、前記第一蛍光色素の成分と前記自家蛍光成分とを分離し、分離画像を生成する蛍光分離部と、
前記分離画像の分離の程度を評価する評価部と、
を備える情報処理装置。 a simulated image generation unit that superimposes an unstained image containing an autofluorescent component and a dye tile image associated with a reference spectrum of a first fluorescent dye and imaging noise for each pixel of the unstained image to generate a simulated image; ,
a fluorescence separation unit that separates the component of the first fluorescent dye and the autofluorescence component based on the simulated image to generate a separated image;
an evaluation unit that evaluates the degree of separation of the separated image;
Information processing device. - 前記色素タイル画像は、前記第一蛍光色素に加え、第二蛍光色素の参照スペクトルを含み、前記第一蛍光色素及び前記第二蛍光色素の個々の参照スペクトルと前記非染色画像の画素毎の撮像ノイズとが関連付けられた画像である、
請求項1に記載の情報処理装置。 The dye tile image includes a reference spectrum of a second fluorochrome in addition to the first fluorochrome, and a pixel-by-pixel imaging of the individual reference spectra of the first fluorochrome and the second fluorochrome and the unstained image. is an image associated with noise,
The information processing device according to claim 1 . - 前記撮像ノイズは、前記非染色画像の撮像条件に応じて変化するノイズである、
請求項1に記載の情報処理装置。 The imaging noise is noise that changes according to the imaging conditions of the unstained image.
The information processing device according to claim 1 . - 前記非染色画像の撮像条件は、レーザーパワー、ゲイン及び露光時間のうち少なくとも1つ又は全てを含む、
請求項3に記載の情報処理装置。 The imaging conditions for the non-stained image include at least one or all of laser power, gain and exposure time,
The information processing apparatus according to claim 3. - 前記色素タイル画像は、複数の色素タイルを有する色素タイル群である、
請求項1に記載の情報処理装置。 wherein the dye tile image is a dye tile group having a plurality of dye tiles;
The information processing device according to claim 1 . - 前記複数の色素タイルの個々のサイズは、細胞のサイズと同じである、
請求項5に記載の情報処理装置。 the individual size of the plurality of dye tiles is the same as the size of a cell;
The information processing device according to claim 5 . - 前記複数の色素タイルは、所定の配色パターンで並ぶように配置されている、
請求項5に記載の情報処理装置。 The plurality of pigment tiles are arranged in a predetermined color scheme pattern,
The information processing device according to claim 5 . - 前記撮像ノイズの程度は、前記色素タイル毎に定量化又は可視化される、
請求項5に記載の情報処理装置。 the degree of imaging noise is quantified or visualized for each dye tile;
The information processing device according to claim 5 . - 前記模擬画像生成部は、ユーザが指定した色素数分の前記色素タイルを繰り返し配置し、前記色素タイル画像を生成する、
請求項5に記載の情報処理装置。 The simulated image generation unit repeatedly arranges the pigment tiles for the number of pigments specified by the user to generate the pigment tile image.
The information processing device according to claim 5 . - 前記模擬画像生成部は、複数の色素を混ぜて前記色素タイルを作成する、
請求項5に記載の情報処理装置。 The simulated image generation unit creates the dye tile by mixing multiple dyes.
The information processing device according to claim 5 . - 前記模擬画像生成部は、前記非染色画像の自家蛍光強度に対して付与する色素のスペクトル強度を決定する、
請求項1に記載の情報処理装置。 The simulated image generation unit determines the spectral intensity of the dye to be applied to the autofluorescence intensity of the unstained image,
The information processing device according to claim 1 . - 前記模擬画像生成部は、前記第一蛍光色素の参照スペクトルに前記撮像ノイズを重畳する、
請求項1に記載の情報処理装置。 The simulated image generator superimposes the imaging noise on the reference spectrum of the first fluorescent dye.
The information processing device according to claim 1 . - 前記撮像ノイズは、ショットノイズである、
請求項12に記載の情報処理装置。 The imaging noise is shot noise,
The information processing apparatus according to claim 12. - 前記蛍光分離部は、最小二乗法や重み付最小二乗法、非負値行列因子分解のうち少なくとも一つを含む色分離計算により、前記第一蛍光色素の成分と前記自家蛍光成分を分離する、
請求項1に記載の情報処理装置。 The fluorescence separation unit separates the first fluorescent dye component and the autofluorescence component by color separation calculation including at least one of a least squares method, a weighted least squares method, and a non-negative matrix factorization.
The information processing device according to claim 1 . - 前記評価部は、
前記分離画像からヒストグラムを生成し、
前記ヒストグラムから色素と色素以外との信号分離値を算出し、
前記信号分離値に基づいて前記分離の程度を評価する、
請求項1に記載の情報処理装置。 The evaluation unit
generating a histogram from the separated images;
Calculate the signal separation value between the dye and the non-dye from the histogram,
assessing the degree of separation based on the signal separation value;
The information processing device according to claim 1 . - 前記分離の程度に基づいて、ユーザが指定した色素に対応する最適な試薬を推奨する推奨部をさらに備える、
請求項1に記載の情報処理装置。 Further comprising a recommendation unit that recommends an optimal reagent corresponding to the dye specified by the user based on the degree of separation,
The information processing device according to claim 1 . - 前記推奨部は、色素の組み合わせ又は色素と前記試薬との組み合わせを示す画像を生成する、
請求項16に記載の情報処理装置。 The recommendation unit generates an image showing a combination of dyes or a combination of dyes and the reagent.
The information processing apparatus according to claim 16. - 前記推奨部は、抗体及び色素の組み合わせを示す画像を生成する、
請求項16に記載の情報処理装置。 The recommender generates an image showing the antibody and dye combination.
The information processing apparatus according to claim 16. - 自家蛍光成分を含む非染色画像を取得する撮像装置と、
前記非染色画像を処理する情報処理装置と、
を備え、
前記情報処理装置は、
前記非染色画像と、第一蛍光色素の参照スペクトル及び前記非染色画像の画素毎の撮像ノイズが関連付けられた色素タイル画像とを重畳し、模擬画像を生成する模擬画像生成部と、
前記模擬画像に基づいて、前記第一蛍光色素の成分と前記自家蛍光成分とを分離し、分離画像を生成する蛍光分離部と、
前記分離画像の分離の程度を評価する評価部と、
を有する生体試料観察システム。 an imaging device that acquires an unstained image containing an autofluorescent component;
an information processing device that processes the unstained image;
with
The information processing device is
a simulated image generator that generates a simulated image by superimposing the unstained image and a dye tile image in which the reference spectrum of the first fluorescent dye and the imaging noise for each pixel of the unstained image are associated;
a fluorescence separation unit that separates the component of the first fluorescent dye and the autofluorescence component based on the simulated image to generate a separated image;
an evaluation unit that evaluates the degree of separation of the separated image;
A biological sample observation system. - 自家蛍光成分を含む非染色画像と、第一蛍光色素の参照スペクトル及び前記非染色画像の画素毎の撮像ノイズが関連付けられた色素タイル画像とを重畳し、模擬画像を生成することを含む画像生成方法。 image generation comprising superimposing an unstained image containing an autofluorescence component and a dye tile image associated with a reference spectrum of a first fluorescent dye and imaging noise for each pixel of the unstained image to generate a simulated image; Method.
Priority Applications (2)
| Application Number | Priority Date | Filing Date | Title |
|---|---|---|---|
| DE112022002756.8T DE112022002756T5 (en) | 2021-05-26 | 2022-02-16 | INFORMATION PROCESSING DEVICE, SYSTEM FOR OBSERVING BIOLOGICAL SAMPLES AND IMAGE FORMATION METHOD |
| JP2023523990A JPWO2022249583A1 (en) | 2021-05-26 | 2022-02-16 |
Applications Claiming Priority (2)
| Application Number | Priority Date | Filing Date | Title |
|---|---|---|---|
| JP2021-088623 | 2021-05-26 | ||
| JP2021088623 | 2021-05-26 |
Publications (1)
| Publication Number | Publication Date |
|---|---|
| WO2022249583A1 true WO2022249583A1 (en) | 2022-12-01 |
Family
ID=84229810
Family Applications (1)
| Application Number | Title | Priority Date | Filing Date |
|---|---|---|---|
| PCT/JP2022/006169 WO2022249583A1 (en) | 2021-05-26 | 2022-02-16 | Information processing device, biological sample observation system, and image generation method |
Country Status (3)
| Country | Link |
|---|---|
| JP (1) | JPWO2022249583A1 (en) |
| DE (1) | DE112022002756T5 (en) |
| WO (1) | WO2022249583A1 (en) |
Citations (4)
| Publication number | Priority date | Publication date | Assignee | Title |
|---|---|---|---|---|
| JP2004112772A (en) * | 2002-08-30 | 2004-04-08 | Fuji Photo Film Co Ltd | Imaging apparatus |
| WO2004042392A1 (en) * | 2002-11-07 | 2004-05-21 | Fujitsu Limited | Image analysis supporting method, image analysis supporting program, and image analysis supporting device |
| JP2018185524A (en) * | 2013-10-09 | 2018-11-22 | ハワード ヒューズ メディカル インスティチュート | Multiview light-sheet microscopy |
| JP2020180976A (en) * | 2014-08-14 | 2020-11-05 | ザ トラスティーズ オブ ザ ユニバーシティ オブ ペンシルバニア | Apparatus and methods for analyzing output of microfluidic devices |
Family Cites Families (1)
| Publication number | Priority date | Publication date | Assignee | Title |
|---|---|---|---|---|
| JP2020020791A (en) | 2018-07-24 | 2020-02-06 | ソニー株式会社 | Information processor, method for processing information, information processing system, and program |
-
2022
- 2022-02-16 JP JP2023523990A patent/JPWO2022249583A1/ja active Pending
- 2022-02-16 WO PCT/JP2022/006169 patent/WO2022249583A1/en active Application Filing
- 2022-02-16 DE DE112022002756.8T patent/DE112022002756T5/en active Pending
Patent Citations (4)
| Publication number | Priority date | Publication date | Assignee | Title |
|---|---|---|---|---|
| JP2004112772A (en) * | 2002-08-30 | 2004-04-08 | Fuji Photo Film Co Ltd | Imaging apparatus |
| WO2004042392A1 (en) * | 2002-11-07 | 2004-05-21 | Fujitsu Limited | Image analysis supporting method, image analysis supporting program, and image analysis supporting device |
| JP2018185524A (en) * | 2013-10-09 | 2018-11-22 | ハワード ヒューズ メディカル インスティチュート | Multiview light-sheet microscopy |
| JP2020180976A (en) * | 2014-08-14 | 2020-11-05 | ザ トラスティーズ オブ ザ ユニバーシティ オブ ペンシルバニア | Apparatus and methods for analyzing output of microfluidic devices |
Also Published As
| Publication number | Publication date |
|---|---|
| DE112022002756T5 (en) | 2024-04-18 |
| JPWO2022249583A1 (en) | 2022-12-01 |
Similar Documents
| Publication | Publication Date | Title |
|---|---|---|
| US11662316B2 (en) | Fluorescence observation apparatus and fluorescence observation method | |
| EP2943761B1 (en) | Multispectral imaging system and methods | |
| JP5540102B2 (en) | Multiple modality contrast and bright field context representation for enhanced pathological determination, and multiple specimen detection in tissues | |
| US10580128B2 (en) | Whole slide multispectral imaging systems and methods | |
| IL272907A (en) | Microscopy of a tissue sample using structured illumination | |
| CN112384787A (en) | Multispectral sample imaging | |
| JP2013092540A5 (en) | ||
| WO2021177004A1 (en) | Microscope device, image acquisition system, and image acquisition method | |
| JP2006317261A (en) | Image processing method and device of scanning cytometer | |
| WO2022004500A1 (en) | Information processing device, information processing method, program, microscope system, and analysis system | |
| CN109863441A (en) | Fluorescence microscope | |
| US11842555B2 (en) | Signal acquisition apparatus, signal acquisition system, and signal acquisition method | |
| WO2022249583A1 (en) | Information processing device, biological sample observation system, and image generation method | |
| WO2023276219A1 (en) | Information processing device, biological sample observation system, and image generation method | |
| WO2023149296A1 (en) | Information processing device, biological sample observation system, and image generation method | |
| WO2023157756A1 (en) | Information processing device, biological sample analysis system, and biological sample analysis method | |
| WO2020239981A1 (en) | Hyperspectral quantitative imaging cytometry system | |
| WO2021183967A1 (en) | High throughput snapshot spectral encoding device for fluorescence spectral microscopy | |
| WO2023157755A1 (en) | Information processing device, biological specimen analysis system, and biological specimen analysis method | |
| WO2023189393A1 (en) | Biological sample observation system, information processing device, and image generation method | |
| US11971355B2 (en) | Fluorescence observation apparatus and fluorescence observation method | |
| WO2023248954A1 (en) | Biological specimen observation system, biological specimen observation method, and dataset creation method | |
| WO2022075040A1 (en) | Image generation system, microscope system, and image generation method | |
| WO2022080189A1 (en) | Biological specimen detection system, microscope system, fluorescence microscope system, biological specimen detection method, and program | |
| Rana | Integration of hyperspectral imaging system for optimized data acquisition and control to revolutionize pathology applications |
Legal Events
| Date | Code | Title | Description |
|---|---|---|---|
| 121 | Ep: the epo has been informed by wipo that ep was designated in this application |
Ref document number: 22810867 Country of ref document: EP Kind code of ref document: A1 |
|
| WWE | Wipo information: entry into national phase |
Ref document number: 2023523990 Country of ref document: JP |
|
| WWE | Wipo information: entry into national phase |
Ref document number: 112022002756 Country of ref document: DE |