WO2022230282A1 - Automatic analysis device - Google Patents
Automatic analysis device Download PDFInfo
- Publication number
- WO2022230282A1 WO2022230282A1 PCT/JP2022/004104 JP2022004104W WO2022230282A1 WO 2022230282 A1 WO2022230282 A1 WO 2022230282A1 JP 2022004104 W JP2022004104 W JP 2022004104W WO 2022230282 A1 WO2022230282 A1 WO 2022230282A1
- Authority
- WO
- WIPO (PCT)
- Prior art keywords
- output information
- substance
- data
- internal standard
- measured
- Prior art date
Links
- 238000004458 analytical method Methods 0.000 title claims abstract description 28
- 239000000126 substance Substances 0.000 claims abstract description 105
- 230000002159 abnormal effect Effects 0.000 claims abstract description 60
- 238000001514 detection method Methods 0.000 claims abstract description 29
- 238000000034 method Methods 0.000 claims abstract description 21
- 238000003745 diagnosis Methods 0.000 claims abstract description 17
- 230000008569 process Effects 0.000 claims abstract description 9
- 239000003153 chemical reaction reagent Substances 0.000 claims description 66
- 238000005259 measurement Methods 0.000 claims description 55
- 238000000926 separation method Methods 0.000 claims description 35
- 230000014759 maintenance of location Effects 0.000 claims description 28
- 238000004128 high performance liquid chromatography Methods 0.000 claims description 25
- 238000012423 maintenance Methods 0.000 claims description 19
- 238000011088 calibration curve Methods 0.000 claims description 9
- 238000002360 preparation method Methods 0.000 claims description 9
- 238000011109 contamination Methods 0.000 claims description 5
- 238000004891 communication Methods 0.000 claims description 2
- 239000007921 spray Substances 0.000 claims description 2
- 230000005856 abnormality Effects 0.000 abstract description 26
- 230000008859 change Effects 0.000 abstract description 13
- 239000000523 sample Substances 0.000 description 78
- 150000002500 ions Chemical class 0.000 description 33
- 238000011002 quantification Methods 0.000 description 20
- 238000003908 quality control method Methods 0.000 description 19
- 239000007788 liquid Substances 0.000 description 18
- 239000013076 target substance Substances 0.000 description 11
- 238000012545 processing Methods 0.000 description 10
- 230000032258 transport Effects 0.000 description 9
- 238000005406 washing Methods 0.000 description 8
- 230000007246 mechanism Effects 0.000 description 7
- 150000003839 salts Chemical class 0.000 description 7
- 239000000243 solution Substances 0.000 description 7
- 239000002904 solvent Substances 0.000 description 7
- 238000012360 testing method Methods 0.000 description 7
- 239000011324 bead Substances 0.000 description 6
- 239000000356 contaminant Substances 0.000 description 6
- 230000000875 corresponding effect Effects 0.000 description 6
- 238000010586 diagram Methods 0.000 description 6
- 230000010485 coping Effects 0.000 description 5
- 238000004949 mass spectrometry Methods 0.000 description 5
- 238000012544 monitoring process Methods 0.000 description 5
- 230000009471 action Effects 0.000 description 4
- 238000004140 cleaning Methods 0.000 description 4
- 230000006866 deterioration Effects 0.000 description 4
- 238000007599 discharging Methods 0.000 description 4
- 238000002347 injection Methods 0.000 description 4
- 239000007924 injection Substances 0.000 description 4
- 238000004811 liquid chromatography Methods 0.000 description 4
- 238000007781 pre-processing Methods 0.000 description 4
- 238000010926 purge Methods 0.000 description 4
- 238000012546 transfer Methods 0.000 description 4
- 239000002699 waste material Substances 0.000 description 4
- 230000007547 defect Effects 0.000 description 3
- 230000002950 deficient Effects 0.000 description 3
- 238000000132 electrospray ionisation Methods 0.000 description 3
- USFZMSVCRYTOJT-UHFFFAOYSA-N Ammonium acetate Chemical compound N.CC(O)=O USFZMSVCRYTOJT-UHFFFAOYSA-N 0.000 description 2
- IJGRMHOSHXDMSA-UHFFFAOYSA-N Atomic nitrogen Chemical compound N#N IJGRMHOSHXDMSA-UHFFFAOYSA-N 0.000 description 2
- 239000012491 analyte Substances 0.000 description 2
- 238000004364 calculation method Methods 0.000 description 2
- 230000002596 correlated effect Effects 0.000 description 2
- 229910001873 dinitrogen Inorganic materials 0.000 description 2
- 238000013399 early diagnosis Methods 0.000 description 2
- 239000012634 fragment Substances 0.000 description 2
- 239000012535 impurity Substances 0.000 description 2
- 238000007689 inspection Methods 0.000 description 2
- BDAGIHXWWSANSR-UHFFFAOYSA-N methanoic acid Natural products OC=O BDAGIHXWWSANSR-UHFFFAOYSA-N 0.000 description 2
- 230000000737 periodic effect Effects 0.000 description 2
- 230000002123 temporal effect Effects 0.000 description 2
- 230000001960 triggered effect Effects 0.000 description 2
- OSWFIVFLDKOXQC-UHFFFAOYSA-N 4-(3-methoxyphenyl)aniline Chemical compound COC1=CC=CC(C=2C=CC(N)=CC=2)=C1 OSWFIVFLDKOXQC-UHFFFAOYSA-N 0.000 description 1
- QGZKDVFQNNGYKY-UHFFFAOYSA-O Ammonium Chemical compound [NH4+] QGZKDVFQNNGYKY-UHFFFAOYSA-O 0.000 description 1
- 239000005695 Ammonium acetate Substances 0.000 description 1
- 102000009123 Fibrin Human genes 0.000 description 1
- 108010073385 Fibrin Proteins 0.000 description 1
- BWGVNKXGVNDBDI-UHFFFAOYSA-N Fibrin monomer Chemical compound CNC(=O)CNC(=O)CN BWGVNKXGVNDBDI-UHFFFAOYSA-N 0.000 description 1
- 238000012951 Remeasurement Methods 0.000 description 1
- 235000019257 ammonium acetate Nutrition 0.000 description 1
- 229940043376 ammonium acetate Drugs 0.000 description 1
- 239000002246 antineoplastic agent Substances 0.000 description 1
- 229940041181 antineoplastic drug Drugs 0.000 description 1
- 238000010923 batch production Methods 0.000 description 1
- 239000012472 biological sample Substances 0.000 description 1
- 230000005540 biological transmission Effects 0.000 description 1
- 230000001276 controlling effect Effects 0.000 description 1
- 230000008021 deposition Effects 0.000 description 1
- 238000011161 development Methods 0.000 description 1
- 239000003814 drug Substances 0.000 description 1
- 238000010828 elution Methods 0.000 description 1
- 238000000605 extraction Methods 0.000 description 1
- 229950003499 fibrin Drugs 0.000 description 1
- 235000019253 formic acid Nutrition 0.000 description 1
- 239000007789 gas Substances 0.000 description 1
- 230000036541 health Effects 0.000 description 1
- 229960003444 immunosuppressant agent Drugs 0.000 description 1
- 239000003018 immunosuppressive agent Substances 0.000 description 1
- 230000006872 improvement Effects 0.000 description 1
- 238000000752 ionisation method Methods 0.000 description 1
- 238000004895 liquid chromatography mass spectrometry Methods 0.000 description 1
- 230000007774 longterm Effects 0.000 description 1
- 238000000691 measurement method Methods 0.000 description 1
- 208000030159 metabolic disease Diseases 0.000 description 1
- 239000000203 mixture Substances 0.000 description 1
- 238000012986 modification Methods 0.000 description 1
- 230000004048 modification Effects 0.000 description 1
- 230000000704 physical effect Effects 0.000 description 1
- 239000002244 precipitate Substances 0.000 description 1
- 239000000047 product Substances 0.000 description 1
- 229940126585 therapeutic drug Drugs 0.000 description 1
- 230000036962 time dependent Effects 0.000 description 1
- 238000011144 upstream manufacturing Methods 0.000 description 1
- 238000012795 verification Methods 0.000 description 1
Images


Classifications
-
- G—PHYSICS
- G01—MEASURING; TESTING
- G01N—INVESTIGATING OR ANALYSING MATERIALS BY DETERMINING THEIR CHEMICAL OR PHYSICAL PROPERTIES
- G01N35/00—Automatic analysis not limited to methods or materials provided for in any single one of groups G01N1/00 - G01N33/00; Handling materials therefor
- G01N35/00584—Control arrangements for automatic analysers
- G01N35/00594—Quality control, including calibration or testing of components of the analyser
-
- G—PHYSICS
- G01—MEASURING; TESTING
- G01N—INVESTIGATING OR ANALYSING MATERIALS BY DETERMINING THEIR CHEMICAL OR PHYSICAL PROPERTIES
- G01N30/00—Investigating or analysing materials by separation into components using adsorption, absorption or similar phenomena or using ion-exchange, e.g. chromatography or field flow fractionation
- G01N30/02—Column chromatography
- G01N30/86—Signal analysis
-
- G—PHYSICS
- G01—MEASURING; TESTING
- G01N—INVESTIGATING OR ANALYSING MATERIALS BY DETERMINING THEIR CHEMICAL OR PHYSICAL PROPERTIES
- G01N35/00—Automatic analysis not limited to methods or materials provided for in any single one of groups G01N1/00 - G01N33/00; Handling materials therefor
- G01N35/00584—Control arrangements for automatic analysers
- G01N35/00722—Communications; Identification
- G01N2035/00891—Displaying information to the operator
- G01N2035/009—Displaying information to the operator alarms, e.g. audible
Definitions
- the present invention relates to an automatic analyzer.
- an automatic analyzer for example, by combining separation based on the chemical structure and physical properties of the substance to be measured by liquid chromatograph (HPLC) and separation based on the mass of the substance to be measured by mass spectrometer (MS), sample A liquid chromatograph/mass spectrometer (HPLC/MS) for qualitatively and quantitatively determining each component in the liquid is known.
- HPLC liquid chromatograph
- MS mass spectrometer
- a liquid chromatograph/mass spectrometer can qualitatively and quantitatively measure a substance to be measured, even in the case where a large number of similar substances are metabolized in the body, such as pharmaceuticals in a biological sample. , is expected to be applied to the field of clinical testing.
- liquid chromatograph mass spectrometers HPLC/MS are used to test immunosuppressants, anticancer drugs, tests for neonatal metabolic disorders, and TDM (Therapeutic Drug Monitoring). ing.
- Patent Document 1 discloses a clinical diagnostic system (100) comprising a sample preparation module (20) for automatic preparation of a sample, and a liquid chromatography (LC) separation module (30) coupled to a mass spectrometer (MS) module (50) coupled to said LC separation module (30) by an LC/MS interface (60); a results calculation module (70) for identifying and/or quantifying an analyte or substance of interest included and passed through said LC separation module (30) and said MS module (50); ), wherein said controller (80) monitors a predetermined set of operating parameters (1-n) indicative of the performance status of said clinical diagnostic system (100); whenever one or more parameters (1-n) of the set of are out of specification, activate a quality control action and/or maintenance action, wherein said set of operating parameters (1-n) are within specification
- a clinical diagnostic system (100) is disclosed that is programmed to minimize quality control and/or maintenance actions as long as it continues to be.
- Patent Document 2 discloses a clinical specimen processing apparatus that can be connected via a network to a management device for maintenance installed outside, in which specimens are processed by causing each of a plurality of mechanisms to perform predetermined operations.
- a sample processing unit comparing means for comparing a numerical value based on an operation detection signal of a predetermined operation of each mechanism with a threshold value serving as a reference for determining whether the predetermined operation is in a normal state; If the numerical value based on the operation detection signal of the predetermined operation of any one of the mechanisms exceeds the threshold value, it indicates that the mechanism is in a state with a higher possibility of failure in the future compared to the normal state.
- transmission means for transmitting failure prediction information to the management device for maintenance via the network.
- a numerical value based on an operation detection signal of a predetermined operation of each mechanism is compared with a threshold as a reference for determining whether the predetermined operation is in a normal state. and when a numerical value based on an operation detection signal of a predetermined operation of any one of a plurality of mechanisms exceeds a threshold value, the mechanism is more likely to fail in the future than in a normal state. Failure prediction information indicating that the system is in a state is notified.
- a two-stage judgment criteria is used to issue a "warning" when the first threshold is exceeded, and when the second threshold is exceeded.
- the present invention has been made in view of the above, and is capable of quickly coping with abnormal processing when it occurs.
- An object of the present invention is to provide an automatic analyzer capable of suppressing the frequency.
- the present application includes a plurality of means for solving the above problems.
- a separation unit that separates a preprocessed sample to be measured, and the sample separated by the separation unit and a control device for controlling the operation of the analysis device, wherein the control device detects the sample from the detection result of the analysis device.
- a data alarm database storing data output information including at least one generated item; and storing predetermined reference data output information for determining whether the data output information is in a normal state or an abnormal state.
- a normal data alarm database the data output information of the data alarm database and the reference data output information of the normal data alarm database are compared, and the data output information of the data alarm database determined to be in an abnormal state a data alarm determination unit that assigns data alarms to the items of; a system alarm database that stores system output information including at least one item generated from the detection result of a sensor provided in the analyzer; and the system output information a normal system alarm database for storing predetermined reference system output information for determining whether is in a normal state or an abnormal state; a system alarm determination unit that compares the system output information with the reference system output information and assigns a data alarm to the item of the data output information in the system alarm database that is determined to be in an abnormal state; Predictive diagnosis of the failure state of the automatic analyzer is performed based on the temporal change of the data output information obtained by the analyzer and stored in the data alarm database and the temporal change of the system output information of the system alarm database. It shall be.
- the present invention it is possible to quickly deal with abnormal processing when it occurs, accurately grasp the abnormal state, and reduce the frequency of early abnormality diagnosis of the device and adjustment or replacement of parts.
- FIG. 2 is a top view schematically showing an example of the configuration of a pretreatment section
- FIG. 4 is a diagram schematically showing an example of the configuration of a separating section
- It is a figure which shows an example of a structure of a detection part typically.
- 4 is a flow chart showing the contents of the analysis operation of the automatic analyzer; It is a figure which shows an example of the display screen displayed on a display apparatus. It is a figure which shows an example of the display screen displayed on a display apparatus. It is a figure which shows an example of the display screen displayed on a display apparatus. It is a figure which shows an example of the display screen displayed on a display apparatus.
- FIG. 1 is a functional block diagram schematically showing the overall configuration of the automatic analysis system according to this embodiment.
- the automatic analyzer 100 is roughly composed of a control device 110, an analyzer 120, and an external computer 130.
- the analyzer 120 has a pretreatment unit (SP) 121, a separation unit (HPLC) 122, a detection unit (MS) 123, and an analysis processing unit 124 for mass spectrometry.
- SP pretreatment unit
- HPLC separation unit
- MS detection unit
- analysis processing unit 124 for mass spectrometry.
- FIG. 2 is a top view schematically showing an example of the configuration of the pretreatment section.
- a preprocessing unit (SP) 121 includes a sample transport unit 1211 that transports a sample container rack 101 loaded with a plurality of sample containers 101a containing samples (specimens) to be measured to a dispensing position; A reaction disk unit 1212 having a plurality of reaction containers 1212a for adding magnetic beads and reagents to a sample containing a target substance for reaction, and a reaction disk for storing the sample in the sample container 101a of the sample container rack 101 transported to the dispensing position.
- SP preprocessing unit
- washing unit 1217 that transfers the sample containing the substance to be measured and the magnetic beads that have been reacted in the reaction container 1212a of the reaction disk unit 1212 to wash the magnetic beads, etc.;
- a washing probe 1216 for dispensing (aspirating/discharging) the sample to a washing unit 1217 , and a separation section transport unit 1218 for transporting a sample to a separation section (HPLC) 122 .
- FIG. 3 is a diagram schematically showing an example of the configuration of the separating section.
- a plurality of (eg, three in the present embodiment) streams such as HPLC1 stream 1222, HPLC2 stream 1223, and HPLC3 stream 1224 are arranged to improve throughput, and each stream is switched.
- an input stream select valve 1225 positioned before each stream and an output stream select valve 1226 positioned after each stream for switching the stream to be connected to the detection unit (MS) 123 in the latter stage from each stream are provided. I have it.
- Each stream 1222, 1223, 1224 includes pump units 1222a, 1223a, 1224a that feed the solvent reagent to the channel, a sample introduction unit 1222b that introduces the sample transferred from the pretreatment unit (SP) 121 into the channel, It has 1223b, 1224b and separation columns 1222c, 1223c, 1224c for separating samples.
- a system reagent unit 1221 capable of selecting a reagent to be used from a plurality of reagents is arranged upstream of the input stream select valve 1225 .
- Pump units 1222a, 1223a, and 1224a include two cylinders that are driven to maintain the set flow rate, an auto-purge valve that switches between the flow path and waste liquid to remove air in the flow path, and a pump that monitors the pressure in the flow path. It has a pressure sensor.
- the sample introduction units 1222b, 1223b, and 1224b are installed in each stream, and include an injection valve for switching the liquid feeding channel from the pump and the channel from the syringe, a sample loop connected to the injection valve, and aspirating/discharging the sample. It has a syringe and a syringe pressure sensor that monitors the suction/ejection state of the syringe.
- the sample transported from the pretreatment section (SP) 121 is transported to a sample aspiration position installed in each stream in the separation section transport unit 1218, and after the sample is aspirated, the sample is aspirated to a waste liquid aspiration position common to each stream.
- the transported solution remaining in the specimen container is aspirated/discharged by the waste liquid probe.
- the separation columns 1222c, 1223c, 1224c are held in a column cartridge with a heat transfer block below.
- Each column cartridge is temperature-controlled in a column oven having a heater, a heat block, and a temperature-sensing thermistor.
- the column cartridge is fixed in place inside the column oven and monitored by a position sensor.
- the system reagent unit 1221 has a lifter for setting each reagent bottle in a normal position and a weight sensor for monitoring the amount of reagent in each reagent bottle.
- the system reagent unit 1221 has a lifter for placing reagent bottles and a weight sensor for monitoring the amount of reagent in the reagent bottles.
- FIG. 4 is a diagram schematically showing an example of the configuration of the detection unit.
- the detection unit (MS) 123 is composed of an ion source unit 1231 and a mass spectrometer 1232 .
- the mass spectrometer 1232 generates signal intensity (area) data where a particular m/z (mass/charge number) is counted by the detector.
- SP preprocessing unit
- an internal standard substance is added to the sample containing the substance to be measured, and signal intensity data for the m/z of the substance to be measured and the m/z of the internal standard substance are generated.
- the horizontal axis shows the measurement target substance concentration
- the vertical axis shows the signals of the measurement target substance and the internal standard substance.
- a calibration curve is prepared by plotting the signal intensity (area) ratio corresponding to the intensity (area). Measured from the signal intensity (area) ratio corresponding to the signal intensity (area) data corresponding to the m/z of the measurement target substance and the m/z of the internal standard substance generated from the mass spectrometer 1232 and the calibration curve prepared in advance. Calculate the concentration of the target substance.
- the output of the detection unit (MS) 123 is sent to the analysis processing unit 124 for mass spectrometry, and the peak is obtained from the information on the signal intensity (area) in which a specific m/z (mass/charge number) is counted by the detector. A fitting is performed and data output information is generated.
- the functions of the mass spectrometry analysis processing unit 124 are realized by, for example, software operating on the detection unit (MS) 123 .
- Data output information generated by the mass spectrometer 1232 and the mass spectrometric analysis processing unit 124 will now be described.
- Data output information includes: 1) Peak area ratio of m/z for quantification of the substance to be measured and m/z for quantification of the internal standard substance 2) Peak intensity ratio of m/z for quantification of the substance to be measured and m/z for quantification of the internal standard substance 3) Peak area of m/z for quantification of the substance to be measured 4) Peak intensity of m/z for quantification of the substance to be measured 5) Retention time of m/z for quantification of the substance to be measured 6) For quantification of the substance to be measured m/z peak width 7) m/z half width for quantification of the substance to be measured 8) S/N of m/z for quantification of the substance to be measured (peak intensity/background ratio) 9) m/z leading factor for quantification of the substance to be measured 10) m/z tailing factor for quantification of the substance to be measured 11
- the control device 110 controls the operation of the analysis device 120, and includes a data alarm database 114 that stores the "data output information" generated by the analysis device 120, and data information of the normal state.
- Data alarm database 115 for storing normal data
- data alarm judgment unit 116 system alarm database 111 for storing "system output information" generated by analyzer 120
- normal system for storing system alarm information in normal state It has an alarm database 112 and a system alarm determination unit 113 .
- the data output information from the analysis device 120 is transferred to the control device 110, compared with the normal data alarm database 115 in the data alarm judgment unit 116, the data output information outside the threshold value is judged to be an abnormal value, and the data alarm database 114.
- a data alarm is attached to the inspection result and notified to the user. At this time, the user checks the data and determines whether or not reexamination is necessary. Some data alarms automatically carry out remeasurement.
- system output information from the analysis device 120 is transferred to the control device 110, and is compared with the normal system alarm database 112 storing system alarm information in the normal state in the system alarm determination unit 113.
- the information is determined to be an anomaly and stored in system alarm database 111 .
- a system alarm is notified to the user.
- the external computer 130 accurately grasps the abnormal state from the information in the system alarm database 111 and the data alarm database 114 determined to be abnormal by the control device 110, and determines early abnormality diagnosis, parts adjustment, and parts replacement. be able to.
- the external computer 130 has an integrated platform 131 constructed by the user and connected to various clinical examination equipment, and information relating to early diagnosis of abnormalities, part adjustment, and part replacement of the apparatus is shared.
- a data alarm is given in the data alarm database 114 to the judgment item judged to be abnormal.
- Internal standard substance signal check lower limit value: If the peak intensity of the internal standard substance peak is equal to or lower than the lower limit value, it is judged to be in an abnormal state.
- Internal standard substance signal check upper limit: If the peak intensity of the internal standard substance is greater than or equal to the maximum value, it is judged to be in an abnormal state.
- Internal standard substance identification check If the peak parameters (e.g., internal standard substance retention time, peak width, half width, S/N (peak intensity/background ratio)) are checked and are out of range is determined to be in an abnormal state.
- Signal check for substances to be measured (lower limit) When the peak intensity of the measurement target substance peak is equal to or less than the lower limit value, it is determined to be in an abnormal state. 5) Signal check of substance to be measured (upper limit value): If the peak intensity of the substance to be measured is equal to or greater than the maximum value, it is judged to be in an abnormal state. 6) Identification check of substances to be measured: When peak parameters (e.g. retention time of internal standard substance, peak width, half width, S/N (peak intensity/background ratio)) are checked and found to be out of range is determined to be in an abnormal state.
- peak parameters e.g. retention time of internal standard substance, peak width, half width, S/N (peak intensity/background ratio)
- HPLC performance check HPLC pressure curve, ESI spray current, internal standard substance peak parameters (peak width, peak symmetry, retention time, etc.) are performed and judged to be abnormal when out of range .
- MS Performance Check Determine abnormal conditions if peak parameters, such as background intensity and/or noise values, are out of range. Contamination information is also output.
- Calibration curve check The calibration curve is checked, and if it is out of range, it is judged to be in an abnormal state.
- QC check A QC check is performed, and if it is out of range, it is judged to be in an abnormal state. Note that the determination items and determination method are not limited to those described above.
- FIG. 5 is a flow chart showing the contents of the analysis operation of the automatic analyzer.
- the automatic analyzer 100 first turns on the power to start each device, confirms communication between the analyzer 120 and the control device 110, and checks the status of each sensor and each consumable. A "start-up process" is performed (step S100).
- step S110 the user or service person performs a "pre-measurement preparation process” in which maintenance items are selected and implemented (step S110), and when the pre-measurement preparation process is completed, calibration measurement, QC measurement, and sample measurement are performed in the "main measurement step” is performed (step S120).
- step S120 the main measurement step
- step S121 a "waiting process” is performed to wait until the next start of the main measurement process.
- step S130 a “post-measurement preparation step” for preparing to turn off the device is performed (step S130), and then , a “shutdown step” is performed to shut down each device by turning off the power (step S140).
- the calibration measurement signal intensity data for the m/z of the substance to be measured and the m/z of the internal standard substance are generated.
- the horizontal axis is the concentration of the target substance to be measured
- the vertical axis is the signal intensity of the target substance and the internal standard substance (
- a calibration curve is prepared by plotting the signal intensity (area) ratio corresponding to the area). Based on the calibration curve prepared in advance and the signal intensity (area) ratio corresponding to the m/z of the target substance and the m/z of the internal standard substance generated from the mass spectrometer. Calculate the concentration of the substance.
- QC Quality Control
- QC measurements are performed for quality control, and the measurement results must be reported correctly (accuracy), and there must be no significant changes in the results of repeated measurements as long as there is no change in the sample (precision).
- the purpose of quality control is to guarantee the accuracy of the measurement results and to prove the validity of the measurement method and its control method from the records of the measurement results.
- the QC measurement is performed using a QC sample of known concentration, the concentration is calculated using the calibration curve of the calibration measurement obtained in advance, and the generated result is calculated. Evaluate whether the concentration is within the specified value. In the series of steps, validity verification is performed as to whether the calculated concentration value is valid.
- Analyte measurements can begin after instrument status has been validated with calibration and QC measurements.
- the data output information from the sample measurement is the calibration curve generated by the calibration measurement, and the signal intensity (area) data for the m/z of the substance to be measured and the m/z of the internal standard substance generated from the mass spectrometer.
- the concentration of the substance to be measured is calculated from the signal intensity (area) ratio corresponding to .
- the data output information is transferred to the control device 110 and compared with the normal data alarm database 115 , and the data output information outside the threshold value is determined as an abnormal value and stored in the data alarm database 114 .
- a data alarm is attached to the inspection result and notified to the user. The user checks the data and decides whether retesting is necessary.
- the automatic analyzer 100 detects abnormalities such as reagent shortage, sample clogging, RFID read failure, etc. based on information output from each sensor or software count after the start of measurement.
- the system output information of the preprocessing unit (SP) 121 includes an aspiration position error due to an abnormality in the position sensor that occurs during driving of the sample probe 1213, reagent dispensing unit 1214b, and washing probe 1216, and an aspiration position error that occurs when a sample or reagent is aspirated/dispensed. There is a clogging detection error due to an abnormality in the pressure sensor.
- a plurality of different types of alarms such as sample aspiration position, sample discharge position, origin position, origin off position, etc. are output.
- the system output information of the separator (HPLC) 122 includes pump cylinder position due to a position sensor abnormality that occurs during driving of the pump cylinder, injection valve, auto purge valve, input side stream select valve 1225, output side stream select valve 1226, etc. and valve position error.
- the pump units 1222a, 1223a, and 1224a are provided with pump pressure sensors that monitor the pressure in the channels, and detect pressure abnormalities such as clogging and leaks in the channels.
- the system reagent unit 1221 has an abnormal position sensor that detects the abnormal position of the lifter.
- a weight sensor is installed at the bottom of each reagent bottle installed in the system reagent unit 1221 to monitor the amount of reagent in each reagent bottle. be.
- the surface temperatures of the heater, heat block, and separation column are sensed by a thermistor, and temperature anomaly is detected when the temperature exceeds a threshold value.
- Electrospray ionization is used in the ion source unit 1231 of the detection unit (MS) 123, and the liquid feeding channel from the separation unit (HPLC) 122 has a diameter of the solution in the ion source unit 1231.
- a high temperature, a high voltage, and a high current are applied while sending the liquid through the pipe of 100 ⁇ m.
- the probe pipe is a double pipe, the solution is sent to the center, and nitrogen gas is sprayed inside and outside the pipe to improve the ionization efficiency.
- Each temperature, voltage value, and current value are monitored, and when they are equal to or higher than threshold values, temperature abnormality, voltage value abnormality, and current value abnormality are detected.
- the nitrogen gas flow path is also monitored, and an abnormality is detected if it deviates from the threshold.
- the mass spectrometer 1232 uses a triple quadrupole mass spectrometer to focus the ions ionized in the ion source, filter Q0 to separate impurities, and add only mass numbers of specific m/z. It is composed of a filter Q1 which is an ion filter, a filter Q2 which generates fragment ions by causing gas to collide with ions, a filter Q3 which adds only specific fragment ions, and a detector.
- the voltage and current inside each filter Q0, Q1, Q2, Q3 are monitored for inrush voltage, internal voltage, and exit voltage, and an abnormality is detected when the threshold value is exceeded.
- a system alarm is given in the system alarm database 111 to the judgment item judged to be abnormal.
- Abnormal position sensor of sample probe 1213 2) Abnormal position sensor of reagent pipetting unit 1214b 3) Abnormal position sensor of cleaning probe 1216 4) Abnormal pressure sensor of sample probe 1213 5) Abnormal pressure sensor of reagent pipetting unit 1214b 6 ) Abnormal pressure sensor of washing probe 1216 7) Abnormal temperature sensor of reaction disk unit 1212 8) Abnormal position sensor of sample transport unit 1211 9) Abnormal position sensor of reaction disk unit 1212 10) Abnormal position sensor of washing unit 1217 11) Separation 12) Pump cylinder position sensor error 13) Injection valve position sensor error 14) Auto purge valve position sensor error 15) Input side stream Select valve 1225 position sensor error 16) Output side stream Abnormal position sensor of select valve 1226 17) Abnormal pressure sensor of pump and channel 18) Abnormal position sensor of system reagent unit 1221 and lifter 19) Abnormal weight
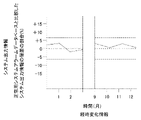
- the control device 110 acquires system output information over time, and displays the system output information that changes over time on a display device (not shown).
- the change information over time is plotted on the horizontal axis
- the system output information is plotted on the vertical axis.
- the vertical axis indicates the percentage of deviation when comparing the normal system alarm database 112 and the system output information.
- FIG. 6 to 8 are diagrams showing examples of display screens displayed on the display device.
- Fig. 6 shows the relationship between time-varying information and system output information.
- 8 shows a case where the horizontal axis (time axis) is set in units of one month.
- 6 to 8 show, as an example, the pressure sensor abnormality of the syringe pressure sensor.
- the plotting intervals on the horizontal axis can be displayed, for example, for all data, daily data, and monthly data, and the state of the syringe pressure sensor can be confirmed.
- the deviation of the system output information compared with the system alarm database 112 for normal is ⁇ 20% as a threshold of the normal range, and if this threshold is exceeded, the system output information is judged to be an abnormal value.
- the system alarm database 111 Stored in the system alarm database 111 .
- a system alarm will be issued and the user will respond according to the action method issued at the same time as the system alarm.
- the vertical axis represents the ratio of the deviation of the system output information compared to the normal system alarm database 112
- the horizontal axis represents the system output information plotted with the change information over time.
- the screen to be displayed can be displayed, and changes over time in the state of each system output information can be grasped.
- the data alarm database 114 in addition to the system alarm database 111 storing the system output information generated by the analysis device 120, the data alarm database 114 storing the data output information generated by the analysis device 120 Based on each information or combination of information, it is possible to reduce equipment downtime due to equipment failure by grasping the parts adjustment timing, parts replacement timing, and failure locations in the equipment and performing predictive diagnosis. .
- Pump units 122a, 1223a, and 1224a include two cylinders that are driven to maintain the set flow rate, an auto purge valve that switches between the flow path and waste liquid to remove air in the flow path, and a pump that monitors the pressure in the flow path. It is composed of a pressure sensor, and detects abnormal pressure in the flow path downstream from the pump units 122a, 1223a, 1224a.
- a pressure sensor is installed in each syringe, and it is possible to detect clogging of components such as flow paths and valves in the downstream stages of the pump units 122a, 1223a, and 1224a.
- the pressure curve information in the gradient program of the pump liquid transfer of the "measurement preparation operation” is output.
- a threshold value of 80 MPa is set, and if it exceeds, a system alarm is generated and the device is stopped.
- the latter is when the pressure curve is different from normal. For example, if the pressure curve rises quickly, the channel, connection, or column body is about to be clogged. (dead volume) leak is suspected. If the steady-state pressure is higher than the normal value, clogging is suspected, and if it is lower, leak is suspected. In this case a data alarm is generated.
- the retention time of the internal standard substance if the retention time is faster than normal, it is suspected that the pump is not delivering liquid (if the flow rate is higher than the setting), and if the retention time is slow, the Suspect a defect (flow rate lower than set) or flow path, connection or column deterioration (dead volume). In this case a data alarm is generated.
- the relationship between pump pressure and retention time may be correlated. In this case, it becomes easier to identify the cause of the problem. If only the system sensor information of the pressure sensor value is extracted, the user can recognize the device abnormality. However, it is difficult to select a specific part as a coping method, and in the end, it is necessary to ask a service person to handle the problem, which prolongs the downtime of the apparatus.
- extracting information in association with data alarms of retention time information and pressure curve information facilitates extraction of coping methods. In other words, by extracting information on overpressure, which is system alarm information, retention time, which is data alarm information, and time-varying change in pressure curve information, it is possible to grasp the daily state of the apparatus.
- the user since it can be predicted that the flow path will be highly clogged, the user performs a maintenance menu for predicting the location of pressure clogging. After identifying the pressure, that is, the location, parts can be replaced for items that can be handled by the user, such as probe replacement of the ion source, and other parts can be replaced by a service person.
- the user performs a maintenance menu for column replacement. Since the information on the change over time is acquired, the pressure curve information and the information on the change over time in the retention time can be displayed on the GUI and clearly shown to the user.
- a solution containing an internal standard substance is sent from the separation unit (HPLC) 122 and ionized by applying high temperature, high voltage and high current in the ion source.
- a solution containing an internal standard substance contains salts such as formic acid, ammonium acetate, and ammonium, and a volatile ammonium acetate salt and contaminants may precipitate during the ionization process.
- Contaminants may be derived from the HPLC solvent, especially from plastic members of the channel parts, or from components concentrated in the separation column.
- the ion source probe is periodically cleaned with a cleaning solution to reduce the risk of deposits. However, salt may be precipitated by long-term continuous use.
- the voltage application does not reach the set value due to deposition of salts and contaminants on the probe surface of the ion source or on the counter plate of the ion source inlet.
- a signal derived from the salt and contaminants having the same m/z as the m/z of the internal standard substance output by the detection unit (MS) is detected.
- the internal standard peaks are concentrated in the separation columns 1222c, 1223c, and 1224c of the separation section (HPLC) 122, and the elution timings from the separation columns 1222c, 1223c, and 1224c do not change under the same HPLC gradient program. That is, the peak of the internal standard substance is detected at the fixed retention time.
- the peak of the internal standard substance Due to the influence of the precipitated salt and impurities, the peak of the internal standard substance is inhibited from ionization and becomes lower than the original peak intensity.
- Signals derived from salts and contaminants with m/z similar to the m/z of the internal standard substance output by the detection unit (MS) are always detected at a constant amount regardless of the retention time, and a constant amount of background peak detected as By extracting information on changes in S/N (ratio of peak intensity/background) over time, it is possible to grasp the daily state of the device.
- the relationship between the S/N (ratio of peak intensity/background) and the voltage of the ion source may be correlated. In this case, it becomes easier to identify the cause of the problem. If only the system sensor information of the voltage value of the ion source is extracted as in the past, the user can recognize the voltage abnormality of the ion source. However, it is difficult to select a specific part as a coping method, and in the end, it is necessary to ask a service person to handle the problem, which prolongs the downtime of the apparatus. On the other hand, by extracting information in association with data alarms related to S/N (peak intensity/background ratio) and voltage of the ion source, it becomes easy to extract coping methods. In other words, by extracting time-varying information on overpressure, which is system alarm information, S/N (ratio of peak intensity/background), which is data alarm information, and ion source voltage relationship information, the daily apparatus status can be can be understood in more detail.
- the sensor itself that applies the voltage to the ion source and the part that monitors the voltage itself may be defective. can be expected to be high.
- the relationship information of the S/N (peak intensity/background ratio) and the voltage of the ion source changes over time, it is highly likely that the probe of the ion source or the curtain plate at the entrance of the ion source has been contaminated. I can judge.
- ⁇ C Pressure value of syringe pressure sensor, peak intensity (area) of internal standard substance>
- the sample introduction units 1222b, 1223b, and 1224b have syringes for aspirating/ejecting the sample, and syringe pressure sensors for monitoring the aspirating/ejecting states of the syringes.
- a system alarm can be generated, displayed on the GUI, and made explicit to the user.
- information in which the peak of the pressure value changes in stages is extracted from information on periodic changes over time.
- the information on the peak intensity (area) of the internal standard substance is periodically acquired step by step, and the peak intensity (area) is compared with the normal data alarm and judged to be abnormal.
- a data alarm can be generated, displayed on the GUI, and made explicit to the user.
- information in which the peak intensity (area) changes stepwise is extracted from information on periodic changes over time.
- the sample introduction units 1222b, 1223b, and 1224b each have a syringe for aspirating/ejecting a specimen and a syringe pressure sensor for monitoring the aspirating/ejecting state of the syringe.
- a weight sensor is installed at the bottom of each reagent bottle installed in the system reagent unit 1221. There is a weight sensor that monitors the amount of reagent in each reagent bottle and detects shortage of the reagent when the reagent is less than a specified value. .
- a lack of reagent in the reagent bottle is detected by the detection of the weight sensor while the sample is being aspirated/discharged.
- the reagent shortage threshold for the reagent bottle issues a "warning" system alarm when the remaining amount of the reagent bottle falls below 20%. If it becomes 10% or less, a data alarm is issued because it affects the measurement results.
- the reagent remains in the tubing from the reagent bottle to the pump channel, there is a possibility that the result of the number measurement will not be affected after the data alarm is issued. In other words, even if the solvent in the reagent bottle is 10% or less, if the solvent after the pump remains, it does not affect the measurement results.
- the pump units 1222a, 1223a, 1224a have pump pressure sensors that monitor the pressure in the channels, and detect pressure abnormalities in the channels downstream from the pump units 1222a, 1223a, 1224a. It is possible to output the pressure curve information in the gradient program of the pump liquid transfer of the "measurement preparation operation". Exceeding the pressure resistance of the pump seals and connections in the pump creates a risk of component deterioration and leakage, so a threshold of 80 MPa is set, and if exceeded, a system alarm is generated and the equipment is stopped. If the pressure curve is different from normal, or if the rise of the pressure curve is slow, it is suspected that the solvent after the pump is insufficient due to the shortage of the reagent in the reagent bottle. On the other hand, focusing on the retention time of the internal standard substance, when the retention time is slow, it is suspected that the solvent after the pump is insufficient due to the shortage of the reagent in the reagent bottle.
- the pressure curve behaves differently from the normal state, instead of issuing a data alarm for the relevant item for the specimen after the relevant specimen. If the retention time is later than the retention time threshold, it is suspected that the solvent after the pump is insufficient due to the lack of reagent in the reagent bottle, and a data alarm is issued for the item after the relevant sample.
- system output information and data output information acquisition of data output information using system output information and internal standard substances as indicators is possible even if the calibration measurement, QC (Quality Control) measurement, and sample measurement performed in the "main measurement operation" are not performed. status can be grasped.
- the user or the service person selects maintenance items and performs a "pre-measurement preparation" to check the apparatus at regular intervals.
- the device is checked every morning when it is started up, and the system alarm of the device output at the time of the device check and the time-dependent change information of the data alarm information using the internal standard substance as an index are analyzed. Predictive diagnosis of the device can be performed without wastefully consuming reagents and specimens.
Abstract
Description
ここで、質量分析計1232及び質量分析用解析処理部124で生成されるデータ出力情報について説明する。データ出力情報には、以下のものが含まれている。
1)測定対象物質の定量用m/zと内部標準物質の定量用m/zのピーク面積比
2)測定対象物質の定量用m/zと内部標準物質の定量用m/zのピーク強度比
3)測定対象物質の定量用m/zのピーク面積
4)測定対象物質の定量用m/zのピーク強度
5)測定対象物質の定量用m/zの保持時間
6)測定対象物質の定量用m/zのピーク幅
7)測定対象物質の定量用m/zの半値幅
8)測定対象物質の定量用m/zのS/N(ピーク強度/バックグラウンドの比)
9)測定対象物質の定量用m/zのリーディングファクタ
10)測定対象物質の定量用m/zのテーリングファクタ
11)測定対象物質の定性用m/zのピーク面積
12)測定対象物質の定性用m/zのピーク強度
13)測定対象物質の定性用m/zの保持時間
14)測定対象物質の定性用m/zのピーク幅
15)測定対象物質の定性用m/zの半値幅
16)測定対象物質の定性用m/zのS/N(ピーク強度/バックグラウンドの比)
17)内部標準物質の定量用m/zのピーク面積
18)内部標準物質の定量用m/zのピーク強度
19)内部標準物質の定量用m/zの保持時間
20)内部標準物質の定量用m/zのピーク幅
21)内部標準物質の定量用m/zの半値幅
22)内部標準物質の定量用m/zのS/N(ピーク強度/バックグラウンドの比)
23)測定対象物質の定量用m/zのリーディングファクタ
24)測定対象物質の定量用m/zのテーリングファクタ
25)内部標準物質の定性用m/zのピーク面積
26)内部標準物質の定性用m/zのピーク強度
27)内部標準物質の定性用m/zの保持時間
28)内部標準物質の定性用m/zのピーク幅
29)内部標準物質の定性用m/zの半値幅
30)内部標準物質の定性用m/zのS/N(ピーク強度/バックグラウンドの比)
なお、データ出力情報は、上記したものに限定されるものではない。 <Data output information>
Data output information generated by the
1) Peak area ratio of m/z for quantification of the substance to be measured and m/z for quantification of the internal standard substance 2) Peak intensity ratio of m/z for quantification of the substance to be measured and m/z for quantification of the internal standard substance 3) Peak area of m/z for quantification of the substance to be measured 4) Peak intensity of m/z for quantification of the substance to be measured 5) Retention time of m/z for quantification of the substance to be measured 6) For quantification of the substance to be measured m/z peak width 7) m/z half width for quantification of the substance to be measured 8) S/N of m/z for quantification of the substance to be measured (peak intensity/background ratio)
9) m/z leading factor for quantification of the substance to be measured 10) m/z tailing factor for quantification of the substance to be measured 11) peak area of m/z for qualitative measurement of the substance to be measured 12) qualitative of the substance to be measured m/z peak intensity 13) m/z retention time for qualitative determination of the substance to be measured 14) m/z peak width for qualitative determination of the measured substance 15) half width of m/z for qualitative determination of the measured substance 16) S/N of m/z for qualitative measurement of substance to be measured (ratio of peak intensity/background)
17) m/z peak area for quantification of internal standard substance 18) m/z peak intensity for quantification of internal standard substance 19) m/z retention time for quantification of internal standard substance 20) for quantification of internal standard substance m/z peak width 21) m/z half width for quantification of internal standard 22) m/z S/N for quantification of internal standard (peak intensity/background ratio)
23) m/z leading factor for quantification of the substance to be measured 24) m/z tailing factor for quantification of the substance to be measured 25) m/z peak area for qualitative internal standard substance 26) for qualitative internal standard substance m/z peak intensity 27) internal standard substance qualitative m/z retention time 28) internal standard substance qualitative m/z peak width 29) internal standard substance qualitative m/z half width 30) m/z S/N (peak intensity/background ratio) for qualitative internal standard
Note that the data output information is not limited to the above.
ここで、データアラーム判定部116における判定項目および判定方法について説明する。異常であると判定された判定項目には、データアラームデータベース114においてデータアラームが付与される。
1)内部標準物質シグナルチェック(下限値):内部標準物質ピークのピーク強度が下限値以下である場合に異常状態であると判定する。
2)内部標準物質シグナルチェック(上限値):内部標準物質のピーク強度が最大値以上である場合に異常状態であると判定する。
3)内部標準物質同定チェック:ピークパラメータ(例えば、内部標準物質の保持時間、ピーク幅、半値幅、S/N(ピーク強度/バックグラウンドの比))のチェックを実施して範囲外である場合に異常状態であると判定する。
4)測定対象物質シグナルチェック(下限値)
測定対象物質ピークのピーク強度が下限値以下である場合に異常状態であると判定する。
5)測定対象物質シグナルチェック(上限値):測定対象物質のピーク強度が最大値以上である場合に異常状態であると判定する。
6)測定対象物質同定チェック:ピークパラメータ(例えば、内部標準物質の保持時間、ピーク幅、半値幅、S/N(ピーク強度/バックグラウンドの比))のチェックを実施して範囲外である場合に異常状態であると判定する。
7)HPLC性能チェック:HPLCの圧力カーブ、ESIスプレ電流、内部標準物質のピークパラメータ(ピーク幅、ピーク対称性、保持時間等)を実施して範囲外である場合に異常状態であると判定する。
8)MS性能チェック:ピークパラメータ、例えばバックグラウンド強度およびまたはノイズ値が範囲外である場合に異常状態であると判定する。コンタミネーションの情報も出力する。
9)キャリブレーションカーブチェック:キャリブレーションカーブのチェックを実施して範囲外である場合に異常状態であると判定する。
10)QCチェック:QCチェックを実施して範囲外である場合に異常状態であると判定する。
なお、判定項目および判定方法は、上記したものに限定されるものではない。 <Data alarm>
Here, determination items and determination methods in the data
1) Internal standard substance signal check (lower limit value): If the peak intensity of the internal standard substance peak is equal to or lower than the lower limit value, it is judged to be in an abnormal state.
2) Internal standard substance signal check (upper limit): If the peak intensity of the internal standard substance is greater than or equal to the maximum value, it is judged to be in an abnormal state.
3) Internal standard substance identification check: If the peak parameters (e.g., internal standard substance retention time, peak width, half width, S/N (peak intensity/background ratio)) are checked and are out of range is determined to be in an abnormal state.
4) Signal check for substances to be measured (lower limit)
When the peak intensity of the measurement target substance peak is equal to or less than the lower limit value, it is determined to be in an abnormal state.
5) Signal check of substance to be measured (upper limit value): If the peak intensity of the substance to be measured is equal to or greater than the maximum value, it is judged to be in an abnormal state.
6) Identification check of substances to be measured: When peak parameters (e.g. retention time of internal standard substance, peak width, half width, S/N (peak intensity/background ratio)) are checked and found to be out of range is determined to be in an abnormal state.
7) HPLC performance check: HPLC pressure curve, ESI spray current, internal standard substance peak parameters (peak width, peak symmetry, retention time, etc.) are performed and judged to be abnormal when out of range .
8) MS Performance Check: Determine abnormal conditions if peak parameters, such as background intensity and/or noise values, are out of range. Contamination information is also output.
9) Calibration curve check: The calibration curve is checked, and if it is out of range, it is judged to be in an abnormal state.
10) QC check: A QC check is performed, and if it is out of range, it is judged to be in an abnormal state.
Note that the determination items and determination method are not limited to those described above.
キャリブレーション測定では、測定対象物質のm/zおよび内部標準物質のm/zに対する信号強度のデータが生成される。事前に、幾つかの既知濃度の測定対象物質に既知の内部標準物質を質量分析計で測定することで、 横軸に測定対象物質濃度、縦軸に測定対象物質および内部標準物質の信号強度(面積)に対応する信号強度(面積)比をプロットした検量線を作成しておく。事前に作成した検量線と、質量分析計から生成された測定対象物質のm/zおよび内部標準物質のm/zに対する信号強度(面積)のデータに対応する信号強度(面積)比から測定対象物質の濃度を算出する。 First, the calibration measurement will be explained.
In the calibration measurement, signal intensity data for the m/z of the substance to be measured and the m/z of the internal standard substance are generated. In advance, by measuring a known internal standard substance with a known concentration of the target substance to be measured with a mass spectrometer, the horizontal axis is the concentration of the target substance to be measured, and the vertical axis is the signal intensity of the target substance and the internal standard substance ( A calibration curve is prepared by plotting the signal intensity (area) ratio corresponding to the area). Based on the calibration curve prepared in advance and the signal intensity (area) ratio corresponding to the m/z of the target substance and the m/z of the internal standard substance generated from the mass spectrometer. Calculate the concentration of the substance.
QC測定は、精度管理のために実施するものであり、測定結果が正しく報告されていること(正確性)および検体に変化がない限り繰り返し測定される結果に大きな変化がないこと(精密性)を保証するために実施する。精度管理を行う目的は、測定結果が正確であることを保証すること、および測定方法とその管理方法の妥当性を測定結果の記録から証明することである。具体的にはQC測定は、既知濃度のQC試料を用いて、測定を実施し、生成された結果を事前に取得しておいたキャリブレーション測定の検量線を用いて濃度を算出し、算出された濃度が規定値以内におさまっているかを評価する。その一連の工程では、算出された濃度値が有効であるかの妥当性検証が実施される。 Next, QC (Quality Control) measurement will be described.
QC measurements are performed for quality control, and the measurement results must be reported correctly (accuracy), and there must be no significant changes in the results of repeated measurements as long as there is no change in the sample (precision). to ensure that The purpose of quality control is to guarantee the accuracy of the measurement results and to prove the validity of the measurement method and its control method from the records of the measurement results. Specifically, the QC measurement is performed using a QC sample of known concentration, the concentration is calculated using the calibration curve of the calibration measurement obtained in advance, and the generated result is calculated. Evaluate whether the concentration is within the specified value. In the series of steps, validity verification is performed as to whether the calculated concentration value is valid.
キャリブレーション測定およびQC測定で装置状態の有効性が確認された後に検体測定を開始することができる。検体測定で出力されたデータ出力情報はキャリブレーション測定で生成した検量線と、質量分析計から生成された測定対象物質のm/zおよび内部標準物質のm/zに対する信号強度(面積)のデータに対応する信号強度(面積)比から測定対象物質の濃度を算出する。また、データ出力情報が制御装置110へ移行され正常用データアラームデータベース115と比較され、しきい値外のデータ出力情報が異常値と判断され、データアラームデータベース114に格納される。データアラームは検査結果に添付され、ユーザに報知される。ユーザはデータを確認し、再検査が必要かどうかを判断する。 Next, sample measurement will be described.
Analyte measurements can begin after instrument status has been validated with calibration and QC measurements. The data output information from the sample measurement is the calibration curve generated by the calibration measurement, and the signal intensity (area) data for the m/z of the substance to be measured and the m/z of the internal standard substance generated from the mass spectrometer. The concentration of the substance to be measured is calculated from the signal intensity (area) ratio corresponding to . Further, the data output information is transferred to the
続いて、分析装置120の前処理部(SP)121、分離部(HPLC)122、検出部(MS)123で生成されて出力されるシステム出力情報について説明する。自動分析装置100では、測定を開始してから各センサまたはソフトウェアカウントにより出力した情報により、試薬不足、試料の詰まり、RFIDの読取り不良などの異常検知を行う。 <System output information>
Next, the system output information generated and output by the pretreatment unit (SP) 121, the separation unit (HPLC) 122, and the detection unit (MS) 123 of the
前処理部(SP)121のシステム出力情報としては、検体プローブ1213、試薬分注ユニット1214b、洗浄プローブ1216の駆動中に発生するポジションセンサ異常による吸引位置エラー、試料または試薬の吸引/吐出時に発生する圧力センサ異常により詰まり検知エラーなどがある。他にも、検体搬送ユニット1211、反応ディスクユニット1212、洗浄ユニット1217および分離部搬送ユニット1218の駆動中に発生するポジションセンサ異常により吸引/吐出位置エラー、反応ディスクユニットの温度センサ異常による温度異常エラーなどがある。これらの異常が生じた場合において、例えば、各プローブのポジションセンサのポジションセンサ異常のときは検体吸引位置、検体吐出位置、原点位置、原点外し位置等、複数の異なる種類のアラームが出力される。 First, the system output information of the preprocessing unit (SP) 121 will be described.
The system output information of the preprocessing unit (SP) 121 includes an aspiration position error due to an abnormality in the position sensor that occurs during driving of the
分離部(HPLC)122のシステム出力情報としては、ポンプのシリンダ、インジェクションバルブ、オートパージバルブ、入力側ストリームセレクトバルブ1225、出力側ストリームセレクトバルブ1226などの駆動中に発生するポジションセンサ異常によるポンプシリンダ位置およびバルブ位置エラーがある。ポンプユニット1222a,1223a,1224aには、流路内の圧力を監視するポンプ圧力センサが設けられており、流路の詰まり、リークなどを検知する圧力異常の検知がある。システム試薬ユニット1221には、リフタの異常位置を検知するポジションセンサ異常がある。システム試薬ユニット1221に架設される各試薬ボトル下部には重量センサが設置されており、各試薬ボトルの試薬量の監視を実施し、試薬が規定値より少なくなると試薬不足を検知する重量センサ異常がある。ヒータと、ヒートブロックと、分離カラムの表面温度をサーミスタでセンシングし、温度がしきい値以上のときに、温度異常を検知する温度異常がある。カラムオーブン内のカラムカートリッジの位置を検知するポジションセンサ異常によるカラム位置エラーがある。試料の吸引/吐出のシリンジ駆動中のシリンジ圧力の変動を監視し、圧力異常時にシリンジ内のつまり異常およびリーク異常がある。 Next, the system output information of the separator (HPLC) 122 will be described.
The system output information of the separation unit (HPLC) 122 includes pump cylinder position due to a position sensor abnormality that occurs during driving of the pump cylinder, injection valve, auto purge valve, input side stream
検出部(MS)123のイオン源ユニット1231には、エレクトロースプレーイオン化法(ESI)が用いられ、分離部(HPLC)122からの送液流路は、イオン源ユニット1231の溶液内の直径数百μmの配管を送液しながら、高温、高電圧、高電流が印加される。プローブ配管は2重配管になっており、中心は溶液が送液されており、外側の配管内および配管の外側には窒素ガスが噴霧されイオン化効率を向上させている。それぞれの温度、電圧値、電流値は監視されており、しきい値以上のときに、温度異常、電圧値異常、電流値異常を検知する。窒素ガスの流路も監視されており、しきい値を外れると異常を検知する。 Next, the system output information of the detector (MS) 123 will be explained.
Electrospray ionization (ESI) is used in the
ここで、システムアラーム判定部113における判定項目について説明する。異常であると判定された判定項目には、システムアラームデータベース111においてシステムアラームが付与される。
1)検体プローブ1213のポジションセンサ異常
2)試薬分注ユニット1214bのポジションセンサ異常
3)洗浄プローブ1216のポジションセンサ異常
4)検体プローブ1213の圧力センサ異常
5)試薬分注ユニット1214bの圧力センサ異常
6)洗浄プローブ1216の圧力センサ異常
7)反応ディスクユニット1212の温度センサ異常
8)検体搬送ユニット1211のポジションセンサ異常
9)反応ディスクユニット1212のポジションセンサ異常
10)洗浄ユニット1217のポジションセンサ異常
11)分離部搬送ユニット1218のポジションセンサ異常
12)ポンプシリンダ位置のポジションセンサ異常
13)インジェクションバルブのポジションセンサ異常
14)オートパージバルブのポジションセンサ異常
15)入力側ストリームセレクトバルブ1225のポジションセンサ異常
16)出力側ストリームセレクトバルブ1226のポジションセンサ異常
17)ポンプ、流路の圧力センサ異常
18)システム試薬ユニット1221、リフタのポジションセンサ異常
19)システム試薬ユニット1221の重量センサ
20)シリンジ圧力センサの圧力センサ異常
21)カラムオーブン、ヒータの温度異常
22)カラムオーブン、ヒートブロックの温度異常
23)カラムオーブン、分離カラム表面の温度異常
24)イオン源の温度異常
25)イオン源の電圧異常
26)イオン源の電流異常
27)Q0(突入、内部、出口)の電圧/電流異常
28)Q1(突入、内部、出口)の電圧/電流異常
29)Q2(突入、内部、出口)の電圧/電流異常
30)Q3(突入、内部、出口)の電圧/電流異常
なお、判定項目および判定方法は、上記したものに限定されるものではない。 <System alarm>
Here, determination items in the system
1) Abnormal position sensor of sample probe 1213 2) Abnormal position sensor of reagent pipetting unit 1214b 3) Abnormal position sensor of cleaning probe 1216 4) Abnormal pressure sensor of sample probe 1213 5) Abnormal pressure sensor of reagent pipetting unit 1214b 6 ) Abnormal pressure sensor of washing probe 1216 7) Abnormal temperature sensor of reaction disk unit 1212 8) Abnormal position sensor of sample transport unit 1211 9) Abnormal position sensor of reaction disk unit 1212 10) Abnormal position sensor of washing unit 1217 11) Separation 12) Pump cylinder position sensor error 13) Injection valve position sensor error 14) Auto purge valve position sensor error 15) Input side stream Select valve 1225 position sensor error 16) Output side stream Abnormal position sensor of select valve 1226 17) Abnormal pressure sensor of pump and channel 18) Abnormal position sensor of system reagent unit 1221 and lifter 19) Abnormal weight sensor of system reagent unit 1221 20) Abnormal pressure sensor of syringe pressure sensor 21) Column Oven and heater temperature anomalies 22) Column oven and heat block temperature anomalies 23) Column oven and separation column surface temperature anomalies 24) Ion source temperature anomalies 25) Ion source voltage anomalies 26) Ion source current anomalies 27) Q0 (inrush, internal, exit) voltage/current anomaly 28) Q1 (inrush, internal, exit) voltage/current anomaly 29) Q2 (inrush, internal, exit) voltage/current anomaly 30) Q3 (inrush, internal , outlet) voltage/current anomaly Note that the determination items and determination methods are not limited to those described above.
ポンプユニット122a,1223a,1224aは、設定流量を維持するために駆動する2つのシリンダ、流路内の空気を除去するために流路と廃液を切り替えるオートパージバルブ、流路内の圧力を監視するポンプ圧力センサから構成され、ポンプユニット122a,1223a,1224aから下流の流路の圧力異常を検知する。各シリンジに圧力センサは設置され、ポンプユニット122a,1223a,1224a後段の流路およびバルブ等の構成部品のつまりを検知することができる。また、「測定準備動作」のポンプ送液のグラジエントプログラムにおける圧力カーブ情報を出力する。前者はポンプ内のポンプシールや、接続部の耐圧を超過すると、部品劣化やリークのリスクがあることから80MPaのしきい値を設け、超過するとシステムアラームを生成し、装置を停止する。後者は、圧力カーブが正常時と異なる場合、例えば圧力カーブ立ち上がりが早いである場合は流路、接続部またはカラム本体が詰まりかけている、もしくは立ち上がりが遅い場合は流路、接続部またはカラム劣化(デッドボリューム)のリークが疑われる。また、定常圧力が正常時の値より高い場合は、圧力つまりが疑われ、低い場合はリークが疑われる。この場合、データアラームが生成される。 <A: Pressure sensor (rise), pressure sensor (pressure curve), retention time>
1)突然、圧力が変化して、かつ内部標準物質のピークが検出することができない場合、流路のつまりである可能性が高いと予測できる。
2)定期的に圧力カーブ情報と保持時間が経時変化している場合、カラム劣化(つまりも含む)である可能性が高いと予測できる。 Specifically, it can be estimated as follows.
1) If the pressure suddenly changes and the peak of the internal standard cannot be detected, it can be predicted that the channel is likely to be clogged.
2) If the pressure curve information and the retention time regularly change over time, it can be predicted that there is a high possibility of column deterioration (including that is).
また、上記の2)の場合には、ユーザはカラム交換のメンテナンスメニューを実施する。経時変化の情報が取得されているため、圧力カーブ情報と保持時間が経時変化している情報をGUI上に表示し、ユーザに明示することができる。 In the case of 1) above, since it can be predicted that the flow path will be highly clogged, the user performs a maintenance menu for predicting the location of pressure clogging. After identifying the pressure, that is, the location, parts can be replaced for items that can be handled by the user, such as probe replacement of the ion source, and other parts can be replaced by a service person.
In the case of 2) above, the user performs a maintenance menu for column replacement. Since the information on the change over time is acquired, the pressure curve information and the information on the change over time in the retention time can be displayed on the GUI and clearly shown to the user.
分離部(HPLC)122から内部標準物質が含まれる溶液が送液され、イオン源で高温、高電圧、高電流が印加され、イオン化される。内部標準物質が含まれる溶液には、ギ酸、酢酸アンモニウム、アンモニウム等の塩が含まれ、イオン化の過程で揮発性物質の酢酸アンモニウム塩および夾雑物が析出することがある。夾雑物は、HPLCの溶媒由来、流路部品の特にプラスチック部材由来、分離カラムで濃縮された成分由来が考えられる。イオン源のプローブは洗浄液で定期的に洗浄され、析出のリスクを軽減する。しなしながら、長期的な連続使用で塩が析出する場合がある。その際にはイオン源のプローブ表面または、イオン源入口のカウンタープレート上への塩および夾雑物の析出により、電圧印加が設定値に到達しない。この場合、析出した塩および夾雑物の影響により、検出部(MS)が出力する内部標準物質のm/zと同様のm/zをもつ塩および夾雑物由来の信号が検出される。内部標準物質のピークは分離部(HPLC)122の分離カラム1222c,1223c,1224cで濃縮され、同じHPLCグラジエントプログラムであれば、分離カラム1222c,1223c,1224cから溶出するタイミングは変化がない。つまり、決まった保持時間で内部標準物質のピークは検出される。析出した塩および夾雑物の影響により、内部標準物質のピークはイオン化阻害が生じ、本来のピーク強度より低くなる。検出部(MS)が出力する内部標準物質のm/zと同様のm/zをもつ塩および夾雑物由来の信号は保持時間に関係なく、常に一定量で検出され、一定量のバックグラウンドピークとして検出される。S/N(ピーク強度/バックグラウンドの比)の経時変化の情報を抽出することで、日々の装置状態を把握することができる。 <B: S/N (ratio of peak intensity/background), current value applied to ion source probe>
A solution containing an internal standard substance is sent from the separation unit (HPLC) 122 and ionized by applying high temperature, high voltage and high current in the ion source. A solution containing an internal standard substance contains salts such as formic acid, ammonium acetate, and ammonium, and a volatile ammonium acetate salt and contaminants may precipitate during the ionization process. Contaminants may be derived from the HPLC solvent, especially from plastic members of the channel parts, or from components concentrated in the separation column. The ion source probe is periodically cleaned with a cleaning solution to reduce the risk of deposits. However, salt may be precipitated by long-term continuous use. At that time, the voltage application does not reach the set value due to deposition of salts and contaminants on the probe surface of the ion source or on the counter plate of the ion source inlet. In this case, due to the influence of the precipitated salt and contaminants, a signal derived from the salt and contaminants having the same m/z as the m/z of the internal standard substance output by the detection unit (MS) is detected. The internal standard peaks are concentrated in the
1)突然、イオン源の電圧が変化して、かつ内部標準物質のピークが検出することができない場合、イオン源に電圧を印加するセンサ自体および電圧監視をしている部品そのもの不具合である可能性が高いと予測できる。
2)S/N(ピーク強度/バックグラウンドの比)およびイオン源の電圧の関係情報が経時変化している場合、イオン源のプローブまたはイオン源入口のカーテンプレートが汚染された可能性が高いと判断できる。 Specifically, it can be judged as follows.
1) If the voltage of the ion source suddenly changes and the peak of the internal standard substance cannot be detected, the sensor itself that applies the voltage to the ion source and the part that monitors the voltage itself may be defective. can be expected to be high.
2) If the relationship information of the S/N (peak intensity/background ratio) and the voltage of the ion source changes over time, it is highly likely that the probe of the ion source or the curtain plate at the entrance of the ion source has been contaminated. I can judge.
また、上記2)の場合には、ユーザはイオン源のプローブまたはイオン源入口のカーテンプレートの汚染を除去するメンテナンスメニューを実施する。メンテナンス前後のイオン源の電圧値を比較する、メンテナンス前後のS/N(ピーク強度/バックグラウンドの比)を比較することで汚染源除去の状態を把握することができる。 In case 1) above, it can be predicted that there is a high possibility that the sensor itself that applies the voltage to the ion source and the parts that monitor the voltage are defective, so the service person will replace the parts.
In the case of 2) above, the user performs a maintenance menu for removing contamination from the ion source probe or the curtain plate at the ion source entrance. By comparing the voltage value of the ion source before and after maintenance, and by comparing the S/N (ratio of peak intensity/background) before and after maintenance, the status of contamination source removal can be grasped.
試料導入ユニット1222b,1223b,1224bは、検体を吸引/吐出するシリンジと、シリンジの吸引/吐出状態を監視するシリンジ圧力センサを有する。前処理部(SP)121での前処理中に磁性ビーズが処理溶液に残存する、検体中の粘性成分、たとえばフィブリンの除去が不十分な場合に、試料導入のため、シリンジ吸引/吐出時に圧力センサから出力される圧力値が正常システムアラームと比較し、異常であると判断される。この場合は、システムアラームを生成し、GUI上に表示し、ユーザに明示することができる。また、異常値とは判断されないが、定期的な経時変化の情報で段階的に圧力値のピークが変化している情報が抽出される場合がある。 <C: Pressure value of syringe pressure sensor, peak intensity (area) of internal standard substance>
The
1)突然、シリンジ圧力センサから出力される圧力値が変化して、かつ内部標準物質のピーク強度(面積)が検出することができない場合、圧力センサ部品そのもの不具合である可能性が高いと判断できる。
2)定期的にシリンジ圧力センサおよび内部標準物質のピーク強度(面積)の関係情報が経時変化している場合、試料導入ユニット1222b,1223b,1224bを構成する流路の汚染による詰まりの可能性が高いと判断できる。 Specifically, it can be judged as follows.
1) If the pressure value output from the syringe pressure sensor suddenly changes and the peak intensity (area) of the internal standard cannot be detected, it can be determined that there is a high possibility that the pressure sensor part itself is defective. .
2) If the relationship information between the syringe pressure sensor and the peak intensity (area) of the internal standard substance periodically changes over time, there is a possibility of clogging due to contamination of the flow paths constituting the
また、上記の2)の場合には、ユーザは、メンテナンスメニューから試料導入ユニット1222b,1223b,1224bの洗浄のメンテナンス項目を実施し、その後、装置チェックを実施し、シリンジ圧力センサの値をモニタしながら、内部標準物質を測定し、内部標準物質のピーク強度(面積)の情報を正常値と比較することで装置状態の復帰作業を実施することができる。 In the above case 1), it can be determined that there is a high possibility that the syringe pressure sensor is malfunctioning, so that the service person can replace the parts.
In the case of 2) above, the user performs the maintenance item of cleaning the
試料導入ユニット1222b,1223b,1224bは、検体を吸引/吐出するシリンジと、シリンジの吸引/吐出状態を監視するシリンジ圧力センサを有する。システム試薬ユニット1221に架設される各試薬ボトル下部には重量センサが設置されており、各試薬ボトルの試薬量の監視を実施し、試薬が規定値より少なくなると試薬不足を検知する重量センサがある。検体を吸引/吐出中に、重量センサの検知により、試薬ボトルの試薬不足を検知する。試薬ボトルの試薬不足のしきい値は試薬ボトルの残量値が20%以下になると「警告」のシステムアラームを発行する。10%以下になると測定結果に影響があることからデータアラームを発行する。しかしながら、試薬ボトルからポンプ流路までの配管中には試薬が残存しているため、データアラームが発行されてから数測定の結果に影響しない可能性がある。つまり、試薬ボトル内の溶媒が10%以下になった場合でも、ポンプ以降の溶媒が残存していた場合は、測定結果に影響を与えない。 <D: weight sensor value (system reagent unit), pressure sensor (pressure curve), retention time>
The
なお、本発明は上記の実施の形態に限定されるものではなく、その要旨を逸脱しない範囲内の様々な変形例や組み合わせが含まれる。また、本発明は、上記の実施の形態で説明した全ての構成を備えるものに限定されず、その構成の一部を削除したものも含まれる。また、上記の各構成、機能等は、それらの一部又は全部を、例えば集積回路で設計する等により実現してもよい。また、上記の各構成、機能等は、プロセッサがそれぞれの機能を実現するプログラムを解釈し、実行することによりソフトウェアで実現してもよい。 <Appendix>
It should be noted that the present invention is not limited to the above-described embodiments, and includes various modifications and combinations within the scope of the invention. Moreover, the present invention is not limited to those having all the configurations described in the above embodiments, and includes those having some of the configurations omitted. Further, each of the above configurations, functions, etc. may be realized by designing a part or all of them, for example, with an integrated circuit. Moreover, each of the above configurations, functions, etc. may be realized by software by a processor interpreting and executing a program for realizing each function.
Claims (5)
- 前処理を実施された測定対象である試料の分離を行う分離部と、前記分離部で分離された前記試料の測定対象物質を検出する検出部とを有する分析装置と、
前記分析装置の動作を制御する制御装置とを備えた自動分析装置において、
前記制御装置は、
前記分析装置の前記試料に対する検出結果から生成された少なくとも1つの項目を含むデータ出力情報を格納するデータアラームデータベースと、
前記データ出力情報が正常状態であるか異常状態であるかを判定するために予め定めた基準データ出力情報を格納する正常用データアラームデータベースと、
前記データアラームデータベースの前記データ出力情報と前記正常用データアラームデータベースの前記基準データ出力情報とを比較し、異常状態であると判定した前記データアラームデータベースの前記データ出力情報の項目にデータアラームを付与するデータアラーム判定部と、
前記分析装置に設けられたセンサの検出結果から生成された少なくとも1つの項目を含むシステム出力情報を格納するシステムアラームデータベースと、
前記システム出力情報が正常状態であるか異常状態であるかを判定するために予め定めた基準システム出力情報を格納する正常用システムアラームデータベースと、
前記システムアラームデータベースの前記システム出力情報と前記正常用システムアラームデータベースの前記基準システム出力情報とを比較し、異常状態であると判定した前記システムアラームデータベースの前記データ出力情報の項目にデータアラームを付与するシステムアラーム判定部とを有し、
内部標準物質を試料として前記分析装置で得られて前記データアラームデータベースに格納されたデータ出力情報の経時変化と、前記システムアラームデータベースのシステム出力情報の経時変化とに基づいて、前記自動分析装置の故障状態の予兆診断を実施することを特徴とする自動分析装置。 an analysis device having a separation unit that separates a preprocessed sample to be measured, and a detection unit that detects a substance to be measured of the sample separated by the separation unit;
In an automatic analyzer comprising a control device that controls the operation of the analyzer,
The control device is
a data alarm database storing data output information including at least one item generated from a detection result of the analysis device for the sample;
a normal data alarm database storing predetermined reference data output information for determining whether the data output information is normal or abnormal;
The data output information in the data alarm database is compared with the reference data output information in the normal data alarm database, and a data alarm is assigned to the item of the data output information in the data alarm database determined to be in an abnormal state. a data alarm determination unit that
a system alarm database storing system output information including at least one item generated from a detection result of a sensor provided in the analysis device;
a normal system alarm database storing predetermined reference system output information for determining whether the system output information is normal or abnormal;
The system output information in the system alarm database is compared with the reference system output information in the normal system alarm database, and a data alarm is assigned to the item of the data output information in the system alarm database determined to be in an abnormal state. and a system alarm determination unit for
Based on changes over time in data output information obtained by the analysis apparatus using an internal standard substance as a sample and stored in the data alarm database, and changes over time in system output information in the system alarm database, the automatic analysis apparatus An automatic analyzer characterized by performing predictive diagnosis of a failure state. - 請求項1に係る自動分析装置において、
前記制御装置が前記システムアラームデータベースに格納するシステム出力情報は、
測定対象物質と内部標準物質のピーク面積比、
測定対象物質と内部標準物質のピーク強度比、
測定対象物質のピーク面積、
測定対象物質のピーク強度、
測定対象物質の保持時間、
測定対象物質のピーク幅、
測定対象物質の半値幅、
測定対象物質のピーク強度とバックグラウンドの比であるS/N比、
測定対象物質のリーディングファクタ、
測定対象物質のテーリングファクタ、
内部標準物質のピーク面積、
内部標準物質のピーク強度、
内部標準物質の保持時間、
内部標準物質のピーク幅、
内部標準物質の半値幅、
内部標準物質のピーク強度とバックグラウンドの比であるS/N比、
内部標準物質のリーディングファクタ、
内部標準物質のテーリングファクタ
の少なくともいずれか1つを含むことを特徴とする自動分析装置。 In the automatic analyzer according to claim 1,
The system output information stored in the system alarm database by the control device includes:
the peak area ratio of the substance to be measured and the internal standard substance,
The peak intensity ratio of the substance to be measured and the internal standard substance,
the peak area of the substance to be measured,
peak intensity of the substance to be measured,
retention time of the substance to be measured,
the peak width of the substance to be measured,
FWHM of the substance to be measured,
S/N ratio, which is the ratio of the peak intensity of the substance to be measured and the background,
the reading factor of the substance to be measured,
tailing factor of the substance to be measured,
peak area of the internal standard,
peak intensity of the internal standard,
retention time of the internal standard,
peak width of the internal standard,
FWHM of internal standard,
S / N ratio, which is the ratio of the peak intensity of the internal standard substance and the background,
reading factor of the internal standard,
An automatic analyzer comprising at least one tailing factor of an internal standard substance. - 請求項1記載の自動分析装置において、
前記制御装置が前記データアラームデータベースに格納するデータ出力情報は、
内部標準物質シグナル値、
内部標準物質同定チェック(内部標準物質の保持時間、ピーク幅、半値幅、S/N(ピーク強度/バックグラウンドの比)、
測定対象物質シグナル値、
測定対象物質同定チェック(内部標準物質の保持時間、ピーク幅、半値幅、S/N(ピーク強度/バックグラウンドの比)、
HPLC性能チェック(HPLCの圧力カーブ、ESIスプレ電流、内部標準物質のピーク幅、ピーク対称性、保持時間)、
MS性能チェック(ピークパラメータ、バックグラウンド強度、ノイズ値、コンタミネーションの情報)、
キャリブレーションカーブ情報、
QCチェック
の少なくともいずれか1つを含むことを特徴とする自動分析装置。 In the automatic analyzer according to claim 1,
The data output information stored in the data alarm database by the control device includes:
internal standard signal value,
Internal standard substance identification check (retention time of internal standard substance, peak width, half width, S/N (ratio of peak intensity/background),
signal value of the substance to be measured,
Identification check of substances to be measured (retention time of internal standard substance, peak width, half width, S/N (ratio of peak intensity/background),
HPLC performance check (HPLC pressure curve, ESI spray current, internal standard peak width, peak symmetry, retention time),
MS performance check (peak parameters, background intensity, noise value, contamination information),
calibration curve information,
An automated analyzer comprising at least one of QC checks. - 請求項1記載の自動分析装置において、
電源を投入した後に分析装置と制御装置の通信確認、各センサおよび各消耗品の状態確認を実施する立上げ工程の後に、ユーザまたはサービスパーソンがメンテナンス項目を選択し実施する測定前準備工程において、キャリブレーション試薬、QC試薬および検体のいずれも使用せずに、内部標準物質を指標として予兆診断を実施することを特徴とする自動分析装置。 In the automatic analyzer according to claim 1,
After the start-up process of checking the communication between the analyzer and the control device after turning on the power and checking the status of each sensor and each consumable, the user or service person selects and performs maintenance items in the pre-measurement preparation process, An automatic analyzer for performing predictive diagnosis using an internal standard substance as an index without using any of calibration reagents, QC reagents, and specimens. - 前処理を実施された測定対象である試料の分離を行う分離部と、前記分離部で分離された前記試料の測定対象物質を検出する検出部とを有する分析装置と、前記分析装置の動作を制御する制御装置とを備えた自動分析装置の故障状態の予兆診断方法において、
前記分析装置の前記試料に対する検出結果から生成された少なくとも1つの項目を含むデータ出力情報をデータアラームデータベースに格納する工程と、
前記データアラームデータベースの前記データ出力情報と予め定めた基準データ出力情報とを比較し、異常状態であると判定した前記データアラームデータベースの前記データ出力情報の項目にデータアラームを付与する工程と、
前記分析装置に設けられたセンサの検出結果から生成された少なくとも1つの項目を含むシステム出力情報をシステムアラームデータベースに格納する工程と、
前記システムアラームデータベースの前記システム出力情報と予め定めた基準システム出力情報とを比較し、異常状態であると判定した前記システムアラームデータベースの前記データ出力情報の項目にデータアラームを付与する工程と、
内部標準物質を試料として前記分析装置で得られて前記データアラームデータベースに格納されたデータ出力情報の経時変化と、前記システムアラームデータベースのシステム出力情報の経時変化とに基づいて故障状態の予兆診断を行う工程と
を有することを特徴とする自動分析装置の故障状態の予兆診断方法。 an analysis device having a separation unit that separates a pretreated sample to be measured, and a detection unit that detects a substance to be measured in the sample separated by the separation unit; and an operation of the analysis device. In a predictive diagnosis method for a failure state of an automatic analyzer comprising a control device for controlling
storing in a data alarm database data output information including at least one item generated from a detection result for the sample by the analyzer;
a step of comparing the data output information of the data alarm database with predetermined reference data output information, and assigning a data alarm to the item of the data output information of the data alarm database determined to be in an abnormal state;
a step of storing in a system alarm database system output information including at least one item generated from a detection result of a sensor provided in the analysis device;
a step of comparing the system output information in the system alarm database with predetermined reference system output information, and assigning a data alarm to the item of the data output information in the system alarm database determined to be in an abnormal state;
A predictive diagnosis of a failure state is performed based on changes over time in data output information obtained by using an internal standard substance as a sample and stored in the data alarm database and changes over time in system output information in the system alarm database. A predictive diagnosis method for a failure state of an automatic analyzer, comprising:
Priority Applications (3)
| Application Number | Priority Date | Filing Date | Title |
|---|---|---|---|
| CN202280029525.0A CN117321421A (en) | 2021-04-27 | 2022-02-02 | Automatic analysis device |
| JP2023517057A JPWO2022230282A1 (en) | 2021-04-27 | 2022-02-02 | |
| EP22795205.8A EP4332579A1 (en) | 2021-04-27 | 2022-02-02 | Automatic analysis device |
Applications Claiming Priority (2)
| Application Number | Priority Date | Filing Date | Title |
|---|---|---|---|
| JP2021-074742 | 2021-04-27 | ||
| JP2021074742 | 2021-04-27 |
Publications (1)
| Publication Number | Publication Date |
|---|---|
| WO2022230282A1 true WO2022230282A1 (en) | 2022-11-03 |
Family
ID=83848258
Family Applications (1)
| Application Number | Title | Priority Date | Filing Date |
|---|---|---|---|
| PCT/JP2022/004104 WO2022230282A1 (en) | 2021-04-27 | 2022-02-02 | Automatic analysis device |
Country Status (4)
| Country | Link |
|---|---|
| EP (1) | EP4332579A1 (en) |
| JP (1) | JPWO2022230282A1 (en) |
| CN (1) | CN117321421A (en) |
| WO (1) | WO2022230282A1 (en) |
Citations (8)
| Publication number | Priority date | Publication date | Assignee | Title |
|---|---|---|---|---|
| JP2005283332A (en) * | 2004-03-30 | 2005-10-13 | Shimadzu Corp | Validation system and validation program |
| JP2008089616A (en) | 2007-12-28 | 2008-04-17 | Sysmex Corp | Clinical specimen processing device and clinical specimen processing system |
| JP2011053229A (en) * | 2004-07-22 | 2011-03-17 | Wako Pure Chem Ind Ltd | Analysis assisting method, analyzer, remote computer, data analyzing method, program, and reagent container |
| US20110245089A1 (en) * | 2009-11-18 | 2011-10-06 | Qiagen Gaithersburg, Inc. | Laboratory central control unit method and system |
| WO2019007868A1 (en) | 2017-07-04 | 2019-01-10 | F. Hoffmann-La Roche Ag | Automated clinical diagnostic system and method |
| WO2019111312A1 (en) * | 2017-12-05 | 2019-06-13 | 株式会社島津製作所 | Biological sample analysis system |
| WO2020084886A1 (en) * | 2018-10-25 | 2020-04-30 | 株式会社日立ハイテク | Automated analyzer |
| WO2021002431A1 (en) * | 2019-07-04 | 2021-01-07 | 株式会社日立ハイテク | Automatic analysis device |
-
2022
- 2022-02-02 EP EP22795205.8A patent/EP4332579A1/en active Pending
- 2022-02-02 CN CN202280029525.0A patent/CN117321421A/en active Pending
- 2022-02-02 WO PCT/JP2022/004104 patent/WO2022230282A1/en active Application Filing
- 2022-02-02 JP JP2023517057A patent/JPWO2022230282A1/ja active Pending
Patent Citations (9)
| Publication number | Priority date | Publication date | Assignee | Title |
|---|---|---|---|---|
| JP2005283332A (en) * | 2004-03-30 | 2005-10-13 | Shimadzu Corp | Validation system and validation program |
| JP2011053229A (en) * | 2004-07-22 | 2011-03-17 | Wako Pure Chem Ind Ltd | Analysis assisting method, analyzer, remote computer, data analyzing method, program, and reagent container |
| JP2008089616A (en) | 2007-12-28 | 2008-04-17 | Sysmex Corp | Clinical specimen processing device and clinical specimen processing system |
| US20110245089A1 (en) * | 2009-11-18 | 2011-10-06 | Qiagen Gaithersburg, Inc. | Laboratory central control unit method and system |
| WO2019007868A1 (en) | 2017-07-04 | 2019-01-10 | F. Hoffmann-La Roche Ag | Automated clinical diagnostic system and method |
| JP2020525798A (en) * | 2017-07-04 | 2020-08-27 | エフ ホフマン−ラ ロッシュ アクチェン ゲゼルシャフト | Automated clinical diagnostic system and method |
| WO2019111312A1 (en) * | 2017-12-05 | 2019-06-13 | 株式会社島津製作所 | Biological sample analysis system |
| WO2020084886A1 (en) * | 2018-10-25 | 2020-04-30 | 株式会社日立ハイテク | Automated analyzer |
| WO2021002431A1 (en) * | 2019-07-04 | 2021-01-07 | 株式会社日立ハイテク | Automatic analysis device |
Also Published As
| Publication number | Publication date |
|---|---|
| JPWO2022230282A1 (en) | 2022-11-03 |
| EP4332579A1 (en) | 2024-03-06 |
| CN117321421A (en) | 2023-12-29 |
Similar Documents
| Publication | Publication Date | Title |
|---|---|---|
| US11275065B2 (en) | Automated clinical diagnostic system and method | |
| JP5520841B2 (en) | Biological sample pretreatment device and mass spectrometer equipped with the same | |
| JP7399330B2 (en) | Automatic analyzer and its cleaning method | |
| CN109557292B (en) | Calibration method | |
| EP2116852B1 (en) | Automatic analyzer | |
| US20210063361A1 (en) | Techniques for checking state of analyzers | |
| JP7227948B2 (en) | Techniques for checking the condition of analyzers | |
| EP3394614B1 (en) | Method of detecting the presence or absence of a clot in a liquid sample analyzer | |
| WO2022230282A1 (en) | Automatic analysis device | |
| WO2020121726A1 (en) | Automated analyzer | |
| EP3872500A1 (en) | Automated analyzer | |
| JPH049756A (en) | Liquid chromatograph analyser | |
| WO2023153073A1 (en) | Component abnormality detecting system, automated analyzing device, and component abnormality detecting method | |
| US20230417784A1 (en) | Control method of sample pretreatment apparatus | |
| CN114544795B (en) | Anomaly detection of gas flow parameters in mass spectrometry | |
| WO2022270267A1 (en) | Diagnosis system, automated analysis device, and diagnostic method |
Legal Events
| Date | Code | Title | Description |
|---|---|---|---|
| 121 | Ep: the epo has been informed by wipo that ep was designated in this application |
Ref document number: 22795205 Country of ref document: EP Kind code of ref document: A1 |
|
| DPE1 | Request for preliminary examination filed after expiration of 19th month from priority date (pct application filed from 20040101) | ||
| WWE | Wipo information: entry into national phase |
Ref document number: 2023517057 Country of ref document: JP |
|
| WWE | Wipo information: entry into national phase |
Ref document number: 2022795205 Country of ref document: EP |
|
| NENP | Non-entry into the national phase |
Ref country code: DE |
|
| ENP | Entry into the national phase |
Ref document number: 2022795205 Country of ref document: EP Effective date: 20231127 |