WO2022201968A1 - 情報処理装置、制御プログラム、および制御方法 - Google Patents
情報処理装置、制御プログラム、および制御方法 Download PDFInfo
- Publication number
- WO2022201968A1 WO2022201968A1 PCT/JP2022/005821 JP2022005821W WO2022201968A1 WO 2022201968 A1 WO2022201968 A1 WO 2022201968A1 JP 2022005821 W JP2022005821 W JP 2022005821W WO 2022201968 A1 WO2022201968 A1 WO 2022201968A1
- Authority
- WO
- WIPO (PCT)
- Prior art keywords
- image
- inspection target
- target area
- information processing
- difference
- Prior art date
Links
- 230000010365 information processing Effects 0.000 title claims abstract description 25
- 238000000034 method Methods 0.000 title claims description 14
- 230000005856 abnormality Effects 0.000 claims abstract description 38
- 238000004364 calculation method Methods 0.000 claims abstract description 23
- 238000007689 inspection Methods 0.000 claims description 170
- 230000002950 deficient Effects 0.000 claims description 20
- 238000012549 training Methods 0.000 claims description 11
- 239000000284 extract Substances 0.000 claims description 6
- 238000001514 detection method Methods 0.000 abstract description 13
- 238000012545 processing Methods 0.000 abstract description 3
- 238000010586 diagram Methods 0.000 description 23
- 238000013528 artificial neural network Methods 0.000 description 6
- 239000004744 fabric Substances 0.000 description 5
- 238000003384 imaging method Methods 0.000 description 5
- 238000003062 neural network model Methods 0.000 description 5
- 238000004891 communication Methods 0.000 description 4
- 230000006870 function Effects 0.000 description 4
- 238000010801 machine learning Methods 0.000 description 4
- 230000002159 abnormal effect Effects 0.000 description 3
- 238000006243 chemical reaction Methods 0.000 description 3
- 230000007547 defect Effects 0.000 description 3
- 230000015654 memory Effects 0.000 description 3
- 238000011179 visual inspection Methods 0.000 description 3
- 238000004519 manufacturing process Methods 0.000 description 2
- 238000005259 measurement Methods 0.000 description 2
- 239000004065 semiconductor Substances 0.000 description 2
- 230000002547 anomalous effect Effects 0.000 description 1
- 230000002542 deteriorative effect Effects 0.000 description 1
- 238000002845 discoloration Methods 0.000 description 1
- 230000000694 effects Effects 0.000 description 1
- 238000005516 engineering process Methods 0.000 description 1
- 238000012986 modification Methods 0.000 description 1
- 230000004048 modification Effects 0.000 description 1
- 239000007787 solid Substances 0.000 description 1
- 238000011144 upstream manufacturing Methods 0.000 description 1
- 235000012431 wafers Nutrition 0.000 description 1
Images


Classifications
-
- G—PHYSICS
- G06—COMPUTING; CALCULATING OR COUNTING
- G06T—IMAGE DATA PROCESSING OR GENERATION, IN GENERAL
- G06T7/00—Image analysis
- G06T7/0002—Inspection of images, e.g. flaw detection
- G06T7/0004—Industrial image inspection
- G06T7/001—Industrial image inspection using an image reference approach
-
- G—PHYSICS
- G06—COMPUTING; CALCULATING OR COUNTING
- G06V—IMAGE OR VIDEO RECOGNITION OR UNDERSTANDING
- G06V10/00—Arrangements for image or video recognition or understanding
- G06V10/20—Image preprocessing
- G06V10/25—Determination of region of interest [ROI] or a volume of interest [VOI]
-
- G—PHYSICS
- G06—COMPUTING; CALCULATING OR COUNTING
- G06V—IMAGE OR VIDEO RECOGNITION OR UNDERSTANDING
- G06V10/00—Arrangements for image or video recognition or understanding
- G06V10/70—Arrangements for image or video recognition or understanding using pattern recognition or machine learning
- G06V10/74—Image or video pattern matching; Proximity measures in feature spaces
- G06V10/761—Proximity, similarity or dissimilarity measures
-
- G—PHYSICS
- G06—COMPUTING; CALCULATING OR COUNTING
- G06T—IMAGE DATA PROCESSING OR GENERATION, IN GENERAL
- G06T2207/00—Indexing scheme for image analysis or image enhancement
- G06T2207/20—Special algorithmic details
- G06T2207/20081—Training; Learning
-
- G—PHYSICS
- G06—COMPUTING; CALCULATING OR COUNTING
- G06T—IMAGE DATA PROCESSING OR GENERATION, IN GENERAL
- G06T2207/00—Indexing scheme for image analysis or image enhancement
- G06T2207/20—Special algorithmic details
- G06T2207/20084—Artificial neural networks [ANN]
-
- G—PHYSICS
- G06—COMPUTING; CALCULATING OR COUNTING
- G06T—IMAGE DATA PROCESSING OR GENERATION, IN GENERAL
- G06T2207/00—Indexing scheme for image analysis or image enhancement
- G06T2207/30—Subject of image; Context of image processing
- G06T2207/30108—Industrial image inspection
- G06T2207/30124—Fabrics; Textile; Paper
Definitions
- the present invention relates to an information processing device, a control program, and a control method.
- defective products are sorted by detecting product defects through visual inspections.
- visual inspection techniques such as detecting defects by pattern matching with a reference image using the image of the product.
- Patent Document 1 discloses the following visual inspection technology using machine learning.
- an autoencoder or the like is trained so as to restore the normal image data.
- a learned self-encoder or the like is used to calculate a difference between restored data generated from image data of an object photographed by a camera or the like and the image data. Then, the abnormality of the object is determined based on the magnitude of the difference. This eliminates the need to align the normal image and the image of the object, which serve as a reference for abnormality determination.
- the present invention was made to solve the above problems. In other words, even if an area other than the inspection target area is reflected in the image of the object, or even if the appearance of the object may partially change due to the nature of the object, erroneous detection of abnormality can be suppressed. , an information processing device, a control program, and a control method.
- a generating unit that acquires an image and generates a reconstructed image based on the image, a specifying unit that specifies an inspection target area in the image based on the image, the image and the reconstructed image and a calculation unit that calculates the difference in the inspection target area from the above.
- the calculation unit compares a portion of the inspection target region extracted from the image with a portion corresponding to the inspection target region extracted from the reconstructed image, thereby calculating the difference in the inspection target region.
- the calculation unit extracts the difference corresponding to the inspection target area from among the differences calculated by comparing the entire image and the entire reconstructed image, thereby extracting the inspection target area.
- the information processing apparatus according to (1) or (2) above, which calculates the difference in the area.
- the specifying unit specifies the inspection target area by estimating the inspection target area from the image using a trained model machine-learned so as to estimate the inspection target area from the image.
- the information processing apparatus according to any one of (1) to (4) above.
- step (10) a step (a) of acquiring an image and generating a reconstructed image based on the image; a step (b) of specifying an inspection target region in the image based on the image; A control program for causing a computer to execute a procedure (c) of calculating a difference in the inspection target area from the reconstructed image.
- (11) acquiring an image and generating a reconstructed image based on the image; (b) identifying a region to be inspected in the image based on the image; and (c) calculating a difference in the inspection area from the reconstructed image.
- the inspection target area in the image is specified based on the image, and the difference between the reconstructed image generated based on the image and the inspection target area of the image is calculated.
- FIG. 1 is a block diagram of an inspection device;
- FIG. 4 is a functional block diagram of a control unit;
- FIG. FIG. 4 is an explanatory diagram for explaining generation of a reconstructed image;
- FIG. 10 is an explanatory diagram for explaining identification of an inspection target area based on an image;
- FIG. 10 is a diagram showing a user interface screen for designating an inspection target area in an image of a normal product;
- FIG. 10 is an explanatory diagram for explaining calculation of a difference in an inspection target region between an image and a reconstructed image; It is a figure which shows the example of the inspection object area
- FIG. 4 is a diagram showing an example of corresponding regions extracted from a reconstructed image; It is a figure which shows the example of an abnormality score map. It is a flow chart which shows operation of an inspection system.
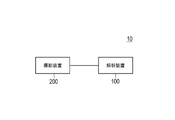
- FIG. 1 is a diagram showing the configuration of the inspection system 10.
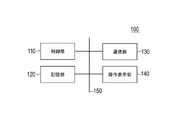
- FIG. 2 is a block diagram of an inspection device 100 included in the inspection system 10.
- the inspection device 100 may be composed of a plurality of devices.
- the inspection device 100 constitutes an information processing device.
- the inspection system 10 may include an inspection device 100 and an imaging device 200.
- the imaging device 200 captures an image 210 (hereinafter also simply referred to as "image 210") of an inspection target 220 (see FIG. 4), which is an object.
- Image 210 may be an image of all or part of object 220 .
- Image 210 may be an image that includes things other than object 220 .
- the photographing device 200 is configured by, for example, a camera.
- the object 220 is, for example, a product, and the product includes not only finished products such as cloth and semiconductor chips, but also unfinished products such as semiconductor wafers upstream of the manufacturing process and parts such as automobile doors.
- Image 210 may be, for example, a black and white image or a color image, and may be a 128 pixel by 128 pixel image.
- the imaging device 200 transmits the image 210 to the inspection device 100 .
- the inspection apparatus 100 detects (inspects) an abnormality to be analyzed based on the image 210 .
- Abnormalities include, for example, stains, discoloration, scratches, chips, breaks, bends, and the like.
- the inspection apparatus 100 can detect an abnormality in the target 220 by outputting an abnormality degree indicating the degree of abnormality.
- the inspection apparatus 100 includes a control section 110, a storage section 120, a communication section 130, and an operation display section 140. These components are connected to each other via bus 150 .
- the inspection device 100 is configured by, for example, a computer terminal.
- the control unit 110 is composed of a CPU (Central Processing Unit), RAM (Random Access Memory), ROM (Read Only Memory), and other memories, and performs control and arithmetic processing of each unit of the inspection apparatus 100 according to a program. Details of the functions of the control unit 110 will be described later.
- CPU Central Processing Unit
- RAM Random Access Memory
- ROM Read Only Memory
- the storage unit 120 is configured by a HDD (Hard Disc Drive), SSD (Solid State Drive), etc., and stores various programs and various data.
- HDD Hard Disc Drive
- SSD Solid State Drive
- the communication unit 130 is an interface circuit (for example, a LAN card, etc.) for communicating with an external device via a network.
- an interface circuit for example, a LAN card, etc.
- the operation display unit 140 may be composed of, for example, a touch panel.
- the operation display unit 140 receives various inputs from the user.
- the operation display unit 140 displays various types of information including detection results of abnormality of the target 220 .
- control unit 110 The function of the control unit 110 will be explained.
- FIG. 3 is a functional block diagram of the control unit 110. As shown in FIG. Control unit 110 functions as generation unit 111 , identification unit 112 , and calculation unit 113 .
- the generation unit 111 acquires the image 210 and generates a reconstructed image 230 based on the image 210 .
- FIG. 4 is an explanatory diagram for explaining generation of a reconstructed image.
- the generation unit 111 generates a reconstructed image 230 of the cloth, which is the target 220, based on the image 210 of the cloth, which is the target 220.
- the generation unit 111 generates a reconstructed image 230 that reproduces the features of a normal product.
- the generation unit 111 may be configured by an autoencoder using a neural network, for example. To simplify the explanation, the generation unit 111 is assumed to be an autoencoder.
- the autoencoder that constitutes the generation unit 111 is trained in advance using a relatively large amount of training data of images 210 of normal products.
- the autoencoder by inputting the normal product image 210 to the autoencoder, the difference (loss) between the output image (reconstructed image) output from the autoencoder and the normal product image 210 is eliminated. Pre-learned by backpropagation.
- the autoencoder is trained using training data of only good images 210 .
- the autoencoder is thereby trained to reproduce the features of a good product in the output image. That is, the autoencoder can generate a reconstructed image 230 that reproduces the characteristics of a normal product based on the input image 210 regardless of whether the image 210 is an image of a normal product or an image of a defective product. .
- An object may be reflected in a non-inspection area outside the inspection area 212 (see FIG. 5) where inspection is required.
- the non-inspection area reflected in the image 210 is not reproduced or is incompletely reproduced in the reconstructed image 230 due to an abnormal reaction in the generation of the reconstructed image 230 by the generation unit 111.
- FIG. 5 there is a possibility that the non-inspection area reflected in the image 210 is not reproduced or is incompletely reproduced in the reconstructed image 230 due to an abnormal reaction in the generation of the reconstructed image 230 by the generation unit 111.
- the reconstructed image 230 shows a case where the diagram 211 for dimension measurement in the non-inspection area is not reproduced.
- Such a phenomenon occurs because, for example, the image 210 of the training data used for learning of the autoencoder constituting the generation unit 111 does not show the diagram 211 of the non-inspection area, or the image 210 of the diagram 211 does not appear. It is considered that the cause is that the upper position is fluctuating.
- the rounded ends of the cloth, which are part of the object 220, and the like, which are located in the non-inspection area are not fixed in the rolled state, so there is a possibility that the appearance may vary. As such, portions of such object 220 may also not be reproduced or be incompletely reproduced in reconstructed image 230 due to abnormal reactions in the generation of reconstructed image 230 .
- the generation unit 111 preferably generates a reconstructed image 230 of an area including the inspection target area 212 and wider than the inspection target area 212 from the image 210 including the inspection target area 212 and the area wider than the inspection target area 212 .
- the inspection target area 212 is extracted from the image 210 and the reconstructed image 230 is generated based on the image of only the inspection target area 212, the reconstruction accuracy is reduced in a part (edge) of the inspection target area 212.
- the reconstruction accuracy is reduced in a part (edge) of the inspection target area 212.
- a part of the inspection target area 212 can be generated. It is possible to prevent the reconstruction accuracy from deteriorating at the part.
- the identifying unit 112 identifies an inspection target area 212 in the image 210 based on the image 210 .
- the inspection target area 212 is, for example, a rectangular area in the image 210, and the specifying unit 112 can specify the inspection target area 212 by the diagonal coordinates of the rectangle, for example.
- the inspection target area 212 is assumed to be rectangular.
- the coordinates of the diagonal corners of the rectangle specified by the specifying unit 112 as the inspection target area 212 are also referred to as "specified coordinates 213" (see FIG. 5).
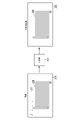
- FIG. 5 is an explanatory diagram for explaining identification of the inspection target area 212 based on the image 210.
- FIG. 5 an inspection target area 212 is also indicated by a dashed line in the image 210 for the sake of simplicity of explanation.
- the specifying unit 112 can specify the inspection target area 212 in the image 210 by template matching with the image 210 using the input template image 240 of the inspection target area 212 of the normal product.
- Template image 240 constitutes a predetermined reference image.
- Template matching is a method of detecting a portion of image 210 that is most similar to template image 240 by shifting template image 240 on image 210 pixel by pixel and calculating similarity.
- the target 220 may have features such as patterns in addition to features of shape.
- the identifying unit 112 can identify the inspection target region 212 in each input image 210 using the template image 240 . Note that the specifying unit 112 may specify the inspection target region 212 in each of the plurality of images 210 by using the coordinates of the inspection target region 212 specified based on one image 210 in common for the plurality of images 210. good.
- Template image 240 may be specified, for example, as follows.
- Control unit 110 constitutes a reception unit, displays image 210 of a normal product on operation display unit 140 , and receives specification of inspection target area 212 by the user as specification of template image 240 .
- the template image 240 can be specified for each product.
- the template image 240 can be stored in the storage unit 120 in association with the product (for example, identification data specifying the product).
- the identification unit 112 acquires from the storage unit 120 the template image 240 associated with the product to which the object 220 in the image 210 belongs.
- FIG. 6 is a diagram showing the user interface screen 141 for designating the inspection target area 212 in the image 210 of the normal product.
- a user interface screen 141 can be displayed on the operation display unit 140 .
- an image 210 of a normal product is displayed on the user interface screen 141.
- the user inputs the inspection target area 212 by, for example, clicking a pair of diagonal positions (positions indicated by white circles in FIG. 6) of the rectangle on the displayed image 210, thereby forming the rectangle. It may be designated as an inspection target area 212 .
- the designation of the template image 240 described above is preferably performed when the generating unit 111 learns. Since the image 210 used as training data when the generation unit 111 learns is the image 210 of a normal product, the designation of the inspection target region 212 is performed when the generation unit 111 learns, so that the inspection target region 212 can be specified in a short time and efficiently. can be done.
- the identifying unit 112 may identify the inspection target area 212 in the image 210 by machine learning. Specifically, a neural network model learned from these training data is used, with the inspection target area 212 on the normal product image 210 as a positive example and the area not including the inspection target area 212 as a negative example. Then, the inspection target area 212 may be specified by classifying the inspection target area 212 on the image 210 from the image 210 using the model of the neural network. Known methods such as VGG, EfficientNet, and Vision Transformer can be used for detection of the inspection target region 212 using the neural network.
- an image 210 of a normal product is input data
- an inspection target area 212 on the image 210 (specifically, the range of the inspection target area 212 on the image 210, for example, an inspection target area 212 on the image 210 A set of diagonal coordinates of a rectangle with ) is used as a correct label, and a neural network model learned from these training data is used.
- the inspection target area 212 may be specified by detecting the inspection target area 212 on the image 210 from the image 210 using the model of the neural network.
- Known methods such as YOLO, EfficientDet, and Detection Transformer can be used to detect the inspection target region 212 using a neural network.
- the inspection target region 212 used as the correct label in learning the neural network model can be specified as follows.
- the control unit 110 displays an image 210 of a normal product on the operation display unit 140 and accepts designation of an inspection target area 212 by the user. Specifically, the control unit 110 causes the two positions input by the user by clicking or the like on the image 210 of the normal product displayed on the operation display unit 140 to be displayed on the image 210 as a rectangular area to be inspected 212 . as a pair of diagonal coordinates of . As a result, the inside of the rectangle in the image 210 diagonally opposite the two accepted positions is specified as the inspection target area 212 .
- the designation by the user of the inspection target region 212 used as the correct label in the learning of the neural network model can be performed by the user interface screen 141 (see FIG. 6) for specifying the inspection target region 212 in the normal product image 210 described above. It can be done using similar user interface screens.
- the learning of the identifying unit 112 is preferably performed when the generating unit 111 learns.
- An image 210 used as training data when the generating unit 111 learns is an image 210 of a normal product. Therefore, by specifying the inspection target region 212 to be used as the correct label for learning of the identifying unit 112 during learning of the generating unit 111, training data used for learning of the identifying unit 112 can be efficiently obtained.
- the identifying unit 112 can identify the inspection target area 212 in the image 210 as the specific coordinates 213 described above.
- the calculation unit 113 calculates the difference in the inspection target area 212 between the image 210 and the reconstructed image 230 . Specifically, the calculation unit 113 calculates a portion of the inspection target region 212 extracted from the image 210 and a portion corresponding to the inspection target region 212 extracted from the reconstructed image 230 (hereinafter referred to as “corresponding region 231” (see FIG. 7). ) may be compared to calculate the difference in the region of interest 212 between the image 210 and the reconstructed image 230 .
- FIG. 7 is an explanatory diagram for explaining calculation of the difference in the inspection target area 212 between the image 210 and the reconstructed image 230.
- FIG. 7 In order to simplify the explanation, a corresponding region 231 is also shown in the reconstructed image 230 .
- a target 220 is also shown in the diagram showing the specific coordinates 213 .
- the calculation unit 113 can use the specific coordinates 213 specified by the specifying unit 112 to extract the corresponding region 231 in the reconstructed image 230 . That is, the calculation unit 113 extracts, as the corresponding region 231 , a rectangle having the specific coordinates 213 as one set of diagonals in the reconstructed image 230 .
- the calculation unit 113 extracts the difference corresponding to the inspection target region 212 from among the differences calculated by comparing the entire image 210 and the entire reconstructed image 230, thereby obtaining the image 210 and the reconstructed image. 230 may be calculated.
- the difference in the inspection target area 212 between the image 210 and the reconstructed image 230 may be a pixel-by-pixel difference.
- the calculation unit 113 can calculate the difference in the inspection target region 212 between the image 210 and the reconstructed image 230 as an abnormality score map indicating the degree of abnormality.
- the abnormality score map is a diagram showing the score of the degree of abnormality corresponding to the magnitude of the difference between the image 210 and the reconstructed image 230, for example, by color, brightness, density, etc. in units of pixels. In the anomaly score map, highly anomalous portions of the object 220 may be highlighted.
- the score of the degree of abnormality may be the magnitude of the difference between the image 210 and the reconstructed image 230 (for example, the absolute difference in pixel values). It may be the ratio of the difference (for example, 0.3).
- the calculation unit 113 outputs the calculated abnormality score map.
- the calculation unit 113 can output the abnormality score map by displaying the abnormality score map on the operation display unit 140 .
- the calculation unit 113 may output the abnormality score map by transmitting the abnormality score map from the communication unit 130 to an external device or the like.
- FIG. 8A is a diagram showing an example of an inspection target area 212 extracted from an image 210 of a defective product.
- FIG. 8B is a diagram showing an example of the corresponding region 231 extracted from the reconstructed image 230.
- FIG. 8C is a diagram showing an example of an anomaly score map.
- FIG. 8A an inspection target area 212 of a defective product image 210 including a round dirt defect is shown.
- FIG. 8B a corresponding region 231 of a reconstructed image 230 reconstructed from the defective image 210 is shown. Since the reconstructed image 230 is reconstructed by extracting the features of the non-defective product from the image 210 of the defective product, the image is an image without (disappeared) the defective round dirt.
- FIG. 8C shows an abnormality score map generated based on the comparison between the inspection target region 212 of FIG. 8A and the corresponding region 231 of FIG. 8B. As shown in FIG. 8C, in the abnormality score map, the abnormality score for each pixel can be indicated by a color or the like corresponding to the magnitude of the abnormality score.
- FIG. 9 is a flowchart showing the operation of the inspection system 10.
- FIG. This flowchart can be executed by the control unit 110 of the inspection apparatus 100 according to a program.
- the control unit 110 acquires the image 210 by receiving it from the imaging device 200 (S101).
- the control unit 110 may acquire the image 210 by reading the image 210 stored in the storage unit 120 .
- control unit 110 Based on the image 210, the control unit 110 generates a reconstructed image 230 by reconstructing the image 210 using an autoencoder or the like (S102).
- the control unit 110 reads the template image 240 corresponding to the image 210 from the storage unit 120 (S103).
- the control unit 110 identifies the inspection target area 212 by template matching between the image 210 and the template image 240 (S104).
- the control unit 110 extracts the inspection target area 212 from the image 210 (S105).
- the control unit 110 extracts the corresponding area 231 from the reconstructed image 230 (S106).
- the control unit 110 generates an abnormality score map by comparing the extracted inspection target region 212 of the image 210 with the corresponding region 231 of the reconstructed image 230 (S107).
- the control unit 110 outputs an abnormality score map (S108).
- the embodiment has the following effects.
- the inspection target area in the image is specified based on the image, and the difference between the reconstructed image generated based on the image and the inspection target area of the image is calculated.
- the inspection target area is specified for each image based on the image. As a result, the abnormality detection accuracy can be improved.
- the difference in the inspection target area is calculated. Therefore, the amount of calculations for abnormality detection can be reduced.
- the difference in the inspection target area is calculated by extracting the difference corresponding to the inspection target area from among the differences calculated by comparing the entire image and the reconstructed image. This makes it possible to more easily prevent erroneous detection of abnormalities.
- the inspection target area in the image is specified by pattern matching between the image and a predetermined reference image. This makes it possible to specify the inspection target area easily and with high accuracy.
- the inspection target area is specified by estimating the inspection target area from the image using a machine-learned model that has been machine-learned to estimate the inspection target area from the image.
- the inspection target area can be specified with high accuracy.
- a machine-learned model that accepts designation of an inspection target area in a non-defective image, uses the designated inspection target area as training data, and performs machine learning to estimate the inspection target area from the image. do.
- the inspection target area can be specified with high accuracy.
- the degree of abnormality of the image is calculated based on the difference between the reconstructed image and the inspection target area of the image. This makes it possible to directly grasp product abnormalities.
- the information processing apparatus, the control program, and the control method described above have described the main configurations in describing the features of the above-described embodiments, and are not limited to the above-described configurations. Various modifications can be made. Moreover, the configuration provided in a general information processing apparatus or the like is not excluded.
- steps may be omitted from the above-described flowchart, and other steps may be added. Also, part of each step may be executed simultaneously, or one step may be divided into a plurality of steps and executed.
- the means and methods for performing various processes in the system described above can be realized by either dedicated hardware circuits or programmed computers.
- the program may be provided by a computer-readable recording medium such as a USB memory or a DVD (Digital Versatile Disc)-ROM, or may be provided online via a network such as the Internet.
- the program recorded on the computer-readable recording medium is usually transferred to and stored in a storage unit such as a hard disk.
- the above program may be provided as independent application software, or may be incorporated as one function into the software of the device such as the abnormality detection device.
- 10 inspection system 100 inspection device, 110 control unit, 111 generator, 112 specific part, 113 calculation unit, 120 storage unit, 130 Communication Department, 140 operation display unit, 200 imaging device, 210 images, 212 inspection target area; 213 specific coordinates, 220 subject, 230 reconstructed image, 231 corresponding regions, 240 template images.
Landscapes
- Engineering & Computer Science (AREA)
- Theoretical Computer Science (AREA)
- Computer Vision & Pattern Recognition (AREA)
- Physics & Mathematics (AREA)
- General Physics & Mathematics (AREA)
- Multimedia (AREA)
- Quality & Reliability (AREA)
- Artificial Intelligence (AREA)
- Health & Medical Sciences (AREA)
- Computing Systems (AREA)
- Databases & Information Systems (AREA)
- Evolutionary Computation (AREA)
- General Health & Medical Sciences (AREA)
- Medical Informatics (AREA)
- Software Systems (AREA)
- Image Analysis (AREA)
- Image Processing (AREA)
Abstract
Description
100 検査装置、
110 制御部、
111 生成部、
112 特定部、
113 算出部、
120 記憶部、
130 通信部、
140 操作表示部、
200 撮影装置、
210 画像、
212 検査対象領域、
213 特定座標、
220 対象、
230 再構成画像、
231 対応領域、
240 テンプレート画像。
Claims (11)
- 画像を取得して、前記画像に基づいて再構成画像を生成する生成部と、
前記画像に基づいて、前記画像における検査対象領域を特定する特定部と、
前記画像と前記再構成画像との前記検査対象領域における差異を算出する算出部と、
を有する情報処理装置。 - 前記特定部は、前記画像ごとに、前記画像に基づいて前記検査対象領域を特定する、請求項1に記載の情報処理装置。
- 前記算出部は、前記画像から抽出した前記検査対象領域の部分と、前記再構成画像から抽出した前記検査対象領域に対応する部分とを比較することで、前記検査対象領域における前記差異を算出する、請求項1または2に記載の情報処理装置。
- 前記算出部は、前記画像全体と、前記再構成画像全体とを比較することで算出した前記差異の中から、前記検査対象領域に対応する前記差異を抽出することで、前記検査対象領域における前記差異を算出する、請求項1または2に記載の情報処理装置。
- 前記特定部は、所定の基準画像と前記画像とのパターンマッチングにより、前記画像における前記検査対象領域を特定する、請求項1~4のいずれか一項に記載の情報処理装置。
- 前記特定部は、前記画像から前記検査対象領域を推定するように機械学習された学習済モデルを用いて、前記画像から前記検査対象領域を推定することにより、前記検査対象領域を特定する、請求項1~4のいずれか一項に記載の情報処理装置。
- 良品の前記画像である良品画像における前記検査対象領域の指定を受け付ける受付部をさらに有し、
前記学習済モデルは、前記指定がされた前記検査対象領域を訓練データとして、前記画像から前記検査対象領域を推定するように機械学習される、請求項6に記載の情報処理装置。 - 良品の前記画像である良品画像における前記検査対象領域の指定を受け付ける受付部をさらに有し、
前記特定部は、前記指定がされた前記検査対象領域に基づいて、前記画像における前記検査対象領域を特定する、請求項1~5のいずれか一項に記載の情報処理装置。 - 前記算出部は、前記差異に基づいて前記画像の異常度を算出する、請求項1~8のいずれか一項に記載の情報処理装置。
- 画像を取得して、前記画像に基づいて再構成画像を生成する手順(a)と、
前記画像に基づいて、前記画像における検査対象領域を特定する手順(b)と、
前記画像と前記再構成画像との前記検査対象領域における差異を算出する手順(c)と
、
をコンピューターに実行させるための制御プログラム。 - 画像を取得して、前記画像に基づいて再構成画像を生成する段階(a)と、
前記画像に基づいて、前記画像における検査対象領域を特定する段階(b)と、
前記画像と前記再構成画像との前記検査対象領域における差異を算出する段階(c)と
、
を有する制御方法。
Priority Applications (4)
| Application Number | Priority Date | Filing Date | Title |
|---|---|---|---|
| CN202280022813.3A CN117083630A (zh) | 2021-03-26 | 2022-02-15 | 信息处理装置、控制程序以及控制方法 |
| JP2023508773A JPWO2022201968A1 (ja) | 2021-03-26 | 2022-02-15 | |
| EP22774768.0A EP4318391A4 (en) | 2021-03-26 | 2022-02-15 | INFORMATION PROCESSING DEVICE, CONTROL PROGRAM AND CONTROL METHOD |
| US18/283,974 US20240161271A1 (en) | 2021-03-26 | 2022-02-15 | Information processing apparatus, control program, and control method |
Applications Claiming Priority (2)
| Application Number | Priority Date | Filing Date | Title |
|---|---|---|---|
| JP2021052771 | 2021-03-26 | ||
| JP2021-052771 | 2021-03-26 |
Publications (1)
| Publication Number | Publication Date |
|---|---|
| WO2022201968A1 true WO2022201968A1 (ja) | 2022-09-29 |
Family
ID=83396923
Family Applications (1)
| Application Number | Title | Priority Date | Filing Date |
|---|---|---|---|
| PCT/JP2022/005821 WO2022201968A1 (ja) | 2021-03-26 | 2022-02-15 | 情報処理装置、制御プログラム、および制御方法 |
Country Status (5)
| Country | Link |
|---|---|
| US (1) | US20240161271A1 (ja) |
| EP (1) | EP4318391A4 (ja) |
| JP (1) | JPWO2022201968A1 (ja) |
| CN (1) | CN117083630A (ja) |
| WO (1) | WO2022201968A1 (ja) |
Citations (6)
| Publication number | Priority date | Publication date | Assignee | Title |
|---|---|---|---|---|
| WO2018105028A1 (ja) | 2016-12-06 | 2018-06-14 | 三菱電機株式会社 | 検査装置及び検査方法 |
| WO2020031984A1 (ja) * | 2018-08-08 | 2020-02-13 | Blue Tag株式会社 | 部品の検査方法及び検査システム |
| JP2020160616A (ja) * | 2019-03-25 | 2020-10-01 | ブラザー工業株式会社 | 生成装置、コンピュータプログラム、生成方法 |
| JP2020187735A (ja) * | 2019-05-13 | 2020-11-19 | 富士通株式会社 | 表面欠陥識別方法及び装置 |
| JP2020187656A (ja) * | 2019-05-16 | 2020-11-19 | 株式会社キーエンス | 画像検査装置 |
| JP2021052771A (ja) | 2013-03-15 | 2021-04-08 | モジュラー ジェネティクス, インコーポレイテッド | アシルアミノ酸の生成 |
Family Cites Families (1)
| Publication number | Priority date | Publication date | Assignee | Title |
|---|---|---|---|---|
| JP2020187657A (ja) * | 2019-05-16 | 2020-11-19 | 株式会社キーエンス | 画像検査装置 |
-
2022
- 2022-02-15 WO PCT/JP2022/005821 patent/WO2022201968A1/ja active Application Filing
- 2022-02-15 US US18/283,974 patent/US20240161271A1/en active Pending
- 2022-02-15 CN CN202280022813.3A patent/CN117083630A/zh active Pending
- 2022-02-15 EP EP22774768.0A patent/EP4318391A4/en active Pending
- 2022-02-15 JP JP2023508773A patent/JPWO2022201968A1/ja active Pending
Patent Citations (6)
| Publication number | Priority date | Publication date | Assignee | Title |
|---|---|---|---|---|
| JP2021052771A (ja) | 2013-03-15 | 2021-04-08 | モジュラー ジェネティクス, インコーポレイテッド | アシルアミノ酸の生成 |
| WO2018105028A1 (ja) | 2016-12-06 | 2018-06-14 | 三菱電機株式会社 | 検査装置及び検査方法 |
| WO2020031984A1 (ja) * | 2018-08-08 | 2020-02-13 | Blue Tag株式会社 | 部品の検査方法及び検査システム |
| JP2020160616A (ja) * | 2019-03-25 | 2020-10-01 | ブラザー工業株式会社 | 生成装置、コンピュータプログラム、生成方法 |
| JP2020187735A (ja) * | 2019-05-13 | 2020-11-19 | 富士通株式会社 | 表面欠陥識別方法及び装置 |
| JP2020187656A (ja) * | 2019-05-16 | 2020-11-19 | 株式会社キーエンス | 画像検査装置 |
Non-Patent Citations (1)
| Title |
|---|
| See also references of EP4318391A4 |
Also Published As
| Publication number | Publication date |
|---|---|
| EP4318391A1 (en) | 2024-02-07 |
| CN117083630A (zh) | 2023-11-17 |
| US20240161271A1 (en) | 2024-05-16 |
| JPWO2022201968A1 (ja) | 2022-09-29 |
| EP4318391A4 (en) | 2024-09-25 |
Similar Documents
| Publication | Publication Date | Title |
|---|---|---|
| US7155052B2 (en) | Method for pattern inspection | |
| JP7004145B2 (ja) | 欠陥検査装置、欠陥検査方法、及びそのプログラム | |
| WO2019117065A1 (ja) | データ生成装置、データ生成方法及びデータ生成プログラム | |
| TWI798516B (zh) | 取樣檢驗的方法及其系統與非暫態電腦可讀取儲存媒體 | |
| US8115169B2 (en) | Method and apparatus of pattern inspection and semiconductor inspection system using the same | |
| TWI684000B (zh) | 產生檢查配方的方法及其系統 | |
| KR101992970B1 (ko) | 딥러닝과 노이즈 제거 기술을 이용한 표면 결함 검출 장치 및 방법 | |
| JP7453813B2 (ja) | 検査装置、検査方法、プログラム、学習装置、学習方法、および学習済みデータセット | |
| JP7492240B2 (ja) | 分析装置及び分析方法 | |
| CN117274258B (zh) | 主板图像的缺陷检测方法、系统、设备及存储介质 | |
| WO2020137121A1 (ja) | 画像処理装置、画像処理方法、及び画像処理プログラム | |
| WO2022130814A1 (ja) | 指標選択装置、情報処理装置、情報処理システム、検査装置、検査システム、指標選択方法、および指標選択プログラム | |
| JP2014126445A (ja) | 位置合せ装置、欠陥検査装置、位置合せ方法、及び制御プログラム | |
| JP2006113073A (ja) | パターン欠陥検査装置及びパターン欠陥検査方法 | |
| WO2022201968A1 (ja) | 情報処理装置、制御プログラム、および制御方法 | |
| JP2023145412A (ja) | 欠陥検出方法及びシステム | |
| CN112084728B (zh) | 基于pix2pix的PCB灰度图像着色方法及系统 | |
| JP7475901B2 (ja) | 試験片上の欠陥検出の方法およびそのシステム | |
| JP7462377B1 (ja) | 方法、プログラム、情報処理装置、及び学習済みモデル | |
| KR102686135B1 (ko) | 인공지능을 활용한 결함 검사 방법 및 인공지능을 활용한 결함 검사 장치 | |
| WO2021229901A1 (ja) | 画像検査装置、画像検査方法及び学習済みモデル生成装置 | |
| WO2024062854A1 (ja) | 画像処理装置および画像処理方法 | |
| US20230005120A1 (en) | Computer and Visual Inspection Method | |
| CN113808136B (zh) | 一种基于最近邻算法的液晶屏幕缺陷检测方法和系统 | |
| JP7459696B2 (ja) | 異常検知システム、学習装置、異常検知プログラム、学習プログラム、異常検知方法、および学習方法演算装置の学習方法 |
Legal Events
| Date | Code | Title | Description |
|---|---|---|---|
| 121 | Ep: the epo has been informed by wipo that ep was designated in this application |
Ref document number: 22774768 Country of ref document: EP Kind code of ref document: A1 |
|
| WWE | Wipo information: entry into national phase |
Ref document number: 2023508773 Country of ref document: JP |
|
| WWE | Wipo information: entry into national phase |
Ref document number: 202280022813.3 Country of ref document: CN |
|
| WWE | Wipo information: entry into national phase |
Ref document number: 18283974 Country of ref document: US |
|
| WWE | Wipo information: entry into national phase |
Ref document number: 2022774768 Country of ref document: EP |
|
| NENP | Non-entry into the national phase |
Ref country code: DE |
|
| ENP | Entry into the national phase |
Ref document number: 2022774768 Country of ref document: EP Effective date: 20231026 |