WO2022185644A1 - 画像処理装置、画像処理装置の作動方法、画像処理装置の作動プログラム、並びに学習方法 - Google Patents
画像処理装置、画像処理装置の作動方法、画像処理装置の作動プログラム、並びに学習方法 Download PDFInfo
- Publication number
- WO2022185644A1 WO2022185644A1 PCT/JP2021/045209 JP2021045209W WO2022185644A1 WO 2022185644 A1 WO2022185644 A1 WO 2022185644A1 JP 2021045209 W JP2021045209 W JP 2021045209W WO 2022185644 A1 WO2022185644 A1 WO 2022185644A1
- Authority
- WO
- WIPO (PCT)
- Prior art keywords
- image
- point
- map
- line
- unit
- Prior art date
- Legal status (The legal status is an assumption and is not a legal conclusion. Google has not performed a legal analysis and makes no representation as to the accuracy of the status listed.)
- Ceased
Links
Images


Classifications
-
- G—PHYSICS
- G06—COMPUTING OR CALCULATING; COUNTING
- G06V—IMAGE OR VIDEO RECOGNITION OR UNDERSTANDING
- G06V10/00—Arrangements for image or video recognition or understanding
- G06V10/70—Arrangements for image or video recognition or understanding using pattern recognition or machine learning
- G06V10/82—Arrangements for image or video recognition or understanding using pattern recognition or machine learning using neural networks
-
- G—PHYSICS
- G06—COMPUTING OR CALCULATING; COUNTING
- G06T—IMAGE DATA PROCESSING OR GENERATION, IN GENERAL
- G06T7/00—Image analysis
- G06T7/10—Segmentation; Edge detection
- G06T7/12—Edge-based segmentation
-
- A—HUMAN NECESSITIES
- A61—MEDICAL OR VETERINARY SCIENCE; HYGIENE
- A61B—DIAGNOSIS; SURGERY; IDENTIFICATION
- A61B6/00—Apparatus or devices for radiation diagnosis; Apparatus or devices for radiation diagnosis combined with radiation therapy equipment
- A61B6/02—Arrangements for diagnosis sequentially in different planes; Stereoscopic radiation diagnosis
- A61B6/03—Computed tomography [CT]
-
- G—PHYSICS
- G06—COMPUTING OR CALCULATING; COUNTING
- G06N—COMPUTING ARRANGEMENTS BASED ON SPECIFIC COMPUTATIONAL MODELS
- G06N20/00—Machine learning
-
- G—PHYSICS
- G06—COMPUTING OR CALCULATING; COUNTING
- G06T—IMAGE DATA PROCESSING OR GENERATION, IN GENERAL
- G06T5/00—Image enhancement or restoration
- G06T5/20—Image enhancement or restoration using local operators
- G06T5/30—Erosion or dilatation, e.g. thinning
-
- G—PHYSICS
- G06—COMPUTING OR CALCULATING; COUNTING
- G06T—IMAGE DATA PROCESSING OR GENERATION, IN GENERAL
- G06T7/00—Image analysis
-
- G—PHYSICS
- G06—COMPUTING OR CALCULATING; COUNTING
- G06T—IMAGE DATA PROCESSING OR GENERATION, IN GENERAL
- G06T7/00—Image analysis
- G06T7/10—Segmentation; Edge detection
- G06T7/13—Edge detection
-
- G—PHYSICS
- G06—COMPUTING OR CALCULATING; COUNTING
- G06V—IMAGE OR VIDEO RECOGNITION OR UNDERSTANDING
- G06V10/00—Arrangements for image or video recognition or understanding
- G06V10/20—Image preprocessing
- G06V10/26—Segmentation of patterns in the image field; Cutting or merging of image elements to establish the pattern region, e.g. clustering-based techniques; Detection of occlusion
-
- G—PHYSICS
- G06—COMPUTING OR CALCULATING; COUNTING
- G06V—IMAGE OR VIDEO RECOGNITION OR UNDERSTANDING
- G06V10/00—Arrangements for image or video recognition or understanding
- G06V10/40—Extraction of image or video features
- G06V10/44—Local feature extraction by analysis of parts of the pattern, e.g. by detecting edges, contours, loops, corners, strokes or intersections; Connectivity analysis, e.g. of connected components
- G06V10/443—Local feature extraction by analysis of parts of the pattern, e.g. by detecting edges, contours, loops, corners, strokes or intersections; Connectivity analysis, e.g. of connected components by matching or filtering
- G06V10/449—Biologically inspired filters, e.g. difference of Gaussians [DoG] or Gabor filters
- G06V10/451—Biologically inspired filters, e.g. difference of Gaussians [DoG] or Gabor filters with interaction between the filter responses, e.g. cortical complex cells
- G06V10/454—Integrating the filters into a hierarchical structure, e.g. convolutional neural networks [CNN]
-
- G—PHYSICS
- G06—COMPUTING OR CALCULATING; COUNTING
- G06V—IMAGE OR VIDEO RECOGNITION OR UNDERSTANDING
- G06V10/00—Arrangements for image or video recognition or understanding
- G06V10/70—Arrangements for image or video recognition or understanding using pattern recognition or machine learning
- G06V10/764—Arrangements for image or video recognition or understanding using pattern recognition or machine learning using classification, e.g. of video objects
-
- G—PHYSICS
- G06—COMPUTING OR CALCULATING; COUNTING
- G06T—IMAGE DATA PROCESSING OR GENERATION, IN GENERAL
- G06T2207/00—Indexing scheme for image analysis or image enhancement
- G06T2207/10—Image acquisition modality
- G06T2207/10116—X-ray image
-
- G—PHYSICS
- G06—COMPUTING OR CALCULATING; COUNTING
- G06T—IMAGE DATA PROCESSING OR GENERATION, IN GENERAL
- G06T2207/00—Indexing scheme for image analysis or image enhancement
- G06T2207/20—Special algorithmic details
- G06T2207/20084—Artificial neural networks [ANN]
-
- G—PHYSICS
- G06—COMPUTING OR CALCULATING; COUNTING
- G06T—IMAGE DATA PROCESSING OR GENERATION, IN GENERAL
- G06T2207/00—Indexing scheme for image analysis or image enhancement
- G06T2207/30—Subject of image; Context of image processing
- G06T2207/30004—Biomedical image processing
- G06T2207/30008—Bone
- G06T2207/30012—Spine; Backbone
-
- G—PHYSICS
- G06—COMPUTING OR CALCULATING; COUNTING
- G06V—IMAGE OR VIDEO RECOGNITION OR UNDERSTANDING
- G06V2201/00—Indexing scheme relating to image or video recognition or understanding
- G06V2201/03—Recognition of patterns in medical or anatomical images
Definitions
- the technology of the present disclosure relates to an image processing device, an image processing device operating method, an image processing device operating program, and a learning method.
- CNN Convolutional Neural Network
- Japanese Patent Application Laid-Open No. 2020-025730 describes that a radiographic image obtained by irradiating a patient with radiation is used as an image to be analyzed, and a plurality of objects appearing in the radiographic image are identified using CNN.
- objects include lung fields, the spine (backbone), and other regions, and separate identification of the thoracic and lumbar vertebrae of the spine is also described.
- objects with a certain size such as lung fields or spines
- objects with a certain size can be identified with relatively high accuracy.
- fine objects such as the center point of the vertebral bodies of the vertebrae, the center point of the left and right eyeballs, or the center line of the aorta.
- An embodiment according to the technology of the present disclosure provides an image processing device capable of accurately identifying minute objects, an operating method of the image processing device, an operating program of the image processing device, and a learning method.
- the image processing device of the present disclosure includes a processor and a memory connected to or built into the processor, the processor providing one point corresponding to an object, a plurality of discrete points corresponding to a plurality of objects, and an annotation image in which a first pixel corresponding to at least one of a line corresponding to an object having a line structure has a first pixel value, and other second pixels have a second pixel value different from the first pixel value
- a semantic segmentation model trained using input, output from the semantic segmentation model a feature map having features associated with at least one of a point, a plurality of discrete points, and a line in the image to be analyzed, and based on the feature map , a point, a plurality of discrete points, and/or a line in the image to be analyzed.
- the processor preferably identifies the center of gravity of the feature quantity map based on the feature quantities as one point.
- the feature quantity map is a probability distribution map having the existence probability of a plurality of discrete points as a feature quantity
- the processor generates an output image in which each pixel is labeled with a class corresponding to the existence probability of the probability distribution map, Preferably, a plurality of discrete points are identified based on the output image.
- the feature quantity map is a probability distribution map having the existence probabilities of a plurality of discrete points as a feature quantity, and the processor selects a plurality of discrete points as candidates for a predetermined threshold from each element of the probability distribution map. Elements with existence probabilities equal to or greater than the above are selected, rectangular frames of a preset size are assigned to the selected candidates, non-maximum suppression processing is performed on the rectangular frames, and based on the results of the non-maximum suppression processing, discrete It is preferable to identify a plurality of points that are
- the feature map is a probability distribution map having line existence probabilities as feature quantities
- the processor generates an output image in which each pixel is labeled with a class corresponding to the existence probability of the probability distribution map.
- a thinning process is applied and the lines are identified based on the result of the thinning process.
- the feature quantity map is a probability distribution map having the existence probability of a line as a feature quantity
- the processor selects an element having an existence probability equal to or higher than a preset threshold from each element of the probability distribution map as a candidate for the line.
- a rectangular frame of a preset size is assigned to the selected candidate, a non-maximum suppression process is performed on the rectangular frame, and a line is identified based on the result of the non-maximum suppression process.
- the image to be analyzed is a medical image of the inside of the patient's body, and the object is the structure of the body.
- the operating method of the image processing apparatus of the present disclosure includes at least one of one point corresponding to an object, a plurality of discrete points corresponding to a plurality of objects, and a line corresponding to an object having a line structure.
- the operating program of the image processing apparatus of the present disclosure includes at least one of one point corresponding to an object, a plurality of discrete points corresponding to a plurality of objects, and a line corresponding to an object having a line structure.
- the learning method of the present disclosure corresponds to at least one of a point corresponding to an object, a plurality of discrete points corresponding to multiple objects, and a line corresponding to an object having a line structure.
- a semantic segmentation model that outputs a feature map with features associated with at least one of a point, discrete points, and lines in the image to be analyzed. let them learn
- an image processing device capable of accurately identifying minute objects, an operation method of the image processing device, an operation program of the image processing device, and a learning method.
- FIG. 10 illustrates a semantic segmentation model for point extraction
- FIG. 4 is an explanatory diagram of convolution processing performed on target data
- FIG. 10 is a diagram showing an output part of a semantic segmentation model for point extraction
- FIG. 10 is a diagram showing an output part of a semantic segmentation model for point extraction
- FIG. 4 is a diagram showing an outline of processing in the learning phase of the semantic segmentation model for point extraction;
- FIG. 11 illustrates non-maximum suppression processing;
- FIG. 4 is a diagram showing how point position information is generated based on a point image and a point position display map is generated based on the point position information;
- FIG. 3 illustrates a semantic segmentation model for object identification;
- FIG. 4 is an explanatory diagram of convolution processing performed on a tomographic image and a point position display map;
- FIG. 10 is a diagram showing an output image;
- FIG. 4 is a diagram showing an outline of processing in a learning phase of a semantic segmentation model for object identification; It is a figure which shows a labeling result. It is a figure which shows a 2nd screen.
- FIG. 4 is a flow chart showing a processing procedure of the diagnostic support device; It is a figure which shows the extraction part of 2nd Embodiment. It is a figure which shows the semantic segmentation model for point extraction of 2nd Embodiment. It is a figure which shows the output part of the semantic segmentation model for point extraction of 2nd Embodiment.
- FIG. 10 is a diagram showing how point position information is generated based on an output image; It is a figure which shows the extraction part of 3rd Embodiment. It is a figure which shows a mode that point position information is produced
- FIG. 4 is a diagram showing how line position information is generated based on an output image; It is a figure which shows another example of the extraction part of 4th Embodiment.
- FIG. 11 illustrates non-maximum suppression processing; It is a figure which shows a mode that line position information is produced
- the medical system 2 includes a CT (Computed Tomography) device 10 , a PACS (Picture Archiving and Communication System) server 11 , and a diagnosis support device 12 .
- CT apparatus 10 Computed Tomography
- PACS Physical Archiving and Communication System
- diagnosis support apparatus 12 are connected to a LAN (Local Area Network) 13 laid in the medical facility, and can communicate with each other via the LAN 13 .
- LAN Local Area Network
- the CT apparatus 10 radiographs the patient P at different projection angles to obtain a plurality of pieces of projection data, and reconstructs the obtained plurality of pieces of projection data to create a tomographic image 15 of the patient P. Output.
- the tomographic image 15 is voxel data representing the three-dimensional shape of the patient's P internal structure.
- the tomographic image 15 is an image of the upper body of the patient P (hereinafter referred to as an upper tomographic image).
- FIG. 1 shows an upper tomographic image 15S of a sagittal section.
- the upper tomographic image 15 shows the spine SP made up of a plurality of vertebrae VB.
- CT apparatus 10 transmits upper tomographic image 15 to PACS server 11 .
- the PACS server 11 stores and manages upper tomographic images 15 from the CT apparatus 10 .
- the upper tomographic image 15 is an example of an “analysis target image” and a “medical image” according to the technology of the present disclosure.
- Vertebra VB is also an example of the "object” and "structure” of this disclosure. Note that reconstruction of projection data may be performed by the diagnostic support device 12 or the like instead of the CT device 10 .
- the diagnosis support device 12 is, for example, a desktop personal computer, and is an example of an "image processing device" according to the technology of the present disclosure.
- the diagnosis support device 12 has a display 17 and an input device 18 .
- the input device 18 is a keyboard, mouse, touch panel, microphone, or the like.
- the doctor operates the input device 18 to transmit a distribution request for the upper tomographic image 15 of the patient P to the PACS server 11 .
- the PACS server 11 retrieves the upper tomographic image 15 of the patient P whose delivery has been requested and delivers it to the diagnosis support apparatus 12 .
- the diagnosis support device 12 displays the upper tomographic image 15 delivered from the PACS server 11 on the display 17 .
- the doctor observes the vertebrae VB of the patient P shown in the upper tomographic image 15 and diagnoses fractures, bone metastasis of cancer, and the like.
- CT device 10 and one diagnostic support device 12 are illustrated in FIG. 1, a plurality of CT devices 10 and multiple diagnostic support devices 12 may be provided.
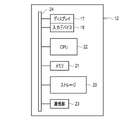
- the computer constituting the diagnostic support device 12 includes a storage 20, a memory 21, a CPU (Central Processing Unit) 22, and a communication section 23 in addition to the display 17 and the input device 18 described above. I have. These are interconnected via bus lines 24 .
- the CPU 22 is an example of a “processor” according to the technology of the present disclosure.
- the storage 20 is a hard disk drive built into the computer constituting the diagnosis support device 12 or connected via a cable or network.
- the storage 20 is a disk array in which a plurality of hard disk drives are connected.
- the storage 20 stores a control program such as an operating system, various application programs, various data associated with these programs, and the like.
- a solid state drive may be used instead of the hard disk drive.
- the memory 21 is a work memory for the CPU 22 to execute processing.
- the CPU 22 loads the program stored in the storage 20 into the memory 21 and executes processing according to the program. Thereby, the CPU 22 comprehensively controls each part of the computer.
- the communication unit 23 controls transmission of various information with an external device such as the PACS server 11 . Note that the memory 21 may be built in the CPU 22 .
- the operating program 30 is stored in the storage 20 of the diagnostic support device 12 .
- the operating program 30 is an application program for causing a computer that configures the diagnosis support device 12 to function as an "image processing device” according to the technology of the present disclosure. That is, the operation program 30 is an example of the "image processing apparatus operation program” according to the technology of the present disclosure.
- the storage 20 also stores an upper tomographic image 15, a semantic segmentation (hereinafter abbreviated as SS) model 32 for point extraction, and an SS model 33 for object identification.
- the point extraction SS model 32 is an example of a “semantic segmentation model” according to the technology of the present disclosure.
- the storage 20 also stores the doctor's findings on the vertebrae VB shown in the upper tomographic image 15, various screen data displayed on the display 17, and the like.
- the CPU 22 of the computer that constitutes the diagnostic support device 12 cooperates with the memory 21 and the like to operate a read/write (hereinafter abbreviated as RW (Read Write)) control unit 40 and an instruction reception unit. 41 , an extraction unit 42 , a point position display map generation unit 43 , an object identification unit 44 , an anatomical name assignment unit 45 , and a display control unit 46 .
- RW Read Write
- the RW control unit 40 controls storage of various data in the storage 20 and reading of various data in the storage 20 .
- the RW control unit 40 receives the upper tomographic image 15 from the PACS server 11 and stores the received upper tomographic image 15 in the storage 20 .
- the RW control unit 40 receives the upper tomographic image 15 from the PACS server 11 and stores the received upper tomographic image 15 in the storage 20 .
- a plurality of upper tomographic images 15 may be stored in the storage 20 .
- the RW control unit 40 reads the upper tomographic image 15 of the patient P designated by the doctor for diagnosis from the storage 20, and transfers the read upper tomographic image 15 to the extraction unit 42, the object identification unit 44, and the display control unit 46. output to The RW control unit 40 also reads the point extraction SS model 32 from the storage 20 and outputs the read point extraction SS model 32 to the extraction unit 42 . Further, the RW control unit 40 reads the object identification SS model 33 from the storage 20 and outputs the read object identification SS model 33 to the object identification unit 44 .
- the instruction reception unit 41 receives various instructions from the doctor through the input device 18.
- the instructions received by the instruction receiving unit 41 include, for example, an analysis instruction for the upper tomographic image 15 and a finding storage instruction for storing the findings for the vertebrae VB in the storage 20 .
- the instruction receiving unit 41 When the instruction receiving unit 41 receives an analysis instruction, it outputs that fact to the extracting unit 42 . Further, when receiving a finding storage instruction, the instruction accepting unit 41 outputs that fact to the RW control unit 40 together with the finding.
- the extraction unit 42 uses the point extraction SS model 32 to extract points within each vertebra VB appearing in the upper tomographic image 15 .
- the central point CP of the vertebral body (see FIG. 12, etc.) is extracted as the point within the vertebra VB.
- the extraction unit 42 generates point position information 50 representing the position of the center point CP of the vertebral body.
- the extractor 42 outputs the point position information 50 to the point position display map generator 43 .
- the center point CP of the vertebral body is an example of "a plurality of discrete points" according to the technology of the present disclosure.
- the point position display map generation unit 43 generates a point position display map 51 representing the position of the center point CP of the vertebral body in the upper tomographic image 15 based on the point position information 50 from the extraction unit 42 .
- the central point CP of the vertebral body is represented by one pixel 136 (see FIG. 16) in the upper tomographic image 15.
- FIG. The point position display map generator 43 outputs the point position display map 51 to the object identification unit 44 .
- the object identification unit 44 identifies each vertebra VB based on the upper tomographic image 15 and the point position display map 51 . More specifically, the object identification unit 44 inputs the upper tomographic image 15 and the point position display map 51 to the object identification SS model 33, and outputs an output image 52 (see also FIG. 17) in which each vertebra VB is identified. ) is output from the SS model 33 for object identification. The object identifying section 44 outputs the output image 52 to the anatomical naming section 45 .
- the anatomical name assigning unit 45 assigns an anatomical name to each vertebra VB identified in the output image 52 .
- the anatomical naming unit 45 outputs to the display control unit 46 an assignment result 53 that is the result of assigning an anatomical name to the vertebrae VB.
- the display control unit 46 controls the display of various screens on the display 17.
- Various screens include a first screen 60 (FIG. 4 (see FIG. 20), and a second screen 155 (see FIG. 20) that displays the grant result 53, and the like.
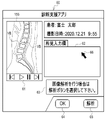
- FIG. 4 shows an example of the first screen 60 for instructing analysis of the upper tomographic image 15 .
- On the first screen 60 for example, an upper tomographic image 15S of a sagittal section of a patient P whose spine SP is to be diagnosed is displayed.
- a button group 61 for switching the display is provided below the upper tomographic image 15S.
- the upper tomographic image 15 of the axial section and the coronal section may be displayed.
- a finding input field 62 On the first screen 60, a finding input field 62, a message 63, an OK button 64, and an analysis button 65 are displayed.
- the doctor inputs the finding of the vertebra VB.
- the doctor moves the cursor 66 to the OK button 64 and selects it.
- the instruction receiving unit 41 receives the finding storage instruction.
- the RW control unit 40 associates the upper tomographic image 15 with the finding input in the finding input field 62 and stores them in the storage 20 .
- the message 63 prompts the user to select the analysis button 65. If the doctor wishes to analyze the upper tomographic image 15 prior to inputting his findings, he moves the cursor 66 to the analysis button 65 and selects it. Accordingly, the instruction receiving unit 41 receives the instruction to analyze the upper tomographic image 15 and outputs the instruction to the extracting unit 42 .
- the extraction unit 42 has an analysis unit 70 , a selection unit 71 , a non-maximum suppression processing unit 72 , and a conversion unit 73 .
- the analysis unit 70 inputs the upper tomographic image 15 to the SS model 32 for point extraction, and causes the SS model 32 for point extraction to output a probability distribution map 74 indicating the existence probability of the center point CP of the vertebral body.
- the analysis unit 70 outputs the probability distribution map 74 to the selection unit 71 .
- the probability distribution map 74 has elements 80 corresponding to the pixels 136 of the upper tomographic image 15 on a one-to-one basis. This is data in which pairs of probability and non-existence probability are registered. For example, element values (1.0, 0) represent that the existence probability of the central point CP of the vertebral body is 100% and the non-existence probability is 0%.
- the probability distribution map 74 is an example of a "feature quantity map" according to the technology of the present disclosure. Also, the element value of each element 80 of the probability distribution map 74 is an example of the "feature amount" according to the technology of the present disclosure.
- the selection unit 71 selects the elements 80 whose presence probability of the vertebral body center point CP is equal to or greater than a threshold value (for example, 0.9) as a vertebral body center point CP candidate 120 ( (see FIG. 13).
- the selection unit 71 generates a point candidate image 75 (see also FIG. 13) representing the selected candidate 120 and outputs the generated point candidate image 75 to the non-maximum suppression processing unit 72 .
- the point candidate image 75 is, for example, an image in which the pixel value of the pixel corresponding to the candidate 120 is 1 and the pixel value of the other pixels is 0.
- the non-maximum suppression processing unit 72 performs non-maximum suppression processing on each candidate 120 of the point candidate image 75, and as a result, generates a point image 76 (see also FIG. 13) representing the center point CP of the vertebral body.
- the point image 76 is, for example, an image in which the pixel value of the pixel corresponding to the center point CP of the vertebral body is 1, and the pixel value of the other pixels is 0. That is, the point image 76 is an image identifying the center point CP of the vertebral body.
- the non-maximum suppression processing unit 72 outputs the point image 76 to the conversion unit 73 .
- a conversion unit 73 converts the point image 76 into point position information 50 .
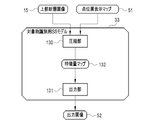
- the point extraction SS model 32 has a compression unit 90 and an output unit 91 .
- the upper tomographic image 15 is input to the compression unit 90 .
- the upper tomographic image 15 input to the compression unit 90 is, for example, the upper tomographic image 15S of the sagittal section from which the point position display map 51 is generated.
- a compression unit 90 converts the upper tomographic image 15 into a feature quantity map 92 .
- the compression unit 90 transfers the feature quantity map 92 to the output unit 91 .
- the output unit 91 outputs the probability distribution map 74 based on the feature quantity map 92 .
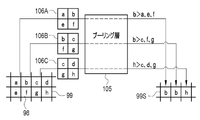
- the compression unit 90 converts the upper tomographic image 15 into a feature quantity map 92 by performing a convolution operation as shown in FIG. 8 as an example.
- the compression unit 90 has a convolution layer 95 .
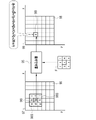
- a convolution layer 95 applies, for example, a 3 ⁇ 3 filter F to target data 97 having a plurality of elements 96 arranged two-dimensionally. Then, the element value e of one target element 96I of the elements 96 and the element values a, b, c, d, f, g, h, and i of eight elements 96S adjacent to the target element 96I are convoluted. .
- the convolution layer 95 sequentially performs a convolution operation on each element 96 of the target data 97 while shifting the target element 96I by one element, and outputs the element value of the element 98 of the operation data 99 . Thereby, operation data 99 having a plurality of elements 98 arranged two-dimensionally is obtained.
- the target data 97 input to the convolution layer 95 is, for example, the upper tomographic image 15 or reduction calculation data 99S (see FIG. 10) described later.
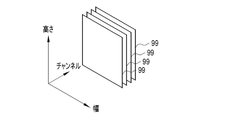
- One calculation data 99 is output for one filter F.
- operation data 99 is output for each filter F.
- FIG. 9 That is, as shown in FIG. 9 as an example, the calculation data 99 are generated for the number of filters F applied to the target data 97 .
- the operation data 99 has a plurality of elements 98 arranged two-dimensionally, it has width and height.
- the number of calculation data 99 is called the number of channels.
- FIG. 9 illustrates four channels of operation data 99 output by applying four filters F to one object data 97 .
- the compression unit 90 has a pooling layer 105 in addition to the convolution layer 95 .
- the pooling layer 105 obtains the local statistic of the element value of the element 98 of the operation data 99, and generates the reduced operation data 99S having the obtained statistic as the element value.
- the pooling layer 105 performs maximum value pooling processing for obtaining the maximum value of the element values within the block 106 of 2 ⁇ 2 elements as a local statistic. By performing processing while shifting the block 106 by one element in the width direction and the height direction, the reduced calculation data 99S is reduced to 1/2 the size of the original calculation data 99 .
- FIG. 10 the compression unit 90 has a pooling layer 105 in addition to the convolution layer 95 .
- the pooling layer 105 obtains the local statistic of the element value of the element 98 of the operation data 99, and generates the reduced operation data 99S having the obtained statistic as the element value.
- the pooling layer 105 performs maximum value pooling processing for obtaining the maximum value of the element values within the block 106 of
- the compression unit 90 repeats the convolution processing by the convolution layer 95 and the pooling processing by the pooling layer 105 multiple times, and outputs the final calculation data 99 .
- This final calculation data 99 is the feature quantity map 92 .
- the compression unit 90 also performs skip layer processing and the like for transferring the calculation data 99 to the output unit 91 .
- the output unit 91 performs upsampling processing to enlarge the size of the feature quantity map 92 to obtain an enlarged feature quantity map.
- the output unit 91 also performs convolution processing at the same time as the upsampling processing.
- the output unit 91 also performs a merge process of combining the enlarged feature quantity map and the calculation data 99 passed from the compression unit 90 in skip layer processing.
- the output unit 91 further performs convolution processing after the merge processing. Through such various processes, the output unit 91 outputs the probability distribution map 74 from the feature quantity map 92 .
- the point extraction SS model 32 is constructed by CNN.
- Examples of CNN include U-Net and ResNet (Residual Network).
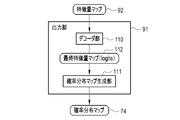
- the output unit 91 has a decoder unit 110 and a probability distribution map generation unit 111.
- the decoder unit 110 performs upsampling, convolution, merging, and the like on the feature quantity map 92 to generate the final feature quantity map 112 .
- the final feature quantity map 112 is also called logits, and has elements in one-to-one correspondence with the pixels 136 of the upper tomographic image 15 .
- Each element of the final feature map 112 has an element value associated with the center point CP of the vertebral body to be extracted. For example, the element value of the element where the center point CP of the vertebral body seems to be is higher than the element values of the other elements.
- the decoder section 110 outputs the final feature quantity map 112 to the probability distribution map generation section 111 .
- the probability distribution map generation unit 111 generates the probability distribution map 74 from the final feature quantity map 112 using a well-known activation function.
- the probability distribution map generator 111 applies, for example, a softmax function to calculate e 2 /(e 2 +e 1.5 ) and e 1.5 /(e 2 +e 1.5 ). Then, the probability that the central point CP of the vertebral body exists in the element, that is, the existence probability of 0.62 ( ⁇ e 2 /(e 2 +e 1.5 )) is derived, and the central point CP of the vertebral body is derived in the element. 0.38 ( ⁇ e 1.5 /(e 2 +e 1.5 )) is derived as the probability that does not exist (hereinafter referred to as non-existence probability).
- a sigmoid function may be used instead of the softmax function.
- the SS model for point extraction 32 is learned by being given learning data (also called teacher data) 115 in the learning phase.
- the learning data 115 is a set of a learning upper tomographic image 15L and an annotation image 116 corresponding to the learning upper tomographic image 15L.
- the annotation image 116 is an image in which the central point CP of the vertebral body of each vertebra VB shown in the learning upper tomographic image 15L is annotated.
- the annotation image 116 is an image in which the pixel value of the pixel 117A corresponding to the center point CP of the vertebral body is 1, and the pixel value of the other pixels 117B is 0.
- the pixel 117A is an example of the "first pixel” according to the technology of the present disclosure
- the pixel value of 1 of the pixel 117A is an example of the "first pixel value" of the technology of the present disclosure
- the pixel 117B is an example of a “second pixel” according to the technology of the present disclosure
- the pixel value of 0 of the pixel 117B is an example of a “second pixel value” according to the technology of the present disclosure.
- the upper tomographic image 15L for learning is input to the SS model 32 for point extraction.
- the point extraction SS model 32 outputs a learning probability distribution map 74L for the learning upper tomographic image 15L.
- the loss calculation of the point extraction SS model 32 is performed.
- Various coefficients (such as the coefficients of the filter F) of the point extraction SS model 32 are updated according to the result of the loss calculation, and the point extraction SS model 32 is updated according to the update settings.
- a weighted cross entropy function is used in the loss calculation of the SS model 32 for point extraction.
- the cross entropy function compares when the existence probability of the central point CP of the vertebral body among the element values of the element 80 of the learning probability distribution map 74L and the pixel value of the annotation image 116 are relatively close values. take a relatively low value. In other words, in this case, the loss is estimated to be small.
- the cross entropy function was a value in which the existence probability of the central point CP of the vertebral body among the element values of the element 80 of the learning probability distribution map 74L and the pixel value of the annotation image 116 were relatively deviated. takes a relatively high value. In other words, in this case, the loss is estimated to be large.
- the weight of the cross entropy function is set to 10, for example, for the pixel 117A corresponding to the central point CP of the vertebral body annotated in the annotation image 116, and 1, for example, to the other pixels 117B.
- the learning phase of the point extraction SS model 32 input of the upper tomographic image 15L for learning to the SS model 32 for point extraction, output of the probability distribution map 74L for learning from the SS model 32 for point extraction, loss calculation, and updating.
- the series of processes of setting and updating the point extraction SS model 32 are repeated while the learning data 115 are exchanged. Repetition of the above series of processes ends when the prediction accuracy of the learning probability distribution map 74L for the annotation image 116 reaches a predetermined set level.
- the point extraction SS model 32 whose prediction accuracy has thus reached the set level is stored in the storage 20 and used in the extraction unit 42 . Regardless of the prediction accuracy of the learning probability distribution map 74L for the annotation image 116, the learning may be terminated when the series of processes described above is repeated a set number of times.
- FIG. 13 shows an example of non-maximum suppression processing by the non-maximum suppression processing unit 72.
- the point candidate image 75 is obtained by simply selecting the elements 80 whose existence probability in the probability distribution map 74 is equal to or higher than the threshold as the candidates 120 . Therefore, not all candidates 120 are truly vertebral body center points CP. Therefore, the true center point CP of the vertebral body is narrowed down from among the plurality of candidates 120 by performing non-maximum suppression processing.
- the non-maximum suppression processing unit 72 first assigns a rectangular frame 121 to each candidate 120 of the point candidate image 75 .
- the rectangular frame 121 has a preset size corresponding to the vertebrae VB, for example, a size one size larger than one vertebrae VB.
- the center of rectangular frame 121 coincides with candidate 120 .
- the non-maximum suppression processing unit 72 calculates the IoU (Intersection over Union) of the rectangular frame 121 assigned to each candidate 120 .
- the IoU is a value obtained by dividing the overlapping area (Area of Overlap) of the two rectangular frames 121 by the area (Area of Union) where the two rectangular frames 121 are integrated.
- the non-maximum suppression processing unit 72 leaves one representative rectangular frame 121 and deletes the other one rectangular frame 121 for each candidate 120 for two rectangular frames 121 whose IoU is equal to or greater than a threshold value (for example, 0.3).
- a threshold value for example, 0.3
- the conversion unit 73 generates the point position information 50 based on the point image 76 .
- the point position information 50 is the XYZ coordinates of the position of the center point CP of the vertebral body in the point image 76 .
- the X-axis is parallel to the horizontal direction
- the Y-axis is parallel to the front-rear direction
- the Z-axis is parallel to the vertical direction.
- the value of the X coordinate among the XYZ coordinates of each center point CP is the same for each center point CP.
- the Y coordinate and Z coordinate values are different for each center point CP.
- numbers (No.) are assigned in ascending order of the Z coordinate, and the central points CP of each vertebral body are organized.
- the point position display map 51 has elements 137 (see FIG. 16) corresponding to the pixels 136 of the upper tomographic image 15 on a one-to-one basis. or 2, data in which the element value of the element 137 corresponding to the pixel 136 other than the center point CP of the vertebral body is set to 0; That is, the point position display map 51 is data representing the position of the central point CP of the vertebral body with an element value of 1 or 2.
- FIG. 14 the vertebrae VB and the like are indicated by dashed lines to aid understanding, but the actual point position display map 51 does not show the vertebrae VB and the like.
- the point position display map generation unit 43 assigns labels A to two adjacent vertebrae VB with the element value of the element 137 corresponding to the center point CP of the vertebral body of one vertebrae VB being 1, and The element 137 corresponding to the center point CP of the vertebral body is assigned a label B with the element value of 2.
- the element value of the element 137 corresponding to the center point CP of the vertebral body of No. 1 is set to 1, and the label A is attached.
- the element value of the element 137 corresponding to the center point CP of the 2 vertebral bodies is set to 2, and the label B is attached.
- the point position display map generator 43 assigns the labels A and B in this way, and as a result, No. Elements 137 corresponding to the center points CP of vertebral bodies 1, 3, 5, 7, and 9 are labeled A, and no. Label B for the elements 137 corresponding to the center points CP of the 2, 4, 6 and 8 vertebral bodies. That is, labels A and B are alternately applied to the center point CP of the vertebral body of each vertebra VB.
- the SS model 33 for object identification has a compression unit 130 and an output unit 131, like the SS model 32 for point extraction.
- the upper tomographic image 15 and the point position display map 51 are input to the compression unit 130 .
- the upper tomographic image 15 input to the compression unit 130 is, for example, the upper tomographic image 15S of the sagittal section from which the point position display map 51 is generated.
- the compression unit 130 converts the upper tomographic image 15 and the point position display map 51 into a feature quantity map 132 .
- the compression unit 130 passes the feature quantity map 132 to the output unit 131 .
- the output unit 131 outputs an output image 52 based on the feature quantity map 132 .
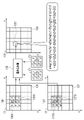
- the compression unit 130 combines the upper tomographic image 15 and the point position display map 51 in the channel direction by performing a convolution operation as shown in FIG. 16 as an example.
- the compression unit 130 has a convolution layer 135 to which the upper tomographic image 15 and the point position display map 51 are input.
- the convolution layer 135 applies, for example, a 3 ⁇ 3 filter F1 to the upper tomographic image 15 having a plurality of pixels 136 arranged two-dimensionally.
- the convolution layer 135 applies, for example, a 3 ⁇ 3 filter F2 to the point position display map 51 having a plurality of elements 137 arranged two-dimensionally.
- the pixel value e1 of one target pixel 136I of the pixels 136 the pixel values a1, b1, c1, d1, f1, g1, h1, and i1 of eight pixels 136S adjacent to the target pixel 136I, and , which is one of the elements 137 and corresponds to the target pixel 136I, and the element values a2, b2, c2, d2, and f2 of the eight elements 137S adjacent to the target pixel 137I. , g2, h2, and i2.
- the convolution layer 135 sequentially performs the convolution operation while shifting the target pixel 136I and the target element 137I one by one, and outputs the element value of the element 139 of the operation data 138 .
- operation data 138 having a plurality of elements 139 arranged two-dimensionally is obtained.
- the upper tomographic image 15 and the point position display map 51 are combined in the channel direction.
- the coefficients of filter F1 be r1, s1, t1, u1, v1, w1, x1, y1, and z1.
- the coefficients of filter F2 be r2, s2, t2, u2, v2, w2, x2, y2, and z2.
- the element value k of the element 139I of the operation data 138 which is the result of the convolution operation on the target pixel 136I and the target element 137I, is obtained by calculating the following equation (2), for example.
- the compression unit 130 has multiple convolution layers similar to the convolution layer 95 shown in FIG. 8, and performs convolution processing multiple times. Also, the compression unit 130 has a plurality of pooling layers similar to the pooling layer 105 shown in FIG. 10, and performs pooling processing a plurality of times. Furthermore, the compression unit 130 also performs a skip layer process of passing the operation data obtained by the convolution process to the output unit 131 . By repeating the convolution processing, pooling processing, skip layer processing, and the like a plurality of times, the compression unit 130 outputs final operation data 138 . This final calculation data 138 is the feature quantity map 132 .
- the output unit 131 performs upsampling processing, convolution processing, merging processing, and the like on the feature map 132 in the same manner as the output unit 91 of the SS model 32 for point extraction. Through such various processes, the output unit 131 outputs the output image 52 from the feature quantity map 132 .
- the SS model 33 for object identification is constructed by CNN, like the SS model 32 for point extraction.
- the output image 52 is an image in which each vertebra VB is labeled with a class. More specifically, the output image 52 is No. Vertebrae VB containing vertebral body center points CP of 1, 3, 5, 7, and 9 are identified as class A corresponding to label A; Vertebra VB, including vertebral body center points CP of 2, 4, 6, and 8, is the image identified as class B corresponding to label B.
- FIG. 17 shows that the output image 52 is an image in which each vertebra VB is labeled with a class. More specifically, the output image 52 is No. Vertebrae VB containing vertebral body center points CP of 1, 3, 5, 7, and 9 are identified as class A corresponding to label A; Vertebra VB, including vertebral body center points CP of 2, 4, 6, and 8, is the image identified as class B corresponding to label B.
- the SS model 33 for object identification is learned by being given learning data 150 in the learning phase.
- the learning data 150 includes a learning upper tomographic image 15L, a learning point position display map 51L corresponding to the learning upper tomographic image 15L, and an annotation image corresponding to the learning upper tomographic image 15L and the learning point position display map 51L. It is a pair with 151.
- the learning point position display map 51L is obtained by alternately assigning labels A and B to the elements 137 corresponding to the center point CP of the vertebral body of the vertebra VB shown in the learning upper tomographic image 15L.
- the annotation image 151 is an image in which each vertebra VB appearing in the learning upper tomographic image 15L is labeled with a class corresponding to the label given in the learning point position display map 51L.
- the learning upper tomographic image 15L and the learning point position display map 51L are input to the SS model 33 for object identification.
- the object identification SS model 33 outputs a learning output image 52L for the learning upper tomographic image 15L and the learning point position display map 51L.
- the loss calculation of the object identification SS model 33 is performed.
- Various coefficients (such as the coefficients of the filters F1 and F2) of the object identification SS model 33 are updated according to the result of the loss calculation, and the object identification SS model 33 is updated according to the update settings.
- the learning upper tomographic image 15L and the learning point position display map 51L are input to the object identification SS model 33, and the learning from the object identification SS model 33 is performed.
- the series of processes of outputting the output image 52L, calculating the loss, setting the update, and updating the SS model 33 for object identification are repeated while the learning data 150 are exchanged. Repetition of the above series of processes ends when the prediction accuracy of the learning output image 52L for the annotation image 151 reaches a predetermined set level.
- the object identification SS model 33 whose prediction accuracy reaches the set level in this manner is stored in the storage 20 and used in the object identification unit 44 . Regardless of the prediction accuracy of the learning output image 52L with respect to the annotation image 151, learning may be terminated when the series of processes described above is repeated a set number of times.
- the assigned result 53 is the anatomical name of each vertebrae VB such as Th10 (10th thoracic vertebrae), L1 (1st lumbar vertebrae), and S1 (sacral vertebrae).
- FIG. 20 shows an example of the second screen 155 displaying the grant result 53.
- the display control unit 46 causes the screen to transition from the first screen 60 shown in FIG. 4 to the second screen 155 .
- the application result 53 is displayed next to the upper tomographic image 15S.
- a finding input field 62 and an OK button 64 are displayed, like the first screen 60 of FIG.
- the doctor moves the cursor 66 to the OK button 64 and selects it.
- the instruction receiving unit 41 receives the finding storage instruction, as in the case of FIG.
- the RW control unit 40 associates the upper tomographic image 15 with the finding input in the finding input field 62 and stores them in the storage 20 .
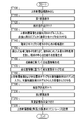
- the operation program 30 when the operation program 30 is started in the diagnostic support device 12, as shown in FIG. It functions as a generating unit 43 , an object identifying unit 44 , an anatomical naming unit 45 , and a display control unit 46 .
- the RW control unit 40 reads from the storage 20 the upper tomographic image 15 of the patient P whose spine SP is to be diagnosed (step ST100).
- the upper tomographic image 15 is output from the RW controller 40 to the display controller 46 .
- the display controller 46 under the control of the display control section 46, the first screen 60 shown in FIG. 4 is displayed on the display 17 (step ST110).
- the instruction receiving unit 41 receives an instruction to analyze the upper tomographic image 15 (step ST120).
- the upper tomographic image 15 is input to the point extraction SS model 32 in the analysis unit 70 of the extraction unit 42, and the presence of the central point CP of the vertebral body is detected from the point extraction SS model 32.
- a probability distribution map 74 indicating probabilities is output (step ST130).
- a probability distribution map 74 is output from the analysis unit 70 to the selection unit 71 .
- the selection unit 71 selects the element 80 of the probability distribution map 74 whose existence probability of the center point CP of the vertebral body is equal to or greater than the threshold as the candidate 120 of the center point CP of the vertebral body (step ST140). Then, the non-maximum suppression processing unit 72 assigns the rectangular frame 121 to the candidate 120 and performs non-maximum suppression processing on the rectangular frame 121 . A point image 76 representing the center point CP of the vertebral body is thereby generated (step ST150). The point image 76 is output from the non-maximum suppression processing section 72 to the conversion section 73 .
- the point position information 50 representing the XYZ coordinates of the position of the central point CP of the vertebral body in the point image 76 is generated by the conversion unit 73 based on the point image 76 (step ST160).
- the point position information 50 is output from the converter 73 to the point position display map generator 43 .
- the point position display map generator 43 generates the point position display map 51 based on the point position information 50 (step ST170).
- the point position display map 51 is output from the point position display map generation section 43 to the object identification section 44 .
- the upper tomographic image 15 and the SS model 33 for object identification are input from the RW control unit 40 to the object identification unit 44 .
- the object identification unit 44 the upper tomographic image 15 and the point position display map 51 are input to the object identification SS model 33 as shown in FIG.
- the output image 52 is output from the object identification SS model 33 (step ST180).
- the output image 52 is output from the object identifying section 44 to the anatomical naming section 45 .
- the anatomical name assignment unit 45 assigns an anatomical name to each vertebra VB identified in the output image 52 (step ST190).
- the assignment result 53 is output from the anatomical name assignment unit 45 to the display control unit 46 .
- the second screen 155 shown in FIG. 20 is displayed on the display 17 (step ST200).
- the doctor moves the cursor 66 to the OK button 64 and selects it.
- the finding storage instruction is accepted by the instruction accepting section 41 (step ST210).
- the RW control unit 40 the upper tomographic image 15 and the finding input in the finding input field 62 are associated and stored in the storage 20 (step ST220).
- the diagnosis support device 12 uses the SS model 32 for point extraction.
- the pixel value of the pixel 117A corresponding to the center point CP of each vertebral body of the plurality of vertebrae VB is set to 1, and the pixel value of the other pixels 117B is set to 0. is learned using the annotation image 116 that
- the point extraction SS model 32 is learned by assigning a greater weight to the pixel 117A corresponding to the center point CP of the vertebral body than to the other pixels 117B and calculating the loss. As shown in FIG.
- the extraction unit 42 inputs the upper tomographic image 15 to the SS model 32 for point extraction, and extracts a probability distribution map 74 indicating the existence probability of the central point CP of the vertebral body in the upper tomographic image 15. Output from the SS model 32 for extraction. Then, as shown in FIG. 13, a point image 76 is generated based on the probability distribution map 74 to identify the center point CP of the vertebral body. Since the central point CP of the vertebral body is very small, it will be buried if no measures are taken, making it difficult to learn.
- the pixel 117A corresponding to the center point CP of the vertebral body is assigned a greater weight than the other pixels 117B, learning can be performed intensively with respect to the center point CP of the vertebral body. Therefore, it is possible to accurately identify the center point CP of the vertebral body.
- the selection unit 71 selects an element 80 having an existence probability equal to or higher than a preset threshold from each element 80 of the probability distribution map 74 as a candidate 120 for the center point CP of the vertebral body.
- the non-maximum suppression processing unit 72 allocates a rectangular frame 121 having a preset size to the selected candidate 120 . Then, non-maximum suppression processing is performed on the rectangular frame 121, and the center point CP of the vertebral body is identified based on the result of the non-maximum suppression processing. Therefore, it is possible to accurately identify a plurality of discrete points relatively close to each other, such as the center point CP of the vertebral body.
- the upper tomographic image 15 input to the compression units 90 and 130 is not limited to the upper tomographic image 15S of the sagittal section from which the point position display map 51 was generated.
- several sagittal cross-sectional images before and after the upper tomographic image 15S of the sagittal section from which the point position display map 51 is generated are displayed.
- the upper tomographic image 15S may be input to compression units 90 and .
- the identification result of the vertebrae VB for one upper tomographic image 15S of the sagittal section may be applied to several upper tomographic images 15S of the front and rear sagittal sections.
- the annotation image 116 is not limited to an image annotated with one pixel 117A indicating the center point CP of the vertebral body.
- An image in which a circular region composed of several to several tens of pixels around the central point CP of the vertebral body is annotated may be used.
- the point to be extracted is not limited to the central point CP of the vertebral body. It may be the tip of the spinous process of the vertebral arch or the center of the vertebral foramen.
- the plurality of discrete points relatively close to each other is not limited to the central point CP of the vertebral body.
- the center point of the finger bone or the like may be used.
- the element value of label A is 1 and the element value of label B is 2, but it is not limited to this. It is sufficient if the element values of label A and label B are different from each other.
- the element value of label A may be 1 and the element value of label B may be -1.
- the types of labels are not limited to the two types of labels A and B. Three or more labels may be attached.
- no. vertebra VB may be labeled C with an element value of 3.
- the output image 52 is No. 1, 4, and 7 vertebrae VB are identified as class A corresponding to label A; 2, 5, and 8 vertebrae VB are identified as class B corresponding to label B; Vertebrae VB of 3, 6, and 9 are images identified as class C corresponding to label C.
- each vertebra VB is identified, but this is not the only option.
- the vertebrae VB may be identified as preprocessing for CAD (Computer-Aided Diagnosis) for extracting lesion candidates such as bone fractures and bone metastasis of cancer.
- CAD Computer-Aided Diagnosis
- head tomographic images 160 showing the left and right eyeballs EB are handled.
- the head tomographic image 160 is an example of an “analysis target image” and a “medical image” according to the technology of the present disclosure.
- the eyeball EB is an example of the “object” and the “structure” according to the technology of the present disclosure.
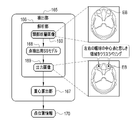
- the extraction unit 165 of this embodiment has an analysis unit 166 and a center-of-gravity calculation unit 167 .
- the analysis unit 166 inputs the head tomographic image 160 to the point extraction SS model 168 and causes the point extraction SS model 168 to output an output image 169 .
- An output image 169 is an image in which regions that are thought to be the center points of the left and right eyeballs EB appearing in the head tomographic image 160 are labeled as classes.
- the analysis unit 166 outputs the output image 169 to the center-of-gravity calculation unit 167 .
- the center-of-gravity calculator 167 Based on the output image 169, the center-of-gravity calculator 167 generates point position information 170 indicating the center points of the left and right eyeballs EB.
- the center points of the left and right eyeballs EB are an example of "a plurality of discrete points" according to the technology of the present disclosure.
- the point extraction SS model 168 has a compression unit 175 and an output unit 176, and is constructed by CNN, like the point extraction SS model 32 and the like.
- a head tomographic image 160 is input to the compression unit 175 .
- the compression unit 175 converts the head tomographic image 160 into a feature map 177 .
- the compression unit 175 passes the feature quantity map 177 to the output unit 176 .
- the output unit 176 outputs an output image 169 based on the feature quantity map 177 .
- pixels corresponding to the center points of the left and right eyeballs EB are assigned a greater weight than the other pixels to reduce loss. Learned by computing.
- the output unit 176 has a decoder unit 180 and a probability distribution map generation unit 181, like the output unit 91 of the SS model 32 for point extraction.
- the output unit 176 also has a labeling unit 182 .
- the decoder unit 180 performs upsampling processing, convolution processing, merging processing, etc. on the feature quantity map 177 to generate a final feature quantity map 183 .
- the final feature quantity map 183 has elements corresponding to the pixels of the head tomographic image 160 on a one-to-one basis. Each element of the final feature map 183 has an element value associated with the center point of the left and right eyeballs EB to be extracted.
- the element value of the element where the center points of the left and right eyeballs EB are supposed to be is higher than the element values of the other elements.
- the decoder section 180 outputs the final feature quantity map 183 to the probability distribution map generation section 181 .
- the probability distribution map generation unit 181 generates a probability distribution map 184 from the final feature quantity map 183 .
- a probability distribution map 184 indicates the existence probabilities of the center points of the left and right eyeballs EB.
- the probability distribution map generator 181 outputs the probability distribution map 184 to the label assigner 182 .
- the probability distribution map 184 is an example of a "feature quantity map" according to the technology of the present disclosure.
- the labeling unit 182 labels each element of the probability distribution map 184 with either a class indicating that it is the center point of the eyeball EB or a class indicating that it is other than the center point of the eyeball EB.
- the labeling unit 182 labels an element whose existence probability is greater than its non-existence probability (existence probability>non-existence probability) with a class indicating that it is the central point of the eyeball EB.
- the labeling unit 182 labels the elements whose existence probability of the element value is equal to or less than the non-existence probability (existence probability ⁇ non-existence probability) with a class indicating that they are other than the central point of the eyeball EB.
- an output image 169 is obtained in which regions that are thought to be the center points of the left and right eyeballs EB are labeled as classes.
- the center-of-gravity calculator 167 calculates the center of gravity CG of each of the two regions labeled as the center points of the left and right eyeballs EB of the output image 169 .
- the barycenter calculator 167 generates point position information 170 in which the calculated coordinates of the barycenter CG are registered as the coordinates of the central points of the left and right eyeballs EB.
- the extraction unit 165 generates the output image 169 in which each pixel is labeled with a class corresponding to the existence probability of the probability distribution map 184 . Then, based on the output image 169, the central points of the left and right eyeballs EB are identified. Therefore, it is possible to accurately identify a plurality of discrete points that are relatively distant from each other, such as the center points of the left and right eyeballs EB.
- the plurality of discrete points that are relatively distant from each other are not limited to the central points of the left and right eyeballs EB.
- the central points of the right hippocampus and the left hippocampus of the brain may also be used.
- the third embodiment deals with a chest tomographic image 190 showing the aortic valve AV.
- the chest tomographic image 190 is an example of an “analysis target image” and a “medical image” according to the technology of the present disclosure.
- the aortic valve AV is an example of the "object" and "structure” according to the technology of the present disclosure.
- the extraction unit 195 of this embodiment has an analysis unit 196 and a center-of-gravity calculation unit 197 .
- the analysis unit 196 inputs the chest tomographic image 190 to the point extraction SS model 198 and causes the point extraction SS model 198 to output a probability distribution map 199 .
- a probability distribution map 199 indicates the existence probability of the central point of the aortic valve AV.
- the analysis unit 196 outputs the probability distribution map 199 to the center-of-gravity calculation unit 197 .
- the center-of-gravity calculator 197 generates point position information 200 indicating the center point of the aortic valve AV based on the probability distribution map 199 .
- the point extraction SS model 198 like the point extraction SS model 32 and the like of the first embodiment, assigns a greater weight to the pixel corresponding to the central point of the aortic valve AV than the other pixels to calculate the loss. is learned by Note that the center point of the aortic valve AV is an example of "one point” according to the technology of the present disclosure. Also, the probability distribution map 199 is an example of a “feature quantity map” according to the technology of the present disclosure.
- the centroid calculator 197 calculates the centroid CG of the existence probability of the center point of the aortic valve AV of the element values of the probability distribution map 199 .
- the center of gravity CG is expressed by the following equation (3), where r is the coordinate vector of each element of the probability distribution map 199, and ⁇ (r) is the existence probability of the central point of the aortic valve AV of the element value of the probability distribution map 199. be done.
- the center of gravity CG is the sum of the products of the existence probability ⁇ (r) of the central point of the aortic valve AV and the coordinate vector r of each element of the probability distribution map 199, and the existence probability ⁇ (r) of the central point of the aortic valve AV. is the value divided by the sum of
- the center-of-gravity calculator 197 generates point position information 200 in which the coordinates of the calculated center of gravity CG are registered as the coordinates of the central point of the aortic valve AV.
- the extraction unit 195 identifies the center of gravity CG of the probability distribution map 199 based on the existence probability of the central point of the aortic valve AV as one point. Therefore, one point, such as the center point of the aortic valve AV, can be identified with high accuracy.
- the center point of the aortic valve AV may be identified based on the final feature quantity map 214 instead of the probability distribution map 199 .
- the extraction unit 210 has an analysis unit 211 and a selection unit 212.
- the analysis unit 211 inputs the chest tomographic image 190 to the point extraction SS model 213 and causes the point extraction SS model 213 to output the final feature quantity map 214 .
- the final feature quantity map 214 has elements in one-to-one correspondence with the pixels of the chest tomographic image 190 .
- Each element of the final feature map 214 has an element value associated with the center point of the aortic valve AV to be extracted. For example, the element value of an element suspected of having an aortic valve AV is higher than the element values of other elements.
- the final feature map 214 is an example of a "feature map" according to the technology of the present disclosure.
- the analysis unit 211 outputs the final feature quantity map 214 to the selection unit 212 .
- the point extraction SS model 213 is also learned by assigning a larger weight to the pixel corresponding to the central point of the aortic valve AV than the other pixels and calculating the loss, similarly to the point extraction SS model 198. .
- the selection unit 212 selects the element with the largest element value in the final feature map 214 as the center of gravity of the final feature map 214 .
- the selection unit 212 generates point position information 215 in which the coordinates of the element having the maximum element value in the final feature amount map 214 are registered as the coordinates of the central point of the aortic valve AV.
- the extraction unit 210 identifies the center of gravity (the element with the largest element value) of the final feature map 214 as one point. This method also allows accurate identification of a single point, such as the center point of the aortic valve AV.
- one point is not limited to the central point of the aortic valve AV. It may be the center point of the pulmonary valve, the center point of the mitral valve, or the like.
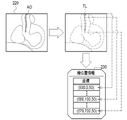
- the fourth embodiment deals with a cardiac tomographic image 220 showing the aorta AO of the heart.
- the cardiac tomographic image 220 is an example of an “analysis target image” and a “medical image” according to the technology of the present disclosure.
- the aorta AO is an example of the "object” and the "structure” according to the technology of the present disclosure.
- the extraction unit 225 of this embodiment has an analysis unit 226 and a thinning processing unit 227 .
- the analysis unit 226 inputs the cardiac tomographic image 220 to the line extraction SS model 228 and causes the line extraction SS model 228 to output an output image 229 .
- An output image 229 is an image in which a region that appears to be the center line of the aorta AO shown in the cardiac tomographic image 220 is labeled as a class.
- the analysis unit 226 outputs the output image 229 to the thinning processing unit 227 .
- the thinning processing unit 227 generates line position information 230 indicating the center line of the aorta AO based on the output image 229 .
- the center line of the aorta AO is an example of a "line” according to the technology of the present disclosure.
- the line extraction SS model 228 has a compression unit 235 and an output unit 236, and is constructed by CNN, like the point extraction SS model 32 and the like.
- a cardiac tomographic image 220 is input to the compression unit 235 .
- a compression unit 235 converts the cardiac tomographic image 220 into a feature quantity map 237 .
- the compression unit 235 passes the feature quantity map 237 to the output unit 236 .
- the output unit 236 outputs an output image 229 based on the feature amount map 237 .
- the line extraction SS model 228 calculates a loss by assigning a greater weight to pixels corresponding to the center line of the aorta AO than other pixels, as in the point extraction SS model 32 and the like of the first embodiment. It is learned by doing
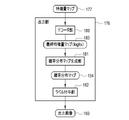
- the output unit 236 includes a decoder unit 240, a probability distribution map generation unit 241, and a labeling unit 242, similar to the output unit 176 of the point extraction SS model 168 of the second embodiment.
- the decoder unit 240 performs upsampling processing, convolution processing, merging processing, etc. on the feature quantity map 237 to generate a final feature quantity map 243 .
- the final feature quantity map 243 has elements in one-to-one correspondence with the pixels of the cardiac tomographic image 220 . Each element of the final feature map 243 has an element value associated with the centerline of the aorta AO to be extracted.
- the element value of the element where the center line of the aorta AO is supposed to be is higher than the element values of the other elements.
- the decoder section 240 outputs the final feature quantity map 243 to the probability distribution map generation section 241 .
- the probability distribution map generation unit 241 generates a probability distribution map 244 from the final feature quantity map 243 .
- a probability distribution map 244 indicates the existence probability of the centerline of the aorta AO.
- the probability distribution map generator 241 outputs the probability distribution map 244 to the label assigner 242 .
- the probability distribution map 244 is an example of a “feature quantity map” according to the technology of the present disclosure.
- the labeling unit 242 labels each element of the probability distribution map 244 with either a class indicating that it is the center line of the aorta AO or a class indicating that it is other than the center point of the aorta AO.
- the labeling unit 242 labels an element whose existence probability is greater than its non-existence probability (existence probability>non-existence probability) with a class indicating that it is the center line of the aorta AO.
- the labeling unit 242 labels the elements whose existence probability of the element value is equal to or less than the non-existence probability (existence probability ⁇ non-existence probability) with a class indicating that they are other than the center line of the aorta AO.
- an output image 229 is obtained in which the region that is thought to be the centerline of the aorta AO is labeled as a class.
- the thinning processing unit 227 performs a thinning process on the region that seems to be the center line of the aorta AO labeled as a class in the output image 229, and performs the thinning process on the region that seems to be the center line of the aorta AO. to a thin line TL.
- a thin line TL is composed of a series of one pixel.
- the thinning processing unit 227 generates line position information 230 in which the coordinates of each pixel forming the thin line TL are registered.
- the extraction unit 225 generates the output image 229 in which each pixel is labeled with a class corresponding to the existence probability of the probability distribution map 244 . Then, thinning processing is performed on the output image 229, and the center line of the aorta AO is identified based on the result of the thinning processing. Therefore, a line such as the center line of the aorta AO can be identified with high accuracy.
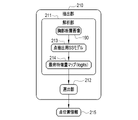
- the extractor 250 shown in FIG. 33 may be used to identify lines such as the centerline of the aorta AO.
- the extraction unit 250 has an analysis unit 251, a selection unit 252, a non-maximum suppression processing unit 253, and a conversion unit 254, similar to the extraction unit 42 of the first embodiment.
- the analysis unit 251 inputs the cardiac tomographic image 220 to the SS model 255 for line extraction, and causes the SS model 255 for line extraction to output a probability distribution map 256 indicating the existence probability of the center line of the aorta AO.
- the analysis unit 251 outputs the probability distribution map 256 to the selection unit 252 .
- the probability distribution map 256 is an example of a "feature quantity map" according to the technology of the present disclosure. Note that the line extraction SS model 255 is also learned by assigning a greater weight than the other pixels to pixels corresponding to the center line of the aorta AO and calculating the loss, similarly to the line extraction SS model 228 .
- the selection unit 252 selects elements in the probability distribution map 256 for which the existence probability of the center line of the aorta AO is equal to or greater than a threshold value (for example, 0.9) as candidates 260 (see FIG. 34) for the center line of the aorta AO.
- the selection unit 252 generates a line candidate image 257 (see also FIG. 34) representing the selected candidate 260 and outputs the generated line candidate image 257 to the non-maximum suppression processing unit 253 .
- the line candidate image 257 is, for example, an image in which the pixel value of the pixel corresponding to the candidate 260 is 1 and the pixel value of the other pixels is 0.
- the non-maximum suppression processing unit 253 performs non-maximum suppression processing on each candidate 260 of the line candidate image 257, and as a result, generates a line image 258 (see also FIG. 35) representing the center line of the aorta AO.
- the line image 258 is, for example, an image in which the pixel values of the pixels corresponding to the center line of the aorta AO are 1, and the pixel values of the other pixels are 0. That is, the line image 258 is an image identifying the centerline of the aorta AO.
- the non-maximum suppression processing unit 253 outputs the line image 258 to the conversion unit 254 .
- the conversion unit 254 converts the line image 258 into line position information 259 .
- FIG. 34 and 35 show an example of non-maximum suppression processing by the non-maximum suppression processing unit 253.
- FIG. The line candidate image 257 is obtained by simply selecting, as candidates 260, elements whose existence probability in the probability distribution map 256 is equal to or greater than the threshold. Therefore, not all candidates 260 are truly centerlines of the aorta AO. Therefore, the center line of the true aorta AO is narrowed down from among the plurality of candidates 260 by performing non-maximum suppression processing.
- the non-maximum suppression processing unit 253 first assigns a rectangular frame 261 to each candidate 260 of the line candidate image 257 .
- the rectangular frame 261 has a preset size corresponding to the aorta AO, for example, a size one size larger than the width of the aorta AO.
- the center of the rectangular frame 261 matches the candidate 260 .
- the non-maximum suppression processing unit 253 calculates the IoU of the rectangular frame 261 assigned to each candidate 260 .
- the non-maximum suppression processing unit 253 selects two rectangular frames 261 whose IoU is equal to or greater than a threshold value (for example, 0.3), leaving one representative rectangular frame 261 and the other rectangular frame 261 are deleted for every 260 candidates.
- a threshold value for example, 0.3
- two rectangular frames 261 whose IoU is greater than or equal to the threshold are integrated into one rectangular frame 261 .
- a line image 258 representing the center line of the aorta AO is finally obtained.
- the conversion unit 254 generates line position information 259 based on the line image 258 .
- the line position information 259 is the XYZ coordinates of a plurality of pixels representing the centerline of the aorta AO in the line image 258 .
- the selection unit 252 selects an element having an existence probability equal to or higher than a preset threshold from each element of the probability distribution map 256 as a centerline candidate 260 of the aorta AO.
- the non-maximum suppression processing unit 253 allocates a rectangular frame 261 having a preset size to the selected candidate 260 . Then, the rectangular frame 261 is subjected to non-maximum suppression processing, and the centerline of the aorta AO is identified based on the result of the non-maximum suppression processing. This method can also accurately identify a line such as the center line of the aorta AO.
- the line is not limited to the center line of the aorta AO.
- the center line of the ribs appearing on the chest tomographic image 190, the center line of the urethra appearing on the waist tomographic image, or the like may be used.
- the RW control unit 40 the instruction receiving unit 41, the extraction units 42, 165, 195, 210, 225, and 250, the point position display map generation unit 43, the object identification unit 44, the anatomical Naming unit 45, display control unit 46, analysis units 70, 166, 196, 211, 226, and 251, selection units 71, 212, and 252, non-maximum suppression processing units 72 and 253, conversion units 73 and 254, center of gravity
- the processing units processing units that execute various processes such as the calculation units 167 and 197 and the thinning processing unit 227, the following various processors can be used.
- processors include, as described above, in addition to the CPU 22 which is a general-purpose processor that executes software (operation program 30) and functions as various processing units, FPGAs (Field Programmable Gate Arrays), etc.
- Programmable Logic Device PLD
- ASIC Application Specific Integrated Circuit
- One processing unit may be configured with one of these various processors, or a combination of two or more processors of the same or different type (for example, a combination of a plurality of FPGAs and/or a CPU and combination with FPGA). Also, a plurality of processing units may be configured by one processor.
- a single processor is configured by combining one or more CPUs and software.
- a processor functions as multiple processing units.
- SoC System On Chip
- a processor that realizes the functions of the entire system including multiple processing units with a single IC (Integrated Circuit) chip. be.
- the various processing units are configured using one or more of the above various processors as a hardware structure.
- an electric circuit combining circuit elements such as semiconductor elements can be used.
- the image to be analyzed is not limited to the tomographic image 15 obtained from the CT device 10 or the like.
- it may be a tomographic image obtained from an MRI (Magnetic Resonance Imaging) device.
- the image to be analyzed is not limited to a three-dimensional image such as a tomographic image.
- it may be a two-dimensional image such as a simple radiographic image.
- images to be analyzed are not limited to medical images.
- the object is not limited to the structure of the body.
- an image of the street may be used as the image to be analyzed, and the target object may be the face of a person.
- the technology of the present disclosure can also appropriately combine various embodiments and/or various modifications described above. Moreover, it is needless to say that various configurations can be employed without departing from the scope of the present invention without being limited to the above embodiments. Furthermore, the technology of the present disclosure extends to storage media that non-temporarily store programs in addition to programs.
- a and/or B is synonymous with “at least one of A and B.” That is, “A and/or B” means that only A, only B, or a combination of A and B may be used.
- a and/or B means that only A, only B, or a combination of A and B may be used.
Landscapes
- Engineering & Computer Science (AREA)
- Theoretical Computer Science (AREA)
- Physics & Mathematics (AREA)
- General Physics & Mathematics (AREA)
- Computer Vision & Pattern Recognition (AREA)
- Health & Medical Sciences (AREA)
- Multimedia (AREA)
- Evolutionary Computation (AREA)
- Medical Informatics (AREA)
- General Health & Medical Sciences (AREA)
- Artificial Intelligence (AREA)
- Software Systems (AREA)
- Computing Systems (AREA)
- Life Sciences & Earth Sciences (AREA)
- Databases & Information Systems (AREA)
- Biomedical Technology (AREA)
- Molecular Biology (AREA)
- Animal Behavior & Ethology (AREA)
- Biophysics (AREA)
- Optics & Photonics (AREA)
- Nuclear Medicine, Radiotherapy & Molecular Imaging (AREA)
- High Energy & Nuclear Physics (AREA)
- Public Health (AREA)
- Data Mining & Analysis (AREA)
- Veterinary Medicine (AREA)
- Pathology (AREA)
- Radiology & Medical Imaging (AREA)
- General Engineering & Computer Science (AREA)
- Mathematical Physics (AREA)
- Surgery (AREA)
- Heart & Thoracic Surgery (AREA)
- Biodiversity & Conservation Biology (AREA)
- Apparatus For Radiation Diagnosis (AREA)
Priority Applications (3)
| Application Number | Priority Date | Filing Date | Title |
|---|---|---|---|
| JP2023503386A JPWO2022185644A1 (https=) | 2021-03-03 | 2021-12-08 | |
| US18/453,319 US12511756B2 (en) | 2021-03-03 | 2023-08-22 | Image processing apparatus, operation method of image processing apparatus, operation program of image processing apparatus, and learning method |
| US19/387,678 US20260073526A1 (en) | 2021-03-03 | 2025-11-13 | Image processing apparatus, operation method of image processing apparatus, operation program of image processing apparatus, and learning method |
Applications Claiming Priority (2)
| Application Number | Priority Date | Filing Date | Title |
|---|---|---|---|
| JP2021-033848 | 2021-03-03 | ||
| JP2021033848 | 2021-03-03 |
Related Child Applications (1)
| Application Number | Title | Priority Date | Filing Date |
|---|---|---|---|
| US18/453,319 Continuation US12511756B2 (en) | 2021-03-03 | 2023-08-22 | Image processing apparatus, operation method of image processing apparatus, operation program of image processing apparatus, and learning method |
Publications (1)
| Publication Number | Publication Date |
|---|---|
| WO2022185644A1 true WO2022185644A1 (ja) | 2022-09-09 |
Family
ID=83154204
Family Applications (1)
| Application Number | Title | Priority Date | Filing Date |
|---|---|---|---|
| PCT/JP2021/045209 Ceased WO2022185644A1 (ja) | 2021-03-03 | 2021-12-08 | 画像処理装置、画像処理装置の作動方法、画像処理装置の作動プログラム、並びに学習方法 |
Country Status (3)
| Country | Link |
|---|---|
| US (2) | US12511756B2 (https=) |
| JP (1) | JPWO2022185644A1 (https=) |
| WO (1) | WO2022185644A1 (https=) |
Families Citing this family (1)
| Publication number | Priority date | Publication date | Assignee | Title |
|---|---|---|---|---|
| CN118314086B (zh) * | 2024-03-22 | 2025-05-16 | 浙江大学 | 一种晶圆参考版图和sem图像的自动匹配方法和系统 |
Citations (9)
| Publication number | Priority date | Publication date | Assignee | Title |
|---|---|---|---|---|
| JPH08289888A (ja) * | 1995-04-24 | 1996-11-05 | Ge Yokogawa Medical Syst Ltd | 断層撮影計画方法及び断層撮影装置 |
| JP2005327076A (ja) * | 2004-05-14 | 2005-11-24 | Matsushita Electric Ind Co Ltd | パラメタ推定方法、パラメタ推定装置および照合方法 |
| WO2017141958A1 (ja) * | 2016-02-15 | 2017-08-24 | 学校法人慶應義塾 | 脊柱配列推定装置、脊柱配列推定方法及び脊柱配列推定プログラム |
| JP2019013724A (ja) * | 2017-07-03 | 2019-01-31 | 株式会社リコー | 診断支援システム、診断支援方法及び診断支援プログラム |
| CN109712163A (zh) * | 2018-12-05 | 2019-05-03 | 上海联影医疗科技有限公司 | 冠脉提取方法、装置、图像处理工作站和可读存储介质 |
| JP2019175093A (ja) * | 2018-03-28 | 2019-10-10 | パナソニックIpマネジメント株式会社 | 推定装置、推定方法、推定プログラム、学習装置、学習方法、及び学習プログラム |
| WO2019235192A1 (ja) * | 2018-06-06 | 2019-12-12 | 日本電信電話株式会社 | 領域抽出モデル学習装置、領域抽出モデル学習方法、プログラム |
| WO2020235461A1 (ja) * | 2019-05-22 | 2020-11-26 | パナソニック株式会社 | 異常検出方法、異常検出プログラム、異常検出装置、サーバ装置及び情報処理方法 |
| JP2021503414A (ja) * | 2018-08-22 | 2021-02-12 | ベイジン センスタイム テクノロジー デベロップメント カンパニー, リミテッド | 知的運転制御方法および装置、電子機器、プログラムならびに媒体 |
Family Cites Families (6)
| Publication number | Priority date | Publication date | Assignee | Title |
|---|---|---|---|---|
| US11138746B2 (en) | 2017-07-03 | 2021-10-05 | Ricoh Company, Ltd. | Diagnostic support system and diagnostic support method |
| JP2020025730A (ja) | 2018-08-10 | 2020-02-20 | キヤノン株式会社 | 画像処理装置、画像処理方法、およびプログラム |
| CN109635685B (zh) * | 2018-11-29 | 2021-02-12 | 北京市商汤科技开发有限公司 | 目标对象3d检测方法、装置、介质及设备 |
| CN109840917B (zh) * | 2019-01-29 | 2021-01-26 | 北京市商汤科技开发有限公司 | 图像处理方法及装置、网络训练方法及装置 |
| JP2020201649A (ja) * | 2019-06-07 | 2020-12-17 | トヨタ自動車株式会社 | 地図生成装置、地図生成方法及び地図生成用コンピュータプログラム |
| US20200395117A1 (en) * | 2019-06-14 | 2020-12-17 | Cycle Clarity, LLC | Adaptive image processing method and system in assisted reproductive technologies |
-
2021
- 2021-12-08 WO PCT/JP2021/045209 patent/WO2022185644A1/ja not_active Ceased
- 2021-12-08 JP JP2023503386A patent/JPWO2022185644A1/ja active Pending
-
2023
- 2023-08-22 US US18/453,319 patent/US12511756B2/en active Active
-
2025
- 2025-11-13 US US19/387,678 patent/US20260073526A1/en active Pending
Patent Citations (9)
| Publication number | Priority date | Publication date | Assignee | Title |
|---|---|---|---|---|
| JPH08289888A (ja) * | 1995-04-24 | 1996-11-05 | Ge Yokogawa Medical Syst Ltd | 断層撮影計画方法及び断層撮影装置 |
| JP2005327076A (ja) * | 2004-05-14 | 2005-11-24 | Matsushita Electric Ind Co Ltd | パラメタ推定方法、パラメタ推定装置および照合方法 |
| WO2017141958A1 (ja) * | 2016-02-15 | 2017-08-24 | 学校法人慶應義塾 | 脊柱配列推定装置、脊柱配列推定方法及び脊柱配列推定プログラム |
| JP2019013724A (ja) * | 2017-07-03 | 2019-01-31 | 株式会社リコー | 診断支援システム、診断支援方法及び診断支援プログラム |
| JP2019175093A (ja) * | 2018-03-28 | 2019-10-10 | パナソニックIpマネジメント株式会社 | 推定装置、推定方法、推定プログラム、学習装置、学習方法、及び学習プログラム |
| WO2019235192A1 (ja) * | 2018-06-06 | 2019-12-12 | 日本電信電話株式会社 | 領域抽出モデル学習装置、領域抽出モデル学習方法、プログラム |
| JP2021503414A (ja) * | 2018-08-22 | 2021-02-12 | ベイジン センスタイム テクノロジー デベロップメント カンパニー, リミテッド | 知的運転制御方法および装置、電子機器、プログラムならびに媒体 |
| CN109712163A (zh) * | 2018-12-05 | 2019-05-03 | 上海联影医疗科技有限公司 | 冠脉提取方法、装置、图像处理工作站和可读存储介质 |
| WO2020235461A1 (ja) * | 2019-05-22 | 2020-11-26 | パナソニック株式会社 | 異常検出方法、異常検出プログラム、異常検出装置、サーバ装置及び情報処理方法 |
Non-Patent Citations (3)
| Title |
|---|
| KUBOTA, RYOSUKE, KOGURE, KIYOSHI: "Contour Extraction of Transparent Objects Using Fully Convolutional Networks", IEICE TECHNICAL REPORT, vol. 118, no. 35, 1 January 2018 (2018-01-01), JP, pages 41 - 45, XP009539365 * |
| LU SHENG; GAO FENG; PIAO CHANGHAO; MA YING: "Dynamic Weighted Cross Entropy for Semantic Segmentation with Extremely Imbalanced Data", 2019 INTERNATIONAL CONFERENCE ON ARTIFICIAL INTELLIGENCE AND ADVANCED MANUFACTURING (AIAM), 16 October 2019 (2019-10-16), pages 230 - 233, XP033688396, DOI: 10.1109/AIAM48774.2019.00053 * |
| PATRIK OLA BRESSAN; JOSE MARCATO JUNIOR; JOSE AUGUSTO CORREA MARTINS; DIOGO NUNES GONCALVES; DANIEL MATTE FREITAS; LUCAS PRADO OSC: "Semantic Segmentation with Labeling Uncertainty and Class Imbalance", ARXIV.ORG, 8 February 2021 (2021-02-08), pages 1 - 15, XP081877515 * |
Also Published As
| Publication number | Publication date |
|---|---|
| JPWO2022185644A1 (https=) | 2022-09-09 |
| US20230394673A1 (en) | 2023-12-07 |
| US12511756B2 (en) | 2025-12-30 |
| US20260073526A1 (en) | 2026-03-12 |
Similar Documents
| Publication | Publication Date | Title |
|---|---|---|
| CN110400283B (zh) | 实时且准确的软组织变形预测 | |
| US12076158B2 (en) | Intuitive display for rotator cuff tear diagnostics | |
| US10210613B2 (en) | Multiple landmark detection in medical images based on hierarchical feature learning and end-to-end training | |
| EP3828818A1 (en) | Method and system for identifying pathological changes in follow-up medical images | |
| US10147190B2 (en) | Generation of a patient-specific anatomical atlas | |
| JP7660388B2 (ja) | 医用情報処理装置、医用情報処理方法及び医用情報処理プログラム | |
| US20220108540A1 (en) | Devices, systems and methods for generating and providing image information | |
| US11229377B2 (en) | System and method for next-generation MRI spine evaluation | |
| US11669974B2 (en) | Constrained object correction for a segmented image | |
| US20180005378A1 (en) | Atlas-Based Determination of Tumor Growth Direction | |
| US20260073526A1 (en) | Image processing apparatus, operation method of image processing apparatus, operation program of image processing apparatus, and learning method | |
| US20230394661A1 (en) | Image processing apparatus, method for operating image processing apparatus, and program for operating image processing apparatus | |
| JPWO2022185644A5 (https=) | ||
| WO2021256096A1 (ja) | 領域修正装置、方法およびプログラム | |
| US10832423B1 (en) | Optimizing an atlas | |
| JP6843892B2 (ja) | 解剖学的または生理学的状態データのクラスタリング | |
| JP2023080703A (ja) | 医用画像処理装置、方法及びプログラム | |
| Wachinger | A Scalable Toolkit for Modeling 3D Surface-Based Brain Geometry | |
| JP2023159043A (ja) | 医用画像処理装置、変化度算出方法、及びプログラム | |
| WO2025128927A1 (en) | Information processing apparatus and information processing method | |
| CN116912160A (zh) | 医用图像处理装置、变化度计算方法及非易失性存储介质 | |
| CN116250005A (zh) | 图像处理装置、图像处理装置的工作方法、图像处理装置的工作程序以及学习完毕模型 |
Legal Events
| Date | Code | Title | Description |
|---|---|---|---|
| 121 | Ep: the epo has been informed by wipo that ep was designated in this application |
Ref document number: 21929202 Country of ref document: EP Kind code of ref document: A1 |
|
| WWE | Wipo information: entry into national phase |
Ref document number: 2023503386 Country of ref document: JP |
|
| NENP | Non-entry into the national phase |
Ref country code: DE |
|
| 122 | Ep: pct application non-entry in european phase |
Ref document number: 21929202 Country of ref document: EP Kind code of ref document: A1 |