WO2022137778A1 - Information processing device, analysis method, and analysis program - Google Patents
Information processing device, analysis method, and analysis program Download PDFInfo
- Publication number
- WO2022137778A1 WO2022137778A1 PCT/JP2021/039367 JP2021039367W WO2022137778A1 WO 2022137778 A1 WO2022137778 A1 WO 2022137778A1 JP 2021039367 W JP2021039367 W JP 2021039367W WO 2022137778 A1 WO2022137778 A1 WO 2022137778A1
- Authority
- WO
- WIPO (PCT)
- Prior art keywords
- insight
- data
- subjects
- information processing
- evaluation
- Prior art date
Links
- 230000010365 information processing Effects 0.000 title claims abstract description 101
- 238000004458 analytical method Methods 0.000 title claims description 65
- 238000011156 evaluation Methods 0.000 claims abstract description 125
- 238000000034 method Methods 0.000 claims description 48
- 239000002245 particle Substances 0.000 claims description 46
- 230000008569 process Effects 0.000 claims description 31
- 238000000513 principal component analysis Methods 0.000 claims description 25
- 238000007405 data analysis Methods 0.000 claims description 7
- 230000008602 contraction Effects 0.000 claims description 2
- 230000006870 function Effects 0.000 description 21
- 238000013450 outlier detection Methods 0.000 description 15
- 238000012545 processing Methods 0.000 description 14
- 230000000694 effects Effects 0.000 description 13
- 238000010586 diagram Methods 0.000 description 12
- 239000002131 composite material Substances 0.000 description 11
- 230000002776 aggregation Effects 0.000 description 6
- 238000004220 aggregation Methods 0.000 description 6
- 230000015556 catabolic process Effects 0.000 description 6
- 238000001514 detection method Methods 0.000 description 6
- 239000000284 extract Substances 0.000 description 6
- 238000004891 communication Methods 0.000 description 5
- 230000000875 corresponding effect Effects 0.000 description 5
- 238000012800 visualization Methods 0.000 description 5
- 230000008859 change Effects 0.000 description 4
- 239000011159 matrix material Substances 0.000 description 4
- 239000008186 active pharmaceutical agent Substances 0.000 description 3
- 230000005540 biological transmission Effects 0.000 description 3
- 238000005070 sampling Methods 0.000 description 3
- 230000004931 aggregating effect Effects 0.000 description 2
- 238000004364 calculation method Methods 0.000 description 2
- 150000001875 compounds Chemical class 0.000 description 2
- 238000012986 modification Methods 0.000 description 2
- 230000004048 modification Effects 0.000 description 2
- 238000003646 Spearman's rank correlation coefficient Methods 0.000 description 1
- 230000000295 complement effect Effects 0.000 description 1
- 230000002596 correlated effect Effects 0.000 description 1
- 238000012217 deletion Methods 0.000 description 1
- 230000037430 deletion Effects 0.000 description 1
- 238000011161 development Methods 0.000 description 1
- 238000005516 engineering process Methods 0.000 description 1
- 238000001914 filtration Methods 0.000 description 1
- 238000007667 floating Methods 0.000 description 1
- 230000006872 improvement Effects 0.000 description 1
- 238000003780 insertion Methods 0.000 description 1
- 230000037431 insertion Effects 0.000 description 1
- 239000004065 semiconductor Substances 0.000 description 1
- 239000007787 solid Substances 0.000 description 1
- 238000000528 statistical test Methods 0.000 description 1
- 230000007704 transition Effects 0.000 description 1
- 238000007794 visualization technique Methods 0.000 description 1
Images


Classifications
-
- G—PHYSICS
- G06—COMPUTING; CALCULATING OR COUNTING
- G06F—ELECTRIC DIGITAL DATA PROCESSING
- G06F18/00—Pattern recognition
- G06F18/20—Analysing
- G06F18/21—Design or setup of recognition systems or techniques; Extraction of features in feature space; Blind source separation
- G06F18/213—Feature extraction, e.g. by transforming the feature space; Summarisation; Mappings, e.g. subspace methods
- G06F18/2135—Feature extraction, e.g. by transforming the feature space; Summarisation; Mappings, e.g. subspace methods based on approximation criteria, e.g. principal component analysis
-
- G—PHYSICS
- G06—COMPUTING; CALCULATING OR COUNTING
- G06F—ELECTRIC DIGITAL DATA PROCESSING
- G06F18/00—Pattern recognition
- G06F18/20—Analysing
- G06F18/24—Classification techniques
- G06F18/241—Classification techniques relating to the classification model, e.g. parametric or non-parametric approaches
-
- G—PHYSICS
- G06—COMPUTING; CALCULATING OR COUNTING
- G06F—ELECTRIC DIGITAL DATA PROCESSING
- G06F18/00—Pattern recognition
- G06F18/20—Analysing
- G06F18/24—Classification techniques
- G06F18/243—Classification techniques relating to the number of classes
- G06F18/2433—Single-class perspective, e.g. one-against-all classification; Novelty detection; Outlier detection
-
- G—PHYSICS
- G06—COMPUTING; CALCULATING OR COUNTING
- G06Q—INFORMATION AND COMMUNICATION TECHNOLOGY [ICT] SPECIALLY ADAPTED FOR ADMINISTRATIVE, COMMERCIAL, FINANCIAL, MANAGERIAL OR SUPERVISORY PURPOSES; SYSTEMS OR METHODS SPECIALLY ADAPTED FOR ADMINISTRATIVE, COMMERCIAL, FINANCIAL, MANAGERIAL OR SUPERVISORY PURPOSES, NOT OTHERWISE PROVIDED FOR
- G06Q10/00—Administration; Management
- G06Q10/06—Resources, workflows, human or project management; Enterprise or organisation planning; Enterprise or organisation modelling
Definitions
- the present invention relates to an information processing device or the like that analyzes a data set.
- Patent Document 1 discloses a system that automatically provides insights from a data set.
- the analyst may input the multidimensional data to be analyzed into the system described in Patent Document 1.
- the system automatically determines the insight, and the determined insight is displayed on the display.
- Patent Document 1 has room for improvement in that it cannot detect insights between a plurality of data sets. For example, by analyzing both a dataset of product sales data for one company and a dataset of product sales data for another company, you may find insights that cannot be obtained from just one dataset. There is.
- Patent Document 1 is not supposed to detect such insights between a plurality of data sets. Therefore, as a matter of course, the technique described in Patent Document 1 cannot detect insights between a plurality of data sets.
- One aspect of the present invention has been made in view of the above problems, and one example of the present invention is to provide an information processing device or the like that enables detection of insights among a plurality of data sets.
- the information processing apparatus detects an insight subject, which is data generated by associating a plurality of data items included in the data set from each of the plurality of data sets, for each insight to be detected. It is provided with a classification means for grouping into groups and an evaluation means for calculating an evaluation value for determining the presence or absence of insights for a combination of the plurality of grouped insight subjects.
- At least one processor detects an insight subject, which is data generated by associating a plurality of data items contained in the data set from each of the plurality of data sets. It includes grouping by target insight and calculating an evaluation value for determining the presence or absence of insight for a combination of the plurality of grouped insight subjects.
- the analysis program captures insight subjects, which are data generated by associating a plurality of data items contained in the data set from each of the plurality of data sets, for each insight to be detected.
- a computer is made to execute a process of grouping and a process of calculating an evaluation value for determining the presence or absence of insight for a combination of a plurality of grouped insight subjects.
- FIG. 1 is a block diagram showing the configuration of the information processing apparatus 1. As shown in the figure, the information processing apparatus 1 includes a classification unit 11 and an evaluation unit 12.
- the classification unit 11 groups insight subjects, which are data generated by associating a plurality of data items included in the data set from each of the plurality of data sets, for each insight to be detected. At the time of grouping, the classification unit 11 groups the insight subjects whose evaluation values can be calculated by the evaluation unit 12. In the following, the insight to be detected is referred to as an insight type. At least one insight type may be set. The details of the insight type will be described in the second embodiment.
- the evaluation unit 12 calculates an evaluation value for determining the presence or absence of insight for the combination of the plurality of grouped insight subjects.
- this evaluation value will be referred to as an insight score.
- the insight subject For example, if a dataset that shows the monthly sales record of a store is the analysis target, the data showing the daily total sales at that store (data that associates the date and the data item of the total sales) is used as the insight subject. be able to.
- data indicating the daily sales of a certain product in the store can be used as an insight subject. Since such an insight subject can be visualized in the form of, for example, a chart, the insight subject can also be called a visualization pattern. It can also be said that the insight subject characterizes each visualization pattern obtained from a dataset that is multidimensional data. In this case, one visualization pattern is associated with one insight subject.
- the classification unit 11 can calculate the insight score (for example, the correlation coefficient) for determining the presence or absence of the correlation.
- the insight score for example, the correlation coefficient
- the classification unit 11 may group insight subjects showing the relationship between the date and the sales in each store.
- the evaluation unit 12 can calculate the insight score for the date and sales at each store.
- the insight score is a great help for users to discover insights even if it is output as it is.
- the insight subjects generated from each of the plurality of data sets are grouped together with the classification unit 11 that groups the insights to be detected.
- a configuration is adopted in which the evaluation unit 12 for calculating the evaluation value for determining the presence / absence of insight is provided for the combination of the plurality of insight subjects.
- the information processing apparatus 1 it is possible to obtain the effect that insights can be detected among a plurality of data sets.
- it leads to the discovery of composite insights (hereinafter referred to as cross-sectional composite insights) obtained by cross-sectional analysis of a plurality of data sets. It will be possible to present potential data to the user.
- the above-mentioned function of the information processing apparatus 1 can also be realized by a program.
- the analysis program according to this exemplary embodiment a process of grouping insight subjects generated from each of a plurality of data sets into a computer for each insight to be detected, and a plurality of grouped insights are described.
- the process of calculating the evaluation value for determining the presence or absence of insight is executed. Therefore, according to the analysis program according to this exemplary embodiment, it is possible to obtain an effect that insights, that is, cross-sectional composite insights, can be detected among a plurality of data sets.
- FIG. 2 is a flow chart showing the flow of the analysis method according to this exemplary embodiment.
- At least one processor groups insight subjects generated from each of a plurality of datasets by insight type. Then, in S12, at least one processor calculates an insight score, which is an evaluation value for determining the presence or absence of insight, for the combination of the plurality of insight subjects grouped in S11. This ends the analysis method of FIG.
- one processor may execute the processes of S11 to S12, or the processes of S11 and the processes of S12 may be executed by different processors. In the latter case, each processor may be provided by one information processing device or may be provided by different information processing devices. Further, at least one processor that executes the processes of S11 to S12 may be included in the information processing apparatus 1.
- At least one processor groups and groups insight subjects generated from each of a plurality of data sets by insight type.
- a configuration is adopted that includes calculating an insight score for determining the presence or absence of insight for a combination of the plurality of insight subjects. Therefore, according to the analysis method according to the present exemplary embodiment, it is possible to obtain an effect that insights, that is, cross-sectional composite insights, can be detected among a plurality of data sets.
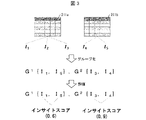
- FIG. 3 is a diagram showing an outline of processing executed by the information processing apparatus 2.
- the information processing apparatus 2 acquires the analysis target data 211a and 211b to be analyzed.
- the analysis target data 211a and 211b are both a data set of multidimensional data including a plurality of records. When it is not necessary to distinguish between the analysis target data 211a and 211b, it is simply referred to as analysis target data 211.
- the analysis target data 211a and 211b shown in FIG. 3 are both table format data.
- the information processing apparatus 2 generates an insight subject from each of the acquired analysis target data 211a and 211b.
- three insight subjects I 1 to I 3 are generated from the analysis target data 211a, and two insight subjects I 4 and I 5 are generated from the analysis target data 211b.
- the information processing apparatus 2 groups the generated insight subjects I 1 to I 5 .
- the insight subjects I 1 and I 5 are classified into the group G 1
- the insight subjects I 3 and I 4 are classified into the group G 2 .
- the insight types of groups G1 and G2 may be the same or different. However, if the insight types of groups G1 and G2 are the same, different insight subjects are classified into each group.
- the information processing apparatus 2 calculates an insight score, which is an evaluation value for determining the presence or absence of insight, for the combination of insight subjects included in each group.
- the insight scores of the insight subjects I 1 and I 5 are calculated to be 0.6
- the insight scores of the insight subjects I 3 and I 4 are calculated to be 0.9.
- the insight score may be, for example, indicating the degree of correlation between insight subjects by a numerical value of 0 to 1 (the larger the value, the higher the degree of correlation). In this case, the insight subjects I 3 and I 4 have a high correlation.
- the insight subject I 3 is generated from the analysis target data 211a.
- the insight subject I 4 is generated from the analysis target data 211b.
- the finding that the insight subject I 3 and I 4 have a high correlation is useful for humans. That is, according to the information processing apparatus 2, it is possible to detect insights between a plurality of data sets, that is, cross-sectional composite insights. Although the details will be described below, the information processing apparatus 2 enables detection of various insights other than correlation.
- FIG. 4 is a block diagram showing the configuration of the information processing apparatus 2.
- the information processing device 2 includes a control unit 20 that controls and controls each part of the information processing device 2, and a storage unit 21 that stores various data used by the information processing device 2. Further, the information processing device 2 has a communication unit 22 for the information processing device 2 to communicate with another device, an input unit 23 for receiving an input to the information processing device 2, and an output for the information processing device 2 to output data.
- the unit 24 is provided.
- the output unit 24 is a display device for displaying and outputting data will be described, but the output mode of the output unit 24 is arbitrary, and data is output in a mode such as print output or audio output. You may.
- the input unit 23 and the output unit 24 may be external devices of the information processing device 2 attached to the information processing device 2.
- the control unit 20 includes a data acquisition unit 201, a subject generation unit 202, a notation unification unit 203, a classification unit 204, a particle size unification unit 205, an evaluation unit 206, and an output data generation unit 207. Further, the storage unit 21 stores the analysis target data 211, the evaluation result data 212, and the output data 213.
- the analysis target data 211 is the data to be analyzed by the information processing device 2.
- the analysis target data 211 includes a plurality of data sets. Each dataset is multidimensional data containing multiple records.
- the evaluation result data 212 is data showing the evaluation result of the analysis target data 211 by the evaluation unit 206.
- the output data 213 is data for presenting the result of the analysis of the analysis target data 211 by the information processing apparatus 2 to the user, that is, data relating to the insight of the analysis target data 211.
- the data acquisition unit 201 acquires a plurality of data sets to be analyzed by the information processing apparatus 2, and stores them in the storage unit 21 as analysis target data 211.
- the data acquisition unit 201 may acquire the analysis target data 211 and store it in the storage unit 21 by the start of the analysis.
- the method of acquiring the analysis target data 211 is not particularly limited.
- the data acquisition unit 201 may acquire a data set input by the user of the information processing apparatus 2 via the input unit 23. Further, for example, the data acquisition unit 201 may acquire the analysis target data 211 from an external device by communication via the communication unit 22.
- the subject generation unit 202 generates an insight subject from each of a plurality of data sets included in the analysis target data 211. More specifically, the subject generation unit 202 generates an insight subject by associating a plurality of data items included in the data set from each of the plurality of data sets. For example, if a dataset is multidimensional data that includes date, sales, and location data items, the subject generator 202 may have an insights subject that associates dates with sales, or insights that associates location with sales. Generate a subject.
- Notation unification unit 203 unifies the notation of data in each insight subject. More specifically, the notation unification unit 203 unifies the notation in each insight subject by extracting similar words from the words included in each insight subject and replacing those words with one word. ..
- similarity includes not only the similarity of character strings of words but also the similarity of meanings.
- “Tokyo”, which represents the place of sale of a product in one data set, is a word that has a similar meaning and character string to "Tokyo”, which represents the place of sale of a product in another data set, and these are called notational fluctuations. You can also do it.
- "prefecture” representing a place of sale of a product in a certain data set is a word having a similar meaning to "place” representing a place of sale of a product in another data set.
- the notation unification unit 203 may extract words with notational fluctuations such as "Tokyo" and "Tokyo". In this case, the notation unification unit 203 may, for example, extract words having a close editing distance between words.
- the edit distance also called the Levenshtein distance, is a distance that indicates how different the two strings are.
- the notation unification unit 203 configures the other of the comparison targets by performing change processing (deletion, insertion, replacement) many times on the character string constituting one word of the comparison target. Ask if it can be converted to a character string.
- the analysis target data 211 may extract similar words based on the Jaro-Winkler distance, which is a distance for measuring the length of two character strings and the necessity (partial match) of replacement, for example. good.
- the analysis target data 211 may represent, for example, each word included in each data set in a distributed expression, and extract words having a high degree of similarity in the distributed expression.
- a program such as word2vec can be used to derive the distributed representation.
- the notation unification unit 203 unifies the notation of similar words after extracting them. For example, the notation unification unit 203 may unify the notation by replacing one word of two similar words with the other word. Further, the notation unification unit 203 may unify the notation by replacing two similar words with a higher-level conceptual word that includes those words.
- the classification unit 204 groups the insight subjects generated by the subject generation unit 202. More specifically, the classification unit 204 groups insight subjects that can calculate an insight score, which is an evaluation value for determining the presence or absence of insight. This makes it possible to detect insights based on the insight score. It should be noted that one group can contain any number of insight subjects. And one group can contain insight subjects from different datasets. It is preferable to include at least one insight subject in one group.
- the evaluation unit 206 groups the insight subjects having the same notation. Notations are often inconsistent between different data sets, and inconsistent notations generally hinder evaluation, but according to the information processing device 2, in such cases. Can also be evaluated. That is, according to the information processing apparatus 2, in addition to the effect of the information processing apparatus 1 according to the exemplary embodiment 1, it becomes possible to detect cross-sectional complex insights even for a data set having a non-uniform notation. The effect is obtained.
- the classification unit 204 puts them in one group. Classify. Further, even if the series name is another notation such as "sales" in a part of such an insight subject, the notation unification unit 203 unifies the notation, so that the classification unit 204 sets them as 1. It can be divided into two groups.
- the criteria for grouping may be set in advance.
- Insight types include, for example, correlation.
- the classifier 204 may group insight subjects that can evaluate the strength of the correlation, in other words, the correlation coefficient can be calculated.
- the classifier 204 groups the insight subjects that can detect the outliers, that is, the insight subjects that can calculate the distance between the corresponding data. do it.
- the classification unit 204 may classify insight subjects having the same word indicating each series name into one group.
- insight type any type other than correlation can be adopted.
- insight types such as cross-measure correlation, two-dimensional clustering, and attribution may be set.
- the classification unit 204 may group single point insights, that is, non-ordinal dimension insight subjects on the horizontal axis with one insight subject as an input. good.
- the prominent No. It is possible to detect insights such as 1 (Outstanding No. 1), prominent lowest (Outstanding No. Last), prominent top two (Outstanding Top 2), or uniformity (Evenness).
- the classification unit 204 may group single shape insights, that is, insight subjects having an order on the horizontal axis with one insight subject as an input (ordinal dimension).
- data having an order on the horizontal axis for example, time series data can be mentioned.
- the set insight type may include at least one that can detect a cross-sectional compound insight (eg, correlation, etc.), and is for detecting a non-cross-sectional compound insight (for example,).
- a change point (Change point, etc.) may be included.
- Particle size unification unit 205 unifies the particle size of data in each insight subject. Since this process is a process for enabling the evaluation unit 206 to evaluate the relationship between the insight subjects, it is performed for the data whose particle size is not uniform.
- the unification of the particle size may be performed on the insight subject generated from the data set, or may be performed on a plurality of data sets to be analyzed in advance.
- the particle size of the data indicates the fineness (unit) of the series of data.
- one insight subject and another insight subject both show monthly sales, the former shows monthly sales and the latter shows bimonthly (odd-numbered) sales. If so, the particle sizes of these data do not match. In this case, it may not be possible to evaluate the distance or similarity between the two data.
- the particle size unification unit 205 performs a process of adjusting the particle size for such data.
- the particle size unification unit 205 may complement the data by complementing the missing values to make the particle size uniform, or may use downsampling to make the particle size uniform.
- Missing value complementation is a process of predicting and complementing a missing portion from other data, and specific examples thereof include interpolation.
- Downsampling is a process of adjusting the sampling particle size to the coarser one.
- the particle size unification unit 205 complements sales in even-numbered months in other insight subjects. Further, when downsampling is performed in the above example, the particle size unification unit 205 ensures that only the sales in odd-numbered months in a certain insight subject are used for the evaluation by the evaluation unit 206.
- the evaluation unit 206 calculates an insight score for a combination of a plurality of insight subjects classified into the same group by the classification unit 204, generates evaluation result data 212 showing the calculation result, and stores it in the storage unit 21.
- the evaluation unit 206 may perform the above evaluation using a function f T that returns an insight score by inputting a combination of insight subjects classified into the same group.
- f T is a predefined function for each insight type T and is designed to have a high value when an insight subject that gives the insights to be detected is input. Assuming that the insight group corresponding to the insight type T is GT, the insight score is expressed by the following formula.
- the evaluation unit 206 may calculate the insight score of each set by combining a plurality of insight subjects classified into the same group. In this case, fT with two insight subjects as inputs may be used. For example, when three insight subjects I 1 to I 3 are grouped, the evaluation unit 206 sets each pair of I 1 and I 2 , I 1 and I 3 , and I 2 and I 3 to f, respectively. By inputting to T , the insight score of each set is calculated.
- the method of calculating the insight score may be according to the insight type. For example, when evaluating the degree of linear correlation between a set of insight subjects, the evaluation unit 206 may calculate the insight score using f T for calculating the Pearson correlation coefficient. In addition to this, for example, the evaluation unit 206 may calculate Spearman's rank correlation coefficient, cosine similarity, Euclidean distance between corresponding data, EMD (Earth Mover's distance), and the like as insight scores.
- EMD Earth Mover's distance
- the evaluation unit 206 calculates the insight score for the combination of a plurality of insight subjects having the same particle size.
- the particle size of data is often inconsistent between different data sets, and in general, the inconsistency in particle size often hinders evaluation.
- the information processing apparatus 2 such data is used. Evaluation can also be made in some cases. That is, according to the information processing apparatus 2, in addition to the effect of the information processing apparatus 1 according to the exemplary embodiment 1, it is possible to detect cross-sectional composite insights even for a data set containing data having non-uniform particle size. The effect of being possible is obtained.
- the output data generation unit 207 generates output data 213 using the evaluation result data 212.
- the output data generation unit 207 is not an essential component of the information processing device 2, by providing the output data generation unit 207, the result of the analysis by the information processing device 2 can be presented to the user in a more recognizable manner. Will be possible.
- FIG. 5 is a flow chart showing the flow of the analysis method.
- FIG. 6 is a diagram showing an example of the analysis target data 211 and the insight subject generated from the analysis target data 211.
- FIG. 7 is a diagram showing an example of the evaluation result data 212 and the output data 213.
- the data acquisition unit 201 receives the input of a plurality of data sets and stores the data to be analyzed in the storage unit 21 as the data 211.
- the data acquisition unit 201 receives the input of the analysis target data 211 shown in FIG. 6 via the input unit 23.
- the data to be analyzed 211 includes a data set ( DS) showing monthly sales by prefecture in convenience stores and a data set (DT ) showing monthly sales by prefecture in supermarkets.
- the subject generation unit 202 generates an insight subject from each data set included in the analysis target data 211. For example, when the datasets DS and DT shown in FIG. 6 are used, the subject generator 202 generates the insight subjects IS 1 and IS 2 from the dataset DS and the insight subject from the dataset DT . IT 1 and IT 2 can be generated.
- Insight subject IS 1 shows sales by prefecture in convenience stores, and in FIG. 6, IS 1 is shown as a bar graph of sales (horizontal axis is prefecture, vertical axis is sales).
- Insight Subject IS 2 shows monthly sales at convenience stores, and in FIG. 6, IS 2 is shown as a line graph of sales (horizontal axis is date, vertical axis is sales). ..
- Insight Subject IT 1 shows sales by prefecture in a supermarket, and in FIG. 6, IT 1 is shown as a bar graph of sales (horizontal axis is prefecture, vertical axis is sales). There is. Further, the insight subject IT 2 shows monthly sales in a supermarket, and in FIG. 6, IT 2 is shown as a line graph of sales (horizontal axis is date, vertical axis is sales).
- the insight subject I can also be in the following data format, for example.
- I ⁇ subspace, breakdown, measure, aggregation ⁇
- the above "subspace” indicates how the records contained in the dataset, which is multidimensional data, are filtered.
- the above "subspace” corresponds to the legend of each chart.
- “subspace” in the line graph of IS 2 in FIG. 6 is “Tokyo”. Not performing filtering may be represented by a symbol such as "*”.
- breakdown indicates a column used as a key for aggregating a dataset which is multidimensional data.
- the above “breakdown” corresponds to the horizontal axis of each chart.
- breakdown in the line graph of IS 2 in FIG. 6 is a “date”.
- the above “measure” indicates a column used as numerical data in a dataset that is multidimensional data.
- the above “measure” corresponds to the vertical axis of each chart.
- “measure” in the line graph of IS 2 in FIG. 6 is numerical data of “sales”.
- the above “aggregation” indicates a method (for example, a function) for aggregating data for each "breakdown". Examples of the above “aggregation” include total, average, maximum value, minimum value and the like. If the function used for aggregation is "total”, “aggregation” may be omitted.
- IS 2 ⁇ ⁇ *, Tokyo ⁇ , date, sales ⁇
- the subject generation unit 202 may generate an insight subject in such a data format from each data set included in the data to be analyzed 211.
- the notation unification unit 203 unifies the notation of the data in each insight subject generated in S22.
- the label “prefecture” on the horizontal axis in IS 1 and the label “location” on the horizontal axis in IT 1 The meanings of are similar.
- the series names "Tokyo”, “Osaka”, and “Kanagawa” of IS 1 are similar in meaning and notation to the series names “Tokyo”, “Osaka”, and "Kanagawa” of IT 1 . ing.
- the notation unification unit 203 extracts such words and unifies those notations.
- the classification unit 204 groups the insight subjects generated in S22 and whose notation is unified in S23. For example, suppose that among the IS 1 , IS 2 , IT 1 , and IT 2 shown in FIG. 6, the insight subjects having the same label on the vertical axis and the horizontal axis are grouped. In this case, the classification unit 204 groups IS 1 and IT 1 in which the label on the vertical axis is “sales” and the label on the horizontal axis is “location”. Since the "prefectures" of IS 1 have been replaced with "places" by the Ministry of Unification 203, such grouping is possible. Further, the classification unit 204 groups IS 2 and IT 2 in which the label on the vertical axis is “sales” and the label on the horizontal axis is “date”.
- the grouping result is expressed as follows. IS 1 , IT 1 ⁇ G 1 IS 2 , IT 2 ⁇ G 2
- the particle size unification unit 205 unifies the particle size of the data included in the insight subject grouped in S24.
- the "date" of IS 2 shown in FIG. 6 is the first day of an odd month, whereas the "date" of IT 2 is the first day of every month.
- the particle size unification unit 205 extracts data having a difference in particle size in this way, and performs a process of aligning the particle size of the data.
- the particle size unification unit 205 may make the particle size of the “date” data uniform by extracting (that is, downsampling ) the data of odd-numbered months from the data of the “date” of IT 2 . Further, the particle size unification unit 205 may make the particle size of the “date” data uniform by complementing the missing value of the data of even months of IS 2 . Missing value complementation is also effective when there is a deviation in the sampling date of the data. For example, when the particle size unification unit 205 aligns the particle size of the data on the 1st day of the month with the data on the 15th day of the month, the data on the 1st day of the month may be generated by complementing the data on the 15th day of the month with missing values. ..
- the evaluation unit 206 evaluates a combination of insight subjects grouped in S24 and has a unified data particle size in S25, and the evaluation result is stored in the storage unit 21 as evaluation result data 212. More specifically, the evaluation unit 206 performs a process of grouping insight subjects included in the same group and calculating an insight score for that group for each group.
- the evaluation unit 206 uses a score function expressed by the formula of f T (I i , I j ), that is, a function that inputs two insight subjects to be evaluated and outputs an insight score. You may calculate the insight score.
- the insight score of group G 1 is expressed as f T ( IS 1 , IT 1 )
- the insight score of group G 2 is expressed as f T ( IS 2 , IT 2 ). ..
- the evaluation unit 206 may generate the evaluation result data 212 as shown in FIG. 7, for example, by listing the evaluation results as described above.
- the evaluation result data 212 shown in FIG. 7 is data in a table format showing a combination of insight subjects and an insight score calculated for the combination. Further, in the evaluation result data 212 shown in FIG. 7, the “rank” indicating the ranking of the insight score and the “insight type” are also shown. As described above, the evaluation unit 206 may generate the evaluation result data 212 including various information regarding the evaluation in addition to the combination of the insight subjects and the insight score calculated for the combination.
- the output data generation unit 207 generates the output data 213 using the evaluation result data 212 generated in S26, and causes the output unit 24 to output the output data 213. For example, when the evaluation result data 212 shown in FIG. 7 is used, the output data generation unit 207 generates output data 213 indicating a combination of insight subjects having the highest insight score (rank), and outputs the output data 213 to the output unit 24. .. As a result, the process of FIG. 5 is completed.
- the output data 213 may be a visualization of the insight so that the user can easily recognize the insight.
- the visualization method may be determined according to the insight type. For example, when the insight type is "correlation", the output data generation unit 207 generates a chart (for example, a two-dimensional scatter diagram) suitable for expressing the correlation as information about the insight as the output data 213. May be good.
- the lower part of FIG. 7 shows an example of information on insights for the combination of insight subjects shown in the evaluation result data 212 that has the highest insight score (that is, rank 1).
- the information about the insight shown in FIG. 7 includes a scatter diagram showing the correlation between the sales of the supermarket and the convenience store, and the insight information showing the details of the insight.
- the insight information shows the insight type and insight score, as well as the details of each insight subject and the underlying dataset.
- the information generated by the output data generation unit 207 may be any information that allows the user to recognize the insight, and is not limited to the example of FIG. 7.
- the output data generation unit 207 may generate a chart of each insight subject for the combination of the insight subjects having the highest insight score, and use this as the output data 213.
- the evaluation unit 206 may present the analysis result to the user by outputting all or part of the evaluation result data 212 shown in FIG. 7 to the output unit 24. Further, the evaluation unit 206 may output data constituting each insight subject having a rank of 1 and each insight subject having an insight score of a predetermined threshold value or more. As described above, the mode for outputting the analysis result is arbitrary and is not limited to the example shown in FIG. 7. In addition, the user may be allowed to select a method for visualizing the analysis result. In this case, the output data generation unit 207 visualizes the analysis result by a method selected by the user.
- the information processing apparatus 2 can output charts, data, and the like that may lead to the discovery of insights as the analysis results of a plurality of data sets. This eliminates the need to manually compare charts. It also makes it easy to narrow down datasets that may be useful for analysis, even if the user ultimately considers insights. Therefore, the time required for analysis and visualization can be significantly reduced.
- the information processing apparatus 2 there is no room for deviation of the judgment criteria that occurs when the user performs all the analysis. Further, it is possible to reduce the risk of oversight that occurs when the user performs the analysis. Further, when a large-scale data set is the analysis target, it is difficult for the user to discover the composite insight, but according to the information processing apparatus 2, the discovery of the composite insight (including the cross-sectional composite insight) can be found. It will be easier.
- the process of S23 may be performed before the process of S24, and may be performed between S21 and S22, for example. Further, the processing of S25 may be performed before the processing of S26, and may be performed between S21 and S22, for example.
- the evaluation unit 206 may evaluate the insight subject by an evaluation method capable of calculating the insight score even for a combination of a plurality of insight subjects having different data granularity.
- an evaluation method capable of calculating the insight score even for a combination of a plurality of insight subjects having different data granularity As a result, in addition to the effect of the information processing apparatus 1 according to the exemplary embodiment 1, it is possible to detect cross-sectional complex insights even for a data set containing data having non-uniform particle size. Be done. Further, in this case, the effect that the particle size unification unit 205 can be omitted can also be obtained.
- the evaluation unit 206 uses DTW (Dynamic Time Warping) or function data analysis to analyze the insight score. May be calculated. Examples of data having an order include time-series data and the like.
- the shortest path of n, n) is obtained by dynamic programming.
- the evaluation unit 206 derives a continuous function representing the record of each insight subject, calculates the distance and similarity between the insight subjects through the function, and calculates them. Can be used to calculate the insight score.
- FIG. 8 is a block diagram showing a configuration of the information processing apparatus 3 according to the present exemplary embodiment.
- FIG. 9 is a flow chart showing the flow of the analysis method according to this exemplary embodiment.
- FIG. 10 is a diagram illustrating a method of calculating an insight score and a method of detecting outliers.
- the information processing apparatus 3 includes an evaluation unit 31 and an outlier detection unit 32. If it is not necessary to detect outliers, the outlier detection unit 32 may be omitted. Similar to the evaluation unit 12 shown in FIG. 1 and the evaluation unit 206 shown in FIG. 4, the evaluation unit 31 calculates an insight score for a combination of a plurality of grouped insight subjects. The evaluation unit 31 is evaluated in that it can evaluate three or more insight subjects at once, in other words, it can calculate one insight score indicating the presence or absence of insight in three or more insight subjects. It is different from parts 12 and 206.
- the evaluation unit 31 describes the combination of the insight subjects based on the degree of bias in the contribution of each principal component, which is obtained by performing principal component analysis on a plurality of grouped insight subjects. Calculate the insight score. Principal component analysis can be performed on any number of insight subjects. Therefore, according to the information processing apparatus 3 according to the present exemplary embodiment, in addition to the effects of the information processing apparatus 1 and 2 according to the exemplary embodiments 1 and 2, three or more insight subjects are collectively combined. The effect of being able to evaluate is obtained. The details of the evaluation method and the reason why such evaluation is possible will be described later with reference to FIGS. 9 and 10.
- the outlier detection unit 32 uses the principal component obtained by the principal component analysis by the evaluation unit 31 to represent the data contained in a plurality of grouped insight subjects, thereby detecting the outliers included in the data. To detect. Therefore, according to the information processing apparatus 3 according to the present exemplary embodiment, in addition to the effects of the information processing apparatus 1 and 2 according to the exemplary embodiments 1 and 2, the principal component analysis performed for evaluation is performed. The effect of being able to efficiently detect outliers using the results can be obtained. The details of the outlier detection method and the reason why the outliers can be detected by such a method will be described later with reference to FIGS. 9 and 10.
- the flow of processing executed by the information processing apparatus 3 will be described with reference to FIG. It is assumed that a plurality of insight subjects have been grouped before the process of FIG. That is, although not shown in FIG. 8, in the present exemplary embodiment, the information processing apparatus 3 has a configuration corresponding to the classification unit 11 (exemplary embodiment 1) or the classification unit 204 (exemplary embodiment 2). It is assumed that it is.
- the information processing device 3 may include a part or all of various configurations (for example, data acquisition unit 201, subject generation unit 202, etc.) included in the information processing device 2.
- the evaluation unit 31 performs principal component analysis on the data specified as the target of principal component analysis.
- the evaluation unit 31 may generate a multidimensional correlation matrix from the data of the item of “measure” in each insight subject, and perform principal component analysis using this correlation matrix.
- Principal component analysis calculates eigenvalues and eigenvectors.
- the evaluation unit 31 calculates the contribution rate of each principal component using the calculated eigenvalues. Since the contribution rate of each principal component can be regarded as the amount of information in the axial direction (eigenvector), the strength of the correlation between the insight subjects can be quantitatively determined by examining the degree of bias of the contribution rate of each principal component. Can be evaluated.
- FIG. 10 shows a bar graph 1001 showing the contribution rate of each principal component calculated by principal component analysis of uncorrelated insight subjects, and each calculated by principal component analysis of correlated insight subjects.
- a bar graph 1002 showing the contribution rate of the principal component is shown.
- PC1 is the first principal component
- PC2 is the second principal component
- PC3 is the third principal component.
- the contribution rates of PC1 to PC3 are almost the same, and the degree of bias between the main components is small.
- the contribution rate of PC1 is the highest, the contribution rate of PC2 is about half of that, the contribution rate of PC3 is considerably small, and the degree of bias is large as a whole. In this way, the presence or absence of correlation between insight subjects is clearly reflected in the degree of bias in the contribution rate of each principal component.
- the evaluation result can be used as an insight score.
- the contribution rate of the first principal component may be used as the insight score. This is because, as shown in FIG. 10, when the degree of bias of the contribution ratio of each main component is large (bar graph 1002), the contribution ratio of the first main component PC1 is larger than when it is small (bar graph 1001). Is.
- the insight score is calculated using a score function that inputs the contribution rate of each principal component and outputs a higher value as the input contribution rate includes a prominently higher one. You can also.
- the evaluation unit 31 may execute a kernel principal component analysis using an arbitrary kernel instead of the normal principal component analysis. Further, when the correlation matrix cannot be calculated due to the difference in the sampling grain size of the record, the evaluation unit 31 may execute the function principal component analysis using the function data analysis.
- the outlier detection unit 32 detects outliers included in each grouped insight subject. For example, when evaluation is performed using the data of the item "measure” in each insight subject in S31, the outlier detection unit 32 also detects the outlier in the data of the item "measure” in each insight subject. do.
- Outlier detection is performed by representing the data contained in a plurality of grouped insight subjects using the principal components obtained by the principal component analysis performed for the evaluation in S31.
- a coordinate plane in which the vertical axis is PC2 and the horizontal axis is PC1 is the point where the sample data is represented by the first principal component PC1 and the second principal component PC2 obtained by principal component analysis of the sample data. It is plotted above. In the plot after the principal component analysis, the data that is separated from the other data is also separated from the other data in the original sample data. Therefore, data that is distant from other data may be detected as an outlier, as in the plot that is regarded as an "outlier" in 1003.
- the outlier detection unit 32 may calculate the Hotelling T 2 statistic of the data represented by the principal component, and detect the data in which the calculated T 2 statistic is remarkable as the outlier value.
- the T 2 statistic calculated from the sample data shown in 1003 of the same figure is plotted on the coordinate plane of the sample number on the horizontal axis and the T 2 statistic on the vertical axis.
- the T2 statistic is larger than that of the other plots. Therefore, the outlier detection unit 32 can detect the outliers using the T 2 statistic.
- the outlier detection unit 32 may calculate the score using the p-value obtained based on the statistical test. In this case, the outlier detection unit 32 may detect the outliers using the calculated score.
- the evaluation result of S31 and the outliers detected in S32 may be stored as evaluation result data.
- the evaluation result data may be output as it is, or output data may be generated from the evaluation result data and the generated output data may be output as in the exemplary embodiment 2.
- the evaluation method described above by the evaluation unit 31 is suitable for detecting cross-sectional composite insights and also for detecting non-cross-sectional, that is, insights in one dataset. Therefore, the above-mentioned information processing apparatus 3 does not necessarily have to have a configuration corresponding to the classification unit 204 (exemplary embodiment 2) or the classification unit 11 (exemplary embodiment 1).
- the information processing apparatus 3 includes an acquisition unit for acquiring a plurality of insight subjects to be evaluated and the evaluation unit 31 described above.
- the plurality of insight subjects acquired by the acquisition unit may be generated from at least one data set. That is, each of the above exemplary embodiments differs from this reference example in that it is not essential to use multiple insight subjects generated from multiple datasets.
- the evaluation unit 31 is based on the degree of bias in the contribution of each principal component obtained by performing principal component analysis of the plurality of insight subjects acquired by the acquisition unit. Then, the insight score for the combination of the insight subjects is calculated. Therefore, it is possible to solve the conventional problem that it was not possible to evaluate three or more insight subjects at once.
- the analysis method according to this reference example is obtained by acquiring a plurality of insight subjects to be evaluated by at least one processor and performing principal component analysis of the acquired plurality of said insight subjects. It also includes calculating the insight score for the combination of insight subjects based on the degree of bias in the contribution of each principal component.
- the analysis program according to this reference example is obtained by subjecting a computer to a process of acquiring a plurality of insight subjects to be evaluated and performing principal component analysis of the acquired plurality of the insight subjects. The process of calculating the insight score for the combination of the insight subjects based on the degree of bias of the contribution of the components is executed.
- the processing performed by one information processing device 1 may be shared by a plurality of information processing devices. In other words, at least one other information processing device may execute a part of the processing performed by the information processing device 1. Further, in other words, when each of the above-mentioned processes is performed by at least one processor, the at least one processor may be provided by one information processing device 1, or may be provided by different information processing devices. It may be the one that is. This also applies to the information processing apparatus 2 in the above-mentioned exemplary embodiment 2 and the information processing apparatus 3 in the exemplary embodiment 3.
- Some or all the functions of the information processing devices 1 to 3 may be realized by hardware such as an integrated circuit (IC chip) or by software.
- the information processing devices 1 to 3 are realized by, for example, a computer that executes an instruction of a program which is software that realizes each function.
- a computer that executes an instruction of a program which is software that realizes each function.
- An example of such a computer (hereinafter referred to as computer C) is shown in FIG.
- the computer C includes at least one processor C1 and at least one memory C2.
- a program P for operating the computer C as the information processing devices 1 to 3 is recorded in the memory C2.
- the processor C1 reads the program P from the memory C2 and executes it, so that each function of the information processing devices 1 to 3 is realized.
- Examples of the processor C1 include CPU (Central Processing Unit), GPU (Graphic Processing Unit), DSP (Digital Signal Processor), MPU (Micro Processing Unit), FPU (Floating point number Processing Unit), and PPU (Physics Processing Unit). , Microcontrollers, or combinations thereof.
- the memory C2 for example, a flash memory, an HDD (Hard Disk Drive), an SSD (Solid State Drive), or a combination thereof can be used.
- the computer C may further include a RAM (RandomAccessMemory) for expanding the program P at the time of execution and temporarily storing various data. Further, the computer C may further include a communication interface for transmitting / receiving data to / from another device. Further, the computer C may further include an input / output interface for connecting an input / output device such as a keyboard, a mouse, a display, and a printer.
- RAM RandomAccessMemory
- the computer C may further include a communication interface for transmitting / receiving data to / from another device. Further, the computer C may further include an input / output interface for connecting an input / output device such as a keyboard, a mouse, a display, and a printer.
- the program P can be recorded on a non-temporary tangible recording medium M that can be read by the computer C.
- a recording medium M for example, a tape, a disk, a card, a semiconductor memory, a programmable logic circuit, or the like can be used.
- the computer C can acquire the program P via such a recording medium M.
- the program P can be transmitted via the transmission medium.
- a transmission medium for example, a communication network, a broadcast wave, or the like can be used.
- the computer C can also acquire the program P via such a transmission medium.
- the insight subject which is the data generated by associating multiple data items contained in the dataset from each of the plurality of datasets, is grouped with a classification means for grouping the insights to be detected.
- An information processing apparatus including an evaluation means for calculating an evaluation value for determining the presence or absence of insights for a combination of a plurality of the insight subjects. This configuration allows the detection of insights across multiple datasets.
- Appendix 2 The information processing apparatus according to Appendix 1, further comprising a notation unifying means for unifying the notations in the plurality of insight subjects, wherein the classification means groups the insight subjects having a unified notation. This configuration makes it possible to detect cross-sectional complex insights even for datasets with inconsistent notations.
- Appendix 3 It is described in Appendix 1 or 2, further comprising a particle size unifying means for unifying the particle size of the data in the plurality of insight subjects, wherein the evaluation means calculates the evaluation value for the plurality of the insight subjects having the same particle size.
- Information processing equipment This configuration makes it possible to detect cross-sectional complex insights even for datasets containing data with non-uniform particle size.
- Appendix 4 The information processing apparatus according to Appendix 1 or 2, wherein the evaluation means calculates the evaluation value by a dynamic time expansion / contraction method or function data analysis. This configuration makes it possible to detect cross-sectional complex insights even for datasets containing data with non-uniform particle size.
- the evaluation means calculates the evaluation value based on the degree of bias in the contribution of each main component, which is obtained by performing principal component analysis on a plurality of grouped insight subjects.
- Appendix 6 Further provided with outlier detection means for detecting outliers included in the data by representing the data contained in the plurality of grouped insight subjects using the principal components obtained by the principal component analysis. , The information processing apparatus according to Appendix 5. According to this configuration, efficient outlier detection can be performed by using the result of the principal component analysis performed for the evaluation.
- the processor comprises at least one processor, and the processor detects an insight subject, which is data generated by associating a plurality of data items contained in the data set from each of the plurality of data sets, for each insight to be detected.
- An information processing device that executes a process of grouping and a process of calculating an evaluation value for determining the presence or absence of insight for a combination of a plurality of grouped insight subjects.
- the information processing apparatus may further include a memory, even if the memory stores a program for causing the processor to execute the process of grouping the above and the process of evaluating the evaluation. good.
- the program may also be recorded on a computer-readable, non-temporary, tangible recording medium.
Landscapes
- Engineering & Computer Science (AREA)
- Theoretical Computer Science (AREA)
- Data Mining & Analysis (AREA)
- Computer Vision & Pattern Recognition (AREA)
- Physics & Mathematics (AREA)
- General Physics & Mathematics (AREA)
- Bioinformatics & Cheminformatics (AREA)
- Bioinformatics & Computational Biology (AREA)
- Artificial Intelligence (AREA)
- Evolutionary Biology (AREA)
- Evolutionary Computation (AREA)
- General Engineering & Computer Science (AREA)
- Life Sciences & Earth Sciences (AREA)
- Business, Economics & Management (AREA)
- Human Resources & Organizations (AREA)
- Economics (AREA)
- Entrepreneurship & Innovation (AREA)
- Strategic Management (AREA)
- Educational Administration (AREA)
- Game Theory and Decision Science (AREA)
- Development Economics (AREA)
- Marketing (AREA)
- Operations Research (AREA)
- Quality & Reliability (AREA)
- Tourism & Hospitality (AREA)
- General Business, Economics & Management (AREA)
- Information Retrieval, Db Structures And Fs Structures Therefor (AREA)
Abstract
Description
本発明の第1の例示的実施形態について、図面を参照して詳細に説明する。本例示的実施形態は、後述する例示的実施形態の基本となる形態である。 [Exemplary Embodiment 1]
A first exemplary embodiment of the invention will be described in detail with reference to the drawings. This exemplary embodiment is the basis of the exemplary embodiments described below.
本例示的実施形態に係る情報処理装置1の構成について、図1を参照して説明する。図1は、情報処理装置1の構成を示すブロック図である。図示のように、情報処理装置1は、分類部11と評価部12を備えている。 (Configuration of information processing device 1)
The configuration of the
本例示的実施形態に係る分析方法の流れについて、図2を参照して説明する。図2は、本例示的実施形態に係る分析方法の流れを示すフロー図である。 (Flow of analysis method)
The flow of the analysis method according to this exemplary embodiment will be described with reference to FIG. FIG. 2 is a flow chart showing the flow of the analysis method according to this exemplary embodiment.
(概要)
本発明の第2の例示的実施形態について、図面を参照して詳細に説明する。本例示的実施形態では、複数のデータセットの入力を受け付けて、それらのデータセットについてのインサイトに関する情報を出力する情報処理装置2について説明する。図3は、情報処理装置2が実行する処理の概要を示す図である。 [Exemplary Embodiment 2]
(Overview)
A second exemplary embodiment of the invention will be described in detail with reference to the drawings. In this exemplary embodiment, an
図4は、情報処理装置2の構成を示すブロック図である。情報処理装置2は、情報処理装置2の各部を統括して制御する制御部20と、情報処理装置2が使用する各種データを記憶する記憶部21を備えている。また、情報処理装置2は、情報処理装置2が他の装置と通信するための通信部22、情報処理装置2に対する入力を受け付ける入力部23、および情報処理装置2がデータを出力するための出力部24を備えている。以下では、出力部24がデータを表示出力する表示装置である例を説明するが、出力部24の出力態様は任意であり、例えば印字出力や音声出力等の態様でデータを出力するものであってもよい。また、入力部23と出力部24は、情報処理装置2に外付けされた、情報処理装置2の外部の機器であってもよい。 (Configuration of information processing device 2)
FIG. 4 is a block diagram showing the configuration of the
評価部206は、同じグループに分類された複数のインサイトサブジェクトを組にして、各組のインサイトスコアを算出してもよい。この場合、2つのインサイトサブジェクトを入力とするfTを用いればよい。例えば、I1~I3の3つのインサイトサブジェクトがグループ化されている場合、評価部206は、I1とI2、I1とI3、およびI2とI3の各組をそれぞれfTに入力することにより、各組のインサイトスコアを算出する。 (Insight score) = f T (I 1 , I 2 , ..., In | I i ∈ GT )
The
本例示的実施形態に係る分析方法の流れについて図5~図7を参照して説明する。図5は、分析方法の流れを示すフロー図である。また、図6は、分析対象データ211と、当該分析対象データ211から生成されたインサイトサブジェクトの例を示す図である。そして、図7は、評価結果データ212と出力データ213の例を示す図である。 (Flow of analysis method)
The flow of the analysis method according to this exemplary embodiment will be described with reference to FIGS. 5 to 7. FIG. 5 is a flow chart showing the flow of the analysis method. Further, FIG. 6 is a diagram showing an example of the
I={subspace, breakdown, measure, aggregation}
上記“subspace”(サブスペース)は、多次元データであるデータセットに含まれるレコードをどのようにフィルタしたかを示す。上記“subspace”は、各チャートの凡例に対応する。例えば、図6のIS 2の折れ線グラフにおける“subspace”は「東京都」である。フィルタリングを行わないことは、“*”等の記号で表せばよい。 The insight subject I can also be in the following data format, for example.
I = {subspace, breakdown, measure, aggregation}
The above "subspace" indicates how the records contained in the dataset, which is multidimensional data, are filtered. The above "subspace" corresponds to the legend of each chart. For example, “subspace” in the line graph of IS 2 in FIG. 6 is “Tokyo”. Not performing filtering may be represented by a symbol such as "*".
IS 1,IT 1∈G1
IS 2,IT 2∈G2
S25では、粒度統一部205が、S24でグループ化されたインサイトサブジェクトに含まれるデータの粒度を統一する。例えば、図6に示すIS 2の「日付」は、奇数月の1日であるのに対し、IT 2の「日付」は毎月の1日である。粒度統一部205は、このように粒度に差異があるデータを抽出し、それらのデータの粒度を揃える処理を行う。例えば、粒度統一部205は、IT 2の「日付」のデータのうち、奇数月のデータを抽出(すなわちダウンサンプリング)することにより、「日付」データの粒度を揃えてもよい。また、粒度統一部205は、IS 2の偶数月のデータを欠損値補完することにより、「日付」データの粒度を揃えてもよい。なお、欠損値補完は、データのサンプリング日付にずれがある場合にも有効である。例えば、粒度統一部205は、毎月1日のデータと、毎月15日のデータの粒度を揃える場合、毎月15日のデータを欠損値補完することにより、毎月1日のデータを生成してもよい。 Assuming that the group containing IS 1 and IT 1 is G 1 and the group containing IS 2 and IT 2 is G 2 , the grouping result is expressed as follows.
IS 1 , IT 1 ∈ G 1
IS 2 , IT 2 ∈ G 2
In S25, the particle
評価部206は、データの粒度が異なる複数のインサイトサブジェクトの組み合わせについてもインサイトスコアを算出可能な評価方法により、インサイトサブジェクトを評価してもよい。これにより、例示的実施形態1に係る情報処理装置1の奏する効果に加えて、粒度が不統一なデータを含むデータセットについても横断的複合インサイトを検出することが可能になるという効果が得られる。また、この場合、粒度統一部205を省略することができるという効果も得られる。 (Variation example of dealing with the difference in particle size)
The
本発明の第3の例示的実施形態について、図面を参照して詳細に説明する。上述の例示的実施形態において、インサイトサブジェクトをグループ化したときに、3つ以上のインサイトサブジェクトが1つのグループに分類されることがあり得る。このような場合、上述したスコア関数fT(Ii,Ij)では、3つ以上のインサイトサブジェクトをまとめて評価することはできない。また、3つ以上のインサイトサブジェクトをまとめて評価する方法については、特許文献1にも記載も示唆もされていない。 [Exemplary Embodiment 3]
A third exemplary embodiment of the invention will be described in detail with reference to the drawings. In the exemplary embodiments described above, when grouping insight subjects, it is possible that more than one insight subject will be grouped into one group. In such a case, the score function f T (I i , I j ) described above cannot collectively evaluate three or more insight subjects. Further, neither a description nor a suggestion is made in
図8に示すように、情報処理装置3は、評価部31と外れ値検出部32を備えている。なお、外れ値を検出する必要がない場合には外れ値検出部32を省略してもよい。評価部31は、図1に示した評価部12および図4に示した評価部206と同様に、グループ化された複数のインサイトサブジェクトの組み合わせについてインサイトスコアを算出する。評価部31は、3つ以上のインサイトサブジェクトをまとめて評価することができる点、言い換えれば3つ以上のインサイトサブジェクトにおけるインサイトの有無を示す1つのインサイトスコアを算出できる点で、評価部12、206と相違している。 (Configuration of information processing device 3)
As shown in FIG. 8, the
情報処理装置3が実行する処理の流れを図9に基づいて説明する。なお、図9の処理の前に、複数のインサイトサブジェクトがグループ化済であるとする。つまり、図8には示していないが、本例示的実施形態では、情報処理装置3が分類部11(例示的実施形態1)または分類部204(例示的実施形態2)に相当する構成を備えていることを想定している。なお、情報処理装置3は、情報処理装置2が備える各種構成(例えば、データ取得部201やサブジェクト生成部202等)の一部または全部を備えていてもよい。 (Flow of processing executed by the information processing device 3)
The flow of processing executed by the
評価部31による上述の評価方法は、横断的複合インサイトの検出に好適であると共に、横断的ではない、つまり1つのデータセットにおけるインサイトの検出にも好適である。このため、上述の情報処理装置3は、必ずしも分類部204(例示的実施形態2)や、分類部11(例示的実施形態1)に相当する構成を備えている必要はない。 [Reference example]
The evaluation method described above by the
上述の例示的実施形態1において、1つの情報処理装置1が行っていた処理は、複数の情報処理装置に分担させてもよい。言い換えれば、情報処理装置1が行う処理の一部を、少なくとも1つの他の情報処理装置に実行させてもよい。さらに言い換えれば、上述の各処理を少なくとも1つのプロセッサに行わせる場合、その少なくとも1つのプロセッサは、1つの情報処理装置1が備えているものであってもよいし、それぞれ異なる情報処理装置が備えているものであってもよい。これは、上述の例示的実施形態2における情報処理装置2、および例示的実施形態3における情報処理装置3についても同様である。 [Modification example]
In the above-mentioned
情報処理装置1~3の一部又は全部の機能は、集積回路(ICチップ)等のハードウェアによって実現してもよいし、ソフトウェアによって実現してもよい。 [Example of implementation by software]
Some or all the functions of the
本発明は、上述した実施形態に限定されるものでなく、請求項に示した範囲で種々の変更が可能である。例えば、上述した実施形態に開示された技術的手段を適宜組み合わせて得られる実施形態についても、本発明の技術的範囲に含まれる。 [Appendix 1]
The present invention is not limited to the above-described embodiment, and various modifications can be made within the scope of the claims. For example, an embodiment obtained by appropriately combining the technical means disclosed in the above-described embodiment is also included in the technical scope of the present invention.
上述した実施形態の一部又は全部は、以下のようにも記載され得る。ただし、本発明は、以下の記載する態様に限定されるものではない。 [Appendix 2]
Some or all of the embodiments described above may also be described as follows. However, the present invention is not limited to the aspects described below.
複数のデータセットのそれぞれから当該データセットに含まれる複数のデータ項目を関連付けることにより生成されたデータであるインサイトサブジェクトを、検出対象のインサイトごとにグループ化する分類手段と、グループ化された複数の前記インサイトサブジェクトの組み合わせについて、インサイトの有無を判定するための評価値を算出する評価手段と、を備える情報処理装置。この構成によれば、複数のデータセット間におけるインサイトの検出を可能にすることができる。 (Appendix 1)
The insight subject, which is the data generated by associating multiple data items contained in the dataset from each of the plurality of datasets, is grouped with a classification means for grouping the insights to be detected. An information processing apparatus including an evaluation means for calculating an evaluation value for determining the presence or absence of insights for a combination of a plurality of the insight subjects. This configuration allows the detection of insights across multiple datasets.
複数の前記インサイトサブジェクトにおける表記を統一する表記統一手段をさらに備え、前記分類手段は、表記が統一された前記インサイトサブジェクトをグループ化する、付記1に記載の情報処理装置。この構成によれば、表記が不統一なデータセットについても横断的複合インサイトを検出することが可能になる。 (Appendix 2)
The information processing apparatus according to
複数の前記インサイトサブジェクトにおけるデータの粒度を統一する粒度統一手段をさらに備え、前記評価手段は、粒度が統一された複数の前記インサイトサブジェクトについて前記評価値を算出する、付記1または2に記載の情報処理装置。この構成によれば、粒度が不統一なデータを含むデータセットについても横断的複合インサイトを検出することが可能になる。 (Appendix 3)
It is described in
前記評価手段は、動的時間伸縮法または関数データ解析により前記評価値を算出する、付記1または2に記載の情報処理装置。この構成によれば、粒度が不統一なデータを含むデータセットについても横断的複合インサイトを検出することが可能になる。 (Appendix 4)
The information processing apparatus according to
前記評価手段は、グループ化された複数の前記インサイトサブジェクトを主成分分析することにより求めた、各主成分の寄与度の偏りの程度に基づいて前記評価値を算出する、付記1から4の何れかに記載の情報処理装置。この構成によれば、3つ以上のインサイトサブジェクトをまとめて評価することが可能になる。 (Appendix 5)
The evaluation means calculates the evaluation value based on the degree of bias in the contribution of each main component, which is obtained by performing principal component analysis on a plurality of grouped insight subjects. The information processing device described in any of them. With this configuration, it is possible to evaluate three or more insight subjects at once.
前記主成分分析により求められた主成分を用いて、グループ化された複数の前記インサイトサブジェクトに含まれるデータを表すことにより、当該データに含まれる外れ値を検出する外れ値検出手段をさらに備える、付記5に記載の情報処理装置。この構成によれば、評価のために行った主成分分析の結果を利用した効率のよい外れ値検出ができる。 (Appendix 6)
Further provided with outlier detection means for detecting outliers included in the data by representing the data contained in the plurality of grouped insight subjects using the principal components obtained by the principal component analysis. , The information processing apparatus according to Appendix 5. According to this configuration, efficient outlier detection can be performed by using the result of the principal component analysis performed for the evaluation.
少なくとも1つのプロセッサが、複数のデータセットのそれぞれから当該データセットに含まれる複数のデータ項目を関連付けることにより生成されたデータであるインサイトサブジェクトを、検出対象のインサイトごとにグループ化すること、およびグループ化された複数の前記インサイトサブジェクトの組み合わせについて、インサイトの有無を判定するための評価値を算出すること、を含む分析方法。この構成によれば、複数のデータセット間におけるインサイトの検出を可能にすることができる。 (Appendix 7)
Grouping insight subjects, which are data generated by associating multiple data items contained in a dataset from each of the datasets, by at least one processor, by insights to be detected. And an analysis method comprising calculating an evaluation value for determining the presence or absence of insights for a combination of the plurality of grouped insight subjects. This configuration allows the detection of insights across multiple datasets.
コンピュータに、複数のデータセットのそれぞれから当該データセットに含まれる複数のデータ項目を関連付けることにより生成されたデータであるインサイトサブジェクトを、検出対象のインサイトごとにグループ化する処理と、グループ化された複数の前記インサイトサブジェクトの組み合わせについて、インサイトの有無を判定するための評価値を算出する処理と、を実行させる分析プログラム。この構成によれば、複数のデータセット間におけるインサイトの検出を可能にすることができる。 (Appendix 8)
The process of grouping insight subjects, which are data generated by associating multiple data items contained in the data set from each of the multiple data sets with the computer, for each insight to be detected, and grouping. An analysis program that executes a process of calculating an evaluation value for determining the presence or absence of insights for a combination of a plurality of the insight subjects. This configuration allows the detection of insights across multiple datasets.
少なくとも1つのプロセッサを備え、前記プロセッサは、複数のデータセットのそれぞれから当該データセットに含まれる複数のデータ項目を関連付けることにより生成されたデータであるインサイトサブジェクトを、検出対象のインサイトごとにグループ化する処理と、グループ化された複数の前記インサイトサブジェクトの組み合わせについて、インサイトの有無を判定するための評価値を算出する処理とを実行する情報処理装置。 (Appendix 9)
The processor comprises at least one processor, and the processor detects an insight subject, which is data generated by associating a plurality of data items contained in the data set from each of the plurality of data sets, for each insight to be detected. An information processing device that executes a process of grouping and a process of calculating an evaluation value for determining the presence or absence of insight for a combination of a plurality of grouped insight subjects.
11 分類部(分類手段)
12 評価部(評価手段)
2 情報処理装置
203 表記統一部(表記統一手段)
204 分類部(分類手段)
205 粒度統一部(粒度統一手段)
206 評価部(評価手段)
3 情報処理装置
31 評価部(評価手段)
32 外れ値検出部(外れ値検出手段) 1
12 Evaluation Department (evaluation means)
2
204 Classification section (classification means)
205 Particle size unification section (particle size unification means)
206 Evaluation Department (Evaluation Means)
3
32 Outlier detection unit (outlier detection means)
Claims (8)
- 複数のデータセットのそれぞれから当該データセットに含まれる複数のデータ項目を関連付けることにより生成されたデータであるインサイトサブジェクトを、検出対象のインサイトごとにグループ化する分類手段と、
グループ化された複数の前記インサイトサブジェクトの組み合わせについて、インサイトの有無を判定するための評価値を算出する評価手段と、を備える情報処理装置。 A classification means for grouping insight subjects, which are data generated by associating multiple data items contained in the dataset from each of the plurality of datasets, for each insight to be detected.
An information processing apparatus including an evaluation means for calculating an evaluation value for determining the presence or absence of insights for a combination of a plurality of grouped insight subjects. - 複数の前記インサイトサブジェクトにおける表記を統一する表記統一手段を備え、
前記分類手段は、表記が統一された前記インサイトサブジェクトをグループ化する、請求項1に記載の情報処理装置。 Equipped with a notation unification means to unify the notation in the multiple Insight subjects,
The information processing apparatus according to claim 1, wherein the classification means groups the insight subjects having a unified notation. - 複数の前記インサイトサブジェクトにおけるデータの粒度を統一する粒度統一手段を備え、
前記評価手段は、粒度が統一された複数の前記インサイトサブジェクトについて前記評価値を算出する、請求項1または2に記載の情報処理装置。 Equipped with a particle size unification means to unify the particle size of the data in the plurality of insight subjects.
The information processing apparatus according to claim 1 or 2, wherein the evaluation means calculates the evaluation value for a plurality of the insight subjects having a uniform particle size. - 前記評価手段は、動的時間伸縮法または関数データ解析により前記評価値を算出する、請求項1または2に記載の情報処理装置。 The information processing apparatus according to claim 1 or 2, wherein the evaluation means calculates the evaluation value by a dynamic time expansion / contraction method or function data analysis.
- 前記評価手段は、グループ化された複数の前記インサイトサブジェクトを主成分分析することにより求めた、各主成分の寄与度の偏りの程度に基づいて前記評価値を算出する、請求項1から4の何れか1項に記載の情報処理装置。 The evaluation means calculates the evaluation value based on the degree of bias of the contribution of each main component, which is obtained by performing principal component analysis of a plurality of grouped insight subjects, according to claims 1 to 4. The information processing apparatus according to any one of the above items.
- 前記主成分分析により求められた主成分を用いて、グループ化された複数の前記インサイトサブジェクトに含まれるデータを表すことにより、当該データに含まれる外れ値を検出する外れ値検出手段を備える、請求項5に記載の情報処理装置。 An outlier detecting means for detecting an outlier included in the data by representing the data contained in the plurality of grouped insight subjects by using the principal component obtained by the principal component analysis is provided. The information processing apparatus according to claim 5.
- 少なくとも1つのプロセッサが、
複数のデータセットのそれぞれから当該データセットに含まれる複数のデータ項目を関連付けることにより生成されたデータであるインサイトサブジェクトを、検出対象のインサイトごとにグループ化すること、および
グループ化された複数の前記インサイトサブジェクトの組み合わせについて、インサイトの有無を判定するための評価値を算出すること、を含む分析方法。 At least one processor
Grouping insight subjects, which are data generated by associating multiple data items contained in the dataset from each of multiple datasets, for each insight to be detected, and grouping multiple. An analysis method including calculating an evaluation value for determining the presence or absence of insight for the combination of the insight subjects. - コンピュータに、
複数のデータセットのそれぞれから当該データセットに含まれる複数のデータ項目を関連付けることにより生成されたデータであるインサイトサブジェクトを、検出対象のインサイトごとにグループ化する処理と、
グループ化された複数の前記インサイトサブジェクトの組み合わせについて、インサイトの有無を判定するための評価値を算出する処理と、を実行させる分析プログラム。 On the computer
The process of grouping insight subjects, which are data generated by associating multiple data items contained in the dataset from each of the multiple datasets, for each insight to be detected.
An analysis program that executes a process of calculating an evaluation value for determining the presence or absence of insights for a combination of a plurality of grouped insight subjects.
Priority Applications (2)
| Application Number | Priority Date | Filing Date | Title |
|---|---|---|---|
| US18/266,745 US20240054187A1 (en) | 2020-12-22 | 2021-10-25 | Information processing apparatus, analysis method, and storage medium |
| JP2022571910A JPWO2022137778A1 (en) | 2020-12-22 | 2021-10-25 |
Applications Claiming Priority (2)
| Application Number | Priority Date | Filing Date | Title |
|---|---|---|---|
| JP2020212788 | 2020-12-22 | ||
| JP2020-212788 | 2020-12-22 |
Publications (1)
| Publication Number | Publication Date |
|---|---|
| WO2022137778A1 true WO2022137778A1 (en) | 2022-06-30 |
Family
ID=82158991
Family Applications (1)
| Application Number | Title | Priority Date | Filing Date |
|---|---|---|---|
| PCT/JP2021/039367 WO2022137778A1 (en) | 2020-12-22 | 2021-10-25 | Information processing device, analysis method, and analysis program |
Country Status (3)
| Country | Link |
|---|---|
| US (1) | US20240054187A1 (en) |
| JP (1) | JPWO2022137778A1 (en) |
| WO (1) | WO2022137778A1 (en) |
Families Citing this family (1)
| Publication number | Priority date | Publication date | Assignee | Title |
|---|---|---|---|---|
| US20230288918A1 (en) * | 2022-03-09 | 2023-09-14 | The Boeing Company | Outlier detection and management |
Citations (4)
| Publication number | Priority date | Publication date | Assignee | Title |
|---|---|---|---|---|
| WO2017163277A1 (en) * | 2016-03-25 | 2017-09-28 | 日本電気株式会社 | Information processing system, information processing method, and information processing program |
| JP2019148897A (en) * | 2018-02-26 | 2019-09-05 | 株式会社日立製作所 | Behavior pattern search system and behavior pattern search method |
| US20200257682A1 (en) * | 2015-06-29 | 2020-08-13 | Microsoft Technology Licensing, Llc | Automatic insights for multi-dimensional data |
| JP2021043899A (en) * | 2019-09-13 | 2021-03-18 | 大日本印刷株式会社 | Sense-of-value cluster generation device, computer program, sense-of-value cluster imparting method, database integration method, and advertisement providing method |
-
2021
- 2021-10-25 US US18/266,745 patent/US20240054187A1/en active Pending
- 2021-10-25 WO PCT/JP2021/039367 patent/WO2022137778A1/en active Application Filing
- 2021-10-25 JP JP2022571910A patent/JPWO2022137778A1/ja active Pending
Patent Citations (4)
| Publication number | Priority date | Publication date | Assignee | Title |
|---|---|---|---|---|
| US20200257682A1 (en) * | 2015-06-29 | 2020-08-13 | Microsoft Technology Licensing, Llc | Automatic insights for multi-dimensional data |
| WO2017163277A1 (en) * | 2016-03-25 | 2017-09-28 | 日本電気株式会社 | Information processing system, information processing method, and information processing program |
| JP2019148897A (en) * | 2018-02-26 | 2019-09-05 | 株式会社日立製作所 | Behavior pattern search system and behavior pattern search method |
| JP2021043899A (en) * | 2019-09-13 | 2021-03-18 | 大日本印刷株式会社 | Sense-of-value cluster generation device, computer program, sense-of-value cluster imparting method, database integration method, and advertisement providing method |
Non-Patent Citations (2)
| Title |
|---|
| ANONYMOUS: "Starting sales of a new service of dotData that visualizes the results predicted and analyzed with AI and presents the next move", NEC, 7 October 2020 (2020-10-07), XP055946805, Retrieved from the Internet <URL:https://jpn.nec.com/press/202010/20201007_01.html> * |
| TSUKAGOSHI, YUTO: "Finding relationships between heterogeneous data based on domain ontology focusing on relationships between dimensions", IPSJ SIG TECHNICAL REPORT, INTELLIGENT SYSTEM (ICS), vol. 2020-ICS-200, no. 10, 7 September 2020 (2020-09-07), JP , pages 1 - 8, XP009538936, ISSN: 2188-885X * |
Also Published As
| Publication number | Publication date |
|---|---|
| US20240054187A1 (en) | 2024-02-15 |
| JPWO2022137778A1 (en) | 2022-06-30 |
Similar Documents
| Publication | Publication Date | Title |
|---|---|---|
| US9753801B2 (en) | Detection method and information processing device | |
| JP6555061B2 (en) | Clustering program, clustering method, and information processing apparatus | |
| EP3201804B1 (en) | Cloud process for rapid data investigation and data integrity analysis | |
| Hao et al. | Visual exploration of frequent patterns in multivariate time series | |
| JP6586184B2 (en) | Data analysis support device and data analysis support method | |
| US20170140309A1 (en) | Database analysis device and database analysis method | |
| JP6835098B2 (en) | Factor analysis method, factor analyzer and factor analysis program | |
| US10579589B2 (en) | Data filtering | |
| Shen et al. | A new multivariate EWMA scheme for monitoring covariance matrices | |
| Cheng et al. | A framework to visualize temporal behavioral relationships in streaming multivariate data | |
| US20080288527A1 (en) | User interface for graphically representing groups of data | |
| JP6696568B2 (en) | Item recommendation method, item recommendation program and item recommendation device | |
| WO2022137778A1 (en) | Information processing device, analysis method, and analysis program | |
| Goossens et al. | Effective steering of customer journey via order-aware recommendation | |
| Ramos et al. | Multivariate statistical process control methods for batch production: A review focused on applications | |
| JP2017045080A (en) | Business flow specification regeneration method | |
| WO2018185899A1 (en) | Library retrieval device, library retrieval system and library retrieval method | |
| Wuyts et al. | Dylopro: Profiling the dynamics of event logs | |
| Rahangdale et al. | Application of k-nn and naive bayes algorithm in banking and insurance domain | |
| Patri et al. | Predicting compressor valve failures from multi-sensor data | |
| WO2017164095A1 (en) | Factor analysis device, factor analysis method, and storage medium on which program is stored | |
| WO2023037399A1 (en) | Information processing device, information processing method, and program | |
| Carbery et al. | Missingness analysis of manufacturing systems: a case study | |
| JP2016532949A (en) | System and method for deriving critical change attributes from data signals that have been selected and analyzed over a period of time to predict future changes in conventional predictors | |
| JPWO2023037398A5 (en) |
Legal Events
| Date | Code | Title | Description |
|---|---|---|---|
| 121 | Ep: the epo has been informed by wipo that ep was designated in this application |
Ref document number: 21909935 Country of ref document: EP Kind code of ref document: A1 |
|
| WWE | Wipo information: entry into national phase |
Ref document number: 18266745 Country of ref document: US |
|
| ENP | Entry into the national phase |
Ref document number: 2022571910 Country of ref document: JP Kind code of ref document: A |
|
| NENP | Non-entry into the national phase |
Ref country code: DE |
|
| 122 | Ep: pct application non-entry in european phase |
Ref document number: 21909935 Country of ref document: EP Kind code of ref document: A1 |