WO2022080102A1 - Server system, information processing system, data acquisition client terminal, data analysis client terminal, and information processing method - Google Patents
Server system, information processing system, data acquisition client terminal, data analysis client terminal, and information processing method Download PDFInfo
- Publication number
- WO2022080102A1 WO2022080102A1 PCT/JP2021/034791 JP2021034791W WO2022080102A1 WO 2022080102 A1 WO2022080102 A1 WO 2022080102A1 JP 2021034791 W JP2021034791 W JP 2021034791W WO 2022080102 A1 WO2022080102 A1 WO 2022080102A1
- Authority
- WO
- WIPO (PCT)
- Prior art keywords
- data
- analysis
- intensity data
- output
- server system
- Prior art date
Links
- 230000010365 information processing Effects 0.000 title claims abstract description 111
- 238000007405 data analysis Methods 0.000 title claims description 199
- 238000003672 processing method Methods 0.000 title claims description 16
- 238000004458 analytical method Methods 0.000 claims abstract description 548
- 238000012545 processing Methods 0.000 claims abstract description 305
- 239000007850 fluorescent dye Substances 0.000 claims abstract description 219
- 230000002452 interceptive effect Effects 0.000 claims abstract description 100
- 239000012472 biological sample Substances 0.000 claims abstract description 78
- 238000013500 data storage Methods 0.000 claims abstract description 63
- 238000000034 method Methods 0.000 claims description 237
- 230000008569 process Effects 0.000 claims description 209
- 238000010586 diagram Methods 0.000 claims description 63
- 230000004044 response Effects 0.000 claims description 58
- 238000003860 storage Methods 0.000 claims description 58
- 230000003287 optical effect Effects 0.000 claims description 55
- 230000005540 biological transmission Effects 0.000 claims description 23
- 238000004364 calculation method Methods 0.000 claims description 20
- 230000001678 irradiating effect Effects 0.000 claims description 20
- 238000004891 communication Methods 0.000 claims description 16
- 238000001228 spectrum Methods 0.000 claims description 8
- 239000003550 marker Substances 0.000 description 51
- 238000005259 measurement Methods 0.000 description 48
- 239000000523 sample Substances 0.000 description 37
- 239000002245 particle Substances 0.000 description 35
- 230000003595 spectral effect Effects 0.000 description 30
- 210000004027 cell Anatomy 0.000 description 21
- 238000001514 detection method Methods 0.000 description 21
- 230000008859 change Effects 0.000 description 20
- 235000015108 pies Nutrition 0.000 description 15
- 230000006870 function Effects 0.000 description 12
- 238000002474 experimental method Methods 0.000 description 10
- 239000010419 fine particle Substances 0.000 description 10
- 206010036618 Premenstrual syndrome Diseases 0.000 description 9
- 238000012937 correction Methods 0.000 description 9
- 238000013508 migration Methods 0.000 description 7
- 230000005012 migration Effects 0.000 description 7
- 238000000684 flow cytometry Methods 0.000 description 6
- 239000003153 chemical reaction reagent Substances 0.000 description 5
- 238000002360 preparation method Methods 0.000 description 5
- 230000001960 triggered effect Effects 0.000 description 5
- 239000003086 colorant Substances 0.000 description 4
- 238000007906 compression Methods 0.000 description 4
- 239000000284 extract Substances 0.000 description 4
- 238000001506 fluorescence spectroscopy Methods 0.000 description 4
- 238000001215 fluorescent labelling Methods 0.000 description 4
- 238000002372 labelling Methods 0.000 description 4
- 239000011159 matrix material Substances 0.000 description 4
- 238000000926 separation method Methods 0.000 description 4
- 210000001744 T-lymphocyte Anatomy 0.000 description 3
- 210000004369 blood Anatomy 0.000 description 3
- 239000008280 blood Substances 0.000 description 3
- 238000006243 chemical reaction Methods 0.000 description 3
- 230000000052 comparative effect Effects 0.000 description 3
- 230000006835 compression Effects 0.000 description 3
- 238000013461 design Methods 0.000 description 3
- 238000005516 engineering process Methods 0.000 description 3
- 239000007788 liquid Substances 0.000 description 3
- 210000004698 lymphocyte Anatomy 0.000 description 3
- 238000007619 statistical method Methods 0.000 description 3
- 102000004127 Cytokines Human genes 0.000 description 2
- 108090000695 Cytokines Proteins 0.000 description 2
- 239000000427 antigen Substances 0.000 description 2
- 102000036639 antigens Human genes 0.000 description 2
- 108091007433 antigens Proteins 0.000 description 2
- 210000003719 b-lymphocyte Anatomy 0.000 description 2
- 230000015572 biosynthetic process Effects 0.000 description 2
- 210000000601 blood cell Anatomy 0.000 description 2
- 238000004422 calculation algorithm Methods 0.000 description 2
- 230000001413 cellular effect Effects 0.000 description 2
- 238000004590 computer program Methods 0.000 description 2
- BFMYDTVEBKDAKJ-UHFFFAOYSA-L disodium;(2',7'-dibromo-3',6'-dioxido-3-oxospiro[2-benzofuran-1,9'-xanthene]-4'-yl)mercury;hydrate Chemical compound O.[Na+].[Na+].O1C(=O)C2=CC=CC=C2C21C1=CC(Br)=C([O-])C([Hg])=C1OC1=C2C=C(Br)C([O-])=C1 BFMYDTVEBKDAKJ-UHFFFAOYSA-L 0.000 description 2
- 210000003743 erythrocyte Anatomy 0.000 description 2
- 230000005284 excitation Effects 0.000 description 2
- 238000001917 fluorescence detection Methods 0.000 description 2
- 238000000799 fluorescence microscopy Methods 0.000 description 2
- 210000000265 leukocyte Anatomy 0.000 description 2
- 230000007246 mechanism Effects 0.000 description 2
- 239000011859 microparticle Substances 0.000 description 2
- 239000000203 mixture Substances 0.000 description 2
- 238000011084 recovery Methods 0.000 description 2
- 238000011160 research Methods 0.000 description 2
- 210000001239 CD8-positive, alpha-beta cytotoxic T lymphocyte Anatomy 0.000 description 1
- 241001137251 Corvidae Species 0.000 description 1
- 206010018910 Haemolysis Diseases 0.000 description 1
- 238000000098 azimuthal photoelectron diffraction Methods 0.000 description 1
- 239000011324 bead Substances 0.000 description 1
- 210000001124 body fluid Anatomy 0.000 description 1
- 239000010839 body fluid Substances 0.000 description 1
- 210000004748 cultured cell Anatomy 0.000 description 1
- 238000012258 culturing Methods 0.000 description 1
- 230000006837 decompression Effects 0.000 description 1
- 230000003111 delayed effect Effects 0.000 description 1
- 238000000432 density-gradient centrifugation Methods 0.000 description 1
- 238000013400 design of experiment Methods 0.000 description 1
- 201000010099 disease Diseases 0.000 description 1
- 208000037265 diseases, disorders, signs and symptoms Diseases 0.000 description 1
- 239000003814 drug Substances 0.000 description 1
- 239000000975 dye Substances 0.000 description 1
- 235000013601 eggs Nutrition 0.000 description 1
- 210000001808 exosome Anatomy 0.000 description 1
- 238000002189 fluorescence spectrum Methods 0.000 description 1
- 210000004602 germ cell Anatomy 0.000 description 1
- 239000011521 glass Substances 0.000 description 1
- 230000005484 gravity Effects 0.000 description 1
- 210000002443 helper t lymphocyte Anatomy 0.000 description 1
- 230000008588 hemolysis Effects 0.000 description 1
- 238000003384 imaging method Methods 0.000 description 1
- 210000002865 immune cell Anatomy 0.000 description 1
- 238000002347 injection Methods 0.000 description 1
- 239000007924 injection Substances 0.000 description 1
- 239000002502 liposome Substances 0.000 description 1
- 239000000463 material Substances 0.000 description 1
- 210000001806 memory b lymphocyte Anatomy 0.000 description 1
- 210000003071 memory t lymphocyte Anatomy 0.000 description 1
- 244000005700 microbiome Species 0.000 description 1
- 238000010295 mobile communication Methods 0.000 description 1
- 210000001616 monocyte Anatomy 0.000 description 1
- 230000000877 morphologic effect Effects 0.000 description 1
- 210000000822 natural killer cell Anatomy 0.000 description 1
- 239000013307 optical fiber Substances 0.000 description 1
- 210000000056 organ Anatomy 0.000 description 1
- 210000003819 peripheral blood mononuclear cell Anatomy 0.000 description 1
- 238000000746 purification Methods 0.000 description 1
- 238000010186 staining Methods 0.000 description 1
- 239000000126 substance Substances 0.000 description 1
- 238000012546 transfer Methods 0.000 description 1
- 239000002699 waste material Substances 0.000 description 1
Images


Classifications
-
- G—PHYSICS
- G01—MEASURING; TESTING
- G01N—INVESTIGATING OR ANALYSING MATERIALS BY DETERMINING THEIR CHEMICAL OR PHYSICAL PROPERTIES
- G01N15/00—Investigating characteristics of particles; Investigating permeability, pore-volume, or surface-area of porous materials
- G01N15/10—Investigating individual particles
- G01N15/14—Electro-optical investigation, e.g. flow cytometers
- G01N15/1429—Electro-optical investigation, e.g. flow cytometers using an analyser being characterised by its signal processing
-
- G—PHYSICS
- G01—MEASURING; TESTING
- G01N—INVESTIGATING OR ANALYSING MATERIALS BY DETERMINING THEIR CHEMICAL OR PHYSICAL PROPERTIES
- G01N15/00—Investigating characteristics of particles; Investigating permeability, pore-volume, or surface-area of porous materials
- G01N15/10—Investigating individual particles
- G01N15/14—Electro-optical investigation, e.g. flow cytometers
- G01N15/1456—Electro-optical investigation, e.g. flow cytometers without spatial resolution of the texture or inner structure of the particle, e.g. processing of pulse signals
- G01N15/1459—Electro-optical investigation, e.g. flow cytometers without spatial resolution of the texture or inner structure of the particle, e.g. processing of pulse signals the analysis being performed on a sample stream
-
- G—PHYSICS
- G16—INFORMATION AND COMMUNICATION TECHNOLOGY [ICT] SPECIALLY ADAPTED FOR SPECIFIC APPLICATION FIELDS
- G16H—HEALTHCARE INFORMATICS, i.e. INFORMATION AND COMMUNICATION TECHNOLOGY [ICT] SPECIALLY ADAPTED FOR THE HANDLING OR PROCESSING OF MEDICAL OR HEALTHCARE DATA
- G16H10/00—ICT specially adapted for the handling or processing of patient-related medical or healthcare data
- G16H10/40—ICT specially adapted for the handling or processing of patient-related medical or healthcare data for data related to laboratory analysis, e.g. patient specimen analysis
-
- G—PHYSICS
- G16—INFORMATION AND COMMUNICATION TECHNOLOGY [ICT] SPECIALLY ADAPTED FOR SPECIFIC APPLICATION FIELDS
- G16H—HEALTHCARE INFORMATICS, i.e. INFORMATION AND COMMUNICATION TECHNOLOGY [ICT] SPECIALLY ADAPTED FOR THE HANDLING OR PROCESSING OF MEDICAL OR HEALTHCARE DATA
- G16H40/00—ICT specially adapted for the management or administration of healthcare resources or facilities; ICT specially adapted for the management or operation of medical equipment or devices
- G16H40/60—ICT specially adapted for the management or administration of healthcare resources or facilities; ICT specially adapted for the management or operation of medical equipment or devices for the operation of medical equipment or devices
- G16H40/67—ICT specially adapted for the management or administration of healthcare resources or facilities; ICT specially adapted for the management or operation of medical equipment or devices for the operation of medical equipment or devices for remote operation
-
- G01N15/01—
-
- G01N15/1433—
-
- G—PHYSICS
- G01—MEASURING; TESTING
- G01N—INVESTIGATING OR ANALYSING MATERIALS BY DETERMINING THEIR CHEMICAL OR PHYSICAL PROPERTIES
- G01N15/00—Investigating characteristics of particles; Investigating permeability, pore-volume, or surface-area of porous materials
- G01N15/10—Investigating individual particles
- G01N15/14—Electro-optical investigation, e.g. flow cytometers
- G01N15/1468—Electro-optical investigation, e.g. flow cytometers with spatial resolution of the texture or inner structure of the particle
- G01N15/147—Electro-optical investigation, e.g. flow cytometers with spatial resolution of the texture or inner structure of the particle the analysis being performed on a sample stream
-
- G—PHYSICS
- G01—MEASURING; TESTING
- G01N—INVESTIGATING OR ANALYSING MATERIALS BY DETERMINING THEIR CHEMICAL OR PHYSICAL PROPERTIES
- G01N15/00—Investigating characteristics of particles; Investigating permeability, pore-volume, or surface-area of porous materials
- G01N15/10—Investigating individual particles
- G01N2015/1006—Investigating individual particles for cytology
-
- G—PHYSICS
- G16—INFORMATION AND COMMUNICATION TECHNOLOGY [ICT] SPECIALLY ADAPTED FOR SPECIFIC APPLICATION FIELDS
- G16B—BIOINFORMATICS, i.e. INFORMATION AND COMMUNICATION TECHNOLOGY [ICT] SPECIALLY ADAPTED FOR GENETIC OR PROTEIN-RELATED DATA PROCESSING IN COMPUTATIONAL MOLECULAR BIOLOGY
- G16B45/00—ICT specially adapted for bioinformatics-related data visualisation, e.g. displaying of maps or networks
Definitions
- the present disclosure relates to a server system, an information processing system, a data acquisition client terminal, a data analysis client terminal, and an information processing method, and more particularly, processes light intensity data acquired by irradiating a biological sample with light.
- the present invention relates to a server system, an information processing system including the server system, a data acquisition client terminal and a data analysis client terminal included in the information processing system, and an information processing method related to the processing.
- a particle population such as cells, microorganisms, and liposomes is labeled with a fluorescent dye, and each particle of the particle population is irradiated with laser light to measure the intensity and / or pattern of fluorescence generated from the excited fluorescent dye. By doing so, the characteristics of the particles are measured.
- a flow cytometer can be mentioned as a typical example of a particle analyzer that performs the measurement.
- Patent Document 1 describes a computer program product for processing scientific data according to a model independent of any specific data set. It has been disclosed.
- the computer program product comprises a data discovery node data structure existing on a non-temporary computer readable storage medium and a plurality of processor executable instructions existing on the non-temporary computer readable storage medium.
- the data structure contains specific specifications.
- Patent Document 2 discloses a sample analysis system using flow cytometry.
- the sample analysis system has a measurement data acquisition unit that acquires measurement data of the particles by measuring the particles contained in the measurement sample prepared by adding a reagent to the sample, and an output indicating the output mode of the measurement data. It includes an output mode information acquisition unit that acquires mode information, and an output unit that outputs the measurement data in an output mode corresponding to the output mode information.
- An example of an analysis system for data obtained by flow cytometry is a client-server analysis system.
- the client-server analysis system may increase the operating cost.
- the server is always running even when there is no user who uses the server, or the analysis process by the server can be executed at all times.
- the client-server analysis system also has a problem related to processing speed. For example, as the number of users who execute analysis at the same time increases, the computing resources may be exhausted and the processing may be delayed. In addition, it may be difficult to realize high-speed processing that requires a large amount of computing resources at one time, such as dimensional compression processing or clustering processing.
- the main purpose of this disclosure is to provide a technique for solving at least one of these problems.
- the object of the present disclosure is not limited to this, and may be, for example, to solve any one or more of the problems described below in the present specification.
- An automatic analysis processing unit that generates output data by analysis processing for light intensity data or fluorescent label intensity data acquired by irradiating a biological sample with light
- An automatic analysis processing unit An analysis result data storage unit that stores the output data generated based on the light intensity data or the fluorescent label intensity data
- An automatic analysis processing unit may calculate fluorescent label intensity data from the light intensity data.
- the processing by the automatic analysis processing unit and the processing by the interactive analysis processing unit may be executed on different computing resources.
- the server system may reserve computing resources for processing by the automatic analysis processing unit and / or processing by the interactive analysis processing unit in response to receiving an analysis start command.
- the server system may further include a database in which analysis setting data used in the processing by the automatic analysis processing unit and / or the processing by the interactive analysis processing unit is stored.
- the server system may further include an optical data storage unit that stores the light intensity data and / or the fluorescent label intensity data.
- the optical data storage unit may include two or more types of storage having different access speeds.
- the server system migrates the light intensity data and / or the fluorescent label intensity data stored in the storage having a higher access speed to the storage having a lower access speed when a predetermined condition is satisfied.
- the process can be executed.
- the output data may include at least one of a two-dimensional plot image, a spectral plot image, a one-dimensional histogram image, a two-dimensional contour plot image, a dimensional compressed image, and a clustering result display diagram.
- the present disclosure is a data acquisition client terminal that acquires light intensity data acquired by irradiating a biological sample with light or acquires fluorescence label intensity data by calculation processing for the light intensity data; and from the data acquisition client terminal.
- An optical data storage unit that stores the transmitted light intensity data or the fluorescent label intensity data, and An automatic analysis processing unit that calculates fluorescent label intensity data from the light intensity data
- An analysis result data storage unit that stores the output data generated based on the light intensity data or the fluorescent label intensity data
- an information processing system including a server system including an interactive analysis processing unit that analyzes the fluorescent label intensity data and outputs analysis result data based on an analysis command for the output data output to the output device.
- the data acquisition client terminal may transmit the light intensity data or the fluorescent label intensity data to the server system in response to the acquisition of the light intensity data or the fluorescent label intensity data.
- the data acquisition client terminal performs a predetermined process on the light intensity data or the fluorescent label intensity data in response to the acquisition of the light intensity data or the fluorescent label intensity data, and the processed.
- the light intensity data or the fluorescent label intensity data can be transmitted to the server system.
- the server system may hold analysis setting data used in the processing by the automatic analysis processing unit in advance.
- the automatic analysis processing unit may calculate the fluorescent label intensity data from the light intensity data using the analysis setting data.
- the automatic analysis processing unit can execute a process of calculating fluorescent label intensity data from the light intensity data in response to the light intensity data being stored in the optical data storage unit.
- the information processing system may further include a data analysis client terminal including the output device.
- the data analysis client terminal may transmit the analysis command for the output data output to the output device to the server system.
- the data analysis client terminal can output the window in which the output data is displayed to the output device, and can accept the input of the analysis command in the window.
- a plurality of data analysis client terminals may share any one or more of the light intensity data, the fluorescence intensity data, and the analysis setting data in the server system.
- a plurality of data acquisition client terminals may be able to share the analysis setting data in the server system.
- the present disclosure includes a data acquisition unit that acquires light intensity data acquired by irradiating a biological sample with light, and a data acquisition unit. Including a transmission unit that transmits the light intensity data to the server system in response to the acquisition of the light intensity data.
- the fluorescent label intensity data is calculated from the light intensity data.
- the present disclosure includes a communication unit that receives output data created by the server system based on the fluorescence label intensity data from the server system.
- a processing unit that performs processing to output the output data to the output device, Provides a data analysis client terminal including.
- the data analysis client terminal may output a window in which the output data is displayed to the output device, and may accept input of an analysis command for the output data in the window.
- the present disclosure is an automatic analysis processing step for generating output data by performing analysis processing on light intensity data acquired by irradiating a biological sample with light or fluorescent labeling intensity data calculated from the light intensity data.
- An analysis result data storage step for storing the output data generated based on the light intensity data or the fluorescent label intensity data
- an information processing method including an interactive analysis processing step of analyzing the fluorescent label intensity data based on an analysis command for the output data output to the output device and outputting the analysis result data.
- FIG. 1 It is a schematic diagram of the structure of a flow cytometer. It is a figure which shows the experimental flow example when this technique is applied in the flow cytometry. It is a figure which shows the example of a gate setting. It is a figure for demonstrating a surface marker. It is a figure which shows the configuration example of an information processing system. It is a figure which shows the example of the functional configuration of a server system. It is a figure which shows the composition example of metadata. It is a figure which shows the composition example of metadata. It is a figure which shows the hardware configuration example of the server apparatus which constitutes a server system. It is a figure which shows the example of the functional structure of a data analysis client terminal. It is a figure which shows the hardware configuration example of a data analysis client terminal.
- FIG. 1 It is a figure which shows the example of the functional configuration of a data acquisition client terminal. It is a figure which shows the structural example of the biological sample analyzer. It is a figure which shows the example of the flow of the automatic analysis processing by an information processing system. It is a figure which shows the example of the flow of the automatic analysis processing by an information processing system. It is a figure which shows the example of the flow of the output data acquisition processing by an information processing system. It is a figure which shows the example of the flow of the interactive analysis processing by an information processing system. It is a schematic diagram for demonstrating an interactive analysis processing flow. It is a schematic diagram for demonstrating an interactive analysis processing flow. It is a figure which shows the example of the window which a data analysis client terminal outputs to an output device.
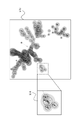
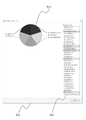
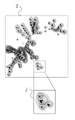
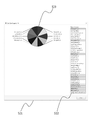
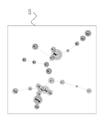
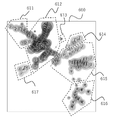
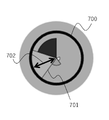
- Clustering result display diagram It is a figure which shows the example of the image. It is a figure which shows the example of the meta cluster chart. It is a figure which shows the example of the meta cluster chart. It is a figure which shows the example of the clustering result display figure and the example of the corresponding 2D plot. It is a figure for demonstrating the meta cluster in a clustering result display figure. It is a figure which shows the example of the operation by the user with respect to the clustering result display figure, and the example of the two-dimensional plot colored by the operation. It is a figure for demonstrating the pie display in a node. It is a figure which shows the example of the plot setting window for setting the display of a two-dimensional plot data and the plot data.
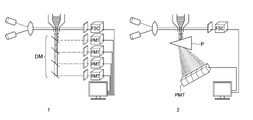
- the flow cytometer can be roughly classified into a filter type and a spectral type, for example, from the viewpoint of an optical system for fluorescence measurement. Since the filter type flow cytometer extracts only the target optical information from the target fluorescent dye, the configuration as shown in 1 of FIG. 1 can be adopted. Specifically, the light generated by irradiating the particles with light is branched into a plurality of particles by a wavelength separation means DM such as a dichroic mirror, passed through different filters, and each of the branched lights is divided into a plurality of detectors. For example, it is measured by a photomultiplier tube PMT or the like.
- DM such as a dichroic mirror
- multicolor fluorescence detection is performed by performing fluorescence detection for each wavelength band corresponding to each fluorescent dye using a detector corresponding to each fluorescent dye. At that time, when a plurality of fluorescent dyes having close fluorescence wavelengths are used, a fluorescence correction process can be performed in order to calculate a more accurate fluorescence amount.
- the spectral flow cytometer unmixes the fluorescence data obtained by detecting the light generated by irradiating the particles with light based on the spectral information of the fluorescent dye used for staining, thereby decomposing the fluorescence amount of each particle.
- the spectral type flow cytometer uses a prism spectroscopic optical element P to disperse fluorescence.
- an array type detector such as an array type photomultiplier tube PMT is used instead of a large number of photodetectors included in the filter type flow cytometer. I have.
- the spectral type flow cytometer is easier to avoid the influence of fluorescence leakage than the filter type flow cytometer, and is more suitable for analysis using a plurality of fluorescent dyes.
- the flow of experiments using a flow cytometer can be broadly classified into an experiment planning process in which cells to be tested and methods for detecting them are examined and an antibody reagent with a fluorescence index is prepared (Fig. 2 "1: Plan”).
- a sample preparation step (“2: Preparation” in the same figure) that actually stains and prepares cells in a state suitable for measurement, and an FCM measurement step that measures the amount of fluorescence of each stained cell with a flow cytometer.
- Fig. "3: FCM” and a data analysis process Fig. "4: Data Analysis” that performs various data processing so that desired analysis results can be obtained from the data recorded by FCM measurement. Then, these steps can be repeated as needed.
- the flow cytometer is used to first determine which molecule (eg, antigen or cytokine) expression is used to determine which molecule (eg, antigen or cytokine) the microparticles (mainly cells) that one wants to detect are to be detected, that is, the microparticles. Determine which marker to use for detection. The decision can be made on the basis of information such as past experimental results and papers. Next, for the marker, it is examined which fluorescent dye is used for detection.
- molecule eg, antigen or cytokine
- the microparticles mainly cells
- the experimental object is first processed into a state suitable for FCM measurement.
- cell separation and purification can be performed.
- erythrocytes are removed from blood by hemolysis treatment and density gradient centrifugation to extract leukocytes.
- the extracted cell group of the target is stained with a fluorescently labeled antibody.
- the FCM measurement step when optically analyzing fine particles, first, excitation light is emitted from the light source of the light irradiation unit of the flow cytometer, and the fine particles flowing in the flow path are irradiated. Next, the fluorescence emitted from the fine particles is detected by the detection unit of the flow cytometer. Specifically, using a dichroic mirror, bandpass filter, etc., only light of a specific wavelength (target fluorescence) is separated from the light emitted from fine particles, and it is detected by a detector such as PMT. do.
- a detector such as PMT. do.
- a prism or a diffraction grating is used to disperse the fluorescence, and a detector such as a 32-channel PMT is used to detect light having a different wavelength in each channel.
- a detector such as a 32-channel PMT is used to detect light having a different wavelength in each channel.
- the flow cytometer may have a function of recording the fluorescence information of each fine particle acquired by the FCM measurement together with the scattered light information, the time information, and the position information other than the fluorescence information.
- the recording function may be performed primarily by computer memory or disk. In normal cell analysis, thousands to millions of fine particles are analyzed under one experimental condition, so it is necessary to record a large amount of information in an organized state for each experimental condition.
- the light intensity data in each wavelength region detected in the FCM measurement step is quantified using a computer or the like, and the fluorescence amount (intensity) for each fluorescent dye used is obtained.
- a correction method using a standard calculated from experimental data is used for this analysis.
- the standard is calculated by statistical processing using two types of measurement data of fine particles stained with only one fluorescent dye and measurement data of unstained fine particles.
- the calculated fluorescence amount can be recorded in a data recording unit provided in the computer together with information such as a fluorescent molecule name, a measurement date, and a type of fine particles.
- the fluorescence amount (fluorescence spectrum data) of the sample estimated by the data analysis is saved, and is displayed as a graph according to the purpose to analyze the fluorescence amount distribution of the fine particles.
- gate setting is often performed for analysis of fluorescence amount distribution, whereby the ratio of cells to be detected in the sample can be calculated.
- FSC forward scattered light
- SSC lateral scattered light
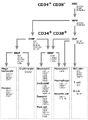
- a predetermined range of the plots is selected to contain blood cells contained in PBMC.
- the proportion of monocytes and lymphocytes among them can be specified.
- the proportion of B cells, T cells, and NK cells among lymphocytes can be calculated by gate setting and expansion for lymphocytes expressing a predetermined surface marker.
- the ratio of memory B cells among B cells can be specified by appropriately selecting the antibody that binds to the surface marker and the fluorescent dye that labels each antibody, and analyzing by a flow cytometer.
- the information processing system according to the present disclosure and the components included in the system can be used for analysis in the data analysis process.
- Information processing in the data analysis process is performed by, for example, an information processing device attached to the flow cytometer or a user's information processing device using the flow cytometer.
- an information processing device attached to the flow cytometer or a user's information processing device using the flow cytometer As described above, in flow cytometry, the number of fluorescent dyes used in one measurement tends to increase, and the amount of information processing in the data analysis step also tends to increase accordingly. Therefore, in order to execute the data analysis process in these information processing devices, it is required that these information processing devices have higher specifications. This tendency becomes particularly remarkable when executing so-called Advanced analysis methods such as dimensional compression processing and clustering processing, which have a large computational load. However, it is often impractical and undesirable for users to equip these information processing devices with such specifications.
- the information processing in the data analysis process can be executed by the client-server type analysis system, particularly the client-server type analysis system using the cloud.
- the client-server analysis system often has a high operating cost.
- the analysis system also has a problem regarding processing speed.
- the present disclosure comprises an automatic analysis processing unit that generates output data by analysis processing for light intensity data or fluorescent label intensity data acquired by irradiating a biological sample with light, and the light intensity data or the fluorescent label.
- the analysis result data storage unit that stores the output data generated based on the intensity data and the fluorescent label intensity data are analyzed based on the analysis command for the output data output to the output device, and the analysis result data is output.
- a server system including an interactive analysis processing unit and an information processing system including the server system are provided. When the server system includes the automatic analysis processing unit and the interactive analysis processing unit, the data analysis process can be executed in the server system.
- the interactive analysis processing unit can execute the analysis process or adjust the analysis settings while the user confirms the output data output to the output device, it is easy to obtain the desired analysis result. Further, the operation cost can be reduced by executing the processing by the automatic analysis processing unit and the interactive analysis processing unit only when the server system is required. Further, the processing speed of the server system can be improved by the configuration described below in the present specification.
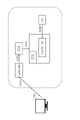
- the information processing system 1 shown in FIG. 5 includes a server system 10, a data analysis client terminal 20, a data acquisition client terminal 30, and a biological sample analysis device 40.
- the server system 10 may be connected to the data analysis client terminal 20 and the data acquisition client terminal 30 via the network 50.
- the network 50 may be a communication network through which data is transmitted and received, and may be, for example, the Internet, a satellite communication network, a telephone line network, or a mobile communication network (for example, a 4G or 5G line network), or any of these. It may be a combination.
- the data analysis client terminal 20 and the data acquisition client terminal 30 may be connected, for example, by wire or wirelessly, or may be connected via a network 50.
- the bioparticle analyzer 40 may be connected to the data acquisition client terminal 30 by, for example, wired or wireless.
- the server system 10 will be described with reference to FIG. FIG. 6 is a block diagram showing an example of the functional configuration of the system.
- the server system 10 may include an automatic analysis processing unit 11, an interactive analysis processing unit 12, an output data generation unit 13, a connection unit 14, an optical data storage unit 15, an analysis result data storage unit 16, and a database 17.
- the automatic analysis processing unit 11 may calculate the fluorescent label intensity data from the light intensity data acquired by irradiating the biological sample with light.
- the light intensity data may be light intensity data transmitted from the data acquisition client terminal 30 to the server system 10.
- the light intensity data may be stored in the optical data storage unit 15, and the automatic analysis processing unit 11 can acquire the light intensity data from the optical data storage unit 15.
- the automatic analysis processing unit 11 does not have to perform the calculation processing. That is, the data acquisition client terminal 30 may execute a process of calculating the fluorescent label intensity data from the light intensity data, and the data acquisition client terminal 30 may transmit the fluorescent label intensity data to the server system 10.
- the automatic analysis processing unit 11 can execute a process of calculating the fluorescent label intensity data from the light intensity data.
- the automatic analysis processing unit 11 can execute the calculation process using the analysis setting data previously possessed by the server system 10.
- the analysis setting data may be, for example, transmitted in advance from the data analysis client terminal 20 or the data acquisition client terminal 30 (particularly before the execution of the calculation process).
- the automatic analysis processing unit 11 performs, for example, fluorescence correction processing or unmixing processing on the light intensity data to calculate fluorescence labeling intensity data.
- the unmixing process is also called a fluorescence separation process.
- the automatic analysis processing unit 11 preferably executes the unmixing process using the spectral reference data.
- the spectral reference data used in the unmixing process includes spectral data of fluorescence generated when a fluorescent dye labeling the particles is irradiated with a predetermined excitation light.
- the spectral reference data used in the unmixing process includes spectrum data of fluorescence generated when light having a predetermined wavelength is irradiated on a fluorescent dye labeling particles, and light having a wavelength different from the predetermined wavelength. Fluorescent spectral data generated when the fluorescent dye labeling the particles is irradiated may be included.
- the spectral reference data may be stored in any storage unit or database in the server system 10 in advance, and may be stored in, for example, the database 17. In particular, it may be stored as one of the metadata described later.
- the automatic analysis processing unit 11 can acquire spectral reference data from, for example, a database 17, and execute the unmixing process using the acquired spectral reference data.
- the automatic analysis processing unit 11 may perform the unmixing process using, for example, a least squares method (Least Square Method, LSM), more preferably a weighted least squares method (WLSM).
- LSM least square Method
- WLSM weighted least squares method
- the unmixing process using the least squares method may be performed, for example, by using the fluorescence intensity correction method described in Japanese Patent No. 5985140.
- the fluorescence intensity correction method can be performed using, for example, the following WLSM mathematical formula (1).
- x n indicates the fluorescence intensity of the nth fluorescent dye
- [ ST ] indicates the transposed matrix of the spectral reference
- [L] indicates the weight matrix
- [S] indicates the spectral reference.
- y i shows the measured value at the i-th photodetector
- ⁇ i shows the weight at the i-th photodetector
- max (y i , 0) shows the detection of the i-th detector.
- the value is compared with zero to indicate a large value, and offset'indicates a value determined based on the detection value of each detector.
- the fluorescence wavelength distribution of the fluorescent dye may be wide. Therefore, for example, the PMT used for detecting the fluorescence generated from a certain fluorescent dye can also detect the fluorescence generated from another fluorescent dye. That is, the optical data acquired by each PMT may be data in which fluorescence data from a plurality of fluorescent dyes are superimposed. Therefore, it is necessary to make corrections to separate the optical data into fluorescence data from each fluorescent dye.
- the unmixing process is a method for the correction, and the data on which the fluorescent label intensity data from a plurality of fluorescent dyes are superimposed is separated into the fluorescent label intensity data from each fluorescent dye by the unmixing process. Therefore, fluorescent label intensity data from each fluorescent dye can be obtained.
- the automatic analysis processing unit 11 performs analysis processing on the fluorescent label intensity data.
- the automatic analysis processing unit 11 generates analysis result data by the analysis processing.
- Output data can be generated from the analysis result data.
- the output data is transmitted to the data analysis client terminal 20, and the data analysis client terminal 20 causes the output device to output the output data.
- the output device may be, for example, a display device.
- the output device may be configured so that the user can input the analysis command described later.
- the automatic analysis processing unit 11 preferably executes a process of calculating fluorescent label intensity data from the light intensity data in response to the light intensity data being stored in the optical data storage unit 15. Then, the automatic analysis processing unit 11 can analyze the fluorescent label intensity data and generate analysis result data. Further, the automatic analysis processing unit 11 can generate output data from the analysis result data. For example, the automatic analysis processing unit 11 may start the automatic analysis processing in response to the light intensity data being stored in the optical data storage unit 15. That is, the automatic analysis processing unit 11 may execute the event-driven analysis processing triggered by the storage.
- the automatic analysis processing unit 11 secures a computation resource for the automatic analysis processing in response to the light intensity data being stored in the optical data storage unit 15. That is, the automatic analysis processing unit 11 can treat the storage as the reception of the analysis start command, and secure the computation in the server system 10 in response to the reception.
- the automatic analysis processing unit 11 uses the secured computation resource to execute a calculation process of fluorescent label intensity data, an analysis process of fluorescent label intensity data, and a process of generating output data from the analysis result data. Can be done.
- the interactive analysis processing unit 12 can analyze the fluorescent label intensity data based on the analysis command for the output data output to the output device and generate the analysis result data.
- the output data may be output data generated by the automatic analysis processing unit 11, or may be output data acquired or generated by the output data generation unit 13 described later.
- the interactive analysis processing unit 12 may execute a process of calculating the fluorescent label intensity data from the light intensity data. Then, the calculated fluorescent label intensity data may be analyzed based on the analysis command to generate analysis result data. Then, the interactive analysis processing unit 12 can generate output data from the generated analysis result data.
- the interactive analysis processing unit 12 may secure a computation resource for processing by the interactive analysis processing unit 12 in response to receiving the analysis start command. After the securing, the interactive analysis processing unit 12 waits until the analysis command is transmitted from the data analysis client terminal 20.
- the automatic analysis processing unit 11 secures computing resources for processing by the automatic analysis processing unit in response to receiving the analysis start command, and the interactive analysis processing unit 12 also has a dialogue. Compute resources for processing by the type analysis processing unit 12 can be secured according to the reception of the analysis start command. Therefore, in the present disclosure, the processing by the automatic analysis processing unit and the processing by the interactive analysis processing unit may be executed on different computing resources.
- the interactive analysis processing unit 12 receives the analysis command transmitted from the data analysis client terminal 20, and responds to the calculation process of the fluorescent label intensity data, the analysis process of the fluorescent label intensity data, and the analysis result data. Output data generation processing can be executed. These processes may be event-driven analysis processes triggered by the reception of the analysis command. That is, the interactive analysis process according to the present technique may be an event-driven analysis process.
- the interactive analysis processing unit 12 performs the calculation processing of the fluorescence labeling intensity data, the analysis processing of the fluorescence labeling intensity data, and the generation processing of output data from the analysis result data, which are the same as those processing by the automatic analysis processing unit 11. You may do this.
- connection unit 14 is a functional element for executing RPC (Remote Procedure Call) in the interactive processing between the server system 10 (particularly the interactive analysis processing unit 12) and the data analysis client terminal 20.
- RPC Remote Procedure Call
- the connection unit 14 causes the server system 10 to execute the analysis command input in the data analysis client terminal 20.
- the output data generation unit 13 can generate output data from the analysis result data stored in the analysis result data storage unit 16. Then, the output data generation unit 13 transmits the output data to the data analysis client terminal 20.
- the computing resources required for processing by the output data generation unit 13 are small. Therefore, it is possible to reduce the operating cost of the server system.
- the process by the output data generation unit 13 may be executed by a virtual server in the server system 10 that is always running. Since the virtual server is always running, the output data acquisition process can be executed at high speed without waiting time for starting the server. Further, the output data generation unit 13 may be configured as a serverless architecture.
- the optical data storage unit 15 stores light intensity data and / or fluorescent label intensity data.
- the optical data storage unit 15 may include two units, a light intensity data storage unit for storing light intensity data and a fluorescent label intensity data storage unit for storing fluorescent label intensity data.
- the analysis result data storage unit 16 stores the analysis result data generated based on the fluorescent label intensity data by the automatic analysis processing unit 11 and / or the analysis result data generated based on the fluorescent label intensity data by the interactive analysis processing unit 12. do. Further, the analysis result data storage unit 16 stores output data generated from each of these analysis result data.
- the database 17 may store various metadata.
- the metadata may include analysis setting data.
- the database 17 may store analysis setting data used in the processing by the automatic analysis processing unit and / or the processing by the interactive analysis processing unit.
- the analysis setting data may include ancillary data referred to or used in the analysis process of light intensity data.
- the ancillary data may include, for example, data on the biological sample itself and / or data on analytical settings for the biological sample.
- the analysis setting data is, for example, data used for calculating fluorescence label intensity data from light intensity data (including, for example, spectral reference data) and / or data used in analysis processing for fluorescence intensity label data.
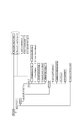
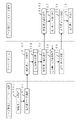
- the project data (project in FIG. 7) included in the metadata may specify, for example, a project unit arbitrarily set by the user.
- the metadata may include one or more of project data, default fluorescent dye data, optionally set fluorescent dye data, spectral reference data, autofluorescent data, and device setting data.
- the default fluorescent dye data (Fluorochrome (preset) in FIG. 7), the fluorescent dye data arbitrarily set (Fluorochrome (custom)), the spectral reference data (Spectral Reference), and the autofluorescent data (autofluorescent data) are included in one project data. Autofluorescence), and one or more data of device setting data (Instrument Settings) may be associated.
- the default fluorescent dye data includes data on one or more fluorescent dyes commonly used in data analysis in which the project data is used (eg, fluorescent dye name data, etc.).
- the arbitrarily set fluorescent dye data includes data related to a fluorescent dye arbitrarily selected by the user for each experiment or sample in the data analysis in which the project data is used (for example, fluorescent dye name data).
- the spectral reference data includes the spectral reference data of each of the fluorescent dyes contained in the predetermined fluorescent dye data and the arbitrarily set fluorescent dye data.
- the autofluorescence data includes data on autofluorescence of a biological sample analyzed using the project data.
- the device setting data includes data related to the setting in the analysis of the biological sample analyzer that has acquired the light intensity data of the biological sample analyzed using the project data.
- the number of these data associated with one project data may be one or more.
- one project data may be associated with one or more default fluorescent dye data.
- Metadata may include experimental data.
- one project data may be associated with one or more experimental data (Experiment in FIG. 7).
- Each experiment data may include, for example, one or more of experiment name data, user name data for which the experiment data was created, and date and time data for which the experiment data was created.
- Metadata may include plate data.
- one experimental data may be associated with one or more plate data (plate in FIG. 7).
- Each plate data includes, for example, data that identifies a plate (particularly a well plate or a microtiter plate) to be analyzed by a biological sample analyzer, for example, a plate name, a user name data that created the plate data, and plate data are created. It may include one or more of the date and time data and the plate type data.
- Metadata may include sample group data.
- one plate data may be associated with one or more sample group data (Sample Group in FIG. 7).
- Each sample group data includes, for example, data for specifying a group of biological samples included in each plate data, for example, sample group name data, user name data for creating sample group data, and date and time when sample group data was created. It may contain one or more of the data.
- Metadata may include protocol data.
- protocol data (Protocol in FIG. 7) may be associated with each of the sample group data.
- the same protocol data may be associated with a plurality of sample group data, or different protocol data may be associated with each other.
- Each protocol data includes, for example, data that identifies the analysis protocol of a biological sample, for example, unmixing config data (Unmixing Config), fluorescent dye setting data (Color Palette), device setting data (Measurement Settings), and a common worksheet. It may include one or more of the setting data (Shared Worksheet).
- the unmixing setting data may include data that specifies a method of unmixing processing (for example, setting of an unmixing matrix or a calculation method).
- the fluorescent dye setting data may include data regarding the allocation of the fluorescent dye to a biomolecule, and may include, for example, the result of a panel design.
- the device setting data may include data relating to the setting of analysis by the biological sample analyzer.
- the worksheet setting data may include data on analysis settings commonly applied to all biological samples contained in one sample group data.
- the worksheet setting data may include gate setting data that is commonly applied to all biological samples contained in one sample group data.
- One sample group data may be associated with one or more sample data (Sample in FIG. 7).
- Each sample data includes, for example, individual worksheet setting data (Individual Worksheet) applied in the analysis of each sample, unmixing setting data (Sample Unmixing Config) applied in the analysis of each sample, and light measured for each sample. It may include one or more of a data path to intensity data (Raw Data) and fluorescent label intensity data (Unmixed Data) calculated from the light intensity data measured for each sample.
- Metadata may include comparative worksheet data.
- one experimental data may be associated with one or more comparative worksheet data (Comparison Worksheet in FIG. 7).
- the comparative worksheet data may be worksheet data used to compare or superimpose the analysis results for each sample data.
- the worksheet setting data includes area setting data (Region in FIG. 8), gate setting data (Gate), axis parameter setting data (AxisParameter), plot setting data (Plot), and axis scale setting data.
- area setting data (Region in FIG. 8)
- gate setting data (Gate)
- axis parameter setting data (AxisParameter)
- plot setting data (Plot)
- axis scale setting data (Axis Tick setting) and one, two, three, four, or five of the statistical setting data (Statistic) may be included, or all six may be included.
- the region setting data is data relating to the region set by the gate in the plot displayed on the worksheet, and includes, for example, data relating to the range of fluorescent label intensity and / or the wavelength defined by the gate.
- the gate setting data includes, for example, data regarding the type of gate setting in the plot displayed on the worksheet and / or data regarding the gate parameter.
- the data regarding the type of the gate setting includes, for example, data regarding the shape of the gate, and the shape may be, for example, a rectangle, a linear shape, a polygon, an ellipse, or four quadrants.
- the data regarding the gate parameters may include, for example, data regarding the position and / or size of the gate.
- the axis parameter setting data may include, for example, data regarding the type of plot field displayed on the worksheet and / or data regarding the type of signal adopted in the plot.
- the field type may be, for example, forward scattered light (FSC), side scattered light (SSC), fluorescence, wavelength, channel (type or number of light detection channel), number of events, light intensity, and the like. Any of these field types may be adopted as the axis parameter.
- the data regarding the type of signal may be, for example, data regarding area, height, or width.
- the plot setting data may include data regarding the type of plot displayed on the worksheet.
- the plot type may be, for example, a spectral plot, a histogram plot, a dot plot, or a density plot.
- the axis scale setting data may include data related to the axis scale of the plot displayed on the worksheet.
- the data may include, for example, one or more of data regarding the scale of the scale, data regarding the maximum and / or minimum values of the scale, and whether the setting is associated with a biexponential function.
- the statistical setting data may include, for example, data that specifies a statistic to be output on a worksheet.
- the statistic includes, for example, the number of events, the ratio of the number of events in the gate to the number of events in the parent gate (parent%), and the ratio of the number of events in the gate to the total number of events in the corresponding sample (total%). , Mean, maximum, minimum, standard deviation, coefficient of variation (CV), and median.
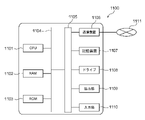
- FIG. 9 shows an example of the hardware configuration of the server device constituting the server system 10.
- the server system 10 may have a plurality of the server devices. Further, the plurality of server devices may exist in one data center, or may be distributed and arranged in a plurality of data centers located in different places or different countries.
- the server device 1000 shown in FIG. 9 includes a CPU (Central Processing Unit) 1001, a RAM 1002, and a ROM 1003.
- the CPU 1001, the RAM 1002, and the ROM 1003 are connected to each other via the bus 1004.
- An input / output interface 1005 is further connected to the bus 1004.
- a communication device 1006, a storage device 1007, a drive 1008, an output unit 1009, and an input unit 1010 are connected to the input / output interface 1005.
- the communication device 1006 connects the server device 1000 to the network 1011 by wire or wirelessly.
- the communication device 1006 allows the server device 1000 to acquire various data (for example, image data) via the network 1011.
- the acquired data can be stored in, for example, the storage device 1007.
- the type of communication device 1006 may be appropriately selected by those skilled in the art.
- the storage device 1007 includes an operating system, a program for realizing an information processing method according to the present disclosure in a server system, and various other programs, as well as image data, various data used in the information processing method according to the present disclosure, and various data.
- the operating system may be, for example, a UNIX®-based OS, particularly a LINUX®-based OS or a WINDOWS®-based OS.
- the drive 1008 can read out the data (for example, light intensity data, fluorescent label intensity data, analysis result data, output data, etc.) or program recorded on the recording medium and output it to the RAM 1003.
- the recording medium is, for example, an HDD, SSD, microSD memory card, SD memory card, or flash memory, but is not limited thereto.
- An output device for example, a display device may be connected to the output unit 1009.
- the input unit 1010 can accept an input for operating the server system itself.
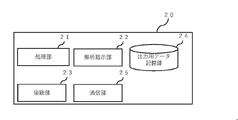
- the data analysis client terminal 20 will be described with reference to FIG. FIG. 10 is a block diagram showing an example of the functional configuration of the terminal.
- the data analysis client terminal 20 includes a processing unit 21, an analysis instruction unit 22, a connection unit 23, an output data storage unit 24, and a communication unit 25.
- the processing unit 21 performs a process of outputting the output data transmitted from the server system 10 to the output device attached to the data analysis client terminal 20.
- the output data is displayed in a window on the screen displayed on the output device (particularly, a display device).
- the data analysis client terminal may include an output device to which output data is output.
- the analysis instruction unit 22 transmits the start request of the interactive analysis process described above to the server system 10. Further, the analysis instruction unit 22 accepts the input of the analysis command used in the interactive analysis process described above, and transmits the analysis command to the server system 10.
- the analysis command may include the worksheet setting data described above.
- the interactive analysis processing unit 12 executes the analysis process with reference to the worksheet setting data, whereby output data according to the worksheet setting data can be generated.
- the data analysis client terminal according to the present disclosure may be configured to transmit the analysis command for the output data output to the output device to the server system. Further, the data analysis client terminal according to the present disclosure may be configured to output a window in which the output data is displayed to the output device and accept the input of the analysis command in the window.
- the connection unit 23 executes RPC (Remote Procedure Call) in interactive processing between the server system 10 (particularly the interactive analysis processing unit 12) and the data analysis client terminal 20 (particularly the analysis instruction unit 22). It is a functional element for.
- RPC Remote Procedure Call
- the combination of the connection unit 23 of the data analysis client terminal 20 and the connection unit 14 of the server system 10 causes the analysis command input in the data analysis client terminal 20 to be transmitted to the server system 10 and the analysis command to be sent to the server. It may be possible to run on system 10.
- the output data storage unit 24 stores the output data transmitted from the server system 10.
- the communication unit 25 receives the output data created by the server system 10 based on the fluorescent label intensity data from the server system.
- FIG. 11 shows an example of the hardware configuration of the data analysis client terminal 20.
- the terminal may be, for example, a general-purpose information processing device (particularly a computer).
- the information processing apparatus 1100 shown in FIG. 11 includes a CPU (Central Processing Unit) 1101, a RAM 1102, and a ROM 1103.
- the CPU 1101, the RAM 1102, and the ROM 1103 are connected to each other via the bus 1004.
- An input / output interface 1105 is further connected to the bus 1104.
- a communication device 1106, a storage device 1107, a drive 1108, an output unit 1109, and an input unit 1110 are connected to the input / output interface 1105.
- the communication device 1106 connects the information processing device 1100 to the network 1111 by wire or wirelessly.
- the communication device 1106 allows the information processing device 1100 to transmit or receive various data via the network 1111.
- the communication device 1106 transmits various data to the server system 10 or receives various data from the server system 10.
- the type of communication device 1106 may be appropriately selected by those skilled in the art.
- the storage device 1107 includes an operating system, a program for outputting output data by an output data output unit, a program for realizing interactive analysis processing, and various other programs, and information processing according to the present disclosure.
- the operating system may be, for example, a UNIX®-based OS, particularly a LINUX®-based OS or a WINDOWS®-based OS.
- the drive 1108 can read the data (for example, output data) or the program recorded on the recording medium and output it to the RAM 1103.
- the recording medium is, for example, an HDD, SSD, microSD memory card, SD memory card, or flash memory, but is not limited thereto.
- the output unit 1109 causes the output device to output output data.
- the output device may be, for example, a display device.
- the input unit 1110 accepts, for example, the input of an analysis command in the interactive analysis process.
- An input device such as a keyboard or a mouse may be connected to the input unit 1110, and the analysis command may be input by these input devices.
- the data acquisition client terminal 30 will be described with reference to FIG. FIG. 12 is a block diagram showing an example of the functional configuration of the terminal.
- the data acquisition client terminal 30 includes a data acquisition unit 31, a transmission unit 32, a data processing unit 33, and a data storage unit 34.
- the data acquisition unit 31 acquires the measurement data transmitted from the biological sample analyzer 40.
- the measurement data includes light intensity data to be processed by the automatic analysis processing unit 11.
- the light intensity data may be light intensity data acquired by irradiating a biological sample with light.
- the transmission unit 32 uses the measurement data (including the light intensity data) acquired by the data acquisition unit 31 or the measurement data processed by the following data processing unit 33 in the server system 10 (particularly, the optical data storage unit of the server system 10). Send to 15).
- the transmission unit 32 can also transmit analysis setting data to the server system 10.
- the transmission unit 32 transmits the light intensity data, or the light intensity data and the analysis setting data to the server system in response to the acquisition of the light intensity data.
- the transmission unit 32 may automatically start transmitting the measurement data or the measurement data (and analysis setting data) after the processing in response to the acquisition of the measurement data.
- the data client terminal may transmit the light intensity data to the server system 10.
- the data acquisition client terminal may be configured to transmit the light intensity data (and analysis setting data) to the server system 10 in response to the acquisition of the light intensity data.
- the data acquisition client terminal 30 may execute a calculation process for calculating the fluorescent label intensity data from the light intensity data.
- the calculation process may be executed as described in (3-1) above, and may be, for example, a fluorescence correction process or an unmixing process.
- the transmission unit 32 transfers the fluorescent label intensity data (or the fluorescent label intensity data processed by the following data processing unit 33) to the server system 10 (particularly, the optical data storage unit 15 of the server system 10). Can be sent.
- the data client terminal according to the present disclosure may transmit the fluorescent label intensity data to the server system 10.
- the data acquisition client terminal according to the present disclosure may be configured to transmit the fluorescent label intensity data to the server system 10 in response to the acquisition of the fluorescent label intensity data.
- the transmission unit 32 may transmit both the measurement data and the fluorescence label intensity data to the server system 10.
- the data acquisition client terminal 30 has a functional unit called a transmission unit 32 in addition to the data acquisition unit 31, so that the data acquisition process and the upload process can be executed separately.
- the measurement data including the light intensity data
- the fluorescent label intensity data calculated from the measurement data or both of these data, without affecting the data acquisition process from the biological sample analyzer 40.
- the data processing unit 33 can execute a predetermined process on the measurement data and / or the fluorescent label intensity data acquired by the data acquisition unit 31.
- the process may be a compression process, a data processing process (for example, a format conversion process), or the like.
- the measurement data and / or the fluorescent label intensity data can be converted into a format suitable for information processing in the server system 10, and the processing in the server system 10 is streamlined.
- the data acquisition client terminal according to the present disclosure performs a predetermined process on the light intensity data or the fluorescent label intensity data in response to the acquisition of the light intensity data or the fluorescent label intensity data. Then, the processed light intensity data or fluorescent label intensity data may be configured to be transmitted to the server system.
- the data storage unit 34 can store the measurement data or the measurement data after the processing.
- the data storage unit 34 may store the fluorescent label intensity data or the fluorescent label intensity data after the treatment.
- the data acquisition client terminal 30 may also be, for example, a general-purpose information processing device (particularly a computer).
- the biological sample analyzer may be, for example, a flow cytometer as described above, but is not limited thereto.
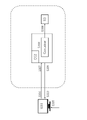
- FIG. 13 shows a configuration example of the biological sample analyzer.
- the biological sample analyzer 40 includes a light irradiation unit 101 that irradiates the biological sample S flowing through the flow path C with light, a detection unit 102 that detects the light generated by the irradiation, and the detection unit. It includes an information processing unit 103 that processes information about the detected light.
- Examples of the biological sample analyzer 40 include, for example, a flow cytometer and an imaging cytometer.
- the biological sample analyzer 40 may include a sorting unit 104 that sorts specific biological particles P in the biological sample.
- the biological sample analyzer 40 including the sorting unit for example, a cell sorter can be mentioned.
- the biological sample S may be a liquid sample containing biological particles.
- the biological particle is, for example, a cell or a non-cellular biological particle.
- the cell may be a living cell, and more specific examples thereof include blood cells such as erythrocytes and leukocytes, and germ cells such as sperm and fertilized eggs. Further, the cells may be those directly collected from a sample such as whole blood, or may be cultured cells obtained after culturing. Examples of the non-cellular biological particles include extracellular vesicles, particularly exosomes and microvesicles.
- the biological particles may be labeled with one or more labeling substances (eg, dyes (particularly fluorescent dyes) and fluorescent dye-labeled antibodies, etc.).
- the biological sample analyzer of the present disclosure may analyze particles other than biological particles, or may analyze beads or the like for calibration or the like.
- the flow path C may be configured to form a flow in which the biological sample flows, in particular, the biological particles contained in the biological sample are arranged in a substantially row.
- the flow path structure including the flow path C may be designed so that a laminar flow is formed, and in particular, a laminar flow in which the flow of the biological sample (sample flow) is surrounded by the flow of the sheath liquid is formed. Designed.
- the design of the flow path structure may be appropriately selected by those skilled in the art, and known ones may be adopted.
- the flow path C may be formed in a flow channel structure (flow channel structure, particularly a flow path structure in which focusing is performed) such as a microchip (a chip having a flow path on the order of micrometers) or a flow cell.
- the width of the flow path C may be 1 mm or less, and in particular, 10 ⁇ m or more and 1 mm or less.
- the flow path C and the flow path structure including the flow path C may be formed of a material such as plastic
- the apparatus of the present disclosure may be configured so that the biological sample flowing in the flow path C, particularly the biological particles in the biological sample, is irradiated with the light from the light irradiation unit.
- the apparatus of the present disclosure may be configured such that the light irradiation point (interrogation point) for the biological sample is in the flow path structure in which the flow path C is formed, or the light irradiation point is such that the light irradiation point is located in the flow path structure. It may be configured to be outside the flow path structure.
- the former a configuration in which the light is irradiated to the flow path C in the microchip or the flow cell can be mentioned.
- the biological particles after exiting from the flow path structure may be irradiated with the light, and examples thereof include a Jet in Air type flow cytometer.
- the light irradiation unit 101 includes a light source unit that emits light and a light guide optical system that guides the light to the flow path C.
- the light source unit includes one or more light sources.
- the type of light source may be, for example, a laser light source or an LED.
- the wavelength of the light emitted from each light source may be any wavelength of ultraviolet light, visible light, or infrared light.
- the light guide optical system includes optical components such as beam splitters, mirrors or optical fibers. Further, the light guide optical system may include a lens group for condensing light, and may include, for example, an objective lens.
- the irradiation point of light on the biological sample may be one or more.
- the light irradiation unit 101 may be configured to collect light emitted from one or a plurality of different light sources with respect to one irradiation point.
- the detection unit 102 includes at least one photodetector that detects the light generated by the light irradiation of the particles by the light irradiation unit.
- the light to be detected is, for example, fluorescence or scattered light (for example, one or more of forward scattered light, backscattered light, and side scattered light).
- Each photodetector comprises one or more light receiving elements, eg, having a light receiving element array.
- Each photodetector may include one or more PMTs (photomultiplier tubes) and / or photodiodes such as APDs and MPPCs as light receiving elements.
- the photodetector includes, for example, a PMT array in which a plurality of PMTs are arranged in a one-dimensional direction.
- the detection unit may include an image pickup device such as a CCD or CMOS.
- the detection unit can acquire an image of biological particles (for example, a bright-field image, a dark-field image, a fluorescent image, etc.) by the image pickup device.
- the detection unit includes a detection optical system that causes light of a predetermined detection wavelength to reach a corresponding photodetector.
- the detection optical system includes a spectroscopic unit such as a prism or a diffraction grating or a wavelength separation unit such as a dichroic mirror or an optical filter.
- the detection optical system may be configured to, for example, disperse light from biological particles and detect light in different wavelength ranges with a plurality of photodetectors having a larger number of fluorescent dyes.
- a flow cytometer including such a detection optical system is called a spectral type flow cytometer.
- the detection optical system may be configured to separate the light corresponding to the fluorescence wavelength range of the fluorescent dye from the light from the biological particles, for example, and have the corresponding photodetector detect the separated light.
- the detection unit may include a signal processing unit that converts an electric signal obtained by a photodetector into a digital signal.
- the signal processing unit may include an A / D converter as a device for performing the conversion.
- the digital signal obtained by the conversion by the signal processing unit can be transmitted to the information processing unit.
- the digital signal can be handled by the information processing unit as data related to light (hereinafter, also referred to as "optical data").
- the optical data may be optical data including, for example, fluorescence data. More specifically, the optical data may be light intensity data, and the light intensity may be light intensity data of light including fluorescence (may include feature quantities such as Area, Hight, Width, etc.). good.
- the information processing unit 103 includes, for example, a processing unit that executes processing of various data (for example, optical data) and a storage unit that stores various data.
- the information processing unit can execute a determination as to whether to sort biological particles based on optical data and / or morphological information. Then, the information processing unit controls the sorting unit based on the result of the determination, and the bioparticles can be sorted by the sorting unit.
- the information processing unit may be configured as a general-purpose computer, and may be configured as an information processing device including, for example, a CPU, RAM, and ROM.
- the information processing unit may be included in a housing provided with a light irradiation unit and a detection unit, or may be outside the housing.
- the information processing unit may be realized by, for example, a data acquisition client terminal 30.
- the sorting unit 104 may execute sorting of biological particles according to, for example, a determination result by the information processing unit.
- the preparative method may be a method in which droplets containing biological particles are generated by vibration, an electric charge is applied to the droplets to be sorted, and the traveling direction of the droplets is controlled by an electrode.
- the method of sorting may be a method of controlling the traveling direction of the biological particles in the flow path structure to perform sorting.
- the flow path structure is provided with, for example, a control mechanism based on pressure (injection or suction) or electric charge.
- a chip having a flow path structure in which the flow path C branches to a recovery flow path and a waste liquid flow path downstream thereof, and specific biological particles are recovered to the recovery flow path. (For example, the chip described in 2020-76736) can be mentioned.
- the biological sample analyzer 40 may be a microscope device for performing, for example, multicolor fluorescence imaging, particularly a fluorescence microscope device.
- multicolor fluorescence imaging particularly a fluorescence microscope device.
- the information processing system of the present disclosure may be executed for light intensity data acquired by the microscope device.
- the information processing method executed by the information processing system 1 may include an automatic analysis processing step. Further, the information processing method may include an interactive analysis processing step using output data generated by the automatic analysis processing step in addition to the automatic analysis processing step. Further, the information processing method executed by the information processing system 1 includes an output data acquisition process for acquiring output data based on analysis result data existing in the server system, and an output data obtained by the acquisition process. It may include an interactive analysis processing step to be used.
- the automatic analysis process, the output data acquisition process, and the interactive analysis process will be described.
- step S101 the data acquisition client terminal 30 acquires the light intensity data of the biological sample from the biological sample analyzer 40.
- the light intensity data may be light intensity data acquired by irradiating a biological sample with light.
- the data acquisition client terminal 30 may acquire incidental data referred to or used in the analysis process of the light intensity data in addition to the light intensity data.
- the ancillary data may include, for example, data on the biological sample itself and / or data on analytical settings for the biological sample.
- the data regarding the biological sample itself for example, the attributes of the biological sample (for example, the type of organism from which the biological sample is derived, the type of body fluid from which the biological sample is derived, the type of organ from which the biological sample is derived, the type of disease, etc.). , Fluorescent dyes labeled with biological samples, creators and dates of creation of biological samples, and the like.
- step S101 the data acquisition client terminal 30 may execute a process of calculating the fluorescent label intensity data from the light intensity data.
- step S102 the data acquisition client terminal 30 transmits the light intensity data to the server system 10.
- step S102 the data acquisition client terminal 30 may transmit the attached data in addition to the light intensity data.
- the data acquisition client terminal 30 may transmit the fluorescent label intensity data to the server system 10 in step S102.
- the data acquisition client terminal 30 has acquired the light intensity data or the fluorescent label intensity data from the biological sample analyzer 40 in step S101.
- the transmission may be executed accordingly. More specifically, the data acquisition client terminal 30 may start transmitting the light intensity data to the server system 10 with the start of receiving the light intensity data as a trigger. The transmission may be performed via the network 50.
- the data acquisition client terminal 30 may start transmitting the light intensity data to the server system 10 with the completion of receiving the light intensity data as a trigger. However, as described above, the light intensity data may be started. By triggering the start of transmission of, the upload completion can be accelerated.
- step S103 the server system 10 receives the light intensity data or the fluorescent label intensity data transmitted from the data acquisition client terminal 30 via the network 50.
- the server system 10 stores the light intensity data or the fluorescent label intensity data in the optical data storage unit 15.
- step S104 the server system 10 executes an automatic analysis process for the light intensity data or the fluorescent label intensity data.
- the automatic analysis process is particularly executed by the automatic analysis processing unit 11.
- the server system 10 can calculate fluorescent label intensity data from the light intensity data and perform analysis process on the fluorescent label intensity data to generate output data.
- the server system 10 receives the fluorescent label intensity data
- the server system 10 executes an analysis process for the received fluorescent label intensity data without performing a calculation process for the fluorescent label intensity data. Can be done.
- the details of the process in step S104 will be described below with reference to FIG.
- the automatic analysis processing unit 11 starts the automatic analysis processing.
- the automatic analysis process is started in response to the storage of the light intensity data (or the fluorescent label intensity data) in the optical data storage unit 15 in step S103.
- the automatic analysis process may be an event-driven analysis process triggered by the storage.
- the processing by the automatic analysis processing unit 11 may be executed, for example, serverless, and may be configured as a so-called serverless architecture.
- "process executed without a server” is not a process that does not use a server, but executes only predetermined information processing in an event-driven format on a pre-built server architecture. That is, it may mean that the information processing is executed in a function unit.
- the pre-built server architecture may be pre-built by a business operator that provides an analysis service to the user of the data analysis client terminal 20 by the server system 10, and may be built by a so-called cloud business operator. good.
- the processing by the automatic analysis processing unit 11 may be performed by, for example, AWS Lambda, and in particular, by a system including a combination of AWS Lambda and Amazon EC2. To.
- step S152 the automatic analysis processing unit 11 secures a computing resource for executing the analysis processing of the light intensity data (or fluorescent label intensity data) on the server system 10.
- the computing resource functions as a virtual server for executing the analysis process.
- step S152 the virtual server is started.
- step S153 the automatic analysis processing unit 11 (particularly the virtual server) downloads the light intensity data (or fluorescent label intensity data) stored in the optical data storage unit 15.
- the automatic analysis processing unit 11 acquires data necessary for analysis.
- the data required for the analysis may include, for example, data used for calculating the fluorescence label intensity data and data used in the analysis process for the fluorescence intensity label data. These data may be stored in any storage unit or database in the server system 10, and may be stored in, for example, the database 17.
- the data used to calculate the fluorescence label intensity data may include, for example, spectral reference data.
- the data is used for the unmixing process.
- the data used in the analysis process for the fluorescence intensity labeled data may further include analysis commands.
- the analysis command includes, for example, a gate setting command, a plot setting command, an axis setting command, an axis display setting command, a statistical setting command, and a region setting command.
- the analysis command is used to obtain the analysis result data desired by the user, for example, a two-dimensional plot. Further, the analysis command may include a clustering command.
- the analysis command may be transmitted from the data analysis client terminal 20 or the data acquisition client terminal 30 to the server system 10 in advance.
- step S155 the automatic analysis processing unit 11 (particularly, the virtual server) can execute a process of calculating the fluorescent label intensity data from the light intensity data. Then, the automatic analysis processing unit 11 executes a process of generating analysis result data using the calculated fluorescent label intensity data. If the server system 10 receives the fluorescent label intensity data in step S103, the calculation process may be omitted. The process of calculating the fluorescent label intensity data may be performed using the data used for calculating the fluorescent label intensity data referred to in step S154. The calculation process may include, for example, a process of performing an unmixing process on the light intensity data to acquire the fluorescent label intensity data using the data. Further, the automatic analysis processing unit 11 may execute advanced analysis processing such as clustering processing and dimension compression processing.
- the process of generating the analysis result data may be executed by using the analysis command mentioned with respect to step S154.
- the generation process includes, for example, using the analysis command to generate analysis result data including one or more of a plot image, a clustering result display diagram, and a statistic based on the fluorescent label intensity data. It's fine.
- the automatic analysis processing unit 11 (particularly, the virtual server) stores the analysis result data generated in step S155 in, for example, the analysis result data storage unit 16. Further, the automatic analysis processing unit 11 stores the fluorescent label intensity data generated in step S155 in, for example, an optical data storage unit 15. These storage processes may be performed, for example, after the process of step S155, or may be performed after the process of step S156 or step S157.
- the automatic analysis processing unit 11 (particularly the virtual server) generates output data output by the data analysis client terminal 20.
- the automatic analysis processing unit 11 can specify or extract output data from the analysis result data generated in step S155.
- the output data may be a part of the analysis result data.
- the output data includes, for example, one or more of a two-dimensional plot image, a spectrum plot image, and a clustering result display diagram.
- the output data may include data for generating these images, while may not include the fluorescent label intensity data used in the analysis process.
- the output data may be configured so that these images can be edited by the data analysis client terminal 20.
- the data analysis client terminal 20 can execute an editing process on the output data, which is easy to use in the interactive analysis process described later.
- the output data may include numerical data such as statistical analysis result data.
- the “analysis result data” means the data generated by the analysis process in the server system 10.
- the “output data” is a part of the analysis result data, and is particularly data used for outputting the analysis result in the data analysis client terminal 20.
- step S157 the automatic analysis processing unit 11 (particularly, the virtual server) ends the analysis processing and advances the processing to step S105.
- step S105 the automatic analysis processing unit 11 (particularly, the virtual server) transmits an automatic analysis completion notification to the data analysis client terminal 20.
- the automatic analysis completion notification may be an e-mail or a notification method using a server-side push technique.
- the automatic analysis processing unit 11 stops the virtual server in response to the completion of the transmission of the automatic analysis completion notification. As a result, it is possible to prevent the operating time of the virtual server from becoming excessively long, and the cost of using the server is reduced.
- step S106 the data analysis client terminal 20 receives the automatic analysis completion notification.
- the data analysis client terminal 20 causes the output device to output the automatic analysis completion notification.
- the data analysis client terminal 20 may display a screen asking the user whether to send an output data request to the server system 10 in response to receiving the automatic analysis completion notification.
- a button for causing the data analysis client terminal 20 to send an output data request to the server system 10 may be arranged.
- step S107 the data analysis client terminal 20 transmits an output data request to the server system 10.
- the data analysis client terminal 20 may execute the transmission in response to the click or selection of a button on the screen by the user of the data analysis client terminal 20.
- step S108 the server system 10 receives an output data request.
- step S109 the server system 10 transmits the output data generated in step S104 to the data analysis client terminal 20.
- step S110 the data analysis client terminal 20 receives the output data transmitted from the server system 10.
- step S111 the data analysis client terminal 20 (particularly, the processing unit 21) causes the output device to output the output data.
- FIG. 23 shows an example of output data output to the output device.
- the output device displays a window in which the output data is displayed. Seven plot images are displayed in the lower left of the window. Further, one clustering result display diagram is displayed on the right side of the window. Further, in the upper left of the window, statistical data (number of events, Parent%, and Total%) corresponding to each gate is displayed.
- the window may display image data and / or statistic data based on the output data.
- the image data may include one or more plot images and / or one or more clustering result display diagrams as described above.
- the statistic data may include one or more statistic.
- the virtual server can be operated only when necessary. Therefore, the running cost can be significantly reduced as compared with the always-operated server. It also makes it possible to ensure scalability.
- step S101 the data acquisition client terminal 30 acquires the light intensity data of the biological sample from the biological sample analyzer 40.
- step S102 the data acquisition client terminal 30 transmits the light intensity data to the server system 10.
- the data acquisition client terminal 30 may execute the transmission in response to the acquisition of light intensity data from the biological sample analyzer 40 in step S101.
- step S103 the server system 10 receives the light intensity data transmitted from the data acquisition client terminal 30 via the network 50.
- the light intensity data is uploaded to the bucket of Amazon S3 that functions as the light data storage unit 15.
- step S104 the server system 10 executes an automatic analysis process for the light intensity data. The details of the process in step S104 will be described below with reference to FIG.
- step S151 for example, when an object containing light intensity data is uploaded to the bucket of Amazon S3 that functions as the optical data storage unit 15, AWS Lambda that functions as the automatic analysis processing unit 11 automatically performs the automatic analysis in step S151. Start the analysis process.
- step S152 AWS Lambda secures a computing resource on the server system 10 for executing the analysis process described later.
- an Amazon EC2 instance is launched as a virtual server for executing the analysis process in step S155 described later.
- AWS Lambda may be terminated in response to the launch of the Amazon EC2 instance.
- step S153 the instance launched in step S152 downloads the object containing the light intensity data stored in the bucket.
- step S154 the instance launched in step S152 acquires the data necessary for the analysis stored in advance in Amazon Aurora.
- the data required for the analysis may be transmitted at the same time as the light intensity data in step S102 and stored in advance in Amazon Aurora.
- step S155 the instance calculates fluorescent label intensity data from the light intensity data, for example, using the spectral reference data.
- the fluorescent label intensity data may be stored in the bucket.
- the instance generates analysis result data using the calculated fluorescent label intensity data.
- the instance stores the analysis result data generated in step S155 in the bucket.
- the instance may also store the fluorescent label intensity data generated in step S155 in the bucket.
- step S156 the instance generates output data from, for example, the analysis result data.
- the instance identifies or extracts output data from the analysis result data.
- step S157 the instance ends the analysis process. Upon completion of the analysis process, the instance advances the process to step S105.
- the light intensity data acquired in step S101 may be one or more.
- the plurality of light intensity data may be, for example, a plurality of light intensity data acquired by performing measurements on a plurality of biological samples.
- the data acquisition client terminal 30 transmits the plurality of light intensity data to the server system 10. Further, the data acquisition client terminal 30 can also transmit the data necessary for analysis to the server system 10.
- the server system 10 can record the plurality of light intensity data and / or the data necessary for the analysis in a database such as Amazon DynamoDB.
- the instance can execute the automatic analysis process for each of the plurality of light intensity data. The instance may update the database as the automatic analysis process is completed. Depending on the completion of the analysis process for all of the plurality of light intensity data, the instance may proceed to the process in step S105.
- step S105 the instance sends an automatic analysis completion notification to the data analysis client terminal 20.
- the instance may be stopped in response to the end of transmission of the automatic analysis completion notification.
- step S106 the data analysis client terminal 20 receives the automatic analysis completion notification.
- the data analysis client terminal 20 causes the output device to output the automatic analysis completion notification.
- the data analysis client terminal 20 may display a screen asking the user whether to send an output data request to the server system 10 in response to receiving the automatic analysis completion notification.
- a button for causing the data analysis client terminal 20 to send an output data request to the server system 10 may be arranged.
- step S107 the data analysis client terminal 20 transmits an output data request to the server system 10.
- the data analysis client terminal 20 may execute the transmission in response to the click or selection of a button on the screen by the user of the data analysis client terminal 20.
- step S108 the server system 10 receives an output data request.
- step S109 the server system 10 transmits the output data generated in step S104 to the data analysis client terminal 20.
- step S110 the data analysis client terminal 20 receives the output data transmitted from the server system 10.
- step S111 the data analysis client terminal 20 causes the output device to output the output data.
- step S201 the data analysis client terminal 20 sends an output data request to the server system 10.
- the request may include information used by the server system 10 to acquire or generate output data.
- the request includes information used to identify analysis result data and / or information used to generate output data from the analysis result data.
- the transmitted information may include the user authentication information of the data analysis client terminal 20 in addition to the request. The transmission in step S201 may be performed via the network 50.
- step S202 the server system 10 receives an output data request transmitted from the data analysis client terminal 20 via the network 50.
- the server system 10 may acquire output data from the analysis result data storage unit 16, or the analysis result stored in the analysis result data storage unit 16.
- Output data may be generated from the data.
- the output data may be a part of the analysis result data.
- the output data includes, for example, one or more of a two-dimensional plot image, a spectrum plot image, and a clustering result display diagram.
- the output data may include data for generating these images, while may not include the fluorescent label intensity data used in the analysis process.
- the output data may be configured so that these images can be edited.
- the data analysis client terminal can execute the editing process on the output data.
- the output data may include numerical data such as statistical analysis result data.
- the process by the output data generation unit 13 may be executed by the constantly running virtual server in the server system 10. Since the virtual server is always running, the output data acquisition process can be executed at high speed. Further, the output data generation unit 13 may be configured as a serverless architecture.
- the output data acquisition or generation process by the output data generation unit 13 is executed in a container generated or managed by Amazon ECS, for example. good.
- AWS Fargate can execute the above process.
- AWS Fragate can acquire output data stored in Amazon S3, or can generate output data from analysis result data stored in Amazon S3.
- step S204 the server system 10 transmits output data to the data analysis client terminal 20 via the network 50.
- step S205 the data analysis client terminal 20 receives output data via the network 50.
- step S206 the data analysis client terminal 20 causes the output device to output the output data.
- the flow of interactive analysis processing by the information processing system 1 will be described below with reference to FIG.
- the analysis process may be executed continuously after the automatic analysis process described in (4-1) above, or may be executed continuously after the output data acquisition process described in (4-3) above. good.
- step S301 the data analysis client terminal 20 transmits an interactive analysis processing start request to the server system 10 via the network 50. Prior to the transmission, the data analysis client terminal 20 may have the output device output the output data. For example, step S301 may be executed after step S107 described in (4-1) above, or may be executed after step S206 described in (4-3) above.
- the data analysis client terminal 20 causes the output device to output a window as shown in FIG. 20. Then, in step S206, as shown in FIG. 21, the acquired output data (plot data) is displayed in the window.
- the request includes, for example, identification data used for specifying analysis target data to be subject to interactive analysis processing.
- the identification data includes, for example, information identifying a biological sample and information identifying an analysis performed on the biological sample.
- step S302 the server system 10 receives the request via the network 50.
- step S303 the server system 10 (particularly, the interactive analysis processing unit 12) secures a computing resource on the server system 10 for executing the interactive analysis processing in response to receiving the request.
- the computing resource functions as a virtual server that executes the interactive analysis process.
- step S304 the interactive analysis processing unit 12 (particularly the virtual server) acquires the analysis target data.
- the interactive analysis processing unit 12 may specify the analysis target data to be acquired by referring to the identification data.
- the analysis target data may include analysis result data from which the output data is derived. Further, the analysis target data may include light intensity data and / or fluorescent label intensity data from which the analysis result data is derived.
- the interactive analysis processing unit 12 monitors whether or not the analysis command described later has been received, that is, waits until the analysis command is received. May include.
- a session for executing RPC may be established between the server system 10 and the data analysis client terminal 20.
- the server system 10 may send, for example, a notification to the data analysis client terminal 20 notifying that the computation resource has been secured.
- the establishment may be made.
- the notification may be, for example, a notification by a notification method using server-side push technology.
- the establishment may be performed by acquiring the state by polling from the data analysis client terminal 20 to the server system 10.
- the server system 10 can execute the analysis process according to the analysis command transmitted from the data analysis client terminal 20.
- Both the server system 10 and the data analysis client terminal 20 may include a connection unit which is a functional element for executing RPC.
- the RPC may be executed by the combination of the connection unit 14 of the server system 10 and the connection unit 23 of the data analysis client terminal 20.
- MagicOnion can be mentioned as an example of these connection portions, but the present invention is not limited thereto.
- the interactive analysis processing unit 12 may acquire data necessary for analysis.
- the data required for the analysis may include, for example, data used for calculating the fluorescence label intensity data and data used in the analysis process for the fluorescence intensity label data.
- the data used to calculate the fluorescence label intensity data may include, for example, spectral reference data.
- the data is used for the unmixing process.
- the data used in the analysis process for the fluorescence intensity labeled data may further include the analysis command.
- step S305 the data analysis client terminal 20 receives an input of an analysis command for the output data.
- the data analysis client terminal 20 causes the output device to display a window for accepting the input of the analysis command.
- the user inputs an analysis command through the window.
- the input analysis command is, for example, an analysis command in which one or more of the various setting commands included in the analysis command used to acquire the output data output in step S301 is modified. good.
- the analysis commands entered are modified gate configuration commands, modified plot configuration commands, modified axis configuration commands, modified axis display configuration commands, modified statistical configuration commands, and modified regions. Includes at least one of the configuration commands.
- the analysis command may also include a modified clustering command.
- step S306 the data analysis client terminal 20 transmits the analysis command input in step S305 to the server system 10.
- step S307 the server system 10 receives the analysis command transmitted from the data analysis client terminal 20.
- the processes of steps S308 to S310 are executed in response to the receipt of the analysis command.
- These processes may be event-driven analysis processes triggered by the reception of the analysis command. That is, the interactive analysis process according to the present technique may be an event-driven analysis process.
- the processing by the interactive analysis processing unit 12 may be executed, for example, serverless, and may be configured as a so-called serverless architecture.
- server system 10 is, for example, Amazon Web Services (trademark)
- the processing by the interactive analysis processing unit 12 may be executed by, for example, AWS Lambda, and in particular, executed by a system including a combination of AWS Lambda and Amazon EC2. Will be done.
- step S308 the interactive analysis processing unit 12 (particularly, the virtual server) executes a process of calculating fluorescent label intensity data from the light intensity data. Then, the interactive analysis processing unit 12 executes a process of generating analysis result data using the calculated fluorescent label intensity data. If the fluorescent label intensity data does not change, the interactive analysis processing unit 12 may omit the calculation process of the fluorescent label intensity data, that is, the analysis result data may be obtained using the existing fluorescent label intensity data. You may execute only the process to generate.
- the interactive analysis processing unit 12 stores the analysis result data generated in step S308 in, for example, the analysis result data storage unit 16. Further, the interactive analysis processing unit 12 stores the fluorescent label intensity data generated in step S308 in, for example, an optical data storage unit. These storage processes may be performed, for example, after the process of step S308, or may be performed after the process of step S310.
- the interactive analysis processing unit 12 generates output data output by the data analysis client terminal.
- the interactive analysis processing unit 12 can specify or extract output data from the analysis result data generated in step S309.
- the output data may be a part of the analysis result data.
- the output data includes, for example, one or more of a two-dimensional plot image, a spectrum plot image, and a clustering result display diagram.
- the output data may include data for generating these images, while may not include the fluorescent label intensity data used in the analysis process.
- the output data may be configured so that these images can be edited.
- the data analysis client terminal can execute the editing process on the output data.
- the output data may include numerical data such as statistical analysis result data.
- the server system 10 transmits the generated output data to the data analysis client terminal 20.
- the output data may be transmitted for each data unit constituting the output data, or the entire output data may be transmitted collectively.
- the output data includes two of statistical data and image data (one or more of a two-dimensional plot image, a spectral plot image, and a clustering result display diagram).
- the server system 10 may transmit the statistic data, and then if the image data for output is generated, the server system 10 may transmit the image data.
- the image data may be transmitted first, and then the statistic data may be transmitted. In this way, the server system 10 can transmit output data for each data unit.
- step S310 the data analysis client terminal 20 receives the output data.
- step S311 the data analysis client terminal 20 causes the output device to output the output data.
- the plot image in which a part of the plot image of FIG. 21 is modified is displayed in the window.
- steps S305 to S312 may be repeated for the output data output in step S312. Each time these processes are repeated, the output data output to the output device may be updated and redrawn.
- the analysis command input in the data analysis client terminal 20 and the interactive analysis process by the server system 10 are repeated, and in this way, the interactive analysis process by the server system 10 and the data analysis client terminal 20 is repeated.
- the interactive analysis processing unit 12 stops the virtual server. As a result, it is possible to prevent the operating time of the virtual server from becoming excessively long, and the cost of using the server is reduced.
- the interactive analysis process may be terminated, for example, by the data analysis client terminal 20 receiving an instruction to end the interactive analysis process. Upon receiving the termination instruction, the data analysis client terminal 20 transmits the termination instruction to the server system 10. Upon receiving the termination instruction, the interactive analysis processing unit 12 stops the virtual server. As a result, it is possible to prevent the operating time of the virtual server from becoming excessively long, and the cost of using the server is reduced.
- the interactive analysis processing unit 12 may stop the virtual server in response to the elapse of a predetermined time without the server system 10 receiving the analysis command from the data analysis client terminal 20.
- the virtual server can be operated only when necessary. Therefore, the running cost can be significantly reduced as compared with the always-operated server. It also makes it possible to ensure scalability.
- step S301 the data analysis client terminal 20 transmits an interactive analysis processing start request to the server system 10 via the network 50.
- step S302 the server system 10 receives the request via the network 50.
- AWS Lambda which functions as the interactive analysis processing unit 12, secures a computing resource on the server system 10 for executing the interactive analysis processing in response to receiving the request.
- AWS Lambda causes Amazon ECS to execute a container (particularly a Docker container) in Amazon EC2.
- the processing of the virtual server that executes the analysis processing described later is executed. Further, the processing of the virtual server may be executed without constructing the container.
- step S304 the instance acquires analysis target data stored in, for example, Amazon S3. Further, in step S304, the instance can acquire data necessary for analysis. For example, the instance acquires data necessary for the analysis (for example, data used for calculating fluorescent label intensity data) stored in advance in Amazon Aurora.
- a session for executing RPC may be established between the server system 10 and the data analysis client terminal 20.
- the server system 10 may send a notification to the data analysis client terminal 20 notifying that the computation resource has been secured in Amazon EC2. The establishment may be made upon receipt of the notice.
- Both the server system 10 and the data analysis client terminal 20 may include a MagicOnion as a connection unit which is a functional element for executing RPC.
- the instance monitors whether the analysis command described later is received, that is, waits until the analysis command is received.
- step S305 the data analysis client terminal 20 receives an input of an analysis command for the output data.
- step S306 the data analysis client terminal 20 transmits the analysis command input in step S305 to the server system 10.
- step S307 the server system 10 receives the analysis command transmitted from the data analysis client terminal 20.
- the processes of steps S308 to S309 are executed in response to the receipt of the analysis command.
- These processes may be event-driven analysis processes triggered by the reception of the analysis command. That is, the interactive analysis process according to the present technique may be an event-driven analysis process.
- step S308 the instance executes a process of calculating fluorescent label intensity data from the light intensity data. Then, the instance executes a process of generating analysis result data using the calculated fluorescent label intensity data. If the fluorescent label intensity data does not change, the instance may omit the fluorescent label intensity data, that is, only the process of generating the analysis result data using the existing fluorescent label intensity data is executed. You may.
- the instance stores the analysis result data generated in step S308 in, for example, the bucket of S3.
- the interactive analysis processing unit 12 also stores the fluorescent label intensity data generated in step S308 in the bucket.
- step S309 the instance generates output data from the analysis result data, and transmits the generated output data to the data analysis client terminal 20.
- step S310 the data analysis client terminal 20 receives the output data.
- step S311 the data analysis client terminal 20 causes the output device to output the output data.
- steps S305 to S311 may be repeated for the output data output in step S311. That is, the analysis command input in the data analysis client terminal 20 and the interactive analysis process by the server system 10 are repeated, and in this way, the interactive analysis process by the server system 10 and the data analysis client terminal 20 is repeated.
- the server system 10 may be composed of a group of servers existing in each of a plurality of geographically dispersed data centers.
- the plurality of data centers may be distributed in a plurality of countries, for example.
- Each data center can be called a region.
- the server system 10 has an automatic analysis process and / or an interactive type according to the present disclosure from the plurality of data centers according to the position where the data analysis client terminal 20 and / or the data acquisition client terminal 30 exists.
- a data center that executes analysis processing can be specified, and a server in the specified data center can execute these processing.
- the server system 10 can specify the data center closer to the location as the data center that executes the processing from the plurality of data centers.
- the server system 10 is among the plurality of data centers according to preset information such as information or contract information regarding the location where the data analysis client terminal 20 and / or the data acquisition client terminal 30 exists. Therefore, the data center in which the data used in the processing of the present disclosure is uploaded or stored may be specified, and the data may be uploaded or stored in the server in the specified data center. Preferably, the server system 10 can specify the data center closer to the location as the data center in which the upload or storage is performed from among the plurality of data centers.
- the server that executes the process and the server that performs the upload or storage may exist in the same data center.
- a data center As described above, it is possible to speed up the processing in accordance with this disclosure. For example, by configuring the data center where data is saved in units such as users and contracts, it is possible to use a data center that is geographically close to the user, speeding up data upload, and dialogue. It is possible to speed up the response during type analysis.
- the optical data storage unit may include two or more types of storage having different access speeds.
- the server system uses the light intensity data and / or the fluorescent label intensity data stored in the storage having a higher access speed (hereinafter, also referred to as “hot storage”) when a predetermined condition is satisfied.
- Hot storage also referred to as “hot storage”
- You may execute the migration process to migrate to the storage with lower access speed (hereinafter also referred to as “cold storage").
- hot storage which has a high unit price instead of being able to access data immediately
- cold storage which has a slow response speed to data access but a low unit price.
- the predetermined conditions for executing the migration process may be preset by the user.
- the predetermined condition may be a condition such as executing the migration process when a predetermined number of days have passed without access to the data after the final access to the data.
- the server system compresses the data to be migrated and then executes the migration process.
- the storage cost can be further reduced.
- the server system 10 may copy the data from the cold storage to the hot storage. Further, in order to access the compressed data, the server system 10 can also execute the decompression process at the time of the data copy.
- the server system 10 may include a database containing information about the storage in which the data resides (which cold storage or which hot storage it resides in).
- the server system 10 or the data analysis client terminal 20 can easily access the data in the cold storage by referring to the database.
- the automatic analysis processing unit included in the information processing system starts the automatic analysis processing in response to the light intensity data being stored in the optical data storage unit 15. It's okay.
- the optical data storage unit 15 exists in the server system 10 in the embodiment described in (4-1) above, but in the present disclosure, the optical data storage unit 15 may exist outside the server system 10. ..
- an external storage existing outside the server system 10 may be used as the optical data storage unit 15 in which the optical intensity data is stored.
- the external storage existing outside the server system 10 may be, for example, an online storage owned by a user of the information processing system according to the present disclosure.
- the server system 10 (particularly, the automatic analysis processing unit 11) may start the automatic analysis processing described in (4-1) above in response to the light intensity data being stored in the external storage.
- the external storage may notify the server system 10 that the light intensity data has been stored.
- the automatic analysis processing unit 11 can execute the event-driven analysis process described in (4-1) above.
- steps S152 and S154 to S157 may be executed as described in (4-1) above.
- step S153 the automatic analysis processing unit 11 downloads the light intensity data stored in the external storage used as the optical data storage unit 15.
- the automatic analysis processing unit 11 secures a computation resource for executing the analysis processing on the server system 10. It may be a computation resource outside the server system 10.
- a computation resource for executing analysis processing may be secured in an information processing device existing outside the server system 10.
- the information processing system uses an external online storage as a data storage destination, or an external computation resource is used to execute an analysis process, so that the user can use the server system. It is possible to further reduce the operating cost.
- step S155 described in (4-2) above and step S309 described in (4-4) above the process of calculating the fluorescence label intensity data from the light intensity data is executed.
- the process includes, for example, a fluorescence correction process or an unmixing process, and these processes are performed particularly when the biological sample analyzer is a biological particle analyzer such as a flow cytometer.
- the data acquired by the bioparticle analyzer can be divided into event units (that is, for each measurement result of each bioparticle).
- the information processing system (particularly the server system) according to the present disclosure first divides the light intensity data for each event, and then divides the light intensity.
- the calculation process may be executed for each of the data.
- the calculation process of each of the divided light intensity data may be executed in parallel, for example.
- the server system (particularly, an automatic analysis processing unit) launches a plurality of AWS Lambda, and assigns each divided light intensity data to each virtual server. Then, each virtual server executes the calculation process for each of the assigned divided light intensity data.
- the metadata (particularly analysis setting data), light intensity data, and fluorescent label intensity data described in (4-1) above can be stored in the storage or storage unit included in the server system 10 in the present disclosure.
- these data may be stored in the server system 10 in a state of being associated with each other.
- the association of these data with each other facilitates the reproduction of measurements and / or the analysis of measurement results.
- the attached data described in (4-1) above, the data used for calculating the fluorescent label intensity data, and the data used in the analysis process for the fluorescent label intensity label data are also associated with each other in the server. It may be stored in the system 10.
- the association of these data with each other facilitates the reproduction of measurements and / or the analysis of measurement results.
- these data may be available only by one data analysis client terminal and / or data acquisition client terminal, or by two or more data analysis client terminals and / Or may be available by the data acquisition client terminal. That is, these data can be shared by two or more data analysis client terminals and / or data analysis client terminals.
- a plurality of data analysis client terminals can share one or more of the light intensity data, the fluorescent label intensity data, and the analysis setting data in the server system.
- a plurality of data analysis client terminals can share the analysis setting data in the server system.
- a plurality of data acquisition client terminals can share one or more of the light intensity data, the fluorescent label intensity data, and the analysis setting data in the server system.
- a plurality of data acquisition client terminals can share the analysis setting data in the server system.
- information on measurement and / or analysis by a user by configuring an information processing system (or a server system, a data analysis client terminal, or a data acquisition client terminal included in the system) in this way. Can be reused by other users, facilitating the reproduction of measurements and / or the analysis of measurement results.
- Any of the output data generated by the interactive analysis process described in 4) may be configured so that it can be output to a window (particularly a worksheet) having the same user interface.
- these three output data may have the same metadata used to be output by the output device.
- the analysis command input in step S305 of the interactive analysis process can also be used to execute the automatic analysis process on the newly acquired light intensity data.
- the output data is displayed on a worksheet having a similar user interface in this way, the user can view the automatic analysis process, the output data generation process, and the interactive analysis process on a consistent user interface. It is feasible. Further, since various analysis setting data used for the measurement are saved together with the analysis result, the measurement and the analysis can be easily reproduced by using the same setting. By combining these mechanisms with the data standardization function between devices, it is possible to easily reproduce the same experiment across multiple different devices.
- the data analysis client terminal 20 causes the output device to output the output data including the clustering result display diagram.
- the clustering result display chart may be, for example, a clustering result display chart as shown in FIG. 23, and the clustering result display chart shown in the figure is an output result obtained when a clustering algorithm called FlowSOM is executed. , Also known as Star Chart.
- the number of markers used in the analysis is large, the number of markers included in the output data will also be large.
- the content of the clustering result display diagram becomes complicated and it becomes difficult to grasp the expression level of each marker.
- the star chart and population pie chart in FlowSOM if the number of types of markers displayed in each cluster is large, it may be difficult to grasp the expression level of each cluster.
- the data analysis client terminal 20 may be configured so that the number of markers displayed in the clustering result display diagram can be changed, and more specifically, in the clustering result display diagram. It may be configured to allow selection of markers contained in each cluster of. By being able to select the markers included in each cluster, the clustering result display diagram can be adjusted according to the user's purpose. Further, since the number of markers included in the clustering result display diagram can be adjusted, it becomes easier to grasp the expression level of the markers.
- the data analysis client terminal 20 forms a clustering result display diagram relating to the selected one or more markers in response to the selection of one or more markers from all the markers included in the output data. You can do it.
- the formed clustering result display diagram may not include data on one or more unselected surface markers. That is, in response to the selection being made, the data analysis client terminal 20 can form a clustering result display diagram based on the data of the selected one or more markers.
- the clustering result display diagram may be a star chart or a pie chart, but is not limited thereto.
- step S111 described in (4-1) above the data analysis client terminal 20 displays, for example, a star chart 500 as shown in FIG. 24 on the screen of the output device as a clustering result display diagram based on the output data. Imagine a case where you are doing it. Further assume that the user wants to reduce the number of markers displayed on the star chart.
- the data analysis client terminal 20 is as shown in FIG. 25, for example, in response to the user selecting (clicking or touching) the star chart or in response to the user selecting a predetermined button.
- the marker selection window 501 is displayed on the output device.
- the window includes a group of markers displayed in the star chart, a color-coded display element 502 indicating a color corresponding to each marker, and a marker list 503 displayed in the star chart.
- the marker list is configured so that it is possible to select whether to display each marker on the star chart.
- the color-coded display element is shown as a pie display in the figure, the color-coded display element may be shown so that the marker and the color are associated with each other. It may be in a display format.
- the user selects a marker to be displayed in the star chart from the marker list.
- the marker list 512 shown in FIG. 26 shows a state in which the user has selected five markers (shaded in gray).
- the data analysis client terminal 20 displays only the color of the selected marker in the color-coded display element, as shown by the color-coded display element 513 in the figure. As a result, the user can grasp the display content of the star chart after selecting the marker.
- the data analysis client terminal 20 also changes the star chart shown in FIG. 24 according to the selection of the five markers. For example, depending on the selection of the five markers, the data analysis client terminal 20 changes the star chart 500 to the star chart 510 shown in FIG. 27.
- the data analysis client terminal 20 changes the data element (number of colors) displayed in each cluster.
- the data analysis client terminal 20 may be configured to change the clustering result display diagram according to the selection of the marker in the marker list. Then, as described above, the change of the clustering result display diagram is performed so as to display only the data of the markers selected in the marker list (data based on the expression level and / or the color corresponding to each marker). You can do it.
- the data analysis client terminal 20 may change the displayed clustering result display diagram in conjunction with the marker selection operation in the marker list 512.
- the data analysis client terminal 20 selects a predetermined button (for example, a predetermined button in the marker selection window, for example, the Close button shown in the figure) to change the displayed star chart.
- a predetermined button for example, a predetermined button in the marker selection window, for example, the Close button shown in the figure
- the displayed clustering result display diagram may be changed.
- the data analysis client terminal 20 may change the color-coded display element in the marker selection window. Further, the data analysis client terminal 20 may change the clustering result display diagram in conjunction with the selection of the marker. For example, FIG. 28 shows a state in which 10 markers are selected in the marker list 522 in the marker selection window 521. The data analysis client terminal 20 displays the color-coded display element 523 color-coded into 10 according to the selection. Then, depending on the selection, the data analysis client terminal 20 may display the clustering result display FIG. 520 as shown in FIG. 29. Further, FIG.
- the data analysis client terminal 20 displays the three color-coded color-coded display elements 533 according to the selection. Then, depending on the selection, the data analysis client terminal 20 may display the clustering result display FIG. 530 as shown in FIG. 31. Further, the display order of the markers in the star chart may be arbitrarily changed. That is, the data analysis client terminal 20 may be configured so that the display order of the markers in the star chart can be changed. The change in the display order may be executed, for example, according to a user operation on the marker list or the color-coded display element in the marker selection window, or may be executed according to the user operation operation on the star chart itself.
- the data analysis client terminal 20 may change the display order in response to the user changing the positional relationship of two or more selected markers in the marker list by a predetermined operation (for example, a drag operation).
- a predetermined operation for example, a drag operation
- the data analysis client terminal 20 changes the display order in response to the user changing the positional relationship of two or more pies in the color-coded display element by a predetermined operation (for example, a drag operation). sell.
- the data analysis client terminal 20 may change the display order by the same operation for the nodes in the star chart.
- the data analysis client terminal 20 is executing the change of the clustering result display diagram, but the change of the clustering result display diagram may be executed by the server system 10.
- the data analysis client terminal 20 transmits data regarding the selected marker to the server system 10.
- the server system 10 generates a clustering result display diagram after the change based on the data related to the selected marker, and transmits the clustering result display diagram after the change to the data analysis client terminal 20.
- the data analysis client terminal 20 may display the changed clustering result display diagram on the output device.
- the number of clusters (for example, nodes in FlowSOM) often increases. For example, as the number of cell types to be analyzed increases, so does the number of clusters.
- FlowSOM has a function to group clusters with similar marker expression tendencies called metaclusters, but star charts and population pie charts are displayed on a cluster-by-cluster basis.
- the tendency and outline of the marker expression level as a whole of the sample measured from the clustering result display diagram (for example, the tendency of the expression level in the metacluster unit). Etc.) may be difficult to grasp.
- FIG. 32 shows an example of a clustering result display diagram (star chart) including a large number of nodes. Since a large number of clusters are displayed in the clustering result display FIG. 600 of the same figure, for example, a large number of clusters are overlapped and displayed in the area 601 surrounded by the dotted line, and the tendency of the expression level in these clusters. Is difficult to confirm. Even if the region is expanded as shown on the right side of the figure, it is difficult to confirm the tendency of the expression level. In addition, it is more difficult to grasp the tendency and characteristics of the expression level in each metacluster in which a plurality of clusters are grouped, and as a result, it is difficult to get an overview of the expression tendency of the sample as a whole.
- the data analysis client terminal 20 may be configured to output a star chart or a population pie chart in meta-cluster units in which one or more clusters having similar expression tendencies are grouped. ..
- the metacluster may be formed by automatically grouping clusters having a similar marker expression tendency by an algorithm, or the metacluster is formed according to the user selecting one or more clusters by himself / herself. May be done.
- Such a clustering result output diagram for each metacluster, that is, a metacluster chart makes it easy to grasp the tendency of the expression level.
- FIG. 33 shows an example of a metacluster chart formed from a clustering result display diagram.
- the clustering result display diagram 600 described above is displayed on the left side of the figure.
- the data analysis client terminal 20 generates a meta-cluster chart 602 as shown on the right side of the clustering result display diagram 600, for example, in response to receiving a predetermined operation by the user.
- the predetermined operation may be, for example, an operation such as clicking or touching a predetermined operation button.
- the plurality of clusters in FIG. 600 can be classified into seven cluster groups (referred to as metaclusters 611 to metaclusters 617) as shown in the figure.
- Each metacluster has common characteristics (eg, common characteristics regarding marker expression status).
- Cluster groups that belong to the same metacluster are colored the same. Also, the metaclusters are colored differently from each other.
- the data analysis client terminal 20 generates a metacluster node for each of these seven metaclusters based on the data of one or more clusters belonging to each metacluster.
- a metacluster chart 602 containing the seven generated metacluster nodes 621-627 is shown on the right side of the figure.
- the color of the metacluster node 621 is the same as the color of the metacluster 611.
- the colors of the metacluster nodes 622 to 627 are the same as the colors of the metaclusters 612 to 617, respectively.
- the metacluster and the metacluster node are colored in the same color, which makes it easier to understand the relationship between the metacluster and the metacluster node.
- the data analysis client terminal 20 may set the size of the metacluster node (the size of the diameter of the circle in the figure) according to quantitative data such as the number of events or the number of cells belonging to the metacluster node. .. In the figure, the metacluster node containing more events has a larger diameter circle.
- the data analysis client terminal 20 may arrange each metacluster node at a position specified based on the position of one or more clusters belonging to each metacluster node in the metacluster chart. For example, the data analysis client terminal 20 is based on the number of events included in each of one or more clusters belonging to each metacluster node and the position of each of the one or more clusters in the metacluster chart of each metacluster node. The position may be specified. In one example, the position of each metacluster node may be the position of the center of gravity of the position of one or more clusters integrated into the metacluster node.
- the location of the metacluster node as described above does not have to be specified in the metacluster chart.
- the data analysis client terminal 20 may arrange one or more generated metacluster nodes so as to form a predetermined number of rows and / or columns, as shown in the metacluster chart 603 of FIG.
- one or more generated metacluster nodes may be arranged in a grid pattern.
- the data analysis client terminal 20 forms the meta-cluster chart from the clustering result display diagram, but the formation of the meta-cluster chart may be executed by the server system 10.
- a user performs a predetermined operation for forming a metacluster chart in order to form a metacluster chart from a certain clustering result display diagram.
- the data analysis client terminal 20 transmits instruction data for generating a meta-cluster chart from the clustering result display diagram to the server system 10 in response to receiving the predetermined operation.
- the server system 10 In response to receiving the instruction data, the server system 10 generates a meta-cluster chart from the clustering result display diagram, and transmits the meta-cluster chart to the data analysis client terminal 20. Then, the data analysis client terminal 20 may display the meta-cluster chart on the output device.
- a plurality of clusters in the clustering result display diagram can be classified into metaclusters consisting of one or more clusters having common characteristics.
- the metacluster in the clustering result display diagram can be associated with the event in the two-dimensional plot, the event belonging to the metacluster can be intuitively grasped.
- the data analysis client terminal 20 identifies an event belonging to the metacluster from the events included in the two-dimensional plot according to the selection of the metacluster in the clustering result display diagram. You may display a two-dimensional plot so that you can.
- the data analysis client terminal 20 may, for example, attach a color commonly assigned to the metacluster to an event belonging to the metacluster in the two-dimensional plot. By displaying such a two-dimensional plot, events belonging to the metacluster can be intuitively grasped, and backgating is also possible.
- step S111 described in (4-1) above the data analysis client terminal 20 outputs the clustering result display FIG. 600 and the two-dimensional plots 630 and 631 based on the output data. It is assumed that it is displayed on the screen.
- the clustering result display diagram 600 is described in (12) above, and the plurality of clusters in the clustering result display diagram can be classified into seven meta-clusters as shown in FIG. 36.
- the user drags the mouse cursor from the position of reference numeral 632 to the position of reference numeral 633 to select the area 634 surrounded by the broken line.
- the metaclusters 611 to 617 that overlap with the region are also selected.
- the data analysis client terminal 20 attaches to each metacluster to the events belonging to each metacluster in the two-dimensional plots 630 and 631, as shown in the figure. Add the color that was used. With this colored display method, events belonging to the metacluster can be intuitively grasped, and backgating is also possible.
- the figure shows an example in which a plurality of metaclusters are selected by a drag operation, for example, one or more metaclusters may be selected by a click operation.
- the events that increase in the selected metacluster may be colored with each metacluster.
- the expression level data of the marker group may be shown by pie display in each node (cluster) of the star chart.
- the larger the expression level of the marker the longer the radial length of the region (pie) corresponding to the marker is displayed.
- the expression levels of a plurality of markers are shown by pie display in the node 700 shown in FIG. 38.
- the expression level of each marker corresponds to the radial length
- the expression level of the marker corresponding to the region indicated by reference numeral 701 corresponds to the radial length 702.
- the length 702 is indicated by an arrow in the figure, such an arrow may not be displayed in the star chart.
- the data analysis client terminal 20 may be configured so that the axis setting of the pie display in each node can be changed.
- the data analysis client terminal 20 may change the axis setting of the pie display so that the axis scale of the pie display at a certain node corresponds to the axis scale of the two-dimensional plot corresponding to the node.
- each node that is a group of events does not have to be a cluster formed by executing clustering.
- Each node may be formed based on a group of events existing in the gate, for example, when a gate is created on the two-dimensional plot.
- Examples of axis scales for 2D plots include Linear scale, Log scale, and Biexponential scale.
- Examples of the axis scale of the display include a Linear scale, a Log scale, and a Biexponential scale.
- the data analysis client terminal 20 may adopt any one of these as the axis scale of the pie display in each node.
- the Biexponential scale is adopted as the axis scale of the two-dimensional plot
- the data analysis client terminal 20 may adopt the Biexponential scale as the axis scale of the pie display of one or more nodes corresponding to the two-dimensional plot. ..
- the data analysis client terminal 20 may be configured to be able to output a setting window for a two-dimensional plot. It is assumed that the data analysis client terminal 20 displays, for example, the two-dimensional plot data 710 shown in FIG. 39 on the output device as output data.
- the data analysis client terminal 20 causes the output device to display the plot setting window 711 in response to the user performing a predetermined operation.
- the plot setting window has areas 712 and 713 for adjusting the X-axis and Y-axis settings of the two-dimensional plot data 710, as shown in the figure.
- the area 712 for setting the X-axis has a list box 714 for selecting the axis scale for the X-axis, as shown in the figure. In the figure, "Biexponential" is displayed, but in the list box, "Linear” and “Log” can be selected in addition to "Biexponential".
- the area 713 for setting the Y-axis also has a list box 715 for selecting the axis scale for the Y-axis. Similarly, the list box is configured so that any one of the three axis scales can be selected.
- the data analysis client terminal 20 is two-dimensional controlled by the plot setting window in response to the axis scale being selected. You can change the axis scale of the pie display for one or more nodes that correspond to the plot. The change is made so that the axis scale of the pie display is the same as the axis scale selected in the plot setting.
- the present disclosure provides the information processing system described above, as well as a server system, a data acquisition client terminal, and a data analysis client terminal included in the information processing system. These details are as described above.
- the information processing method may include one or more of the processes described in (4) above.
- the information processing method is an automatic analysis that generates output data by performing analysis processing on light intensity data acquired by irradiating a biological sample with light or fluorescent label intensity data calculated from the light intensity data.
- the fluorescence is based on the processing step, the analysis result data storage step of storing the output data generated based on the light intensity data or the fluorescent label intensity data, and the analysis command for the output data output to the output device.
- It may include an interactive analysis processing step that analyzes the label intensity data and outputs the analysis result data. The explanation in (4) above applies to each of these steps.
- the present disclosure may also have the following structure.
- An automatic analysis processing unit that generates output data by analysis processing for light intensity data or fluorescent label intensity data acquired by irradiating a biological sample with light, and an automatic analysis processing unit.
- An analysis result data storage unit that stores the output data generated based on the light intensity data or the fluorescent label intensity data
- a server system including an interactive analysis processing unit that analyzes the fluorescent label intensity data based on the analysis command for the output data output to the output device and outputs the analysis result data.
- the server system according to [1] or [2], wherein the processing by the automatic analysis processing unit and the processing by the interactive analysis processing unit are executed on different computing resources.
- the server system secures computing resources for processing by the automatic analysis processing unit and / or processing by the interactive analysis processing unit in response to receiving an analysis start command, [1] to [ The server system according to any one of 3].
- the server system is any one of [1] to [4], further including a database in which analysis setting data used in the processing by the automatic analysis processing unit and / or the processing by the interactive analysis processing unit is stored. The server system described in.
- the server system according to any one of [1] to [5], wherein the server system further includes an optical data storage unit that stores the light intensity data and / or the fluorescent label intensity data.
- the optical data storage unit includes two or more types of storage having different access speeds. The server system migrates the light intensity data and / or the fluorescent label intensity data stored in the storage having a higher access speed to the storage having a lower access speed when a predetermined condition is satisfied.
- the server system according to [6] which executes the process.
- the output data includes at least one of a two-dimensional plot image, a spectrum plot image, a one-dimensional histogram image, a two-dimensional contour plot image, a dimensional compressed image, and a clustering result display diagram, [1] to [7]. ]
- the server system described in any one of. [9] A data acquisition client terminal that acquires light intensity data acquired by irradiating a biological sample with light or acquires fluorescence label intensity data by a calculation process for the light intensity data; and the data transmission from the data acquisition client terminal.
- An optical data storage unit that stores light intensity data or the fluorescent label intensity data
- An automatic analysis processing unit that generates output data by analysis processing of the light intensity data or the fluorescent label intensity data from the above, and an automatic analysis processing unit.
- An analysis result data storage unit that stores the output data generated based on the light intensity data or the fluorescent label intensity data
- An information processing system including a server system including an interactive analysis processing unit that analyzes the fluorescent label intensity data based on an analysis command for the output data output to the output device and outputs analysis result data.
- the data acquisition client terminal transmits the light intensity data or the fluorescent label intensity data to the server system in response to the acquisition of the light intensity data or the fluorescent label intensity data, according to [9].
- Information processing system [11] The data acquisition client terminal performs a predetermined process on the light intensity data or the fluorescent label intensity data in response to the acquisition of the light intensity data or the fluorescent label intensity data, and the processed.
- the information processing system which transmits light intensity data or fluorescent label intensity data to the server system.
- the server system holds analysis setting data used in the processing by the automatic analysis processing unit in advance.
- the automatic analysis processing unit calculates the fluorescent label intensity data from the light intensity data using the analysis setting data.
- the information processing system according to any one of [9] to [11].
- the automatic analysis processing unit executes a process of calculating fluorescent label intensity data from the light intensity data in response to the light intensity data being stored in the light data storage unit, [9] to [12].
- the information processing system described in any one of. [14] The information processing system according to any one of [9] to [13], further including a data analysis client terminal including the output device.
- a data acquisition unit that acquires light intensity data acquired by irradiating a biological sample with light, Including a transmission unit that transmits the light intensity data to the server system in response to the acquisition of the light intensity data.
- the fluorescent label intensity data is calculated from the light intensity data.
- a communication unit that receives output data created by the server system based on the fluorescence label intensity data from the server system, and A processing unit that performs processing to output the output data to the output device, Data analysis client terminal including.
- Information processing system 10 Server system 20 Data analysis client terminal 30 Data acquisition client terminal 40 Biological sample analyzer
Abstract
The main objective of the present disclosure is to provide an information processing system capable of dealing with an increase in the amount of information processing involved in the analysis of a biological sample. The present disclosure provides a server system including: an automatic analysis processing unit which generates output data by means of analysis processing performed with respect to light intensity data or fluorescent label intensity data acquired by shining light on a biological sample; an analysis result data storage unit which stores the output data generated on the basis of the light intensity data or the fluorescent label intensity data; and an interactive analysis processing unit which analyzes the fluorescent label intensity data on the basis of an analysis command relating to the output data output to an output device, and outputs analysis result data. The present disclosure also provides an information processing system including said server system.
Description
本開示は、サーバシステム、情報処理システム、データ取得クライアント端末、データ解析クライアント端末、及び情報処理方法に関し、より特には生体試料に光を照射することで取得される光強度データの処理を実行するサーバシステム、当該サーバシステムを含む情報処理システム、当該情報処理システムに含まれるデータ取得クライアント端末及びデータ解析クライアント端末、並びに、当該処理に関する情報処理方法に関する。
The present disclosure relates to a server system, an information processing system, a data acquisition client terminal, a data analysis client terminal, and an information processing method, and more particularly, processes light intensity data acquired by irradiating a biological sample with light. The present invention relates to a server system, an information processing system including the server system, a data acquisition client terminal and a data analysis client terminal included in the information processing system, and an information processing method related to the processing.
例えば細胞、微生物、及びリポソームなどの粒子集団を蛍光色素によって標識し、当該粒子集団のそれぞれの粒子にレーザ光を照射して励起された蛍光色素から発生する蛍光の強度及び/又はパターンを計測することによって、粒子の特性を測定することが行われている。当該測定を行う粒子分析装置の代表的な例として、フローサイトメータを挙げることができる。
For example, a particle population such as cells, microorganisms, and liposomes is labeled with a fluorescent dye, and each particle of the particle population is irradiated with laser light to measure the intensity and / or pattern of fluorescence generated from the excited fluorescent dye. By doing so, the characteristics of the particles are measured. A flow cytometer can be mentioned as a typical example of a particle analyzer that performs the measurement.
フローサイトメータによって取得されたデータ、特には光強度データの処理に関する技術として、例えば以下の特許文献1には、任意の特定データセットから独立したモデルに従って科学データを処理するためのコンピュータプログラム製品が開示されている。当該コンピュータプログラム製品は、非一時的コンピュータ可読記憶媒体上に存在するデータ発見ノードデータ構造と、 非一時的コンピュータ可読記憶媒体上に存在する複数のプロセッサ実行可能命令と、を備え、前記データ発見ノードデータ構造は特定の仕様を含む。
As a technique for processing data acquired by a flow cytometer, especially light intensity data, for example, Patent Document 1 below describes a computer program product for processing scientific data according to a model independent of any specific data set. It has been disclosed. The computer program product comprises a data discovery node data structure existing on a non-temporary computer readable storage medium and a plurality of processor executable instructions existing on the non-temporary computer readable storage medium. The data structure contains specific specifications.
また、以下の特許文献2には、フローサイトメトリーを用いる試料分析システムが開示されている。当該試料分析システムは、検体に試薬を加えることにより調製された測定試料に含まれる粒子を測定することにより、前記粒子の測定データを取得する測定データ取得部と、測定データの出力態様を示す出力モード情報を取得する出力モード情報取得部と、前記測定データを、前記出力モード情報に応じた出力態様で出力する出力部と、を備える。
Further, Patent Document 2 below discloses a sample analysis system using flow cytometry. The sample analysis system has a measurement data acquisition unit that acquires measurement data of the particles by measuring the particles contained in the measurement sample prepared by adding a reagent to the sample, and an output indicating the output mode of the measurement data. It includes an output mode information acquisition unit that acquires mode information, and an output unit that outputs the measurement data in an output mode corresponding to the output mode information.
フローサイトメトリーにおいて、一度の測定において用いられる蛍光色素の数は増加傾向にあり、これに伴い、前記データ解析工程における情報処理量も増加傾向にある。そのため、前記データ解析工程をこれらの情報処理装置で実行するためには、より高いスペックをこれらの情報処理装置が有することが求められるが、これらの情報処理装置にそのようなスペックを備えることはしばしば現実的ではなく、ユーザにとっても望ましくない。
In flow cytometry, the number of fluorescent dyes used in one measurement is increasing, and the amount of information processing in the data analysis process is also increasing accordingly. Therefore, in order to execute the data analysis process in these information processing devices, it is required that these information processing devices have higher specifications, but it is not possible to provide these information processing devices with such specifications. Often unrealistic and undesirable for the user.
また、フローサイトメトリーにより得られたデータの解析システムの例として、クライアントサーバ方式の解析システムが挙げられる。しかしながら、クライアントサーバ方式の解析システムは、運用コストがかさむ場合がある。この原因として、例えばサーバを使用するユーザがいない状態でもサーバが常時稼働していること、又は、サーバによる解析処理が常時実行可能であることを挙げることができる。
An example of an analysis system for data obtained by flow cytometry is a client-server analysis system. However, the client-server analysis system may increase the operating cost. As a cause of this, for example, the server is always running even when there is no user who uses the server, or the analysis process by the server can be executed at all times.
また、クライアントサーバ方式の解析システムには、処理速度に関する課題も存在する。例えば、同時に解析を実行するユーザ数の増大に伴いコンピューテーションリソースが枯渇して処理が遅延しうる。また、例えば次元圧縮処理又はクラスタリング処理などの一度に多量のコンピューテーションリソースが要求される処理を高速に実現することが難しい場合もある。
In addition, the client-server analysis system also has a problem related to processing speed. For example, as the number of users who execute analysis at the same time increases, the computing resources may be exhausted and the processing may be delayed. In addition, it may be difficult to realize high-speed processing that requires a large amount of computing resources at one time, such as dimensional compression processing or clustering processing.
そこで、本開示は、これらの課題の少なくとも1つを解決するための技法を提供することを主目的とする。本開示の目的は、これに限定されず、例えば本明細書内以下で記載されるいずれか1つ以上の課題を解決することであってもよい。
Therefore, the main purpose of this disclosure is to provide a technique for solving at least one of these problems. The object of the present disclosure is not limited to this, and may be, for example, to solve any one or more of the problems described below in the present specification.
本開示は、
生体試料に光を照射することで取得される光強度データ又は蛍光標識強度データに対する解析処理により出力用データを生成する自動解析処理部と、
前記光強度データ又は前記蛍光標識強度データに基づき生成された前記出力用データを記憶する解析結果データ記憶部と、
出力装置に出力された前記出力用データに対する解析コマンドに基づき前記蛍光標識強度データを解析して解析結果データを出力する対話型解析処理部と
を含むサーバシステムを提供する。
前記自動解析処理部は、前記光強度データから蛍光標識強度データを算出してよい。
前記自動解析処理部による処理及び前記対話型解析処理部による処理は、互いに異なるコンピューテーションリソース上で実行されてよい。
前記サーバシステムは、前記自動解析処理部による処理及び/又は前記対話型解析処理部による処理のためのコンピューテーションリソースを、解析開始コマンドを受信したことに応じて確保してよい。
前記サーバシステムは、前記自動解析処理部による処理及び/又は前記対話型解析処理部による処理において用いられる解析設定データが保存されるデータベースをさらに含みうる。
前記サーバシステムは、前記光強度データ及び/又は前記蛍光標識強度データを記憶する光データ記憶部をさらに含みうる。
前記光データ記憶部は、アクセス速度の異なる2種類以上のストレージを含んでよく、
前記サーバシステムは、アクセス速度がより高いストレージに格納されている前記光強度データ及び/又は前記蛍光標識強度データを、所定の条件が満たされた場合に、アクセス速度がより低いストレージへと移行する処理を実行しうる。
前記出力用データは、二次元プロット画像、スペクトルプロット画像、一次元ヒストグラム画像、二次元等高線プロット画像、次元圧縮画像、及びクラスタリング結果表示図のうちの少なくとも一つを含みうる。 This disclosure is
An automatic analysis processing unit that generates output data by analysis processing for light intensity data or fluorescent label intensity data acquired by irradiating a biological sample with light, and an automatic analysis processing unit.
An analysis result data storage unit that stores the output data generated based on the light intensity data or the fluorescent label intensity data, and
Provided is a server system including an interactive analysis processing unit that analyzes the fluorescent label intensity data based on an analysis command for the output data output to the output device and outputs the analysis result data.
The automatic analysis processing unit may calculate fluorescent label intensity data from the light intensity data.
The processing by the automatic analysis processing unit and the processing by the interactive analysis processing unit may be executed on different computing resources.
The server system may reserve computing resources for processing by the automatic analysis processing unit and / or processing by the interactive analysis processing unit in response to receiving an analysis start command.
The server system may further include a database in which analysis setting data used in the processing by the automatic analysis processing unit and / or the processing by the interactive analysis processing unit is stored.
The server system may further include an optical data storage unit that stores the light intensity data and / or the fluorescent label intensity data.
The optical data storage unit may include two or more types of storage having different access speeds.
The server system migrates the light intensity data and / or the fluorescent label intensity data stored in the storage having a higher access speed to the storage having a lower access speed when a predetermined condition is satisfied. The process can be executed.
The output data may include at least one of a two-dimensional plot image, a spectral plot image, a one-dimensional histogram image, a two-dimensional contour plot image, a dimensional compressed image, and a clustering result display diagram.
本開示は、生体試料に光を照射することで取得される光強度データを取得する又は当該光強度データに対する算出処理によって蛍光標識強度データを取得するデータ取得クライアント端末;及び
前記データ取得クライアント端末から送信された前記光強度データ又は前記蛍光標識強度データを記憶する光データ記憶部と、
前記光強度データから蛍光標識強度データを算出する自動解析処理部と、
前記光強度データ又は前記蛍光標識強度データに基づき生成された前記出力用データを記憶する解析結果データ記憶部と、
出力装置に出力された前記出力用データに対する解析コマンドに基づき前記蛍光標識強度データを解析して解析結果データを出力する対話型解析処理部と、を含むサーバシステム
を含む情報処理システムを提供する。
前記データ取得クライアント端末は、前記光強度データ又は前記蛍光標識強度データを取得したことに応じて、前記光強度データ又は前記蛍光標識強度データを前記サーバシステムへと送信しうる。
前記データ取得クライアント端末は、前記光強度データ又は前記蛍光標識強度データを取得したことに応じて、前記光強度データ又は前記蛍光標識強度データに対して所定の処理を行い、そして、当該処理された光強度データ又は前記蛍光標識強度データを前記サーバシステムへと送信しうる。
前記サーバシステムは、前記自動解析処理部による処理において用いられる解析設定データを予め保有してよく、
前記自動解析処理部は、当該解析設定データを用いて、前記光強度データから前記蛍光標識強度データを算出してよい。
前記自動解析処理部は、前記光強度データが前記光データ記憶部に格納されたことに応じて、当該光強度データから蛍光標識強度データを算出する処理を実行しうる。
前記情報処理システムは、前記出力装置を含むデータ解析クライアント端末をさらに含んでよい。
前記データ解析クライアント端末は、前記出力装置に出力された前記出力用データに対する前記解析コマンドを、前記サーバシステムへ送信しうる。
前記データ解析クライアント端末は、前記出力用データが表示されるウィンドウを前記出力装置に出力させ、当該ウィンドウにて、前記解析コマンドの入力を受け付けうる。
複数のデータ解析クライアント端末が、前記サーバシステム内の光強度データ、蛍光強度データ及び解析設定データのうちのいずれか1つ以上を共有することができてよい。
複数のデータ取得クライアント端末が、前記サーバシステム内の解析設定データを共有することができてよい。 The present disclosure is a data acquisition client terminal that acquires light intensity data acquired by irradiating a biological sample with light or acquires fluorescence label intensity data by calculation processing for the light intensity data; and from the data acquisition client terminal. An optical data storage unit that stores the transmitted light intensity data or the fluorescent label intensity data, and
An automatic analysis processing unit that calculates fluorescent label intensity data from the light intensity data,
An analysis result data storage unit that stores the output data generated based on the light intensity data or the fluorescent label intensity data, and
Provided is an information processing system including a server system including an interactive analysis processing unit that analyzes the fluorescent label intensity data and outputs analysis result data based on an analysis command for the output data output to the output device.
The data acquisition client terminal may transmit the light intensity data or the fluorescent label intensity data to the server system in response to the acquisition of the light intensity data or the fluorescent label intensity data.
The data acquisition client terminal performs a predetermined process on the light intensity data or the fluorescent label intensity data in response to the acquisition of the light intensity data or the fluorescent label intensity data, and the processed. The light intensity data or the fluorescent label intensity data can be transmitted to the server system.
The server system may hold analysis setting data used in the processing by the automatic analysis processing unit in advance.
The automatic analysis processing unit may calculate the fluorescent label intensity data from the light intensity data using the analysis setting data.
The automatic analysis processing unit can execute a process of calculating fluorescent label intensity data from the light intensity data in response to the light intensity data being stored in the optical data storage unit.
The information processing system may further include a data analysis client terminal including the output device.
The data analysis client terminal may transmit the analysis command for the output data output to the output device to the server system.
The data analysis client terminal can output the window in which the output data is displayed to the output device, and can accept the input of the analysis command in the window.
A plurality of data analysis client terminals may share any one or more of the light intensity data, the fluorescence intensity data, and the analysis setting data in the server system.
A plurality of data acquisition client terminals may be able to share the analysis setting data in the server system.
また、本開示は、生体試料に光を照射することで取得される光強度データを取得するデータ取得部と、
前記光強度データを取得したことに応じて、前記光強度データをサーバシステムへと送信する送信部とを含み、
前記サーバシステムにおいて、前記光強度データから蛍光標識強度データを算出する、
データ取得クライアント端末を提供する。 Further, the present disclosure includes a data acquisition unit that acquires light intensity data acquired by irradiating a biological sample with light, and a data acquisition unit.
Including a transmission unit that transmits the light intensity data to the server system in response to the acquisition of the light intensity data.
In the server system, the fluorescent label intensity data is calculated from the light intensity data.
Provides a data acquisition client terminal.
また、本開示は、サーバシステムが蛍光標識強度データに基づき作成した出力用データを当該サーバシステムから受信する通信部と、
当該出力用データを出力装置に出力させる処理を行う処理部と、
を含むデータ解析クライアント端末を提供する。
前記データ解析クライアント端末は、前記出力用データが表示されるウィンドウを前記出力装置に出力させ、当該ウィンドウにて、当該出力用データに対する解析コマンドの入力を受け付けてよい。 Further, the present disclosure includes a communication unit that receives output data created by the server system based on the fluorescence label intensity data from the server system.
A processing unit that performs processing to output the output data to the output device,
Provides a data analysis client terminal including.
The data analysis client terminal may output a window in which the output data is displayed to the output device, and may accept input of an analysis command for the output data in the window.
また、本開示は、生体試料に光を照射することで取得される光強度データ又は当該光強度データから算出された蛍光標識強度データに対する解析処理を行って出力用データを生成する自動解析処理工程と、
前記光強度データ又は前記蛍光標識強度データに基づき生成された前記出力用データを記憶する解析結果データ記憶工程と、
出力装置に出力された前記出力用データに対する解析コマンドに基づき前記蛍光標識強度データを解析して解析結果データを出力する対話型解析処理工程と
を含む情報処理方法を提供する。 Further, the present disclosure is an automatic analysis processing step for generating output data by performing analysis processing on light intensity data acquired by irradiating a biological sample with light or fluorescent labeling intensity data calculated from the light intensity data. When,
An analysis result data storage step for storing the output data generated based on the light intensity data or the fluorescent label intensity data, and
Provided is an information processing method including an interactive analysis processing step of analyzing the fluorescent label intensity data based on an analysis command for the output data output to the output device and outputting the analysis result data.
以下、本開示を実施するための好適な形態について説明する。なお、以下に説明する実施形態は、本開示の代表的な実施形態を示したものであり、本開示の範囲がこれらの実施形態のみに限定されることはない。なお、本開示の説明は以下の順序で行う。
1.情報処理システム
(1)関連技術の説明
(2)情報処理システムの概要
(3)情報処理システムに含まれる構成要素
(3-1)サーバシステム
(3-2)データ解析クライアント端末
(3-3)データ取得クライアント端末
(3-4)生体試料分析装置
(4)情報処理システムによる処理フローの例
(4-1)自動解析処理
(4-2)自動解析処理の例
(4-3)出力用データ取得処理
(4-4)対話型解析処理
(4-5)対話型解析処理の例
(5)リージョンの設定
(6)データ移行
(7)外部のストレージ又はコンピューテーションリソースの利用
(8)解析対象データの分割
(9)データの共有
(10)出力用データの統一
(11)クラスタリング結果表示図の出力制御の例1
(12)クラスタリング結果表示図の出力制御の例2
(13)クラスタリング結果表示図中のメタクラスタと二次元プロットとの関連付け
(14)スターチャート中のパイ表示軸の制御
2.情報処理方法 Hereinafter, suitable embodiments for carrying out the present disclosure will be described. The embodiments described below show typical embodiments of the present disclosure, and the scope of the present disclosure is not limited to these embodiments. The explanations of the present disclosure will be given in the following order.
1. 1. Information processing system (1) Explanation of related technologies (2) Outline of information processing system (3) Components included in information processing system (3-1) Server system (3-2) Data analysis client terminal (3-3) Data acquisition client terminal (3-4) Biological sample analyzer (4) Example of processing flow by information processing system (4-1) Automatic analysis processing (4-2) Example of automatic analysis processing (4-3) Data for output Acquisition process (4-4) Interactive analysis process (4-5) Example of interactive analysis process (5) Region setting (6) Data migration (7) Use of external storage or compute resources (8) Analysis Division of target data (9) Data sharing (10) Unification of output data (11) Example of output control of clustering result display diagram 1
(12) Example 2 of output control of clustering result display diagram
(13) Association of meta-clusters in the clustering result display diagram with the two-dimensional plot (14) Control of the pie display axis in thestar chart 2. Information processing method
1.情報処理システム
(1)関連技術の説明
(2)情報処理システムの概要
(3)情報処理システムに含まれる構成要素
(3-1)サーバシステム
(3-2)データ解析クライアント端末
(3-3)データ取得クライアント端末
(3-4)生体試料分析装置
(4)情報処理システムによる処理フローの例
(4-1)自動解析処理
(4-2)自動解析処理の例
(4-3)出力用データ取得処理
(4-4)対話型解析処理
(4-5)対話型解析処理の例
(5)リージョンの設定
(6)データ移行
(7)外部のストレージ又はコンピューテーションリソースの利用
(8)解析対象データの分割
(9)データの共有
(10)出力用データの統一
(11)クラスタリング結果表示図の出力制御の例1
(12)クラスタリング結果表示図の出力制御の例2
(13)クラスタリング結果表示図中のメタクラスタと二次元プロットとの関連付け
(14)スターチャート中のパイ表示軸の制御
2.情報処理方法 Hereinafter, suitable embodiments for carrying out the present disclosure will be described. The embodiments described below show typical embodiments of the present disclosure, and the scope of the present disclosure is not limited to these embodiments. The explanations of the present disclosure will be given in the following order.
1. 1. Information processing system (1) Explanation of related technologies (2) Outline of information processing system (3) Components included in information processing system (3-1) Server system (3-2) Data analysis client terminal (3-3) Data acquisition client terminal (3-4) Biological sample analyzer (4) Example of processing flow by information processing system (4-1) Automatic analysis processing (4-2) Example of automatic analysis processing (4-3) Data for output Acquisition process (4-4) Interactive analysis process (4-5) Example of interactive analysis process (5) Region setting (6) Data migration (7) Use of external storage or compute resources (8) Analysis Division of target data (9) Data sharing (10) Unification of output data (11) Example of output control of clustering result display diagram 1
(12) Example 2 of output control of clustering result display diagram
(13) Association of meta-clusters in the clustering result display diagram with the two-dimensional plot (14) Control of the pie display axis in the
1.情報処理システム
1. 1. Information processing system
(1)関連技術の説明
(1) Explanation of related technologies
フローサイトメータは、例えば蛍光計測の光学系の観点から、フィルタ型及びスペクトル型に大別されうる。フィルタ型のフローサイトメータは、目的の蛍光色素から目的の光情報のみを取り出すため、図1の1に示されるような構成を採用しうる。具体的には、粒子への光照射により生じた光を、例えばダイクロイックミラーなどの波長分離手段DMで複数に分岐させ、異なるフィルタを通し、そして、分岐したそれぞれの光を、複数の検出器、例えば光電子増倍管PMTなどにより計測する。すなわち、フィルタ型のフローサイトメータでは、各蛍光色素に対応した波長帯域毎の蛍光検出を、各蛍光色素に対応する検出器を用いて行うことで多色の蛍光検出を行っている。その際、蛍光波長が近接した複数の蛍光色素が用いられる場合は、より正確な蛍光量を算出するために蛍光補正処理が行われうる。
The flow cytometer can be roughly classified into a filter type and a spectral type, for example, from the viewpoint of an optical system for fluorescence measurement. Since the filter type flow cytometer extracts only the target optical information from the target fluorescent dye, the configuration as shown in 1 of FIG. 1 can be adopted. Specifically, the light generated by irradiating the particles with light is branched into a plurality of particles by a wavelength separation means DM such as a dichroic mirror, passed through different filters, and each of the branched lights is divided into a plurality of detectors. For example, it is measured by a photomultiplier tube PMT or the like. That is, in the filter type flow cytometer, multicolor fluorescence detection is performed by performing fluorescence detection for each wavelength band corresponding to each fluorescent dye using a detector corresponding to each fluorescent dye. At that time, when a plurality of fluorescent dyes having close fluorescence wavelengths are used, a fluorescence correction process can be performed in order to calculate a more accurate fluorescence amount.
スペクトル型フローサイトメータは、粒子への光照射により生じた光の検出により得られた蛍光データを、染色に使用した蛍光色素のスペクトル情報によりデコンボリューション(Unmixing)することで、各粒子の蛍光量を分析する。図1の2に示されるように、スペクトル型フローサイトメータは、プリズム分光光学素子Pを使って蛍光を分光する。また、スペクトル型フローサイトメータ、当該分光された蛍光を検出するために、フィルタ型フローサイトメータが有する多数の光検出器の代わりに、アレイ型検出器、例えばアレイ型光電子増倍管PMTなどを備えている。スペクトル型フローサイトメータは、フィルタ型フローサイトメータと比べて、蛍光の漏れ込みの影響を回避しやすく、複数の蛍光色素を用いた分析により適している。
The spectral flow cytometer unmixes the fluorescence data obtained by detecting the light generated by irradiating the particles with light based on the spectral information of the fluorescent dye used for staining, thereby decomposing the fluorescence amount of each particle. To analyze. As shown in 2 of FIG. 1, the spectral type flow cytometer uses a prism spectroscopic optical element P to disperse fluorescence. Further, in order to detect the spectral type flow cytometer and the spectroscopic fluorescence, an array type detector such as an array type photomultiplier tube PMT is used instead of a large number of photodetectors included in the filter type flow cytometer. I have. The spectral type flow cytometer is easier to avoid the influence of fluorescence leakage than the filter type flow cytometer, and is more suitable for analysis using a plurality of fluorescent dyes.
近年、基礎医学及び臨床分野において、網羅的解釈を進めるために、フローサイトメトリーにおいても、複数の蛍光色素を使用したマルチカラー解析が普及してきている。一度のマルチカラー解析において用いられる蛍光色素の数は増加傾向にある。一度の測定で多数の蛍光色素を使用すると、フィルタ型フローサイトメータでは、上記のとおり、それぞれの検出器に、目的とする蛍光色素以外の蛍光色素からの蛍光が漏れ込み、分析精度が低下する。色数が多い場合には、スペクトル型フローサイトメータを用いることにより、蛍光の漏れ込みの問題を解消することができる。
In recent years, in the fields of basic medicine and clinical practice, multicolor analysis using multiple fluorescent dyes has become widespread in flow cytometry in order to promote comprehensive interpretation. The number of fluorescent dyes used in one multicolor analysis is on the rise. When a large number of fluorescent dyes are used in one measurement, in the filter type flow cytometer, as described above, fluorescence from fluorescent dyes other than the target fluorescent dye leaks to each detector, and the analysis accuracy is lowered. .. When the number of colors is large, the problem of fluorescence leakage can be solved by using a spectral flow cytometer.
フローサイトメータを用いた実験フローの例を、以下で図2を参照しながら説明する。
An example of an experimental flow using a flow cytometer will be described below with reference to FIG.
フローサイトメータを用いた実験の流れは大きく分類すると、実験対象となる細胞と、それ検出するための方法を検討し蛍光指標付き抗体試薬を準備する実験計画工程(図2「1:Plan」)と、実際に細胞を測定に適した状態に染色し準備するサンプル準備工程(同図「2:Preparation」)と、染色された細胞一つ一つの蛍光量をフローサイトメータで測定するFCM測定工程(同図「3:FCM」)と、FCM測定で記録されたデータから所望の分析結果が得られるよう各種データ処理を行うデータ解析工程(同図「4:Data Analysis」)により構成される。そして、これらの工程が、必要に応じて繰り返し行われうる。
The flow of experiments using a flow cytometer can be broadly classified into an experiment planning process in which cells to be tested and methods for detecting them are examined and an antibody reagent with a fluorescence index is prepared (Fig. 2 "1: Plan"). A sample preparation step (“2: Preparation” in the same figure) that actually stains and prepares cells in a state suitable for measurement, and an FCM measurement step that measures the amount of fluorescence of each stained cell with a flow cytometer. (Fig. "3: FCM") and a data analysis process (Fig. "4: Data Analysis") that performs various data processing so that desired analysis results can be obtained from the data recorded by FCM measurement. Then, these steps can be repeated as needed.
前記実験計画工程では、はじめにフローサイトメータを用いて検出したいと考えている微小粒子(主に細胞)をどの分子(例えば抗原又はサイトカインなど)の発現で判定するかを決定し、すなわち微小粒子の検出において用いるマーカーを決定する。当該決定は、例えば過去の実験結果や論文などの情報を基に行われうる。次にそのマーカーに対し、どの蛍光色素により検出するかを検討する。同時に検出したいマーカー数、使用可能なFCM装置のスペック、購入可能な蛍光標識付き試薬、蛍光色素のスペクトルや明るさ、価格、納期などの情報を統合的に判断し、実際の実験に必要な蛍光標識付き抗体試薬の組み合わせを決定する。この試薬の組合せの決定プロセスは、一般的にFCMにおけるパネルデザインと呼ばれている。
In the design of experiments, the flow cytometer is used to first determine which molecule (eg, antigen or cytokine) expression is used to determine which molecule (eg, antigen or cytokine) the microparticles (mainly cells) that one wants to detect are to be detected, that is, the microparticles. Determine which marker to use for detection. The decision can be made on the basis of information such as past experimental results and papers. Next, for the marker, it is examined which fluorescent dye is used for detection. Information such as the number of markers to be detected at the same time, the specifications of the FCM device that can be used, the reagents with fluorescent labels that can be purchased, the spectrum and brightness of the fluorescent dye, the price, and the delivery date are comprehensively judged, and the fluorescence required for the actual experiment is determined. Determine the combination of labeled antibody reagents. The process of determining this reagent combination is commonly referred to as panel design in FCM.
サンプル準備工程では、まず実験対象をFCM測定に適した状態へと処理する。例えば、細胞の分離及び精製が行われうる。例えば血液由来の免疫細胞などは、血液から溶血処理及び密度勾配遠心法により赤血球を除去し、白血球を抽出する。抽出された対象の細胞群に対し、蛍光標識付き抗体を用い染色処理を行う。
In the sample preparation process, the experimental object is first processed into a state suitable for FCM measurement. For example, cell separation and purification can be performed. For example, for blood-derived immune cells, erythrocytes are removed from blood by hemolysis treatment and density gradient centrifugation to extract leukocytes. The extracted cell group of the target is stained with a fluorescently labeled antibody.
FCM測定工程において、微小粒子を光学的に分析する際は、先ず、フローサイトメータの光照射部の光源から励起光を出射し、流路内を流れる微小粒子に照射する。次に、微小粒子から発せられた蛍光をフローサイトメータの検出部により検出する。具体的には、ダイクロイックミラーやバンドパスフィルターなどを使用して、微小粒子から発せられた光から特定波長の光(目的とする蛍光)のみを分離し、それを例えばPMTなどの検出器で検出する。このとき、例えばプリズムや回折格子などを使用して蛍光を分光し、32チャンネルPMTなどの検出器などを用いて、各チャンネルで異なる波長の光を検出するようにする。これにより、容易に検出光(蛍光)のスペクトラム情報を得ることができる。
フローサイトメータは、FCM測定で取得された各微粒子の蛍光情報を、蛍光情報以外の散乱光情報、時間情報、及び位置情報と併せて記録する機能を有しうる。当該記録機能は、主にコンピュータのメモリ又はディスクにより実行されうる。通常の細胞解析では1つの実験条件において、数千~数百万個の微小粒子の分析を行う為、多数の情報を実験条件ごとに整理された状態で記録されることが必要である。 In the FCM measurement step, when optically analyzing fine particles, first, excitation light is emitted from the light source of the light irradiation unit of the flow cytometer, and the fine particles flowing in the flow path are irradiated. Next, the fluorescence emitted from the fine particles is detected by the detection unit of the flow cytometer. Specifically, using a dichroic mirror, bandpass filter, etc., only light of a specific wavelength (target fluorescence) is separated from the light emitted from fine particles, and it is detected by a detector such as PMT. do. At this time, for example, a prism or a diffraction grating is used to disperse the fluorescence, and a detector such as a 32-channel PMT is used to detect light having a different wavelength in each channel. Thereby, the spectrum information of the detected light (fluorescence) can be easily obtained.
The flow cytometer may have a function of recording the fluorescence information of each fine particle acquired by the FCM measurement together with the scattered light information, the time information, and the position information other than the fluorescence information. The recording function may be performed primarily by computer memory or disk. In normal cell analysis, thousands to millions of fine particles are analyzed under one experimental condition, so it is necessary to record a large amount of information in an organized state for each experimental condition.
データ解析工程では、コンピュータなどを用いて、FCM測定工程で検出した各波長領域の光強度データを定量化し、使用した蛍光色素ごとの蛍光量(強度)を求める。この解析には実験データから算出された基準を使用した補正方法が用いられる。基準は、一つの蛍光色素のみで染色した微小粒子の測定データと、無染色の微小粒子の測定データの2種類を用い、統計処理によって算出する。算出された蛍光量は、蛍光分子名、測定日、微小粒子の種類等の情報と共に、当該コンピュータに備えられているデータ記録部に記録されうる。データ解析で見積もられたサンプルの蛍光量(蛍光スペクトルデータ)は保存され、目的に応じてグラフで表示して微小粒子の蛍光量分布の解析が行われる。
In the data analysis step, the light intensity data in each wavelength region detected in the FCM measurement step is quantified using a computer or the like, and the fluorescence amount (intensity) for each fluorescent dye used is obtained. A correction method using a standard calculated from experimental data is used for this analysis. The standard is calculated by statistical processing using two types of measurement data of fine particles stained with only one fluorescent dye and measurement data of unstained fine particles. The calculated fluorescence amount can be recorded in a data recording unit provided in the computer together with information such as a fluorescent molecule name, a measurement date, and a type of fine particles. The fluorescence amount (fluorescence spectrum data) of the sample estimated by the data analysis is saved, and is displayed as a graph according to the purpose to analyze the fluorescence amount distribution of the fine particles.
例えば、蛍光量分布の解析のために、しばしばゲート設定が行われ、これによりサンプル中の検出対象細胞の割合が、算出されうる。例えば図3に示されるように、前方散乱光(FSC)及び側方散乱光(SSC)に関する二次元プロットを生成し、当該プロットのうち所定の範囲を選択することで、PBMCに含まれる血液細胞のうちの単球及びリンパ球の割合を特定することができる。さらに、所定の表面マーカーを発現しているリンパ球に対するゲート設定及び展開によって、リンパ球のうちのB細胞、T細胞、及びNK細胞の割合を算出することができる。さらに、B細胞のうちのメモリーB細胞の割合や、T細胞のうちのキラーT細胞及びヘルパーT細胞の割合、さらにはナイーブT細胞及びメモリーT細胞の割合を特定することもできる。各種類の細胞が発現している表面マーカーは、例えば図4に示されるとおり、細胞種によって異なることが知られている。そのため、表面マーカーに結合する抗体及び各抗体を標識する蛍光色素を適切に選択し、そして、フローサイトメータによって分析することで、サンプル中の細胞を調べることができる。
For example, gate setting is often performed for analysis of fluorescence amount distribution, whereby the ratio of cells to be detected in the sample can be calculated. For example, as shown in FIG. 3, a two-dimensional plot for forward scattered light (FSC) and lateral scattered light (SSC) is generated, and a predetermined range of the plots is selected to contain blood cells contained in PBMC. The proportion of monocytes and lymphocytes among them can be specified. Furthermore, the proportion of B cells, T cells, and NK cells among lymphocytes can be calculated by gate setting and expansion for lymphocytes expressing a predetermined surface marker. Furthermore, it is also possible to specify the ratio of memory B cells among B cells, the ratio of killer T cells and helper T cells among T cells, and the ratio of naive T cells and memory T cells. It is known that the surface markers expressed by each type of cell differ depending on the cell type, for example, as shown in FIG. Therefore, the cells in the sample can be examined by appropriately selecting the antibody that binds to the surface marker and the fluorescent dye that labels each antibody, and analyzing by a flow cytometer.
本開示に従う情報処理システム及び当該システムに含まれる構成要素は、前記データ解析工程における解析のために用いられうる。
The information processing system according to the present disclosure and the components included in the system can be used for analysis in the data analysis process.
(2)情報処理システムの概要
(2) Overview of information processing system
前記データ解析工程における情報処理は、例えばフローサイトメータに付属の情報処理装置又はフローサイトメータを利用するユーザの情報処理装置によって行われている。しかしながら、上記で述べたとおり、フローサイトメトリーにおいて、一度の測定において用いられる蛍光色素の数は増加傾向にあり、これに伴い、前記データ解析工程における情報処理量も増加傾向にある。そのため、前記データ解析工程をこれらの情報処理装置で実行するためには、より高いスペックをこれらの情報処理装置が有することが求められる。この傾向は、計算負荷の大きな次元圧縮処理やクラスタリング処理などのいわゆるAdvanced解析手法の実行時に特に顕著となる。しかしながら、これらの情報処理装置にそのようなスペックを備えることはしばしば現実的ではなく、ユーザにとっても望ましくない。
Information processing in the data analysis process is performed by, for example, an information processing device attached to the flow cytometer or a user's information processing device using the flow cytometer. However, as described above, in flow cytometry, the number of fluorescent dyes used in one measurement tends to increase, and the amount of information processing in the data analysis step also tends to increase accordingly. Therefore, in order to execute the data analysis process in these information processing devices, it is required that these information processing devices have higher specifications. This tendency becomes particularly remarkable when executing so-called Advanced analysis methods such as dimensional compression processing and clustering processing, which have a large computational load. However, it is often impractical and undesirable for users to equip these information processing devices with such specifications.
そこで、前記データ解析工程における情報処理を、クライアントサーバ方式の解析システム、特にはクラウドを利用したクライアントサーバ方式の解析システムによって実行することができれば、ユーザにとって望ましいと考えられる。
また、上記で述べたとおり、クライアントサーバ方式の解析システムは、しばしば運用コストがかさむ。加えて、当該解析システムには、処理速度に関する課題も存在する。 Therefore, it is considered desirable for the user if the information processing in the data analysis process can be executed by the client-server type analysis system, particularly the client-server type analysis system using the cloud.
Further, as described above, the client-server analysis system often has a high operating cost. In addition, the analysis system also has a problem regarding processing speed.
本発明者らは、特定のサーバシステムによって、これらの課題の少なくとも一つを解決することができることを見出した。すなわち、本開示は、生体試料に光を照射することで取得される光強度データ又は蛍光標識強度データに対する解析処理により出力用データを生成する自動解析処理部と、前記光強度データ又は前記蛍光標識強度データに基づき生成された前記出力用データを記憶する解析結果データ記憶部と、出力装置に出力された前記出力用データに対する解析コマンドに基づき前記蛍光標識強度データを解析して解析結果データを出力する対話型解析処理部とを含むサーバシステム、及び、当該サーバシステムを含む情報処理システムを提供する。
当該サーバシステムが前記自動解析処理部及び対話型解析処理部を含むことによって、サーバシステムにおいてデータ解析工程を実行することができる。また、前記対話型解析処理部によって、出力装置に出力された出力用データをユーザが確認しながら解析処理を実行し又は解析設定を調整することができるので、所望の解析結果を取得しやすい。
また、当該サーバシステムが、前記自動解析処理部及び対話型解析処理部による処理を必要な場合にだけ実行することにより、運用コストを削減することもできる。また、本明細書内以下で説明する構成によって、当該サーバシステムの処理速度の向上も可能である。 The present inventors have found that a specific server system can solve at least one of these problems. That is, the present disclosure comprises an automatic analysis processing unit that generates output data by analysis processing for light intensity data or fluorescent label intensity data acquired by irradiating a biological sample with light, and the light intensity data or the fluorescent label. The analysis result data storage unit that stores the output data generated based on the intensity data and the fluorescent label intensity data are analyzed based on the analysis command for the output data output to the output device, and the analysis result data is output. A server system including an interactive analysis processing unit and an information processing system including the server system are provided.
When the server system includes the automatic analysis processing unit and the interactive analysis processing unit, the data analysis process can be executed in the server system. Further, since the interactive analysis processing unit can execute the analysis process or adjust the analysis settings while the user confirms the output data output to the output device, it is easy to obtain the desired analysis result.
Further, the operation cost can be reduced by executing the processing by the automatic analysis processing unit and the interactive analysis processing unit only when the server system is required. Further, the processing speed of the server system can be improved by the configuration described below in the present specification.
以下では、本開示に従う情報処理システムの構成例を、図5を参照しながら説明する。
Hereinafter, a configuration example of the information processing system according to the present disclosure will be described with reference to FIG.
図5に示される情報処理システム1は、サーバシステム10、データ解析クライアント端末20、データ取得クライアント端末30、及び生体試料分析装置40を含む。
The information processing system 1 shown in FIG. 5 includes a server system 10, a data analysis client terminal 20, a data acquisition client terminal 30, and a biological sample analysis device 40.
サーバシステム10は、データ解析クライアント端末20及びデータ取得クライアント端末30と、ネットワーク50を介して接続されていてよい。ネットワーク50は、データの送受信が行われる通信網であってよく、例えばインターネット、衛星通信網、電話回線網、若しくは移動体通信網(例えば4G又は5G回線網など)であってよく、又はこれらの組合せであってもよい。
The server system 10 may be connected to the data analysis client terminal 20 and the data acquisition client terminal 30 via the network 50. The network 50 may be a communication network through which data is transmitted and received, and may be, for example, the Internet, a satellite communication network, a telephone line network, or a mobile communication network (for example, a 4G or 5G line network), or any of these. It may be a combination.
データ解析クライアント端末20及びデータ取得クライアント端末30は、例えば有線又は無線により接続されていてよく、又は、ネットワーク50を介して接続されていてもよい。
The data analysis client terminal 20 and the data acquisition client terminal 30 may be connected, for example, by wire or wirelessly, or may be connected via a network 50.
生体粒子分析装置40は、データ取得クライアント端末30と例えば有線又は無線により接続されていてよい。
The bioparticle analyzer 40 may be connected to the data acquisition client terminal 30 by, for example, wired or wireless.
(3)情報処理システムに含まれる構成要素
以下で、本開示に従う情報処理システムに含まれる要素についてそれぞれ説明する。 (3) Components included in the information processing system The elements included in the information processing system according to the present disclosure will be described below.
以下で、本開示に従う情報処理システムに含まれる要素についてそれぞれ説明する。 (3) Components included in the information processing system The elements included in the information processing system according to the present disclosure will be described below.
(3-1)サーバシステム
(3-1) Server system
サーバシステム10について図6を参照しながら説明する。図6は、同システムの機能構成の例を示すブロック図である。サーバシステム10は、自動解析処理部11、対話型解析処理部12、出力用データ生成部13、接続部14、光データ記憶部15、解析結果データ記憶部16、及びデータベース17を含んでよい。
The server system 10 will be described with reference to FIG. FIG. 6 is a block diagram showing an example of the functional configuration of the system. The server system 10 may include an automatic analysis processing unit 11, an interactive analysis processing unit 12, an output data generation unit 13, a connection unit 14, an optical data storage unit 15, an analysis result data storage unit 16, and a database 17.
本開示の一つの実施態様において、自動解析処理部11は、生体試料に光を照射することで取得される光強度データから蛍光標識強度データを算出してよい。当該光強度データは、データ取得クライアント端末30からサーバシステム10に送信された光強度データであってよい。当該光強度データは、光データ記憶部15に格納されてよく、自動解析処理部11は、光データ記憶部15から当該光強度データを取得しうる。
本開示の他の実施態様において、自動解析処理部11は、当該算出処理を行わなくてもよい。すなわち、データ取得クライアント端末30が、光強度データから蛍光標識強度データを算出する処理を実行し、そして、データ取得クライアント端末30が当該蛍光標識強度データをサーバシステム10に送信してもよい。 In one embodiment of the present disclosure, the automaticanalysis processing unit 11 may calculate the fluorescent label intensity data from the light intensity data acquired by irradiating the biological sample with light. The light intensity data may be light intensity data transmitted from the data acquisition client terminal 30 to the server system 10. The light intensity data may be stored in the optical data storage unit 15, and the automatic analysis processing unit 11 can acquire the light intensity data from the optical data storage unit 15.
In another embodiment of the present disclosure, the automaticanalysis processing unit 11 does not have to perform the calculation processing. That is, the data acquisition client terminal 30 may execute a process of calculating the fluorescent label intensity data from the light intensity data, and the data acquisition client terminal 30 may transmit the fluorescent label intensity data to the server system 10.
本開示の他の実施態様において、自動解析処理部11は、当該算出処理を行わなくてもよい。すなわち、データ取得クライアント端末30が、光強度データから蛍光標識強度データを算出する処理を実行し、そして、データ取得クライアント端末30が当該蛍光標識強度データをサーバシステム10に送信してもよい。 In one embodiment of the present disclosure, the automatic
In another embodiment of the present disclosure, the automatic
自動解析処理部11は、前記光強度データから蛍光標識強度データを算出する処理を実行しうる。自動解析処理部11は、サーバシステム10が予め保有している解析設定データを用いて当該算出処理を実行しうる。当該解析設定データは、例えば、データ解析クライアント端末20又はデータ取得クライアント端末30から事前に(特には当該算出処理の実行前に)送信されたものであってよい。
The automatic analysis processing unit 11 can execute a process of calculating the fluorescent label intensity data from the light intensity data. The automatic analysis processing unit 11 can execute the calculation process using the analysis setting data previously possessed by the server system 10. The analysis setting data may be, for example, transmitted in advance from the data analysis client terminal 20 or the data acquisition client terminal 30 (particularly before the execution of the calculation process).
自動解析処理部11は、前記光強度データに対して、例えば蛍光補正処理又はアンミキシング処理を行って蛍光標識強度データを算出する。アンミキシング処理は、蛍光分離処理とも呼ばれる。
The automatic analysis processing unit 11 performs, for example, fluorescence correction processing or unmixing processing on the light intensity data to calculate fluorescence labeling intensity data. The unmixing process is also called a fluorescence separation process.
自動解析処理部11は、好ましくは、当該アンミキシング処理を、スペクトラルリファレンスデータを用いて実行する。前記アンミキシング処理において用いられるスペクトラルリファレンスデータは、粒子を標識している蛍光色素に所定の励起光が照射されたときに生じる蛍光のスペクトルデータを含む。前記アンミキシング処理において用いられるスペクトラルリファレンスデータは、所定波長を有する光を、粒子を標識している蛍光色素に照射したときに生じる蛍光のスペクトルデータと、前記所定波長と異なる波長を有する光を、粒子を標識している蛍光色素に照射したときに生じる蛍光のスペクトルデータと、を含んでよい。
The automatic analysis processing unit 11 preferably executes the unmixing process using the spectral reference data. The spectral reference data used in the unmixing process includes spectral data of fluorescence generated when a fluorescent dye labeling the particles is irradiated with a predetermined excitation light. The spectral reference data used in the unmixing process includes spectrum data of fluorescence generated when light having a predetermined wavelength is irradiated on a fluorescent dye labeling particles, and light having a wavelength different from the predetermined wavelength. Fluorescent spectral data generated when the fluorescent dye labeling the particles is irradiated may be included.
前記スペクトラルリファレンスデータは、予めサーバシステム10内のいずれかの記憶部又はデータベースに格納されていてよく、例えばデータベース17に格納されていてよい。特には後述のメタデータの一つとして格納されていてよい。自動解析処理部11は、スペクトラルリファレンスデータを、例えばデータベース17から取得し、そして、当該取得したスペクトラルリファレンスデータを用いて前記アンミキシング処理を実行しうる。
The spectral reference data may be stored in any storage unit or database in the server system 10 in advance, and may be stored in, for example, the database 17. In particular, it may be stored as one of the metadata described later. The automatic analysis processing unit 11 can acquire spectral reference data from, for example, a database 17, and execute the unmixing process using the acquired spectral reference data.
自動解析処理部11は、前記アンミキシング処理を、例えば最小二乗法(Least Square Method, LSM)、より好ましくは重み付き最小二乗法(Weighted Least Square Method, WLSM)を用いて行いうる。最小二乗法を用いたアンミキシング処理は、例えば、特許第5985140号公報に記載された蛍光強度補正方法を用いて行われてよい。当該蛍光強度補正方法は、例えば以下のWLSMの数式(1)を用いて行われうる。

上記数式(1)において、xnはn番目の蛍光色素の蛍光強度を示し、[ST]はスペクトラルリファレンスの転置行列を示し、[L]は重み行列を示し、[S]はスペクトラルリファレンスの行列を示し、yiはi番目の光検出器での測定値を示し、λiはi番目の光検出器での重みを示し、max(yi,0)はi番目の検出器の検出値とゼロとを比較し大きい値を示し、offset’は各検出器の検出値に基づいて決定される値を示す。 The automaticanalysis processing unit 11 may perform the unmixing process using, for example, a least squares method (Least Square Method, LSM), more preferably a weighted least squares method (WLSM). The unmixing process using the least squares method may be performed, for example, by using the fluorescence intensity correction method described in Japanese Patent No. 5985140. The fluorescence intensity correction method can be performed using, for example, the following WLSM mathematical formula (1).
In the above formula (1), x n indicates the fluorescence intensity of the nth fluorescent dye, [ ST ] indicates the transposed matrix of the spectral reference, [L] indicates the weight matrix, and [S] indicates the spectral reference. The matrix is shown, y i shows the measured value at the i-th photodetector, λ i shows the weight at the i-th photodetector, and max (y i , 0) shows the detection of the i-th detector. The value is compared with zero to indicate a large value, and offset'indicates a value determined based on the detection value of each detector.
上記数式(1)において、xnはn番目の蛍光色素の蛍光強度を示し、[ST]はスペクトラルリファレンスの転置行列を示し、[L]は重み行列を示し、[S]はスペクトラルリファレンスの行列を示し、yiはi番目の光検出器での測定値を示し、λiはi番目の光検出器での重みを示し、max(yi,0)はi番目の検出器の検出値とゼロとを比較し大きい値を示し、offset’は各検出器の検出値に基づいて決定される値を示す。 The automatic
In the above formula (1), x n indicates the fluorescence intensity of the nth fluorescent dye, [ ST ] indicates the transposed matrix of the spectral reference, [L] indicates the weight matrix, and [S] indicates the spectral reference. The matrix is shown, y i shows the measured value at the i-th photodetector, λ i shows the weight at the i-th photodetector, and max (y i , 0) shows the detection of the i-th detector. The value is compared with zero to indicate a large value, and offset'indicates a value determined based on the detection value of each detector.
蛍光色素の蛍光波長分布は広い場合がある。そのため、例えば或る蛍光色素から生じた蛍光を検出するために用いられるPMTが、他の蛍光色素から生じた蛍光も検出しうる。すなわち、各PMTにより取得される光データは、複数の蛍光色素からの蛍光データが重畳したデータでありうる。そこで、当該光データを、各蛍光色素からの蛍光データへと分離するための補正が必要となる。前記アンミキシング処理は、当該補正のための手法であり、前記アンミキシング処理によって、複数の蛍光色素からの蛍光標識強度データが重畳したデータが、各蛍光色素からの蛍光標識強度データへと分離されて、各蛍光色素からの蛍光標識強度データが得られる。
The fluorescence wavelength distribution of the fluorescent dye may be wide. Therefore, for example, the PMT used for detecting the fluorescence generated from a certain fluorescent dye can also detect the fluorescence generated from another fluorescent dye. That is, the optical data acquired by each PMT may be data in which fluorescence data from a plurality of fluorescent dyes are superimposed. Therefore, it is necessary to make corrections to separate the optical data into fluorescence data from each fluorescent dye. The unmixing process is a method for the correction, and the data on which the fluorescent label intensity data from a plurality of fluorescent dyes are superimposed is separated into the fluorescent label intensity data from each fluorescent dye by the unmixing process. Therefore, fluorescent label intensity data from each fluorescent dye can be obtained.
自動解析処理部11は、前記蛍光標識強度データに対して解析処理を行う。自動解析処理部11は、当該解析処理によって、解析結果データを生成する。解析結果データから、出力用データが生成されうる。当該出力用データは、データ解析クライアント端末20へと送信され、そして、データ解析クライアント端末20が出力装置に当該出力用データを出力させる。当該出力装置は、例えば表示装置であってよい。当該出力装置は、ユーザが後述の解析コマンドを入力することができるように構成されうる。
The automatic analysis processing unit 11 performs analysis processing on the fluorescent label intensity data. The automatic analysis processing unit 11 generates analysis result data by the analysis processing. Output data can be generated from the analysis result data. The output data is transmitted to the data analysis client terminal 20, and the data analysis client terminal 20 causes the output device to output the output data. The output device may be, for example, a display device. The output device may be configured so that the user can input the analysis command described later.
自動解析処理部11は、好ましくは、光強度データが光データ記憶部15に格納されたことに応じて、当該光強度データから蛍光標識強度データを算出する処理を実行する。そして、自動解析処理部11は、当該蛍光標識強度データを解析して、解析結果データを生成しうる。さらに、自動解析処理部11は、当該解析結果データから出力用データを生成しうる。例えば、自動解析処理部11は、光データ記憶部15へ光強度データが格納されたことに応じて、当該自動解析処理を開始してよい。すなわち、自動解析処理部11は、当該格納をトリガーとするイベントドリブンの解析処理を実行してよい。
The automatic analysis processing unit 11 preferably executes a process of calculating fluorescent label intensity data from the light intensity data in response to the light intensity data being stored in the optical data storage unit 15. Then, the automatic analysis processing unit 11 can analyze the fluorescent label intensity data and generate analysis result data. Further, the automatic analysis processing unit 11 can generate output data from the analysis result data. For example, the automatic analysis processing unit 11 may start the automatic analysis processing in response to the light intensity data being stored in the optical data storage unit 15. That is, the automatic analysis processing unit 11 may execute the event-driven analysis processing triggered by the storage.
自動解析処理部11は、光データ記憶部15へ光強度データが格納されたことに応じて、自動解析処理のためのコンピューテーションリソースを確保する。すなわち、自動解析処理部11は、当該格納を解析開始コマンドの受信として取り扱い、当該受信に応じてコンピューテーションをサーバシステム10内に確保しうる。自動解析処理部11は、当該確保されたコンピューテーションリソースを用いて、蛍光標識強度データの算出処理、蛍光標識強度データの解析処理、及び、解析結果データからの出力用データの生成処理を実行しうる。
The automatic analysis processing unit 11 secures a computation resource for the automatic analysis processing in response to the light intensity data being stored in the optical data storage unit 15. That is, the automatic analysis processing unit 11 can treat the storage as the reception of the analysis start command, and secure the computation in the server system 10 in response to the reception. The automatic analysis processing unit 11 uses the secured computation resource to execute a calculation process of fluorescent label intensity data, an analysis process of fluorescent label intensity data, and a process of generating output data from the analysis result data. Can be done.
対話型解析処理部12は、出力装置に出力された出力用データに対する解析コマンドに基づき前記蛍光標識強度データを解析して解析結果データを生成しうる。当該出力用データは、自動解析処理部11によって生成された出力用データであってよく、又は、後述の出力用データ生成部13によって取得又は生成された出力用データであってもよい。
The interactive analysis processing unit 12 can analyze the fluorescent label intensity data based on the analysis command for the output data output to the output device and generate the analysis result data. The output data may be output data generated by the automatic analysis processing unit 11, or may be output data acquired or generated by the output data generation unit 13 described later.
対話型解析処理部12は、光強度データから蛍光標識強度データを算出する処理を実行してもよい。そして、当該算出された蛍光標識強度データを、前記解析コマンドに基づき解析して解析結果データを生成してもよい。そして、対話型解析処理部12は、当該生成された解析結果データから出力用データを生成しうる。
The interactive analysis processing unit 12 may execute a process of calculating the fluorescent label intensity data from the light intensity data. Then, the calculated fluorescent label intensity data may be analyzed based on the analysis command to generate analysis result data. Then, the interactive analysis processing unit 12 can generate output data from the generated analysis result data.
対話型解析処理部12は、対話型解析処理部12による処理のためのコンピューテーションリソースを、解析開始コマンドを受信したことに応じて確保してよい。当該確保後、対話型解析処理部12は、データ解析クライアント端末20から解析コマンドが送信されるまで待機する。
上記で述べたとおり、自動解析処理部11は、自動解析処理部による処理のためのコンピューテーションリソースを、解析開始コマンドを受信したことに応じて確保し、対話型解析処理部12も、対話型解析処理部12による処理のためのコンピューテーションリソースを、解析開始コマンドを受信したことに応じて確保しうる。そのため、本開示において、前記自動解析処理部による処理及び前記対話型解析処理部による処理は、互いに異なるコンピューテーションリソース上で実行されてよい。 The interactiveanalysis processing unit 12 may secure a computation resource for processing by the interactive analysis processing unit 12 in response to receiving the analysis start command. After the securing, the interactive analysis processing unit 12 waits until the analysis command is transmitted from the data analysis client terminal 20.
As described above, the automaticanalysis processing unit 11 secures computing resources for processing by the automatic analysis processing unit in response to receiving the analysis start command, and the interactive analysis processing unit 12 also has a dialogue. Compute resources for processing by the type analysis processing unit 12 can be secured according to the reception of the analysis start command. Therefore, in the present disclosure, the processing by the automatic analysis processing unit and the processing by the interactive analysis processing unit may be executed on different computing resources.
上記で述べたとおり、自動解析処理部11は、自動解析処理部による処理のためのコンピューテーションリソースを、解析開始コマンドを受信したことに応じて確保し、対話型解析処理部12も、対話型解析処理部12による処理のためのコンピューテーションリソースを、解析開始コマンドを受信したことに応じて確保しうる。そのため、本開示において、前記自動解析処理部による処理及び前記対話型解析処理部による処理は、互いに異なるコンピューテーションリソース上で実行されてよい。 The interactive
As described above, the automatic
対話型解析処理部12は、データ解析クライアント端末20から送信された解析コマンドを受信したことに応じて、蛍光標識強度データの算出処理、蛍光標識強度データの解析処理、及び、解析結果データからの出力用データの生成処理を実行しうる。これらの処理は、当該解析コマンドの受信をトリガーとするイベントドリブンの解析処理であってよい。すなわち、本技術に従う対話型解析処理は、イベント駆動型の解析処理であってよい。
The interactive analysis processing unit 12 receives the analysis command transmitted from the data analysis client terminal 20, and responds to the calculation process of the fluorescent label intensity data, the analysis process of the fluorescent label intensity data, and the analysis result data. Output data generation processing can be executed. These processes may be event-driven analysis processes triggered by the reception of the analysis command. That is, the interactive analysis process according to the present technique may be an event-driven analysis process.
対話型解析処理部12は、蛍光標識強度データの算出処理、蛍光標識強度データの解析処理、及び、解析結果データからの出力用データの生成処理を、自動解析処理部11によるこれらの処理と同じように実行してよい。
The interactive analysis processing unit 12 performs the calculation processing of the fluorescence labeling intensity data, the analysis processing of the fluorescence labeling intensity data, and the generation processing of output data from the analysis result data, which are the same as those processing by the automatic analysis processing unit 11. You may do this.
接続部14は、サーバシステム10(特には対話型解析処理部12)とデータ解析クライアント端末20との間における対話型処理において、RPC(Remote Procedure Call)を実行するための機能要素である。例えば、接続部14は、データ解析クライアント端末20において入力された解析コマンドを、サーバシステム10において実行させる。
The connection unit 14 is a functional element for executing RPC (Remote Procedure Call) in the interactive processing between the server system 10 (particularly the interactive analysis processing unit 12) and the data analysis client terminal 20. For example, the connection unit 14 causes the server system 10 to execute the analysis command input in the data analysis client terminal 20.
出力用データ生成部13は、解析結果データ記憶部16に格納されている解析結果データから出力用データを生成しうる。そして、出力用データ生成部13は、当該出力用データを、データ解析クライアント端末20に送信する。 出力用データ生成部13による処理のために要求されるコンピューテーションリソースは小さい。そのため、サーバシステムの運用コストを低減することが可能である。
The output data generation unit 13 can generate output data from the analysis result data stored in the analysis result data storage unit 16. Then, the output data generation unit 13 transmits the output data to the data analysis client terminal 20. The computing resources required for processing by the output data generation unit 13 are small. Therefore, it is possible to reduce the operating cost of the server system.
出力用データ生成部13による処理は、サーバシステム10内の、常時稼働している仮想サーバにより実行されてよい。当該仮想サーバが常時稼働していることによって、出力用データ取得処理を、サーバ起動にともなう待ち時間なく高速に実行することができる。
また、出力用データ生成部13は、サーバレスアーキテクチャとして構成されてもよい。 The process by the outputdata generation unit 13 may be executed by a virtual server in the server system 10 that is always running. Since the virtual server is always running, the output data acquisition process can be executed at high speed without waiting time for starting the server.
Further, the outputdata generation unit 13 may be configured as a serverless architecture.
また、出力用データ生成部13は、サーバレスアーキテクチャとして構成されてもよい。 The process by the output
Further, the output
光データ記憶部15は、光強度データ及び/又は蛍光標識強度データを記憶する。光データ記憶部15は、光強度データを記憶する光強度データ記憶部及び蛍光標識強度データを記憶する蛍光標識強度データ記憶部の2つを含んでもよい。
The optical data storage unit 15 stores light intensity data and / or fluorescent label intensity data. The optical data storage unit 15 may include two units, a light intensity data storage unit for storing light intensity data and a fluorescent label intensity data storage unit for storing fluorescent label intensity data.
解析結果データ記憶部16は、自動解析処理部11によって蛍光標識強度データに基づき生成された解析結果データ及び/又は対話型解析処理部12によって蛍光標識強度データに基づき生成された解析結果データを記憶する。さらに、解析結果データ記憶部16は、これらの解析結果データからそれぞれ生成された出力用データを記憶する。
The analysis result data storage unit 16 stores the analysis result data generated based on the fluorescent label intensity data by the automatic analysis processing unit 11 and / or the analysis result data generated based on the fluorescent label intensity data by the interactive analysis processing unit 12. do. Further, the analysis result data storage unit 16 stores output data generated from each of these analysis result data.
データベース17は、各種メタデータを格納してよい。前記メタデータは、解析設定データを含んでよい。特には、データベース17は、前記自動解析処理部による処理及び/又は前記対話型解析処理部による処理において用いられる解析設定データを保存してよい。
例えば当該解析設定データは、光強度データの解析処理において参照され又は用いられる付属データを含んでよい。当該付属データは、例えば生体試料自体に関するデータ及び/又は生体試料の分析設定に関するデータを含みうる。
また、当該解析設定データは、例えば、光強度データから蛍光標識強度データを算出するために用いられるデータ(例えばスペクトラルリファレンスデータを含む)、及び/又は、蛍光強度標識データに対する解析処理において用いられるデータ(例えば解析コマンドを含む)を含みうる。 Thedatabase 17 may store various metadata. The metadata may include analysis setting data. In particular, the database 17 may store analysis setting data used in the processing by the automatic analysis processing unit and / or the processing by the interactive analysis processing unit.
For example, the analysis setting data may include ancillary data referred to or used in the analysis process of light intensity data. The ancillary data may include, for example, data on the biological sample itself and / or data on analytical settings for the biological sample.
Further, the analysis setting data is, for example, data used for calculating fluorescence label intensity data from light intensity data (including, for example, spectral reference data) and / or data used in analysis processing for fluorescence intensity label data. Can include (including, for example, parsing commands).
例えば当該解析設定データは、光強度データの解析処理において参照され又は用いられる付属データを含んでよい。当該付属データは、例えば生体試料自体に関するデータ及び/又は生体試料の分析設定に関するデータを含みうる。
また、当該解析設定データは、例えば、光強度データから蛍光標識強度データを算出するために用いられるデータ(例えばスペクトラルリファレンスデータを含む)、及び/又は、蛍光強度標識データに対する解析処理において用いられるデータ(例えば解析コマンドを含む)を含みうる。 The
For example, the analysis setting data may include ancillary data referred to or used in the analysis process of light intensity data. The ancillary data may include, for example, data on the biological sample itself and / or data on analytical settings for the biological sample.
Further, the analysis setting data is, for example, data used for calculating fluorescence label intensity data from light intensity data (including, for example, spectral reference data) and / or data used in analysis processing for fluorescence intensity label data. Can include (including, for example, parsing commands).
メタデータの構成の例を図7及び8を参照して説明する。
An example of the metadata structure will be described with reference to FIGS. 7 and 8.
図7に示されるとおり、メタデータに含まれるプロジェクトデータ(図7におけるproject)は、例えばユーザにより任意に設定されるプロジェクト単位を特定するものであってよい。
As shown in FIG. 7, the project data (project in FIG. 7) included in the metadata may specify, for example, a project unit arbitrarily set by the user.
メタデータは、プロジェクトデータ、既定の蛍光色素データ、任意に設定される蛍光色素データ、スペクトラルリファレンスデータ、自家蛍光データ、及び装置設定データのうちの1つ以上を含んでよい。
例えば、1つのプロジェクトデータに、既定の蛍光色素データ(図7におけるFluorochrome(preset))、任意に設定される蛍光色素データ(Fluorochrome(custom))、スペクトラルリファレンスデータ(Spectral Reference)、自家蛍光データ(Autofluorescence)、及び装置設定データ(Instrument Settings)のうちの1つ以上のデータが関連付けられていてよい。
前記既定の蛍光色素データは、前記プロジェクトデータが用いられるデータ解析において共通して利用される1つ以上の蛍光色素に関するデータ(例えば蛍光色素名データなど)を含む。
前記任意に設定される蛍光色素データは、前記プロジェクトデータが用いられるデータ解析において、例えば実験毎又はサンプル毎にユーザによって任意に選択される蛍光色素に関するデータ(例えば蛍光色素名データなど)を含む。
前記スペクトラルリファレンスデータは、前記既定の蛍光色素データ及び前記任意に設定される蛍光色素データに含まれる蛍光色素それぞれのスペクトラルリファレンスのデータを含む。
前記自家蛍光データは、前記プロジェクトデータを用いて解析される生体試料の自家蛍光に関するデータを含む。
前記装置設定データは、前記プロジェクトデータを用いて解析される生体試料の光強度データを取得した生体試料分析装置の、分析における設定に関するデータを含む。
1つのプロジェクトデータに関連付けられるこれらのデータの数は、1つ又は複数であってよい。例えば、1つのプロジェクトデータに、1つ又は2以上の既定の蛍光色素データが関連付けられていてよい。 The metadata may include one or more of project data, default fluorescent dye data, optionally set fluorescent dye data, spectral reference data, autofluorescent data, and device setting data.
For example, the default fluorescent dye data (Fluorochrome (preset) in FIG. 7), the fluorescent dye data arbitrarily set (Fluorochrome (custom)), the spectral reference data (Spectral Reference), and the autofluorescent data (autofluorescent data) are included in one project data. Autofluorescence), and one or more data of device setting data (Instrument Settings) may be associated.
The default fluorescent dye data includes data on one or more fluorescent dyes commonly used in data analysis in which the project data is used (eg, fluorescent dye name data, etc.).
The arbitrarily set fluorescent dye data includes data related to a fluorescent dye arbitrarily selected by the user for each experiment or sample in the data analysis in which the project data is used (for example, fluorescent dye name data).
The spectral reference data includes the spectral reference data of each of the fluorescent dyes contained in the predetermined fluorescent dye data and the arbitrarily set fluorescent dye data.
The autofluorescence data includes data on autofluorescence of a biological sample analyzed using the project data.
The device setting data includes data related to the setting in the analysis of the biological sample analyzer that has acquired the light intensity data of the biological sample analyzed using the project data.
The number of these data associated with one project data may be one or more. For example, one project data may be associated with one or more default fluorescent dye data.
メタデータは、実験データを含んでよい。例えば、1つのプロジェクトデータに、1つ又は2つ以上の実験データ(図7におけるExperiment)が関連付けられていてよい。各実験データは、例えば実験名データ、実験データを作成したユーザ名データ、及び実験データが作成された日時のデータのうちの1つ以上を含んでよい。
Metadata may include experimental data. For example, one project data may be associated with one or more experimental data (Experiment in FIG. 7). Each experiment data may include, for example, one or more of experiment name data, user name data for which the experiment data was created, and date and time data for which the experiment data was created.
メタデータは、プレートデータを含んでよい。例えば、1つの実験データに、1つ又は2つ以上のプレートデータ(図7におけるplate)が関連付けられていてよい。各プレートデータは、例えば生体試料分析装置による分析対象となるプレート(特にはウェルプレート又はマイクロタイタープレート)を特定するデータを含み、例えばプレート名、プレートデータを作成したユーザ名データ、プレートデータが作成された日時のデータ、及びプレートの種類データのうちの1つ以上を含んでよい。
Metadata may include plate data. For example, one experimental data may be associated with one or more plate data (plate in FIG. 7). Each plate data includes, for example, data that identifies a plate (particularly a well plate or a microtiter plate) to be analyzed by a biological sample analyzer, for example, a plate name, a user name data that created the plate data, and plate data are created. It may include one or more of the date and time data and the plate type data.
メタデータは、試料グループデータを含んでよい。例えば、1つのプレートデータに、1つ又は2つ以上の試料グループデータ(図7におけるSample Group)が関連付けられていてよい。各試料グループデータは、例えば、各プレートデータに含まれる生体試料の集団を特定するデータを含み、例えば試料グループ名データ、試料グループデータを作成したユーザ名データ、及び試料グループデータが作成された日時データのうちの1つ以上を含んでよい。
Metadata may include sample group data. For example, one plate data may be associated with one or more sample group data (Sample Group in FIG. 7). Each sample group data includes, for example, data for specifying a group of biological samples included in each plate data, for example, sample group name data, user name data for creating sample group data, and date and time when sample group data was created. It may contain one or more of the data.
メタデータはプロトコルデータを含んでよい。
例えば、試料グループデータのそれぞれに、プロトコルデータ(図7におけるProtocol)が関連付けられていてよい。例えば複数の試料グループデータに対して、同じプロトコルデータが関連付けられていてよく、又は、互いに異なるプロトコルデータが関連付けられていてもよい。
各プロトコルデータは、例えば生体試料の分析プロトコルを特定するデータを含み、例えば、アンミキシング設定データ(Unmixing Config)、蛍光色素設定データ(Color Palette)、装置設定データ(Measurement Settings)、及び共通ワークシート設定データ(Shared Worksheet)のうちの1つ以上を含んでよい。
前記アンミキシング設定データは、アンミキシング処理の仕方(例えばアンミキシングマトリックスの設定又は計算手法など)を特定するデータを含んでよい。
前記蛍光色素設定データは、蛍光色素の生体分子への割り当てに関するデータを含んでよく、例えばパネルデザインの結果を含んでよい。
前記装置設定データは、生体試料分析装置による分析の設定に関するデータを含んでよい。
前記ワークシート設定データは、1つの試料グループデータに含まれる生体試料全てに対して共通して適用される解析設定に関するデータを含んでよい。例えば、前記ワークシート設定データは、1つの試料グループデータに含まれる生体試料全てに対して共通して適用されるゲート設定データを含んでよい。 Metadata may include protocol data.
For example, protocol data (Protocol in FIG. 7) may be associated with each of the sample group data. For example, the same protocol data may be associated with a plurality of sample group data, or different protocol data may be associated with each other.
Each protocol data includes, for example, data that identifies the analysis protocol of a biological sample, for example, unmixing config data (Unmixing Config), fluorescent dye setting data (Color Palette), device setting data (Measurement Settings), and a common worksheet. It may include one or more of the setting data (Shared Worksheet).
The unmixing setting data may include data that specifies a method of unmixing processing (for example, setting of an unmixing matrix or a calculation method).
The fluorescent dye setting data may include data regarding the allocation of the fluorescent dye to a biomolecule, and may include, for example, the result of a panel design.
The device setting data may include data relating to the setting of analysis by the biological sample analyzer.
The worksheet setting data may include data on analysis settings commonly applied to all biological samples contained in one sample group data. For example, the worksheet setting data may include gate setting data that is commonly applied to all biological samples contained in one sample group data.
1つの試料グループデータに、1つ又は2つ以上の試料データ(図7におけるSample)が関連付けられていてよい。各試料データは、例えば、各試料の解析において適用される個別ワークシート設定データ(Individual Worksheet)、各試料の解析において適用されるアンミキシング設定データ(Sample Unmixing Config)、各試料について測定された光強度データへのデータパス(Raw Data)、及び各試料について測定された光強度データから算出された蛍光標識強度データ(Unmixed Data)のうちの1つ以上を含んでよい。
One sample group data may be associated with one or more sample data (Sample in FIG. 7). Each sample data includes, for example, individual worksheet setting data (Individual Worksheet) applied in the analysis of each sample, unmixing setting data (Sample Unmixing Config) applied in the analysis of each sample, and light measured for each sample. It may include one or more of a data path to intensity data (Raw Data) and fluorescent label intensity data (Unmixed Data) calculated from the light intensity data measured for each sample.
メタデータは、比較ワークシートデータを含んでよい。例えば、1つの実験データに、1つ又は2つ以上の比較ワークシートデータ(図7におけるComparison Worksheet)が関連付けられていてよい。比較ワークシートデータは、各試料データについての解析結果を対比したり又は重ね合わせて表示するために用いられるワークシートデータであってよい。
Metadata may include comparative worksheet data. For example, one experimental data may be associated with one or more comparative worksheet data (Comparison Worksheet in FIG. 7). The comparative worksheet data may be worksheet data used to compare or superimpose the analysis results for each sample data.
図7に示されるデータのうち、ワークシート設定データについて、以下で図8を参照してさらに詳細に説明する。
Of the data shown in FIG. 7, the worksheet setting data will be described in more detail with reference to FIG. 8 below.
図8に示されるとおり、ワークシート設定データは、領域設定データ(図8におけるRegion)、ゲート設定データ(Gate)、軸パラメータ設定データ(Axis Parameter)、プロット設定データ(Plot)、軸目盛設定データ(Axis Tick setting)、及び統計設定データ(Statistic)のうちの1つ、2つ、3つ、4つ、若しくは5つを含んでよく、又は、6つ全てを含んでもよい。
As shown in FIG. 8, the worksheet setting data includes area setting data (Region in FIG. 8), gate setting data (Gate), axis parameter setting data (AxisParameter), plot setting data (Plot), and axis scale setting data. (Axis Tick setting) and one, two, three, four, or five of the statistical setting data (Statistic) may be included, or all six may be included.
前記領域設定データは、ワークシート上に表示されるプロット中のゲートによって設定された領域に関するデータであり、例えばゲートにより規定された蛍光標識強度の範囲及び/又は波長の範囲に関するデータを含む。
The region setting data is data relating to the region set by the gate in the plot displayed on the worksheet, and includes, for example, data relating to the range of fluorescent label intensity and / or the wavelength defined by the gate.
前記ゲート設定データは、例えばワークシート上に表示されるプロット中のゲート設定の種類に関するデータ及び/又はゲートパラメータに関するデータを含む。前記ゲート設定の種類に関するデータは、例えばゲートの形状に関するデータを含み、当該形状は、例えば矩形、線形、多角形、楕円、又は四象限などであってよい。前記ゲートパラメータに関するデータは、例えばゲートの位置及び/又はサイズに関するデータを含んでよい。
The gate setting data includes, for example, data regarding the type of gate setting in the plot displayed on the worksheet and / or data regarding the gate parameter. The data regarding the type of the gate setting includes, for example, data regarding the shape of the gate, and the shape may be, for example, a rectangle, a linear shape, a polygon, an ellipse, or four quadrants. The data regarding the gate parameters may include, for example, data regarding the position and / or size of the gate.
前記軸パラメータ設定データは、例えばワークシート上に表示されるプロットのフィールドの種類に関するデータ及び/又は当該プロットにおいて採用される信号の種類に関するデータを含んでよい。フィールドの種類は、例えば前方散乱光(FSC)、側方散乱光(SSC)、蛍光、波長、チャネル(光検出チャネルの種類又は番号)、イベント数、又は光強度などであってよい。これらフィールドの種類のいずれかが、軸パラメータとして採用されてよい。また、信号の種類に関するデータは、例えば面積、高さ、又は幅に関するデータであってよい。
The axis parameter setting data may include, for example, data regarding the type of plot field displayed on the worksheet and / or data regarding the type of signal adopted in the plot. The field type may be, for example, forward scattered light (FSC), side scattered light (SSC), fluorescence, wavelength, channel (type or number of light detection channel), number of events, light intensity, and the like. Any of these field types may be adopted as the axis parameter. Further, the data regarding the type of signal may be, for example, data regarding area, height, or width.
前記プロット設定データは、ワークシート上に表示されるプロットの種類に関するデータを含んでよい。プロットの種類は、例えばスペクトラルプロット、ヒストグラムプロット、ドットプロット、又は密度プロットなどであってよい。
The plot setting data may include data regarding the type of plot displayed on the worksheet. The plot type may be, for example, a spectral plot, a histogram plot, a dot plot, or a density plot.
前記軸目盛設定データは、ワークシート上に表示されるプロットの軸の目盛に関するデータを含んでよい。当該データは、例えば目盛のスケールに関するデータ、目盛の最大値及び/又は最小値に関するデータ、及び双指数関数に関連付けられた設定であるかに関するデータのうちの1つ以上を含んでよい。
The axis scale setting data may include data related to the axis scale of the plot displayed on the worksheet. The data may include, for example, one or more of data regarding the scale of the scale, data regarding the maximum and / or minimum values of the scale, and whether the setting is associated with a biexponential function.
前記統計設定データは、例えば、ワークシート上に出力される統計量を指定するデータを含んでよい。当該統計量は、例えばイベント数、当該ゲート内イベント数が、親ゲート内イベント数に占める割合(parent%)、当該ゲート内イベント数が、該当する試料の全イベント数に占める割合(total%)、平均値、最大値、最小値、標準偏差、変動係数(CV)、及び中央値のうちの1つ以上であってよい。
The statistical setting data may include, for example, data that specifies a statistic to be output on a worksheet. The statistic includes, for example, the number of events, the ratio of the number of events in the gate to the number of events in the parent gate (parent%), and the ratio of the number of events in the gate to the total number of events in the corresponding sample (total%). , Mean, maximum, minimum, standard deviation, coefficient of variation (CV), and median.
図9に、サーバシステム10を構成するサーバ装置のハードウェア構成例を示す。サーバシステム10は、当該サーバ装置を複数有してよい。また、当該複数のサーバ装置は、1つのデータセンター内に存在してよく、又は、互いに異なる場所又は異なる国に存在する複数のデータセンターに分散されて配置されていてよい。
FIG. 9 shows an example of the hardware configuration of the server device constituting the server system 10. The server system 10 may have a plurality of the server devices. Further, the plurality of server devices may exist in one data center, or may be distributed and arranged in a plurality of data centers located in different places or different countries.
図9に示されるサーバ装置1000は、CPU(Central Processing Unit)1001、RAM1002、及びROM1003を備えている。CPU1001、RAM1002、及びROM1003は、バス1004を介して相互に接続されている。バス1004には、さらに入出力インタフェース1005が接続されている。
The server device 1000 shown in FIG. 9 includes a CPU (Central Processing Unit) 1001, a RAM 1002, and a ROM 1003. The CPU 1001, the RAM 1002, and the ROM 1003 are connected to each other via the bus 1004. An input / output interface 1005 is further connected to the bus 1004.
入出力インタフェース1005には、通信装置1006、記憶装置1007、ドライブ1008、出力部1009、及び入力部1010が接続されている、
A communication device 1006, a storage device 1007, a drive 1008, an output unit 1009, and an input unit 1010 are connected to the input / output interface 1005.
通信装置1006は、サーバ装置1000をネットワーク1011に有線又は無線で接続する。通信装置1006によって、サーバ装置1000は、ネットワーク1011を介して各種データ(例えば画像データなど)を取得することができる。取得したデータは、例えば記憶装置1007に格納されうる。通信装置1006の種類は当業者により適宜選択されてよい。
The communication device 1006 connects the server device 1000 to the network 1011 by wire or wirelessly. The communication device 1006 allows the server device 1000 to acquire various data (for example, image data) via the network 1011. The acquired data can be stored in, for example, the storage device 1007. The type of communication device 1006 may be appropriately selected by those skilled in the art.
記憶装置1007は、オペレーティング・システム、本開示に従う情報処理方法をサーバシステムに実現させるためのプログラム、及び他の種々のプログラム、並びに、画像データ、本開示に従う情報処理方法において用いられる各種データ、及び他の種々のデータが格納されうる。前記オペレーティング・システムは、例えばUNIX(登録商標)系のOS、特にはLINUX(登録商標)、又は、WINDOWS(登録商標)系のOSであってよい。
The storage device 1007 includes an operating system, a program for realizing an information processing method according to the present disclosure in a server system, and various other programs, as well as image data, various data used in the information processing method according to the present disclosure, and various data. Various other data may be stored. The operating system may be, for example, a UNIX®-based OS, particularly a LINUX®-based OS or a WINDOWS®-based OS.
ドライブ1008は、記録媒体に記録されているデータ(例えば光強度データ、蛍光標識強度データ、解析結果データ、又は出力用データなど)又はプログラムを読み出して、RAM1003に出力することができる。記録媒体は、例えば、HDD、SSD、microSDメモリカード、SDメモリカード、又はフラッシュメモリであるが、これらに限定されない。
The drive 1008 can read out the data (for example, light intensity data, fluorescent label intensity data, analysis result data, output data, etc.) or program recorded on the recording medium and output it to the RAM 1003. The recording medium is, for example, an HDD, SSD, microSD memory card, SD memory card, or flash memory, but is not limited thereto.
出力部1009は、出力装置、例えば表示装置が接続されていてよい。入力部1010は、サーバシステム自体を操作するための入力を受け付けうる。
An output device, for example, a display device may be connected to the output unit 1009. The input unit 1010 can accept an input for operating the server system itself.
(3-2)データ解析クライアント端末
(3-2) Data analysis client terminal
データ解析クライアント端末20について図10を参照しながら説明する。図10は、当該端末の機能構成の例を示すブロック図である。データ解析クライアント端末20は、処理部21、解析指示部22、接続部23、出力用データ記憶部24、及び通信部25を含む。
The data analysis client terminal 20 will be described with reference to FIG. FIG. 10 is a block diagram showing an example of the functional configuration of the terminal. The data analysis client terminal 20 includes a processing unit 21, an analysis instruction unit 22, a connection unit 23, an output data storage unit 24, and a communication unit 25.
処理部21は、サーバシステム10から送信された出力用データを、データ解析クライアント端末20に付属の出力装置に出力させる処理を行う。特には、当該出力用データは、当該出力装置(特には表示装置)に表示される画面中のウィンドウに表示される。すなわち、データ解析クライアント端末は、出力用データが出力される出力装置を含んでよい。
The processing unit 21 performs a process of outputting the output data transmitted from the server system 10 to the output device attached to the data analysis client terminal 20. In particular, the output data is displayed in a window on the screen displayed on the output device (particularly, a display device). That is, the data analysis client terminal may include an output device to which output data is output.
解析指示部22は、上記で説明した対話型解析処理の開始リクエストをサーバシステム10に送信する。
また、解析指示部22は、上記で説明した対話型解析処理において用いられる解析コマンドの入力を受け付け、そして、当該解析コマンドをサーバシステム10に送信する。当該解析コマンドは、上記で説明したワークシート設定データを含んでよい。対話型解析処理部12が、当該ワークシート設定データを参照して解析処理を実行し、これにより、当該ワークシート設定データに従う出力用データが生成されうる。このように、本開示に従うデータ解析クライアント端末は、前記出力装置に出力された前記出力用データに対する前記解析コマンドを、前記サーバシステムへ送信するように構成されていてよい。また、本開示に従うデータ解析クライアント端末は、前記出力用データが表示されるウィンドウを前記出力装置に出力させ、当該ウィンドウにて、前記解析コマンドの入力を受け付けるように構成されていてよい。 Theanalysis instruction unit 22 transmits the start request of the interactive analysis process described above to the server system 10.
Further, theanalysis instruction unit 22 accepts the input of the analysis command used in the interactive analysis process described above, and transmits the analysis command to the server system 10. The analysis command may include the worksheet setting data described above. The interactive analysis processing unit 12 executes the analysis process with reference to the worksheet setting data, whereby output data according to the worksheet setting data can be generated. As described above, the data analysis client terminal according to the present disclosure may be configured to transmit the analysis command for the output data output to the output device to the server system. Further, the data analysis client terminal according to the present disclosure may be configured to output a window in which the output data is displayed to the output device and accept the input of the analysis command in the window.
また、解析指示部22は、上記で説明した対話型解析処理において用いられる解析コマンドの入力を受け付け、そして、当該解析コマンドをサーバシステム10に送信する。当該解析コマンドは、上記で説明したワークシート設定データを含んでよい。対話型解析処理部12が、当該ワークシート設定データを参照して解析処理を実行し、これにより、当該ワークシート設定データに従う出力用データが生成されうる。このように、本開示に従うデータ解析クライアント端末は、前記出力装置に出力された前記出力用データに対する前記解析コマンドを、前記サーバシステムへ送信するように構成されていてよい。また、本開示に従うデータ解析クライアント端末は、前記出力用データが表示されるウィンドウを前記出力装置に出力させ、当該ウィンドウにて、前記解析コマンドの入力を受け付けるように構成されていてよい。 The
Further, the
接続部23は、サーバシステム10(特には対話型解析処理部12)とデータ解析クライアント端末20(特には解析指示部22)との間における対話型処理において、RPC(Remote Procedure Call)を実行するための機能要素である。例えば、データ解析クライアント端末20が有する接続部23とサーバシステム10が有する接続部14との組合せが、データ解析クライアント端末20において入力された解析コマンドがサーバシステム10に送信されそして当該解析コマンドがサーバシステム10において実行されることを可能としてよい。
The connection unit 23 executes RPC (Remote Procedure Call) in interactive processing between the server system 10 (particularly the interactive analysis processing unit 12) and the data analysis client terminal 20 (particularly the analysis instruction unit 22). It is a functional element for. For example, the combination of the connection unit 23 of the data analysis client terminal 20 and the connection unit 14 of the server system 10 causes the analysis command input in the data analysis client terminal 20 to be transmitted to the server system 10 and the analysis command to be sent to the server. It may be possible to run on system 10.
出力用データ記憶部24は、サーバシステム10から送信された出力用データを記憶する。
The output data storage unit 24 stores the output data transmitted from the server system 10.
通信部25は、サーバシステム10が蛍光標識強度データに基づき作成した出力用データを当該サーバシステムから受信する。
The communication unit 25 receives the output data created by the server system 10 based on the fluorescent label intensity data from the server system.
図11に、データ解析クライアント端末20のハードウェア構成例を示す。なお、当該端末は、例えば汎用の情報処理装置(特にはコンピュータ)であってもよい。
FIG. 11 shows an example of the hardware configuration of the data analysis client terminal 20. The terminal may be, for example, a general-purpose information processing device (particularly a computer).
図11に示される情報処理装置1100は、CPU(Central Processing Unit)1101、RAM1102、及びROM1103を備えている。CPU1101、RAM1102、及びROM1103は、バス1004を介して相互に接続されている。バス1104には、さらに入出力インタフェース1105が接続されている。
The information processing apparatus 1100 shown in FIG. 11 includes a CPU (Central Processing Unit) 1101, a RAM 1102, and a ROM 1103. The CPU 1101, the RAM 1102, and the ROM 1103 are connected to each other via the bus 1004. An input / output interface 1105 is further connected to the bus 1104.
入出力インタフェース1105には、通信装置1106、記憶装置1107、ドライブ1108、出力部1109、及び入力部1110が接続されている、
A communication device 1106, a storage device 1107, a drive 1108, an output unit 1109, and an input unit 1110 are connected to the input / output interface 1105.
通信装置1106は、情報処理装置1100をネットワーク1111に有線又は無線で接続する。通信装置1106によって、情報処理装置1100は、ネットワーク1111を介して各種データを送信又は受信することができる。例えば、通信装置1106によって、サーバシステム10への各種データ送信又はサーバシステム10からの各種データの受信が行われる。通信装置1106の種類は当業者により適宜選択されてよい。
The communication device 1106 connects the information processing device 1100 to the network 1111 by wire or wirelessly. The communication device 1106 allows the information processing device 1100 to transmit or receive various data via the network 1111. For example, the communication device 1106 transmits various data to the server system 10 or receives various data from the server system 10. The type of communication device 1106 may be appropriately selected by those skilled in the art.
記憶装置1107は、オペレーティング・システム、出力用データ出力部によって出力用データを出力させるためのプログラム、対話型解析処理を実現するためのプログラム、及び他の種々のプログラム、並びに、本開示に従う情報処理において用いられる各種データ、及び他の種々のデータが格納されうる。前記オペレーティング・システムは、例えばUNIX(登録商標)系のOS、特にはLINUX(登録商標)、又は、WINDOWS(登録商標)系のOSであってよい。
The storage device 1107 includes an operating system, a program for outputting output data by an output data output unit, a program for realizing interactive analysis processing, and various other programs, and information processing according to the present disclosure. Various data used in, and various other data may be stored. The operating system may be, for example, a UNIX®-based OS, particularly a LINUX®-based OS or a WINDOWS®-based OS.
ドライブ1108は、記録媒体に記録されているデータ(例えば出力用データなど)又はプログラムを読み出して、RAM1103に出力することができる。記録媒体は、例えば、HDD、SSD、microSDメモリカード、SDメモリカード、又はフラッシュメモリであるが、これらに限定されない。
The drive 1108 can read the data (for example, output data) or the program recorded on the recording medium and output it to the RAM 1103. The recording medium is, for example, an HDD, SSD, microSD memory card, SD memory card, or flash memory, but is not limited thereto.
出力部1109は、出力装置に出力用データを出力させる。当該出力装置は、例えば表示装置であってよい。入力部1110は、例えば対話型解析処理における解析コマンドの入力を受け付ける。入力部1110には、例えばキーボード又はマウスなどの入力装置が接続されていてよく、これら入力装置によって前記解析コマンドの入力が行われうる。
The output unit 1109 causes the output device to output output data. The output device may be, for example, a display device. The input unit 1110 accepts, for example, the input of an analysis command in the interactive analysis process. An input device such as a keyboard or a mouse may be connected to the input unit 1110, and the analysis command may be input by these input devices.
(3-3)データ取得クライアント端末
(3-3) Data acquisition client terminal
データ取得クライアント端末30について図12を参照しながら説明する。図12は、当該端末の機能構成の例を示すブロック図である。データ取得クライアント端末30は、データ取得部31、送信部32、データ処理部33、及びデータ記憶部34を含む。
The data acquisition client terminal 30 will be described with reference to FIG. FIG. 12 is a block diagram showing an example of the functional configuration of the terminal. The data acquisition client terminal 30 includes a data acquisition unit 31, a transmission unit 32, a data processing unit 33, and a data storage unit 34.
データ取得部31は、生体試料分析装置40から送信された測定データを取得する。測定データは、自動解析処理部11による処理の対象となる光強度データを含む。当該光強度データは、生体試料に光を照射することで取得される光強度データであってよい。
The data acquisition unit 31 acquires the measurement data transmitted from the biological sample analyzer 40. The measurement data includes light intensity data to be processed by the automatic analysis processing unit 11. The light intensity data may be light intensity data acquired by irradiating a biological sample with light.
送信部32は、データ取得部31が取得した測定データ(光強度データを含む)又は以下のデータ処理部33による処理後の測定データを、サーバシステム10(特にはサーバシステム10の光データ記憶部15)に送信する。送信部32は、前記測定データに加えて、解析設定データもサーバシステム10に送信しうる。好ましくは、送信部32は、前記光強度データを取得したことに応じて、前記光強度データ、又は、前記光強度データ及び解析設定データをサーバシステムへと送信する。例えば、送信部32は、当該測定データの取得に応じて、当該測定データ又は当該処理後の測定データ(及び解析設定データ)の送信を自動的に開始してよい。このように、本開示に従うデータクライアント端末は、前記光強度データをサーバシステム10に送信してよい。さらに、本開示に従うデータ取得クライアント端末は、前記光強度データを取得したことに応じて、前記光強度データ(及び解析設定データ)をサーバシステム10へと送信するように構成されていてよい。
また、本開示の一つの実施態様において、データ取得クライアント端末30が、前記光強度データから前記蛍光標識強度データを算出する算出処理を実行してもよい。当該算出処理は、上記(3-1)において説明したとおりに実行されてよく、例えば蛍光補正処理又はアンミキシング処理であってよい。この実施態様において、送信部32は、当該蛍光標識強度データ(又は以下のデータ処理部33による処理後の蛍光標識強度データ)をサーバシステム10(特にはサーバシステム10の光データ記憶部15)に送信しうる。このように、本開示に従うデータクライアント端末は、前記蛍光標識強度データをサーバシステム10に送信してよい。さらに、本開示に従うデータ取得クライアント端末は、前記蛍光標識強度データを取得したことに応じて、前記蛍光標識強度データをサーバシステム10へと送信するように構成されていてよい。
また、本開示において、送信部32は、前記測定データ及び前記蛍光標識強度データの両方をサーバシステム10に送信してもよい。 Thetransmission unit 32 uses the measurement data (including the light intensity data) acquired by the data acquisition unit 31 or the measurement data processed by the following data processing unit 33 in the server system 10 (particularly, the optical data storage unit of the server system 10). Send to 15). In addition to the measurement data, the transmission unit 32 can also transmit analysis setting data to the server system 10. Preferably, the transmission unit 32 transmits the light intensity data, or the light intensity data and the analysis setting data to the server system in response to the acquisition of the light intensity data. For example, the transmission unit 32 may automatically start transmitting the measurement data or the measurement data (and analysis setting data) after the processing in response to the acquisition of the measurement data. As described above, the data client terminal according to the present disclosure may transmit the light intensity data to the server system 10. Further, the data acquisition client terminal according to the present disclosure may be configured to transmit the light intensity data (and analysis setting data) to the server system 10 in response to the acquisition of the light intensity data.
Further, in one embodiment of the present disclosure, the dataacquisition client terminal 30 may execute a calculation process for calculating the fluorescent label intensity data from the light intensity data. The calculation process may be executed as described in (3-1) above, and may be, for example, a fluorescence correction process or an unmixing process. In this embodiment, the transmission unit 32 transfers the fluorescent label intensity data (or the fluorescent label intensity data processed by the following data processing unit 33) to the server system 10 (particularly, the optical data storage unit 15 of the server system 10). Can be sent. As described above, the data client terminal according to the present disclosure may transmit the fluorescent label intensity data to the server system 10. Further, the data acquisition client terminal according to the present disclosure may be configured to transmit the fluorescent label intensity data to the server system 10 in response to the acquisition of the fluorescent label intensity data.
Further, in the present disclosure, thetransmission unit 32 may transmit both the measurement data and the fluorescence label intensity data to the server system 10.
また、本開示の一つの実施態様において、データ取得クライアント端末30が、前記光強度データから前記蛍光標識強度データを算出する算出処理を実行してもよい。当該算出処理は、上記(3-1)において説明したとおりに実行されてよく、例えば蛍光補正処理又はアンミキシング処理であってよい。この実施態様において、送信部32は、当該蛍光標識強度データ(又は以下のデータ処理部33による処理後の蛍光標識強度データ)をサーバシステム10(特にはサーバシステム10の光データ記憶部15)に送信しうる。このように、本開示に従うデータクライアント端末は、前記蛍光標識強度データをサーバシステム10に送信してよい。さらに、本開示に従うデータ取得クライアント端末は、前記蛍光標識強度データを取得したことに応じて、前記蛍光標識強度データをサーバシステム10へと送信するように構成されていてよい。
また、本開示において、送信部32は、前記測定データ及び前記蛍光標識強度データの両方をサーバシステム10に送信してもよい。 The
Further, in one embodiment of the present disclosure, the data
Further, in the present disclosure, the
データ取得クライアント端末30は、データ取得部31とは別に、送信部32という機能単位を有することで、データ取得プロセスと、アップロードプロセスとを別々に実行することができる。これにより、生体試料分析装置40からのデータ取得処理に影響を与えることなく、サーバシステム10への測定データ(光強度データを含む)若しくは測定データから算出された蛍光標識強度データ又はこれら両方のデータのアップロードが可能である。
The data acquisition client terminal 30 has a functional unit called a transmission unit 32 in addition to the data acquisition unit 31, so that the data acquisition process and the upload process can be executed separately. As a result, the measurement data (including the light intensity data) to the server system 10, the fluorescent label intensity data calculated from the measurement data, or both of these data, without affecting the data acquisition process from the biological sample analyzer 40. Can be uploaded.
データ処理部33は、データ取得部31によって取得された測定データ及び/又は蛍光標識強度データに対して所定の処理を実行しうる。当該処理は、圧縮処理又はデータ加工処理(例えばフォーマット変換処理)などであってよい。当該データ加工処理によって、測定データ及び/又は蛍光標識強度データを、サーバシステム10における情報処理に適した形式へと変換することができ、サーバシステム10における処理が効率化される。このように、本開示に従うデータ取得クライアント端末は、前記光強度データ又は前記蛍光標識強度データを取得したことに応じて、前記光強度データ又は前記蛍光標識強度データに対して所定の処理を行い、そして、当該処理された光強度データ又は蛍光標識強度データを前記サーバシステムへと送信するように構成されていてよい。
The data processing unit 33 can execute a predetermined process on the measurement data and / or the fluorescent label intensity data acquired by the data acquisition unit 31. The process may be a compression process, a data processing process (for example, a format conversion process), or the like. By the data processing, the measurement data and / or the fluorescent label intensity data can be converted into a format suitable for information processing in the server system 10, and the processing in the server system 10 is streamlined. As described above, the data acquisition client terminal according to the present disclosure performs a predetermined process on the light intensity data or the fluorescent label intensity data in response to the acquisition of the light intensity data or the fluorescent label intensity data. Then, the processed light intensity data or fluorescent label intensity data may be configured to be transmitted to the server system.
データ記憶部34は、前記測定データ又は前記処理後の測定データを記憶しうる。データ記憶部34は、前記蛍光標識強度データ又は前記処理後の蛍光標識強度データを記憶してもよい。
The data storage unit 34 can store the measurement data or the measurement data after the processing. The data storage unit 34 may store the fluorescent label intensity data or the fluorescent label intensity data after the treatment.
データ取得クライアント端末30のハードウェア構成例については、上記(3-2)においてデータ解析クライアント端末20について説明した内容が、当てはまる。なお、データ取得クライアント端末30も、例えば汎用の情報処理装置(特にはコンピュータ)であってもよい。
As for the hardware configuration example of the data acquisition client terminal 30, the content described for the data analysis client terminal 20 in (3-2) above applies. The data acquisition client terminal 30 may also be, for example, a general-purpose information processing device (particularly a computer).
(3-4)生体試料分析装置
(3-4) Biological sample analyzer
生体試料分析装置は、例えば上記で述べたとおりフローサイトメータであってよいが、これに限定されない。生体試料分析装置の構成例を図13に示す。図13に示されるとおり、生体試料分析装置40は、流路Cを流れる生体試料Sに光を照射する光照射部101、前記照射によって生じた光を検出する検出部102、及び前記検出部により検出された光に関する情報を処理する情報処理部103を含む。生体試料分析装置40の例としては、例えばフローサイトメータ及びイメージングサイトメータを挙げることができる。生体試料分析装置40は、生体試料内の特定の生体粒子Pの分取を行う分取部104を含んでもよい。分取部を含む生体試料分析装置40の例としては、例えばセルソータを挙げることができる。
The biological sample analyzer may be, for example, a flow cytometer as described above, but is not limited thereto. FIG. 13 shows a configuration example of the biological sample analyzer. As shown in FIG. 13, the biological sample analyzer 40 includes a light irradiation unit 101 that irradiates the biological sample S flowing through the flow path C with light, a detection unit 102 that detects the light generated by the irradiation, and the detection unit. It includes an information processing unit 103 that processes information about the detected light. Examples of the biological sample analyzer 40 include, for example, a flow cytometer and an imaging cytometer. The biological sample analyzer 40 may include a sorting unit 104 that sorts specific biological particles P in the biological sample. As an example of the biological sample analyzer 40 including the sorting unit, for example, a cell sorter can be mentioned.
(生体試料)
生体試料Sは、生体粒子を含む液状試料であってよい。当該生体粒子は、例えば細胞又は非細胞性生体粒子である。前記細胞は、生細胞であってよく、より具体的な例として、赤血球や白血球などの血液細胞、及び精子や受精卵等生殖細胞を挙げることができる。また前記細胞は全血等検体から直接採取されたものでもよいし、培養後に取得された培養細胞であってもよい。前記非細胞性生体粒子として、細胞外小胞、特にはエクソソーム及びマイクロベシクルなどを挙げることができる。前記生体粒子は、1つ又は複数の標識物質(例えば色素(特には蛍光色素)及び蛍光色素標識抗体など)によって標識されていてもよい。なお、本開示の生体試料分析装置により、生体粒子以外の粒子が分析されてもよく、キャリブレーションなどのために、ビーズなどが分析されてもよい。 (Biological sample)
The biological sample S may be a liquid sample containing biological particles. The biological particle is, for example, a cell or a non-cellular biological particle. The cell may be a living cell, and more specific examples thereof include blood cells such as erythrocytes and leukocytes, and germ cells such as sperm and fertilized eggs. Further, the cells may be those directly collected from a sample such as whole blood, or may be cultured cells obtained after culturing. Examples of the non-cellular biological particles include extracellular vesicles, particularly exosomes and microvesicles. The biological particles may be labeled with one or more labeling substances (eg, dyes (particularly fluorescent dyes) and fluorescent dye-labeled antibodies, etc.). The biological sample analyzer of the present disclosure may analyze particles other than biological particles, or may analyze beads or the like for calibration or the like.
(流路)
流路Cは、生体試料が流れるように、特に前記生体試料に含まれる生体粒子が略一列に並んだ流れが形成されるように構成されうる。流路Cを含む流路構造は、層流が形成されるように設計されてよく、特には生体試料の流れ(サンプル流)がシース液の流れによって包まれた層流が形成されるように設計される。当該流路構造の設計は、当業者により適宜選択されてよく、既知のものが採用されてもよい。流路Cは、マイクロチップ(マイクロメートルオーダーの流路を有するチップ)又はフローセルなどの流路構造体(flow channel structure、特にはフォーカシングが行われる流路構造体)中に形成されてよい。流路Cの幅は、1mm以下であり、特には10μm以上1mm以下であってよい。流路C及びそれを含む流路構造体は、プラスチックやガラスなどの材料から形成されてよい。 (Flow path)
The flow path C may be configured to form a flow in which the biological sample flows, in particular, the biological particles contained in the biological sample are arranged in a substantially row. The flow path structure including the flow path C may be designed so that a laminar flow is formed, and in particular, a laminar flow in which the flow of the biological sample (sample flow) is surrounded by the flow of the sheath liquid is formed. Designed. The design of the flow path structure may be appropriately selected by those skilled in the art, and known ones may be adopted. The flow path C may be formed in a flow channel structure (flow channel structure, particularly a flow path structure in which focusing is performed) such as a microchip (a chip having a flow path on the order of micrometers) or a flow cell. The width of the flow path C may be 1 mm or less, and in particular, 10 μm or more and 1 mm or less. The flow path C and the flow path structure including the flow path C may be formed of a material such as plastic or glass.
流路C内を流れる生体試料、特には当該生体試料中の生体粒子に、前記光照射部からの光が照射されるように、本開示の装置は構成されてよい。本開示の装置は、生体試料に対する光の照射点(interrogation point)が、流路Cが形成されている流路構造体中にあるように構成されてよく、又は、当該光の照射点が、当該流路構造体の外にあるように構成されてもよい。前者の例として、マイクロチップ又はフローセル内の流路Cに前記光が照射される構成を挙げることができる。後者では、流路構造体(特にはそのノズル部)から出た後の生体粒子に前記光が照射されてよく、例えばJet in Air方式のフローサイトメータを挙げることができる。
The apparatus of the present disclosure may be configured so that the biological sample flowing in the flow path C, particularly the biological particles in the biological sample, is irradiated with the light from the light irradiation unit. The apparatus of the present disclosure may be configured such that the light irradiation point (interrogation point) for the biological sample is in the flow path structure in which the flow path C is formed, or the light irradiation point is such that the light irradiation point is located in the flow path structure. It may be configured to be outside the flow path structure. As an example of the former, a configuration in which the light is irradiated to the flow path C in the microchip or the flow cell can be mentioned. In the latter, the biological particles after exiting from the flow path structure (particularly the nozzle portion thereof) may be irradiated with the light, and examples thereof include a Jet in Air type flow cytometer.
(光照射部)
光照射部101は、光を出射する光源部と、当該光を流路Cへと導く導光光学系とを含む。前記光源部は、1又は複数の光源を含む。光源の種類は、例えばレーザ光源又はLEDでありうる。各光源から出射される光の波長は、紫外光、可視光、又は赤外光のいずれかの波長であってよい。導光光学系は、例えばビームスプリッター群、ミラー群又は光ファイバなどの光学部品を含む。また、導光光学系は、光を集光するためのレンズ群を含んでよく、例えば対物レンズを含みうる。生体試料に対する光の照射点は、1つ又は複数であってよい。光照射部101は、一の照射点に対して、一つ又は異なる複数の光源から照射された光を集光するよう構成されていてもよい。 (Light irradiation part)
Thelight irradiation unit 101 includes a light source unit that emits light and a light guide optical system that guides the light to the flow path C. The light source unit includes one or more light sources. The type of light source may be, for example, a laser light source or an LED. The wavelength of the light emitted from each light source may be any wavelength of ultraviolet light, visible light, or infrared light. The light guide optical system includes optical components such as beam splitters, mirrors or optical fibers. Further, the light guide optical system may include a lens group for condensing light, and may include, for example, an objective lens. The irradiation point of light on the biological sample may be one or more. The light irradiation unit 101 may be configured to collect light emitted from one or a plurality of different light sources with respect to one irradiation point.
光照射部101は、光を出射する光源部と、当該光を流路Cへと導く導光光学系とを含む。前記光源部は、1又は複数の光源を含む。光源の種類は、例えばレーザ光源又はLEDでありうる。各光源から出射される光の波長は、紫外光、可視光、又は赤外光のいずれかの波長であってよい。導光光学系は、例えばビームスプリッター群、ミラー群又は光ファイバなどの光学部品を含む。また、導光光学系は、光を集光するためのレンズ群を含んでよく、例えば対物レンズを含みうる。生体試料に対する光の照射点は、1つ又は複数であってよい。光照射部101は、一の照射点に対して、一つ又は異なる複数の光源から照射された光を集光するよう構成されていてもよい。 (Light irradiation part)
The
(検出部)
検出部102は、光照射部による粒子への光照射により生じた光を検出する少なくとも一つの光検出器を備えている。検出する光は、例えば蛍光又は散乱光(例えば前方散乱光、後方散乱光、及び側方散乱光のいずれか1つ以上)である。各光検出器は、1以上の受光素子を含み、例えば受光素子アレイを有する。各光検出器は、受光素子として、1又は複数のPMT(光電子増倍管)及び/又はAPD及びMPPC等のフォトダイオードを含んでよい。当該光検出器は、例えば複数のPMTを一次元方向に配列したPMTアレイを含む。また、検出部は、CCD又はCMOSなどの撮像素子を含んでもよい。検出部は、当該撮像素子により、生体粒子の画像(例えば明視野画像、暗視野画像、及び蛍光画像など)を取得しうる。 (Detection unit)
Thedetection unit 102 includes at least one photodetector that detects the light generated by the light irradiation of the particles by the light irradiation unit. The light to be detected is, for example, fluorescence or scattered light (for example, one or more of forward scattered light, backscattered light, and side scattered light). Each photodetector comprises one or more light receiving elements, eg, having a light receiving element array. Each photodetector may include one or more PMTs (photomultiplier tubes) and / or photodiodes such as APDs and MPPCs as light receiving elements. The photodetector includes, for example, a PMT array in which a plurality of PMTs are arranged in a one-dimensional direction. Further, the detection unit may include an image pickup device such as a CCD or CMOS. The detection unit can acquire an image of biological particles (for example, a bright-field image, a dark-field image, a fluorescent image, etc.) by the image pickup device.
検出部102は、光照射部による粒子への光照射により生じた光を検出する少なくとも一つの光検出器を備えている。検出する光は、例えば蛍光又は散乱光(例えば前方散乱光、後方散乱光、及び側方散乱光のいずれか1つ以上)である。各光検出器は、1以上の受光素子を含み、例えば受光素子アレイを有する。各光検出器は、受光素子として、1又は複数のPMT(光電子増倍管)及び/又はAPD及びMPPC等のフォトダイオードを含んでよい。当該光検出器は、例えば複数のPMTを一次元方向に配列したPMTアレイを含む。また、検出部は、CCD又はCMOSなどの撮像素子を含んでもよい。検出部は、当該撮像素子により、生体粒子の画像(例えば明視野画像、暗視野画像、及び蛍光画像など)を取得しうる。 (Detection unit)
The
検出部は、所定の検出波長の光を、対応する光検出器に到達させる検出光学系を含む。検出光学系は、プリズムや回折格子等の分光部又はダイクロイックミラーや光学フィルタ等の波長分離部を含む。検出光学系は、例えば生体粒子からの光を分光し、蛍光色素の数より多い複数の光検出器にて異なる波長域の光が検出されるよう構成されてもよい。このような検出光学系を含むフローサイトメータはスペクトル型フローサイトメータと呼ぶ。また、検出光学系は、例えば生体粒子からの光より蛍光色素の蛍光波長域に対応する光を分離し、当該分離された光を、対応する光検出器に検出させるよう構成されてもよい。
The detection unit includes a detection optical system that causes light of a predetermined detection wavelength to reach a corresponding photodetector. The detection optical system includes a spectroscopic unit such as a prism or a diffraction grating or a wavelength separation unit such as a dichroic mirror or an optical filter. The detection optical system may be configured to, for example, disperse light from biological particles and detect light in different wavelength ranges with a plurality of photodetectors having a larger number of fluorescent dyes. A flow cytometer including such a detection optical system is called a spectral type flow cytometer. Further, the detection optical system may be configured to separate the light corresponding to the fluorescence wavelength range of the fluorescent dye from the light from the biological particles, for example, and have the corresponding photodetector detect the separated light.
また、検出部は、光検出器により得られた電気信号をデジタル信号に変換する信号処理部を含みうる。当該信号処理部が、当該変換を行う装置としてA/D変換器を含んでよい。当該信号処理部による変換により得られたデジタル信号が、情報処理部に送信されうる。前記デジタル信号が、情報処理部により、光に関するデータ(以下「光データ」ともいう)として取り扱われうる。前記光データは、例えば蛍光データを含む光データであってよい。より具体的には、前記光データは、光強度データであってよく、当該光強度は、蛍光を含む光の光強度データ(Area、Height、Width等の特徴量を含んでもよい)であってよい。
Further, the detection unit may include a signal processing unit that converts an electric signal obtained by a photodetector into a digital signal. The signal processing unit may include an A / D converter as a device for performing the conversion. The digital signal obtained by the conversion by the signal processing unit can be transmitted to the information processing unit. The digital signal can be handled by the information processing unit as data related to light (hereinafter, also referred to as "optical data"). The optical data may be optical data including, for example, fluorescence data. More specifically, the optical data may be light intensity data, and the light intensity may be light intensity data of light including fluorescence (may include feature quantities such as Area, Hight, Width, etc.). good.
(情報処理部)
情報処理部103は、例えば各種データ(例えば光データ)の処理を実行する処理部及び各種データを記憶する記憶部を含む。 (Information processing department)
Theinformation processing unit 103 includes, for example, a processing unit that executes processing of various data (for example, optical data) and a storage unit that stores various data.
情報処理部103は、例えば各種データ(例えば光データ)の処理を実行する処理部及び各種データを記憶する記憶部を含む。 (Information processing department)
The
生体試料分析装置が後述の分取部を含む場合、情報処理部は、光データ及び/又は形態情報に基づき、生体粒子を分取するかの判定を実行しうる。そして、情報処理部は、当該判定の結果に基づき当該分取部を制御し、分取部による生体粒子の分取が行われうる。
When the biological sample analyzer includes a sorting unit described later, the information processing unit can execute a determination as to whether to sort biological particles based on optical data and / or morphological information. Then, the information processing unit controls the sorting unit based on the result of the determination, and the bioparticles can be sorted by the sorting unit.
情報処理部は、汎用のコンピュータとして構成されてよく、例えばCPU、RAM、及びROMを備えている情報処理装置として構成されてよい。情報処理部は、光照射部及び検出部が備えられている筐体内に含まれていてよく、又は、当該筐体の外にあってもよい。情報処理部は、例えばデータ取得クライアント端末30によって実現されてもよい。
The information processing unit may be configured as a general-purpose computer, and may be configured as an information processing device including, for example, a CPU, RAM, and ROM. The information processing unit may be included in a housing provided with a light irradiation unit and a detection unit, or may be outside the housing. The information processing unit may be realized by, for example, a data acquisition client terminal 30.
(分取部)
分取部104は、例えば情報処理部による判定結果に応じて、生体粒子の分取を実行しうる。分取の方式は、振動により生体粒子を含む液滴を生成し、分取対象の液滴に対して電荷をかけ、当該液滴の進行方向を電極により制御する方式であってよい。分取の方式は、流路構造体内にて生体粒子の進行方向を制御し分取を行う方式であってもよい。当該流路構造体には、例えば、圧力(噴射若しくは吸引)又は電荷による制御機構が設けられる。当該流路構造体の例として、流路Cがその下流で回収流路及び廃液流路へと分岐している流路構造を有し、特定の生体粒子が当該回収流路へ回収されるチップ(例えば2020-76736に記載されたチップ)を挙げることができる。 (Preparation department)
Thesorting unit 104 may execute sorting of biological particles according to, for example, a determination result by the information processing unit. The preparative method may be a method in which droplets containing biological particles are generated by vibration, an electric charge is applied to the droplets to be sorted, and the traveling direction of the droplets is controlled by an electrode. The method of sorting may be a method of controlling the traveling direction of the biological particles in the flow path structure to perform sorting. The flow path structure is provided with, for example, a control mechanism based on pressure (injection or suction) or electric charge. As an example of the flow path structure, a chip having a flow path structure in which the flow path C branches to a recovery flow path and a waste liquid flow path downstream thereof, and specific biological particles are recovered to the recovery flow path. (For example, the chip described in 2020-76736) can be mentioned.
分取部104は、例えば情報処理部による判定結果に応じて、生体粒子の分取を実行しうる。分取の方式は、振動により生体粒子を含む液滴を生成し、分取対象の液滴に対して電荷をかけ、当該液滴の進行方向を電極により制御する方式であってよい。分取の方式は、流路構造体内にて生体粒子の進行方向を制御し分取を行う方式であってもよい。当該流路構造体には、例えば、圧力(噴射若しくは吸引)又は電荷による制御機構が設けられる。当該流路構造体の例として、流路Cがその下流で回収流路及び廃液流路へと分岐している流路構造を有し、特定の生体粒子が当該回収流路へ回収されるチップ(例えば2020-76736に記載されたチップ)を挙げることができる。 (Preparation department)
The
生体試料分析装置40は、例えば多色蛍光イメージングなどを実行するための顕微鏡装置、特には蛍光顕微鏡装置であってもよい。近年、蛍光イメージングにおいても、使用される蛍光体の数が増加傾向にあり、本開示の情報処理システムは、当該顕微鏡装置によって取得された光強度データに対して実行されてもよい。
The biological sample analyzer 40 may be a microscope device for performing, for example, multicolor fluorescence imaging, particularly a fluorescence microscope device. In recent years, the number of phosphors used in fluorescence imaging has also been increasing, and the information processing system of the present disclosure may be executed for light intensity data acquired by the microscope device.
(4)情報処理システムによる処理フローの例
(4) Example of processing flow by information processing system
情報処理システム1により実行される情報処理方法は、自動解析処理工程を含んでよい。また、当該情報処理方法は、自動解析処理工程に加え、当該自動解析処理工程によって生成された出力用データを用いる対話型解析処理工程を含んでもよい。
また、情報処理システム1により実行される情報処理方法は、サーバシステム内に存在する解析結果データに基づく出力用データを取得する出力用データ取得工程と、当該取得処理によって得られた出力用データを用いる対話型解析処理工程と、を含んでもよい。
以下で、前記自動解析処理、前記出力用データ取得処理、及び前記対話型解析処理について説明する。 The information processing method executed by theinformation processing system 1 may include an automatic analysis processing step. Further, the information processing method may include an interactive analysis processing step using output data generated by the automatic analysis processing step in addition to the automatic analysis processing step.
Further, the information processing method executed by theinformation processing system 1 includes an output data acquisition process for acquiring output data based on analysis result data existing in the server system, and an output data obtained by the acquisition process. It may include an interactive analysis processing step to be used.
Hereinafter, the automatic analysis process, the output data acquisition process, and the interactive analysis process will be described.
また、情報処理システム1により実行される情報処理方法は、サーバシステム内に存在する解析結果データに基づく出力用データを取得する出力用データ取得工程と、当該取得処理によって得られた出力用データを用いる対話型解析処理工程と、を含んでもよい。
以下で、前記自動解析処理、前記出力用データ取得処理、及び前記対話型解析処理について説明する。 The information processing method executed by the
Further, the information processing method executed by the
Hereinafter, the automatic analysis process, the output data acquisition process, and the interactive analysis process will be described.
(4-1)自動解析処理
(4-1) Automatic analysis processing
情報処理システム1による自動解析処理のフローを、図14を参照しながら説明する。
The flow of automatic analysis processing by the information processing system 1 will be described with reference to FIG.
ステップS101において、データ取得クライアント端末30が、生体試料分析装置40から生体試料の光強度データを取得する。当該光強度データは、生体試料に光を照射することで取得される光強度データであってよい。
In step S101, the data acquisition client terminal 30 acquires the light intensity data of the biological sample from the biological sample analyzer 40. The light intensity data may be light intensity data acquired by irradiating a biological sample with light.
ステップS101において、データ取得クライアント端末30は、光強度データに加えて、当該光強度データの解析処理において参照され又は用いられる付属データを取得してもよい。当該付属データは、例えば当該生体試料自体に関するデータ及び/又は当該生体試料の分析設定に関するデータを含みうる。前記生体試料自体に関するデータの例として、例えば生体試料の属性(例えば生体試料が由来する生物の種類、生体試料が由来する体液の種類、生体試料が由来する器官の種類、又は疾患の種類など)、生体試料を標識した蛍光色素、及び生体試料の作成者及び作成日などを挙げることができる。前記生体試料の分析設定に関するデータの例として、例えば当該分析装置の設定、アンミキシング設定、及び測定条件などを挙げることができるが、これらに限定されない。
なお、ステップS101において、データ取得クライアント端末30が、光強度データから蛍光標識強度データを算出する処理を実行してもよい。 In step S101, the dataacquisition client terminal 30 may acquire incidental data referred to or used in the analysis process of the light intensity data in addition to the light intensity data. The ancillary data may include, for example, data on the biological sample itself and / or data on analytical settings for the biological sample. As an example of the data regarding the biological sample itself, for example, the attributes of the biological sample (for example, the type of organism from which the biological sample is derived, the type of body fluid from which the biological sample is derived, the type of organ from which the biological sample is derived, the type of disease, etc.). , Fluorescent dyes labeled with biological samples, creators and dates of creation of biological samples, and the like. Examples of the data relating to the analysis setting of the biological sample include, but are not limited to, the setting of the analysis device, the unmixing setting, and the measurement conditions.
In step S101, the dataacquisition client terminal 30 may execute a process of calculating the fluorescent label intensity data from the light intensity data.
なお、ステップS101において、データ取得クライアント端末30が、光強度データから蛍光標識強度データを算出する処理を実行してもよい。 In step S101, the data
In step S101, the data
ステップS102において、データ取得クライアント端末30は、前記光強度データをサーバシステム10に送信する。ステップS102において、データ取得クライアント端末30は、前記光強度データに加えて、前記付属データを送信しうる。
なお、ステップS101において、蛍光標識強度データが算出する処理が実行された場合は、ステップS102において、データ取得クライアント端末30は、前記蛍光標識強度データをサーバシステム10に送信しうる。 In step S102, the dataacquisition client terminal 30 transmits the light intensity data to the server system 10. In step S102, the data acquisition client terminal 30 may transmit the attached data in addition to the light intensity data.
When the process of calculating the fluorescent label intensity data is executed in step S101, the dataacquisition client terminal 30 may transmit the fluorescent label intensity data to the server system 10 in step S102.
なお、ステップS101において、蛍光標識強度データが算出する処理が実行された場合は、ステップS102において、データ取得クライアント端末30は、前記蛍光標識強度データをサーバシステム10に送信しうる。 In step S102, the data
When the process of calculating the fluorescent label intensity data is executed in step S101, the data
好ましくは、(4-1)における一連のステップを自動的に実行するために、データ取得クライアント端末30は、ステップS101において生体試料分析装置40から光強度データ又は蛍光標識強度データを取得したことに応じて、前記送信を実行してよい。より具体的には、データ取得クライアント端末30は、光強度データの受信を開始したことをトリガーとして、サーバシステム10への当該光強度データの送信を開始してよい。当該送信は、ネットワーク50を介して行われてよい。なお、データ取得クライアント端末30は、光強度データの受信を完了したことをトリガーとして、サーバシステム10への当該光強度データの送信を開始してもよいが、上記で述べたとおり、光強度データの送信開始をトリガーとすることによって、アップロード完了をより早めることができる。
Preferably, in order to automatically execute the series of steps in (4-1), the data acquisition client terminal 30 has acquired the light intensity data or the fluorescent label intensity data from the biological sample analyzer 40 in step S101. The transmission may be executed accordingly. More specifically, the data acquisition client terminal 30 may start transmitting the light intensity data to the server system 10 with the start of receiving the light intensity data as a trigger. The transmission may be performed via the network 50. The data acquisition client terminal 30 may start transmitting the light intensity data to the server system 10 with the completion of receiving the light intensity data as a trigger. However, as described above, the light intensity data may be started. By triggering the start of transmission of, the upload completion can be accelerated.
ステップS103において、サーバシステム10は、データ取得クライアント端末30から送信された光強度データ又は蛍光標識強度データを、ネットワーク50を介して受信する。サーバシステム10は、光強度データ又は蛍光標識強度データを光データ記憶部15に格納する。
In step S103, the server system 10 receives the light intensity data or the fluorescent label intensity data transmitted from the data acquisition client terminal 30 via the network 50. The server system 10 stores the light intensity data or the fluorescent label intensity data in the optical data storage unit 15.
ステップS104において、サーバシステム10は光強度データ又は蛍光標識強度データに対する自動解析処理を実行する。当該自動解析処理は、特には自動解析処理部11によって実行される。当該自動解析処理において、サーバシステム10は、前記光強度データから蛍光標識強度データを算出し、そして、当該蛍光標識強度データに対する解析処理を行って出力用データを生成しうる。また、サーバシステム10が蛍光標識強度データを受信した場合は、当該自動解析処理において、サーバシステム10は、蛍光標識強度データの算出処理を行うことなく、受信した蛍光標識強度データに対する解析処理を実行しうる。
ステップS104における処理の詳細を、図15を参照しながら以下で説明する。 In step S104, theserver system 10 executes an automatic analysis process for the light intensity data or the fluorescent label intensity data. The automatic analysis process is particularly executed by the automatic analysis processing unit 11. In the automatic analysis process, the server system 10 can calculate fluorescent label intensity data from the light intensity data and perform analysis process on the fluorescent label intensity data to generate output data. When the server system 10 receives the fluorescent label intensity data, in the automatic analysis process, the server system 10 executes an analysis process for the received fluorescent label intensity data without performing a calculation process for the fluorescent label intensity data. Can be done.
The details of the process in step S104 will be described below with reference to FIG.
ステップS104における処理の詳細を、図15を参照しながら以下で説明する。 In step S104, the
The details of the process in step S104 will be described below with reference to FIG.
図15に示されるステップS151において、自動解析処理部11は、自動解析処理を開始する。好ましくは、ステップS103において光データ記憶部15へ光強度データ(又は蛍光標識強度データ)が格納されたことに応じて、当該自動解析処理が開始される。特には、当該自動解析処理は、当該格納をトリガーとするイベントドリブンの解析処理であってよい。
In step S151 shown in FIG. 15, the automatic analysis processing unit 11 starts the automatic analysis processing. Preferably, the automatic analysis process is started in response to the storage of the light intensity data (or the fluorescent label intensity data) in the optical data storage unit 15 in step S103. In particular, the automatic analysis process may be an event-driven analysis process triggered by the storage.
自動解析処理部11による処理は、例えばサーバレスで実行されてよく、いわゆるサーバレスアーキテクチャとして構成されてよい。
なお、本明細書内において、「サーバレスで実行される処理」とは、サーバを使用しない処理ではなく、事前に構築済みのサーバアーキテクチャ上で、イベントドリブン形式にて所定の情報処理のみを実行する、すなわち関数単位で当該情報処理を実行することを意味してよい。前記構築済みサーバアーキテクチャは、サーバシステム10によってデータ解析クライアント端末20のユーザへ解析サービスを提供する事業者によって事前に構築されたものであってよく、いわゆるクラウド事業者によって構築されたものであってよい。
サーバシステム10が、例えばAmazon Web Services(商標)である場合、自動解析処理部11による処理は、例えばAWS Lambdaによって実行されてよく、特にはAWS LambdaとAmazon EC2との組合せを含むシステムによって実行される。 The processing by the automaticanalysis processing unit 11 may be executed, for example, serverless, and may be configured as a so-called serverless architecture.
In this specification, "process executed without a server" is not a process that does not use a server, but executes only predetermined information processing in an event-driven format on a pre-built server architecture. That is, it may mean that the information processing is executed in a function unit. The pre-built server architecture may be pre-built by a business operator that provides an analysis service to the user of the dataanalysis client terminal 20 by the server system 10, and may be built by a so-called cloud business operator. good.
When theserver system 10 is, for example, Amazon Web Services ™, the processing by the automatic analysis processing unit 11 may be performed by, for example, AWS Lambda, and in particular, by a system including a combination of AWS Lambda and Amazon EC2. To.
なお、本明細書内において、「サーバレスで実行される処理」とは、サーバを使用しない処理ではなく、事前に構築済みのサーバアーキテクチャ上で、イベントドリブン形式にて所定の情報処理のみを実行する、すなわち関数単位で当該情報処理を実行することを意味してよい。前記構築済みサーバアーキテクチャは、サーバシステム10によってデータ解析クライアント端末20のユーザへ解析サービスを提供する事業者によって事前に構築されたものであってよく、いわゆるクラウド事業者によって構築されたものであってよい。
サーバシステム10が、例えばAmazon Web Services(商標)である場合、自動解析処理部11による処理は、例えばAWS Lambdaによって実行されてよく、特にはAWS LambdaとAmazon EC2との組合せを含むシステムによって実行される。 The processing by the automatic
In this specification, "process executed without a server" is not a process that does not use a server, but executes only predetermined information processing in an event-driven format on a pre-built server architecture. That is, it may mean that the information processing is executed in a function unit. The pre-built server architecture may be pre-built by a business operator that provides an analysis service to the user of the data
When the
ステップS152において、自動解析処理部11は、サーバシステム10上に、前記光強度データ(又は蛍光標識強度データ)の解析処理を実行するためのコンピューテーションリソースを確保する。当該コンピューテーションリソースが、当該解析処理を実行するための仮想サーバとして機能する。ステップS152において、当該仮想サーバが起動する。
In step S152, the automatic analysis processing unit 11 secures a computing resource for executing the analysis processing of the light intensity data (or fluorescent label intensity data) on the server system 10. The computing resource functions as a virtual server for executing the analysis process. In step S152, the virtual server is started.
ステップS153において、自動解析処理部11(特には前記仮想サーバ)は、光データ記憶部15に格納されている光強度データ(又は蛍光標識強度データ)をダウンロードする。
In step S153, the automatic analysis processing unit 11 (particularly the virtual server) downloads the light intensity data (or fluorescent label intensity data) stored in the optical data storage unit 15.
ステップS154において、自動解析処理部11(特には前記仮想サーバ)は、解析に必要なデータを取得する。前記解析に必要なデータは、例えば、蛍光標識強度データの算出のために用いられるデータ、及び、蛍光強度標識データに対する解析処理において用いられるデータを含みうる。これらのデータは、サーバシステム10内のいずれかの記憶部又はデータベースに格納されていてよく、例えばデータベース17に格納されていてよい。
蛍光標識強度データの算出のために用いられるデータは、例えばスペクトラルリファレンスデータを含みうる。当該データは、アンミキシング処理のために用いられる。
蛍光強度標識データに対する解析処理において用いられるデータは、さらに解析コマンドを含みうる。当該解析コマンドは、例えばゲート設定コマンド、プロット設定コマンド、軸設定コマンド、軸表示設定コマンド、統計設定コマンド、及びリージョン設定コマンドを含む。当該解析コマンドは、例えば二次元プロットなど、ユーザが希望する解析結果データを得るために用いられる。また、当該解析コマンドは、クラスタリングコマンドを含んでもよい。
当該解析コマンドは、事前にデータ解析クライアント端末20又はデータ取得クライアント端末30からサーバシステム10に送信されたものであってよい。 In step S154, the automatic analysis processing unit 11 (particularly, the virtual server) acquires data necessary for analysis. The data required for the analysis may include, for example, data used for calculating the fluorescence label intensity data and data used in the analysis process for the fluorescence intensity label data. These data may be stored in any storage unit or database in theserver system 10, and may be stored in, for example, the database 17.
The data used to calculate the fluorescence label intensity data may include, for example, spectral reference data. The data is used for the unmixing process.
The data used in the analysis process for the fluorescence intensity labeled data may further include analysis commands. The analysis command includes, for example, a gate setting command, a plot setting command, an axis setting command, an axis display setting command, a statistical setting command, and a region setting command. The analysis command is used to obtain the analysis result data desired by the user, for example, a two-dimensional plot. Further, the analysis command may include a clustering command.
The analysis command may be transmitted from the dataanalysis client terminal 20 or the data acquisition client terminal 30 to the server system 10 in advance.
蛍光標識強度データの算出のために用いられるデータは、例えばスペクトラルリファレンスデータを含みうる。当該データは、アンミキシング処理のために用いられる。
蛍光強度標識データに対する解析処理において用いられるデータは、さらに解析コマンドを含みうる。当該解析コマンドは、例えばゲート設定コマンド、プロット設定コマンド、軸設定コマンド、軸表示設定コマンド、統計設定コマンド、及びリージョン設定コマンドを含む。当該解析コマンドは、例えば二次元プロットなど、ユーザが希望する解析結果データを得るために用いられる。また、当該解析コマンドは、クラスタリングコマンドを含んでもよい。
当該解析コマンドは、事前にデータ解析クライアント端末20又はデータ取得クライアント端末30からサーバシステム10に送信されたものであってよい。 In step S154, the automatic analysis processing unit 11 (particularly, the virtual server) acquires data necessary for analysis. The data required for the analysis may include, for example, data used for calculating the fluorescence label intensity data and data used in the analysis process for the fluorescence intensity label data. These data may be stored in any storage unit or database in the
The data used to calculate the fluorescence label intensity data may include, for example, spectral reference data. The data is used for the unmixing process.
The data used in the analysis process for the fluorescence intensity labeled data may further include analysis commands. The analysis command includes, for example, a gate setting command, a plot setting command, an axis setting command, an axis display setting command, a statistical setting command, and a region setting command. The analysis command is used to obtain the analysis result data desired by the user, for example, a two-dimensional plot. Further, the analysis command may include a clustering command.
The analysis command may be transmitted from the data
ステップS155において、自動解析処理部11(特には前記仮想サーバ)は、前記光強度データから蛍光標識強度データを算出する処理を実行しうる。そして、自動解析処理部11は、当該算出された蛍光標識強度データを用いて、解析結果データを生成する処理を実行する。なお、ステップS103において、サーバシステム10が蛍光標識強度データを受信した場合は、当該算出処理は省略されてよい。
前記蛍光標識強度データの算出処理は、ステップS154に関して言及した蛍光標識強度データの算出のために用いられるデータを用いて実行されてよい。当該算出処理は、例えば当該データを用いて、光強度データに対してアンミキシング処理を行って蛍光標識強度データを取得する処理を含んでよい。
また、自動解析処理部11は、クラスタリング処理及び次元圧縮処理などのAdvanced解析処理を実行してもよい。
前記解析結果データを生成する処理は、ステップS154に関して言及した解析コマンドを用いて実行されてよい。当該生成処理は、例えば、当該解析コマンドを用いて、前記蛍光標識強度データに基づき、プロット画像、クラスタリング結果表示図、及び統計量のうちの1つ以上を含む解析結果データを生成することを含んでよい。 In step S155, the automatic analysis processing unit 11 (particularly, the virtual server) can execute a process of calculating the fluorescent label intensity data from the light intensity data. Then, the automaticanalysis processing unit 11 executes a process of generating analysis result data using the calculated fluorescent label intensity data. If the server system 10 receives the fluorescent label intensity data in step S103, the calculation process may be omitted.
The process of calculating the fluorescent label intensity data may be performed using the data used for calculating the fluorescent label intensity data referred to in step S154. The calculation process may include, for example, a process of performing an unmixing process on the light intensity data to acquire the fluorescent label intensity data using the data.
Further, the automaticanalysis processing unit 11 may execute advanced analysis processing such as clustering processing and dimension compression processing.
The process of generating the analysis result data may be executed by using the analysis command mentioned with respect to step S154. The generation process includes, for example, using the analysis command to generate analysis result data including one or more of a plot image, a clustering result display diagram, and a statistic based on the fluorescent label intensity data. It's fine.
前記蛍光標識強度データの算出処理は、ステップS154に関して言及した蛍光標識強度データの算出のために用いられるデータを用いて実行されてよい。当該算出処理は、例えば当該データを用いて、光強度データに対してアンミキシング処理を行って蛍光標識強度データを取得する処理を含んでよい。
また、自動解析処理部11は、クラスタリング処理及び次元圧縮処理などのAdvanced解析処理を実行してもよい。
前記解析結果データを生成する処理は、ステップS154に関して言及した解析コマンドを用いて実行されてよい。当該生成処理は、例えば、当該解析コマンドを用いて、前記蛍光標識強度データに基づき、プロット画像、クラスタリング結果表示図、及び統計量のうちの1つ以上を含む解析結果データを生成することを含んでよい。 In step S155, the automatic analysis processing unit 11 (particularly, the virtual server) can execute a process of calculating the fluorescent label intensity data from the light intensity data. Then, the automatic
The process of calculating the fluorescent label intensity data may be performed using the data used for calculating the fluorescent label intensity data referred to in step S154. The calculation process may include, for example, a process of performing an unmixing process on the light intensity data to acquire the fluorescent label intensity data using the data.
Further, the automatic
The process of generating the analysis result data may be executed by using the analysis command mentioned with respect to step S154. The generation process includes, for example, using the analysis command to generate analysis result data including one or more of a plot image, a clustering result display diagram, and a statistic based on the fluorescent label intensity data. It's fine.
自動解析処理部11(特には前記仮想サーバ)は、ステップS155において生成された前記解析結果データを、例えば解析結果データ記憶部16に保存する。また、自動解析処理部11は、ステップS155において生成された前記蛍光標識強度データを、例えば光データ記憶部15に保存する。これらの保存処理は、例えばステップS155の処理後に行われてよく、又はステップS156若しくはステップS157の処理後に行われてもよい。
The automatic analysis processing unit 11 (particularly, the virtual server) stores the analysis result data generated in step S155 in, for example, the analysis result data storage unit 16. Further, the automatic analysis processing unit 11 stores the fluorescent label intensity data generated in step S155 in, for example, an optical data storage unit 15. These storage processes may be performed, for example, after the process of step S155, or may be performed after the process of step S156 or step S157.
ステップS156において、自動解析処理部11(特には前記仮想サーバ)は、データ解析クライアント端末20において出力される出力用データを生成する。例えば、自動解析処理部11は、ステップS155において生成された解析結果データから、出力用データを特定し又は抽出しうる。当該出力用データは、解析結果データの一部であってよい。当該出力用データは、例えば、二次元プロット画像、スペクトルプロット画像、及びクラスタリング結果表示図のうちの一つ以上を含む。当該出力用データは、これらの画像を生成するためのデータを含んでよく、一方で、解析処理において用いられた蛍光標識強度データは含まなくてよい。当該出力用データは、これらの画像を、データ解析クライアント端末20が編集することができるように構成されていてよい。これにより、データ解析クライアント端末20が、出力されたデータに対して編集処理を実行することができ、これは、後述の対話型解析処理において利用しやすい。また、当該出力用データは、例えば統計解析結果データなどの数値データを含んでもよい。
In step S156, the automatic analysis processing unit 11 (particularly the virtual server) generates output data output by the data analysis client terminal 20. For example, the automatic analysis processing unit 11 can specify or extract output data from the analysis result data generated in step S155. The output data may be a part of the analysis result data. The output data includes, for example, one or more of a two-dimensional plot image, a spectrum plot image, and a clustering result display diagram. The output data may include data for generating these images, while may not include the fluorescent label intensity data used in the analysis process. The output data may be configured so that these images can be edited by the data analysis client terminal 20. As a result, the data analysis client terminal 20 can execute an editing process on the output data, which is easy to use in the interactive analysis process described later. Further, the output data may include numerical data such as statistical analysis result data.
本明細書内において、「解析結果データ」は、サーバシステム10における解析処理によって生成されたデータを意味する。「出力用データ」は、当該解析結果データのうちの一部であり、特にはデータ解析クライアント端末20における解析結果出力のために用いられるデータである。
In the present specification, the "analysis result data" means the data generated by the analysis process in the server system 10. The "output data" is a part of the analysis result data, and is particularly data used for outputting the analysis result in the data analysis client terminal 20.
ステップS157において、自動解析処理部11(特には前記仮想サーバ)は、解析処理を終了し、処理をステップS105に進める。
In step S157, the automatic analysis processing unit 11 (particularly, the virtual server) ends the analysis processing and advances the processing to step S105.
ステップS105において、自動解析処理部11(特には前記仮想サーバ)は、自動解析完了通知をデータ解析クライアント端末20に送信する。当該自動解析完了通知は、メールでもよく、又は、サーバーサイドPush技術を用いた通知方式による通知であってもよい。当該自動解析完了通知の送信が終了したことに応じて、自動解析処理部11は、前記仮想サーバを停止する。これにより、仮想サーバの稼働時間が余分に長くなることを防ぐことができ、サーバの利用にかかるコストが削減される。
In step S105, the automatic analysis processing unit 11 (particularly, the virtual server) transmits an automatic analysis completion notification to the data analysis client terminal 20. The automatic analysis completion notification may be an e-mail or a notification method using a server-side push technique. The automatic analysis processing unit 11 stops the virtual server in response to the completion of the transmission of the automatic analysis completion notification. As a result, it is possible to prevent the operating time of the virtual server from becoming excessively long, and the cost of using the server is reduced.
ステップS106において、データ解析クライアント端末20は、前記自動解析完了通知を受信する。データ解析クライアント端末20は、当該自動解析完了通知を出力装置に出力させる。また、データ解析クライアント端末20は、前記自動解析完了通知を受信したことに応じて、例えば、出力用データリクエストをサーバシステム10に送信するかをユーザに問い合わせる画面を表示してよい。当該画面中には、例えば、データ解析クライアント端末20に出力用データリクエストをサーバシステム10に送信させるためのボタンが配置されていてよい。
In step S106, the data analysis client terminal 20 receives the automatic analysis completion notification. The data analysis client terminal 20 causes the output device to output the automatic analysis completion notification. Further, the data analysis client terminal 20 may display a screen asking the user whether to send an output data request to the server system 10 in response to receiving the automatic analysis completion notification. In the screen, for example, a button for causing the data analysis client terminal 20 to send an output data request to the server system 10 may be arranged.
ステップS107において、データ解析クライアント端末20は、出力用データリクエストを、サーバシステム10に送信する。例えばデータ解析クライアント端末20のユーザにより、前記画面中のボタンがクリック又は選択されることに応じて、データ解析クライアント端末20は当該送信を実行しうる。
In step S107, the data analysis client terminal 20 transmits an output data request to the server system 10. For example, the data analysis client terminal 20 may execute the transmission in response to the click or selection of a button on the screen by the user of the data analysis client terminal 20.
ステップS108において、サーバシステム10は、出力用データリクエストを受信する。
In step S108, the server system 10 receives an output data request.
ステップS109において、サーバシステム10は、ステップS104において生成された出力用データをデータ解析クライアント端末20に送信する。
In step S109, the server system 10 transmits the output data generated in step S104 to the data analysis client terminal 20.
ステップS110において、データ解析クライアント端末20は、サーバシステム10から送信された前記出力用データを受信する。
In step S110, the data analysis client terminal 20 receives the output data transmitted from the server system 10.
ステップS111において、データ解析クライアント端末20(特には処理部21)は、前記出力用データを出力装置に出力させる。出力装置に出力された出力用データの例を図23に示す。図23に示されるように、出力装置には、出力用データが表示されるウィンドウが表示される。当該ウィンドウの左下には、7つのプロット画像が表示されている。さらに、当該ウィンドウの右には、1つのクラスタリング結果表示図が表示されている。さらに、当該ウィンドウの左上には、各ゲートに対応する統計量データ(イベント数、Parent%、及びTotal%)が表示されている。このように、当該ウィンドウには、出力用データに基づく画像データ及び/又は統計量データが表示されうる。当該画像データは、上記のとおり1つ以上のプロット画像及び/又は1つ以上のクラスタリング結果表示図を含んでよい。また、当該統計量データは、1つ以上の統計量を含んでよい。
In step S111, the data analysis client terminal 20 (particularly, the processing unit 21) causes the output device to output the output data. FIG. 23 shows an example of output data output to the output device. As shown in FIG. 23, the output device displays a window in which the output data is displayed. Seven plot images are displayed in the lower left of the window. Further, one clustering result display diagram is displayed on the right side of the window. Further, in the upper left of the window, statistical data (number of events, Parent%, and Total%) corresponding to each gate is displayed. In this way, the window may display image data and / or statistic data based on the output data. The image data may include one or more plot images and / or one or more clustering result display diagrams as described above. In addition, the statistic data may include one or more statistic.
以上の自動解析処理では、必要な場合にだけ仮想サーバを稼働させることができる。そのため、常時稼働型サーバと比較して大幅にランニングコストを削減することができる。また、スケーラビリティの確保も可能となる。
With the above automatic analysis process, the virtual server can be operated only when necessary. Therefore, the running cost can be significantly reduced as compared with the always-operated server. It also makes it possible to ensure scalability.
(4-2)自動解析処理の例
(4-2) Example of automatic analysis processing
以下で、サーバシステム10がAmazon Web Services(商標)である場合における自動解析処理フローの例を図14及び15を参照しながら説明する。
Hereinafter, an example of the automatic analysis processing flow when the server system 10 is Amazon Web Services ™ will be described with reference to FIGS. 14 and 15.
ステップS101において、データ取得クライアント端末30が、生体試料分析装置40から生体試料の光強度データを取得する。
In step S101, the data acquisition client terminal 30 acquires the light intensity data of the biological sample from the biological sample analyzer 40.
ステップS102において、データ取得クライアント端末30は、前記光強度データをサーバシステム10に送信する。好ましくは、データ取得クライアント端末30は、ステップS101において生体試料分析装置40から光強度データを取得したことに応じて、前記送信を実行してよい。
In step S102, the data acquisition client terminal 30 transmits the light intensity data to the server system 10. Preferably, the data acquisition client terminal 30 may execute the transmission in response to the acquisition of light intensity data from the biological sample analyzer 40 in step S101.
ステップS103において、サーバシステム10は、データ取得クライアント端末30から送信された光強度データを、ネットワーク50を介して受信する。光強度データは、光データ記憶部15として機能するAmazon S3のバケットにアップロードされる。
In step S103, the server system 10 receives the light intensity data transmitted from the data acquisition client terminal 30 via the network 50. The light intensity data is uploaded to the bucket of Amazon S3 that functions as the light data storage unit 15.
ステップS104において、サーバシステム10は光強度データに対する自動解析処理を実行する。ステップS104における処理の詳細を、図15を参照しながら以下で説明する。
In step S104, the server system 10 executes an automatic analysis process for the light intensity data. The details of the process in step S104 will be described below with reference to FIG.
ステップS151において、例えば光強度データを含むオブジェクトが、光データ記憶部15として機能するAmazon S3のバケットにアップロードされたことに応じて、自動解析処理部11として機能するAWS Lambdaが、ステップS151における自動解析処理を開始する。
In step S151, for example, when an object containing light intensity data is uploaded to the bucket of Amazon S3 that functions as the optical data storage unit 15, AWS Lambda that functions as the automatic analysis processing unit 11 automatically performs the automatic analysis in step S151. Start the analysis process.
ステップS152において、AWS Lambdaは、後述の解析処理を実行するためのコンピューテーションリソースをサーバシステム10上に確保する。特には、後述のステップS155における解析処理を実行するための仮想サーバとして、Amazon EC2インスタンスを立ち上げる。Amazon EC2インスタンスが立ち上げられたことに応じて、AWS Lambdaは終了されてよい。
In step S152, AWS Lambda secures a computing resource on the server system 10 for executing the analysis process described later. In particular, an Amazon EC2 instance is launched as a virtual server for executing the analysis process in step S155 described later. AWS Lambda may be terminated in response to the launch of the Amazon EC2 instance.
ステップS153において、ステップS152において立ち上げられた前記インスタンスは、前記バケットに格納されている前記光強度データを含むオブジェクトをダウンロードする。
In step S153, the instance launched in step S152 downloads the object containing the light intensity data stored in the bucket.
ステップS154において、ステップS152において立ち上げられたインスタンスは、Amazon Auroraに予め格納されている前記解析に必要なデータを取得する。前記解析に必要なデータは、ステップS102において前記光強度データと同時に送信され、そして、Amazon Auroraに予め格納されていてよい。
In step S154, the instance launched in step S152 acquires the data necessary for the analysis stored in advance in Amazon Aurora. The data required for the analysis may be transmitted at the same time as the light intensity data in step S102 and stored in advance in Amazon Aurora.
ステップS155において、前記インスタンスは、例えば前記スペクトラルリファレンスデータを用いて、前記光強度データから蛍光標識強度データを算出する。当該蛍光標識強度データは、前記バケットに格納されうる。
また、前記インスタンスは、当該算出された蛍光標識強度データを用いて、解析結果データを生成する。 In step S155, the instance calculates fluorescent label intensity data from the light intensity data, for example, using the spectral reference data. The fluorescent label intensity data may be stored in the bucket.
In addition, the instance generates analysis result data using the calculated fluorescent label intensity data.
前記インスタンスは、ステップS155において生成された解析結果データを、前記バケットに格納する。また、前記インスタンスは、ステップS155において生成された蛍光標識強度データも前記バケットに格納しうる。
The instance stores the analysis result data generated in step S155 in the bucket. The instance may also store the fluorescent label intensity data generated in step S155 in the bucket.
ステップS156において、前記インスタンスは、例えば前記解析結果データから出力用データを生成する。例えば、前記インスタンスは、前記解析結果データのうちから出力用データを特定し又は抽出する。
In step S156, the instance generates output data from, for example, the analysis result data. For example, the instance identifies or extracts output data from the analysis result data.
ステップS157において、前記インスタンスは解析処理を終了する。解析処理の終了に応じて、前記インスタンスは処理をステップS105に進める。
In step S157, the instance ends the analysis process. Upon completion of the analysis process, the instance advances the process to step S105.
なお、ステップS101において取得される光強度データは1つ又は複数であってよい。光強度データが複数である場合、当該複数の光強度データは、例えば、複数の生体試料についてそれぞれ測定が行われることによって取得された複数の光強度データであってもよい。
この場合、ステップS102において、データ取得クライアント端末30は、当該複数の光強度データをサーバシステム10に送信する。また、データ取得クライアント端末30は、解析に必要なデータも、サーバシステム10に送信しうる。
次に、ステップS103において、サーバシステム10は、当該複数の光強度データ及び/又は当該解析に必要なデータを、例えばAmazon DynamoDBなどのデータベースに記録しうる。
次に、ステップS104において、前記インスタンスは、当該複数の光強度データのそれぞれについて前記自動解析処理を実行しうる。前記インスタンスは、自動解析処理の完了に伴い、前記データベースを更新してよい。前記複数の光強度データの全てについて解析処理が終了したことに応じて、前記インスタンスは処理をステップS105に進めてよい。 The light intensity data acquired in step S101 may be one or more. When there are a plurality of light intensity data, the plurality of light intensity data may be, for example, a plurality of light intensity data acquired by performing measurements on a plurality of biological samples.
In this case, in step S102, the dataacquisition client terminal 30 transmits the plurality of light intensity data to the server system 10. Further, the data acquisition client terminal 30 can also transmit the data necessary for analysis to the server system 10.
Next, in step S103, theserver system 10 can record the plurality of light intensity data and / or the data necessary for the analysis in a database such as Amazon DynamoDB.
Next, in step S104, the instance can execute the automatic analysis process for each of the plurality of light intensity data. The instance may update the database as the automatic analysis process is completed. Depending on the completion of the analysis process for all of the plurality of light intensity data, the instance may proceed to the process in step S105.
この場合、ステップS102において、データ取得クライアント端末30は、当該複数の光強度データをサーバシステム10に送信する。また、データ取得クライアント端末30は、解析に必要なデータも、サーバシステム10に送信しうる。
次に、ステップS103において、サーバシステム10は、当該複数の光強度データ及び/又は当該解析に必要なデータを、例えばAmazon DynamoDBなどのデータベースに記録しうる。
次に、ステップS104において、前記インスタンスは、当該複数の光強度データのそれぞれについて前記自動解析処理を実行しうる。前記インスタンスは、自動解析処理の完了に伴い、前記データベースを更新してよい。前記複数の光強度データの全てについて解析処理が終了したことに応じて、前記インスタンスは処理をステップS105に進めてよい。 The light intensity data acquired in step S101 may be one or more. When there are a plurality of light intensity data, the plurality of light intensity data may be, for example, a plurality of light intensity data acquired by performing measurements on a plurality of biological samples.
In this case, in step S102, the data
Next, in step S103, the
Next, in step S104, the instance can execute the automatic analysis process for each of the plurality of light intensity data. The instance may update the database as the automatic analysis process is completed. Depending on the completion of the analysis process for all of the plurality of light intensity data, the instance may proceed to the process in step S105.
ステップS105において、前記インスタンスは、自動解析完了通知をデータ解析クライアント端末20に送信する。当該自動解析完了通知の送信が終了したことに応じて、前記インスタンスは停止してよい。
In step S105, the instance sends an automatic analysis completion notification to the data analysis client terminal 20. The instance may be stopped in response to the end of transmission of the automatic analysis completion notification.
ステップS106において、データ解析クライアント端末20は、前記自動解析完了通知を受信する。データ解析クライアント端末20は、当該自動解析完了通知を出力装置に出力させる。また、データ解析クライアント端末20は、前記自動解析完了通知を受信したことに応じて、例えば、出力用データリクエストをサーバシステム10に送信するかをユーザに問い合わせる画面を表示してよい。当該画面中には、例えば、データ解析クライアント端末20に出力用データリクエストをサーバシステム10に送信させるためのボタンが配置されていてよい。
In step S106, the data analysis client terminal 20 receives the automatic analysis completion notification. The data analysis client terminal 20 causes the output device to output the automatic analysis completion notification. Further, the data analysis client terminal 20 may display a screen asking the user whether to send an output data request to the server system 10 in response to receiving the automatic analysis completion notification. In the screen, for example, a button for causing the data analysis client terminal 20 to send an output data request to the server system 10 may be arranged.
ステップS107において、データ解析クライアント端末20は、出力用データリクエストを、サーバシステム10に送信する。例えばデータ解析クライアント端末20のユーザにより、前記画面中のボタンがクリック又は選択されることに応じて、データ解析クライアント端末20は当該送信を実行しうる。
In step S107, the data analysis client terminal 20 transmits an output data request to the server system 10. For example, the data analysis client terminal 20 may execute the transmission in response to the click or selection of a button on the screen by the user of the data analysis client terminal 20.
ステップS108において、サーバシステム10は、出力用データリクエストを受信する。
In step S108, the server system 10 receives an output data request.
ステップS109において、サーバシステム10は、ステップS104において生成された出力用データをデータ解析クライアント端末20に送信する。
In step S109, the server system 10 transmits the output data generated in step S104 to the data analysis client terminal 20.
ステップS110において、データ解析クライアント端末20は、サーバシステム10から送信された前記出力用データを受信する。
In step S110, the data analysis client terminal 20 receives the output data transmitted from the server system 10.
ステップS111において、データ解析クライアント端末20は、前記出力用データを出力装置に出力させる。
In step S111, the data analysis client terminal 20 causes the output device to output the output data.
(4-3)出力用データ取得処理
(4-3) Output data acquisition process
情報処理システム1による出力用データ取得処理を、図16を参照しながら以下で説明する。
The output data acquisition process by the information processing system 1 will be described below with reference to FIG.
ステップS201において、データ解析クライアント端末20が、出力用データリクエストを、サーバシステム10に送信する。当該リクエストは、サーバシステム10が出力用データを取得又は生成するために用いられる情報を含んでよい。例えば、当該リクエストは、解析結果データを特定するために用いられる情報、及び/又は、解析結果データから出力用データを生成するために用いられる情報を含む。ステップS201において、送信される情報は、当該リクエストに加えて、データ解析クライアント端末20のユーザ認証情報を含んでもよい。ステップS201における送信は、ネットワーク50を介して行われてよい。
In step S201, the data analysis client terminal 20 sends an output data request to the server system 10. The request may include information used by the server system 10 to acquire or generate output data. For example, the request includes information used to identify analysis result data and / or information used to generate output data from the analysis result data. In step S201, the transmitted information may include the user authentication information of the data analysis client terminal 20 in addition to the request. The transmission in step S201 may be performed via the network 50.
ステップS202において、サーバシステム10は、ネットワーク50を介して、データ解析クライアント端末20から送信された出力用データリクエストを受信する。
In step S202, the server system 10 receives an output data request transmitted from the data analysis client terminal 20 via the network 50.
ステップS203において、サーバシステム10(特には出力用データ生成部13)は、解析結果データ記憶部16から出力用データを取得してよく、又は、解析結果データ記憶部16に格納されている解析結果データから出力用データを生成してもよい。当該出力用データは、解析結果データの一部であってよい。当該出力用データは、例えば、二次元プロット画像、スペクトルプロット画像、及びクラスタリング結果表示図のうちの一つ以上を含む。当該出力用データは、これらの画像を生成するためのデータを含んでよく、一方で、解析処理において用いられた蛍光標識強度データは含まなくてよい。当該出力用データは、これらの画像を編集可能であるように構成されていてよい。これにより、例えばデータ解析クライアント端末が、出力されたデータに対して編集処理を実行することができる。また、当該出力用データは、統計解析結果データなどの数値データを含んでもよい。
In step S203, the server system 10 (particularly, the output data generation unit 13) may acquire output data from the analysis result data storage unit 16, or the analysis result stored in the analysis result data storage unit 16. Output data may be generated from the data. The output data may be a part of the analysis result data. The output data includes, for example, one or more of a two-dimensional plot image, a spectrum plot image, and a clustering result display diagram. The output data may include data for generating these images, while may not include the fluorescent label intensity data used in the analysis process. The output data may be configured so that these images can be edited. As a result, for example, the data analysis client terminal can execute the editing process on the output data. Further, the output data may include numerical data such as statistical analysis result data.
出力用データ生成部13による処理は、サーバシステム10内の常時稼働している仮想サーバにより実行されてよい。当該仮想サーバが常時稼働していることによって、出力用データ取得処理を高速に実行することができる。
また、出力用データ生成部13は、サーバレスアーキテクチャとして構成されてもよい。 The process by the outputdata generation unit 13 may be executed by the constantly running virtual server in the server system 10. Since the virtual server is always running, the output data acquisition process can be executed at high speed.
Further, the outputdata generation unit 13 may be configured as a serverless architecture.
また、出力用データ生成部13は、サーバレスアーキテクチャとして構成されてもよい。 The process by the output
Further, the output
出力用データ生成部13による出力用データの取得又は生成処理は、サーバシステム10が、例えばAmazon Web Services(商標)である場合、例えばAmazon ECSにより生成又は管理されたコンテナにおいて前記処理が実行されてよい。当該コンテナにおいて、例えばAWS Fargateが、前記処理を実行しうる。例えば、AWS Fargateが、Amazon S3内に格納されている出力用データを取得し、又は、Amazon S3内に格納されている解析結果データから出力用データを生成しうる。
When the server system 10 is, for example, Amazon Web Services (trademark), the output data acquisition or generation process by the output data generation unit 13 is executed in a container generated or managed by Amazon ECS, for example. good. In the container, for example, AWS Fargate can execute the above process. For example, AWS Fragate can acquire output data stored in Amazon S3, or can generate output data from analysis result data stored in Amazon S3.
ステップS204において、サーバシステム10は、ネットワーク50を介して出力用データをデータ解析クライアント端末20に送信する。
In step S204, the server system 10 transmits output data to the data analysis client terminal 20 via the network 50.
ステップS205において、データ解析クライアント端末20は、ネットワーク50を介して出力用データを受信する。
In step S205, the data analysis client terminal 20 receives output data via the network 50.
ステップS206において、データ解析クライアント端末20は、当該出力用データを出力装置に出力させる。
In step S206, the data analysis client terminal 20 causes the output device to output the output data.
(4-4)対話型解析処理
(4-4) Interactive analysis processing
情報処理システム1による対話型解析処理のフローを以下で図17を参照しながら説明する。当該解析処理は、上記(4-1)において説明した自動解析処理の後に続けて実行されてよく、又は、上記(4-3)において説明する出力用データ取得処理の後に続けて実行されてもよい。
The flow of interactive analysis processing by the information processing system 1 will be described below with reference to FIG. The analysis process may be executed continuously after the automatic analysis process described in (4-1) above, or may be executed continuously after the output data acquisition process described in (4-3) above. good.
ステップS301において、データ解析クライアント端末20は、対話型解析処理開始リクエストをサーバシステム10に、ネットワーク50を介して送信する。当該送信に先立ち、データ解析クライアント端末20は、出力用データを出力装置に出力させうる。例えば、ステップS301は、上記(4-1)において説明したステップS107の次に実行されてよく、又は、上記(4-3)において説明したステップS206の次に実行されてもよい。
In step S301, the data analysis client terminal 20 transmits an interactive analysis processing start request to the server system 10 via the network 50. Prior to the transmission, the data analysis client terminal 20 may have the output device output the output data. For example, step S301 may be executed after step S107 described in (4-1) above, or may be executed after step S206 described in (4-3) above.
例えば、上記(4-3)において説明した出力用データ取得処理が行われる場合、図20に示されるようなウィンドウを、データ解析クライアント端末20は出力装置に出力させる。そして、ステップS206において、図21に示されるように、取得された出力用データ(プロットデータ)が、当該ウィンドウ内に表示される。
For example, when the output data acquisition process described in (4-3) above is performed, the data analysis client terminal 20 causes the output device to output a window as shown in FIG. 20. Then, in step S206, as shown in FIG. 21, the acquired output data (plot data) is displayed in the window.
前記リクエストは、例えば対話型解析処理の対象となる解析対象データを特定するために用いられる特定用データを含む。当該特定用データは、例えば生体試料を特定する情報、及び、生体試料に対して行われた分析を特定する情報を含む。
The request includes, for example, identification data used for specifying analysis target data to be subject to interactive analysis processing. The identification data includes, for example, information identifying a biological sample and information identifying an analysis performed on the biological sample.
ステップS302において、サーバシステム10は、ネットワーク50を介して前記リクエストを受信する。
In step S302, the server system 10 receives the request via the network 50.
ステップS303において、サーバシステム10(特には対話型解析処理部12)は、前記リクエストを受信したことに応じて、対話型解析処理を実行するためのコンピューテーションリソースをサーバシステム10上に確保する。当該コンピューテーションリソースが、当該対話型解析処理を実行する仮想サーバとして機能する。
In step S303, the server system 10 (particularly, the interactive analysis processing unit 12) secures a computing resource on the server system 10 for executing the interactive analysis processing in response to receiving the request. .. The computing resource functions as a virtual server that executes the interactive analysis process.
ステップS304において、対話型解析処理部12(特には前記仮想サーバ)は、解析対象データを取得する。対話型解析処理部12は、前記特定用データを参照して、取得されるべき解析対象データを特定してよい。
In step S304, the interactive analysis processing unit 12 (particularly the virtual server) acquires the analysis target data. The interactive analysis processing unit 12 may specify the analysis target data to be acquired by referring to the identification data.
当該解析対象データは、前記出力用データが由来する解析結果データを含んでよい。また、当該解析対象データは、当該解析結果データが由来する光強度データ及び/又は蛍光標識強度データを含んでもよい。
ステップS304における解析対象データの取得後、対話型解析処理部12は、後述の解析コマンドが受信されたかを監視し、すなわち当該解析コマンドの受信まで待機する。を含んでもよい。 The analysis target data may include analysis result data from which the output data is derived. Further, the analysis target data may include light intensity data and / or fluorescent label intensity data from which the analysis result data is derived.
After acquiring the analysis target data in step S304, the interactiveanalysis processing unit 12 monitors whether or not the analysis command described later has been received, that is, waits until the analysis command is received. May include.
ステップS304における解析対象データの取得後、対話型解析処理部12は、後述の解析コマンドが受信されたかを監視し、すなわち当該解析コマンドの受信まで待機する。を含んでもよい。 The analysis target data may include analysis result data from which the output data is derived. Further, the analysis target data may include light intensity data and / or fluorescent label intensity data from which the analysis result data is derived.
After acquiring the analysis target data in step S304, the interactive
ステップS304の実行の後且つステップS305の前に、サーバシステム10とデータ解析クライアント端末20との間に、RPC(Remote Procedure Call)を実行するためのセッションが確立されてよい。例えば、当該確立のために、サーバシステム10は、例えば、コンピューテーションリソースが確保されたことを知らせる通知を、データ解析クライアント端末20に送信しうる。当該通知の受領に応じて、当該確立が行われうる。当該通知は、例えば、サーバーサイドPush技術を用いた通知方式による通知であってよい。代替的には、データ解析クライアント端末20からサーバシステム10へのポーリングによる状態取得によって、当該確立が行われてもよい。
RPCの確立によって、ステップS305以降において、データ解析クライアント端末20から送信された解析コマンドに従い、サーバシステム10が解析処理を実行することができる。サーバシステム10及びデータ解析クライアント端末20はいずれも、RPCを実行するための機能要素である接続部を含んでよい。サーバシステム10が有する接続部14及びデータ解析クライアント端末20が有する接続部23との組合せによって、RPCが実行されてよい。これら接続部の例としてMagicOnionを挙げることができるがこれに限定されない。 After the execution of step S304 and before step S305, a session for executing RPC (Remote Procedure Call) may be established between theserver system 10 and the data analysis client terminal 20. For example, for the establishment, the server system 10 may send, for example, a notification to the data analysis client terminal 20 notifying that the computation resource has been secured. Upon receipt of the notice, the establishment may be made. The notification may be, for example, a notification by a notification method using server-side push technology. Alternatively, the establishment may be performed by acquiring the state by polling from the data analysis client terminal 20 to the server system 10.
By establishing the RPC, in step S305 and subsequent steps, theserver system 10 can execute the analysis process according to the analysis command transmitted from the data analysis client terminal 20. Both the server system 10 and the data analysis client terminal 20 may include a connection unit which is a functional element for executing RPC. The RPC may be executed by the combination of the connection unit 14 of the server system 10 and the connection unit 23 of the data analysis client terminal 20. MagicOnion can be mentioned as an example of these connection portions, but the present invention is not limited thereto.
RPCの確立によって、ステップS305以降において、データ解析クライアント端末20から送信された解析コマンドに従い、サーバシステム10が解析処理を実行することができる。サーバシステム10及びデータ解析クライアント端末20はいずれも、RPCを実行するための機能要素である接続部を含んでよい。サーバシステム10が有する接続部14及びデータ解析クライアント端末20が有する接続部23との組合せによって、RPCが実行されてよい。これら接続部の例としてMagicOnionを挙げることができるがこれに限定されない。 After the execution of step S304 and before step S305, a session for executing RPC (Remote Procedure Call) may be established between the
By establishing the RPC, in step S305 and subsequent steps, the
ステップS304において、対話型解析処理部12(特には前記仮想サーバ)は、解析に必要なデータを取得してよい。前記解析に必要なデータは、例えば、蛍光標識強度データの算出のために用いられるデータ、及び、蛍光強度標識データに対する解析処理において用いられるデータを含みうる。
蛍光標識強度データの算出のために用いられるデータは、例えばスペクトラルリファレンスデータを含みうる。当該データは、アンミキシング処理のために用いられる。
蛍光強度標識データに対する解析処理において用いられるデータは、さらに前記解析コマンドを含みうる。 In step S304, the interactive analysis processing unit 12 (particularly the virtual server) may acquire data necessary for analysis. The data required for the analysis may include, for example, data used for calculating the fluorescence label intensity data and data used in the analysis process for the fluorescence intensity label data.
The data used to calculate the fluorescence label intensity data may include, for example, spectral reference data. The data is used for the unmixing process.
The data used in the analysis process for the fluorescence intensity labeled data may further include the analysis command.
ステップS305において、データ解析クライアント端末20は、前記出力用データに対する解析コマンドの入力を受け付ける。ステップS305において、データ解析クライアント端末20は、当該解析コマンドの入力を受け付けるためのウィンドウを出力装置に表示させる。ユーザは、当該ウィンドウを介して、解析コマンドを入力する。入力される解析コマンドは、例えば、ステップS301において出力されている出力用データを取得するために用いられた解析コマンドに含まれる各種設定コマンドのうちの1つ以上が変更された解析コマンドであってよい。例えば、入力される解析コマンドは、変更されたゲート設定コマンド、変更されたプロット設定コマンド、変更された軸設定コマンド、変更された軸表示設定コマンド、変更された統計設定コマンド、及び変更されたリージョン設定コマンドのうちの少なくとも一つ以上を含む。また、当該解析コマンドは、変更されたクラスタリングコマンドを含んでもよい。
In step S305, the data analysis client terminal 20 receives an input of an analysis command for the output data. In step S305, the data analysis client terminal 20 causes the output device to display a window for accepting the input of the analysis command. The user inputs an analysis command through the window. The input analysis command is, for example, an analysis command in which one or more of the various setting commands included in the analysis command used to acquire the output data output in step S301 is modified. good. For example, the analysis commands entered are modified gate configuration commands, modified plot configuration commands, modified axis configuration commands, modified axis display configuration commands, modified statistical configuration commands, and modified regions. Includes at least one of the configuration commands. The analysis command may also include a modified clustering command.
ステップS306において、データ解析クライアント端末20は、ステップS305において入力された解析コマンドを、サーバシステム10に送信する。
In step S306, the data analysis client terminal 20 transmits the analysis command input in step S305 to the server system 10.
ステップS307において、サーバシステム10は、データ解析クライアント端末20から送信された解析コマンドを受信する。当該解析コマンドを受信したことに応じて、ステップS308~S310の処理が実行される。これらの処理は、当該解析コマンドの受信をトリガーとするイベントドリブンの解析処理であってよい。すなわち、本技術に従う対話型解析処理は、イベント駆動型の解析処理であってよい。
In step S307, the server system 10 receives the analysis command transmitted from the data analysis client terminal 20. The processes of steps S308 to S310 are executed in response to the receipt of the analysis command. These processes may be event-driven analysis processes triggered by the reception of the analysis command. That is, the interactive analysis process according to the present technique may be an event-driven analysis process.
対話型解析処理部12による処理は、例えばサーバレスで実行されてよく、いわゆるサーバレスアーキテクチャとして構成されてよい。サーバシステム10が、例えばAmazon Web Services(商標)である場合、対話型解析処理部12による処理は、例えばAWS Lambdaによって実行されてよく、特にはAWS LambdaとAmazon EC2との組合せを含むシステムによって実行される。
The processing by the interactive analysis processing unit 12 may be executed, for example, serverless, and may be configured as a so-called serverless architecture. When the server system 10 is, for example, Amazon Web Services (trademark), the processing by the interactive analysis processing unit 12 may be executed by, for example, AWS Lambda, and in particular, executed by a system including a combination of AWS Lambda and Amazon EC2. Will be done.
ステップS308において、対話型解析処理部12(特には前記仮想サーバ)は、前記光強度データから蛍光標識強度データを算出する処理を実行する。そして、対話型解析処理部12は、当該算出された蛍光標識強度データを用いて、解析結果データを生成する処理を実行する。
なお、蛍光標識強度データに変更が生じない場合は、対話型解析処理部12は、蛍光標識強度データの算出処理を省略してよく、すなわち、既存の蛍光標識強度データを用いて解析結果データを生成する処理だけを実行してもよい。
対話型解析処理部12は、ステップS308において生成された解析結果データを、例えば解析結果データ記憶部16に保存する。また、対話型解析処理部12は、ステップS308において生成された前記蛍光標識強度データを、例えば光データ記憶部に保存する。これらの保存処理は、例えばステップS308の処理後に行われてよく、又は、ステップS310の処理後に行われてもよい。 In step S308, the interactive analysis processing unit 12 (particularly, the virtual server) executes a process of calculating fluorescent label intensity data from the light intensity data. Then, the interactiveanalysis processing unit 12 executes a process of generating analysis result data using the calculated fluorescent label intensity data.
If the fluorescent label intensity data does not change, the interactiveanalysis processing unit 12 may omit the calculation process of the fluorescent label intensity data, that is, the analysis result data may be obtained using the existing fluorescent label intensity data. You may execute only the process to generate.
The interactiveanalysis processing unit 12 stores the analysis result data generated in step S308 in, for example, the analysis result data storage unit 16. Further, the interactive analysis processing unit 12 stores the fluorescent label intensity data generated in step S308 in, for example, an optical data storage unit. These storage processes may be performed, for example, after the process of step S308, or may be performed after the process of step S310.
なお、蛍光標識強度データに変更が生じない場合は、対話型解析処理部12は、蛍光標識強度データの算出処理を省略してよく、すなわち、既存の蛍光標識強度データを用いて解析結果データを生成する処理だけを実行してもよい。
対話型解析処理部12は、ステップS308において生成された解析結果データを、例えば解析結果データ記憶部16に保存する。また、対話型解析処理部12は、ステップS308において生成された前記蛍光標識強度データを、例えば光データ記憶部に保存する。これらの保存処理は、例えばステップS308の処理後に行われてよく、又は、ステップS310の処理後に行われてもよい。 In step S308, the interactive analysis processing unit 12 (particularly, the virtual server) executes a process of calculating fluorescent label intensity data from the light intensity data. Then, the interactive
If the fluorescent label intensity data does not change, the interactive
The interactive
ステップS309において、対話型解析処理部12は、データ解析クライアント端末において出力される出力用データを生成する。例えば、対話型解析処理部12は、ステップS309において生成された解析結果データから、出力用データを特定し又は抽出しうる。当該出力用データは、解析結果データの一部であってよい。当該出力用データは、例えば、二次元プロット画像、スペクトルプロット画像、及びクラスタリング結果表示図のうちの一つ以上を含む。当該出力用データは、これらの画像を生成するためのデータを含んでよく、一方で、解析処理において用いられた蛍光標識強度データは含まなくてよい。当該出力用データは、これらの画像を編集可能であるように構成されていてよい。これにより、例えばデータ解析クライアント端末が、出力されたデータに対して編集処理を実行することができる。また、当該出力用データは、統計解析結果データなどの数値データを含んでもよい。
In step S309, the interactive analysis processing unit 12 generates output data output by the data analysis client terminal. For example, the interactive analysis processing unit 12 can specify or extract output data from the analysis result data generated in step S309. The output data may be a part of the analysis result data. The output data includes, for example, one or more of a two-dimensional plot image, a spectrum plot image, and a clustering result display diagram. The output data may include data for generating these images, while may not include the fluorescent label intensity data used in the analysis process. The output data may be configured so that these images can be edited. As a result, for example, the data analysis client terminal can execute the editing process on the output data. Further, the output data may include numerical data such as statistical analysis result data.
ステップS309において、サーバシステム10は、生成された出力用データを、データ解析クライアント端末20に送信する。出力用データの送信は、出力用データを構成するデータ単位毎に行われてよく、又は、出力用データ全体が一括して送信されてもよい。
前者に関して、例えば出力用データが統計量データ及び画像データ(二次元プロット画像、スペクトルプロット画像、及びクラスタリング結果表示図のうちの一つ以上)の2つを含む場合が想定される。例えば出力用の統計量データが生成されたら、サーバシステム10は当該統計量データを送信し、その後、出力用の画像データが生成されたら、サーバシステム10は当該画像データを送信しうる。代替的には、この反対に、先に当該画像データが送信され、次に、統計量データが送信されてもよい。このように、サーバシステム10は、データ単位毎に、出力用データを送信しうる。 In step S309, theserver system 10 transmits the generated output data to the data analysis client terminal 20. The output data may be transmitted for each data unit constituting the output data, or the entire output data may be transmitted collectively.
Regarding the former, for example, it is assumed that the output data includes two of statistical data and image data (one or more of a two-dimensional plot image, a spectral plot image, and a clustering result display diagram). For example, if the statistic data for output is generated, theserver system 10 may transmit the statistic data, and then if the image data for output is generated, the server system 10 may transmit the image data. Alternatively, on the contrary, the image data may be transmitted first, and then the statistic data may be transmitted. In this way, the server system 10 can transmit output data for each data unit.
前者に関して、例えば出力用データが統計量データ及び画像データ(二次元プロット画像、スペクトルプロット画像、及びクラスタリング結果表示図のうちの一つ以上)の2つを含む場合が想定される。例えば出力用の統計量データが生成されたら、サーバシステム10は当該統計量データを送信し、その後、出力用の画像データが生成されたら、サーバシステム10は当該画像データを送信しうる。代替的には、この反対に、先に当該画像データが送信され、次に、統計量データが送信されてもよい。このように、サーバシステム10は、データ単位毎に、出力用データを送信しうる。 In step S309, the
Regarding the former, for example, it is assumed that the output data includes two of statistical data and image data (one or more of a two-dimensional plot image, a spectral plot image, and a clustering result display diagram). For example, if the statistic data for output is generated, the
ステップS310において、データ解析クライアント端末20は、出力用データを受信する。
In step S310, the data analysis client terminal 20 receives the output data.
ステップS311において、データ解析クライアント端末20は、出力装置に前記出力用データを出力させる。
In step S311 the data analysis client terminal 20 causes the output device to output the output data.
例えば図22に示されるように、図21のプロット画像の一部が変更されたプロット画像が、前記ウィンドウに表示される。
For example, as shown in FIG. 22, the plot image in which a part of the plot image of FIG. 21 is modified is displayed in the window.
ステップS312において出力された出力用データに対して、ステップS305~S312の処理が繰り返されてよい。これらの処理が繰り返されるたびに、出力装置に出力される出力用データが更新され、再描画されてよい。
以上のとおり、データ解析クライアント端末20における解析コマンド入力及びサーバシステム10による対話型解析処理が繰り返され、このようにして、サーバシステム10とデータ解析クライアント端末20とによる対話型解析処理が繰り返される。 The processes of steps S305 to S312 may be repeated for the output data output in step S312. Each time these processes are repeated, the output data output to the output device may be updated and redrawn.
As described above, the analysis command input in the dataanalysis client terminal 20 and the interactive analysis process by the server system 10 are repeated, and in this way, the interactive analysis process by the server system 10 and the data analysis client terminal 20 is repeated.
以上のとおり、データ解析クライアント端末20における解析コマンド入力及びサーバシステム10による対話型解析処理が繰り返され、このようにして、サーバシステム10とデータ解析クライアント端末20とによる対話型解析処理が繰り返される。 The processes of steps S305 to S312 may be repeated for the output data output in step S312. Each time these processes are repeated, the output data output to the output device may be updated and redrawn.
As described above, the analysis command input in the data
対話型解析処理の終了後、対話型解析処理部12は、前記仮想サーバを停止する。これにより、仮想サーバの稼働時間が余分に長くなることを防ぐことができ、サーバの利用にかかるコストが削減される。
対話型解析処理は、例えばデータ解析クライアント端末20が、対話型解析処理の終了指示を受け付けることによって終了されてよい。当該終了指示を受け付けたことに応じて、データ解析クライアント端末20は、終了指示をサーバシステム10に送信する。当該終了指示を受信したことに応じて、対話型解析処理部12は、前記仮想サーバを停止する。これにより、仮想サーバの稼働時間が余分に長くなることを防ぐことができ、サーバの利用にかかるコストが削減される。
代替的には、サーバシステム10がデータ解析クライアント端末20から解析コマンドを受信することなく所定時間が経過したことに応じて、対話型解析処理部12は、前記仮想サーバを停止してもよい。 After the interactive analysis processing is completed, the interactiveanalysis processing unit 12 stops the virtual server. As a result, it is possible to prevent the operating time of the virtual server from becoming excessively long, and the cost of using the server is reduced.
The interactive analysis process may be terminated, for example, by the dataanalysis client terminal 20 receiving an instruction to end the interactive analysis process. Upon receiving the termination instruction, the data analysis client terminal 20 transmits the termination instruction to the server system 10. Upon receiving the termination instruction, the interactive analysis processing unit 12 stops the virtual server. As a result, it is possible to prevent the operating time of the virtual server from becoming excessively long, and the cost of using the server is reduced.
Alternatively, the interactiveanalysis processing unit 12 may stop the virtual server in response to the elapse of a predetermined time without the server system 10 receiving the analysis command from the data analysis client terminal 20.
対話型解析処理は、例えばデータ解析クライアント端末20が、対話型解析処理の終了指示を受け付けることによって終了されてよい。当該終了指示を受け付けたことに応じて、データ解析クライアント端末20は、終了指示をサーバシステム10に送信する。当該終了指示を受信したことに応じて、対話型解析処理部12は、前記仮想サーバを停止する。これにより、仮想サーバの稼働時間が余分に長くなることを防ぐことができ、サーバの利用にかかるコストが削減される。
代替的には、サーバシステム10がデータ解析クライアント端末20から解析コマンドを受信することなく所定時間が経過したことに応じて、対話型解析処理部12は、前記仮想サーバを停止してもよい。 After the interactive analysis processing is completed, the interactive
The interactive analysis process may be terminated, for example, by the data
Alternatively, the interactive
以上の対話型解析処理では、必要な場合にだけ仮想サーバを稼働させることができる。そのため、常時稼働型サーバと比較して大幅にランニングコストを削減することができる。また、スケーラビリティの確保も可能となる。
In the above interactive analysis process, the virtual server can be operated only when necessary. Therefore, the running cost can be significantly reduced as compared with the always-operated server. It also makes it possible to ensure scalability.
(4-5)対話型解析処理の例
(4-5) Example of interactive analysis processing
以下で、サーバシステム10がAmazon Web Services(商標)である場合における図17の対話型解析処理フローの例を、さらに図18及び19を参照しながら説明する。
Hereinafter, an example of the interactive analysis processing flow of FIG. 17 in the case where the server system 10 is Amazon Web Services ™ will be described with reference to FIGS. 18 and 19.
図18に示されるように、ステップS301において、データ解析クライアント端末20は、対話型解析処理開始リクエストをサーバシステム10に、ネットワーク50を介して送信する。
As shown in FIG. 18, in step S301, the data analysis client terminal 20 transmits an interactive analysis processing start request to the server system 10 via the network 50.
ステップS302において、サーバシステム10は、ネットワーク50を介して前記リクエストを受信する。
In step S302, the server system 10 receives the request via the network 50.
ステップS303において、対話型解析処理部12として機能するAWS Lambdaは、前記リクエストを受信したことに応じて、対話型解析処理を実行するためのコンピューテーションリソースをサーバシステム10上に確保する。特には、AWS Lambdaは、Amazon ECSに、Amazon EC2内にコンテナ(特にはDockerコンテナ)を実行させる。当該コンテナ内で、後述の解析処理を実行する仮想サーバの処理が実行される。また、当該コンテナを構築せずに、当該仮想サーバの処理が実行されてもよい。
In step S303, AWS Lambda, which functions as the interactive analysis processing unit 12, secures a computing resource on the server system 10 for executing the interactive analysis processing in response to receiving the request. In particular, AWS Lambda causes Amazon ECS to execute a container (particularly a Docker container) in Amazon EC2. In the container, the processing of the virtual server that executes the analysis processing described later is executed. Further, the processing of the virtual server may be executed without constructing the container.
ステップS304において、前記インスタンスは、例えばAmazon S3に格納されている解析対象データを取得する。
また、ステップS304において、前記インスタンスは、解析に必要なデータを取得しうる。例えば、前記インスタンスは、Amazon Auroraに予め格納されている前記解析に必要なデータ(例えば蛍光標識強度データの算出のために用いられるデータなど)を取得する。
ステップS304の実行の後且つステップS305の前に、サーバシステム10とデータ解析クライアント端末20との間に、RPC(Remote Procedure Call)を実行するためのセッションが確立されてよい。例えば、サーバシステム10が、Amazon EC2内にコンピューテーションリソースが確保されたことを知らせる通知を、データ解析クライアント端末20に送信しうる。当該通知の受領に応じて、当該確立が行われてよい。サーバシステム10及びデータ解析クライアント端末20はいずれも、RPCを実行するための機能要素である接続部として、MagicOnionを備えていてよい。
ステップS304における解析対象データの取得後、前記インスタンスは、後述の解析コマンドが受信されたかを監視し、すなわち当該解析コマンドの受信まで待機する。 In step S304, the instance acquires analysis target data stored in, for example, Amazon S3.
Further, in step S304, the instance can acquire data necessary for analysis. For example, the instance acquires data necessary for the analysis (for example, data used for calculating fluorescent label intensity data) stored in advance in Amazon Aurora.
After the execution of step S304 and before step S305, a session for executing RPC (Remote Procedure Call) may be established between theserver system 10 and the data analysis client terminal 20. For example, the server system 10 may send a notification to the data analysis client terminal 20 notifying that the computation resource has been secured in Amazon EC2. The establishment may be made upon receipt of the notice. Both the server system 10 and the data analysis client terminal 20 may include a MagicOnion as a connection unit which is a functional element for executing RPC.
After acquiring the analysis target data in step S304, the instance monitors whether the analysis command described later is received, that is, waits until the analysis command is received.
また、ステップS304において、前記インスタンスは、解析に必要なデータを取得しうる。例えば、前記インスタンスは、Amazon Auroraに予め格納されている前記解析に必要なデータ(例えば蛍光標識強度データの算出のために用いられるデータなど)を取得する。
ステップS304の実行の後且つステップS305の前に、サーバシステム10とデータ解析クライアント端末20との間に、RPC(Remote Procedure Call)を実行するためのセッションが確立されてよい。例えば、サーバシステム10が、Amazon EC2内にコンピューテーションリソースが確保されたことを知らせる通知を、データ解析クライアント端末20に送信しうる。当該通知の受領に応じて、当該確立が行われてよい。サーバシステム10及びデータ解析クライアント端末20はいずれも、RPCを実行するための機能要素である接続部として、MagicOnionを備えていてよい。
ステップS304における解析対象データの取得後、前記インスタンスは、後述の解析コマンドが受信されたかを監視し、すなわち当該解析コマンドの受信まで待機する。 In step S304, the instance acquires analysis target data stored in, for example, Amazon S3.
Further, in step S304, the instance can acquire data necessary for analysis. For example, the instance acquires data necessary for the analysis (for example, data used for calculating fluorescent label intensity data) stored in advance in Amazon Aurora.
After the execution of step S304 and before step S305, a session for executing RPC (Remote Procedure Call) may be established between the
After acquiring the analysis target data in step S304, the instance monitors whether the analysis command described later is received, that is, waits until the analysis command is received.
図19に示されるように、ステップS305において、データ解析クライアント端末20は、前記出力用データに対する解析コマンドの入力を受け付ける。
As shown in FIG. 19, in step S305, the data analysis client terminal 20 receives an input of an analysis command for the output data.
ステップS306において、データ解析クライアント端末20は、ステップS305において入力された解析コマンドを、サーバシステム10に送信する。
In step S306, the data analysis client terminal 20 transmits the analysis command input in step S305 to the server system 10.
ステップS307において、サーバシステム10は、データ解析クライアント端末20から送信された解析コマンドを受信する。当該解析コマンドを受信したことに応じて、ステップS308~S309の処理が実行される。これらの処理は、当該解析コマンドの受信をトリガーとするイベントドリブンの解析処理であってよい。すなわち、本技術に従う対話型解析処理は、イベント駆動型の解析処理であってよい。
In step S307, the server system 10 receives the analysis command transmitted from the data analysis client terminal 20. The processes of steps S308 to S309 are executed in response to the receipt of the analysis command. These processes may be event-driven analysis processes triggered by the reception of the analysis command. That is, the interactive analysis process according to the present technique may be an event-driven analysis process.
ステップS308において、前記インスタンスは、前記光強度データから蛍光標識強度データを算出する処理を実行する。そして、前記インスタンスは、当該算出された蛍光標識強度データを用いて、解析結果データを生成する処理を実行する。
なお、蛍光標識強度データに変更が生じない場合は、前記インスタンスは、蛍光標識強度データを省略してよく、すなわち、既存の蛍光標識強度データを用いて解析結果データを生成する処理だけを実行してもよい。
前記インスタンスは、ステップS308において生成された解析結果データを、例えばS3のバケットに保存する。また、対話型解析処理部12は、ステップS308において生成された前記蛍光標識強度データも、当該バケットに保存する。 In step S308, the instance executes a process of calculating fluorescent label intensity data from the light intensity data. Then, the instance executes a process of generating analysis result data using the calculated fluorescent label intensity data.
If the fluorescent label intensity data does not change, the instance may omit the fluorescent label intensity data, that is, only the process of generating the analysis result data using the existing fluorescent label intensity data is executed. You may.
The instance stores the analysis result data generated in step S308 in, for example, the bucket of S3. The interactiveanalysis processing unit 12 also stores the fluorescent label intensity data generated in step S308 in the bucket.
なお、蛍光標識強度データに変更が生じない場合は、前記インスタンスは、蛍光標識強度データを省略してよく、すなわち、既存の蛍光標識強度データを用いて解析結果データを生成する処理だけを実行してもよい。
前記インスタンスは、ステップS308において生成された解析結果データを、例えばS3のバケットに保存する。また、対話型解析処理部12は、ステップS308において生成された前記蛍光標識強度データも、当該バケットに保存する。 In step S308, the instance executes a process of calculating fluorescent label intensity data from the light intensity data. Then, the instance executes a process of generating analysis result data using the calculated fluorescent label intensity data.
If the fluorescent label intensity data does not change, the instance may omit the fluorescent label intensity data, that is, only the process of generating the analysis result data using the existing fluorescent label intensity data is executed. You may.
The instance stores the analysis result data generated in step S308 in, for example, the bucket of S3. The interactive
ステップS309において、前記インスタンスは、前記解析結果データから、出力用データを生成し、そして、当該生成された出力用データをデータ解析クライアント端末20に送信する。
In step S309, the instance generates output data from the analysis result data, and transmits the generated output data to the data analysis client terminal 20.
ステップS310において、データ解析クライアント端末20は、出力用データを受信する。
In step S310, the data analysis client terminal 20 receives the output data.
ステップS311において、データ解析クライアント端末20は、出力装置に前記出力用データを出力させる。
In step S311 the data analysis client terminal 20 causes the output device to output the output data.
ステップS311において出力された出力用データに対して、ステップS305~S311の処理が繰り返されてよい。すなわち、データ解析クライアント端末20における解析コマンド入力及びサーバシステム10による対話型解析処理が繰り返され、このようにして、サーバシステム10とデータ解析クライアント端末20とによる対話型解析処理が繰り返される。
The processing of steps S305 to S311 may be repeated for the output data output in step S311. That is, the analysis command input in the data analysis client terminal 20 and the interactive analysis process by the server system 10 are repeated, and in this way, the interactive analysis process by the server system 10 and the data analysis client terminal 20 is repeated.
(5)リージョンの設定
(5) Region settings
サーバシステム10は、地理的に分散された複数のデータセンターそれぞれに存在するサーバ群から構成されてよい。当該複数のデータセンターは、例えば複数の国に分散して存在していてよい。各データセンターはリージョンと呼ばれうる。
The server system 10 may be composed of a group of servers existing in each of a plurality of geographically dispersed data centers. The plurality of data centers may be distributed in a plurality of countries, for example. Each data center can be called a region.
本開示において、サーバシステム10は、データ解析クライアント端末20及び/又はデータ取得クライアント端末30が存在する位置に応じて、前記複数のデータセンターのうちから、本開示に従う自動解析処理及び/又は対話型解析処理を実行するデータセンターを特定し、当該特定されたデータセンター内のサーバが、これらの処理を実行しうる。好ましくは、サーバシステム10は、前記複数のデータセンターのうちから、前記位置により近いデータセンターを前記処理を実行するデータセンターとして特定しうる。
In the present disclosure, the server system 10 has an automatic analysis process and / or an interactive type according to the present disclosure from the plurality of data centers according to the position where the data analysis client terminal 20 and / or the data acquisition client terminal 30 exists. A data center that executes analysis processing can be specified, and a server in the specified data center can execute these processing. Preferably, the server system 10 can specify the data center closer to the location as the data center that executes the processing from the plurality of data centers.
本開示において、サーバシステム10は、データ解析クライアント端末20及び/又はデータ取得クライアント端末30が存在する位置に関する情報又は契約情報など、事前に設定された情報に応じて、前記複数のデータセンターのうちから、本開示の処理において用いられるデータがアップロード又は格納されるデータセンターを特定し、当該特定されたデータセンター内のサーバ内に、前記データがアップロード又は格納されうる。好ましくは、サーバシステム10は、前記複数のデータセンターのうちから、前記位置により近いデータセンターを前記アップロード又は格納が行われるデータセンターとして特定しうる。
In the present disclosure, the server system 10 is among the plurality of data centers according to preset information such as information or contract information regarding the location where the data analysis client terminal 20 and / or the data acquisition client terminal 30 exists. Therefore, the data center in which the data used in the processing of the present disclosure is uploaded or stored may be specified, and the data may be uploaded or stored in the server in the specified data center. Preferably, the server system 10 can specify the data center closer to the location as the data center in which the upload or storage is performed from among the plurality of data centers.
特に好ましくは、前記処理を実行するサーバ及び前記アップロード又は格納が行われるサーバは、同じデータセンター内に存在していてよい。
Particularly preferably, the server that executes the process and the server that performs the upload or storage may exist in the same data center.
以上のようにデータセンターを選択することによって、本開示に従う処理の高速化が可能である。例えばデータの保存先であるデータセンターを、ユーザーや契約といった単位で設定可能な構成とすることで、ユーザに地理的に近いデータセンターを利用することができ、データのアップロードの高速化や、対話型解析時のレスポンスの高速化などが可能である。
By selecting a data center as described above, it is possible to speed up the processing in accordance with this disclosure. For example, by configuring the data center where data is saved in units such as users and contracts, it is possible to use a data center that is geographically close to the user, speeding up data upload, and dialogue. It is possible to speed up the response during type analysis.
(6)データ移行
(6) Data migration
本開示において、前記光データ記憶部は、アクセス速度の異なる2種類以上のストレージを含んでよい。さらに、前記サーバシステムは、アクセス速度がより高いストレージ(以下「ホットストレージ」ともいう)に格納されている前記光強度データ及び/又は前記蛍光標識強度データを、所定の条件が満たされた場合に、アクセス速度がより低いストレージ(以下「コールドストレージ」ともいう)へと移行する移行処理を実行してよい。
In the present disclosure, the optical data storage unit may include two or more types of storage having different access speeds. Further, the server system uses the light intensity data and / or the fluorescent label intensity data stored in the storage having a higher access speed (hereinafter, also referred to as “hot storage”) when a predetermined condition is satisfied. , You may execute the migration process to migrate to the storage with lower access speed (hereinafter also referred to as "cold storage").
一般的に、クラウドプラットフォームにおけるストレージについては、データにすぐにアクセスできる代わりに単価の高いいわゆるホットストレージや、逆にデータアクセスに対する応答速度は遅いがその分単価も低いいわゆるコールドストレージと言われるような、何種類かのストレージサービスを提供していることが多い。本開示において、上記のとおり、前記移行処理を実行することによって、データをホットストレージからコールドストレージへ移行することが可能であり、コスト削減が可能となる。当該移行処理を実行するための前記所定の条件は、ユーザによって予め設定されてよい。例えば、前記所定の条件は、前記データへの最終アクセス後、当該データへのアクセスが無く所定日数経過した場合において、前記移行処理を実行するなどの条件であってよい。
Generally, storage on cloud platforms is so-called hot storage, which has a high unit price instead of being able to access data immediately, and conversely, so-called cold storage, which has a slow response speed to data access but a low unit price. , Often offers several types of storage services. In the present disclosure, as described above, by executing the migration process, it is possible to migrate data from hot storage to cold storage, and it is possible to reduce costs. The predetermined conditions for executing the migration process may be preset by the user. For example, the predetermined condition may be a condition such as executing the migration process when a predetermined number of days have passed without access to the data after the final access to the data.
好ましくは、前記サーバシステムは、前記移行処理の対象となるデータを、圧縮処理してから、前記移行処理を実行する。これにより、ストレージ費用をさらに軽減することができる。
Preferably, the server system compresses the data to be migrated and then executes the migration process. As a result, the storage cost can be further reduced.
コールドストレージ内に格納されているデータに対してアクセスするために、サーバシステム10は、コールドストレージからホットストレージへのデータコピーが行われてよい。また、圧縮されているデータに対してアクセスするために、サーバシステム10は、前記データコピーの際に、展開処理も実行しうる。
In order to access the data stored in the cold storage, the server system 10 may copy the data from the cold storage to the hot storage. Further, in order to access the compressed data, the server system 10 can also execute the decompression process at the time of the data copy.
サーバシステム10は、データが存在するストレージ(どのコールドストレージ又はどのホットストレージに存在するか)に関する情報を含むデータベースを含んでよい。サーバシステム10又はデータ解析クライアント端末20は、当該データベースを参照することによって、簡便に、コールドストレージ内のデータへアクセスすることができる。
The server system 10 may include a database containing information about the storage in which the data resides (which cold storage or which hot storage it resides in). The server system 10 or the data analysis client terminal 20 can easily access the data in the cold storage by referring to the database.
(7)外部のストレージ又はコンピュ―テーションリソースの利用
(7) Use of external storage or computation resources
上記(4-1)において述べたとおり、本開示に従う情報処理システムに含まれる自動解析処理部は、光データ記憶部15へ光強度データが格納されたことに応じて、自動解析処理を開始してよい。光データ記憶部15は、上記(4-1)において説明した実施態様では、サーバシステム10内に存在するが、本開示において、光データ記憶部15は、サーバシステム10外に存在してもよい。例えば、サーバシステム10の外部に存在する外部ストレージが、光強度データが格納される光データ記憶部15として用いられてもよい。
As described in (4-1) above, the automatic analysis processing unit included in the information processing system according to the present disclosure starts the automatic analysis processing in response to the light intensity data being stored in the optical data storage unit 15. It's okay. The optical data storage unit 15 exists in the server system 10 in the embodiment described in (4-1) above, but in the present disclosure, the optical data storage unit 15 may exist outside the server system 10. .. For example, an external storage existing outside the server system 10 may be used as the optical data storage unit 15 in which the optical intensity data is stored.
サーバシステム10の外部に存在する外部ストレージは、例えば本開示に従う情報処理システムのユーザが保有するオンラインストレージであってよい。サーバシステム10(特には自動解析処理部11)は、当該外部ストレージに光強度データが格納されたことに応じて、上記(4-1)において述べた自動解析処理を開始してよい。例えば、当該外部ストレージは、光強度データが格納されたことを、サーバシステム10に通知しうる。当該通知の受信をトリガーとして、上記(4-1)において述べたイベントドリブンの解析処理を、自動解析処理部11は実行しうる。
The external storage existing outside the server system 10 may be, for example, an online storage owned by a user of the information processing system according to the present disclosure. The server system 10 (particularly, the automatic analysis processing unit 11) may start the automatic analysis processing described in (4-1) above in response to the light intensity data being stored in the external storage. For example, the external storage may notify the server system 10 that the light intensity data has been stored. With the reception of the notification as a trigger, the automatic analysis processing unit 11 can execute the event-driven analysis process described in (4-1) above.
この場合、ステップS152及びS154~S157、は、上記(4-1)において述べたとおりに実行されてよい。ステップS153において、自動解析処理部11は、光データ記憶部15として利用される当該外部ストレージに格納されている光強度データをダウンロードする。
In this case, steps S152 and S154 to S157 may be executed as described in (4-1) above. In step S153, the automatic analysis processing unit 11 downloads the light intensity data stored in the external storage used as the optical data storage unit 15.
また、上記(4-1)では、自動解析処理部11は、サーバシステム10上に、解析処理を実行するためのコンピュ―テーションリソースを確保すると説明されているが、当該コンピュ―テーションリソースは、サーバシステム10外のコンピュ―テーションリソースであってもよい。例えば、サーバシステム10の外部に存在する情報処理装置内に、解析処理を実行するためのコンピュ―テーションリソースが確保されてもよい。
Further, in the above (4-1), it is explained that the automatic analysis processing unit 11 secures a computation resource for executing the analysis processing on the server system 10. It may be a computation resource outside the server system 10. For example, a computation resource for executing analysis processing may be secured in an information processing device existing outside the server system 10.
大学や企業の研究所などの研究機関において、近年オンラインストレージやクラウドプラットフォームのアカウントなどを保有し、データをクラウド上に保管したり、クラウド上のコンピューテーションリソースを用いて解析を行うことが行われている。本開示に従う情報処理システムが、上記のとおり、データの格納先として外部のオンラインストレージを利用することによって又は外部のコンピュ―テーションリソースを利用して解析処理を実行することによって、ユーザはサーバシステムの運用コストをさらに低減することが可能である。
In recent years, research institutes such as universities and corporate research institutes have possessed online storage and cloud platform accounts, store data in the cloud, and perform analysis using computing resources on the cloud. It has been. As described above, the information processing system according to the present disclosure uses an external online storage as a data storage destination, or an external computation resource is used to execute an analysis process, so that the user can use the server system. It is possible to further reduce the operating cost.
(8)解析対象データの分割
(8) Division of data to be analyzed
上記(4-2)において説明したステップS155及び上記(4-4)において説明したステップS309において、光強度データから蛍光標識強度データを算出する処理が実行される。当該処理は、例えば蛍光補正処理又はアンミキシング処理を含み、これらの処理は、特には生体試料分析装置がフローサイトメータなどの生体粒子分析装置である場合に実行される。生体粒子分析装置により取得されるデータは、イベント単位で(すなわち各生体粒子の測定結果毎に)分割可能である。
In step S155 described in (4-2) above and step S309 described in (4-4) above, the process of calculating the fluorescence label intensity data from the light intensity data is executed. The process includes, for example, a fluorescence correction process or an unmixing process, and these processes are performed particularly when the biological sample analyzer is a biological particle analyzer such as a flow cytometer. The data acquired by the bioparticle analyzer can be divided into event units (that is, for each measurement result of each bioparticle).
そこで、本開示に従う情報処理システム(特にはサーバシステム)は、光強度データから蛍光標識強度データを算出する算出処理において、まず当該光強度データをイベント単位で分割し、そして、分割された光強度データのそれぞれについて前記算出処理を実行してよい。分割された光強度データのそれぞれの前記算出処理は、例えば同時並行的に実行されてよい。例えば、前記サーバシステム(特には自動解析処理部)は、複数のAWS Lambdaを立ち上げ、そして、各仮想サーバに各分割された光強度データを割り当てる。そして、各仮想サーバが、割り当てられた各分割された光強度データについて、前記算出処理を実行する。
Therefore, in the calculation process for calculating the fluorescent label intensity data from the light intensity data, the information processing system (particularly the server system) according to the present disclosure first divides the light intensity data for each event, and then divides the light intensity. The calculation process may be executed for each of the data. The calculation process of each of the divided light intensity data may be executed in parallel, for example. For example, the server system (particularly, an automatic analysis processing unit) launches a plurality of AWS Lambda, and assigns each divided light intensity data to each virtual server. Then, each virtual server executes the calculation process for each of the assigned divided light intensity data.
以上のとおりに分割処理を実行することによって、処理の高速化が可能である。さらに、処理の効率化も可能である。
By executing the division process as described above, it is possible to speed up the process. Furthermore, it is possible to improve the efficiency of processing.
(9)データの共有
(9) Data sharing
上記(4-1)において述べたメタデータ(特には解析設定データ)、光強度データ、及び蛍光標識強度データは、本開示においてサーバシステム10に含まれるストレージ又は記憶部に保存されうる。本開示において、これらのデータは互いに関連付けられた状態で、サーバシステム10内に保存されていてよい。これらのデータが互いに関連付けられていることによって、測定の再現及び/又は測定結果の解析の再現が容易になる。
また、上記(4-1)において述べた付属データ、蛍光標識強度データの算出のために用いられるデータ、及び、蛍光強度標識データに対する解析処理において用いられるデータも、互いに関連付けられた状態で、サーバシステム10内に保存されていてよい。これらのデータが互いに関連付けられていることによって、測定の再現及び/又は測定結果の解析の再現が容易になる。 The metadata (particularly analysis setting data), light intensity data, and fluorescent label intensity data described in (4-1) above can be stored in the storage or storage unit included in theserver system 10 in the present disclosure. In the present disclosure, these data may be stored in the server system 10 in a state of being associated with each other. The association of these data with each other facilitates the reproduction of measurements and / or the analysis of measurement results.
Further, the attached data described in (4-1) above, the data used for calculating the fluorescent label intensity data, and the data used in the analysis process for the fluorescent label intensity label data are also associated with each other in the server. It may be stored in thesystem 10. The association of these data with each other facilitates the reproduction of measurements and / or the analysis of measurement results.
また、上記(4-1)において述べた付属データ、蛍光標識強度データの算出のために用いられるデータ、及び、蛍光強度標識データに対する解析処理において用いられるデータも、互いに関連付けられた状態で、サーバシステム10内に保存されていてよい。これらのデータが互いに関連付けられていることによって、測定の再現及び/又は測定結果の解析の再現が容易になる。 The metadata (particularly analysis setting data), light intensity data, and fluorescent label intensity data described in (4-1) above can be stored in the storage or storage unit included in the
Further, the attached data described in (4-1) above, the data used for calculating the fluorescent label intensity data, and the data used in the analysis process for the fluorescent label intensity label data are also associated with each other in the server. It may be stored in the
また、これらのデータ(特には互いに関連付けられたこれらのデータ)は、1つのデータ解析クライアント端末及び/又はデータ取得クライアント端末によってだけ利用可能であってよく、又は、2以上のデータ解析クライアント端末及び/又はデータ取得クライアント端末によって利用可能であってもよい。すなわち、これらのデータは、2以上のデータ解析クライアント端末及び/又はデータ解析クライアント端末によって共有されうる。
例えば、本開示において、複数のデータ解析クライアント端末が、前記サーバシステム内の光強度データ、蛍光標識強度データ、及び解析設定データのうちの1つ以上を共有することができる。特に好ましくは、複数のデータ解析クライアント端末が、前記サーバシステム内の解析設定データを共有することができる。
また、本開示において、複数のデータ取得クライアント端末が、前記サーバシステム内の光強度データ、蛍光標識強度データ、及び解析設定データのうちの1つ以上を共有することができる。特に好ましくは、複数のデータ取得クライアント端末が、前記サーバシステム内の解析設定データを共有することができる。
本開示において、このように情報処理システム(又は当該システムに含まれるサーバシステム、データ解析クライアント端末、若しくはデータ取得クライアント端末)が構成されていることにより、或るユーザによる測定及び/又は解析に関する情報を他のユーザが再利用することができ、測定の再現及び/又は測定結果の解析の再現が容易になる。 Also, these data (particularly those data associated with each other) may be available only by one data analysis client terminal and / or data acquisition client terminal, or by two or more data analysis client terminals and / Or may be available by the data acquisition client terminal. That is, these data can be shared by two or more data analysis client terminals and / or data analysis client terminals.
For example, in the present disclosure, a plurality of data analysis client terminals can share one or more of the light intensity data, the fluorescent label intensity data, and the analysis setting data in the server system. Particularly preferably, a plurality of data analysis client terminals can share the analysis setting data in the server system.
Further, in the present disclosure, a plurality of data acquisition client terminals can share one or more of the light intensity data, the fluorescent label intensity data, and the analysis setting data in the server system. Particularly preferably, a plurality of data acquisition client terminals can share the analysis setting data in the server system.
In the present disclosure, information on measurement and / or analysis by a user by configuring an information processing system (or a server system, a data analysis client terminal, or a data acquisition client terminal included in the system) in this way. Can be reused by other users, facilitating the reproduction of measurements and / or the analysis of measurement results.
(10)出力用データの統一
(10) Unification of output data
上記(4-1)において述べた自動解析処理によって生成される出力用データ、上記(4-3)において述べた出力用データ取得処理によって取得又は生成される出力用データ、及び、上記(4-4)において述べた対話型解析処理によって生成される出力用データはいずれも、同一のユーザインターフェースを有するウィンドウ(特にはワークシート)に出力可能であるように構成されてよい。例えば、これら3つの出力用データは、出力装置に出力させるために用いられる同一のメタデータを有していてよい。これにより、例えば自動解析処理によって生成された出力用データ又は出力用データ取得処理によって取得又は生成された出力用データが、対話型解析処理において利用しやすくなる。また、対話型解析処理のステップS305において入力された解析コマンドを、新たに取得された光強度データに対して自動解析処理を実行するために用いることもできる。
Output data generated by the automatic analysis process described in (4-1) above, output data acquired or generated by the output data acquisition process described in (4-3) above, and (4-4) above. Any of the output data generated by the interactive analysis process described in 4) may be configured so that it can be output to a window (particularly a worksheet) having the same user interface. For example, these three output data may have the same metadata used to be output by the output device. As a result, for example, the output data generated by the automatic analysis process or the output data acquired or generated by the output data acquisition process can be easily used in the interactive analysis process. Further, the analysis command input in step S305 of the interactive analysis process can also be used to execute the automatic analysis process on the newly acquired light intensity data.
このように出力用データが、同様のユーザインターフェースを有するワークシート上に表示されることより、ユーザは自動解析処理、出力用データ生成処理、及び対話型解析処理を一貫したユーザインターフェース上で閲覧及び実行可能である。また、測定に用いた各種解析設定データが解析結果とともに保存されることで、同様の設定を用いて測定や解析を容易に再現可能である。これらの仕組みと、装置間でのデータのStandardization機
能を組み合わせることで、異なる複数の装置をまたいで同一の実験を再現することが容易に実現可能となる。 Since the output data is displayed on a worksheet having a similar user interface in this way, the user can view the automatic analysis process, the output data generation process, and the interactive analysis process on a consistent user interface. It is feasible. Further, since various analysis setting data used for the measurement are saved together with the analysis result, the measurement and the analysis can be easily reproduced by using the same setting. By combining these mechanisms with the data standardization function between devices, it is possible to easily reproduce the same experiment across multiple different devices.
能を組み合わせることで、異なる複数の装置をまたいで同一の実験を再現することが容易に実現可能となる。 Since the output data is displayed on a worksheet having a similar user interface in this way, the user can view the automatic analysis process, the output data generation process, and the interactive analysis process on a consistent user interface. It is feasible. Further, since various analysis setting data used for the measurement are saved together with the analysis result, the measurement and the analysis can be easily reproduced by using the same setting. By combining these mechanisms with the data standardization function between devices, it is possible to easily reproduce the same experiment across multiple different devices.
(11)クラスタリング結果表示図の出力制御の例1
(11) Example of output control of clustering result display diagram 1
上記(4-1)において述べたように、本開示において、データ解析クライアント端末20は、クラスタリング結果表示図を含む出力用データを出力装置に出力させる。当該クラスタリング結果表示図は、例えば図23において示されるようなクラスタリング結果表示図であってよく、同図に示されるクラスタリング結果表示図はFlowSOMというクラスタリングアルゴリズムを実行した際に得られる出力結果であって、スターチャート(Star Chart)とも呼ばれる。
As described in (4-1) above, in the present disclosure, the data analysis client terminal 20 causes the output device to output the output data including the clustering result display diagram. The clustering result display chart may be, for example, a clustering result display chart as shown in FIG. 23, and the clustering result display chart shown in the figure is an output result obtained when a clustering algorithm called FlowSOM is executed. , Also known as Star Chart.
分析において用いられるマーカーの数が多い場合は、前記出力用データに含まれるマーカーの数も多くなる。このような場合において、全てのマーカーに関するデータをクラスタリング結果表示図に表示させると、当該クラスタリング結果表示図の内容が複雑になり、各マーカーの発現量が把握しにくくなる。例えばFlowSOMにおけるスターチャートやポピュレーションパイチャートに関して、各クラスタに表示されるマーカーの種類の数が多くなると、各クラスタの発現量の把握が難しくなる場合がある。
If the number of markers used in the analysis is large, the number of markers included in the output data will also be large. In such a case, if the data relating to all the markers is displayed on the clustering result display diagram, the content of the clustering result display diagram becomes complicated and it becomes difficult to grasp the expression level of each marker. For example, regarding the star chart and population pie chart in FlowSOM, if the number of types of markers displayed in each cluster is large, it may be difficult to grasp the expression level of each cluster.
本開示の好ましい実施態様において、データ解析クライアント端末20は、クラスタリング結果表示図において表示されるマーカーの数を変更することができるように構成されてよく、より具体的には、クラスタリング結果表示図中の各クラスタに含まれるマーカーを選択することができるように構成されてよい。
各クラスタに含まれるマーカーを選択することが可能であることによって、ユーザの目的に応じてクラスタリング結果表示図を調整することができる。さらに、クラスタリング結果表示図に含まれるマーカーの数が調整可能であることによって、マーカーの発現量の把握がより容易になる。 In a preferred embodiment of the present disclosure, the dataanalysis client terminal 20 may be configured so that the number of markers displayed in the clustering result display diagram can be changed, and more specifically, in the clustering result display diagram. It may be configured to allow selection of markers contained in each cluster of.
By being able to select the markers included in each cluster, the clustering result display diagram can be adjusted according to the user's purpose. Further, since the number of markers included in the clustering result display diagram can be adjusted, it becomes easier to grasp the expression level of the markers.
各クラスタに含まれるマーカーを選択することが可能であることによって、ユーザの目的に応じてクラスタリング結果表示図を調整することができる。さらに、クラスタリング結果表示図に含まれるマーカーの数が調整可能であることによって、マーカーの発現量の把握がより容易になる。 In a preferred embodiment of the present disclosure, the data
By being able to select the markers included in each cluster, the clustering result display diagram can be adjusted according to the user's purpose. Further, since the number of markers included in the clustering result display diagram can be adjusted, it becomes easier to grasp the expression level of the markers.
例えば、データ解析クライアント端末20は、前記出力用データに含まれる全てのマーカーのうちから1以上のマーカーが選択されることに応じて、当該選択された1以上のマーカーに関するクラスタリング結果表示図を形成してよい。当該形成されたクラスタリング結果表示図は、選択されていない1以上の表面マーカーに関するデータを含まないものであってよい。
すなわち、前記選択が行われることに応じて、データ解析クライアント端末20は、前記選択された1以上のマーカーのデータに基づき、クラスタリング結果表示図を形成しうる。前記クラスタリング結果表示図は、スターチャート又はパイチャートであってよいが、これらに限定されない。 For example, the dataanalysis client terminal 20 forms a clustering result display diagram relating to the selected one or more markers in response to the selection of one or more markers from all the markers included in the output data. You can do it. The formed clustering result display diagram may not include data on one or more unselected surface markers.
That is, in response to the selection being made, the dataanalysis client terminal 20 can form a clustering result display diagram based on the data of the selected one or more markers. The clustering result display diagram may be a star chart or a pie chart, but is not limited thereto.
すなわち、前記選択が行われることに応じて、データ解析クライアント端末20は、前記選択された1以上のマーカーのデータに基づき、クラスタリング結果表示図を形成しうる。前記クラスタリング結果表示図は、スターチャート又はパイチャートであってよいが、これらに限定されない。 For example, the data
That is, in response to the selection being made, the data
前記クラスタリング結果表示図がスターチャートである場合の例を、以下で図面を参照しながらさらに説明する。
An example of the case where the clustering result display diagram is a star chart will be further described below with reference to the drawings.
上記(4-1)において説明したステップS111において、データ解析クライアント端末20が、出力用データに基づき、クラスタリング結果表示図として、例えば図24に示されるようなスターチャート500を出力装置の画面に表示させている場合を想定する。さらに、ユーザが前記スターチャートに表示されるマーカーの数を減らすことを希望していると想定する。
In step S111 described in (4-1) above, the data analysis client terminal 20 displays, for example, a star chart 500 as shown in FIG. 24 on the screen of the output device as a clustering result display diagram based on the output data. Imagine a case where you are doing it. Further assume that the user wants to reduce the number of markers displayed on the star chart.
この場合において、ユーザが例えば前記スターチャートを選択(クリック又はタッチ)することに応じて又はユーザが所定のボタンを選択することに応じて、データ解析クライアント端末20は、図25に示されるような、マーカー選択用ウィンドウ501を出力装置に表示させる。当該ウィンドウには、前記スターチャートにおいて表示されているマーカー群と各マーカーに対応する色を示す色分け表示要素502と前記スターチャートにおいて表示されているマーカーリスト503とを含む。
ここで、前記マーカーリストは、スターチャートにおいて各マーカーを表示させるかを選択可能であるように構成されている。
また、前記色分け表示要素は、同図においてはパイ表示のように示されているが、当該色分け表示要素は、マーカーと色とが対応付けられているように示されていればよく、他の表示形式であってもよい。 In this case, the dataanalysis client terminal 20 is as shown in FIG. 25, for example, in response to the user selecting (clicking or touching) the star chart or in response to the user selecting a predetermined button. , The marker selection window 501 is displayed on the output device. The window includes a group of markers displayed in the star chart, a color-coded display element 502 indicating a color corresponding to each marker, and a marker list 503 displayed in the star chart.
Here, the marker list is configured so that it is possible to select whether to display each marker on the star chart.
Further, although the color-coded display element is shown as a pie display in the figure, the color-coded display element may be shown so that the marker and the color are associated with each other. It may be in a display format.
ここで、前記マーカーリストは、スターチャートにおいて各マーカーを表示させるかを選択可能であるように構成されている。
また、前記色分け表示要素は、同図においてはパイ表示のように示されているが、当該色分け表示要素は、マーカーと色とが対応付けられているように示されていればよく、他の表示形式であってもよい。 In this case, the data
Here, the marker list is configured so that it is possible to select whether to display each marker on the star chart.
Further, although the color-coded display element is shown as a pie display in the figure, the color-coded display element may be shown so that the marker and the color are associated with each other. It may be in a display format.
次に、ユーザが、前記マーカーリストのうちから、スターチャート中に表示させたいマーカーを選択する。例えば図26に示されるマーカーリスト512では、ユーザが5つのマーカー(グレーで網掛けされている)を選択した状態が示されている。
Next, the user selects a marker to be displayed in the star chart from the marker list. For example, the marker list 512 shown in FIG. 26 shows a state in which the user has selected five markers (shaded in gray).
前記5つのマーカーが選択されることに応じて、データ解析クライアント端末20は、同図の色分け表示要素513に示されるように、選択されたマーカーの色だけを色分け表示要素中に表示させる。これにより、ユーザは、マーカー選択後のスターチャートの表示内容を把握することができる。
In response to the selection of the five markers, the data analysis client terminal 20 displays only the color of the selected marker in the color-coded display element, as shown by the color-coded display element 513 in the figure. As a result, the user can grasp the display content of the star chart after selecting the marker.
前記5つのマーカーが選択されることに応じて、データ解析クライアント端末20は、図24に示されるスターチャートも変更する。例えば、前記5つのマーカーが選択されることに応じて、データ解析クライアント端末20は、スターチャート500を、図27に示されるスターチャート510へと変更する。
The data analysis client terminal 20 also changes the star chart shown in FIG. 24 according to the selection of the five markers. For example, depending on the selection of the five markers, the data analysis client terminal 20 changes the star chart 500 to the star chart 510 shown in FIG. 27.
図24の左側の拡大図504及び図27の左側の拡大図514の比較から分かるとおり、データ解析クライアント端末20は、各クラスタ内に表示されるデータ要素(色数)を変更する。
As can be seen from the comparison between the enlarged view 504 on the left side of FIG. 24 and the enlarged view 514 on the left side of FIG. 27, the data analysis client terminal 20 changes the data element (number of colors) displayed in each cluster.
以上のとおり、データ解析クライアント端末20は、マーカーリスト中のマーカーが選択されることに応じて、クラスタリング結果表示図を変更するように構成されてよい。そして、当該クラスタリング結果表示図の変更は、以上のとおり、前記マーカーリストにおいて選択されたマーカーのデータ(発現量に基づくデータ及び/又は各マーカーに対応する色など)のみを表示するように行われてよい。
As described above, the data analysis client terminal 20 may be configured to change the clustering result display diagram according to the selection of the marker in the marker list. Then, as described above, the change of the clustering result display diagram is performed so as to display only the data of the markers selected in the marker list (data based on the expression level and / or the color corresponding to each marker). You can do it.
なお、上記のとおり、データ解析クライアント端末20は、表示されるクラスタリング結果表示図の変更を、マーカーリスト512におけるマーカーの選択操作と連動して実行してよい。
代替的には、データ解析クライアント端末20は、表示されるスターチャートの変更を、所定のボタン(例えばマーカー選択用ウィンドウ中の所定のボタン、例えば同図に示されるCloseボタンなど)が選択されることに応じて、表示されるクラスタリング結果表示図の変更を実行してもよい。 As described above, the dataanalysis client terminal 20 may change the displayed clustering result display diagram in conjunction with the marker selection operation in the marker list 512.
Alternatively, the dataanalysis client terminal 20 selects a predetermined button (for example, a predetermined button in the marker selection window, for example, the Close button shown in the figure) to change the displayed star chart. Depending on the situation, the displayed clustering result display diagram may be changed.
代替的には、データ解析クライアント端末20は、表示されるスターチャートの変更を、所定のボタン(例えばマーカー選択用ウィンドウ中の所定のボタン、例えば同図に示されるCloseボタンなど)が選択されることに応じて、表示されるクラスタリング結果表示図の変更を実行してもよい。 As described above, the data
Alternatively, the data
上記では、マーカー数を減少させる例が示されているが、マーカー数は増加されてもよい。さらに、マーカーの選択に連動して、データ解析クライアント端末20は、前記マーカー選択用ウィンドウ中の色分け表示要素を変更してよい。また、マーカーの選択に連動して、データ解析クライアント端末20は、クラスタリング結果表示図も変更してよい。
例えば、図28では、マーカー選択用ウィンドウ521中のマーカーリスト522において10のマーカーが選択されている状態が示されている。データ解析クライアント端末20は、当該選択が行われたことに応じて、10に色分けされた色分け表示要素523を表示させる。そして、当該選択が行われたことに応じて、データ解析クライアント端末20は、図29に示されるようなクラスタリング結果表示図520を表示してよい。
また、図30では、マーカー選択用ウィンドウ531中のマーカーリスト532において3つのマーカーが選択されている状態が示されている。データ解析クライアント端末20は、当該選択が行われたことに応じて、3つに色分けされた色分け表示要素533を表示させる。そして、当該選択が行われたことに応じて、データ解析クライアント端末20は、図31に示されるようなクラスタリング結果表示図530を表示してよい。
また、スターチャート内のマーカーの表示順序も任意に変更可能であってよい。すなわち、データ解析クライアント端末20は、スターチャート内におけるマーカーの表示順序を変更することができるように構成されてよい。当該表示順序の変更は、例えば、マーカー選択用ウィンドウ中のマーカーリスト若しくは色分け表示要素に対するユーザ操作に応じて実行されてよく、又は、スターチャート自体に対するユーザ操作作に応じて実行されてもよい。
例えば、ユーザが前記マーカーリスト中の2以上の選択済みマーカーの位置関係を所定の操作(例えばドラッグ操作)によって変更することに応じて、データ解析クライアント端末20は、前記表示順序を変更しうる。
代替的には、ユーザが前記色分け表示要素中の2以上のパイの位置関係を所定の操作(例えばドラッグ操作)によって変更することに応じて、データ解析クライアント端末20は、前記表示順序を変更しうる。スターチャート内のノードに対する同様の操作によって、データ解析クライアント端末20は、前記表示順序を変更してもよい。 In the above, an example of reducing the number of markers is shown, but the number of markers may be increased. Further, in conjunction with the selection of the marker, the dataanalysis client terminal 20 may change the color-coded display element in the marker selection window. Further, the data analysis client terminal 20 may change the clustering result display diagram in conjunction with the selection of the marker.
For example, FIG. 28 shows a state in which 10 markers are selected in themarker list 522 in the marker selection window 521. The data analysis client terminal 20 displays the color-coded display element 523 color-coded into 10 according to the selection. Then, depending on the selection, the data analysis client terminal 20 may display the clustering result display FIG. 520 as shown in FIG. 29.
Further, FIG. 30 shows a state in which three markers are selected in themarker list 532 in the marker selection window 531. The data analysis client terminal 20 displays the three color-coded color-coded display elements 533 according to the selection. Then, depending on the selection, the data analysis client terminal 20 may display the clustering result display FIG. 530 as shown in FIG. 31.
Further, the display order of the markers in the star chart may be arbitrarily changed. That is, the dataanalysis client terminal 20 may be configured so that the display order of the markers in the star chart can be changed. The change in the display order may be executed, for example, according to a user operation on the marker list or the color-coded display element in the marker selection window, or may be executed according to the user operation operation on the star chart itself.
For example, the dataanalysis client terminal 20 may change the display order in response to the user changing the positional relationship of two or more selected markers in the marker list by a predetermined operation (for example, a drag operation).
Alternatively, the dataanalysis client terminal 20 changes the display order in response to the user changing the positional relationship of two or more pies in the color-coded display element by a predetermined operation (for example, a drag operation). sell. The data analysis client terminal 20 may change the display order by the same operation for the nodes in the star chart.
例えば、図28では、マーカー選択用ウィンドウ521中のマーカーリスト522において10のマーカーが選択されている状態が示されている。データ解析クライアント端末20は、当該選択が行われたことに応じて、10に色分けされた色分け表示要素523を表示させる。そして、当該選択が行われたことに応じて、データ解析クライアント端末20は、図29に示されるようなクラスタリング結果表示図520を表示してよい。
また、図30では、マーカー選択用ウィンドウ531中のマーカーリスト532において3つのマーカーが選択されている状態が示されている。データ解析クライアント端末20は、当該選択が行われたことに応じて、3つに色分けされた色分け表示要素533を表示させる。そして、当該選択が行われたことに応じて、データ解析クライアント端末20は、図31に示されるようなクラスタリング結果表示図530を表示してよい。
また、スターチャート内のマーカーの表示順序も任意に変更可能であってよい。すなわち、データ解析クライアント端末20は、スターチャート内におけるマーカーの表示順序を変更することができるように構成されてよい。当該表示順序の変更は、例えば、マーカー選択用ウィンドウ中のマーカーリスト若しくは色分け表示要素に対するユーザ操作に応じて実行されてよく、又は、スターチャート自体に対するユーザ操作作に応じて実行されてもよい。
例えば、ユーザが前記マーカーリスト中の2以上の選択済みマーカーの位置関係を所定の操作(例えばドラッグ操作)によって変更することに応じて、データ解析クライアント端末20は、前記表示順序を変更しうる。
代替的には、ユーザが前記色分け表示要素中の2以上のパイの位置関係を所定の操作(例えばドラッグ操作)によって変更することに応じて、データ解析クライアント端末20は、前記表示順序を変更しうる。スターチャート内のノードに対する同様の操作によって、データ解析クライアント端末20は、前記表示順序を変更してもよい。 In the above, an example of reducing the number of markers is shown, but the number of markers may be increased. Further, in conjunction with the selection of the marker, the data
For example, FIG. 28 shows a state in which 10 markers are selected in the
Further, FIG. 30 shows a state in which three markers are selected in the
Further, the display order of the markers in the star chart may be arbitrarily changed. That is, the data
For example, the data
Alternatively, the data
また、以上の説明では、データ解析クライアント端末20が、クラスタリング結果表示図の変更を実行しているが、クラスタリング結果表示図の変更はサーバシステム10によって実行されてもよい。
例えば、ユーザがマーカー選択用ウィンドウ501においてマーカーを選択することに応じて、データ解析クライアント端末20は、選択されたマーカーに関するデータをサーバシステム10に送信する。そして、サーバシステム10が、当該選択されたマーカーに関するデータに基づき、変更後のクラスタリング結果表示図を生成し、そして当該変更後のクラスタリング結果表示図を、データ解析クライアント端末20に送信する。そして、データ解析クライアント端末20が、当該変更後のクラスタリング結果表示図を出力装置に表示させてよい。 Further, in the above description, the dataanalysis client terminal 20 is executing the change of the clustering result display diagram, but the change of the clustering result display diagram may be executed by the server system 10.
For example, in response to the user selecting a marker in themarker selection window 501, the data analysis client terminal 20 transmits data regarding the selected marker to the server system 10. Then, the server system 10 generates a clustering result display diagram after the change based on the data related to the selected marker, and transmits the clustering result display diagram after the change to the data analysis client terminal 20. Then, the data analysis client terminal 20 may display the changed clustering result display diagram on the output device.
例えば、ユーザがマーカー選択用ウィンドウ501においてマーカーを選択することに応じて、データ解析クライアント端末20は、選択されたマーカーに関するデータをサーバシステム10に送信する。そして、サーバシステム10が、当該選択されたマーカーに関するデータに基づき、変更後のクラスタリング結果表示図を生成し、そして当該変更後のクラスタリング結果表示図を、データ解析クライアント端末20に送信する。そして、データ解析クライアント端末20が、当該変更後のクラスタリング結果表示図を出力装置に表示させてよい。 Further, in the above description, the data
For example, in response to the user selecting a marker in the
(12)クラスタリング結果表示図の出力制御の例2
(12) Example 2 of output control of clustering result display diagram
上記(11)において説明したクラスタリング結果表示図に関して、クラスタ(例えばFlowSOMにおけるノードなど)の数が多くなる場合がしばしばある。例えば、分析対象となる細胞の種類の数が多くなるにつれて、クラスタの数も多くなる。FlowSOMでは、メタクラスタという、類似のマーカー発現傾向をもつクラスタをグルーピングする機能があるが、スターチャートやポピュレーションパイチャートはクラスタ単位での表示となっている。このような場合において、全てのクラスタをクラスタリング結果表示図中に表示させると、当該クラスタリング結果表示図から測定したサンプルの全体としてのマーカー発現量の傾向や概要(例えばメタクラスタ単位における発現量の傾向など)を把握することが難しくなる場合がある。
Regarding the clustering result display diagram described in (11) above, the number of clusters (for example, nodes in FlowSOM) often increases. For example, as the number of cell types to be analyzed increases, so does the number of clusters. FlowSOM has a function to group clusters with similar marker expression tendencies called metaclusters, but star charts and population pie charts are displayed on a cluster-by-cluster basis. In such a case, when all the clusters are displayed in the clustering result display diagram, the tendency and outline of the marker expression level as a whole of the sample measured from the clustering result display diagram (for example, the tendency of the expression level in the metacluster unit). Etc.) may be difficult to grasp.
図32に、多数のノードを含むクラスタリング結果表示図(スターチャート)の例を示す。同図のクラスタリング結果表示図600には、多数のクラスタが表示されているために、例えば点線で囲まれた領域601において多数のクラスタが重なって表示されており、これらのクラスタにおける発現量の傾向が確認しにくくなっている。当該領域は、例えば同図の右に示されるように拡大しても、発現量の傾向は確認しにくい。加えて、複数のクラスタをグルーピングしたメタクラスタ単位での発現量の傾向や特徴を把握することはさらに難しく、結果として、サンプル全体としての発現傾向の概要をつかむことが困難となっている。
FIG. 32 shows an example of a clustering result display diagram (star chart) including a large number of nodes. Since a large number of clusters are displayed in the clustering result display FIG. 600 of the same figure, for example, a large number of clusters are overlapped and displayed in the area 601 surrounded by the dotted line, and the tendency of the expression level in these clusters. Is difficult to confirm. Even if the region is expanded as shown on the right side of the figure, it is difficult to confirm the tendency of the expression level. In addition, it is more difficult to grasp the tendency and characteristics of the expression level in each metacluster in which a plurality of clusters are grouped, and as a result, it is difficult to get an overview of the expression tendency of the sample as a whole.
本開示の好ましい実施態様において、データ解析クライアント端末20は、類似の発現傾向をもつ1つ以上のクラスタをグルーピングしたメタクラスタ単位で、スターチャートやポピュレーションパイチャートを出力できるように構成されてよい。
前記メタクラスタは、アルゴリズムによって類似のマーカー発現傾向を持つクラスタを自動でグルーピングすることで形成されてもよく、あるいは、ユーザが自ら1つ以上のクラスタを選択することに応じて、メタクラスタが形成されてもよい。
このようなメタクラスタ単位でのクラスタリング結果出力図、すなわちメタクラスタチャートによって、発現量の傾向が把握しやすくなる。 In a preferred embodiment of the present disclosure, the dataanalysis client terminal 20 may be configured to output a star chart or a population pie chart in meta-cluster units in which one or more clusters having similar expression tendencies are grouped. ..
The metacluster may be formed by automatically grouping clusters having a similar marker expression tendency by an algorithm, or the metacluster is formed according to the user selecting one or more clusters by himself / herself. May be done.
Such a clustering result output diagram for each metacluster, that is, a metacluster chart makes it easy to grasp the tendency of the expression level.
前記メタクラスタは、アルゴリズムによって類似のマーカー発現傾向を持つクラスタを自動でグルーピングすることで形成されてもよく、あるいは、ユーザが自ら1つ以上のクラスタを選択することに応じて、メタクラスタが形成されてもよい。
このようなメタクラスタ単位でのクラスタリング結果出力図、すなわちメタクラスタチャートによって、発現量の傾向が把握しやすくなる。 In a preferred embodiment of the present disclosure, the data
The metacluster may be formed by automatically grouping clusters having a similar marker expression tendency by an algorithm, or the metacluster is formed according to the user selecting one or more clusters by himself / herself. May be done.
Such a clustering result output diagram for each metacluster, that is, a metacluster chart makes it easy to grasp the tendency of the expression level.
クラスタリング結果表示図から形成されるメタクラスタチャートの例を、図33に示す。同図の左に、上記で説明したクラスタリング結果表示図600が表示されている。データ解析クライアント端末20は、例えばユーザによる所定の操作を受け付けることに応じて、クラスタリング結果表示図600から、同図の右に示されるようなメタクラスタチャート602を生成する。ここで、前記所定の操作は、例えば所定の操作ボタンのクリック又はタッチなどの操作であってよい。
FIG. 33 shows an example of a metacluster chart formed from a clustering result display diagram. The clustering result display diagram 600 described above is displayed on the left side of the figure. The data analysis client terminal 20 generates a meta-cluster chart 602 as shown on the right side of the clustering result display diagram 600, for example, in response to receiving a predetermined operation by the user. Here, the predetermined operation may be, for example, an operation such as clicking or touching a predetermined operation button.
クラスタリング結果表示図600中の複数のクラスタは、同図に示されるように7つのクラスタグループ(メタクラスタ611~メタクラスタ617という)へと分類可能である。各メタクラスタは、それぞれ共通の特徴(例えばマーカーの発現状況に関する共通の特徴)を有する。同じメタクラスタに属するクラスタグループには、同じ色が付されている。また、メタクラスタ間で、互いに異なる色が付されている。
データ解析クライアント端末20は、これら7つのメタクラスタそれぞれについて、各メタクラスタに属する1以上のクラスタのデータに基づきメタクラスタノードを生成する。生成された7つのメタクラスタノード621~627を含むメタクラスタチャート602が、同図の右に示されている。
メタクラスタノード621の色は、メタクラスタ611の色と同じである。同様に、メタクラスタノード622~627の色は、メタクラスタ612~617の色とそれぞれ同じである。このように、メタクラスタチャートの形成の前後で、メタクラスタとメタクラスタノードとに同じ色が付されることによって、メタクラスタとメタクラスタノードとの関係が理解しやすくなる。 Clustering Result Display The plurality of clusters in FIG. 600 can be classified into seven cluster groups (referred to asmetaclusters 611 to metaclusters 617) as shown in the figure. Each metacluster has common characteristics (eg, common characteristics regarding marker expression status). Cluster groups that belong to the same metacluster are colored the same. Also, the metaclusters are colored differently from each other.
The dataanalysis client terminal 20 generates a metacluster node for each of these seven metaclusters based on the data of one or more clusters belonging to each metacluster. A metacluster chart 602 containing the seven generated metacluster nodes 621-627 is shown on the right side of the figure.
The color of themetacluster node 621 is the same as the color of the metacluster 611. Similarly, the colors of the metacluster nodes 622 to 627 are the same as the colors of the metaclusters 612 to 617, respectively. In this way, before and after the formation of the metacluster chart, the metacluster and the metacluster node are colored in the same color, which makes it easier to understand the relationship between the metacluster and the metacluster node.
データ解析クライアント端末20は、これら7つのメタクラスタそれぞれについて、各メタクラスタに属する1以上のクラスタのデータに基づきメタクラスタノードを生成する。生成された7つのメタクラスタノード621~627を含むメタクラスタチャート602が、同図の右に示されている。
メタクラスタノード621の色は、メタクラスタ611の色と同じである。同様に、メタクラスタノード622~627の色は、メタクラスタ612~617の色とそれぞれ同じである。このように、メタクラスタチャートの形成の前後で、メタクラスタとメタクラスタノードとに同じ色が付されることによって、メタクラスタとメタクラスタノードとの関係が理解しやすくなる。 Clustering Result Display The plurality of clusters in FIG. 600 can be classified into seven cluster groups (referred to as
The data
The color of the
データ解析クライアント端末20は、メタクラスタノードのサイズ(同図においては円の直径のサイズ)を、例えば当該メタクラスタノードに属するイベントの数若しくは細胞の数などの定量データに応じて設定してよい。同図においては、より多くのイベントを含むメタクラスタノードが、より大きな直径の円を有する。
The data analysis client terminal 20 may set the size of the metacluster node (the size of the diameter of the circle in the figure) according to quantitative data such as the number of events or the number of cells belonging to the metacluster node. .. In the figure, the metacluster node containing more events has a larger diameter circle.
また、データ解析クライアント端末20は、メタクラスタチャートにおいて、各メタクラスタノードを、各メタクラスタノードに属する1以上のクラスタの位置に基づき特定された位置に配置してよい。例えば、データ解析クライアント端末20は、各メタクラスタノードに属する1以上のクラスタのそれぞれに含まれるイベントの数と当該1以上のクラスタそれぞれの位置とに基づき、各メタクラスタノードのメタクラスタチャート内における位置を特定してよい。一例において、各メタクラスタノードの位置は、当該メタクラスタノードへと統合された1以上のクラスタの位置の重心の位置であってよい。
Further, the data analysis client terminal 20 may arrange each metacluster node at a position specified based on the position of one or more clusters belonging to each metacluster node in the metacluster chart. For example, the data analysis client terminal 20 is based on the number of events included in each of one or more clusters belonging to each metacluster node and the position of each of the one or more clusters in the metacluster chart of each metacluster node. The position may be specified. In one example, the position of each metacluster node may be the position of the center of gravity of the position of one or more clusters integrated into the metacluster node.
なお、メタクラスタチャートにおいて、上記のようなメタクラスタノードの位置の特定は行われなくてもよい。例えば、データ解析クライアント端末20は、図34のメタクラスタチャート603に示されるように、生成された1以上のメタクラスタノードを所定数の行及び/又は列を形成するように配置してよく、又は、生成された1以上のメタクラスタノードをグリッド状に配置してもよい。
Note that the location of the metacluster node as described above does not have to be specified in the metacluster chart. For example, the data analysis client terminal 20 may arrange one or more generated metacluster nodes so as to form a predetermined number of rows and / or columns, as shown in the metacluster chart 603 of FIG. Alternatively, one or more generated metacluster nodes may be arranged in a grid pattern.
また、以上の説明では、データ解析クライアント端末20が、クラスタリング結果表示図からメタクラスタチャートを形成しているが、メタクラスタチャートの形成はサーバシステム10によって実行されてもよい。
例えば、ユーザが、或るクラスタリング結果表示図からメタクラスタチャートを形成するために、メタクラスタチャートを形成するための所定の操作を行う。データ解析クライアント端末20は、当該所定の操作を受け付けることに応じて、当該クラスタリング結果表示図からメタクラスタチャートを生成するための指示データを、サーバシステム10に送信する。サーバシステム10は、当該指示データを受信することに応じて、当該クラスタリング結果表示図からメタクラスタチャートを生成し、そして、当該メタクラスタチャートをデータ解析クライアント端末20に送信する。そして、データ解析クライアント端末20が、当該メタクラスタチャートを出力装置に表示させてよい。 Further, in the above description, the dataanalysis client terminal 20 forms the meta-cluster chart from the clustering result display diagram, but the formation of the meta-cluster chart may be executed by the server system 10.
For example, a user performs a predetermined operation for forming a metacluster chart in order to form a metacluster chart from a certain clustering result display diagram. The dataanalysis client terminal 20 transmits instruction data for generating a meta-cluster chart from the clustering result display diagram to the server system 10 in response to receiving the predetermined operation. In response to receiving the instruction data, the server system 10 generates a meta-cluster chart from the clustering result display diagram, and transmits the meta-cluster chart to the data analysis client terminal 20. Then, the data analysis client terminal 20 may display the meta-cluster chart on the output device.
例えば、ユーザが、或るクラスタリング結果表示図からメタクラスタチャートを形成するために、メタクラスタチャートを形成するための所定の操作を行う。データ解析クライアント端末20は、当該所定の操作を受け付けることに応じて、当該クラスタリング結果表示図からメタクラスタチャートを生成するための指示データを、サーバシステム10に送信する。サーバシステム10は、当該指示データを受信することに応じて、当該クラスタリング結果表示図からメタクラスタチャートを生成し、そして、当該メタクラスタチャートをデータ解析クライアント端末20に送信する。そして、データ解析クライアント端末20が、当該メタクラスタチャートを出力装置に表示させてよい。 Further, in the above description, the data
For example, a user performs a predetermined operation for forming a metacluster chart in order to form a metacluster chart from a certain clustering result display diagram. The data
(13)クラスタリング結果表示図中のメタクラスタと二次元プロットとの関連付け
(13) Association of metaclusters in the clustering result display diagram with two-dimensional plots
上記(12)において述べたように、クラスタリング結果表示図中の複数のクラスタは、共通する特徴を有する1以上のクラスタからなるメタクラスタへと分類することができる。ここで、クラスタリング結果表示図中のメタクラスタを二次元プロット中のイベントと対応づけることができれば、メタクラスタに属するイベントを直感的に把握することができる。
As described in (12) above, a plurality of clusters in the clustering result display diagram can be classified into metaclusters consisting of one or more clusters having common characteristics. Here, if the metacluster in the clustering result display diagram can be associated with the event in the two-dimensional plot, the event belonging to the metacluster can be intuitively grasped.
本開示の好ましい実施態様において、データ解析クライアント端末20は、クラスタリング結果表示図中のメタクラスタが選択されることに応じて、二次元プロットに含まれるイベントのうちから当該メタクラスタに属するイベントを特定することができるように、二次元プロットを表示してよい。データ解析クライアント端末20は、例えば、メタクラスタに共通して付された色を、二次元プロット中の当該メタクラスタに属するイベントに付してよい。
このような二次元プロットの表示によって、メタクラスタに属するイベントを直感的に把握することができ、さらにバックゲーティング(Backgating)も可能となる。 In a preferred embodiment of the present disclosure, the dataanalysis client terminal 20 identifies an event belonging to the metacluster from the events included in the two-dimensional plot according to the selection of the metacluster in the clustering result display diagram. You may display a two-dimensional plot so that you can. The data analysis client terminal 20 may, for example, attach a color commonly assigned to the metacluster to an event belonging to the metacluster in the two-dimensional plot.
By displaying such a two-dimensional plot, events belonging to the metacluster can be intuitively grasped, and backgating is also possible.
このような二次元プロットの表示によって、メタクラスタに属するイベントを直感的に把握することができ、さらにバックゲーティング(Backgating)も可能となる。 In a preferred embodiment of the present disclosure, the data
By displaying such a two-dimensional plot, events belonging to the metacluster can be intuitively grasped, and backgating is also possible.
上記で述べた二次元プロットの表示制御手法に関して、以下でさらに説明する。
上記(4-1)において説明したステップS111において、図35に示されるように、データ解析クライアント端末20が、出力用データに基づき、クラスタリング結果表示図600及び二次元プロット630及び631を出力装置の画面に表示させている場合を想定する。クラスタリング結果表示図600は、上記(12)において説明したものであり、当該クラスタリング結果表示図中の複数のクラスタは、図36に示されるように、7つのメタクラスタへと分類できる。 The display control method for the two-dimensional plot described above will be further described below.
In step S111 described in (4-1) above, as shown in FIG. 35, the dataanalysis client terminal 20 outputs the clustering result display FIG. 600 and the two- dimensional plots 630 and 631 based on the output data. It is assumed that it is displayed on the screen. The clustering result display diagram 600 is described in (12) above, and the plurality of clusters in the clustering result display diagram can be classified into seven meta-clusters as shown in FIG. 36.
上記(4-1)において説明したステップS111において、図35に示されるように、データ解析クライアント端末20が、出力用データに基づき、クラスタリング結果表示図600及び二次元プロット630及び631を出力装置の画面に表示させている場合を想定する。クラスタリング結果表示図600は、上記(12)において説明したものであり、当該クラスタリング結果表示図中の複数のクラスタは、図36に示されるように、7つのメタクラスタへと分類できる。 The display control method for the two-dimensional plot described above will be further described below.
In step S111 described in (4-1) above, as shown in FIG. 35, the data
図37に示されるように、ユーザが、マウスのカーソルを符号632の位置から符号633の位置へとドラッグ操作することによって、破線で囲まれた領域634が選択される。領域634が選択されることによって、当該領域と重なるメタクラスタ611~617も選択される。メタクラスタ611~617が選択されることに応じて、データ解析クライアント端末20は、同図に示されるように、二次元プロット630及び631において、各メタクラスタに属するイベントに、各メタクラスタに付された色を付す。このように色を付す表示手法によって、メタクラスタに属するイベントを直感的に把握することができ、さらにバックゲーティングも可能となる。
As shown in FIG. 37, the user drags the mouse cursor from the position of reference numeral 632 to the position of reference numeral 633 to select the area 634 surrounded by the broken line. By selecting the region 634, the metaclusters 611 to 617 that overlap with the region are also selected. In response to the selection of metaclusters 611 to 617, the data analysis client terminal 20 attaches to each metacluster to the events belonging to each metacluster in the two- dimensional plots 630 and 631, as shown in the figure. Add the color that was used. With this colored display method, events belonging to the metacluster can be intuitively grasped, and backgating is also possible.
なお、同図においては、ドラッグ操作によって、複数のメタクラスタが選択された例を示したが、例えばクリック操作によって1つ以上のメタクラスタが選択されてもよい。この場合においても、選択されたメタクラスタに増するイベントに、各メタクラスタに付された色が付されてよい。
Although the figure shows an example in which a plurality of metaclusters are selected by a drag operation, for example, one or more metaclusters may be selected by a click operation. In this case as well, the events that increase in the selected metacluster may be colored with each metacluster.
(14)スターチャート中のパイ表示軸の制御
(14) Control of pie display axis in star chart
上記(11)~(13)において説明した図面においても示されているように、スターチャートの各ノード(クラスタ)において、マーカー群の発現量データがパイ表示によって示されている場合がある。例えば、マーカーの発現量が多いほど、当該マーカーに対応する領域(パイ)の半径方向の長さが長くなるように表示されている。例えば、図38に示されるノード700には複数のマーカーの発現量がパイ表示によって示されている。各マーカーの発現量は半径方向の長さに対応しており、例えば符号701によって示される領域に対応するマーカーの発現量は、半径方向の長さ702に対応している。なお、同図においては長さ702が矢印によって示されているが、スターチャートにおいてそのような矢印は表示されなくてよい。
As shown in the drawings described in (11) to (13) above, the expression level data of the marker group may be shown by pie display in each node (cluster) of the star chart. For example, the larger the expression level of the marker, the longer the radial length of the region (pie) corresponding to the marker is displayed. For example, the expression levels of a plurality of markers are shown by pie display in the node 700 shown in FIG. 38. The expression level of each marker corresponds to the radial length, for example, the expression level of the marker corresponding to the region indicated by reference numeral 701 corresponds to the radial length 702. Although the length 702 is indicated by an arrow in the figure, such an arrow may not be displayed in the star chart.
本開示において、データ解析クライアント端末20は、各ノード中のパイ表示の軸設定を変更することができるように構成されてよい。例えば、データ解析クライアント端末20は、或るノードにおけるパイ表示の軸スケールを、当該ノードに対応する二次元プロットの軸スケールに対応させるように、パイ表示の軸設定を変更してよい。ここで、イベントの集団である各ノードは、クラスタリングを実行することで形成されたクラスタでなくてもよい。各ノードは、例えば二次元プロット上にゲートが作成された場合において、そのゲート内に存在するイベント群に基づき形成されてもよい。
このように軸設定が変更可能であることによって、発現量の程度をより把握しやすくなる。加えて、二次元プロットとの関係をより的確に把握することも可能となる。 In the present disclosure, the dataanalysis client terminal 20 may be configured so that the axis setting of the pie display in each node can be changed. For example, the data analysis client terminal 20 may change the axis setting of the pie display so that the axis scale of the pie display at a certain node corresponds to the axis scale of the two-dimensional plot corresponding to the node. Here, each node that is a group of events does not have to be a cluster formed by executing clustering. Each node may be formed based on a group of events existing in the gate, for example, when a gate is created on the two-dimensional plot.
By being able to change the axis setting in this way, it becomes easier to grasp the degree of expression level. In addition, it is possible to more accurately grasp the relationship with the two-dimensional plot.
このように軸設定が変更可能であることによって、発現量の程度をより把握しやすくなる。加えて、二次元プロットとの関係をより的確に把握することも可能となる。 In the present disclosure, the data
By being able to change the axis setting in this way, it becomes easier to grasp the degree of expression level. In addition, it is possible to more accurately grasp the relationship with the two-dimensional plot.
二次元プロットの軸スケールの例として、Linearスケール、Logスケール、及びBiexponentialスケールを挙げることができる。前記表示の軸スケールの例としても、Linearスケール、Logスケール、及びBiexponentialスケールを挙げることができる。
本開示において、データ解析クライアント端末20は、各ノード中のパイ表示の軸スケールとして、これらのうちのいずれかを採用してよい。例えば、二次元プロットの軸スケールとしてBiexponentialスケールが採用されている場合において、データ解析クライアント端末20は、当該二次元プロットに対応する1以上のノードのパイ表示の軸スケールとしてBiexponentialスケールを採用しうる。 Examples of axis scales for 2D plots include Linear scale, Log scale, and Biexponential scale. Examples of the axis scale of the display include a Linear scale, a Log scale, and a Biexponential scale.
In the present disclosure, the dataanalysis client terminal 20 may adopt any one of these as the axis scale of the pie display in each node. For example, when the Biexponential scale is adopted as the axis scale of the two-dimensional plot, the data analysis client terminal 20 may adopt the Biexponential scale as the axis scale of the pie display of one or more nodes corresponding to the two-dimensional plot. ..
本開示において、データ解析クライアント端末20は、各ノード中のパイ表示の軸スケールとして、これらのうちのいずれかを採用してよい。例えば、二次元プロットの軸スケールとしてBiexponentialスケールが採用されている場合において、データ解析クライアント端末20は、当該二次元プロットに対応する1以上のノードのパイ表示の軸スケールとしてBiexponentialスケールを採用しうる。 Examples of axis scales for 2D plots include Linear scale, Log scale, and Biexponential scale. Examples of the axis scale of the display include a Linear scale, a Log scale, and a Biexponential scale.
In the present disclosure, the data
本開示において、上記の軸設定の変更を行うために、データ解析クライアント端末20は、二次元プロットの設定ウィンドウを出力可能であるように構成されてよい。データ解析クライアント端末20が、出力データとして、例えば図39に示される二次元プロットデータ710を出力装置に表示している場合を想定する。
In the present disclosure, in order to change the above axis settings, the data analysis client terminal 20 may be configured to be able to output a setting window for a two-dimensional plot. It is assumed that the data analysis client terminal 20 displays, for example, the two-dimensional plot data 710 shown in FIG. 39 on the output device as output data.
この場合において、例えばユーザが所定の操作を実行することに応じて、データ解析クライアント端末20は、プロット設定ウィンドウ711を出力装置に表示させる。当該プロット設定ウィンドウには、同図に示されるとおり、二次元プロットデータ710のX軸及びY軸の設定を調整するためのエリア712及び713を有する。X軸を設定するエリア712は、同図に示されるように、X軸の軸スケールを選択するリストボックス714を有する。同図においては、「Biexponential」と表示されているが、当該リストボックスにおいて、「Biexponential」に加えて、「Linear」及び「Log」を選択することも可能であるように構成されている。Y軸を設定するエリア713も、同様にY軸の軸スケールを選択するリストボックス715を有する。当該リストボックスについても、同様に前記3つの軸スケールのうちのいずれかを選択することが可能であるように構成されている。
In this case, for example, the data analysis client terminal 20 causes the output device to display the plot setting window 711 in response to the user performing a predetermined operation. The plot setting window has areas 712 and 713 for adjusting the X-axis and Y-axis settings of the two-dimensional plot data 710, as shown in the figure. The area 712 for setting the X-axis has a list box 714 for selecting the axis scale for the X-axis, as shown in the figure. In the figure, "Biexponential" is displayed, but in the list box, "Linear" and "Log" can be selected in addition to "Biexponential". The area 713 for setting the Y-axis also has a list box 715 for selecting the axis scale for the Y-axis. Similarly, the list box is configured so that any one of the three axis scales can be selected.
ユーザが当該プロット設定ウィンドウにおいて、X軸及び/又はY軸の軸スケールを選択すると、データ解析クライアント端末20は、軸スケールが選択されたことに応じて、当該プロット設定ウィンドウによってコントロールされる二次元プロットに対応する1以上のノードのパイ表示の軸スケールを変更しうる。当該変更は、当該パイ表示の軸スケールが、当該プロット設定において選択された軸スケールと同じになるように行われる。
When the user selects an X-axis and / or Y-axis axis scale in the plot setting window, the data analysis client terminal 20 is two-dimensional controlled by the plot setting window in response to the axis scale being selected. You can change the axis scale of the pie display for one or more nodes that correspond to the plot. The change is made so that the axis scale of the pie display is the same as the axis scale selected in the plot setting.
本開示は、以上で述べた情報処理システム、並びに、当該情報処理システムに含まれるサーバシステム、データ取得クライアント端末、及びデータ解析クライアント端末を提供する。これらの詳細は、以上で説明したとおりである。
The present disclosure provides the information processing system described above, as well as a server system, a data acquisition client terminal, and a data analysis client terminal included in the information processing system. These details are as described above.
2.情報処理方法
2. 2. Information processing method
本開示は、情報処理方法も提供する。当該情報処理方法は、上記(4)において説明した処理の1つ以上を含んでよい。例えば、当該情報処理方法は、生体試料に光を照射することで取得される光強度データ又は当該光強度データから算出された蛍光標識強度データに対する解析処理を行って出力用データを生成する自動解析処理工程と、前記光強度データ又は前記蛍光標識強度データに基づき生成された前記出力用データを記憶する解析結果データ記憶工程と、出力装置に出力された前記出力用データに対する解析コマンドに基づき前記蛍光標識強度データを解析して解析結果データを出力する対話型解析処理工程とを含んでよい。これらの各工程については、上記(4)における説明が当てはまる。
This disclosure also provides information processing methods. The information processing method may include one or more of the processes described in (4) above. For example, the information processing method is an automatic analysis that generates output data by performing analysis processing on light intensity data acquired by irradiating a biological sample with light or fluorescent label intensity data calculated from the light intensity data. The fluorescence is based on the processing step, the analysis result data storage step of storing the output data generated based on the light intensity data or the fluorescent label intensity data, and the analysis command for the output data output to the output device. It may include an interactive analysis processing step that analyzes the label intensity data and outputs the analysis result data. The explanation in (4) above applies to each of these steps.
なお、本開示は、以下のような構成をとることもできる。
〔1〕
生体試料に光を照射することで取得される光強度データ又は蛍光標識強度データに対する解析処理により出力用データを生成する自動解析処理部と、
前記光強度データ又は前記蛍光標識強度データに基づき生成された前記出力用データを記憶する解析結果データ記憶部と、
出力装置に出力された前記出力用データに対する解析コマンドに基づき前記蛍光標識強度データを解析して解析結果データを出力する対話型解析処理部と
を含むサーバシステム。
〔2〕
前記自動解析処理部は、前記光強度データから蛍光標識強度データを算出する、〔1〕に記載のサーバシステム。
〔3〕
前記自動解析処理部による処理及び前記対話型解析処理部による処理は、互いに異なるコンピューテーションリソース上で実行される、〔1〕又は〔2〕に記載のサーバシステム。
〔4〕
前記サーバシステムは、前記自動解析処理部による処理及び/又は前記対話型解析処理部による処理のためのコンピューテーションリソースを、解析開始コマンドを受信したことに応じて確保する、〔1〕~〔3〕のいずれか一つに記載のサーバシステム。
〔5〕
前記サーバシステムは、前記自動解析処理部による処理及び/又は前記対話型解析処理部による処理において用いられる解析設定データが保存されるデータベースをさらに含む、〔1〕~〔4〕のいずれか一つに記載のサーバシステム。
〔6〕
前記サーバシステムは、前記光強度データ及び/又は前記蛍光標識強度データを記憶する光データ記憶部をさらに含む、〔1〕~〔5〕のいずれか一つに記載のサーバシステム。
〔7〕
前記光データ記憶部は、アクセス速度の異なる2種類以上のストレージを含み、
前記サーバシステムは、アクセス速度がより高いストレージに格納されている前記光強度データ及び/又は前記蛍光標識強度データを、所定の条件が満たされた場合に、アクセス速度がより低いストレージへと移行する処理を実行する、〔6〕に記載のサーバシステム。
〔8〕
前記出力用データは、二次元プロット画像、スペクトルプロット画像、一次元ヒストグラム画像、二次元等高線プロット画像、次元圧縮画像、及びクラスタリング結果表示図のうちの少なくとも一つを含む、〔1〕~〔7〕のいずれか一つに記載のサーバシステム。
〔9〕
生体試料に光を照射することで取得される光強度データを取得する又は当該光強度データに対する算出処理によって蛍光標識強度データを取得するデータ取得クライアント端末;及び
前記データ取得クライアント端末から送信された前記光強度データ又は前記蛍光標識強度データを記憶する光データ記憶部と、
前記光強度データ又は前記から蛍光標識強度データに対する解析処理により出力用データを生成する自動解析処理部と、
前記光強度データ又は前記蛍光標識強度データに基づき生成された前記出力用データを記憶する解析結果データ記憶部と、
出力装置に出力された前記出力用データに対する解析コマンドに基づき前記蛍光標識強度データを解析して解析結果データを出力する対話型解析処理部と、を含むサーバシステム
を含む情報処理システム。
〔10〕
前記データ取得クライアント端末は、前記光強度データ又は前記蛍光標識強度データを取得したことに応じて、前記光強度データ又は前記蛍光標識強度データを前記サーバシステムへと送信する、〔9〕に記載の情報処理システム。
〔11〕
前記データ取得クライアント端末は、前記光強度データ又は前記蛍光標識強度データを取得したことに応じて、前記光強度データ又は前記蛍光標識強度データに対して所定の処理を行い、そして、当該処理された光強度データ又は蛍光標識強度データを前記サーバシステムへと送信する、〔9〕又は〔10〕に記載の情報処理システム。
〔12〕
前記サーバシステムは、前記自動解析処理部による処理において用いられる解析設定データを予め保有しており、
前記自動解析処理部は、当該解析設定データを用いて、前記光強度データから前記蛍光標識強度データを算出する、
〔9〕~〔11〕のいずれか一つに記載の情報処理システム。
〔13〕
前記自動解析処理部は、前記光強度データが前記光データ記憶部に格納されたことに応じて、当該光強度データから蛍光標識強度データを算出する処理を実行する、〔9〕~〔12〕のいずれか一つに記載の情報処理システム。
〔14〕
前記情報処理システムは、前記出力装置を含むデータ解析クライアント端末をさらに含む、〔9〕~〔13〕のいずれか一つに記載の情報処理システム。
〔15〕
前記データ解析クライアント端末は、前記出力装置に出力された前記出力用データに対する前記解析コマンドを、前記サーバシステムへ送信する、〔14〕に記載の情報処理システム。
〔16〕
前記データ解析クライアント端末は、前記出力用データが表示されるウィンドウを前記出力装置に出力させ、当該ウィンドウにて、前記解析コマンドの入力を受け付ける、〔14〕又は〔15〕に記載の情報処理システム。
〔17〕
複数のデータ解析クライアント端末が、前記サーバシステム内の光強度データ、蛍光強度データ及び解析設定データのうちのいずれか1つ以上を共有することができる、〔9〕~〔16〕のいずれか一つに記載の情報処理システム。
〔18〕
複数のデータ取得クライアント端末が、前記サーバシステム内の解析設定データを共有することができる、〔9〕~〔17〕のいずれか一つに記載の情報処理システム。
〔19〕
生体試料に光を照射することで取得される光強度データを取得するデータ取得部と、
前記光強度データを取得したことに応じて、前記光強度データをサーバシステムへと送信する送信部とを含み、
前記サーバシステムにおいて、前記光強度データから蛍光標識強度データを算出する、
データ取得クライアント端末。
〔20〕
サーバシステムが蛍光標識強度データに基づき作成した出力用データを当該サーバシステムから受信する通信部と、
当該出力用データを出力装置に出力させる処理を行う処理部と、
を含むデータ解析クライアント端末。
〔21〕
前記データ解析クライアント端末は、前記出力用データが表示されるウィンドウを前記出力装置に出力させ、当該ウィンドウにて、当該出力用データに対する解析コマンドの入力を受け付ける、〔20〕に記載のデータ解析クライアント端末。
〔22〕
生体試料に光を照射することで取得される光強度データ又は当該光強度データから算出された蛍光標識強度データに対する解析処理を行って出力用データを生成する自動解析処理工程と、
前記光強度データ又は前記蛍光標識強度データに基づき生成された前記出力用データを記憶する解析結果データ記憶工程と、
出力装置に出力された前記出力用データに対する解析コマンドに基づき前記蛍光標識強度データを解析して解析結果データを出力する対話型解析処理工程と
を含む情報処理方法。 The present disclosure may also have the following structure.
[1]
An automatic analysis processing unit that generates output data by analysis processing for light intensity data or fluorescent label intensity data acquired by irradiating a biological sample with light, and an automatic analysis processing unit.
An analysis result data storage unit that stores the output data generated based on the light intensity data or the fluorescent label intensity data, and
A server system including an interactive analysis processing unit that analyzes the fluorescent label intensity data based on the analysis command for the output data output to the output device and outputs the analysis result data.
[2]
The server system according to [1], wherein the automatic analysis processing unit calculates fluorescent label intensity data from the light intensity data.
[3]
The server system according to [1] or [2], wherein the processing by the automatic analysis processing unit and the processing by the interactive analysis processing unit are executed on different computing resources.
[4]
The server system secures computing resources for processing by the automatic analysis processing unit and / or processing by the interactive analysis processing unit in response to receiving an analysis start command, [1] to [ The server system according to any one of 3].
[5]
The server system is any one of [1] to [4], further including a database in which analysis setting data used in the processing by the automatic analysis processing unit and / or the processing by the interactive analysis processing unit is stored. The server system described in.
[6]
The server system according to any one of [1] to [5], wherein the server system further includes an optical data storage unit that stores the light intensity data and / or the fluorescent label intensity data.
[7]
The optical data storage unit includes two or more types of storage having different access speeds.
The server system migrates the light intensity data and / or the fluorescent label intensity data stored in the storage having a higher access speed to the storage having a lower access speed when a predetermined condition is satisfied. The server system according to [6], which executes the process.
[8]
The output data includes at least one of a two-dimensional plot image, a spectrum plot image, a one-dimensional histogram image, a two-dimensional contour plot image, a dimensional compressed image, and a clustering result display diagram, [1] to [7]. ] The server system described in any one of.
[9]
A data acquisition client terminal that acquires light intensity data acquired by irradiating a biological sample with light or acquires fluorescence label intensity data by a calculation process for the light intensity data; and the data transmission from the data acquisition client terminal. An optical data storage unit that stores light intensity data or the fluorescent label intensity data,
An automatic analysis processing unit that generates output data by analysis processing of the light intensity data or the fluorescent label intensity data from the above, and an automatic analysis processing unit.
An analysis result data storage unit that stores the output data generated based on the light intensity data or the fluorescent label intensity data, and
An information processing system including a server system including an interactive analysis processing unit that analyzes the fluorescent label intensity data based on an analysis command for the output data output to the output device and outputs analysis result data.
[10]
The data acquisition client terminal transmits the light intensity data or the fluorescent label intensity data to the server system in response to the acquisition of the light intensity data or the fluorescent label intensity data, according to [9]. Information processing system.
[11]
The data acquisition client terminal performs a predetermined process on the light intensity data or the fluorescent label intensity data in response to the acquisition of the light intensity data or the fluorescent label intensity data, and the processed. The information processing system according to [9] or [10], which transmits light intensity data or fluorescent label intensity data to the server system.
[12]
The server system holds analysis setting data used in the processing by the automatic analysis processing unit in advance.
The automatic analysis processing unit calculates the fluorescent label intensity data from the light intensity data using the analysis setting data.
The information processing system according to any one of [9] to [11].
[13]
The automatic analysis processing unit executes a process of calculating fluorescent label intensity data from the light intensity data in response to the light intensity data being stored in the light data storage unit, [9] to [12]. The information processing system described in any one of.
[14]
The information processing system according to any one of [9] to [13], further including a data analysis client terminal including the output device.
[15]
The information processing system according to [14], wherein the data analysis client terminal transmits the analysis command for the output data output to the output device to the server system.
[16]
The information processing system according to [14] or [15], wherein the data analysis client terminal causes the output device to output a window in which the output data is displayed, and accepts an input of the analysis command in the window. ..
[17]
Any one of [9] to [16], wherein a plurality of data analysis client terminals can share any one or more of the light intensity data, the fluorescence intensity data, and the analysis setting data in the server system. The information processing system described in one.
[18]
The information processing system according to any one of [9] to [17], wherein a plurality of data acquisition client terminals can share analysis setting data in the server system.
[19]
A data acquisition unit that acquires light intensity data acquired by irradiating a biological sample with light,
Including a transmission unit that transmits the light intensity data to the server system in response to the acquisition of the light intensity data.
In the server system, the fluorescent label intensity data is calculated from the light intensity data.
Data acquisition client terminal.
[20]
A communication unit that receives output data created by the server system based on the fluorescence label intensity data from the server system, and
A processing unit that performs processing to output the output data to the output device,
Data analysis client terminal including.
[21]
The data analysis client terminal according to [20], wherein the data analysis client terminal causes the output device to output a window in which the output data is displayed, and accepts an input of an analysis command for the output data in the window. Terminal.
[22]
An automatic analysis processing step that generates output data by performing analysis processing on the light intensity data acquired by irradiating a biological sample with light or the fluorescent label intensity data calculated from the light intensity data.
An analysis result data storage step for storing the output data generated based on the light intensity data or the fluorescent label intensity data, and
An information processing method including an interactive analysis processing step of analyzing the fluorescent label intensity data based on an analysis command for the output data output to the output device and outputting the analysis result data.
1 情報処理システム
10 サーバシステム
20 データ解析クライアント端末
30 データ取得クライアント端末
40 生体試料分析装置 1Information processing system 10 Server system 20 Data analysis client terminal 30 Data acquisition client terminal 40 Biological sample analyzer
10 サーバシステム
20 データ解析クライアント端末
30 データ取得クライアント端末
40 生体試料分析装置 1
Claims (22)
- 生体試料に光を照射することで取得される光強度データ又は蛍光標識強度データに対する解析処理により出力用データを生成する自動解析処理部と、
前記光強度データ又は前記蛍光標識強度データに基づき生成された前記出力用データを記憶する解析結果データ記憶部と、
出力装置に出力された前記出力用データに対する解析コマンドに基づき前記蛍光標識強度データを解析して解析結果データを出力する対話型解析処理部と
を含むサーバシステム。 An automatic analysis processing unit that generates output data by analysis processing for light intensity data or fluorescent label intensity data acquired by irradiating a biological sample with light, and an automatic analysis processing unit.
An analysis result data storage unit that stores the output data generated based on the light intensity data or the fluorescent label intensity data, and
A server system including an interactive analysis processing unit that analyzes the fluorescent label intensity data based on the analysis command for the output data output to the output device and outputs the analysis result data. - 前記自動解析処理部は、前記光強度データから蛍光標識強度データを算出する、請求項1に記載のサーバシステム。 The server system according to claim 1, wherein the automatic analysis processing unit calculates fluorescent label intensity data from the light intensity data.
- 前記自動解析処理部による処理及び前記対話型解析処理部による処理は、互いに異なるコンピューテーションリソース上で実行される、請求項1に記載のサーバシステム。 The server system according to claim 1, wherein the processing by the automatic analysis processing unit and the processing by the interactive analysis processing unit are executed on different computing resources.
- 前記サーバシステムは、前記自動解析処理部による処理及び/又は前記対話型解析処理部による処理のためのコンピューテーションリソースを、解析開始コマンドを受信したことに応じて確保する、請求項1に記載のサーバシステム。 The first aspect of claim 1, wherein the server system secures computing resources for processing by the automatic analysis processing unit and / or processing by the interactive analysis processing unit in response to receiving an analysis start command. Server system.
- 前記サーバシステムは、前記自動解析処理部による処理及び/又は前記対話型解析処理部による処理において用いられる解析設定データが保存されるデータベースをさらに含む、請求項1に記載のサーバシステム。 The server system according to claim 1, further comprising a database in which analysis setting data used in the processing by the automatic analysis processing unit and / or the processing by the interactive analysis processing unit is stored.
- 前記サーバシステムは、前記光強度データ及び/又は前記蛍光標識強度データを記憶する光データ記憶部をさらに含む、請求項1に記載のサーバシステム。 The server system according to claim 1, wherein the server system further includes an optical data storage unit that stores the light intensity data and / or the fluorescent label intensity data.
- 前記光データ記憶部は、アクセス速度の異なる2種類以上のストレージを含み、
前記サーバシステムは、アクセス速度がより高いストレージに格納されている前記光強度データ及び/又は前記蛍光標識強度データを、所定の条件が満たされた場合に、アクセス速度がより低いストレージへと移行する処理を実行する、請求項6に記載のサーバシステム。 The optical data storage unit includes two or more types of storage having different access speeds.
The server system migrates the light intensity data and / or the fluorescence label intensity data stored in the storage having a higher access speed to the storage having a lower access speed when a predetermined condition is satisfied. The server system according to claim 6, which executes the process. - 前記出力用データは、二次元プロット画像、スペクトルプロット画像、一次元ヒストグラム画像、二次元等高線プロット画像、次元圧縮画像、及びクラスタリング結果表示図のうちの少なくとも一つを含む、請求項1に記載のサーバシステム。 The output data according to claim 1, wherein the output data includes at least one of a two-dimensional plot image, a spectrum plot image, a one-dimensional histogram image, a two-dimensional contour plot image, a dimensional compressed image, and a clustering result display diagram. Server system.
- 生体試料に光を照射することで取得される光強度データを取得する又は当該光強度データに対する算出処理によって蛍光標識強度データを取得するデータ取得クライアント端末;及び
前記データ取得クライアント端末から送信された前記光強度データ又は前記蛍光標識強度データを記憶する光データ記憶部と、
前記光強度データ又は前記蛍光標識強度データに対する解析処理により出力用データを生成する自動解析処理部と、
前記光強度データ又は前記蛍光標識強度データに基づき生成された前記出力用データを記憶する解析結果データ記憶部と、
出力装置に出力された前記出力用データに対する解析コマンドに基づき前記蛍光標識強度データを解析して解析結果データを出力する対話型解析処理部と、を含むサーバシステム
を含む情報処理システム。 A data acquisition client terminal that acquires light intensity data acquired by irradiating a biological sample with light or acquires fluorescence label intensity data by a calculation process for the light intensity data; and the data transmission from the data acquisition client terminal. An optical data storage unit that stores light intensity data or the fluorescent label intensity data,
An automatic analysis processing unit that generates output data by analysis processing on the light intensity data or the fluorescent label intensity data, and
An analysis result data storage unit that stores the output data generated based on the light intensity data or the fluorescent label intensity data, and
An information processing system including a server system including an interactive analysis processing unit that analyzes the fluorescent label intensity data based on an analysis command for the output data output to the output device and outputs analysis result data. - 前記データ取得クライアント端末は、前記光強度データ又は前記蛍光標識強度データを取得したことに応じて、前記光強度データ又は前記蛍光標識強度データを前記サーバシステムへと送信する、請求項9に記載の情報処理システム。 The ninth aspect of claim 9, wherein the data acquisition client terminal transmits the light intensity data or the fluorescent label intensity data to the server system in response to the acquisition of the light intensity data or the fluorescent label intensity data. Information processing system.
- 前記データ取得クライアント端末は、前記光強度データ又は前記蛍光標識強度データを取得したことに応じて、前記光強度データ又は前記蛍光標識強度データに対して所定の処理を行い、そして、当該処理された光強度データ又は蛍光標識強度データを前記サーバシステムへと送信する、請求項9に記載の情報処理システム。 The data acquisition client terminal performs a predetermined process on the light intensity data or the fluorescent label intensity data in response to the acquisition of the light intensity data or the fluorescent label intensity data, and the processed. The information processing system according to claim 9, wherein the light intensity data or the fluorescent label intensity data is transmitted to the server system.
- 前記サーバシステムは、前記自動解析処理部による処理において用いられる解析設定データを予め保有しており、
前記自動解析処理部は、当該解析設定データを用いて、前記光強度データから前記蛍光標識強度データを算出する、
請求項9に記載の情報処理システム。 The server system holds analysis setting data used in the processing by the automatic analysis processing unit in advance.
The automatic analysis processing unit calculates the fluorescent label intensity data from the light intensity data using the analysis setting data.
The information processing system according to claim 9. - 前記自動解析処理部は、前記光強度データが前記光データ記憶部に格納されたことに応じて、当該光強度データから蛍光標識強度データを算出する処理を実行する、請求項9に記載の情報処理システム。 The information according to claim 9, wherein the automatic analysis processing unit executes a process of calculating fluorescent label intensity data from the light intensity data in response to the light intensity data being stored in the optical data storage unit. Processing system.
- 前記情報処理システムは、前記出力装置を含むデータ解析クライアント端末をさらに含む、請求項9に記載の情報処理システム。 The information processing system according to claim 9, wherein the information processing system further includes a data analysis client terminal including the output device.
- 前記データ解析クライアント端末は、前記出力装置に出力された前記出力用データに対する前記解析コマンドを、前記サーバシステムへ送信する、請求項14に記載の情報処理システム。 The information processing system according to claim 14, wherein the data analysis client terminal transmits the analysis command for the output data output to the output device to the server system.
- 前記データ解析クライアント端末は、前記出力用データが表示されるウィンドウを前記出力装置に出力させ、当該ウィンドウにて、前記解析コマンドの入力を受け付ける、請求項14に記載の情報処理システム。 The information processing system according to claim 14, wherein the data analysis client terminal causes the output device to output a window in which the output data is displayed, and accepts an input of the analysis command in the window.
- 複数のデータ解析クライアント端末が、前記サーバシステム内の光強度データ、蛍光標識強度データ及び解析設定データのうちの1つ以上を共有することができる、請求項9に記載の情報処理システム。 The information processing system according to claim 9, wherein a plurality of data analysis client terminals can share one or more of the light intensity data, the fluorescent label intensity data, and the analysis setting data in the server system.
- 複数のデータ取得クライアント端末が、前記サーバシステム内の解析設定データを共有することができる、請求項9に記載の情報処理システム。 The information processing system according to claim 9, wherein a plurality of data acquisition client terminals can share the analysis setting data in the server system.
- 生体試料に光を照射することで取得される光強度データを取得するデータ取得部と、
前記光強度データを取得したことに応じて、前記光強度データをサーバシステムへと送信する送信部とを含み、
前記サーバシステムにおいて、前記光強度データから蛍光標識強度データを算出する、
データ取得クライアント端末。 A data acquisition unit that acquires light intensity data acquired by irradiating a biological sample with light,
Including a transmission unit that transmits the light intensity data to the server system in response to the acquisition of the light intensity data.
In the server system, the fluorescent label intensity data is calculated from the light intensity data.
Data acquisition client terminal. - サーバシステムが蛍光標識強度データに基づき作成した出力用データを当該サーバシステムから受信する通信部と、
当該出力用データを出力装置に出力させる処理を行う処理部と、
を含むデータ解析クライアント端末。 A communication unit that receives output data created by the server system based on the fluorescence label intensity data from the server system, and
A processing unit that performs processing to output the output data to the output device,
Data analysis client terminal including. - 前記データ解析クライアント端末は、前記出力用データが表示されるウィンドウを前記出力装置に出力させ、当該ウィンドウにて、当該出力用データに対する解析コマンドの入力を受け付ける、請求項20に記載のデータ解析クライアント端末。 The data analysis client according to claim 20, wherein the data analysis client terminal causes the output device to output a window in which the output data is displayed, and accepts input of an analysis command for the output data in the window. Terminal.
- 生体試料に光を照射することで取得される光強度データ又は当該光強度データから算出された蛍光標識強度データに対する解析処理を行って出力用データを生成する自動解析処理工程と、
前記光強度データ又は前記蛍光標識強度データに基づき生成された前記出力用データを記憶する解析結果データ記憶工程と、
出力装置に出力された前記出力用データに対する解析コマンドに基づき前記蛍光標識強度データを解析して解析結果データを出力する対話型解析処理工程と
を含む情報処理方法。 An automatic analysis processing step that generates output data by performing analysis processing on the light intensity data acquired by irradiating a biological sample with light or the fluorescent label intensity data calculated from the light intensity data.
An analysis result data storage step for storing the output data generated based on the light intensity data or the fluorescent label intensity data, and
An information processing method including an interactive analysis processing step of analyzing the fluorescent label intensity data based on an analysis command for the output data output to the output device and outputting the analysis result data.
Priority Applications (4)
| Application Number | Priority Date | Filing Date | Title |
|---|---|---|---|
| JP2022557315A JPWO2022080102A1 (en) | 2020-10-12 | 2021-09-22 | |
| CN202180068088.9A CN116261657A (en) | 2020-10-12 | 2021-09-22 | Server system, information processing system, data acquisition client terminal, data analysis client terminal, and information processing method |
| US18/030,340 US20230366804A1 (en) | 2020-10-12 | 2021-09-22 | Server system, information processing system, data acquisition client terminal, data analysis client terminal, and information processing method |
| EP21879843.7A EP4227665A4 (en) | 2020-10-12 | 2021-09-22 | Server system, information processing system, data acquisition client terminal, data analysis client terminal, and information processing method |
Applications Claiming Priority (2)
| Application Number | Priority Date | Filing Date | Title |
|---|---|---|---|
| JP2020171897 | 2020-10-12 | ||
| JP2020-171897 | 2020-10-12 |
Publications (1)
| Publication Number | Publication Date |
|---|---|
| WO2022080102A1 true WO2022080102A1 (en) | 2022-04-21 |
Family
ID=81208034
Family Applications (1)
| Application Number | Title | Priority Date | Filing Date |
|---|---|---|---|
| PCT/JP2021/034791 WO2022080102A1 (en) | 2020-10-12 | 2021-09-22 | Server system, information processing system, data acquisition client terminal, data analysis client terminal, and information processing method |
Country Status (5)
| Country | Link |
|---|---|
| US (1) | US20230366804A1 (en) |
| EP (1) | EP4227665A4 (en) |
| JP (1) | JPWO2022080102A1 (en) |
| CN (1) | CN116261657A (en) |
| WO (1) | WO2022080102A1 (en) |
Citations (8)
| Publication number | Priority date | Publication date | Assignee | Title |
|---|---|---|---|---|
| JP2003232796A (en) * | 2002-02-08 | 2003-08-22 | Matsushita Electric Ind Co Ltd | Method for enhancing accuracy of measured result and server system |
| JP2005265686A (en) * | 2004-03-19 | 2005-09-29 | Kurita Water Ind Ltd | Data calibration method and calibration data providing method |
| US20060015291A1 (en) * | 2002-10-18 | 2006-01-19 | Leland Stanford Junior University | Methods and systems for data analysis |
| JP2006309288A (en) * | 2005-04-26 | 2006-11-09 | Sony Corp | File management system, access control part, file management method, and program |
| WO2014141878A1 (en) * | 2013-03-15 | 2014-09-18 | ソニー株式会社 | Microparticle analyzing device, microparticle analyzing method, program, and microparticle analyzing system |
| JP2015171333A (en) * | 2014-03-11 | 2015-10-01 | 富士通株式会社 | Determination method, determination program, and determination device |
| JP5985140B2 (en) | 2010-04-28 | 2016-09-06 | ソニー株式会社 | Fluorescence intensity correction method, fluorescence intensity calculation method, and fluorescence intensity calculation apparatus |
| JP2020056593A (en) * | 2018-09-28 | 2020-04-09 | シスメックス株式会社 | Measuring apparatus and accuracy control method |
Family Cites Families (2)
| Publication number | Priority date | Publication date | Assignee | Title |
|---|---|---|---|---|
| JP7271092B2 (en) * | 2018-05-25 | 2023-05-11 | シスメックス株式会社 | Reagent selection support device, cell analysis system, reagent selection support method, computer program and storage medium |
| US20200200671A1 (en) * | 2018-12-20 | 2020-06-25 | Sony Corporation | Information processing apparatus, information processing method, and program |
-
2021
- 2021-09-22 US US18/030,340 patent/US20230366804A1/en active Pending
- 2021-09-22 WO PCT/JP2021/034791 patent/WO2022080102A1/en unknown
- 2021-09-22 JP JP2022557315A patent/JPWO2022080102A1/ja active Pending
- 2021-09-22 EP EP21879843.7A patent/EP4227665A4/en active Pending
- 2021-09-22 CN CN202180068088.9A patent/CN116261657A/en active Pending
Patent Citations (8)
| Publication number | Priority date | Publication date | Assignee | Title |
|---|---|---|---|---|
| JP2003232796A (en) * | 2002-02-08 | 2003-08-22 | Matsushita Electric Ind Co Ltd | Method for enhancing accuracy of measured result and server system |
| US20060015291A1 (en) * | 2002-10-18 | 2006-01-19 | Leland Stanford Junior University | Methods and systems for data analysis |
| JP2005265686A (en) * | 2004-03-19 | 2005-09-29 | Kurita Water Ind Ltd | Data calibration method and calibration data providing method |
| JP2006309288A (en) * | 2005-04-26 | 2006-11-09 | Sony Corp | File management system, access control part, file management method, and program |
| JP5985140B2 (en) | 2010-04-28 | 2016-09-06 | ソニー株式会社 | Fluorescence intensity correction method, fluorescence intensity calculation method, and fluorescence intensity calculation apparatus |
| WO2014141878A1 (en) * | 2013-03-15 | 2014-09-18 | ソニー株式会社 | Microparticle analyzing device, microparticle analyzing method, program, and microparticle analyzing system |
| JP2015171333A (en) * | 2014-03-11 | 2015-10-01 | 富士通株式会社 | Determination method, determination program, and determination device |
| JP2020056593A (en) * | 2018-09-28 | 2020-04-09 | シスメックス株式会社 | Measuring apparatus and accuracy control method |
Non-Patent Citations (1)
| Title |
|---|
| See also references of EP4227665A4 |
Also Published As
| Publication number | Publication date |
|---|---|
| US20230366804A1 (en) | 2023-11-16 |
| EP4227665A1 (en) | 2023-08-16 |
| JPWO2022080102A1 (en) | 2022-04-21 |
| EP4227665A4 (en) | 2024-04-17 |
| CN116261657A (en) | 2023-06-13 |
Similar Documents
| Publication | Publication Date | Title |
|---|---|---|
| US11454588B2 (en) | Fluorescent spectrum correcting method and fluorescent spectrum measuring device | |
| CN106018771B (en) | Blood analysis device and blood analysis method | |
| US8476066B2 (en) | Bacteria analyzer, bacteria analyzing method and computer program product | |
| US20220082489A1 (en) | Methods and apparatus for full spectrum flow cytometer | |
| US11029242B2 (en) | Index sorting systems and methods | |
| EP3882603A1 (en) | Information processing device, information processing method, and computer program | |
| Megyesi et al. | Multi-color FLUOROSPOT counting using ImmunoSpot® Fluoro-X™ suite | |
| US20220276148A1 (en) | Information processing device, display method, program, and information processing system | |
| JP2003505707A (en) | System for small volume laser scanning cytometry | |
| US20220283073A1 (en) | Information processing device, information processing method, program, and information processing system | |
| WO2022080102A1 (en) | Server system, information processing system, data acquisition client terminal, data analysis client terminal, and information processing method | |
| WO2022019006A1 (en) | Information processing system and information processing method | |
| WO2023171463A1 (en) | Information processing device and information processing system | |
| WO2023136201A1 (en) | Information processing device, and information processing system | |
| US20230273191A1 (en) | Information processing apparatus, information processing system, information processing method, and program | |
| CN113168529A (en) | Information processing apparatus, information processing method, and program | |
| Robinson | Comparative overview of flow and image cytometry | |
| US20230384220A1 (en) | Information processing apparatus, information processing method, and program | |
| Goucher et al. | A quantitative determination of multi-protein interactions by the analysis of confocal images using a pixel-by-pixel assessment algorithm | |
| EP4083606A1 (en) | Information processing device, particle measurement device, particle measurement system, particle sorting device, particle sorting system, information processing method, and information processing program | |
| WO2021153192A1 (en) | Information processing device, particle analyzing device, information processing method, and program | |
| US20240027447A1 (en) | Methods and aparatus for a mouse surface and intracellular flow cytometry immunophenotyping kit | |
| Goetz et al. | The Language of Flow Cytometry and Experimental Setup | |
| CN116113819A (en) | Information processing device, flow cytometer system, sorting system, and information processing method |
Legal Events
| Date | Code | Title | Description |
|---|---|---|---|
| 121 | Ep: the epo has been informed by wipo that ep was designated in this application |
Ref document number: 21879843 Country of ref document: EP Kind code of ref document: A1 |
|
| ENP | Entry into the national phase |
Ref document number: 2022557315 Country of ref document: JP Kind code of ref document: A |
|
| NENP | Non-entry into the national phase |
Ref country code: DE |
|
| ENP | Entry into the national phase |
Ref document number: 2021879843 Country of ref document: EP Effective date: 20230512 |