WO2022070656A1 - 異常検知モデルの評価システムおよび評価方法 - Google Patents
異常検知モデルの評価システムおよび評価方法 Download PDFInfo
- Publication number
- WO2022070656A1 WO2022070656A1 PCT/JP2021/030333 JP2021030333W WO2022070656A1 WO 2022070656 A1 WO2022070656 A1 WO 2022070656A1 JP 2021030333 W JP2021030333 W JP 2021030333W WO 2022070656 A1 WO2022070656 A1 WO 2022070656A1
- Authority
- WO
- WIPO (PCT)
- Prior art keywords
- evaluation
- detection model
- abnormality detection
- value
- objective variable
- Prior art date
- Legal status (The legal status is an assumption and is not a legal conclusion. Google has not performed a legal analysis and makes no representation as to the accuracy of the status listed.)
- Ceased
Links
Images






Classifications
-
- G—PHYSICS
- G05—CONTROLLING; REGULATING
- G05B—CONTROL OR REGULATING SYSTEMS IN GENERAL; FUNCTIONAL ELEMENTS OF SUCH SYSTEMS; MONITORING OR TESTING ARRANGEMENTS FOR SUCH SYSTEMS OR ELEMENTS
- G05B23/00—Testing or monitoring of control systems or parts thereof
- G05B23/02—Electric testing or monitoring
Definitions
- the present invention relates to an abnormality detection technique by estimating a normal range of an abnormality detection target, and particularly relates to an evaluation system and an evaluation method of an abnormality detection model for estimating a normal range.
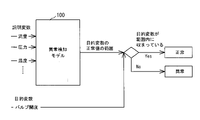
- FIG. 9 is a diagram illustrating a conventional abnormality detection method.
- a plurality of time-series data input to the anomaly detection model 100 are referred to as explanatory variables, and time-series data to be anomaly detection targets are referred to as objective variables.
- the flow rate, pressure, temperature and the like are explanatory variables, and the valve opening degree is the objective variable.
- the data used to create the abnormality detection model 100 is called learning data, and the data for evaluating the performance of the abnormality detection model 100 is called verification data.
- learning data the data during the period in which the abnormality is not detected in the abnormality detection target is used. There is no problem even if there are multiple periods.
- As the verification data data that is not normally used for the training data is usually used, but training data may be used.
- the anomaly detection model 100 estimates the range of normal values of the objective variable from the input explanatory variables. There are an upper limit value and a lower limit value in this range of normal values.
- the upper limit and the lower limit are not limited to one set.
- a plurality of upper and lower limit sets can be output by using a reliability having a value in the range of 0 to 1 as shown in FIG.
- reliability 0 corresponds to the outermost upper and lower limit values
- 1 corresponds to the innermost upper and lower limit values.
- abnormality detection can be performed depending on whether or not the value of the objective variable is within the range of the upper and lower limit values output from the abnormality detection model 100.
- a more complicated method may be used for the abnormality detection method (see Patent Document 1).
- the conventional anomaly detection method in Patent Document 1 that estimates the normal range (time series) of the objective variable using time series data acquired from a sensor or the like is a model for estimating the normal range, and is viewed on the time axis. It is difficult to quantify the evaluation index of the anomaly detection model because there are places with good accuracy and places with bad accuracy. Therefore, there were the following problems.
- the evaluation of the quality of the anomaly detection model is personal and ambiguous.
- the criteria for how much the anomaly detection model should be improved becomes ambiguous.
- the present invention has been made to solve the above problems, and provides an evaluation system and evaluation method for an anomaly detection model capable of calculating an evaluation value of an anomaly detection model and reducing waste in creating an anomaly detection model.
- the purpose is to do.
- the evaluation system for the anomaly detection model of the present invention includes a model creation unit configured to create an anomaly detection model that models the relationship between the explanatory variable data, which is time-series data, and the normal range of the objective variable data, and verification. Based on the estimation result of the normal range of the objective variable output from the anomaly detection model when the explanatory variable for the purpose is input to the anomaly detection model, and the measured data of the objective variable corresponding to the explanatory variable for verification. , The evaluation value calculation unit configured to calculate the evaluation value of the abnormality detection model by aggregating the difference between the estimation result and the time series data of the actual measurement data at each time, and the abnormality based on the evaluation value. It is characterized by including an evaluation unit configured to evaluate the detection model.
- the evaluation method of the anomaly detection model of the present invention includes a first step of creating an anomaly detection model that models the relationship between the explanatory variable data, which is time-series data, and the normal range of the objective variable data, and a verification method. Estimate based on the estimation result of the normal range of the objective variable output from the anomaly detection model when the explanatory variable is input to the anomaly detection model, and the actual measurement data of the objective variable corresponding to the explanatory variable for verification.
- the evaluation value calculation unit and the evaluation unit it is possible to calculate the quantitative evaluation value of the abnormality detection model and evaluate the abnormality detection model, which eliminates the waste of creating the abnormality detection model. Can be mitigated.
- FIG. 1 is a block diagram showing a configuration of an evaluation system for an abnormality detection model according to the first embodiment of the present invention.
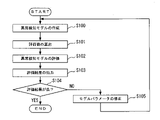
- FIG. 2 is a flowchart illustrating the operation of the evaluation system of the abnormality detection model according to the first embodiment of the present invention.
- FIG. 3 is a diagram illustrating an inclusion rate, which is an example of evaluation values in the first embodiment of the present invention.
- 4A-4B are diagrams illustrating a degree of follow-up, which is an example of evaluation values in the first embodiment of the present invention.
- 5A-5B are diagrams illustrating a range of estimated values, which is an example of evaluation values in the first embodiment of the present invention.
- FIG. 6 is a block diagram showing a configuration of an evaluation system for an abnormality detection model according to a second embodiment of the present invention.
- FIG. 7 is a flowchart illustrating the operation of the evaluation system of the abnormality detection model according to the second embodiment of the present invention.
- FIG. 8 is a block diagram showing a configuration example of a computer that realizes an evaluation system for an abnormality detection model according to the first and second embodiments of the present invention.
- FIG. 9 is a diagram illustrating a conventional abnormality detection method.
- FIG. 10 is a diagram showing an estimated value of an objective variable based on a conventional anomaly detection model and an actual objective variable.
- a model modification type In the present invention, two types of evaluation systems for anomaly detection models, a model modification type and a model selection type, are assumed.
- the model modification type three evaluation values described later are calculated for the abnormality detection model, and the total evaluation value obtained by integrating multiple evaluation values out of the three evaluation values or the comparison result between one evaluation value and the corresponding threshold value is used. And evaluate the anomaly detection model. By evaluating the anomaly detection model, it is possible to determine whether to modify the anomaly detection model or end the model construction.
- multiple anomaly detection models are created by changing the anomaly detection model parameters (explanatory variables, learning parameters, etc.) in advance, three evaluation values are calculated for each anomaly detection model, and multiple of the three evaluation values are calculated.
- Each of the anomaly detection models is evaluated based on the comprehensive evaluation value in which the evaluation values are integrated or one evaluation value. By evaluating a plurality of anomaly detection models, the best anomaly detection model can be selected.
- FIG. 1 is a block diagram showing a configuration of an evaluation system for an abnormality detection model according to a first embodiment of the present invention.
- This embodiment is an example showing an example of a model modification type.
- the evaluation system of this embodiment is when the model creation unit 1 that creates an abnormality detection model 2 that models the relationship between the explanatory variable and the normal range of the objective variable and the explanatory variable for verification are input to the abnormality detection model 2.
- Evaluation value calculation to calculate the evaluation value of the abnormality detection model 2 based on the estimation result of the normal range of the objective variable output from the abnormality detection model 2 and the actual measurement data of the objective variable corresponding to the explanatory variable for verification.
- It includes a unit 3, an evaluation unit 4 that evaluates an abnormality detection model 2 based on an evaluation value, and a model parameter correction unit 5 that corrects an abnormality detection model parameter based on the evaluation result.
- FIG. 2 is a flowchart illustrating the operation of the evaluation system.
- the anomaly detection model 2 is a mathematical model constructed by software.
- the model creation unit 1 creates an abnormality detection model 2 by a known modeling technique using a large number of learning data including an explanatory variable X for learning (step S100 in FIG. 2).
- the training data is given actual measurement data of the objective variable Y corresponding to the explanatory variable X (actual measurement value of the objective variable Y with respect to the explanatory variable X when the plant to be detected for abnormality is in a normal state).
- the anomaly detection model 2 examples include a fuzzy neural network (FNN) and a regression model.
- the explanatory variables X that are the inputs of the abnormality detection model 2 include, for example, a flow rate, a pressure, and a temperature.
- the objective variable Y that is the output of the abnormality detection model 2 for example, there is a valve opening degree.
- the explanatory variable X and the objective variable Y are not limited to these examples. Since the method of creating the abnormality detection model 2 by the model creation unit 1 (method of creating a regression model, method of learning FNN) is a well-known technique, detailed description thereof will be omitted.
- the evaluation value calculation unit 3 calculates the evaluation value of the abnormality detection model 2 using the verification data including the explanatory variable X for verification (FIG. 2, step S101).
- the verification data is given actual measurement data of the objective variable Y corresponding to the explanatory variable X.
- the evaluation value calculation unit 3 calculates three evaluation values: the inclusion rate, the degree of follow-up, and the range of the estimated value.
- the inclusion rate indicates the ratio in which the measured data of the objective variable Y is included in the normal range defined by the estimated value of the upper limit value and the estimated value of the lower limit value of the objective variable Y output from the abnormality detection model 2.
- the inclusion rate is an evaluation value calculated based on the idea that it is desirable that the measured data of the objective variable Y be included in the normal range of the objective variable Y estimated by the abnormality detection model 2.
- the degree of follow-up indicates the degree of similarity between the measured data of the objective variable Y and the movement of the objective variable Y estimated by the abnormality detection model 2 in the normal range.
- the follow-up degree is an evaluation value calculated based on the idea that it is desirable that the movement of the measured data of the objective variable Y and the movement of the estimated value of the abnormality detection model 2 are similar.
- the abnormality detection model 2 has higher accuracy when the width between the estimated value of the upper limit value and the estimated value of the lower limit value of the objective variable Y output from the abnormality detection model 2 is small.
- the width of the estimated value is an evaluation value calculated based on the idea that the width of the estimated value of the upper and lower limits of the abnormality detection model 2 should be as narrow as possible (that is, it is a highly accurate model).
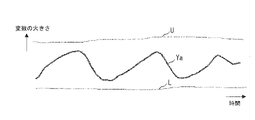
- FIG. 3 shows an example in which a part of the measured data Ya of the objective variable Y (data of the broken lines 30 and 31) deviates from the normal range defined by the estimated upper limit value U and the estimated lower limit value L. Is shown. It is an appropriate abnormality detection model that the measured data Ya of the objective variable Y is included without deviating from the normal range as much as possible.
- the measured data Ya of the objective variable Y corresponding to the explanatory variable X for verification is the normal range of the objective variable Y output from the abnormality detection model 2 with respect to the input of the explanatory variable X for verification.
- Equation (1) indicates the ratio in which the measured data Ya of the objective variable Y is included in the range defined by the outermost upper and lower limit values (the range defined by the highest upper limit value and the lowest lower limit value).
- the explanatory variable X may include a plurality of types of data such as the above-mentioned flow rate, pressure, temperature, etc., but the above-mentioned total number of verification data N includes these multiple types of data as one data. This is the number of verification data counted.
- the evaluation value calculation unit 3 sets the range in which the measured data Ya of the objective variable Y is defined by the innermost upper and lower limit values of the upper and lower limit values of the normal range of the objective variable Y output from the abnormality detection model 2.
- Equation (2) indicates the ratio in which the measured data Ya of the objective variable Y is included in the range defined by the innermost upper and lower limit values (the range defined by the lowest upper limit value and the highest lower limit value). ing. According to the equation (2), a stricter value is calculated as the evaluation value of the abnormality detection model 2 as compared with the case of the equation (1).
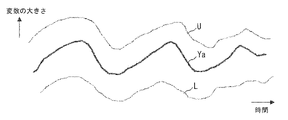
- FIG. 4A shows an example in which the estimated value U of the upper limit value of the normal range of the objective variable Y and the estimated value L of the lower limit value do not follow the movement of the actually measured data Ya of the objective variable Y.
- FIG. 4B shows an example in which the estimated value U of the upper limit value and the estimated value L of the lower limit value follow the movement of the actually measured data Ya of the objective variable Y. It is an appropriate abnormality detection model that the estimated value U of the upper limit value and the estimated value L of the lower limit value follow the actually measured data Ya of the objective variable Y.
- the evaluation value calculation unit 3 uses Ya (t) as the actual measurement data of the objective variable Y at time t, and is the innermost of the estimated value U of the upper limit value U and the estimated value L of the lower limit value of the normal range of the objective variable Y at time t.
- Ya (t) the average value of the estimated value U1 (t) of the upper limit value of U1 (t) and the estimated value L1 (t) of the innermost lower limit value (U1 (t) + L1 (t)) / 2
- E (t) the following equation is used.
- the follow-up degree F is calculated.
- F Corr (Ya (t), E (t)) ... (3)
- Corr () in equation (3) is a correlation coefficient.
- the degree of similarity between the waveform of the measured data Ya of the objective variable Y and the waveform in the normal range defined by the innermost upper and lower limit values is evaluated by the correlation coefficient.
- Equation (4) evaluates the degree of similarity between the waveform of the measured data Ya of the objective variable Y and the waveform in the normal range defined by the innermost upper and lower limit values by the sum of squares of errors.
- FIG. 5A shows an example in which the estimated value U of the upper limit value of the normal range of the objective variable Y and the estimated value L of the lower limit value are wider than the actually measured data Ya of the objective variable Y.
- FIG. 5B shows an example in which the width between the estimated value U of the upper limit value and the estimated value L of the lower limit value is narrow with respect to the actually measured data Ya of the objective variable Y.
- the narrower the width between the estimated value U of the upper limit value and the estimated value L of the lower limit value is the appropriate abnormality detection model.
- the evaluation value calculation unit 3 uses Ya (t) as the measured data of the objective variable Y at time t, and is the outermost of the estimated value U of the upper limit value and the estimated value L of the lower limit value of the normal range of the objective variable Y at time t.
- Mean () in the formula (5) is an average value in a certain period.
- Max () in the formula (6) is the maximum value in a certain period. Equation (6) evaluates the portion where the width of the estimated value of the upper and lower limit values of the normal range of the objective variable Y is the largest. In this way, the evaluation value calculation unit 3 calculates the inclusion rate I, the follow-up degree F, and the width B of the estimated value.
- the verification data is described as being different from the training data, but the training data may be used as the verification data.
- the evaluation unit 4 evaluates the abnormality detection model 2 based on the evaluation value calculated by the evaluation value calculation unit 3 (step S102 in FIG. 2). Specifically, the evaluation unit 4 evaluates the abnormality detection model 2 by comparing each of the inclusion rate I, the follow-up degree F, and the width B of the estimated value with the corresponding threshold values.
- the evaluation unit 4 determines that the inclusion rate I is good ( ⁇ ) when the inclusion rate I is equal to or more than the threshold value Ith, and determines that the inclusion rate I is slightly poor ( ⁇ ) when the inclusion rate I is less than the threshold value Is.
- the threshold Is is, for example, 100%.
- the evaluation unit 4 determines that the follow-up degree F is good ( ⁇ ) when the follow-up degree F is the threshold value Fth1 or more, and is slightly poor ( ⁇ ) when the follow-up degree F is less than the threshold value Fth1 and is the threshold value Fth2 (Fth1> Fth2) or more. If the follow-up degree F is less than the threshold value Fth2, it is determined to be defective (x).
- the threshold value Fth1 is, for example, 0.8
- the threshold value Fth2 is, for example, 0.6.
- the evaluation unit 4 determines that the width B of the estimated value is good ( ⁇ ) when the width B of the estimated value is less than the threshold value Bth1, and the evaluation unit 4 is slightly defective when the width B of the estimated value is equal to or more than the threshold value Bth1 and less than the threshold value Bth2 (Bth1 ⁇ Bth2).
- the threshold value Bth1 is, for example, 0.05
- the threshold value Bth2 is, for example, 0.2.
- the evaluation unit 4 determines that the abnormality detection model 2 is good (no need for improvement), and the comparison result between the evaluation value and the threshold value is predetermined. If the evaluation criteria of the above are not satisfied, the abnormality detection model 2 is determined to be defective (needs improvement), and the evaluation result is output (FIG. 2, step S103).
- the condition that the comparison results of the evaluation value and the threshold value are all good may be used as the evaluation standard, the comparison result of the follow-up degree F and the threshold values Fth1 and Fth2 is good, and the comparison result of the width B of the estimated value and the threshold values Bth1 and Bth2.
- the condition that is good may be used as the evaluation standard.
- the condition that the comparison result between the inclusion rate I, the follow-up degree F, the width B of the estimated value, and the corresponding threshold value is good may be used as the evaluation standard.
- the evaluation criteria may be appropriately set according to the abnormality detection target.
- As an evaluation result (good / bad) output method there are display of evaluation result, output of a signal showing the evaluation result, and the like.
- the model parameter correction unit 5 corrects the abnormality detection model parameter (FIG. 2 step S105) when the evaluation result of the abnormality detection model 2 is defective (needs improvement) (NO in FIG. 2 step S104). Then, the model creation unit 1 recreates the abnormality detection model (step S100 in FIG. 2).
- a method of correcting anomaly detection model parameters for example, there is a method of applying a Bayesian optimization algorithm or the like.
- steps S100 to S105 are repeatedly carried out until the evaluation result of the abnormality detection model 2 becomes good (YES in step S104 of FIG. 2).
- the upper and lower limits of the objective variable Y measured by the measuring instrument are output from the anomaly detection model 2 as in the past. Whether or not the detection target is normal may be determined based on whether or not it is within the normal range defined by the estimated value.
- the criteria for good or bad of the abnormality detection model 2 are quantified, so that personality can be excluded. Further, in this embodiment, by setting a threshold value in the evaluation value and making a determination, it is possible to determine a criterion for discontinuing the correction of the abnormality detection model 2.
- the abnormality detection model 2 can be automatically modified.
- automatic modification of the model is not an essential configuration requirement, and the operator may manually modify the model.
- FIG. 6 is a block diagram showing a configuration of an evaluation system for an abnormality detection model according to a second embodiment of the present invention.
- This embodiment is an example showing a model selection type example.
- the evaluation system of this embodiment includes a model creation unit 1a that creates a plurality of abnormality detection models 2a with different conditions, an evaluation value calculation unit 3a, an evaluation unit 4a, and the best abnormality detection model 2a based on the evaluation results. It includes a model selection unit 6 for selection.
- FIG. 7 is a flowchart illustrating the operation of the evaluation system of this embodiment.
- the model creation unit 1a creates an abnormality detection model 2a by a known modeling technique using a large number of learning data including an explanatory variable X for learning (step S200 in FIG. 7).
- the model creation unit 1a uses learning data having different types of explanatory variables X, learning data having different selection ranges of explanatory variables X, and changing the abnormality detection model parameters, so that the conditions are different. Create a plurality of abnormality detection models 2a.
- the evaluation value calculation unit 3a calculates the evaluation value for each abnormality detection model 2a using the verification data including the explanatory variable X for verification (FIG. 7, step S201).
- the method of calculating the evaluation value is the same as that of the first embodiment. However, in this embodiment, since the evaluation value is calculated for each abnormality detection model 2a having different conditions (type of explanatory variable X and range of explanatory variable X), it is necessary to use verification data as required by the abnormality detection model 2a. It goes without saying that there is.
- the evaluation unit 4a evaluates each abnormality detection model 2a based on the evaluation value calculated by the evaluation value calculation unit 3a (step S202 in FIG. 7). Specifically, the evaluation unit 4a calculates a comprehensive evaluation value (for example, a weighted sum of the inclusion rate I, the follow-up degree F, and the width B of the estimated value) that integrates the evaluation values for each abnormality detection model 2a, and the comprehensive evaluation value. Each abnormality detection model 2a is evaluated by comparing the magnitudes of the above.
- a comprehensive evaluation value for example, a weighted sum of the inclusion rate I, the follow-up degree F, and the width B of the estimated value
- the evaluation unit 4a determines that the abnormality detection model 2a having the maximum weighted sum S is the best abnormality detection model 2a, and outputs the evaluation result (FIG. 7 step S203).
- the weighted sum S is used as the comprehensive evaluation value and the magnitude of the weighted sum S is compared, the weighted sum S may be calculated with the weights w1 and w2 as positive values and the weights w3 as negative values.
- the weighted sum of the three evaluation values is used as the comprehensive evaluation value, but the weighted sum of two evaluation values out of the inclusion rate I, the follow-up degree F, and the width B of the estimated value may be used as the comprehensive evaluation value. good.
- the evaluation unit 4a may evaluate each of the abnormality detection models 2a based on one evaluation value.
- the inclusion rate I is used, the abnormality detection model 2a having the maximum inclusion rate I may be determined to be the best abnormality detection model 2a.
- the follow-up degree F the abnormality detection model 2a having the maximum follow-up degree F may be determined to be the best abnormality detection model 2a.
- the width B of the estimated value is used, the abnormality detection model 2a having the smallest width B of the estimated value may be determined as the best abnormality detection model 2a.
- the model selection unit 6 sets the abnormality detection model 2a having the best evaluation result as the abnormality detection model used in the abnormality detection system (step S204 in FIG. 7).
- the same effect as in the first embodiment can be obtained.
- the criteria for good or bad of the abnormality detection model 2a are quantified, the best abnormality detection model 2a used in the abnormality detection system can be automatically selected.
- automatic model selection is not an essential configuration requirement, and the operator may manually select the model.
- the abnormality detection model 2 is evaluated based on the comparison result between at least one of the three evaluation values and the corresponding threshold value, but the evaluation unit of the first embodiment. 4 calculates a comprehensive evaluation value that integrates a plurality of evaluation values out of the three evaluation values as in the present embodiment, and uses the abnormality detection model 2 based on the comparison result between the comprehensive evaluation value and the corresponding threshold value. It may be evaluated.
- the evaluation unit 4 determines that the total evaluation value is good ( ⁇ ) when the total evaluation value is the threshold value Sth1 or more, and the total evaluation value is less than the threshold value Sth1 and the threshold value Sth2 ( If Sth1> Sth2) or more, it may be determined to be slightly defective ( ⁇ ), and if the comprehensive evaluation value is less than the threshold value Sth2, it may be determined to be defective ( ⁇ ).
- the evaluation system described in the first and second embodiments can be realized by a computer equipped with a CPU (Central Processing Unit), a storage device, and an interface, and a program for controlling these hardware resources.
- a computer equipped with a CPU (Central Processing Unit), a storage device, and an interface, and a program for controlling these hardware resources.
- An example of the configuration of this computer is shown in FIG.
- the computer includes a CPU 200, a storage device 201, and an interface device (I / F) 202.
- An abnormality detection system or the like is connected to the I / F 202.
- a program for realizing the evaluation method of the present invention is stored in the storage device 201.
- the CPU 200 executes the processes described in the first and second embodiments according to the program stored in the storage device 201.
- the present invention can be applied to a technique for creating a model for detecting an abnormality in a plant.
Landscapes
- Physics & Mathematics (AREA)
- General Physics & Mathematics (AREA)
- Engineering & Computer Science (AREA)
- Automation & Control Theory (AREA)
- Testing And Monitoring For Control Systems (AREA)
Abstract
評価システムは、時系列データである説明変数データと目的変数データの正常範囲との関係をモデル化した異常検知モデル(2)を作成するモデル作成部(1)と、検証用の説明変数を異常検知モデル(2)に入力したときに異常検知モデル(2)から出力された目的変数の正常範囲の推定結果と、検証用の説明変数に対応する目的変数の実測データとに基づいて、異常検知モデル(2)の評価値を算出する評価値算出部(3)と、評価値に基づいて異常検知モデル(2)を評価する評価部(4)とを備える。
Description
本発明は、異常検知対象の正常範囲を推定することによる異常検知技術に係り、特に正常範囲を推定する異常検知モデルの評価システムおよび評価方法に関するものである。
化学プラントのような工場では、オンラインでプロセスの状態を計測するためのセンサが取り付けられ、それらのセンサなどから取得される時系列データが日々蓄積されている。この蓄積された時系列データを用いて、異常検知対象の正常範囲を推定するモデルを構築し、対象の異常を検知する方法がある(例えば、特許文献1参照)。
図9は従来の異常検知方法を説明する図である。異常検知モデル100の入力となる複数の時系列データを説明変数、異常検知対象となる時系列データを目的変数と呼ぶ。図9の例では、流量、圧力、温度などが説明変数であり、バルブ開度が目的変数である。また、異常検知モデル100を作成するために使用するデータを学習データ、異常検知モデル100の性能を評価するためのデータを検証データと呼ぶ。学習データとしては、異常検知対象に異常が発生していない期間のデータを使用する。この期間は複数あっても問題ない。検証データとしては、通常、学習データに使用しなかったデータを使用するが、学習データを使用してもよい。
異常検知モデル100は、入力された説明変数から目的変数の正常値の範囲を推定する。この正常値の範囲には、上限値と下限値がある。上限値と下限値は一組には限定されない。例えば、特許文献1においては、図10に示すように0~1の範囲の値をとる信頼度を用いて、複数の上下限の組を出力できる。図10の例では、信頼度0が一番外側の上下限値、1が一番内側の上下限値に対応する。
図9に示すように、異常の検知は、目的変数の値が、異常検知モデル100から出力された上下限値の範囲内に入っているか否かで実施できる。ただし、異常検知方法についてはより複雑な方法を用いる場合もある(特許文献1参照)。
センサなどから取得される時系列データを用いて、目的変数の正常範囲(の時系列)を推定する特許文献1における従来の異常検知方法は、正常範囲を推定するモデルであり、時間軸で見ると精度が良い場所と悪い場所が存在したりするため、異常検知モデルの評価指標を定量化するのが困難で、人が目視で目的変数と推定値の形を見て異常検知モデルの良し悪しを判断していたため、以下のような課題があった。
(I)異常検知モデルの良し悪しの評価が属人的で曖昧となる。
(II)異常検知モデルをどこまで改良すればよいかの基準が曖昧となる。
(I)異常検知モデルの良し悪しの評価が属人的で曖昧となる。
(II)異常検知モデルをどこまで改良すればよいかの基準が曖昧となる。
上記の(II)のような課題があるため、担当者が不必要な試行錯誤を繰り返したり、いつまでやればよいか分からないために担当者の心理的負担となったりしていた。
本発明は、上記課題を解決するためになされたもので、異常検知モデルの評価値を算出し、異常検知モデルの作成の無駄を軽減することができる異常検知モデルの評価システムおよび評価方法を提供することを目的とする。
本発明の異常検知モデルの評価システムは、時系列データである説明変数データと目的変数データの正常範囲との関係をモデル化した異常検知モデルを作成するように構成されたモデル作成部と、検証用の説明変数を前記異常検知モデルに入力したときに前記異常検知モデルから出力された目的変数の正常範囲の推定結果と、前記検証用の説明変数に対応する目的変数の実測データとに基づいて、推定結果と実測データの時系列データの各時刻における差異を集約することで、前記異常検知モデルの評価値を算出するように構成された評価値算出部と、前記評価値に基づいて前記異常検知モデルを評価するように構成された評価部とを備えることを特徴とするものである。
また、本発明の異常検知モデルの評価方法は、時系列データである説明変数データと目的変数データの正常範囲との関係をモデル化した異常検知モデルを作成する第1のステップと、検証用の説明変数を前記異常検知モデルに入力したときに前記異常検知モデルから出力された目的変数の正常範囲の推定結果と、前記検証用の説明変数に対応する目的変数の実測データとに基づいて、推定結果と実測データの時系列データの各時刻における差異を集約することで、前記異常検知モデルの評価値を算出する第2のステップと、前記評価値に基づいて前記異常検知モデルを評価する第3のステップとを含むことを特徴とするものである。
本発明によれば、評価値算出部と評価部とを設けることにより、異常検知モデルの定量的な評価値を算出して異常検知モデルを評価することができ、異常検知モデルの作成の無駄を軽減することができる。
[発明の原理]
本発明では、異常検知モデルの評価システムとして、モデル修正型とモデル選択型の2つを想定している。モデル修正型では、異常検知モデルについて後述する3つの評価値を算出し、3つの評価値のうち複数の評価値を統合した総合評価値または1つの評価値と対応する閾値との比較結果に基づいて、異常検知モデルを評価する。異常検知モデルを評価することにより、異常検知モデルの修正を行うかモデルの構築を終了するかを判断することができる。
本発明では、異常検知モデルの評価システムとして、モデル修正型とモデル選択型の2つを想定している。モデル修正型では、異常検知モデルについて後述する3つの評価値を算出し、3つの評価値のうち複数の評価値を統合した総合評価値または1つの評価値と対応する閾値との比較結果に基づいて、異常検知モデルを評価する。異常検知モデルを評価することにより、異常検知モデルの修正を行うかモデルの構築を終了するかを判断することができる。
モデル選択型では、あらかじめ異常検知モデルパラメータ(説明変数、学習パラメータなど)を変えて異常検知モデルを複数作成し、異常検知モデル毎に3つの評価値を算出し、3つの評価値のうち複数の評価値を統合した総合評価値または1つの評価値に基づいて、異常検知モデルのそれぞれを評価する。複数の異常検知モデルを評価することにより、最良の異常検知モデルを選択することができる。
[第1の実施例]
以下、本発明の実施例について図面を参照して説明する。図1は本発明の第1の実施例に係る異常検知モデルの評価システムの構成を示すブロック図である。本実施例は、モデル修正型の例を示す例である。本実施例の評価システムは、説明変数と目的変数の正常範囲との関係をモデル化した異常検知モデル2を作成するモデル作成部1と、検証用の説明変数を異常検知モデル2に入力したときに異常検知モデル2から出力された目的変数の正常範囲の推定結果と、検証用の説明変数に対応する目的変数の実測データとに基づいて、異常検知モデル2の評価値を算出する評価値算出部3と、評価値に基づいて異常検知モデル2を評価する評価部4と、評価結果に基づいて異常検知モデルパラメータを修正するモデルパラメータ修正部5とを備えている。
以下、本発明の実施例について図面を参照して説明する。図1は本発明の第1の実施例に係る異常検知モデルの評価システムの構成を示すブロック図である。本実施例は、モデル修正型の例を示す例である。本実施例の評価システムは、説明変数と目的変数の正常範囲との関係をモデル化した異常検知モデル2を作成するモデル作成部1と、検証用の説明変数を異常検知モデル2に入力したときに異常検知モデル2から出力された目的変数の正常範囲の推定結果と、検証用の説明変数に対応する目的変数の実測データとに基づいて、異常検知モデル2の評価値を算出する評価値算出部3と、評価値に基づいて異常検知モデル2を評価する評価部4と、評価結果に基づいて異常検知モデルパラメータを修正するモデルパラメータ修正部5とを備えている。
図2は評価システムの動作を説明するフローチャートである。異常検知モデル2は、ソフトウェア的に構築された数学モデルである。モデル作成部1は、学習用の説明変数Xを含む多数の学習データを用いて、公知のモデリング技術により異常検知モデル2を作成する(図2ステップS100)。学習データには、説明変数Xに対応する目的変数Yの実測データ(異常検知対象のプラントが正常な状態での説明変数Xに対する目的変数Yの実測値)が付与されている。
異常検知モデル2の例としては、ファジィニューラルネットワーク(Fuzzy Neural Network:FNN)、回帰モデルなどがある。図9で説明したとおり、異常検知モデル2の入力となる説明変数Xとしては、例えば流量、圧力、温度などがある。また、異常検知モデル2の出力となる目的変数Yとしては、例えばバルブ開度がある。説明変数Xと目的変数Yは、これらの例に限らないことは言うまでもない。モデル作成部1による異常検知モデル2の作成方法(回帰モデルの作成方法、FNNの学習方法)は、周知の技術であるので、詳細な説明は省略する。
評価値算出部3は、検証用の説明変数Xを含む検証データを用いて異常検知モデル2の評価値を算出する(図2ステップS101)。検証データには、説明変数Xに対応する目的変数Yの実測データが付与されている。
評価値算出部3は、評価値として、包含率、追従度、推定値の幅の3つを算出する。包含率は、異常検知モデル2から出力された目的変数Yの上限値の推定値と下限値の推定値とによって規定される正常範囲に目的変数Yの実測データが含まれる割合を示す。包含率は、目的変数Yの実測データが異常検知モデル2によって推定された目的変数Yの正常範囲に包含されることが望ましいという考えの基に算出される評価値である。
追従度は、目的変数Yの実測データと異常検知モデル2によって推定された目的変数Yの正常範囲の動きの類似度を示す。追従度は、目的変数Yの実測データの動きと異常検知モデル2の推定値の動きが似ている方が望ましいという考えの基に算出される評価値である。
また、異常検知モデル2は、異常検知モデル2から出力された目的変数Yの上限値の推定値と下限値の推定値の幅が小さい方がより高精度であると言える。推定値の幅は、異常検知モデル2の上下限の推定値の幅がなるべく狭いほうが良い(つまり高精度なモデルである)という考えの基に算出される評価値である。
まず、包含率の算出方法について説明する。図3は、目的変数Yの実測データYaの一部(破線30,31の部分のデータ)が、上限値の推定値Uと下限値の推定値Lとによって規定される正常範囲を逸脱する例を示している。目的変数Yの実測データYaが正常範囲をなるべく逸脱しないで包含されている方が、適切な異常検知モデルということになる。
評価値算出部3は、検証用の説明変数Xに対応する目的変数Yの実測データYaが、検証用の説明変数Xの入力に対して異常検知モデル2から出力された目的変数Yの正常範囲の上下限値のうち最外側の上下限値によって規定される範囲を逸脱した数をn0、全検証データ数をNとしたとき、次式により包含率I[%]を算出する。
I=(1-n0/N)×100 ・・・(1)
I=(1-n0/N)×100 ・・・(1)
検証データ(説明変数X)を異常検知モデル2に入力すると、目的変数Yの正常範囲の上下限値の推定値が検証データ毎に得られる。式(1)は、目的変数Yの実測データYaが最外側の上下限値によって規定される範囲(最も高い上限値と最も低い下限値とによって規定される範囲)に含まれている割合を示している。
なお、説明変数Xには上記の流量、圧力、温度などのように複数種類のデータが含まれることがあるが、上記の全検証データ数Nは、これら複数種類のデータを1個のデータとして数えた検証データ数である。
なお、説明変数Xには上記の流量、圧力、温度などのように複数種類のデータが含まれることがあるが、上記の全検証データ数Nは、これら複数種類のデータを1個のデータとして数えた検証データ数である。
また、評価値算出部3は、目的変数Yの実測データYaが、異常検知モデル2から出力された目的変数Yの正常範囲の上下限値のうち最内側の上下限値によって規定される範囲を逸脱した数をn1としたとき、次式により包含率I[%]を算出するようにしてもよい。
I=(1-n1/N)×100 ・・・(2)
I=(1-n1/N)×100 ・・・(2)
式(2)は、目的変数Yの実測データYaが最内側の上下限値によって規定される範囲(最も低い上限値と最も高い下限値とによって規定される範囲)に含まれている割合を示している。式(2)によると、式(1)の場合に比べて異常検知モデル2の評価値としては厳しめの値が算出されることになる。
次に、追従度の算出方法について説明する。図4Aは、目的変数Yの正常範囲の上限値の推定値Uと下限値の推定値Lとが目的変数Yの実測データYaの動きに追従していない例を示している。図4Bは、上限値の推定値Uと下限値の推定値Lとが目的変数Yの実測データYaの動きに追従している例を示している。上限値の推定値Uと下限値の推定値Lとが目的変数Yの実測データYaに追従している方が、適切な異常検知モデルということになる。
評価値算出部3は、時刻tにおける目的変数Yの実測データをYa(t)とし、時刻tにおける目的変数Yの正常範囲の上限値の推定値Uと下限値の推定値Lのうち最内側の上限値の推定値U1(t)と最内側の下限値の推定値L1(t)の平均値(U1(t)+L1(t))/2をE(t)としたとき、次式により追従度Fを算出する。
F=Corr(Ya(t),E(t)) ・・・(3)
F=Corr(Ya(t),E(t)) ・・・(3)
式(3)のCorr()は相関係数である。式(3)は、目的変数Yの実測データYaの波形と最内側の上下限値によって規定される正常範囲の波形とが似ている度合いを相関係数で評価している。
また、評価値算出部3は、次式により追従度Fを算出するようにしてもよい。
F=1/SUM((Ya(t)-E(t))2) ・・・(4)
また、評価値算出部3は、次式により追従度Fを算出するようにしてもよい。
F=1/SUM((Ya(t)-E(t))2) ・・・(4)
式(4)のSUM()は一定の期間における合計値である。式(4)は、目的変数Yの実測データYaの波形と最内側の上下限値によって規定される正常範囲の波形とが似ている度合いを誤差2乗和で評価している。
次に、推定値の幅の算出方法について説明する。図5Aは、目的変数Yの実測データYaに対して目的変数Yの正常範囲の上限値の推定値Uと下限値の推定値Lとの幅が広い例を示している。図5Bは、目的変数Yの実測データYaに対して上限値の推定値Uと下限値の推定値Lとの幅が狭い例を示している。上限値の推定値Uと下限値の推定値Lとの幅が狭い方が、適切な異常検知モデルということになる。その際、実測データYaが上限値の推定値Uと下限値の推定値Lの間にある方が望ましいことはいうまでもない。
評価値算出部3は、時刻tにおける目的変数Yの実測データをYa(t)とし、時刻tにおける目的変数Yの正常範囲の上限値の推定値Uと下限値の推定値Lのうち最外側の上限値の推定値をU0(t)、最外側の下限値の推定値をL0(t)とし、目的変数Yを計測する計測器のレンジをWとしたとき、次式により推定値の幅Bを算出する。
B=Mean((|U0(t)-Ya(t)|+|Ya(t)-L0(t)|)/W) ・・・(5)
B=Mean((|U0(t)-Ya(t)|+|Ya(t)-L0(t)|)/W) ・・・(5)
式(5)のMean()は一定の期間における平均値である。式(5)は、目的変数の実測データYaが上限値の推定値Uと下限値の推定値Lの間にあるとき、目的変数Yの正常範囲の上下限値の推定値が平均的にどれぐらいの幅を持っているかを示している。
また、評価値算出部3は、次式により推定値の幅Bを算出するようにしてもよい。
B=Max((|U0(t)-Ya(t)|+|Ya(t)-L0(t)|)/W)・・・(6)
また、評価値算出部3は、次式により推定値の幅Bを算出するようにしてもよい。
B=Max((|U0(t)-Ya(t)|+|Ya(t)-L0(t)|)/W)・・・(6)
式(5)のMean()の内側の(|U0(t)-Ya(t)|+|Ya(t)-L0(t)|)/Wは、次式により簡易的に算出するようにしてもよい。このことは式(6)においても同様である。
(U0(t)-L0(t))/W ・・・(7)
(U0(t)-L0(t))/W ・・・(7)
式(6)のMax()は一定の期間における最大値である。式(6)は、目的変数Yの正常範囲の上下限値の推定値の幅が最も大きくなっている部分を評価している。
こうして、評価値算出部3は、包含率I、追従度F、推定値の幅Bを算出する。
なお、上記の説明では、検証データを学習データと異なるものとして説明しているが、学習データを検証データとして用いてもよい。
こうして、評価値算出部3は、包含率I、追従度F、推定値の幅Bを算出する。
なお、上記の説明では、検証データを学習データと異なるものとして説明しているが、学習データを検証データとして用いてもよい。
次に、評価部4は、評価値算出部3によって算出された評価値に基づいて異常検知モデル2を評価する(図2ステップS102)。具体的には、評価部4は、包含率I、追従度F、推定値の幅Bのそれぞれを対応する閾値と比較することにより、異常検知モデル2を評価する。
本実施例では、評価部4は、包含率Iが閾値Ith以上の場合、良(○)と判定し、包含率Iが閾値Ith未満の場合、やや不良(△)と判定する。閾値Ithは例えば100%である。
また、評価部4は、追従度Fが閾値Fth1以上の場合、良(○)と判定し、追従度Fが閾値Fth1未満で閾値Fth2(Fth1>Fth2)以上の場合、やや不良(△)と判定し、追従度Fが閾値Fth2未満の場合、不良(×)と判定する。閾値Fth1は例えば0.8、閾値Fth2は例えば0.6である。
また、評価部4は、推定値の幅Bが閾値Bth1未満の場合、良(○)と判定し、推定値の幅Bが閾値Bth1以上で閾値Bth2(Bth1<Bth2)未満の場合、やや不良(△)と判定し、推定値の幅Bが閾値Bth2以上の場合、不良(×)と判定する。閾値Bth1は例えば0.05、閾値Bth2は例えば0.2である。
そして、評価部4は、評価値と閾値の比較結果が所定の評価基準を満たしている場合、異常検知モデル2を良(改善の必要無し)と判定し、評価値と閾値の比較結果が所定の評価基準を満たしていない場合、異常検知モデル2を不良(改善の必要有り)と判定し、評価結果を出力する(図2ステップS103)。
例えば評価値と閾値の比較結果が全て良という条件を評価基準としてもよいし、追従度Fと閾値Fth1,Fth2の比較結果が良で、かつ推定値の幅Bと閾値Bth1,Bth2の比較結果が良という条件を評価基準としてもよい。また、包含率Iと追従度Fと推定値の幅Bのうちいずれか1つと対応する閾値との比較結果が良という条件を評価基準としてもよい。どのような評価基準とするかは異常検知対象に応じて適宜設定すればよい。
評価結果(良/不良)の出力方法としては、評価結果の表示、評価結果を示す信号の出力などがある。
評価結果(良/不良)の出力方法としては、評価結果の表示、評価結果を示す信号の出力などがある。
モデルパラメータ修正部5は、異常検知モデル2の評価結果が不良(改善の必要有り)の場合(図2ステップS104においてNO)、異常検知モデルパラメータを修正(図2ステップS105)する。そして、モデル作成部1は、異常検知モデルの作成(図2ステップS100)をやり直す。異常検知モデルパラメータの修正方法としては、例えばベイズ最適化アルゴリズムなどを適用する方法がある。
こうして、異常検知モデル2の評価結果が良となるまで(図2ステップS104においてYES)、ステップS100~S105の処理が繰り返し実施される。
異常検知モデル2を利用してプラントの異常を検知する異常検知システム(不図示)は、従来と同様に計測器によって計測された目的変数Yの値が、異常検知モデル2から出力された上下限値の推定値によって規定される正常範囲内か否かで検知対象が正常か否かを判定すればよい。
以上のように、本実施例では、異常検知モデル2の良し悪しの基準が定量化されるので、属人性を排除することができる。また、本実施例では、評価値に閾値を設けて判定を行うことで、異常検知モデル2の修正を打ち切る基準を決めることができる。
また、本実施例では、異常検知モデル2の良し悪しの基準が定量化されるので、異常検知モデル2を自動的に修正することができる。ただし、本発明においてモデルの自動修正は必須の構成要件ではなく、オペレータが手動でモデルを修正するようにしてもよい。
[第2の実施例]
次に、本発明の第2の実施例について説明する。図6は本発明の第2の実施例に係る異常検知モデルの評価システムの構成を示すブロック図である。本実施例は、モデル選択型の例を示す例である。本実施例の評価システムは、条件の異なる複数の異常検知モデル2aを作成するモデル作成部1aと、評価値算出部3aと、評価部4aと、評価結果に基づいて最良の異常検知モデル2aを選択するモデル選択部6とを備えている。
次に、本発明の第2の実施例について説明する。図6は本発明の第2の実施例に係る異常検知モデルの評価システムの構成を示すブロック図である。本実施例は、モデル選択型の例を示す例である。本実施例の評価システムは、条件の異なる複数の異常検知モデル2aを作成するモデル作成部1aと、評価値算出部3aと、評価部4aと、評価結果に基づいて最良の異常検知モデル2aを選択するモデル選択部6とを備えている。
図7は本実施例の評価システムの動作を説明するフローチャートである。モデル作成部1aは、学習用の説明変数Xを含む多数の学習データを用いて、公知のモデリング技術により異常検知モデル2aを作成する(図7ステップS200)。このとき、モデル作成部1aは、説明変数Xの種類が異なる学習データを用いたり、説明変数Xの選択範囲が異なる学習データを用いたり、異常検知モデルパラメータを変えたりすることで、条件の異なる異常検知モデル2aを複数作成する。
評価値算出部3aは、検証用の説明変数Xを含む検証データを用いて評価値を異常検知モデル2a毎に算出する(図7ステップS201)。評価値の算出方法は第1の実施例と同じである。ただし、本実施例では、条件(説明変数Xの種類や説明変数Xの範囲)の異なる異常検知モデル2a毎に評価値を算出するので、異常検知モデル2aが要求するような検証データを用いる必要があることは言うまでもない。
次に、評価部4aは、評価値算出部3aによって算出された評価値に基づいて各異常検知モデル2aを評価する(図7ステップS202)。具体的には、評価部4aは、評価値を統合した総合評価値(例えば包含率Iと追従度Fと推定値の幅Bの加重和)を異常検知モデル2a毎に算出し、総合評価値を大小比較することにより、各異常検知モデル2aを評価する。
包含率Iの予め定められた重みをw1、追従度Fの予め定められた重みをw2、推定値の幅Bの予め定められた重みをw3とすると、評価部4aは、次式により加重和Sを算出する。
S=I×w1+F×w2+B×w3 ・・・(8)
S=I×w1+F×w2+B×w3 ・・・(8)
そして、評価部4aは、加重和Sが最大の異常検知モデル2aを最良の異常検知モデル2aと判定し、評価結果を出力する(図7ステップS203)。なお、総合評価値として加重和Sを用い、加重和Sの大小比較をする場合、重みw1,w2を正の値、重みw3を負の値として加重和Sを算出すればよい。
また、上記の例では、3つの評価値の加重和を総合評価値としているが、包含率Iと追従度Fと推定値の幅Bのうち2つの評価値の加重和を総合評価値としてもよい。また、評価部4aは、1つの評価値に基づいて異常検知モデル2aのそれぞれを評価してもよい。包含率Iを用いる場合には、包含率Iが最大の異常検知モデル2aを最良の異常検知モデル2aと判定すればよい。同様に、追従度Fを用いる場合には、追従度Fが最大の異常検知モデル2aを最良の異常検知モデル2aと判定すればよい。推定値の幅Bを用いる場合には、推定値の幅Bが最小の異常検知モデル2aを最良の異常検知モデル2aと判定すればよい。
モデル選択部6は、評価結果が最良の異常検知モデル2aを、異常検知システムで用いる異常検知モデルとして設定する(図7ステップS204)。
こうして、本実施例では、第1の実施例と同様の効果を得ることができる。本実施例では、異常検知モデル2aの良し悪しの基準が定量化されるので、異常検知システムで用いる最良の異常検知モデル2aを自動的に選択することができる。ただし、本発明においてモデルの自動選択は必須の構成要件ではなく、オペレータが手動でモデルを選択するようにしてもよい。
なお、第1の実施例では、3つの評価値のうち少なくとも1つの評価値と対応する閾値との比較結果に基づいて異常検知モデル2を評価しているが、第1の実施例の評価部4は、本実施例のように3つの評価値のうち複数の評価値を統合した総合評価値を算出し、この総合評価値と対応する閾値との比較結果に基づいて、異常検知モデル2を評価するようにしてもよい。例えば3つの評価値の加重和を総合評価値とした場合、評価部4は、総合評価値が閾値Sth1以上の場合、良(○)と判定し、総合評価値が閾値Sth1未満で閾値Sth2(Sth1>Sth2)以上の場合、やや不良(△)と判定し、総合評価値が閾値Sth2未満の場合、不良(×)と判定すればよい。
第1、第2の実施例で説明した評価システムは、CPU(Central Processing Unit)、記憶装置及びインタフェースを備えたコンピュータと、これらのハードウェア資源を制御するプログラムによって実現することができる。このコンピュータの構成例を図8に示す。
コンピュータは、CPU200と、記憶装置201と、インタフェース装置(I/F)202とを備えている。I/F202には、異常検知システム等が接続される。このようなコンピュータにおいて、本発明の評価方法を実現させるためのプログラムは記憶装置201に格納される。CPU200は、記憶装置201に格納されたプログラムに従って第1、第2の実施例で説明した処理を実行する。
本発明は、プラントの異常を検知するためのモデルを作成する技術に適用することができる。
1,1a…モデル作成部、2,2a…異常検知モデル、3,3a…評価値算出部、4,4a…評価部、5…モデルパラメータ修正部、6…モデル選択部。
Claims (12)
- 時系列データである説明変数データと目的変数データの正常範囲との関係をモデル化した異常検知モデルを作成するように構成されたモデル作成部と、
検証用の説明変数を前記異常検知モデルに入力したときに前記異常検知モデルから出力された目的変数の正常範囲の推定結果と、前記検証用の説明変数に対応する目的変数の実測データとに基づいて、推定結果と実測データの時系列データの各時刻における差異を集約することで、前記異常検知モデルの評価値を算出するように構成された評価値算出部と、
前記評価値に基づいて前記異常検知モデルを評価するように構成された評価部とを備えることを特徴とする異常検知モデルの評価システム。 - 請求項1記載の異常検知モデルの評価システムにおいて、
前記評価部は、前記評価値を予め定められた閾値と比較することにより、前記異常検知モデルを評価することを特徴とする異常検知モデルの評価システム。 - 請求項2記載の異常検知モデルの評価システムにおいて、
前記評価値算出部は、前記異常検知モデルから出力された目的変数の上限値の推定値と下限値の推定値とによって規定される正常範囲に前記目的変数の実測データが含まれる割合を示す包含率と、前記目的変数の実測データと前記正常範囲の動きの類似度を示す追従度と、前記上限値の推定値と前記下限値の推定値との幅の3つを、前記評価値として算出し、
前記評価部は、前記3つの評価値のうち複数の評価値を統合した総合評価値または1つの評価値に基づいて、前記異常検知モデルを評価することを特徴とする異常検知モデルの評価システム。 - 請求項1記載の異常検知モデルの評価システムにおいて、
前記モデル作成部は、異なる異常検知モデルを複数作成し、
前記評価値算出部は、前記評価値を前記異常検知モデル毎に算出し、
前記評価部は、前記異常検知モデル毎の評価値を比較することにより、前記異常検知モデルのそれぞれを評価することを特徴とする異常検知モデルの評価システム。 - 請求項4記載の異常検知モデルの評価システムにおいて、
前記評価値算出部は、前記異常検知モデルから出力された目的変数の上限値の推定値と下限値の推定値とによって規定される正常範囲に前記目的変数の実測データが含まれる割合を示す包含率と、前記目的変数の実測データと前記正常範囲の動きの類似度を示す追従度と、前記上限値の推定値と前記下限値の推定値との幅の3つを、前記評価値として算出し、
前記評価部は、前記3つの評価値のうち複数の評価値を統合した総合評価値または1つの評価値に基づいて、前記異常検知モデルのそれぞれを評価することを特徴とする異常検知モデルの評価システム。 - 請求項1乃至5のいずれか1項に記載の異常検知モデルの評価システムにおいて、
前記異常検知モデルは、ニューラルネットワークであることを特徴とする異常検知モデルの評価システム。 - 時系列データである説明変数データと目的変数データの正常範囲との関係をモデル化した異常検知モデルを作成する第1のステップと、
検証用の説明変数を前記異常検知モデルに入力したときに前記異常検知モデルから出力された目的変数の正常範囲の推定結果と、前記検証用の説明変数に対応する目的変数の実測データとに基づいて、推定結果と実測データの時系列データの各時刻における差異を集約することで、前記異常検知モデルの評価値を算出する第2のステップと、
前記評価値に基づいて前記異常検知モデルを評価する第3のステップとを含むことを特徴とする異常検知モデルの評価方法。 - 請求項7記載の異常検知モデルの評価方法において、
前記第3のステップは、前記評価値を予め定められた閾値と比較することにより、前記異常検知モデルを評価するステップを含むことを特徴とする異常検知モデルの評価方法。 - 請求項8記載の異常検知モデルの評価方法において、
前記第2のステップは、前記異常検知モデルから出力された目的変数の上限値の推定値と下限値の推定値とによって規定される正常範囲に前記目的変数の実測データが含まれる割合を示す包含率と、前記目的変数の実測データと前記正常範囲の動きの類似度を示す追従度と、前記上限値の推定値と前記下限値の推定値との幅の3つを、前記評価値として算出するステップを含み、
前記第3のステップは、前記3つの評価値のうち複数の評価値を統合した総合評価値または1つの評価値に基づいて、前記異常検知モデルを評価するステップを含むことを特徴とする異常検知モデルの評価方法。 - 請求項7記載の異常検知モデルの評価方法において、
前記第1のステップは、異なる異常検知モデルを複数作成するステップを含み、
前記第2のステップは、前記評価値を前記異常検知モデル毎に算出するステップを含み、
前記第3のステップは、前記異常検知モデル毎の評価値を比較することにより、前記異常検知モデルのそれぞれを評価するステップを含むことを特徴とする異常検知モデルの評価方法。 - 請求項10記載の異常検知モデルの評価方法において、
前記第2のステップは、前記異常検知モデルから出力された目的変数の上限値の推定値と下限値の推定値とによって規定される正常範囲に前記目的変数の実測データが含まれる割合を示す包含率と、前記目的変数の実測データと前記正常範囲の動きの類似度を示す追従度と、前記上限値の推定値と前記下限値の推定値との幅の3つを、前記評価値として算出するステップを含み、
前記第3のステップは、前記3つの評価値のうち複数の評価値を統合した総合評価値または1つの評価値に基づいて、前記異常検知モデルのそれぞれを評価するステップを含むことを特徴とする異常検知モデルの評価方法。 - 請求項7乃至11のいずれか1項に記載の異常検知モデルの評価方法において、
前記異常検知モデルは、ニューラルネットワークであることを特徴とする異常検知モデルの評価方法。
Priority Applications (1)
| Application Number | Priority Date | Filing Date | Title |
|---|---|---|---|
| CN202180058780.3A CN116134393A (zh) | 2020-09-30 | 2021-08-19 | 异常检测模型的评估系统及评估方法 |
Applications Claiming Priority (2)
| Application Number | Priority Date | Filing Date | Title |
|---|---|---|---|
| JP2020164664A JP7662318B2 (ja) | 2020-09-30 | 2020-09-30 | 異常検知モデルの評価システムおよび評価方法 |
| JP2020-164664 | 2020-09-30 |
Publications (1)
| Publication Number | Publication Date |
|---|---|
| WO2022070656A1 true WO2022070656A1 (ja) | 2022-04-07 |
Family
ID=80949914
Family Applications (1)
| Application Number | Title | Priority Date | Filing Date |
|---|---|---|---|
| PCT/JP2021/030333 Ceased WO2022070656A1 (ja) | 2020-09-30 | 2021-08-19 | 異常検知モデルの評価システムおよび評価方法 |
Country Status (3)
| Country | Link |
|---|---|
| JP (1) | JP7662318B2 (ja) |
| CN (1) | CN116134393A (ja) |
| WO (1) | WO2022070656A1 (ja) |
Cited By (2)
| Publication number | Priority date | Publication date | Assignee | Title |
|---|---|---|---|---|
| CN116340851A (zh) * | 2023-05-30 | 2023-06-27 | 西安高商智能科技有限责任公司 | 一种推进电机的生产质量检测系统 |
| CN116738170A (zh) * | 2023-06-13 | 2023-09-12 | 无锡物联网创新中心有限公司 | 一种工业设备的异常分析方法及相关装置 |
Families Citing this family (1)
| Publication number | Priority date | Publication date | Assignee | Title |
|---|---|---|---|---|
| KR20250092447A (ko) * | 2023-12-15 | 2025-06-24 | 포스코홀딩스 주식회사 | 인공지능 모델의 성능을 모니터링하는 방법 및 그 장치 |
Citations (3)
| Publication number | Priority date | Publication date | Assignee | Title |
|---|---|---|---|---|
| JP2016004298A (ja) * | 2014-06-13 | 2016-01-12 | 日本電気株式会社 | ポンプ異常検知システム、ポンプ異常検知方法、及びポンプ異常検知プログラム |
| JP2016071456A (ja) * | 2014-09-26 | 2016-05-09 | アズビル株式会社 | 計装機器監視システム |
| JP2019133212A (ja) * | 2018-01-29 | 2019-08-08 | 株式会社日立製作所 | 異常検知システム、異常検知方法、および、プログラム |
Family Cites Families (4)
| Publication number | Priority date | Publication date | Assignee | Title |
|---|---|---|---|---|
| JP4922265B2 (ja) * | 2008-08-19 | 2012-04-25 | 株式会社東芝 | プラント監視装置およびプラント監視方法 |
| JP6239486B2 (ja) * | 2014-11-05 | 2017-11-29 | 株式会社東芝 | 予測モデル作成方法 |
| CN106872657B (zh) * | 2017-01-05 | 2018-12-14 | 河海大学 | 一种多变量水质参数时序数据异常事件检测方法 |
| JP6815954B2 (ja) | 2017-08-29 | 2021-01-20 | 株式会社神戸製鋼所 | プラントの操業状態推定装置及び操業状態推定方法 |
-
2020
- 2020-09-30 JP JP2020164664A patent/JP7662318B2/ja active Active
-
2021
- 2021-08-19 WO PCT/JP2021/030333 patent/WO2022070656A1/ja not_active Ceased
- 2021-08-19 CN CN202180058780.3A patent/CN116134393A/zh active Pending
Patent Citations (3)
| Publication number | Priority date | Publication date | Assignee | Title |
|---|---|---|---|---|
| JP2016004298A (ja) * | 2014-06-13 | 2016-01-12 | 日本電気株式会社 | ポンプ異常検知システム、ポンプ異常検知方法、及びポンプ異常検知プログラム |
| JP2016071456A (ja) * | 2014-09-26 | 2016-05-09 | アズビル株式会社 | 計装機器監視システム |
| JP2019133212A (ja) * | 2018-01-29 | 2019-08-08 | 株式会社日立製作所 | 異常検知システム、異常検知方法、および、プログラム |
Cited By (3)
| Publication number | Priority date | Publication date | Assignee | Title |
|---|---|---|---|---|
| CN116340851A (zh) * | 2023-05-30 | 2023-06-27 | 西安高商智能科技有限责任公司 | 一种推进电机的生产质量检测系统 |
| CN116340851B (zh) * | 2023-05-30 | 2023-07-28 | 西安高商智能科技有限责任公司 | 一种推进电机的生产质量检测系统 |
| CN116738170A (zh) * | 2023-06-13 | 2023-09-12 | 无锡物联网创新中心有限公司 | 一种工业设备的异常分析方法及相关装置 |
Also Published As
| Publication number | Publication date |
|---|---|
| JP7662318B2 (ja) | 2025-04-15 |
| JP2022056746A (ja) | 2022-04-11 |
| CN116134393A (zh) | 2023-05-16 |
Similar Documents
| Publication | Publication Date | Title |
|---|---|---|
| EP3250965B1 (en) | Methods and systems for detecting, classifying and/or mitigating sensor error | |
| WO2022070656A1 (ja) | 異常検知モデルの評価システムおよび評価方法 | |
| US7822697B2 (en) | Method and apparatus for infrastructure health monitoring and analysis wherein anomalies are detected by comparing measured outputs to estimated/modeled outputs by using a delay | |
| US20090276136A1 (en) | Method for calculating confidence on prediction in fault diagnosis systems | |
| US20140012791A1 (en) | Systems and methods for sensor error detection and compensation | |
| CN117330963B (zh) | 储能电站故障检测方法、系统及设备 | |
| CN109716090B (zh) | 一种用于估计配水管网的子网边界处的水流量的改进系统 | |
| WO2020166236A1 (ja) | 作業効率評価方法、作業効率評価装置、及びプログラム | |
| CN112128950B (zh) | 一种基于多种模型对比的机房温湿度预测方法及系统 | |
| US7949497B2 (en) | Machine condition monitoring using discontinuity detection | |
| US20250322037A1 (en) | Monitoring a Multi-Axis Machine Using Interpretable Time Series Classification | |
| CN116229683B (zh) | 一种地质灾害预测预警方法 | |
| CN110458713B (zh) | 模型监控方法、装置、计算机设备及存储介质 | |
| CN119851973A (zh) | 基于神经网络的病毒传播预测方法 | |
| JP6932467B2 (ja) | 状態変動検出装置、状態変動検出システム及び状態変動検出用プログラム | |
| JP7455667B2 (ja) | センサドリフト診断装置、センサドリフト診断方法およびセンサドリフト診断プログラム | |
| JP6859381B2 (ja) | 状態変動検出装置及び状態変動検出用プログラム | |
| JP2019159365A (ja) | 状態変動検出装置及び状態変動検出用プログラム | |
| CN118999705B (zh) | 一种数据分析处理方法、系统及存储介质 | |
| US20210232132A1 (en) | Online fault localization in industrial processes without utilizing a dynamic system model | |
| Guedaouria et al. | PFEKF Filter‐Based Fault Detection and Isolation in Non‐Linear Systems | |
| Belhaj Salem et al. | Prognostic and Classification of Dynamic Degradation in a Mechanical System Using Variance Gamma Process. Mathematics 2021, 9, 254 | |
| KR20250002984A (ko) | 열화 수준 예측 방법 및 열화 수준 예측 시스템 | |
| Brokarev et al. | Analysis of reliability of gas analysis system based on vector Wiener process | |
| CN121660407A (zh) | 用于核能工程epc项目的尚需工期动态估算方法和系统 |
Legal Events
| Date | Code | Title | Description |
|---|---|---|---|
| 121 | Ep: the epo has been informed by wipo that ep was designated in this application |
Ref document number: 21874959 Country of ref document: EP Kind code of ref document: A1 |
|
| NENP | Non-entry into the national phase |
Ref country code: DE |
|
| 122 | Ep: pct application non-entry in european phase |
Ref document number: 21874959 Country of ref document: EP Kind code of ref document: A1 |