WO2022059785A1 - Method for predicting response to immune checkpoint inhibitor - Google Patents
Method for predicting response to immune checkpoint inhibitor Download PDFInfo
- Publication number
- WO2022059785A1 WO2022059785A1 PCT/JP2021/034399 JP2021034399W WO2022059785A1 WO 2022059785 A1 WO2022059785 A1 WO 2022059785A1 JP 2021034399 W JP2021034399 W JP 2021034399W WO 2022059785 A1 WO2022059785 A1 WO 2022059785A1
- Authority
- WO
- WIPO (PCT)
- Prior art keywords
- subject
- group
- immune checkpoint
- predetermined threshold
- abundance
- Prior art date
Links
Images


Classifications
-
- A—HUMAN NECESSITIES
- A61—MEDICAL OR VETERINARY SCIENCE; HYGIENE
- A61K—PREPARATIONS FOR MEDICAL, DENTAL OR TOILETRY PURPOSES
- A61K39/00—Medicinal preparations containing antigens or antibodies
- A61K39/395—Antibodies; Immunoglobulins; Immune serum, e.g. antilymphocytic serum
-
- A—HUMAN NECESSITIES
- A61—MEDICAL OR VETERINARY SCIENCE; HYGIENE
- A61P—SPECIFIC THERAPEUTIC ACTIVITY OF CHEMICAL COMPOUNDS OR MEDICINAL PREPARATIONS
- A61P35/00—Antineoplastic agents
-
- A—HUMAN NECESSITIES
- A61—MEDICAL OR VETERINARY SCIENCE; HYGIENE
- A61P—SPECIFIC THERAPEUTIC ACTIVITY OF CHEMICAL COMPOUNDS OR MEDICINAL PREPARATIONS
- A61P37/00—Drugs for immunological or allergic disorders
- A61P37/02—Immunomodulators
-
- C—CHEMISTRY; METALLURGY
- C07—ORGANIC CHEMISTRY
- C07K—PEPTIDES
- C07K14/00—Peptides having more than 20 amino acids; Gastrins; Somatostatins; Melanotropins; Derivatives thereof
- C07K14/435—Peptides having more than 20 amino acids; Gastrins; Somatostatins; Melanotropins; Derivatives thereof from animals; from humans
-
- C—CHEMISTRY; METALLURGY
- C12—BIOCHEMISTRY; BEER; SPIRITS; WINE; VINEGAR; MICROBIOLOGY; ENZYMOLOGY; MUTATION OR GENETIC ENGINEERING
- C12N—MICROORGANISMS OR ENZYMES; COMPOSITIONS THEREOF; PROPAGATING, PRESERVING, OR MAINTAINING MICROORGANISMS; MUTATION OR GENETIC ENGINEERING; CULTURE MEDIA
- C12N15/00—Mutation or genetic engineering; DNA or RNA concerning genetic engineering, vectors, e.g. plasmids, or their isolation, preparation or purification; Use of hosts therefor
- C12N15/09—Recombinant DNA-technology
- C12N15/10—Processes for the isolation, preparation or purification of DNA or RNA
-
- C—CHEMISTRY; METALLURGY
- C12—BIOCHEMISTRY; BEER; SPIRITS; WINE; VINEGAR; MICROBIOLOGY; ENZYMOLOGY; MUTATION OR GENETIC ENGINEERING
- C12Q—MEASURING OR TESTING PROCESSES INVOLVING ENZYMES, NUCLEIC ACIDS OR MICROORGANISMS; COMPOSITIONS OR TEST PAPERS THEREFOR; PROCESSES OF PREPARING SUCH COMPOSITIONS; CONDITION-RESPONSIVE CONTROL IN MICROBIOLOGICAL OR ENZYMOLOGICAL PROCESSES
- C12Q1/00—Measuring or testing processes involving enzymes, nucleic acids or microorganisms; Compositions therefor; Processes of preparing such compositions
- C12Q1/02—Measuring or testing processes involving enzymes, nucleic acids or microorganisms; Compositions therefor; Processes of preparing such compositions involving viable microorganisms
- C12Q1/04—Determining presence or kind of microorganism; Use of selective media for testing antibiotics or bacteriocides; Compositions containing a chemical indicator therefor
- C12Q1/06—Quantitative determination
-
- C—CHEMISTRY; METALLURGY
- C12—BIOCHEMISTRY; BEER; SPIRITS; WINE; VINEGAR; MICROBIOLOGY; ENZYMOLOGY; MUTATION OR GENETIC ENGINEERING
- C12Q—MEASURING OR TESTING PROCESSES INVOLVING ENZYMES, NUCLEIC ACIDS OR MICROORGANISMS; COMPOSITIONS OR TEST PAPERS THEREFOR; PROCESSES OF PREPARING SUCH COMPOSITIONS; CONDITION-RESPONSIVE CONTROL IN MICROBIOLOGICAL OR ENZYMOLOGICAL PROCESSES
- C12Q1/00—Measuring or testing processes involving enzymes, nucleic acids or microorganisms; Compositions therefor; Processes of preparing such compositions
- C12Q1/68—Measuring or testing processes involving enzymes, nucleic acids or microorganisms; Compositions therefor; Processes of preparing such compositions involving nucleic acids
-
- G—PHYSICS
- G01—MEASURING; TESTING
- G01N—INVESTIGATING OR ANALYSING MATERIALS BY DETERMINING THEIR CHEMICAL OR PHYSICAL PROPERTIES
- G01N33/00—Investigating or analysing materials by specific methods not covered by groups G01N1/00 - G01N31/00
- G01N33/48—Biological material, e.g. blood, urine; Haemocytometers
- G01N33/50—Chemical analysis of biological material, e.g. blood, urine; Testing involving biospecific ligand binding methods; Immunological testing
Definitions
- the present disclosure relates to a method of predicting a response to an immune checkpoint inhibitor.
- Immune checkpoint inhibitors are a new therapeutic method that cancels the immunosuppressive mechanism and activates the immune response to cancer.
- anti-CTLA-4 cytotoxic T lymphocyte-associated antibody-
- the antibody ipilimumab and the anti-PD-1 (programmed cell death-1) antibody nivolumab and pembrolizumab have been approved both inside and outside Japan and are used in cancer treatment.
- Immune checkpoint inhibitors revolutionized cancer treatment and gave the gospel to cancer patients who were previously difficult to cure.
- immune checkpoint inhibitors do not exert a uniform effect on all cancer patients, and from the data on progression-free survival, anti-PD-1 antibody, which is one of the immune checkpoint inhibitors, is used.
- anti-PD-1 antibody which is one of the immune checkpoint inhibitors.
- the anti-PD-1 antibody was effective for 1 year or more, almost no exacerbation of the disease was observed after that, and a state close to cure was obtained. This suggests that there are three different subgroups of clinical efficacy, such as "ineffective group”, “significantly effective group”, and "intermediate group”.
- Patent Documents 1 to 5 a method for predicting a response to an immune checkpoint inhibitor has been sought, and a method using intestinal bacteria as a biomarker has been proposed.
- An object of the present invention is to predict the response to an immune checkpoint inhibitor in a subject suffering from cancer.
- the present inventors have surprisingly found that the abundance of a specific bacterial species or a specific genomic pathway that has not been known so far in the fecal or intestinal contents in a subject. Score, the abundance of a particular metabolite in blood, serum or plasma in a subject, the expression of a particular gene in blood, serum or plasma in a subject, or the presence or absence of a particular single nucleotide polymorphism (SNP) in a subject. By doing so, it was found that the response to the immune checkpoint inhibitor in the subject can be predicted, and the present invention has been completed.
- SNP single nucleotide polymorphism
- the present invention may include the following aspects.
- [1] A method for predicting the response to an immune checkpoint inhibitor in a subject suffering from cancer.
- (I) Abundance of microorganisms in the feces or intestinal contents of the subject;
- (Iii) Abundance of metabolites in the blood, serum or plasma of the subject;
- (Iv) Gene expression levels in the subject's blood, serum or plasma; and
- SNPs Single nucleotide polymorphisms
- the microorganism is one or more selected from the group consisting of the genus Geobacillus, the genus Gordonibacter, the genus Odoribacter, the genus Veillonella, the genus Corynebacterium, the genus Polychromonas, and the genus Arthrobacter.
- the genomic pathways include bacterial invasion of epithelial cells, fatty acid metabolism, flagellar metabolism, fatty acid biosynthesis (Fatty acid metabolism), fatty acid biosynthesis (Fatty acid metabolism), and fatty acid biosynthesis (Fatty acid metabolism).
- pathway peptide glycan biosynthesis (Peptidoglycan biosynthesis), nucleotide metabolism (Nucleotide metabolism), purine metabolism (Purine metabolism), phenylalanine metabolism (Phenylalanine metabolism)
- the metabolite is one or more selected metabolites from the group consisting of lactic acid, pyruvic acid, glucose, 2-oxobutyric acid, glyceric acid, octanoic acid, citrulin, 2-hydroxybutyric acid and pipecholinic acid.
- the gene is one or more selected from the group consisting of MAPK pathway, Type I IFN receptor complex pathway, TCR signal pathway-related gene, and BCL11B, ERCC3, ERCC6, FCRL1, FCRL3, MS4A1 and TCF7.
- the SNP is one or a plurality of SNPs selected from the group consisting of the following rs numbers: rs2228145.1; rs71900199; and rs7185320.
- step (1) is (ii) a step of determining a genomic pathway score in the fecal or intestinal content of the subject.
- step (1) is (iii) a step of determining the abundance of metabolites in the blood, serum or plasma of the subject.
- step (1) is (iii) a step of determining the abundance of metabolites in the blood, serum or plasma of the subject.
- the abundance of the lactic acid, the pyruvic acid, the glucose, the glyceric acid, the octanic acid, the 2-hydroxybutyric acid and / or the 2-oxobutyric acid is higher than a predetermined threshold value, and / or.
- step (1) is (iv) a step of determining the expression level of the gene in the blood, serum or plasma of the subject.
- step (1) is (iv) a step of determining the expression level of the gene in the blood, serum or plasma of the subject.
- the expression level of one or more genes selected from the group consisting of BCL11B, ERCC3, ERCC6, FCRL1, FCRL3, MS4A1 and TCF7 is higher than a predetermined threshold, immunity in the subject.
- the expression level of the gene related to the pathway selected one or more from the group consisting of the MAPK pathway, the Type I IFN receptor complex pathway, and the gene related to the TCR signal pathway is lower than a predetermined threshold value.
- the method of item 1 or 20 wherein the response to the checkpoint inhibitor is predicted to be poor.
- the item (1) is a step of (v) determining the presence or absence of a single nucleotide polymorphism (SNP) of one or a plurality of genes selected from the group consisting of the IL6R and the NLRC5 in the subject. The method according to 1.
- SNP single nucleotide polymorphism
- the immune checkpoint inhibitors are CTLA-4, PD-1, PD-L1, PD-L2, LAG-3, TIM3, BTLA, B7H3, B7H4, 2B4, CD160, A2aR, KIR, VISTA, IDO1. , Arginase I, TIGIT, and the method of any one of items 1-26, which is an inhibitor of an immune checkpoint molecule selected from the group consisting of CD115.
- the immune checkpoint inhibitor is an anti-PD-1 antibody.
- [29] It is characterized in that it is administered to a subject (cancer patient) suffering from cancer whose response to an immune checkpoint inhibitor is determined (predicted) to be good by the method according to any one of items 1 to 28.
- a cancer therapeutic agent containing an immune checkpoint inhibitor [30] (i) suffering from cancer in which the abundance of microorganisms of the genus Geobacillus, Gordonibacter, and / or Veillonella is higher than a predetermined threshold, and / or the abundance of microorganisms of the genus Odoribacter is lower than a predetermined threshold.
- the cancer is characterized by administration to a subject (preferably, the abundance of Veillonella microorganisms is higher than a predetermined threshold, and / or the abundance of Geobacter microorganisms is lower than a predetermined threshold. It is characterized by administration to affected subjects); (Ii) Bacterial invasion of epithelial cells, fatty acid degradation, Grandellar assembly, PPAR signal pathway (PPAR signaling gene) Scores below a predetermined threshold and / or scores for fatty acid biosynthesis, Nucleotide metabolism and / or peptide glycan biosynthesis are higher than a predetermined threshold.
- a subject suffering from cancer preferably, administration to a subject suffering from cancer having a score of bacterial invasion of epithelial cells in epithelial cells lower than a predetermined threshold. do
- administration to a subject suffering from cancer preferably, administration to a subject suffering from cancer having a score of bacterial invasion of epithelial cells in epithelial cells lower than a predetermined threshold. do
- the abundance of lactic acid, pyruvate, glucose, glyceric acid, octanoic acid, 2-hydroxybutyric acid and / or 2-oxobutyric acid is below a predetermined threshold, and / or the abundance of pipecholinic acid and / or citrulin.
- the expression level of a gene associated with a plurality of selected pathways is higher than a predetermined threshold, and / or a gene one or more selected from the group consisting of BCL11B, ERCC3, ERCC6, FCRL1, FCRL3, MS4A1 and TCF7. It is characterized in that it is administered to a subject suffering from cancer whose expression level is higher than a predetermined threshold.
- a cancer therapeutic agent containing an immune checkpoint inhibitor. Administered to subjects suffering from cancer in which the abundance of microorganisms of the genus Geobacillus, Gordonibacter, and / or Veillonella is higher than a predetermined threshold and / or the abundance of microorganisms of the genus Odoribacter is lower than a predetermined threshold.
- the abundance of microorganisms of the genus Geobacillus is higher than a predetermined threshold, and / or the abundance of microorganisms of the genus Geobacter is lower than a predetermined threshold.
- Bacterial invasion of epithelial cells, Fatty acid degradation, Flagellar assembly, PPAR signal pathway or PPAR signaline metabolism (PPAR sine) ) Is lower than a predetermined threshold, and / or a fatty acid biosynthesis, a Nucleotide metabolism and / or a peptide glycan biosynthesis score is a predetermined threshold.
- a cancer therapeutic agent containing an immune checkpoint inhibitor [33] The abundance of lactic acid, pyruvate, glucose, glyceric acid, octanoic acid, 2-hydroxybutyric acid and / or 2-oxobutyric acid is below a predetermined threshold, and / or the abundance of pipecolic acid and / or citrulin.
- a cancer therapeutic agent comprising an immune checkpoint inhibitor which is administered to a subject suffering from cancer having a glucose higher than a predetermined threshold.
- a method of treating a subject suffering from cancer (1) below: (I) Abundance of microorganisms in the feces or intestinal contents of the subject; (Ii) Genomic pathway score in the fecal or intestinal contents of the subject; (Iii) Abundance of metabolites in the blood, serum or plasma of the subject; (Iv) Gene expression levels in the subject's blood, serum or plasma; and (v) Single nucleotide polymorphisms (SNPs) of one or more genes selected from the group consisting of IL6R and NLRC5 in the subject.
- SNPs Single nucleotide polymorphisms
- a step of determining the presence or absence of one or more selected values or SNPs from a group consisting of (2) A step of predicting a response to an immune checkpoint inhibitor in the subject using the value obtained in the step (1) or the presence or absence of an SNP as an index. (3) A step of administering the immune checkpoint inhibitor to the subject determined to have a good response to the immune checkpoint inhibitor and / or not to induce an adverse skin event.
- the microorganism is one or more selected from the group consisting of the genus Geobacillus, the genus Gordonibacter, the genus Odoribacter, the genus Veillonella, the genus Corynebacterium, the genus Polychromonas, and the genus Arthrobacter.
- the genomic pathways include bacterial invasion of epithelial cells, fatty acid metabolism, flagellar metabolism, fatty acid biosynthesis (Fatty acid metabolism), fatty acid biosynthesis (Fatty acid metabolism), and fatty acid biosynthesis (Fatty acid metabolism).
- pathway peptide glycan biosynthesis (Peptidoglycan biosynthesis), nucleotide metabolism (Nucleotide metabolism), purine metabolism (Purine metabolism), phenylalanine metabolism (Phenylalanine metabolism)
- the metabolite is one or more selected metabolites from the group consisting of lactic acid, pyruvic acid, glucose, 2-oxobutyric acid, glyceric acid, octanoic acid, citrulin, 2-hydroxybutyric acid and pipecholinic acid.
- the gene is one or more selected from the group consisting of MAPK pathway, Type I IFN receptor complex pathway, TCR signal pathway-related gene, and BCL11B, ERCC3, ERCC6, FCRL1, FCRL3, MS4A1 and TCF7.
- the SNP is one or a plurality of SNPs selected from the group consisting of the following rs numbers: rs2228145.1; rs71900199; and rs7185320. Method.
- a system for determining the responsiveness to an immune checkpoint inhibitor in a subject having cancer including a storage unit, an input unit, a data processing unit, and an output unit.
- the memory is (1-i) Abundance of microorganisms in feces or intestinal contents; (1-ii) Genomic pathway scores in fecal or intestinal contents; (1-iii) Abundance of metabolites in blood, serum or plasma; (1-iv) Gene expression levels in blood, serum or plasma; and (1-v) Single nucleotide polymorphisms (SNPs) of one or more selected genes from the group consisting of IL6R and NLRC5.
- SNPs Single nucleotide polymorphisms
- Memorize the cutoff value for determining responsiveness to one or more selected immune checkpoint inhibitors from the group consisting of The storage unit is from the input unit.
- SNP Single nucleotide polymorphism
- a value selected from one or more of the group consisting of SNPs or the presence or absence of SNP is input and stored in the storage unit.
- the data processing unit compares the stored value or the presence or absence of the SNP with the cutoff value to determine the responsiveness to the immune checkpoint inhibitor in the subject.
- the output unit outputs the determination result of responsiveness to the immune checkpoint inhibitor of cancer in the subject. It is a system characterized by that The microorganism is one or more selected from the group consisting of the genus Geobacillus, the genus Gordonibacter, the genus Odoribacter, the genus Veillonella, the genus Corynebacterium, the genus Polychromonas, and the genus Arthrobacter.
- the genomic pathways include bacterial invasion of epithelial cells, fatty acid metabolism, flagellar metabolism, fatty acid biosynthesis (Fatty acid metabolism), fatty acid biosynthesis (Fatty acid metabolism), and fatty acid biosynthesis (Fatty acid metabolism).
- pathway peptide glycan biosynthesis (Peptidoglycan biosynthesis), nucleotide metabolism (Nucleotide metabolism), purine metabolism (Purine metabolism), phenylalanine metabolism (Phenylalanine metabolism)
- the metabolite is one or more selected metabolites from the group consisting of lactic acid, pyruvic acid, glucose, 2-oxobutyric acid, glyceric acid, octanoic acid, citrulin, 2-hydroxybutyric acid and pipecholinic acid.
- the gene is one or more selected from the group consisting of MAPK pathway, Type I IFN receptor complex pathway, TCR signal pathway-related gene, and BCL11B, ERCC3, ERCC6, FCRL1, FCRL3, MS4A1 and TCF7.
- the SNP is one or a plurality of SNPs selected from the group consisting of the following rs numbers: rs2228145.1; rs71900199; and rs7185320. system. [36] Further including an analysis and measurement unit The analysis and measurement unit determines the abundance of microorganisms and / or the score of the genomic pathway in the fecal or intestinal contents of the subject. The analysis and measurement unit determines the abundance of metabolites in the blood, serum or plasma of the subject.
- the analysis and measurement unit determines the expression level of the gene in the blood, serum or plasma of the subject, and / or the analysis and measurement unit determines one or more genes selected from the group consisting of IL6R and NLRC5 in the subject. Determine the presence or absence of single nucleotide polymorphism (SNP), The abundance of the microorganism, the score of the genomic pathway, the abundance of the metabolite, the expression level of the gene, and / or the abundance of the microorganism determined by the analysis and measurement unit on behalf of or through the input unit.
- SNP single nucleotide polymorphism
- the present invention it becomes possible to predict the response to an immune checkpoint inhibitor in a subject suffering from cancer.
- the immune checkpoint inhibitor can be applied to a subject having a good response to the immune checkpoint inhibitor, and improvement in the therapeutic effect can be expected.
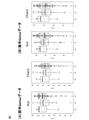
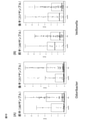
- FIG. 1 shows the relationship between bacterial species diversity in feces and the effect of anti-PD-1 antibody.
- A First half (Training cohort) Genus data
- B Second half (Validation cohort) Genus data.
- Ace and Chao1 represent a diversity index.
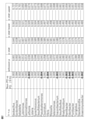
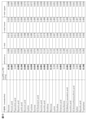
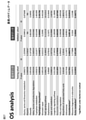
- FIG. 2 shows a list of bacterial species (genus) that showed significant differences as a result of metagenome analysis in feces of PD (progressive disease: tumor growth) group and non-PD (non-tumor growth) group.
- FIG. 3 shows a list of KEGG pathways that showed significant differences as a result of metagenomic analysis in feces of the PD group and the non-PD group.
- FIG. 1 shows the relationship between bacterial species diversity in feces and the effect of anti-PD-1 antibody.
- FIG. 4 shows the results of analysis in the latter half of the patient group (PD group and non-PD group) for the bacterial species in which a significant difference was observed in the fecal metagenome analysis of the first half of the patient group.
- FIG. 5 shows the results of analysis in the latter half of the patient group (PD group and non-PD group) for the bacterial species (Geobacillus genus, Gordonibacter genus) in which a significant difference was observed in the fecal metagenome analysis of the first half patient group. ..
- FIG. 6 shows the results of analysis of the KEGG pathway, which showed a significant difference in fecal metagenomic analysis of the first half patient group, in the second half patient group (PD group and non-PD group).
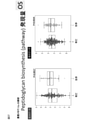
- FIG. 7 shows the results of analysis of the KEGG pathway (Fatty acid biosynthesis) in the fecal metagenome analysis of the first half of the patient group in the second half of the patient group (PD group and non-PD group).
- A Comparison of scores of fatty acid biosynthesis pathways.
- B Comparison of fatty acid decomposition pathway scores.
- C Schematic diagram of fatty acid biosynthesis pathway.
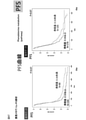
- FIG. 8 shows the results of analysis of the KEGG pathway (PPAR signaling pathway) in the fecal metagenome analysis of the first half of the patient group in the second half of the patient group (PD group and non-PD group).
- A Comparison of PPAR signaling pathway scores in the first half of the patient group.
- FIG. 9 shows the results of analysis by narrowing down to bacterial species (0.01% or more) that frequently appear in the metagenomic analysis in feces of the first half and the second half patient groups (PD group and non-PD group). ..
- A patient group in the first half
- B patient group in the second half
- FIG. 10 shows the scores of the genus Odoribacter (A) and the genus Veillonella (B) in the feces of the first half and the second half patient groups (PD group and non-PD group).
- FIG. 11 shows the profile of the entire bacterial species by fecal metagenomic analysis of the first half patient group.
- FIG. 12 shows the profile of the entire bacterial species by fecal metagenomic analysis of the latter half of the patient group.
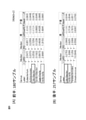
- FIG. 13 shows the results of plasma metabolome analysis of the patient group (PD group and non-PD group).
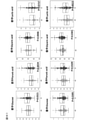
- FIG. 14-1 shows the results of plasma metabolome analysis of the first half and the second half patient groups (PD group and non-PD group).
- FIG. 14-2 shows the results of plasma metabolome analysis of the first half and the second half patient groups (PD group and non-PD group).
- FIG. 15 shows the results of association analysis of fecal metagenomics and plasma metabolome.
- FIG. 16 shows the results of whole blood gene expression analysis (RNA-Seq analysis) in the patient group (PD group and non-PD group).
- FIG. 17-1 shows the results of whole blood gene expression analysis (RNA-Seq analysis) in the patient group (PD group and non-PD group).
- 17-2 and 17-3 show the results (MAPK signing pathway) of whole blood gene expression analysis (RNA-Seq analysis) of the first half and the second half patient groups (ratio of PD group and non-PD group). This pathway is enhanced in the effective group (non-PD group).
- 17-4 and 17-5 show the results (TCR signing pathway) of whole blood gene expression analysis (RNA-Seq analysis) of the first half and the second half patient groups (ratio of PD group and non-PD group). This pathway is enhanced in the effective group (non-PD group).
- MAPK signing pathway RNA-Seq analysis of the first half and the second half patient groups
- FIG. 17-6 and 17-7 show the results (Type I IFN receptor Complex) of whole blood gene expression analysis (RNA-Seq analysis) of the first half and second half patient groups (ratio of PD group and non-PD group). show. This pathway is enhanced in the effective group (non-PD group).
- FIG. 18 shows the results of drug effect prediction of a patient group (PD group and non-PD group) using a combination of a plurality of markers (genus Odoribacter and genus Verionella) as an index.
- FIG. 19 shows the results of drug effect prediction of a patient group (PD group and non-PD group) using a combination of a plurality of markers (Genus Gordonibacter, Geobacillus, Odoribacter and Verionella) as an index.
- FIG. 18 shows the results of drug effect prediction of a patient group (PD group and non-PD group) using a combination of a plurality of markers (Genus Gordonibacter, Geobacillus, Odoribacter and Verionella) as an index.
- FIG. 20-1 shows the first half patient group (PD group and non-PD group) using a combination of multiple markers (pyruvic acid, pipecolic acid, glyceric acid) as an index.
- FIG. 20-2 shows the latter half of the patient group (PD group and non-PD group) using a combination of multiple markers (pyruvic acid, pipecolic acid, glyceric acid) as an index.
- FIG. 20-3 shows the first half of the patient group (PD group and non-PD group) using a combination of multiple markers (pyruvic acid, glyceric acid, lactic acid) as an index. The result of drug effect prediction is shown.
- FIG. 20-2 shows the latter half of the patient group (PD group and non-PD group) using a combination of multiple markers (pyruvic acid, pipecolic acid, glyceric acid) as an index.
- FIG. 20-3 shows the first half of the patient group (PD group and non-PD group
- FIG. 20-4 shows the latter half of the patient group (PD group and non-PD group) using a combination of multiple markers (pyruvic acid, glyceric acid, lactic acid) as an index.
- the result of drug effect prediction is shown.
- FIG. 21-1 shows the results of drug effect prediction of the first half patient group (PD group and non-PD group) using a combination of a plurality of markers (18 genes) as an index.
- FIG. 21-2 shows the results of drug effect prediction of the latter half patient group (PD group and non-PD group) using a combination of a plurality of markers (18 genes) as an index.
- FIG. 22-1 shows the results of drug effect prediction of the first half patient group (PD group and non-PD group) using a combination of a plurality of markers (15 factors) as an index.
- FIG. 21-1 shows the results of drug effect prediction of the first half patient group (PD group and non-PD group) using a combination of a plurality of markers (18 genes) as an index.
- FIG. 22-2 shows the results of drug effect prediction of the latter half patient group (PD group and non-PD group) using a combination of a plurality of markers (15 factors) as an index.
- FIG. 23 shows the results of drug effect prediction of the first half patient group (PD group and non-PD group) using a combination of a plurality of markers (12 factors) as an index.
- FIG. 24 shows the results of drug effect prediction of the first half patient group (PD group and non-PD group) using a combination of a plurality of markers (7 factors) as an index.
- FIG. 25 shows the results of drug effect prediction of the first half patient group (PD group and non-PD group) using a combination of a plurality of markers (4 factors) as an index.
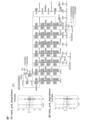
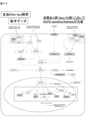
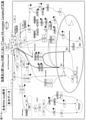
- FIG. 26 shows a block diagram of the system of the present invention.
- FIG. 27 shows bacterial species and KEGG pathways that showed significant differences by overall survival (OS) analysis using fecal metagenomic analysis data from the first and second half patient groups. *: Items for which a significant difference was found by the Bonferroni method.
- FIG. 28 shows bacterial species and KEGG pathways that showed significant differences by progression-free survival (PFS) analysis using metagenomic analysis data in feces of the first half and second half patient groups. *: Items for which a significant difference was found by the Bonferroni method.
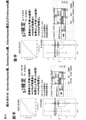
- FIG. 29 shows the scores of the Nucleotide metabolism pathway, which showed a significant difference in OS analysis using fecal metagenome analysis data of the first half and the second half of the patient group, divided into the survival and death patient groups during the observation period. show.
- FIG. 29 shows the scores of the Nucleotide metabolism pathway, which showed a significant difference in OS analysis using fecal metagenome analysis data of the first half and the second half of the patient group, divided into the survival and death patient groups during the
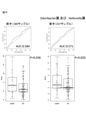
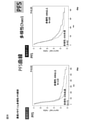
- FIG. 30 shows the survival curves of the patient group (first half and second half) classified according to the expression level (score) of the Nucleotide metabolism pathway of 3.4 or more or less than 3.4 shown by metagenome analysis in feces.
- FIG. 31 shows patients in the Nucleotide metabolism pathway, which showed a significant difference in PFS analysis using fecal metagenome analysis data of the first half and the second half of the patient group, when they were classified into the group with / without exacerbation of cancer during the observation period. Show its score.
- FIG. 32 shows the progression-free survival (PFS) curve of the patient group when the expression level (score) of the Nucleotide metabolism pathway shown by metagenome analysis in feces is classified as 3.4 or more or less than 3.4.
- PFS progression-free survival
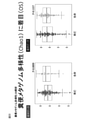
- FIG. 33 shows the score of bacterial species diversity (Chao1) shown by metagenomic analysis in feces of patients who survived or died during the observation period (first half and second half).
- FIG. 34 shows the survival curves of the patient groups (first half and second half) classified with a strain diversity (Chao1) score of 606 or more or less than 606, as shown by metagenomic analysis in feces.
- FIG. 35 shows the score of bacterial species diversity (Chao1) shown by metagenomic analysis in feces of patients (first half and second half) classified into the cancer exacerbation / no exacerbation group during the observation period.
- FIG. 34 shows the survival curves of the patient groups (first half and second half) classified with a strain diversity (Chao1) score of 606 or more or less than 606, as shown by metagenomic analysis in feces.
- FIG. 35 shows the score of bacterial species diversity (Chao1) shown by metagenomic analysis in feces of patients (
- FIG. 36 shows the progression-free survival (PFS) curves of the patient groups (first half and second half) classified with a strain diversity (Chao1) score of 606 or greater or less than 606, as shown by metagenomic analysis in feces.
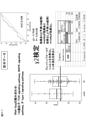
- FIG. 37 shows the scores of the Peptidoglycan biosynthesis pathways that showed significant differences in OS analysis using fecal metagenomic analysis data of the first half and the second half of the patient groups, divided into the survival and death patient groups during the observation period. show.
- FIG. 38 shows the survival curves of the patient group (first half and second half) classified according to the expression level (score) of the Peptidoglycan biosynthesis pathway shown by metagenome analysis in feces of 1.32 or more or less than 1.32.
- FIG. 39 shows the metabolome analysis score of 2-Hydroxybutyric acid amount (normalized by the internal standard (2-Isopropanolmatic acid)) in plasma of patients who survived or died during the observation period (first half and second half).
- FIG. 40 shows a group of patients (first half and second half) classified with a metabolome analysis score of 0.76 or more or less than 0.76 for the amount of 2-Hydroxybutyric acid in plasma (normalized by the internal standard (2-Isopropanolmatic acid)). The survival curve of is shown.
- FIG. 40 shows a group of patients (first half and second half) classified with a metabolome analysis score of 0.76 or more or less than 0.76 for the amount of 2-Hydroxybutyric acid in plasma (normalized by the internal standard (2-Isopropanolmatic acid)). The survival curve of is shown.
- FIG. 41 shows the metabolome analysis score of 2-Oxovolytic acid amount (normalized by the internal standard (2-Isopropanolmatic acid)) in plasma of patients who survived or died during the observation period (first half and second half).
- FIG. 42 shows a group of patients (first half and second half) classified with a metabolome analysis score (Median) of 0 or more or less than 0 for the amount of 2-Oxovolytic acid in plasma (normalized by the internal standard (2-Isopropanolmatic acid)). Shows a survival curve.
- FIG. 43 shows the markers reproduced in the first half and the second half of the patient group as a result of comparing the whole blood gene expression analysis (RNA-Seq analysis) data obtained in the patient group that survived or died during the observation period.
- RNA-Seq analysis whole blood gene expression analysis
- FIG. 44 shows the sum of RNA-Seq analysis expression scores of the 7 genes shown in FIG. 43 in patients who survived or died during the observation period (first half and second half).
- FIG. 45 shows the survival curves of the patient groups (first half and second half) classified by the sum of the RNA-Seq analysis expression scores of the seven genes shown in FIG. 43 being 0.5 or more or less than 0.5.
- FIG. 46 shows patients in the Phenylalane metabolism pathway, which showed a significant difference in PFS analysis using fecal metagenome analysis data of the first half and the second half of the patient group, when they were classified into the cancer exacerbation / no cancer exacerbation group during the observation period. Show its score.
- FIG. 44 shows the sum of RNA-Seq analysis expression scores of the 7 genes shown in FIG. 43 in patients who survived or died during the observation period (first half and second half).
- FIG. 45 shows the survival curves of the patient groups (first half and second half) classified by the sum of the RNA-S
- FIG. 47 shows the progression-free survival (PFS) curve of the patient group when the expression level (score) of the Phenylanaline metabolism pathway shown by metagenome analysis in feces is classified as 0.16 or more or less than 0.16.
- FIG. 48 shows the metabolome analysis score of the plasma Glyceric acid amount (normalized by the internal standard (2-Isopropanolmatic acid)) of patients with / without cancer exacerbation (first half and second half) during the observation period.
- FIG. 49 shows a group of patients (first half and second half) classified with a metabolome analysis score of -0.00033 or higher or less than -0.00033 for the amount of Glyceric acid in plasma (normalized by the internal standard (2-Isopropanolmatic acid)).
- FIG. 50 shows the scores of markers (Arthrobacter genus, Fatty acid metabolism pathway) extracted by intergroup comparative analysis of fecal metagenome data in patients with / without adverse events in the skin.
- FIG. 51 shows SNPs markers for immune-related genes extracted by intergroup comparative analysis of whole blood genomic data from patients with / without adverse events in the skin.
- the present invention presents in patients with cancer to whom an immune checkpoint inhibitor has been applied, with tumor growth (PD group) and non-tumor growth group (non-PD group), survival group and death group, or exacerbation of cancer.
- PD group tumor growth
- non-PD group non-tumor growth group
- survival group and death group or exacerbation of cancer.
- the present invention is a method of predicting a response to an immune checkpoint inhibitor in a subject suffering from cancer.
- SNPs Single nucleotide polymorphisms
- the microorganism is one or more selected from the group consisting of the genus Geobacillus, the genus Gordonibacter, the genus Odoribacter, the genus Veillonella, the genus Corynebacterium, the genus Polychromonas, and the genus Arthrobacter.
- the genomic pathways include bacterial invasion of epithelial cells, fatty acid metabolism, flagellar metabolism, fatty acid biosynthesis (Fatty acid metabolism), fatty acid biosynthesis (Fatty acid metabolism), and fatty acid biosynthesis (Fatty acid metabolism).
- pathway peptide glycan biosynthesis (Peptidoglycan biosynthesis), nucleotide metabolism (Nucleotide metabolism), purine metabolism (Purine metabolism), phenylalanine metabolism (Phenylalanine metabolism)
- the metabolite is one or more selected metabolites from the group consisting of lactic acid, pyruvic acid, glucose, 2-oxobutyric acid, glyceric acid, octanoic acid, citrulin, 2-hydroxybutyric acid and pipecholinic acid.
- the gene is one or more selected from the group consisting of MAPK pathway, Type I IFN receptor complex pathway, TCR signal pathway-related gene, and BCL11B, ERCC3, ERCC6, FCRL1, FCRL3, MS4A1 and TCF7.
- the SNP is one or a plurality of SNPs selected from the group consisting of the following rs numbers: rs2228145.1; rs71900199; and rs7185320. Provide a method.
- cancer is not particularly limited, and is, for example, leukemia (eg, acute myeloid leukemia, chronic myeloid leukemia, acute lymphocytic leukemia, chronic lymphocytic leukemia), malignant lymphoma (hodgkin lymphoma, non-cancer).
- leukemia eg, acute myeloid leukemia, chronic myeloid leukemia, acute lymphocytic leukemia, chronic lymphocytic leukemia
- malignant lymphoma hodgkin lymphoma, non-cancer.
- Hodgkin lymphoma eg, adult T-cell leukemia, follicular lymphoma, diffuse large B-cell lymphoma), multiple myeloma, myelodystrophy syndrome, head and neck cancer, esophageal cancer, esophageal adenocarcinoma, gastric cancer, colon Cancer, colon cancer, rectal cancer, liver cancer (eg, hepatocellular carcinoma), bile sac / bile duct cancer, biliary tract cancer, pancreatic cancer, thyroid cancer, lung cancer (eg, non-small cell lung cancer (eg, squamous epithelial non-small cell lung cancer), Non-flat epithelial non-small cell lung cancer), small cell lung cancer), breast cancer, ovarian cancer (eg, serous ovarian cancer), cervical cancer, uterine body cancer, endometrial cancer, vaginal cancer, genital cancer, renal cancer (eg, serous ovarian cancer) For example, renal cell cancer), urinar
- cancer (malignant tumor) treatment refers to, for example, (i) reducing the growth of cancer, (ii) reducing symptoms caused by cancer, and (iii) improving the quality of life of cancer patients. Includes treatments performed to (iv) reduce the dose of other anticancer drugs or cancer treatment aids already administered, and / or (v) prolong the survival of the cancer patient. Treatment also includes suppression of recurrence. "Relapse suppression” means prophylactically suppressing cancer recurrence in patients whose cancer lesions have been completely or substantially eliminated or removed by cancer treatment or cancer resection surgery.
- examples of the "other anticancer drug” include alkylating agents, platinum preparations, antimetabolites (eg, antimetabolites, pyridine metabolism inhibitors, purine metabolism inhibitors), ribonucleotide reductase inhibitors, and the like. Included are nucleotide analogs, topoisomerase inhibitors, microtube polymerization inhibitors, microtube depolymerization inhibitors, antitumor antibiotics, cytokine preparations, antihormonal agents, molecular targeting agents and cancer immunotherapeutic agents.
- antimetabolites eg, antimetabolites, pyridine metabolism inhibitors, purine metabolism inhibitors
- ribonucleotide reductase inhibitors include alkylating agents, platinum preparations, antimetabolites (eg, antimetabolites, pyridine metabolism inhibitors, purine metabolism inhibitors), ribonucleotide reductase inhibitors, and the like. Included are nucleotide analogs, topoisomerase inhibitors, microtube polymerization
- the therapeutic agents of the present invention are (1) reduced doses of other agents used in combination and / or (3) other agents used in combination to enhance the therapeutic effect of cancer.
- it may be used in combination with one or more other drugs (mainly anticancer drugs) used for the therapeutic purpose of the above-mentioned cancers.
- the dosage form when prescribing in combination with other drugs may be a combination drug form in which both components are mixed in one preparation, or an administration form as separate preparations. good.
- the therapeutic agent or the like of the present invention and another drug are separately administered, the therapeutic agent or the like of the present invention may be administered first, and then the other agent may be administered, or the other agent may be administered.
- each drug may be administered first and the therapeutic agent of the present invention or the like may be administered later, or in the above administration, there may be a period during which both agents are simultaneously administered for a certain period of time.
- the administration method of each drug may be the same or different.
- the drug can also be provided as a kit containing the therapeutic agent of the present invention and other drugs.
- the dose of the other drug can be appropriately selected based on the clinically used dose.
- other drugs may be administered in combination of any two or more at an appropriate ratio.
- the other drugs include not only those found so far but also those found in the future.
- immune checkpoint inhibitor means an agent that exerts an immunosuppressive function by inhibiting an immune checkpoint molecule and transmitting an inhibitory co-signal.
- immune checkpoint molecules include CTLA-4, PD-1, PD-L1 (programmed cell death-ligand 1), PD-L2 (programmed cell date-ligand 2), LAG-3 (Lymphometry activationTime3).
- T cell immunoglobulin and mucin-3 T cell immunoglobulin and mucin-3
- BTLA B and T lympho-cyte attenator
- B7H3, B7H4, 2B4 CD160
- A2aR adenosine A2a receptor
- IR Contining support of T cell activation IDO1 (Indoreamine 2,3-dioxygene), ArginaseI, TIGIT (T cell immunoglobulin and ITIM doman), CD115, etc. 2012, Cancer Cell, 27, 450-461, 2015), and the molecule is not particularly limited as long as it has a function consistent with the definition.
- the applicable immune checkpoint inhibitor is not particularly limited as long as it is a substance capable of suppressing the function (signal) of the immune checkpoint molecule.
- the immune checkpoint inhibitor is preferably an inhibitor of a human immune checkpoint molecule, and more preferably a neutralizing antibody against the human immune checkpoint molecule.
- Immune checkpoint inhibitors consist of, for example, CTLA-4, PD-1, PD-L1, PD-L2, LAG-3, TIM3, BTLA, B7H3, B7H4, 2B4, CD160, A2aR, KIR, VISTA and TIGIT. Included are inhibitors of immune checkpoint molecules selected from the group. Examples of immune checkpoint inhibitors are given below, but immune checkpoint inhibitors are not limited to these.
- immune checkpoint inhibitors examples include anti-CTLA-4 antibody (eg, Ipilimumab (YERVOY®), Tremerimumab, AGEN-1884), anti-PD-1 antibody (eg, nivolumab (registered trademark)).
- anti-CTLA-4 antibody eg, Ipilimumab (YERVOY®), Tremerimumab, AGEN-1884
- anti-PD-1 antibody eg, nivolumab (registered trademark)
- Antibodies comprising the heavy and light chain complementarity determining regions (CDRs) or variable regions (VR) of the known antibodies are also aspects of immune checkpoint inhibitors.
- further embodiments of anti-PD-1 antibodies include antibodies comprising, for example, nivolumab heavy and light chain complementarity determining regions (CDRs) or variable regions (VR).
- the immune checkpoint inhibitor applicable in the present invention is preferably anti-CTLA-4 antibody, anti-PD-1 antibody, anti-PD-L1 antibody, anti-PD-L2 antibody, PD-L1 fusion protein, PD-L2 fusion protein.
- it is an anti-PD-1 antibody, an anti-PD-L1 antibody, an anti-PD-L2 antibody, a PD-L1 fusion protein, and a PD-L2 fusion protein.
- Particularly preferred is an anti-PD-1 antibody.
- the anti-PD-1 antibody is preferably an antibody (including nivolumab) containing the heavy and light chain complementarity determining regions (CDRs) or variable regions (VR) of nivolumab, and more preferably nivolumab.
- CDRs heavy and light chain complementarity determining regions
- VR variable regions
- An antibody or fusion protein of any one of these immune checkpoint inhibitors or any plurality of types can be applied in the present invention.
- the dose of the immune checkpoint inhibitor that can be used for a subject determined to have a good response to the immune checkpoint inhibitor depends on age, body weight, symptoms, therapeutic effect, administration method, treatment time, and the like. Different, but adjusted to produce the optimum desired effect.
- one aspect of the dose when using an anti-PD-1 antibody, one aspect of the dose is 0.1 to 20 mg / kg body weight. Also, when using an antibody (eg, nivolumab) containing nivolumab heavy and light chain complementarity determining regions (CDRs) or variable regions (VR), one aspect of the dose is 0.3-10 mg / kg body weight. Yes, preferably, for adults, (1) 1 mg / kg (body weight) once at 3 week intervals, (2) 3 mg / kg (body weight) once at 2 week intervals, (3) once as nivolumab.
- an antibody eg, nivolumab
- CDRs light chain complementarity determining regions
- VR variable regions
- a single dose of 480 mg can be administered by intravenous drip infusion at 4-week intervals.
- feces refers to those excreted from the intestinal tract to the outside of the body
- intestinal contents refers to the contents before being excreted from the intestinal tract to the outside.
- the "step of determining the value of the abundance of microorganisms" may be to determine the presence or absence of a desired microorganism, and to determine the absolute abundance of a desired microorganism. It may be, or it may be to determine the relative abundance of the desired microorganism.
- the step of determining the value of the abundance of microorganisms can be determined by using a known method for identifying microorganisms, and for example, the abundance of microorganisms can be determined by metagenomic analysis.
- Metagenomic analysis refers to analysis of the entire genome of the microbial flora without going through the process of culturing, and metagenomic analysis applicable in the present invention is a known method, for example, a method and analysis using a next-generation sequencer. It is possible to carry out by.
- Identification of microorganisms by metagenome analysis may be, for example, a method of identification by classification of microorganisms by comparing the base sequences of 16S rRNA genes in small ribosome subunits, and the bacterial species may be identified by the sequences of other genomic regions of the microorganisms. It may be an identification method and is not particularly limited. It is also possible to determine the abundance of the corresponding microorganism by performing metagenomic analysis.
- the present inventors have found that the response to an immune checkpoint inhibitor in a subject can be predicted by using the abundance as an index.
- the abundance of Geobacillus, Gordonibacter, or Veillonella microorganisms is an immune checkpoint inhibitor in patients suffering from cancer that responds well to immune checkpoint inhibitors.
- the abundance of Geobacillus, Gordonibacter, or Veillonella microorganisms in the feces or intestinal contents of the subject is lower than a predetermined threshold, the response to the immune checkpoint inhibitor in the subject is Although it can be predicted to be defective, it is more preferable to use the abundance of microorganisms of the genus Veillonella as an index.
- the abundance of microorganisms of the genus Odoribacter as an index among the microorganisms in the feces or intestinal contents of the subject. They found it for the first time. For example, we have shown that the abundance of microorganisms of the genus Odoribacter shows a good response to immune checkpoint inhibitors in patients suffering from cancer who show a good response to immune checkpoint inhibitors. It was found to be significantly lower than patients with no cancer.
- the immune checkpoint inhibitor will induce skin adverse events in the subject. can do.
- the specific value of the "predetermined threshold” or “cutoff value” is not limited because it is changed depending on the analysis method, measurement conditions, etc., but for example, for an immune checkpoint inhibitor.
- a "genome pathway” is a pathway (inter-molecular interaction network in a metabolic or signaling system) that can be identified by a base sequence obtained from a fecal or intestinal content in a subject, eg, KEGG (Kyoto Encyclopedia of Genes and Genomes) PATHWAY database (https://www.genome.jp/kegg/pathway.html) is a pathway registered. Genome pathways can be identified using the above KEGG PATHWAY database from fecal or intestinal contents in the subject, for example from metagenomic datasets that can be obtained by methods similar to the metagenomic analysis described above.
- the present inventors By analyzing the metagenome datasets that can be obtained from the feces or intestinal contents of the subject, the present inventors have bacterial invasion of epithelial cells, fatty acid degradation, and fluff aggregation.
- the score of one or more genomic pathways selected from the group consisting of (Flagellar assembly), fatty acid biosynthesis, and PPAR signal pathway (PPAR signing pathway) is good for immune checkpoint inhibitors.
- PPAR signing pathway PPAR signing pathway
- peptide glycan biosynthesis (Peptidoglycan biosynthesis), nucleotide metabolism (Nucleotide metabolism), purine metabolism (Purine metabolism), phenylalanine metabolism (Phenylalanine metabolism) and metabolism of fatty acids (selected from Phenelylanine metabolism) and metabolism of fatty acids Metabolic pathway scores show good responses to cancer-affected patients (survival group or no exacerbation group) who respond well to immune checkpoint inhibitors and to immune checkpoint inhibitors. We found that there was a significant difference in the group of patients with no cancer (death group or group with exacerbations).
- the genomic pathways in the feces or intestinal contents of the subject bacterial invasion of epithelial cells, fatty acid metabolism, and flagellar assembly PPAR signals.
- the score of PPAR signing passage and / or phenylalanine metabolism is lower than a predetermined threshold, it can be predicted that the response to the immune checkpoint inhibitor in the subject is good.
- the genomic pathways in the feces or intestinal contents of the subject bacterial invasion of epithelial cells, fatty acid metabolism, and flagellar assembly PPAR signals. If the PPAR signing passage and / or phenylalanine metabolism scores are higher than a predetermined threshold, it can be predicted that the response to the immune checkpoint inhibitor in the subject is poor.
- fatty acid biosynthesis Fatty acid metabolism
- nucleotide metabolism Nucleotide metabolism
- peptide glycan biosynthesis Peptidoglycan biosynthesis
- fatty acid metabolism (Fatty acid metabolism) score of the genomic pathway in the feces or intestinal contents of the subject is higher than a predetermined threshold, the subject is subjected to an immune checkpoint inhibitor. It can be predicted to induce adverse skin events.
- the genomic pathway score used in the present invention can be determined by performing metagenomic analysis on the fecal or intestinal contents of the subject and inputting the resulting metagenomic dataset into the KEGG PHATWAY database, eg, References: Abubucker et al. PLoS Computational Biology 2012, (8) 6 e1002588. It can be implemented by referring to.
- the invention makes it possible to predict a response to an immune checkpoint inhibitor in a subject by determining the abundance of metabolites in the subject's blood, serum or plasma.
- the present inventors consist of metabolites, particularly lactic acid, pyruvate, glucose, 2-oxobutyric acid, glyceric acid, octanoic acid, citrulin, 2-hydroxybutyric acid and pipecholinic acid in the target blood, serum or plasma. It has been found that the response to an immune checkpoint inhibitor in a subject can be predicted by using the abundance of one or more selected metabolites as an index.
- the abundance of lactic acid, pyruvate, glucose, glyceric acid, octanoic acid, 2-hydroxybutyric acid or 2-oxobutyric acid among the metabolites present in the target blood, serum or plasma is predetermined. If it is lower than the threshold of, it can be predicted that the response to the immune checkpoint inhibitor in the subject is good. Further, in another embodiment, the abundance of lactic acid, pyruvate, glucose, glyceric acid, octanoic acid, 2-hydroxybutyric acid or 2-oxobutyric acid among the metabolites present in the blood, serum or plasma of the subject is determined. If it is higher than a predetermined threshold, it can be predicted that the response to the immune checkpoint inhibitor in the subject is poor.
- the immune checkpoint inhibitor in the subject when the abundance of pipecolic acid and / or citrulline among the metabolites present in the blood, serum or plasma of the subject is higher than a predetermined threshold value, the immune checkpoint inhibitor in the subject is referred to. It is possible to predict that the response will be good. In still another embodiment, if the abundance of pipecolic acid and / or citrulline among the metabolites present in the blood, serum or plasma of the subject is lower than a predetermined threshold, the immune checkpoint inhibitor in the subject. It is possible to predict that the response to is poor.
- the method for determining the abundance of metabolites present in blood, serum or plasma is not particularly limited, but may be determined using a known metabolome analysis method, for example, mass spectrometry or nuclear magnetic resonance. It may be determined by a resonance method or the like.
- mass spectrometry a blood, serum or plasma sample is converted into gaseous ions using an ion source (ionization), and the blood is ionized by moving it in a vacuum in a vacuum and using electromagnetic force or by a flight time difference in the analysis unit.
- a measurement method using a mass spectrometer that can separate and detect serum or plasma samples according to the mass-to-charge ratio.
- Methods of ionization using an ion source include electron ionization (EI) method, chemical ionization (CI) method, electrospray ionization (FD) method, fast atom bombardment (FAB) method, and matrix-assisted laser desorption ionization (MALDI).
- EI electron ionization
- CI chemical ionization
- FD electrospray ionization
- FAB fast atom bombardment
- MALDI matrix-assisted laser desorption ionization
- ESI electrospray ionization
- the method for separating the ionized blood, serum, or plasma sample in the analysis unit is a magnetic field deflection type or a quadrupole type.
- Ion trap type flight time (TOF) type, Fourier transformed ion cyclotron resonance type and the like can be appropriately selected.
- tandem mass spectrometry which is a combination of two or more mass spectrometry methods, can be used.
- the metabolites may be separated / purified from the contaminants and analyzed by gas chromatography (GC), liquid chromatography (LC) or high performance liquid chromatography (HPLC).
- the step (1) may be (iv) a step of determining the expression level of the gene in the blood, serum or plasma of the target.
- the gene to be determined is preferably a gene related to one or a plurality of pathways selected from the group consisting of MAPK pathway, Type I IFN receptor compact pathway and TCR signal pathway.
- the present inventors relate to one or a plurality of pathways selected from the group consisting of MAPK pathway, Type I IFN receptor complex pathway and TCR signal pathway.
- Non-PD group Patients with cancer whose gene expression responds favorably to immune checkpoint inhibitors (non-PD group) and cancers that do not respond favorably to immune checkpoint inhibitors
- PD group the patient group
- the present inventors showed that the expression of the following genes: BCL11B, ERCC3, ERCC6, FCRL1, FCRL3, MS4A1 and TCF7 inhibited immune checkpoints.
- Significant difference between the group of patients with cancer who responded well to the drug (survival group) and the group of patients with cancer who did not respond well to immune checkpoint inhibitors (death group) I found that there is.
- the "MAPK pathway (also referred to as MAPK signal pathway)” refers to a signal pathway in which MAP kinase (mitogen-activated proteininase) is involved, and MAPK refers to metabolism, proliferation, division, motility, and apoptosis. It is a serine / threonine kinase that is involved in various functions of cells.
- the MAPK pathway-related genes that can be used to predict the response to an immune checkpoint inhibitor are selected, for example, one or more from MAPKAPK5, MAPKAPK5-AS1, MAP3K14, MAPK3K7, MAP3K1, MAPK9, MAP3K5 and MAPK14. Genes can be mentioned.
- the genes related to "Type I IFN receptor complex pathway" are PIK3R1, PTPN11, STAT1, FYN, EIF4B, RAC1, MAP3K1, RPS6KB1, PDCD4, REL, MAPK14, RPS6KA5, ST. RAPGEF1 and the like can be mentioned.
- the genes related to the "TCR signal pathway” are MAP3K14, CD4, FYN, DLG1, PDK1, NFKB1, MALT1, LAT, SOS1, MAP3K7, IL10, GRAP2, CD40LG, PIK3CA, PRKCQ, NFATC2, CALM1. And so on.
- the expression level of a gene associated with one or more pathways selected from the group consisting of MAPK pathway, Type I IFN receptor complex pathway and TCR signal pathway eg, an expression score calculated by any method.
- a predetermined threshold it can be predicted that the response to the immune checkpoint inhibitor is good.
- the expression score is lower than a predetermined threshold, it can be predicted that the response to the immune checkpoint inhibitor is poor.
- the expression level of one or more genes selected from the group consisting of BCL11B, ERCC3, ERCC6, FCRL1, FCRL3, MS4A1 and TCF7 is predetermined. If it is higher than the threshold, it can be predicted that the response to the immune checkpoint inhibitor is good. Further, in another embodiment, the expression level of one or a plurality of genes selected from the group consisting of BCL11B, ERCC3, ERCC6, FCRL1, FCRL3, MS4A1 and TCF7 (for example, the calculated expression score measured by an arbitrary method) is determined. If it is lower than a predetermined threshold, it can be predicted that the response to the immune checkpoint inhibitor is poor.
- the step of determining the expression level of a gene in the blood, serum or plasma of a subject may be determined by known transcriptome analysis.
- step (1) may be (v) determine the presence or absence of a single nucleotide polymorphism (SNP) in one or more selected genes from the group consisting of IL6R and NLRC5 in the subject.
- the SNP here may be one or more selected SNPs from the group consisting of the following rs numbers: rs2228145.1; rs7190199; and rs7185320.
- the present inventors performed specific SNP and skin adverse events. We found that there was a correlation with the occurrence of. That is, if the subject has one or more SNPs selected from the group consisting of rs2228145.1; rs7190199; and rs7185320, it can be predicted that immune checkpoint inhibitors will induce skin adverse events.
- the method of predicting the response to an immune checkpoint inhibitor in a subject suffering from cancer is described in (i) the abundance of microorganisms in the fecal or intestinal contents of the subject; (Ii) Genomic pathway score in the fecal or intestinal contents of the subject; (Iii) Abundance of metabolites in the blood, serum or plasma of the subject; (Iv) Gene expression levels in the subject's blood, serum or plasma; and (v) Single nucleotide polymorphisms (SNPs) of one or more genes selected from the group consisting of IL6R and NLRC5 in the subject.
- a value selected from one or more of the group consisting of SNPs or an index combining the presence or absence of SNPs may be used to predict the response to an immune checkpoint inhibitor in a subject. By combining the above indicators, the correct diagnosis rate will be higher.
- the present invention is a method of treating a subject suffering from cancer.
- a step of determining the presence or absence of one or more selected values or SNPs from a group consisting of (2) A step of predicting a response to an immune checkpoint inhibitor in the subject using the value obtained in the step (1) or the presence or absence of an SNP as an index. (3) A step of administering the immune checkpoint inhibitor to the subject determined to have a good response to the immune checkpoint inhibitor.
- the microorganism is one or more selected from the group consisting of the genus Geobacillus, the genus Gordonibacter, the genus Odoribacter, the genus Veillonella, the genus Corynebacterium, the genus Polychromonas, and the genus Arthrobacter.
- the genomic pathways include bacterial invasion of epithelial cells, fatty acid metabolism, flagellar metabolism, fatty acid biosynthesis (Fatty acid metabolism), fatty acid biosynthesis (Fatty acid metabolism), and fatty acid biosynthesis (Fatty acid metabolism).
- pathway peptide glycan biosynthesis (Peptidoglycan biosynthesis), nucleotide metabolism (Nucleotide metabolism), purine metabolism (Purine metabolism), phenylalanine metabolism (Phenylalanine metabolism)
- the metabolite is one or more selected metabolites from the group consisting of lactic acid, pyruvic acid, glucose, 2-oxobutyric acid, glyceric acid, octanoic acid, citrulin, 2-hydroxybutyric acid and pipecholinic acid.
- the gene is one or more selected from the group consisting of MAPK pathway, Type I IFN receptor complex pathway, TCR signal pathway-related gene, and BCL11B, ERCC3, ERCC6, FCRL1, FCRL3, MS4A1 and TCF7.
- the SNP is one or a plurality of SNPs selected from the group consisting of the following rs numbers: rs2228145.1; rs71900199; and rs7185320. It may provide a method.
- the present invention is for determining the responsiveness to an immune checkpoint inhibitor in a subject having cancer, including a storage unit 11, an input unit 12, a data processing unit 14, and an output unit 15.
- System 10 The storage unit 11 (1-i) Abundance of microorganisms in feces or intestinal contents; (1-ii) Genomic pathway scores in fecal or intestinal contents; (1-iii) Abundance of metabolites in blood, serum or plasma; (1-iv) Gene expression levels in blood, serum or plasma; and (1-v) Single nucleotide polymorphisms (SNPs) of one or more selected genes from the group consisting of IL6R and NLRC5.
- SNPs Single nucleotide polymorphisms
- a value selected one or more from the group consisting of SNPs or the presence or absence of SNP is input and stored in the storage unit 11.
- the data processing unit 14 compares the presence or absence of the stored value or SNP with the cutoff value to determine the responsiveness to the immune checkpoint inhibitor in the subject.
- the output unit 15 outputs a determination result of responsiveness to the immune checkpoint inhibitor of cancer in the subject.
- the system 10 may be characterized in that (FIG. 26).
- the system 10 may further include an analytical measurement unit 13, which determines the abundance of microorganisms or the genomic pathway score in the fecal or intestinal content of the subject.
- the analysis and measurement unit 13 determines the abundance of metabolites in the blood, serum or plasma of the subject.
- the analysis and measurement unit 13 determines the expression level of the gene in the blood, serum or plasma of the subject, and / or the analysis and measurement unit 13 is one or a plurality of genes selected from the group consisting of IL6R and NLRC5.
- Determine single nucleotide polymorphisms (SNPs) The abundance of the microorganism, the score of the genomic pathway, the abundance of the metabolite, the expression level of the gene determined by the analysis / measurement unit 13 in place of or through the input unit 12. And / or the presence or absence of the SNP may be input (FIG. 26).
- the storage unit 11 has a memory device such as RAM, ROM, and flash memory, a fixed disk device such as a hard disk drive, or a portable storage device such as a flexible disk and an optical disk.
- the storage unit 11 is a computer program used for various processes of the information processing device, such as data measured by the analysis and measurement unit 13, data and instructions input from the input unit 12, calculation processing results performed by the data processing unit 14, and the like. , Database etc. are stored.
- the computer program may be installed via a computer-readable recording medium such as a CD-ROM or a DVD-ROM, or via the Internet.
- the computer program is installed in the storage unit 11 using a known setup program or the like.
- the input unit 12 is an interface or the like, and includes an operation unit such as a keyboard and a mouse. As a result, the input unit 12 can input the data measured by the analysis and measurement unit 13, the instruction of the arithmetic processing performed by the data processing unit 14, and the like. Further, for example, when the analysis / measurement unit 13 is located outside, the input unit 12 may include an interface unit capable of inputting measured data or the like via a network or a storage medium, in addition to the operation unit.
- the analysis and measurement unit 13 performs the above-mentioned steps of measuring the abundance of microorganisms, the score of the genome pathway, the abundance of metabolites, the expression level of genes and / or SNP. Therefore, the analysis / measurement unit 13 has a configuration that enables measurement of the abundance of microorganisms, the score of the genomic pathway, the abundance of metabolites, the expression level of genes and / or SNP.
- the analysis and measurement unit 13 is not intended to be limited to the following, but for example, a next-generation sequencer capable of performing metagenome analysis, a mass spectrometer capable of determining the abundance of metabolites, and the like. Known devices such as nuclear magnetic resonance devices can be used alone or in combination.
- the analysis / measurement unit 13 may be configured separately from the system 10, and the measured data or the like may be input via the input unit 12 using a network or a storage medium.
- the data processing unit 14 uses the value input from the input unit 12 or the analysis measurement unit 13 and the cutoff value for determining the responsiveness to the immune checkpoint inhibitor to determine the immune checkpoint inhibitor of the cancer in the subject. Responsiveness can be determined.
- the data processing unit 14 executes various arithmetic processes on the data measured by the analysis and measurement unit 13 and stored in the storage unit 11 according to the program stored in the storage unit 11.
- the arithmetic processing is performed by the CPU included in the data processing unit 14.
- This CPU includes a functional module that controls an analysis measurement unit 13, an input unit 12, a storage unit 11, and an output unit 15, and can perform various controls. Each of these parts may be composed of an independent integrated circuit, a microprocessor, firmware, or the like.
- the output unit 15 is configured to output the result of performing arithmetic processing in the data processing unit.
- the output unit 15 may be a display device such as a liquid crystal display that directly displays the result of arithmetic processing, an output means such as a printer, or an interface unit for outputting to an external storage device or outputting via a network. There may be.
- the present invention relates to the endpoints of the invention ((1-i) abundance of microorganisms in feces or intestinal contents; (1-ii) scores of genomic pathways in feces or intestinal contents; (1-iii) blood, Abundance of metabolites in serum or plasma; (1-iv) expression of genes in blood, serum or plasma; or (1-v) one or more genes selected from the group consisting of IL6R and NLRC5. Also includes inventions relating to inspections or measurement kits for measuring type (SNP)).
- the "first half” means a training cohort
- the "second half” means a validation cohort
- Example 1 ⁇ Materials and analysis methods> 1.
- Fecal metagenomic analysis 1-1 Sample collection From 478 cases (196 samples in the first half + 282 samples in the second half), feces about the size of azuki beans were collected with a special spoon and immediately placed in a container containing a guanidine solution. After shaking the container 5 to 6 times to mix the contents, the container was submitted to a medical institution within 1 week and stored at ⁇ 20 ° C. or ⁇ 80 ° C.
- sequencing library was prepared with 1 ⁇ g of genomic DNA in the NEBNext Ultra DNA Library Prep Kit for Illumina (NEB, USA).
- the APIPure XP system was used for library purification, and the quality of the sequence library was confirmed by Agilent 2100 Bioanalyzer (Agilent Technologies, Santa Clara, CA).
- the sequence of the sequence library was performed using NovaSeq6000 (Illumina, Inc., San Diego, CA) with a 150 bp pair end.
- RNA-Seq Blood cell RNA expression analysis
- Sequencing Sequencing libraries use Total RNA for NEBNext Ultra II Directional RNA Library Prep Kit for Illumina (New England Biolabs, MA) and NEBNextRan (NEBNextRanb. ..
- the quality of the sequence library was confirmed by Agilent 2200 TapeStation High Sensitivity D1000 (Agilent Technologies, Santa Clara, CA), and the concentration was measured by KOD SYBR qPCR Mix (TOYOBO).
- the sequence of the sequence library was performed using NovaSeq6000 (Illumina, Inc., San Diego, CA) with a 50 bp pair end.
- Plasma blood collected from 489 cases was collected in a blood collection tube containing EDTA-2K, immediately miscible 10 times or more, and centrifuged at 1200 xg for 10 minutes.
- the separated supernatant (plasma) was separated, dispensed into a dispensing tube, and stored at ⁇ 20 ° C. or ⁇ 80 ° C.
- -PD group A group of cases in which tumor growth is observed in the first image evaluation after starting treatment-Non-PD group: Tumor size is maintained or reduced in the first image evaluation after treatment is started Case group
- Geobacillus For bacterial species, Geobacillus, Gordonibacter, Sebaldella, etc. were extracted as markers at the genus level, and for the functional KEGG pathway, Bacterial invasion of epithelial cells, Grandellar fatty acid, etc. were extracted.
- RNA-Seq Whole blood gene expression analysis
- the MAPK pathway As a result of investigating whether or not the gene group having a difference between the PD group vs. non-PD group is biased to a specific GO-Term by functional annotation information (GO-Term) from the gene expression data, the MAPK pathway. , TCR signal pathway, NF-kB, cytokine signaling (for example, Type I IFN receptor complex), etc. were found to have different expression levels in the PD group vs non-PD group. (Fig. 17-1 to Fig. 17-7)
- the frequency information (expression level) of each of the two genera, Odoribacter and Verionella is normalized and scored by adding the values, and the PD group vs non-PD group.
- the AUC was 0.571 to 0.584 and the p value was 0.020 to 0.036.
- the AUC was 0.571 to 0.634 and the p value was 0.001 as a result of scoring with a combination of four species (Gordonibacter, Geobacillus, Odoribacter, Veillonella) and predicting the drug effect.
- the correct diagnosis rate was up to 60% for the prediction with the effect and up to 70% for the prediction without the effect.
- AUC was 0.708 as a result of scoring using three metabolites of pyruvic acid (Pyruvic acid), pipecolic acid (Pipecolic acid), and glyceric acid (Glyceric acid).
- the correct diagnosis rate was 51% for the prediction that there was an effect and 84% for the prediction that there was no effect.
- genes contained in 18 genes TCR signing pathway, MAPK signing pathway, IF typeI signing pathway, etc .: CD247, STAT1, CCR5, CB, BK3, BP1, BP, BP, BP, BP, and CFB,
- AUC was 0.598, the prediction with effect was 43%, and the prediction without effect was 73%. It was the correct diagnosis rate.
- biomarkers The following 15 types were used for the combination. Bacterial Invasion of epithelial cells, Fatty acid degradation, Flagellar assembly, Fatty acid biosynthesis, PPAR signaling pathway, Geobacillus, Gordonibacter, Odoribacter, Veillonella, Lactic acid, Pyruvic acid, Glucose, 2-Oxobutyric acid, Glyceric acid, Pipecolinic acid
- the AUC was 0.631 to 0.682
- the p-value was 0.00003 to 0.0025
- the prediction of effectiveness was up to 67%
- there was no effect. was predicted to have a correct diagnosis rate of up to 74%. (Figs. 22 to 25)
- OS overall survival
- PFS progression-free survival
- RNA-Seq blood cell RNA expression analysis
- metabolome analysis was performed to obtain data, thereby resulting in overall survival (OS) and progression-free survival. (PFS) analysis was performed.
- the survival group and the death group were defined as follows.
- the group with exacerbation and the group without exacerbation were defined as follows.
- Group with exacerbation Group confirmed to have exacerbation during the observation period
- Group without exacerbation Group confirmed to have no exacerbation during the observation period
- Figures 27 and 28 show the markers that showed a significant difference in the expression level between the two groups from the OS analysis comparing the stool metagenomics of the surviving group and the dead group and the PFS analysis comparing the exacerbation group and the exacerbation non-exacerbation group.
- RNA-Seq RNA expression analysis
- Example 3 Adverse event analysis by fecal metagenomics Using the same sample as in Example 1, fecal metagenomic analysis was performed, and a comparison between 56 samples with skin adverse events and other samples was performed, and the first half sample and the second half sample were compared. The marker to be reproduced with was extracted. A marker having a Median difference of 0.01 or more and a t-test P value of 0.05 or less was searched for.
- Group with adverse events Group with any adverse events of acne-like rash, dry skin, or pruritus during the observation period
- Group without adverse events Group with acne-like rash, skin during the observation period Group without any adverse events of dryness or pruritus
- Example 4 Adverse event analysis by fecal metagenomics Genome single nucleotide polymorphisms (SNPs) array analysis was performed from whole blood samples using the same sample as in Example 1. Genomic DNA was extracted from each of the 175 samples in the first half and the 265 samples in the second half and labeled. SNPs analysis was performed on them by a microarray (Illumina: Infinium Screening ArrayBedChip ( ⁇ 600,000 markers). GenomeStudio Software was used for data analysis.
- SNPs single nucleotide polymorphisms
Landscapes
- Health & Medical Sciences (AREA)
- Chemical & Material Sciences (AREA)
- Life Sciences & Earth Sciences (AREA)
- Engineering & Computer Science (AREA)
- Organic Chemistry (AREA)
- General Health & Medical Sciences (AREA)
- Immunology (AREA)
- Zoology (AREA)
- Genetics & Genomics (AREA)
- Bioinformatics & Cheminformatics (AREA)
- Medicinal Chemistry (AREA)
- Molecular Biology (AREA)
- Wood Science & Technology (AREA)
- Proteomics, Peptides & Aminoacids (AREA)
- Biochemistry (AREA)
- Microbiology (AREA)
- Biotechnology (AREA)
- Biomedical Technology (AREA)
- Biophysics (AREA)
- Physics & Mathematics (AREA)
- General Engineering & Computer Science (AREA)
- Veterinary Medicine (AREA)
- Public Health (AREA)
- Animal Behavior & Ethology (AREA)
- Analytical Chemistry (AREA)
- Pharmacology & Pharmacy (AREA)
- Urology & Nephrology (AREA)
- Chemical Kinetics & Catalysis (AREA)
- Nuclear Medicine, Radiotherapy & Molecular Imaging (AREA)
- General Chemical & Material Sciences (AREA)
- Toxicology (AREA)
- Hematology (AREA)
- Food Science & Technology (AREA)
- Epidemiology (AREA)
- Mycology (AREA)
- Gastroenterology & Hepatology (AREA)
- Cell Biology (AREA)
- General Physics & Mathematics (AREA)
- Pathology (AREA)
- Crystallography & Structural Chemistry (AREA)
Abstract
Provided is a method for predicting a response to an immune checkpoint inhibitor for a subject having cancer, the method comprising: a step (1) for determining one or more values or the presence or the absence of single nucleotide polymorphism (SNP), selected from the group consisting of: (i) abundance of microorganisms in feces or bowel content of the subject, (ii) genome pathway score in feces or bowel content of the subject, (iii) abundance of metabolic products in the blood, serum, or plasma of the subject, (iv) gene expression in the blood, serum or plasma of the subject, and (v) SNP of one or more genes selected from the group consisting of IL6R and NLRC5 of the subject; and a step (2) for predicting a response of the subject to an immune checkpoint inhibitor on the basis of the value obtained in the step (1).
Description
本開示は、免疫チェックポイント阻害剤に対する応答を予測する方法に関する。
The present disclosure relates to a method of predicting a response to an immune checkpoint inhibitor.
癌細胞や癌の微小環境には、癌に対する免疫応答を妨げる種々の免疫チェックポイント分子が存在する。免疫チェックポイント阻害剤は、免疫抑制機構を解除し、癌に対する免疫反応を活性化する新たな治療法であり、既に、免疫チェックポイント阻害剤として、抗CTLA-4(cytotoxic T lymphocyte-associated antigen-4)抗体のイピリムマブ(ipilimumab)や抗PD-1(programmed cell death-1)抗体のニボルマブ(nivolumab)およびペンブロリズマブ(pembrolizumab)が日本国の内外で承認を得て、癌治療で使用されている。
There are various immune checkpoint molecules that interfere with the immune response to cancer in cancer cells and the microenvironment of cancer. Immune checkpoint inhibitors are a new therapeutic method that cancels the immunosuppressive mechanism and activates the immune response to cancer. As an immune checkpoint inhibitor, anti-CTLA-4 (cytotoxic T lymphocyte-associated antibody-) has already been used. 4) The antibody ipilimumab and the anti-PD-1 (programmed cell death-1) antibody nivolumab and pembrolizumab have been approved both inside and outside Japan and are used in cancer treatment.
免疫チェックポイント阻害剤は、癌治療に革命をもたらし、これまで完治が難しかった癌患者に福音を与えた。しかしながら、免疫チェックポイント阻害剤は、全ての癌患者に一律の効果を発揮するものではなく、無増悪生存期間のデータからは、免疫チェックポイント阻害剤の一つである抗PD-1抗体を用いた臨床試験において、3ヶ月以内に病勢が増悪する「無効群」が認められる。一方、1年以上にわたり抗PD-1抗体が有効であった群は、それ以降ほとんど病勢増悪が認められず、治癒に近い状態が得られている。これは、臨床効果において「無効群」「著効群」「中間群」というような3つの異なったサブグループが存在することを示唆している。
Immune checkpoint inhibitors revolutionized cancer treatment and gave the gospel to cancer patients who were previously difficult to cure. However, immune checkpoint inhibitors do not exert a uniform effect on all cancer patients, and from the data on progression-free survival, anti-PD-1 antibody, which is one of the immune checkpoint inhibitors, is used. In the clinical trials that had been performed, there was an "ineffective group" in which the disease worsened within 3 months. On the other hand, in the group in which the anti-PD-1 antibody was effective for 1 year or more, almost no exacerbation of the disease was observed after that, and a state close to cure was obtained. This suggests that there are three different subgroups of clinical efficacy, such as "ineffective group", "significantly effective group", and "intermediate group".
ほぼ全ての癌腫における標準治療となる事が予想される免疫チェックポイント阻害剤を無効群の患者に投与することは、医学的見地から問題があるばかりだけではなく、医療経済の点からも問題となる。
Administering immune checkpoint inhibitors, which are expected to be the standard treatment for almost all carcinomas, to patients in the ineffective group is not only problematic from a medical point of view, but also problematic from a medical economic point of view. Become.
上記課題を解決するために、免疫チェックポイント阻害剤に対する応答を予測する方法が探索されており、腸内細菌をバイオマーカーとして用いる方法が提案されている(特許文献1~5)。
In order to solve the above problems, a method for predicting a response to an immune checkpoint inhibitor has been sought, and a method using intestinal bacteria as a biomarker has been proposed (Patent Documents 1 to 5).
本発明の課題は、癌を罹患する対象における、免疫チェックポイント阻害剤に対する応答を予測することにある。
An object of the present invention is to predict the response to an immune checkpoint inhibitor in a subject suffering from cancer.
本発明者らは、前記課題を解決すべく鋭意検討した結果、驚くべきことに、対象における糞便又は腸内容物において、これまで知られていなかった特定の菌種の存在量もしくは特定のゲノムパスウェイのスコア、対象における血液、血清又は血漿における特定の代謝産物の存在量、対象における血液、血清又は血漿における特定の遺伝子発現量、あるいは、対象における特定の一塩基多型(SNP)の有無を決定することによって、対象における免疫チェックポイント阻害剤に対する応答を予測可能であることを見出し、本発明を完成するに至った。
As a result of diligent studies to solve the above problems, the present inventors have surprisingly found that the abundance of a specific bacterial species or a specific genomic pathway that has not been known so far in the fecal or intestinal contents in a subject. Score, the abundance of a particular metabolite in blood, serum or plasma in a subject, the expression of a particular gene in blood, serum or plasma in a subject, or the presence or absence of a particular single nucleotide polymorphism (SNP) in a subject. By doing so, it was found that the response to the immune checkpoint inhibitor in the subject can be predicted, and the present invention has been completed.
すなわち、本発明は、以下の態様を含み得る。
That is, the present invention may include the following aspects.
[1] 癌を罹患する対象における、免疫チェックポイント阻害剤に対する応答を予測する方法であって、
(1)以下:
(i)前記対象の糞便又は腸内容物における微生物の存在量;
(ii)前記対象の糞便又は腸内容物におけるゲノムパスウェイのスコア;
(iii)前記対象の血液、血清又は血漿における代謝産物の存在量;
(iv)前記対象の血液、血清又は血漿における遺伝子の発現量;及び
(v)前記対象におけるIL6R及びNLRC5からなる群から1又は複数選択される遺伝子の一塩基多型(SNP)
からなる群から1又は複数選択される値又はSNPの有無を決定するステップ、
(2)前記ステップ(1)で得られる値又はSNPの有無を指標として、前記対象における免疫チェックポイント阻害剤に対する応答を予測するステップ
を含み、
前記微生物が、Geobacillus属、Gordonibacter属、Odoribacter属、Veillonella属、Corynebacterium属、Porphyromonas属、及びArthrobacter属からなる群から1又は複数選択される微生物であり、
前記ゲノムパスウェイが、上皮細胞における細菌侵入(Bacterial invasion of epithelial cells)、脂肪酸の分解(Fatty acid degradation)、鞭毛集合(Flagellar assembly)、脂肪酸の生合成(Fatty acid biosynthesis)、PPARシグナルパスウェイ(PPAR signaling pathway)、ペプチドグリカンの生合成(Peptidoglycan biosynthesis)、ヌクレオチド代謝(Nucleotide metabolism)、プリン代謝(Purine metabolism)、フェニルアラニン代謝(Phenylalanine metabolism)及び脂肪酸の代謝(Fatty acid metabolism)からなる群から1又は複数選択されるゲノムパスウェイであり、
前記代謝産物が、乳酸、ピルビン酸、グルコース、2-オキソ酪酸、グリセリン酸、オクタン酸、シトルリン、2-ヒドロキシ酪酸及びピペコリン酸からなる群から1又は複数選択される代謝産物であり、
前記遺伝子が、MAPKパスウェイ、Type I IFN receptor complexパスウェイ、及びTCRシグナルパスウェイに関連する遺伝子、並びにBCL11B、ERCC3、ERCC6、FCRL1、FCRL3、MS4A1及びTCF7からなる群から1又は複数選択される遺伝子であり、
前記SNPが、以下のrs番号:rs2228145.1;rs7190199;及びrs7185320からなる群から1又は複数選択されるSNPである、
方法。
[2] 前記ステップ(1)が、(i)前記対象の糞便又は腸内容物における微生物の存在量を決定するステップである、項目1に記載の方法。
[3] 前記Geobacillus属、前記Gordonibacter属、及び/又は前記Veillonella属の微生物の存在量が、所定の閾値より高い場合、並びに/あるいは、
前記Odoribacter属の微生物の存在量が、所定の閾値より低い場合は、前記対象における免疫チェックポイント阻害剤に対する応答が良好であると予測する、項目1又は2に記載の方法。
[4] 前記Veillonella属の微生物の存在量が、所定の閾値より高い場合、並びに/あるいは、
前記Odoribacter属の微生物の存在量が、所定の閾値より低い場合は、前記対象における免疫チェックポイント阻害剤に対する応答が良好であると予測する、項目1又は2に記載の方法。
[5] 前記Geobacillus属、前記Gordonibacter属、及び/又は前記Veillonella属の微生物の存在量が所定の閾値より低い場合、並びに/あるいは、
前記Odoribacter属の微生物の存在量が所定の閾値より高い場合は、前記対象における免疫チェックポイント阻害剤に対する応答が不良であると予測する、項目1又は2に記載の方法。
[6] 前記Veillonella属の微生物の存在量が所定の閾値より低い場合、並びに/あるいは、
前記Odoribacter属の微生物の存在量が所定の閾値より高い場合は、前記対象における免疫チェックポイント阻害剤に対する応答が不良であると予測する、項目1又は2に記載の方法。
[7] 前記Arthrobacter属の微生物の存在量が所定の閾値より高い場合は、前記対象において、免疫チェックポイント阻害剤により皮膚の有害事象を誘発すると予測する、項目1又は2に記載の方法。
[8] 前記微生物の存在量が、メタゲノム解析によって決定される、項目1~6のいずれか1項に記載の方法。
[9] 前記ステップ(1)が、(ii)前記対象の糞便又は腸内容物におけるゲノムパスウェイのスコアを決定するステップである、項目1に記載の方法。
[10] 前記上皮細胞における細菌侵入(Bacterial invasion of epithelial cells)、前記脂肪酸の分解(Fatty acid degradation)、前記鞭毛集合(Flagellar assembly)、前記PPARシグナルパスウェイ(PPAR signaling pathway)及び/又は前記フェニルアラニン代謝(Phenylalanine metabolism)のスコアが、所定の閾値より低い場合、並びに/あるいは、
前記脂肪酸の生合成(Fatty acid biosynthesis)、前記ヌクレオチド代謝(Nucleotide metabolism)及び/又は前記ペプチドグリカンの生合成(Peptidoglycan biosynthesis)のスコアが、所定の閾値より高い場合は、前記対象における免疫チェックポイント阻害剤に対する応答が良好であると予測する、項目1又は9に記載の方法。
[11] 前記上皮細胞における細菌侵入(Bacterial invasion of epithelial cells)及び/又は前記フェニルアラニン代謝(Phenylalanine metabolism)のスコアが、所定の閾値より低い場合、並びに/あるいは、
前記ヌクレオチド代謝(Nucleotide metabolism)及び/又は前記ペプチドグリカンの生合成(Peptidoglycan biosynthesis)のスコアが、所定の閾値より高い場合は、前記対象における免疫チェックポイント阻害剤に対する応答が良好であると予測する、項目1又は9に記載の方法。
[12] 前記上皮細胞における細菌侵入(Bacterial invasion of epithelial cells)、前記脂肪酸の分解(Fatty acid degradation)、前記鞭毛集合(Flagellar assembly)、前記PPARシグナルパスウェイ(PPAR signaling pathway)及び/又は前記フェニルアラニン代謝(Phenylalanine metabolism)のスコアが、所定の閾値より高い場合、並びに/あるいは、
前記脂肪酸の生合成(Fatty acid biosynthesis)、前記ヌクレオチド代謝(Nucleotide metabolism)及び/又は前記ペプチドグリカンの生合成(Peptidoglycan biosynthesis)のスコアが、所定の閾値より低い場合は、前記対象における免疫チェックポイント阻害剤に対する応答が不良であると予測する、項目1又は9に記載の方法。
[13] 前記上皮細胞における細菌侵入(Bacterial invasion of epithelial cells)及び/又は前記フェニルアラニン代謝(Phenylalanine metabolism)のスコアが、所定の閾値より高い場合、並びに/あるいは、
前記ヌクレオチド代謝(Nucleotide metabolism)及び/又は前記ペプチドグリカンの生合成(Peptidoglycan biosynthesis)のスコアが、所定の閾値より低い場合は、前記対象における免疫チェックポイント阻害剤に対する応答が不良であると予測する、項目1又は9に記載の方法。
[14] 前記脂肪酸の代謝(Fatty acid metabolism)のスコアが、所定の閾値より高い場合は、前記対象において、免疫チェックポイント阻害剤により皮膚の有害事象を誘発すると予測する、項目1又は9に記載の方法。
[15] 前記ゲノムパスウェイのスコアが、メタゲノム解析によって決定される、項目1及び9~14のいずれか1項に記載の方法。
[16] 前記ステップ(1)が、(iii)前記対象の血液、血清又は血漿における代謝産物の存在量を決定するステップである、項目1に記載の方法。
[17] 前記乳酸、前記ピルビン酸、前記グルコース、前記グリセリン酸、前記オクタン酸、前記2-ヒドロキシ酪酸及び/又は前記2-オキソ酪酸の存在量が所定の閾値より低い場合、並びに/あるいは、
前記ピペコリン酸及び/又は前記シトルリンの存在量が所定の閾値より高い場合は、前記対象における免疫チェックポイント阻害剤に対する応答が良好であると予測する、項目1又は16に記載の方法。
[18] 前記乳酸、前記ピルビン酸、前記グルコース、前記グリセリン酸、前記オクタン酸、前記2-ヒドロキシ酪酸及び/又は前記2-オキソ酪酸の存在量が所定の閾値より高い場合、並びに/あるいは、
前記ピペコリン酸及び/又は前記シトルリンの存在量が所定の閾値より低い場合は、前記対象における免疫チェックポイント阻害剤に対する応答が不良であると予測する、項目1又は16に記載の方法。
[19] 前記代謝産物の存在量が、メタボローム解析によって決定される、項目1及び16~18のいずれか一項に記載の方法。
[20] 前記ステップ(1)が、(iv)前記対象の血液、血清又は血漿における遺伝子の発現量を決定するステップである、項目1に記載の方法。
[21] 前記MAPKパスウェイ、前記Type I IFN receptor complexパスウェイ、及び前記TCRシグナルパスウェイに関連する遺伝子からなる群から1又は複数選択されるパスウェイに関連する遺伝子の発現量が、所定の閾値より高い場合、あるいは
前記BCL11B、前記ERCC3、前記ERCC6、前記FCRL1、前記FCRL3、前記MS4A1及び前記TCF7からなる群から1又は複数選択される遺伝子の発現量が、所定の閾値より高い場合は、前記対象における免疫チェックポイント阻害剤に対する応答が良好であると予測する、項目1又は20に記載の方法。
[22] 前記MAPKパスウェイ、前記Type I IFN receptor complexパスウェイ、及び前記TCRシグナルパスウェイに関連する遺伝子からなる群から1又は複数選択されるパスウェイに関連する遺伝子の発現量が、所定の閾値より低い場合、あるいは
前記BCL11B、前記ERCC3、前記ERCC6、前記FCRL1、前記FCRL3、前記MS4A1及び前記TCF7からなる群から1又は複数選択される遺伝子の発現量が、所定の閾値より低い場合は、前記対象における免疫チェックポイント阻害剤に対する応答が不良であると予測する、項目1又は20に記載の方法。
[23] 前記遺伝子の発現量が、トランスクリプトーム解析によって決定される、項目20~22のいずれか一項に記載の方法。
[24] 前記ステップ(1)が、(v)前記対象における前記IL6R及び前記NLRC5からなる群から1又は複数選択される遺伝子の一塩基多型(SNP)の有無を決定するステップである、項目1に記載の方法。
[25] 前記SNPを有する場合は、前記対象において、免疫チェックポイント阻害剤により皮膚の有害事象を誘発すると予測する、項目1又は24に記載の方法。
[26] 前記癌が胃癌である、項目1~25のいずれか一項に記載の方法。
[27] 前記免疫チェックポイント阻害剤が、CTLA-4、PD-1、PD-L1、PD-L2、LAG-3、TIM3、BTLA、B7H3、B7H4、2B4、CD160、A2aR、KIR、VISTA、IDO1、Arginase I、TIGIT、およびCD115からなる群から選択される免疫チェックポイント分子の阻害剤である、項目1~26のいずれか一項に記載の方法。
[28] 前記免疫チェックポイント阻害剤が、抗PD-1抗体である、項目1~26のいずれか一項に記載の方法。 [1] A method for predicting the response to an immune checkpoint inhibitor in a subject suffering from cancer.
(1) Below:
(I) Abundance of microorganisms in the feces or intestinal contents of the subject;
(Ii) Genomic pathway score in the fecal or intestinal contents of the subject;
(Iii) Abundance of metabolites in the blood, serum or plasma of the subject;
(Iv) Gene expression levels in the subject's blood, serum or plasma; and (v) Single nucleotide polymorphisms (SNPs) of one or more genes selected from the group consisting of IL6R and NLRC5 in the subject.
A step of determining the presence or absence of one or more selected values or SNPs from a group consisting of
(2) Including the step of predicting the response to the immune checkpoint inhibitor in the subject by using the value obtained in the step (1) or the presence or absence of SNP as an index.
The microorganism is one or more selected from the group consisting of the genus Geobacillus, the genus Gordonibacter, the genus Odoribacter, the genus Veillonella, the genus Corynebacterium, the genus Polychromonas, and the genus Arthrobacter.
The genomic pathways include bacterial invasion of epithelial cells, fatty acid metabolism, flagellar metabolism, fatty acid biosynthesis (Fatty acid metabolism), fatty acid biosynthesis (Fatty acid metabolism), and fatty acid biosynthesis (Fatty acid metabolism). pathway), peptide glycan biosynthesis (Peptidoglycan biosynthesis), nucleotide metabolism (Nucleotide metabolism), purine metabolism (Purine metabolism), phenylalanine metabolism (Phenylalanine metabolism) It is a metabolic pathway,
The metabolite is one or more selected metabolites from the group consisting of lactic acid, pyruvic acid, glucose, 2-oxobutyric acid, glyceric acid, octanoic acid, citrulin, 2-hydroxybutyric acid and pipecholinic acid.
The gene is one or more selected from the group consisting of MAPK pathway, Type I IFN receptor complex pathway, TCR signal pathway-related gene, and BCL11B, ERCC3, ERCC6, FCRL1, FCRL3, MS4A1 and TCF7. ,
The SNP is one or a plurality of SNPs selected from the group consisting of the following rs numbers: rs2228145.1; rs71900199; and rs7185320.
Method.
[2] The method according toitem 1, wherein the step (1) is (i) a step of determining the abundance of microorganisms in the feces or intestinal contents of the subject.
[3] When the abundance of the microorganisms of the genus Geobacillus, the genus Geobacter, and / or the genus Veillonella is higher than a predetermined threshold value, and / or
The method according to item 1 or 2, wherein when the abundance of the microorganism of the genus Odoribacter is lower than a predetermined threshold value, the response to the immune checkpoint inhibitor in the subject is predicted to be good.
[4] When the abundance of the microorganism of the genus Veillonella is higher than a predetermined threshold value, and / or
The method according to item 1 or 2, wherein when the abundance of the microorganism of the genus Odoribacter is lower than a predetermined threshold value, the response to the immune checkpoint inhibitor in the subject is predicted to be good.
[5] When the abundance of the microorganisms of the genus Geobacillus, the genus Geobacter, and / or the genus Veillonella is lower than a predetermined threshold value, and / or.
The method according to item 1 or 2, wherein when the abundance of the microorganism of the genus Odoribacter is higher than a predetermined threshold value, the response to the immune checkpoint inhibitor in the subject is predicted to be poor.
[6] When the abundance of the microorganism of the genus Veillonella is lower than a predetermined threshold value, and / or
The method according to item 1 or 2, wherein when the abundance of the microorganism of the genus Odoribacter is higher than a predetermined threshold value, the response to the immune checkpoint inhibitor in the subject is predicted to be poor.
[7] The method according to item 1 or 2, wherein when the abundance of the microorganism belonging to the genus Arthrobacter is higher than a predetermined threshold value, an immune checkpoint inhibitor is predicted to induce an adverse skin event in the subject.
[8] The method according to any one ofitems 1 to 6, wherein the abundance of the microorganism is determined by metagenomic analysis.
[9] The method ofitem 1, wherein step (1) is (ii) a step of determining a genomic pathway score in the fecal or intestinal content of the subject.
[10] Bacterial invasion of epithelial cells, Fatty acid degradation, Flagellal assessment, PPAR signal pathway or PPAR signing If the score of (Phenylaline metabolism) is lower than a predetermined threshold, and / or
If the scores of Fatty acid biosynthesis, Nucleotide metabolism and / or Peptidoglycan biosynthesis are higher than a predetermined threshold, the immunocheck point in the subject. The method of item 1 or 9, wherein the response to is predicted to be good.
[11] When the score of bacterial invasion of epithelial cells and / or the phenylalanine metabolism in the epithelial cells is lower than a predetermined threshold, and / or,
When the score of the nucleotide metabolism (Nucleotide metabolism) and / or the biosynthesis of the peptidoglycan (Peptidoglycan biosynthesis) is higher than a predetermined threshold value, the response to the immune checkpoint inhibitor in the subject is predicted to be good. The method according to 1 or 9.
[12] Bacterial invasion of epithelial cells, Fatty acid degradation, Flagellal assessment, PPAR signal pathway or PPAR signing If the score of (Phylenaline metabolism) is higher than a predetermined threshold, and / or
If the scores of Fatty acid biosynthesis, Nucleotide metabolism and / or Peptidoglycan biosynthesis are lower than a predetermined threshold, the immune check point in the subject. The method of item 1 or 9, wherein the response to is predicted to be poor.
[13] When the score of bacterial invasion of epithelial cells and / or the phenylalanine metabolism in the epithelial cells is higher than a predetermined threshold, and / or,
If the score of the nucleotide metabolism (Nucleotide metabolism) and / or the biosynthesis of the peptidoglycan (Peptidoglycan biosynthesis) is lower than a predetermined threshold value, the response to the immune checkpoint inhibitor in the subject is predicted to be poor. The method according to 1 or 9.
[14] Item 1 or 9, wherein when the fatty acid metabolism score is higher than a predetermined threshold value, an immune checkpoint inhibitor is predicted to induce a skin adverse event in the subject. the method of.
[15] The method according to any one of items 1 and 9 to 14, wherein the score of the genomic pathway is determined by metagenomic analysis.
[16] The method according toitem 1, wherein step (1) is (iii) a step of determining the abundance of metabolites in the blood, serum or plasma of the subject.
[17] When the abundance of the lactic acid, the pyruvic acid, the glucose, the glyceric acid, the octanic acid, the 2-hydroxybutyric acid and / or the 2-oxobutyric acid is lower than a predetermined threshold value, and / or.
The method according to item 1 or 16, wherein when the abundance of pipecolic acid and / or citrulline is higher than a predetermined threshold value, the response to the immune checkpoint inhibitor in the subject is predicted to be good.
[18] When the abundance of the lactic acid, the pyruvic acid, the glucose, the glyceric acid, the octanic acid, the 2-hydroxybutyric acid and / or the 2-oxobutyric acid is higher than a predetermined threshold value, and / or.
The method of item 1 or 16, wherein if the abundance of pipecolic acid and / or citrulline is below a predetermined threshold, the response to the immune checkpoint inhibitor in the subject is predicted to be poor.
[19] The method according to any one of items 1 and 16 to 18, wherein the abundance of the metabolite is determined by metabolome analysis.
[20] The method according toitem 1, wherein the step (1) is (iv) a step of determining the expression level of the gene in the blood, serum or plasma of the subject.
[21] When the expression level of the gene related to the pathway selected one or more from the group consisting of the MAPK pathway, the Type I IFN receptor complex pathway, and the gene related to the TCR signal pathway is higher than a predetermined threshold. Or, if the expression level of one or more genes selected from the group consisting of BCL11B, ERCC3, ERCC6, FCRL1, FCRL3, MS4A1 and TCF7 is higher than a predetermined threshold, immunity in the subject. The method of item 1 or 20, wherein the response to the checkpoint inhibitor is predicted to be good.
[22] When the expression level of the gene related to the pathway selected one or more from the group consisting of the MAPK pathway, the Type I IFN receptor complex pathway, and the gene related to the TCR signal pathway is lower than a predetermined threshold value. Or, if the expression level of one or more genes selected from the group consisting of BCL11B, ERCC3, ERCC6, FCRL1, FCRL3, MS4A1 and TCF7 is lower than a predetermined threshold, immunity in the subject. The method of item 1 or 20, wherein the response to the checkpoint inhibitor is predicted to be poor.
[23] The method according to any one ofitems 20 to 22, wherein the expression level of the gene is determined by transcriptome analysis.
[24] The item (1) is a step of (v) determining the presence or absence of a single nucleotide polymorphism (SNP) of one or a plurality of genes selected from the group consisting of the IL6R and the NLRC5 in the subject. The method according to 1.
[25] The method according to item 1 or 24, wherein if the SNP is present, the immune checkpoint inhibitor is predicted to induce an adverse skin event in the subject.
[26] The method according to any one ofitems 1 to 25, wherein the cancer is gastric cancer.
[27] The immune checkpoint inhibitors are CTLA-4, PD-1, PD-L1, PD-L2, LAG-3, TIM3, BTLA, B7H3, B7H4, 2B4, CD160, A2aR, KIR, VISTA, IDO1. , Arginase I, TIGIT, and the method of any one of items 1-26, which is an inhibitor of an immune checkpoint molecule selected from the group consisting of CD115.
[28] The method according to any one ofitems 1 to 26, wherein the immune checkpoint inhibitor is an anti-PD-1 antibody.
(1)以下:
(i)前記対象の糞便又は腸内容物における微生物の存在量;
(ii)前記対象の糞便又は腸内容物におけるゲノムパスウェイのスコア;
(iii)前記対象の血液、血清又は血漿における代謝産物の存在量;
(iv)前記対象の血液、血清又は血漿における遺伝子の発現量;及び
(v)前記対象におけるIL6R及びNLRC5からなる群から1又は複数選択される遺伝子の一塩基多型(SNP)
からなる群から1又は複数選択される値又はSNPの有無を決定するステップ、
(2)前記ステップ(1)で得られる値又はSNPの有無を指標として、前記対象における免疫チェックポイント阻害剤に対する応答を予測するステップ
を含み、
前記微生物が、Geobacillus属、Gordonibacter属、Odoribacter属、Veillonella属、Corynebacterium属、Porphyromonas属、及びArthrobacter属からなる群から1又は複数選択される微生物であり、
前記ゲノムパスウェイが、上皮細胞における細菌侵入(Bacterial invasion of epithelial cells)、脂肪酸の分解(Fatty acid degradation)、鞭毛集合(Flagellar assembly)、脂肪酸の生合成(Fatty acid biosynthesis)、PPARシグナルパスウェイ(PPAR signaling pathway)、ペプチドグリカンの生合成(Peptidoglycan biosynthesis)、ヌクレオチド代謝(Nucleotide metabolism)、プリン代謝(Purine metabolism)、フェニルアラニン代謝(Phenylalanine metabolism)及び脂肪酸の代謝(Fatty acid metabolism)からなる群から1又は複数選択されるゲノムパスウェイであり、
前記代謝産物が、乳酸、ピルビン酸、グルコース、2-オキソ酪酸、グリセリン酸、オクタン酸、シトルリン、2-ヒドロキシ酪酸及びピペコリン酸からなる群から1又は複数選択される代謝産物であり、
前記遺伝子が、MAPKパスウェイ、Type I IFN receptor complexパスウェイ、及びTCRシグナルパスウェイに関連する遺伝子、並びにBCL11B、ERCC3、ERCC6、FCRL1、FCRL3、MS4A1及びTCF7からなる群から1又は複数選択される遺伝子であり、
前記SNPが、以下のrs番号:rs2228145.1;rs7190199;及びrs7185320からなる群から1又は複数選択されるSNPである、
方法。
[2] 前記ステップ(1)が、(i)前記対象の糞便又は腸内容物における微生物の存在量を決定するステップである、項目1に記載の方法。
[3] 前記Geobacillus属、前記Gordonibacter属、及び/又は前記Veillonella属の微生物の存在量が、所定の閾値より高い場合、並びに/あるいは、
前記Odoribacter属の微生物の存在量が、所定の閾値より低い場合は、前記対象における免疫チェックポイント阻害剤に対する応答が良好であると予測する、項目1又は2に記載の方法。
[4] 前記Veillonella属の微生物の存在量が、所定の閾値より高い場合、並びに/あるいは、
前記Odoribacter属の微生物の存在量が、所定の閾値より低い場合は、前記対象における免疫チェックポイント阻害剤に対する応答が良好であると予測する、項目1又は2に記載の方法。
[5] 前記Geobacillus属、前記Gordonibacter属、及び/又は前記Veillonella属の微生物の存在量が所定の閾値より低い場合、並びに/あるいは、
前記Odoribacter属の微生物の存在量が所定の閾値より高い場合は、前記対象における免疫チェックポイント阻害剤に対する応答が不良であると予測する、項目1又は2に記載の方法。
[6] 前記Veillonella属の微生物の存在量が所定の閾値より低い場合、並びに/あるいは、
前記Odoribacter属の微生物の存在量が所定の閾値より高い場合は、前記対象における免疫チェックポイント阻害剤に対する応答が不良であると予測する、項目1又は2に記載の方法。
[7] 前記Arthrobacter属の微生物の存在量が所定の閾値より高い場合は、前記対象において、免疫チェックポイント阻害剤により皮膚の有害事象を誘発すると予測する、項目1又は2に記載の方法。
[8] 前記微生物の存在量が、メタゲノム解析によって決定される、項目1~6のいずれか1項に記載の方法。
[9] 前記ステップ(1)が、(ii)前記対象の糞便又は腸内容物におけるゲノムパスウェイのスコアを決定するステップである、項目1に記載の方法。
[10] 前記上皮細胞における細菌侵入(Bacterial invasion of epithelial cells)、前記脂肪酸の分解(Fatty acid degradation)、前記鞭毛集合(Flagellar assembly)、前記PPARシグナルパスウェイ(PPAR signaling pathway)及び/又は前記フェニルアラニン代謝(Phenylalanine metabolism)のスコアが、所定の閾値より低い場合、並びに/あるいは、
前記脂肪酸の生合成(Fatty acid biosynthesis)、前記ヌクレオチド代謝(Nucleotide metabolism)及び/又は前記ペプチドグリカンの生合成(Peptidoglycan biosynthesis)のスコアが、所定の閾値より高い場合は、前記対象における免疫チェックポイント阻害剤に対する応答が良好であると予測する、項目1又は9に記載の方法。
[11] 前記上皮細胞における細菌侵入(Bacterial invasion of epithelial cells)及び/又は前記フェニルアラニン代謝(Phenylalanine metabolism)のスコアが、所定の閾値より低い場合、並びに/あるいは、
前記ヌクレオチド代謝(Nucleotide metabolism)及び/又は前記ペプチドグリカンの生合成(Peptidoglycan biosynthesis)のスコアが、所定の閾値より高い場合は、前記対象における免疫チェックポイント阻害剤に対する応答が良好であると予測する、項目1又は9に記載の方法。
[12] 前記上皮細胞における細菌侵入(Bacterial invasion of epithelial cells)、前記脂肪酸の分解(Fatty acid degradation)、前記鞭毛集合(Flagellar assembly)、前記PPARシグナルパスウェイ(PPAR signaling pathway)及び/又は前記フェニルアラニン代謝(Phenylalanine metabolism)のスコアが、所定の閾値より高い場合、並びに/あるいは、
前記脂肪酸の生合成(Fatty acid biosynthesis)、前記ヌクレオチド代謝(Nucleotide metabolism)及び/又は前記ペプチドグリカンの生合成(Peptidoglycan biosynthesis)のスコアが、所定の閾値より低い場合は、前記対象における免疫チェックポイント阻害剤に対する応答が不良であると予測する、項目1又は9に記載の方法。
[13] 前記上皮細胞における細菌侵入(Bacterial invasion of epithelial cells)及び/又は前記フェニルアラニン代謝(Phenylalanine metabolism)のスコアが、所定の閾値より高い場合、並びに/あるいは、
前記ヌクレオチド代謝(Nucleotide metabolism)及び/又は前記ペプチドグリカンの生合成(Peptidoglycan biosynthesis)のスコアが、所定の閾値より低い場合は、前記対象における免疫チェックポイント阻害剤に対する応答が不良であると予測する、項目1又は9に記載の方法。
[14] 前記脂肪酸の代謝(Fatty acid metabolism)のスコアが、所定の閾値より高い場合は、前記対象において、免疫チェックポイント阻害剤により皮膚の有害事象を誘発すると予測する、項目1又は9に記載の方法。
[15] 前記ゲノムパスウェイのスコアが、メタゲノム解析によって決定される、項目1及び9~14のいずれか1項に記載の方法。
[16] 前記ステップ(1)が、(iii)前記対象の血液、血清又は血漿における代謝産物の存在量を決定するステップである、項目1に記載の方法。
[17] 前記乳酸、前記ピルビン酸、前記グルコース、前記グリセリン酸、前記オクタン酸、前記2-ヒドロキシ酪酸及び/又は前記2-オキソ酪酸の存在量が所定の閾値より低い場合、並びに/あるいは、
前記ピペコリン酸及び/又は前記シトルリンの存在量が所定の閾値より高い場合は、前記対象における免疫チェックポイント阻害剤に対する応答が良好であると予測する、項目1又は16に記載の方法。
[18] 前記乳酸、前記ピルビン酸、前記グルコース、前記グリセリン酸、前記オクタン酸、前記2-ヒドロキシ酪酸及び/又は前記2-オキソ酪酸の存在量が所定の閾値より高い場合、並びに/あるいは、
前記ピペコリン酸及び/又は前記シトルリンの存在量が所定の閾値より低い場合は、前記対象における免疫チェックポイント阻害剤に対する応答が不良であると予測する、項目1又は16に記載の方法。
[19] 前記代謝産物の存在量が、メタボローム解析によって決定される、項目1及び16~18のいずれか一項に記載の方法。
[20] 前記ステップ(1)が、(iv)前記対象の血液、血清又は血漿における遺伝子の発現量を決定するステップである、項目1に記載の方法。
[21] 前記MAPKパスウェイ、前記Type I IFN receptor complexパスウェイ、及び前記TCRシグナルパスウェイに関連する遺伝子からなる群から1又は複数選択されるパスウェイに関連する遺伝子の発現量が、所定の閾値より高い場合、あるいは
前記BCL11B、前記ERCC3、前記ERCC6、前記FCRL1、前記FCRL3、前記MS4A1及び前記TCF7からなる群から1又は複数選択される遺伝子の発現量が、所定の閾値より高い場合は、前記対象における免疫チェックポイント阻害剤に対する応答が良好であると予測する、項目1又は20に記載の方法。
[22] 前記MAPKパスウェイ、前記Type I IFN receptor complexパスウェイ、及び前記TCRシグナルパスウェイに関連する遺伝子からなる群から1又は複数選択されるパスウェイに関連する遺伝子の発現量が、所定の閾値より低い場合、あるいは
前記BCL11B、前記ERCC3、前記ERCC6、前記FCRL1、前記FCRL3、前記MS4A1及び前記TCF7からなる群から1又は複数選択される遺伝子の発現量が、所定の閾値より低い場合は、前記対象における免疫チェックポイント阻害剤に対する応答が不良であると予測する、項目1又は20に記載の方法。
[23] 前記遺伝子の発現量が、トランスクリプトーム解析によって決定される、項目20~22のいずれか一項に記載の方法。
[24] 前記ステップ(1)が、(v)前記対象における前記IL6R及び前記NLRC5からなる群から1又は複数選択される遺伝子の一塩基多型(SNP)の有無を決定するステップである、項目1に記載の方法。
[25] 前記SNPを有する場合は、前記対象において、免疫チェックポイント阻害剤により皮膚の有害事象を誘発すると予測する、項目1又は24に記載の方法。
[26] 前記癌が胃癌である、項目1~25のいずれか一項に記載の方法。
[27] 前記免疫チェックポイント阻害剤が、CTLA-4、PD-1、PD-L1、PD-L2、LAG-3、TIM3、BTLA、B7H3、B7H4、2B4、CD160、A2aR、KIR、VISTA、IDO1、Arginase I、TIGIT、およびCD115からなる群から選択される免疫チェックポイント分子の阻害剤である、項目1~26のいずれか一項に記載の方法。
[28] 前記免疫チェックポイント阻害剤が、抗PD-1抗体である、項目1~26のいずれか一項に記載の方法。 [1] A method for predicting the response to an immune checkpoint inhibitor in a subject suffering from cancer.
(1) Below:
(I) Abundance of microorganisms in the feces or intestinal contents of the subject;
(Ii) Genomic pathway score in the fecal or intestinal contents of the subject;
(Iii) Abundance of metabolites in the blood, serum or plasma of the subject;
(Iv) Gene expression levels in the subject's blood, serum or plasma; and (v) Single nucleotide polymorphisms (SNPs) of one or more genes selected from the group consisting of IL6R and NLRC5 in the subject.
A step of determining the presence or absence of one or more selected values or SNPs from a group consisting of
(2) Including the step of predicting the response to the immune checkpoint inhibitor in the subject by using the value obtained in the step (1) or the presence or absence of SNP as an index.
The microorganism is one or more selected from the group consisting of the genus Geobacillus, the genus Gordonibacter, the genus Odoribacter, the genus Veillonella, the genus Corynebacterium, the genus Polychromonas, and the genus Arthrobacter.
The genomic pathways include bacterial invasion of epithelial cells, fatty acid metabolism, flagellar metabolism, fatty acid biosynthesis (Fatty acid metabolism), fatty acid biosynthesis (Fatty acid metabolism), and fatty acid biosynthesis (Fatty acid metabolism). pathway), peptide glycan biosynthesis (Peptidoglycan biosynthesis), nucleotide metabolism (Nucleotide metabolism), purine metabolism (Purine metabolism), phenylalanine metabolism (Phenylalanine metabolism) It is a metabolic pathway,
The metabolite is one or more selected metabolites from the group consisting of lactic acid, pyruvic acid, glucose, 2-oxobutyric acid, glyceric acid, octanoic acid, citrulin, 2-hydroxybutyric acid and pipecholinic acid.
The gene is one or more selected from the group consisting of MAPK pathway, Type I IFN receptor complex pathway, TCR signal pathway-related gene, and BCL11B, ERCC3, ERCC6, FCRL1, FCRL3, MS4A1 and TCF7. ,
The SNP is one or a plurality of SNPs selected from the group consisting of the following rs numbers: rs2228145.1; rs71900199; and rs7185320.
Method.
[2] The method according to
[3] When the abundance of the microorganisms of the genus Geobacillus, the genus Geobacter, and / or the genus Veillonella is higher than a predetermined threshold value, and / or
The method according to
[4] When the abundance of the microorganism of the genus Veillonella is higher than a predetermined threshold value, and / or
The method according to
[5] When the abundance of the microorganisms of the genus Geobacillus, the genus Geobacter, and / or the genus Veillonella is lower than a predetermined threshold value, and / or.
The method according to
[6] When the abundance of the microorganism of the genus Veillonella is lower than a predetermined threshold value, and / or
The method according to
[7] The method according to
[8] The method according to any one of
[9] The method of
[10] Bacterial invasion of epithelial cells, Fatty acid degradation, Flagellal assessment, PPAR signal pathway or PPAR signing If the score of (Phenylaline metabolism) is lower than a predetermined threshold, and / or
If the scores of Fatty acid biosynthesis, Nucleotide metabolism and / or Peptidoglycan biosynthesis are higher than a predetermined threshold, the immunocheck point in the subject. The method of
[11] When the score of bacterial invasion of epithelial cells and / or the phenylalanine metabolism in the epithelial cells is lower than a predetermined threshold, and / or,
When the score of the nucleotide metabolism (Nucleotide metabolism) and / or the biosynthesis of the peptidoglycan (Peptidoglycan biosynthesis) is higher than a predetermined threshold value, the response to the immune checkpoint inhibitor in the subject is predicted to be good. The method according to 1 or 9.
[12] Bacterial invasion of epithelial cells, Fatty acid degradation, Flagellal assessment, PPAR signal pathway or PPAR signing If the score of (Phylenaline metabolism) is higher than a predetermined threshold, and / or
If the scores of Fatty acid biosynthesis, Nucleotide metabolism and / or Peptidoglycan biosynthesis are lower than a predetermined threshold, the immune check point in the subject. The method of
[13] When the score of bacterial invasion of epithelial cells and / or the phenylalanine metabolism in the epithelial cells is higher than a predetermined threshold, and / or,
If the score of the nucleotide metabolism (Nucleotide metabolism) and / or the biosynthesis of the peptidoglycan (Peptidoglycan biosynthesis) is lower than a predetermined threshold value, the response to the immune checkpoint inhibitor in the subject is predicted to be poor. The method according to 1 or 9.
[14]
[15] The method according to any one of
[16] The method according to
[17] When the abundance of the lactic acid, the pyruvic acid, the glucose, the glyceric acid, the octanic acid, the 2-hydroxybutyric acid and / or the 2-oxobutyric acid is lower than a predetermined threshold value, and / or.
The method according to
[18] When the abundance of the lactic acid, the pyruvic acid, the glucose, the glyceric acid, the octanic acid, the 2-hydroxybutyric acid and / or the 2-oxobutyric acid is higher than a predetermined threshold value, and / or.
The method of
[19] The method according to any one of
[20] The method according to
[21] When the expression level of the gene related to the pathway selected one or more from the group consisting of the MAPK pathway, the Type I IFN receptor complex pathway, and the gene related to the TCR signal pathway is higher than a predetermined threshold. Or, if the expression level of one or more genes selected from the group consisting of BCL11B, ERCC3, ERCC6, FCRL1, FCRL3, MS4A1 and TCF7 is higher than a predetermined threshold, immunity in the subject. The method of
[22] When the expression level of the gene related to the pathway selected one or more from the group consisting of the MAPK pathway, the Type I IFN receptor complex pathway, and the gene related to the TCR signal pathway is lower than a predetermined threshold value. Or, if the expression level of one or more genes selected from the group consisting of BCL11B, ERCC3, ERCC6, FCRL1, FCRL3, MS4A1 and TCF7 is lower than a predetermined threshold, immunity in the subject. The method of
[23] The method according to any one of
[24] The item (1) is a step of (v) determining the presence or absence of a single nucleotide polymorphism (SNP) of one or a plurality of genes selected from the group consisting of the IL6R and the NLRC5 in the subject. The method according to 1.
[25] The method according to
[26] The method according to any one of
[27] The immune checkpoint inhibitors are CTLA-4, PD-1, PD-L1, PD-L2, LAG-3, TIM3, BTLA, B7H3, B7H4, 2B4, CD160, A2aR, KIR, VISTA, IDO1. , Arginase I, TIGIT, and the method of any one of items 1-26, which is an inhibitor of an immune checkpoint molecule selected from the group consisting of CD115.
[28] The method according to any one of
[29] 前記項目1~28のいずれか一項に記載の方法により免疫チェックポイント阻害剤に対する応答が良好と判定(予測)された癌を罹患する対象(癌患者)に投与されることを特徴とする、免疫チェックポイント阻害剤を含有するがん治療剤。
[30](i)Geobacillus属、Gordonibacter属、及び/又はVeillonella属の微生物の存在量が所定の閾値より高い、並びに/あるいは、Odoribacter属の微生物の存在量が所定の閾値より低い、癌を罹患する対象に投与することを特徴とする(好ましくは、Veillonella属の微生物の存在量が、所定の閾値より高い、並びに/あるいは、Odoribacter属の微生物の存在量が、所定の閾値より低い、癌を罹患する対象に投与することを特徴とする);
(ii)上皮細胞における細菌侵入(Bacterial invasion of epithelial cells)、脂肪酸の分解(Fatty acid degradation)、鞭毛集合(Flagellar assembly)、PPARシグナルパスウェイ(PPAR signaling pathway)及び/又はフェニルアラニン代謝(Phenylalanine metabolism)のスコアが、所定の閾値より低い、並びに/あるいは、脂肪酸の生合成(Fatty acid biosynthesis)、ヌクレオチド代謝(Nucleotide metabolism)及び/又はペプチドグリカンの生合成(Peptidoglycan biosynthesis)のスコアが、所定の閾値より高い、癌を罹患する対象に投与することを特徴とする(好ましくは、上皮細胞における細菌侵入(Bacterial invasion of epithelial cells)のスコアが、所定の閾値より低い癌を罹患する対象に投与することを特徴とする);
(iii)乳酸、ピルビン酸、グルコース、グリセリン酸、オクタン酸、2-ヒドロキシ酪酸及び/又は2-オキソ酪酸の存在量が所定の閾値より低い、並びに/あるいは、ピペコリン酸及び/又はシトルリンの存在量が所定の閾値より高い、癌を罹患する対象に投与することを特徴とする;並びに/あるいは
(iv)MAPKパスウェイ、Type I IFN receptor complexパスウェイ、及びTCRシグナルパスウェイに関連する遺伝子からなる群から1又は複数選択されるパスウェイに関連する遺伝子の発現量が、所定の閾値より高い、及び/又は、BCL11B、ERCC3、ERCC6、FCRL1、FCRL3、MS4A1及びTCF7からなる群から1又は複数選択される遺伝子の発現量が、所定の閾値より高い、癌を罹患する対象に投与することを特徴とする、
免疫チェックポイント阻害剤を含有するがん治療剤。
[31]Geobacillus属、Gordonibacter属、及び/又はVeillonella属の微生物の存在量が所定の閾値より高い、並びに/あるいは、Odoribacter属の微生物の存在量が所定の閾値より低い癌を罹患する対象に投与することを特徴とする(好ましくは、Veillonella属の微生物の存在量が、所定の閾値より高い、並びに/あるいは、Odoribacter属の微生物の存在量が、所定の閾値より低い癌を罹患する対象に投与することを特徴とする)、免疫チェックポイント阻害剤を含有するがん治療剤。
[32]上皮細胞における細菌侵入(Bacterial invasion of epithelial cells)、前記脂肪酸の分解(Fatty acid degradation)、前記鞭毛集合(Flagellar assembly)、PPARシグナルパスウェイ(PPAR signaling pathway)及び/又はフェニルアラニン代謝(Phenylalanine metabolism)のスコアが、所定の閾値より低い、並びに/あるいは、脂肪酸の生合成(Fatty acid biosynthesis)、ヌクレオチド代謝(Nucleotide metabolism)及び/又はペプチドグリカンの生合成(Peptidoglycan biosynthesis)のスコアが、所定の閾値より高い、癌を罹患する対象に投与することを特徴とする(好ましくは、上皮細胞における細菌侵入(Bacterial invasion of epithelial cells)のスコアが、所定の閾値より低い癌を罹患する対象に投与することを特徴とする)、免疫チェックポイント阻害剤を含有するがん治療剤。
[33]乳酸、ピルビン酸、グルコース、グリセリン酸、オクタン酸、2-ヒドロキシ酪酸及び/又は2-オキソ酪酸の存在量が所定の閾値より低い、並びに/あるいは、ピペコリン酸及び/又はシトルリンの存在量が所定の閾値より高い癌を罹患する対象に投与することを特徴とする、免疫チェックポイント阻害剤を含有するがん治療剤。 [29] It is characterized in that it is administered to a subject (cancer patient) suffering from cancer whose response to an immune checkpoint inhibitor is determined (predicted) to be good by the method according to any one ofitems 1 to 28. A cancer therapeutic agent containing an immune checkpoint inhibitor.
[30] (i) suffering from cancer in which the abundance of microorganisms of the genus Geobacillus, Gordonibacter, and / or Veillonella is higher than a predetermined threshold, and / or the abundance of microorganisms of the genus Odoribacter is lower than a predetermined threshold. The cancer is characterized by administration to a subject (preferably, the abundance of Veillonella microorganisms is higher than a predetermined threshold, and / or the abundance of Geobacter microorganisms is lower than a predetermined threshold. It is characterized by administration to affected subjects);
(Ii) Bacterial invasion of epithelial cells, fatty acid degradation, Fragellar assembly, PPAR signal pathway (PPAR signaling gene) Scores below a predetermined threshold and / or scores for fatty acid biosynthesis, Nucleotide metabolism and / or peptide glycan biosynthesis are higher than a predetermined threshold. It is characterized by administration to a subject suffering from cancer (preferably, administration to a subject suffering from cancer having a score of bacterial invasion of epithelial cells in epithelial cells lower than a predetermined threshold. do);
(Iii) The abundance of lactic acid, pyruvate, glucose, glyceric acid, octanoic acid, 2-hydroxybutyric acid and / or 2-oxobutyric acid is below a predetermined threshold, and / or the abundance of pipecholinic acid and / or citrulin. Is administered to a subject suffering from cancer above a predetermined threshold; and / or from the group consisting of genes associated with the (iv) MAPK pathway, the Type I IFN receptor complex pathway, and the TCR signal pathway. Or the expression level of a gene associated with a plurality of selected pathways is higher than a predetermined threshold, and / or a gene one or more selected from the group consisting of BCL11B, ERCC3, ERCC6, FCRL1, FCRL3, MS4A1 and TCF7. It is characterized in that it is administered to a subject suffering from cancer whose expression level is higher than a predetermined threshold.
A cancer therapeutic agent containing an immune checkpoint inhibitor.
[31] Administered to subjects suffering from cancer in which the abundance of microorganisms of the genus Geobacillus, Gordonibacter, and / or Veillonella is higher than a predetermined threshold and / or the abundance of microorganisms of the genus Odoribacter is lower than a predetermined threshold. (Preferably, the abundance of microorganisms of the genus Geobacillus is higher than a predetermined threshold, and / or the abundance of microorganisms of the genus Geobacter is lower than a predetermined threshold. A cancer therapeutic agent containing an immune checkpoint inhibitor.
[32] Bacterial invasion of epithelial cells, Fatty acid degradation, Flagellar assembly, PPAR signal pathway or PPAR signaline metabolism (PPAR sine) ) Is lower than a predetermined threshold, and / or a fatty acid biosynthesis, a Nucleotide metabolism and / or a peptide glycan biosynthesis score is a predetermined threshold. It is characterized by administration to a subject suffering from cancer having a high score (preferably having a score of bacterial invasion of epithelial cells in epithelial cells lower than a predetermined threshold). A cancer therapeutic agent containing an immune checkpoint inhibitor).
[33] The abundance of lactic acid, pyruvate, glucose, glyceric acid, octanoic acid, 2-hydroxybutyric acid and / or 2-oxobutyric acid is below a predetermined threshold, and / or the abundance of pipecolic acid and / or citrulin. A cancer therapeutic agent comprising an immune checkpoint inhibitor, which is administered to a subject suffering from cancer having a glucose higher than a predetermined threshold.
[30](i)Geobacillus属、Gordonibacter属、及び/又はVeillonella属の微生物の存在量が所定の閾値より高い、並びに/あるいは、Odoribacter属の微生物の存在量が所定の閾値より低い、癌を罹患する対象に投与することを特徴とする(好ましくは、Veillonella属の微生物の存在量が、所定の閾値より高い、並びに/あるいは、Odoribacter属の微生物の存在量が、所定の閾値より低い、癌を罹患する対象に投与することを特徴とする);
(ii)上皮細胞における細菌侵入(Bacterial invasion of epithelial cells)、脂肪酸の分解(Fatty acid degradation)、鞭毛集合(Flagellar assembly)、PPARシグナルパスウェイ(PPAR signaling pathway)及び/又はフェニルアラニン代謝(Phenylalanine metabolism)のスコアが、所定の閾値より低い、並びに/あるいは、脂肪酸の生合成(Fatty acid biosynthesis)、ヌクレオチド代謝(Nucleotide metabolism)及び/又はペプチドグリカンの生合成(Peptidoglycan biosynthesis)のスコアが、所定の閾値より高い、癌を罹患する対象に投与することを特徴とする(好ましくは、上皮細胞における細菌侵入(Bacterial invasion of epithelial cells)のスコアが、所定の閾値より低い癌を罹患する対象に投与することを特徴とする);
(iii)乳酸、ピルビン酸、グルコース、グリセリン酸、オクタン酸、2-ヒドロキシ酪酸及び/又は2-オキソ酪酸の存在量が所定の閾値より低い、並びに/あるいは、ピペコリン酸及び/又はシトルリンの存在量が所定の閾値より高い、癌を罹患する対象に投与することを特徴とする;並びに/あるいは
(iv)MAPKパスウェイ、Type I IFN receptor complexパスウェイ、及びTCRシグナルパスウェイに関連する遺伝子からなる群から1又は複数選択されるパスウェイに関連する遺伝子の発現量が、所定の閾値より高い、及び/又は、BCL11B、ERCC3、ERCC6、FCRL1、FCRL3、MS4A1及びTCF7からなる群から1又は複数選択される遺伝子の発現量が、所定の閾値より高い、癌を罹患する対象に投与することを特徴とする、
免疫チェックポイント阻害剤を含有するがん治療剤。
[31]Geobacillus属、Gordonibacter属、及び/又はVeillonella属の微生物の存在量が所定の閾値より高い、並びに/あるいは、Odoribacter属の微生物の存在量が所定の閾値より低い癌を罹患する対象に投与することを特徴とする(好ましくは、Veillonella属の微生物の存在量が、所定の閾値より高い、並びに/あるいは、Odoribacter属の微生物の存在量が、所定の閾値より低い癌を罹患する対象に投与することを特徴とする)、免疫チェックポイント阻害剤を含有するがん治療剤。
[32]上皮細胞における細菌侵入(Bacterial invasion of epithelial cells)、前記脂肪酸の分解(Fatty acid degradation)、前記鞭毛集合(Flagellar assembly)、PPARシグナルパスウェイ(PPAR signaling pathway)及び/又はフェニルアラニン代謝(Phenylalanine metabolism)のスコアが、所定の閾値より低い、並びに/あるいは、脂肪酸の生合成(Fatty acid biosynthesis)、ヌクレオチド代謝(Nucleotide metabolism)及び/又はペプチドグリカンの生合成(Peptidoglycan biosynthesis)のスコアが、所定の閾値より高い、癌を罹患する対象に投与することを特徴とする(好ましくは、上皮細胞における細菌侵入(Bacterial invasion of epithelial cells)のスコアが、所定の閾値より低い癌を罹患する対象に投与することを特徴とする)、免疫チェックポイント阻害剤を含有するがん治療剤。
[33]乳酸、ピルビン酸、グルコース、グリセリン酸、オクタン酸、2-ヒドロキシ酪酸及び/又は2-オキソ酪酸の存在量が所定の閾値より低い、並びに/あるいは、ピペコリン酸及び/又はシトルリンの存在量が所定の閾値より高い癌を罹患する対象に投与することを特徴とする、免疫チェックポイント阻害剤を含有するがん治療剤。 [29] It is characterized in that it is administered to a subject (cancer patient) suffering from cancer whose response to an immune checkpoint inhibitor is determined (predicted) to be good by the method according to any one of
[30] (i) suffering from cancer in which the abundance of microorganisms of the genus Geobacillus, Gordonibacter, and / or Veillonella is higher than a predetermined threshold, and / or the abundance of microorganisms of the genus Odoribacter is lower than a predetermined threshold. The cancer is characterized by administration to a subject (preferably, the abundance of Veillonella microorganisms is higher than a predetermined threshold, and / or the abundance of Geobacter microorganisms is lower than a predetermined threshold. It is characterized by administration to affected subjects);
(Ii) Bacterial invasion of epithelial cells, fatty acid degradation, Fragellar assembly, PPAR signal pathway (PPAR signaling gene) Scores below a predetermined threshold and / or scores for fatty acid biosynthesis, Nucleotide metabolism and / or peptide glycan biosynthesis are higher than a predetermined threshold. It is characterized by administration to a subject suffering from cancer (preferably, administration to a subject suffering from cancer having a score of bacterial invasion of epithelial cells in epithelial cells lower than a predetermined threshold. do);
(Iii) The abundance of lactic acid, pyruvate, glucose, glyceric acid, octanoic acid, 2-hydroxybutyric acid and / or 2-oxobutyric acid is below a predetermined threshold, and / or the abundance of pipecholinic acid and / or citrulin. Is administered to a subject suffering from cancer above a predetermined threshold; and / or from the group consisting of genes associated with the (iv) MAPK pathway, the Type I IFN receptor complex pathway, and the TCR signal pathway. Or the expression level of a gene associated with a plurality of selected pathways is higher than a predetermined threshold, and / or a gene one or more selected from the group consisting of BCL11B, ERCC3, ERCC6, FCRL1, FCRL3, MS4A1 and TCF7. It is characterized in that it is administered to a subject suffering from cancer whose expression level is higher than a predetermined threshold.
A cancer therapeutic agent containing an immune checkpoint inhibitor.
[31] Administered to subjects suffering from cancer in which the abundance of microorganisms of the genus Geobacillus, Gordonibacter, and / or Veillonella is higher than a predetermined threshold and / or the abundance of microorganisms of the genus Odoribacter is lower than a predetermined threshold. (Preferably, the abundance of microorganisms of the genus Geobacillus is higher than a predetermined threshold, and / or the abundance of microorganisms of the genus Geobacter is lower than a predetermined threshold. A cancer therapeutic agent containing an immune checkpoint inhibitor.
[32] Bacterial invasion of epithelial cells, Fatty acid degradation, Flagellar assembly, PPAR signal pathway or PPAR signaline metabolism (PPAR sine) ) Is lower than a predetermined threshold, and / or a fatty acid biosynthesis, a Nucleotide metabolism and / or a peptide glycan biosynthesis score is a predetermined threshold. It is characterized by administration to a subject suffering from cancer having a high score (preferably having a score of bacterial invasion of epithelial cells in epithelial cells lower than a predetermined threshold). A cancer therapeutic agent containing an immune checkpoint inhibitor).
[33] The abundance of lactic acid, pyruvate, glucose, glyceric acid, octanoic acid, 2-hydroxybutyric acid and / or 2-oxobutyric acid is below a predetermined threshold, and / or the abundance of pipecolic acid and / or citrulin. A cancer therapeutic agent comprising an immune checkpoint inhibitor, which is administered to a subject suffering from cancer having a glucose higher than a predetermined threshold.
[34] 癌を罹患する対象を治療する方法であって、
(1)以下:
(i)前記対象の糞便又は腸内容物における微生物の存在量;
(ii)前記対象の糞便又は腸内容物におけるゲノムパスウェイのスコア;
(iii)前記対象の血液、血清又は血漿における代謝産物の存在量;
(iv)前記対象の血液、血清又は血漿における遺伝子の発現量;及び
(v)前記対象におけるIL6R及びNLRC5からなる群から1又は複数選択される遺伝子の一塩基多型(SNP)
からなる群から1又は複数選択される値又はSNPの有無を決定するステップ、
(2)前記ステップ(1)で得られる値又はSNPの有無を指標として、前記対象における免疫チェックポイント阻害剤に対する応答を予測するステップ、
(3)免疫チェックポイント阻害剤に対する応答が良好及び/又は皮膚の有害事象を誘発しないと判定された前記対象に、前記免疫チェックポイント阻害剤を投与する工程、
を含み、
前記微生物が、Geobacillus属、Gordonibacter属、Odoribacter属、Veillonella属、Corynebacterium属、Porphyromonas属、及びArthrobacter属からなる群から1又は複数選択される微生物であり、
前記ゲノムパスウェイが、上皮細胞における細菌侵入(Bacterial invasion of epithelial cells)、脂肪酸の分解(Fatty acid degradation)、鞭毛集合(Flagellar assembly)、脂肪酸の生合成(Fatty acid biosynthesis)、PPARシグナルパスウェイ(PPAR signaling pathway)、ペプチドグリカンの生合成(Peptidoglycan biosynthesis)、ヌクレオチド代謝(Nucleotide metabolism)、プリン代謝(Purine metabolism)、フェニルアラニン代謝(Phenylalanine metabolism)及び脂肪酸の代謝(Fatty acid metabolism)からなる群から1又は複数選択されるゲノムパスウェイであり、
前記代謝産物が、乳酸、ピルビン酸、グルコース、2-オキソ酪酸、グリセリン酸、オクタン酸、シトルリン、2-ヒドロキシ酪酸及びピペコリン酸からなる群から1又は複数選択される代謝産物であり、
前記遺伝子が、MAPKパスウェイ、Type I IFN receptor complexパスウェイ、及びTCRシグナルパスウェイに関連する遺伝子、並びにBCL11B、ERCC3、ERCC6、FCRL1、FCRL3、MS4A1及びTCF7からなる群から1又は複数選択される遺伝子であり、
前記SNPが、以下のrs番号:rs2228145.1;rs7190199;及びrs7185320からなる群から1又は複数選択されるSNPである、
方法。 [34] A method of treating a subject suffering from cancer.
(1) Below:
(I) Abundance of microorganisms in the feces or intestinal contents of the subject;
(Ii) Genomic pathway score in the fecal or intestinal contents of the subject;
(Iii) Abundance of metabolites in the blood, serum or plasma of the subject;
(Iv) Gene expression levels in the subject's blood, serum or plasma; and (v) Single nucleotide polymorphisms (SNPs) of one or more genes selected from the group consisting of IL6R and NLRC5 in the subject.
A step of determining the presence or absence of one or more selected values or SNPs from a group consisting of
(2) A step of predicting a response to an immune checkpoint inhibitor in the subject using the value obtained in the step (1) or the presence or absence of an SNP as an index.
(3) A step of administering the immune checkpoint inhibitor to the subject determined to have a good response to the immune checkpoint inhibitor and / or not to induce an adverse skin event.
Including
The microorganism is one or more selected from the group consisting of the genus Geobacillus, the genus Gordonibacter, the genus Odoribacter, the genus Veillonella, the genus Corynebacterium, the genus Polychromonas, and the genus Arthrobacter.
The genomic pathways include bacterial invasion of epithelial cells, fatty acid metabolism, flagellar metabolism, fatty acid biosynthesis (Fatty acid metabolism), fatty acid biosynthesis (Fatty acid metabolism), and fatty acid biosynthesis (Fatty acid metabolism). pathway), peptide glycan biosynthesis (Peptidoglycan biosynthesis), nucleotide metabolism (Nucleotide metabolism), purine metabolism (Purine metabolism), phenylalanine metabolism (Phenylalanine metabolism) It is a metabolic pathway,
The metabolite is one or more selected metabolites from the group consisting of lactic acid, pyruvic acid, glucose, 2-oxobutyric acid, glyceric acid, octanoic acid, citrulin, 2-hydroxybutyric acid and pipecholinic acid.
The gene is one or more selected from the group consisting of MAPK pathway, Type I IFN receptor complex pathway, TCR signal pathway-related gene, and BCL11B, ERCC3, ERCC6, FCRL1, FCRL3, MS4A1 and TCF7. ,
The SNP is one or a plurality of SNPs selected from the group consisting of the following rs numbers: rs2228145.1; rs71900199; and rs7185320.
Method.
[35] 記憶部、入力部、データ処理部、及び出力部を含む、癌を有する対象における免疫チェックポイント阻害剤にする応答性を判定するためのシステムであって、
記憶部は、
(1-i)糞便又は腸内容物における微生物の存在量;
(1-ii)糞便又は腸内容物におけるゲノムパスウェイのスコア;
(1-iii)血液、血清又は血漿における代謝産物の存在量;
(1-iv)血液、血清又は血漿における遺伝子の発現量;及び
(1-v)IL6R及びNLRC5からなる群から1又は複数選択される遺伝子の一塩基多型(SNP)
からなる群から1又は複数選択される免疫チェックポイント阻害剤にする応答性を判定するためのカットオフ値を記憶し、
記憶部は、入力部から、
(2-i)前記対象の糞便又は腸内容物における微生物の存在量;
(2-ii)前記対象の糞便又は腸内容物におけるゲノムパスウェイのスコア;
(2-iii)前記対象の血液、血清又は血漿における代謝産物の存在量;
(2-iv)前記対象の血液、血清又は血漿における遺伝子の発現量;及び
(2-v)前記対象におけるIL6R及びNLRC5からなる群から1又は複数選択される遺伝子の一塩基多型(SNP)
からなる群から1又は複数選択される値又はSNPの有無が入力され、記憶部に記憶し、
データ処理部が、記憶された前記値又はSNPの有無を、前記カットオフ値と比較して、前記対象における免疫チェックポイント阻害剤にする応答性を判定し、
出力部が、前記対象における癌の免疫チェックポイント阻害剤にする応答性の判定結果を出力する、
ことを特徴とする、システムであって、
前記微生物が、Geobacillus属、Gordonibacter属、Odoribacter属、Veillonella属、Corynebacterium属、Porphyromonas属、及びArthrobacter属からなる群から1又は複数選択される微生物であり、
前記ゲノムパスウェイが、上皮細胞における細菌侵入(Bacterial invasion of epithelial cells)、脂肪酸の分解(Fatty acid degradation)、鞭毛集合(Flagellar assembly)、脂肪酸の生合成(Fatty acid biosynthesis)、PPARシグナルパスウェイ(PPAR signaling pathway)、ペプチドグリカンの生合成(Peptidoglycan biosynthesis)、ヌクレオチド代謝(Nucleotide metabolism)、プリン代謝(Purine metabolism)、フェニルアラニン代謝(Phenylalanine metabolism)及び脂肪酸の代謝(Fatty acid metabolism)からなる群から1又は複数選択されるゲノムパスウェイであり、
前記代謝産物が、乳酸、ピルビン酸、グルコース、2-オキソ酪酸、グリセリン酸、オクタン酸、シトルリン、2-ヒドロキシ酪酸及びピペコリン酸からなる群から1又は複数選択される代謝産物であり、
前記遺伝子が、MAPKパスウェイ、Type I IFN receptor complexパスウェイ、及びTCRシグナルパスウェイに関連する遺伝子、並びにBCL11B、ERCC3、ERCC6、FCRL1、FCRL3、MS4A1及びTCF7からなる群から1又は複数選択される遺伝子であり、
前記SNPが、以下のrs番号:rs2228145.1;rs7190199;及びrs7185320からなる群から1又は複数選択されるSNPである、
システム。
[36] 分析測定部をさらに含み、
前記分析測定部が、前記対象の糞便又は腸内容物における微生物の存在量及び/又はゲノムパスウェイのスコアを決定し、
前記分析測定部が、前記対象の血液、血清又は血漿のおける代謝産物の存在量を決定し、
前記分析測定部が、前記対象の血液、血清又は血漿における遺伝子の発現量を決定し、並びに/あるいは
前記分析測定部が、前記対象におけるIL6R及びNLRC5からなる群から1又は複数選択される遺伝子の一塩基多型(SNP)の有無を決定し、
前記入力部に代わり、又は前記入力部を介して、前記分析測定部で決定された前記微生物の存在量、前記ゲノムパスウェイのスコア、前記代謝産物の存在量、前記遺伝子の発現量、及び/又は前記SNPの有無を入力する、項目35に記載のシステム。 [35] A system for determining the responsiveness to an immune checkpoint inhibitor in a subject having cancer, including a storage unit, an input unit, a data processing unit, and an output unit.
The memory is
(1-i) Abundance of microorganisms in feces or intestinal contents;
(1-ii) Genomic pathway scores in fecal or intestinal contents;
(1-iii) Abundance of metabolites in blood, serum or plasma;
(1-iv) Gene expression levels in blood, serum or plasma; and (1-v) Single nucleotide polymorphisms (SNPs) of one or more selected genes from the group consisting of IL6R and NLRC5.
Memorize the cutoff value for determining responsiveness to one or more selected immune checkpoint inhibitors from the group consisting of
The storage unit is from the input unit.
(2-i) Abundance of microorganisms in the feces or intestinal contents of the subject;
(2-ii) Genomic pathway score in the fecal or intestinal contents of the subject;
(2-iii) Abundance of metabolites in the blood, serum or plasma of the subject;
(2-iv) Gene expression level in the blood, serum or plasma of the subject; and (2-v) Single nucleotide polymorphism (SNP) of a gene selected one or more from the group consisting of IL6R and NLRC5 in the subject.
A value selected from one or more of the group consisting of SNPs or the presence or absence of SNP is input and stored in the storage unit.
The data processing unit compares the stored value or the presence or absence of the SNP with the cutoff value to determine the responsiveness to the immune checkpoint inhibitor in the subject.
The output unit outputs the determination result of responsiveness to the immune checkpoint inhibitor of cancer in the subject.
It is a system characterized by that
The microorganism is one or more selected from the group consisting of the genus Geobacillus, the genus Gordonibacter, the genus Odoribacter, the genus Veillonella, the genus Corynebacterium, the genus Polychromonas, and the genus Arthrobacter.
The genomic pathways include bacterial invasion of epithelial cells, fatty acid metabolism, flagellar metabolism, fatty acid biosynthesis (Fatty acid metabolism), fatty acid biosynthesis (Fatty acid metabolism), and fatty acid biosynthesis (Fatty acid metabolism). pathway), peptide glycan biosynthesis (Peptidoglycan biosynthesis), nucleotide metabolism (Nucleotide metabolism), purine metabolism (Purine metabolism), phenylalanine metabolism (Phenylalanine metabolism) It is a metabolic pathway,
The metabolite is one or more selected metabolites from the group consisting of lactic acid, pyruvic acid, glucose, 2-oxobutyric acid, glyceric acid, octanoic acid, citrulin, 2-hydroxybutyric acid and pipecholinic acid.
The gene is one or more selected from the group consisting of MAPK pathway, Type I IFN receptor complex pathway, TCR signal pathway-related gene, and BCL11B, ERCC3, ERCC6, FCRL1, FCRL3, MS4A1 and TCF7. ,
The SNP is one or a plurality of SNPs selected from the group consisting of the following rs numbers: rs2228145.1; rs71900199; and rs7185320.
system.
[36] Further including an analysis and measurement unit
The analysis and measurement unit determines the abundance of microorganisms and / or the score of the genomic pathway in the fecal or intestinal contents of the subject.
The analysis and measurement unit determines the abundance of metabolites in the blood, serum or plasma of the subject.
The analysis and measurement unit determines the expression level of the gene in the blood, serum or plasma of the subject, and / or the analysis and measurement unit determines one or more genes selected from the group consisting of IL6R and NLRC5 in the subject. Determine the presence or absence of single nucleotide polymorphism (SNP),
The abundance of the microorganism, the score of the genomic pathway, the abundance of the metabolite, the expression level of the gene, and / or the abundance of the microorganism determined by the analysis and measurement unit on behalf of or through the input unit. The system according toitem 35, which inputs the presence or absence of the SNP.
記憶部は、
(1-i)糞便又は腸内容物における微生物の存在量;
(1-ii)糞便又は腸内容物におけるゲノムパスウェイのスコア;
(1-iii)血液、血清又は血漿における代謝産物の存在量;
(1-iv)血液、血清又は血漿における遺伝子の発現量;及び
(1-v)IL6R及びNLRC5からなる群から1又は複数選択される遺伝子の一塩基多型(SNP)
からなる群から1又は複数選択される免疫チェックポイント阻害剤にする応答性を判定するためのカットオフ値を記憶し、
記憶部は、入力部から、
(2-i)前記対象の糞便又は腸内容物における微生物の存在量;
(2-ii)前記対象の糞便又は腸内容物におけるゲノムパスウェイのスコア;
(2-iii)前記対象の血液、血清又は血漿における代謝産物の存在量;
(2-iv)前記対象の血液、血清又は血漿における遺伝子の発現量;及び
(2-v)前記対象におけるIL6R及びNLRC5からなる群から1又は複数選択される遺伝子の一塩基多型(SNP)
からなる群から1又は複数選択される値又はSNPの有無が入力され、記憶部に記憶し、
データ処理部が、記憶された前記値又はSNPの有無を、前記カットオフ値と比較して、前記対象における免疫チェックポイント阻害剤にする応答性を判定し、
出力部が、前記対象における癌の免疫チェックポイント阻害剤にする応答性の判定結果を出力する、
ことを特徴とする、システムであって、
前記微生物が、Geobacillus属、Gordonibacter属、Odoribacter属、Veillonella属、Corynebacterium属、Porphyromonas属、及びArthrobacter属からなる群から1又は複数選択される微生物であり、
前記ゲノムパスウェイが、上皮細胞における細菌侵入(Bacterial invasion of epithelial cells)、脂肪酸の分解(Fatty acid degradation)、鞭毛集合(Flagellar assembly)、脂肪酸の生合成(Fatty acid biosynthesis)、PPARシグナルパスウェイ(PPAR signaling pathway)、ペプチドグリカンの生合成(Peptidoglycan biosynthesis)、ヌクレオチド代謝(Nucleotide metabolism)、プリン代謝(Purine metabolism)、フェニルアラニン代謝(Phenylalanine metabolism)及び脂肪酸の代謝(Fatty acid metabolism)からなる群から1又は複数選択されるゲノムパスウェイであり、
前記代謝産物が、乳酸、ピルビン酸、グルコース、2-オキソ酪酸、グリセリン酸、オクタン酸、シトルリン、2-ヒドロキシ酪酸及びピペコリン酸からなる群から1又は複数選択される代謝産物であり、
前記遺伝子が、MAPKパスウェイ、Type I IFN receptor complexパスウェイ、及びTCRシグナルパスウェイに関連する遺伝子、並びにBCL11B、ERCC3、ERCC6、FCRL1、FCRL3、MS4A1及びTCF7からなる群から1又は複数選択される遺伝子であり、
前記SNPが、以下のrs番号:rs2228145.1;rs7190199;及びrs7185320からなる群から1又は複数選択されるSNPである、
システム。
[36] 分析測定部をさらに含み、
前記分析測定部が、前記対象の糞便又は腸内容物における微生物の存在量及び/又はゲノムパスウェイのスコアを決定し、
前記分析測定部が、前記対象の血液、血清又は血漿のおける代謝産物の存在量を決定し、
前記分析測定部が、前記対象の血液、血清又は血漿における遺伝子の発現量を決定し、並びに/あるいは
前記分析測定部が、前記対象におけるIL6R及びNLRC5からなる群から1又は複数選択される遺伝子の一塩基多型(SNP)の有無を決定し、
前記入力部に代わり、又は前記入力部を介して、前記分析測定部で決定された前記微生物の存在量、前記ゲノムパスウェイのスコア、前記代謝産物の存在量、前記遺伝子の発現量、及び/又は前記SNPの有無を入力する、項目35に記載のシステム。 [35] A system for determining the responsiveness to an immune checkpoint inhibitor in a subject having cancer, including a storage unit, an input unit, a data processing unit, and an output unit.
The memory is
(1-i) Abundance of microorganisms in feces or intestinal contents;
(1-ii) Genomic pathway scores in fecal or intestinal contents;
(1-iii) Abundance of metabolites in blood, serum or plasma;
(1-iv) Gene expression levels in blood, serum or plasma; and (1-v) Single nucleotide polymorphisms (SNPs) of one or more selected genes from the group consisting of IL6R and NLRC5.
Memorize the cutoff value for determining responsiveness to one or more selected immune checkpoint inhibitors from the group consisting of
The storage unit is from the input unit.
(2-i) Abundance of microorganisms in the feces or intestinal contents of the subject;
(2-ii) Genomic pathway score in the fecal or intestinal contents of the subject;
(2-iii) Abundance of metabolites in the blood, serum or plasma of the subject;
(2-iv) Gene expression level in the blood, serum or plasma of the subject; and (2-v) Single nucleotide polymorphism (SNP) of a gene selected one or more from the group consisting of IL6R and NLRC5 in the subject.
A value selected from one or more of the group consisting of SNPs or the presence or absence of SNP is input and stored in the storage unit.
The data processing unit compares the stored value or the presence or absence of the SNP with the cutoff value to determine the responsiveness to the immune checkpoint inhibitor in the subject.
The output unit outputs the determination result of responsiveness to the immune checkpoint inhibitor of cancer in the subject.
It is a system characterized by that
The microorganism is one or more selected from the group consisting of the genus Geobacillus, the genus Gordonibacter, the genus Odoribacter, the genus Veillonella, the genus Corynebacterium, the genus Polychromonas, and the genus Arthrobacter.
The genomic pathways include bacterial invasion of epithelial cells, fatty acid metabolism, flagellar metabolism, fatty acid biosynthesis (Fatty acid metabolism), fatty acid biosynthesis (Fatty acid metabolism), and fatty acid biosynthesis (Fatty acid metabolism). pathway), peptide glycan biosynthesis (Peptidoglycan biosynthesis), nucleotide metabolism (Nucleotide metabolism), purine metabolism (Purine metabolism), phenylalanine metabolism (Phenylalanine metabolism) It is a metabolic pathway,
The metabolite is one or more selected metabolites from the group consisting of lactic acid, pyruvic acid, glucose, 2-oxobutyric acid, glyceric acid, octanoic acid, citrulin, 2-hydroxybutyric acid and pipecholinic acid.
The gene is one or more selected from the group consisting of MAPK pathway, Type I IFN receptor complex pathway, TCR signal pathway-related gene, and BCL11B, ERCC3, ERCC6, FCRL1, FCRL3, MS4A1 and TCF7. ,
The SNP is one or a plurality of SNPs selected from the group consisting of the following rs numbers: rs2228145.1; rs71900199; and rs7185320.
system.
[36] Further including an analysis and measurement unit
The analysis and measurement unit determines the abundance of microorganisms and / or the score of the genomic pathway in the fecal or intestinal contents of the subject.
The analysis and measurement unit determines the abundance of metabolites in the blood, serum or plasma of the subject.
The analysis and measurement unit determines the expression level of the gene in the blood, serum or plasma of the subject, and / or the analysis and measurement unit determines one or more genes selected from the group consisting of IL6R and NLRC5 in the subject. Determine the presence or absence of single nucleotide polymorphism (SNP),
The abundance of the microorganism, the score of the genomic pathway, the abundance of the metabolite, the expression level of the gene, and / or the abundance of the microorganism determined by the analysis and measurement unit on behalf of or through the input unit. The system according to
本発明を用いることによって、癌を罹患する対象において、免疫チェックポイント阻害剤に対する応答を予測することが可能となる。その結果、免疫チェックポイント阻害剤に対する応答が良好である対象に、免疫チェックポイント阻害剤を適用することが可能となり、治療効果の向上が期待できる。
By using the present invention, it becomes possible to predict the response to an immune checkpoint inhibitor in a subject suffering from cancer. As a result, the immune checkpoint inhibitor can be applied to a subject having a good response to the immune checkpoint inhibitor, and improvement in the therapeutic effect can be expected.
本発明を以下に詳細に説明する。特段の定義がない限り、本明細書で使用する用語(技術的用語および科学的用語)は、当業者が一般に理解している用語と同一の意味を有する。また、本明細書において引用されている文献は、本明細書においても援用され、その全体が本明細書において取り込まれる。
The present invention will be described in detail below. Unless otherwise defined, the terms used herein (technical and scientific terms) have the same meaning as those commonly understood by one of ordinary skill in the art. The documents cited herein are also incorporated herein by reference in their entirety.
本発明は、免疫チェックポイント阻害剤を適用した、癌を罹患する患者において、腫瘍増大群(PD群)と非腫瘍増大群(non-PD群)、生存群と死亡群、又は癌の増悪あり/なし群を比較して、バイオマーカーを探索した結果、これまで知られていなかった特定の菌種の存在量もしくは特定のゲノムパスウェイのスコア、あるいは対象における血液、血清又は血漿における特定の代謝産物の存在量、あるいは対象における血液、血清又は血漿における特定の遺伝子発現量を決定することによって、対象における免疫チェックポイント阻害剤に対する応答を予測可能であることを見出した。
The present invention presents in patients with cancer to whom an immune checkpoint inhibitor has been applied, with tumor growth (PD group) and non-tumor growth group (non-PD group), survival group and death group, or exacerbation of cancer. As a result of searching for biomarkers by comparing / none groups, the abundance of a specific bacterial species or the score of a specific genomic pathway that was not known so far, or a specific metabolite in blood, serum or plasma in a subject We have found that the response to immune checkpoint inhibitors in a subject can be predicted by determining the abundance of the tumor or the expression of a particular gene in blood, serum or plasma in the subject.
また、免疫チェックポイント阻害剤を適用した、癌を罹患する患者において、有害事象(例えば、皮膚の有害事象)のある群/ない群を比較して新規バイオマーカーを探索した結果、これまで知られていなかった特定の菌種の存在量、特定のゲノムパスウェイのスコア、あるいは対象における特定の一塩基多型(SNP)を検出することにより、対象における免疫チェックポイント阻害剤に対する有害事象の発生リスクを予測可能であることを見出した。
In addition, as a result of searching for new biomarkers by comparing groups with and without adverse events (for example, adverse skin events) in patients suffering from cancer to which immune checkpoint inhibitors have been applied, it has been known so far. By detecting the abundance of specific bacterial species that were not present, the score of a specific genomic pathway, or a specific single nucleotide polymorphism (SNP) in a subject, the risk of adverse events against immune checkpoint inhibitors in the subject Found to be predictable.
すなわち、一実施態様において、本発明は、癌を罹患する対象における、免疫チェックポイント阻害剤に対する応答を予測する方法であって、
(1)以下:
(i)前記対象の糞便又は腸内容物における微生物の存在量;
(ii)前記対象の糞便又は腸内容物におけるゲノムパスウェイのスコア;
(iii)前記対象の血液、血清又は血漿における代謝産物の存在量;
(iv)前記対象の血液、血清又は血漿における遺伝子の発現量;及び
(v)前記対象におけるIL6R及びNLRC5からなる群から1又は複数選択される遺伝子の一塩基多型(SNP)
からなる群から1又は複数選択される値又はSNPの有無を決定するステップ、
(2)前記ステップ(1)で得られる値又はSNPの有無を指標として、前記対象における免疫チェックポイント阻害剤に対する応答を予測するステップ
を含み、
前記微生物が、Geobacillus属、Gordonibacter属、Odoribacter属、Veillonella属、Corynebacterium属、Porphyromonas属、及びArthrobacter属からなる群から1又は複数選択される微生物であり、
前記ゲノムパスウェイが、上皮細胞における細菌侵入(Bacterial invasion of epithelial cells)、脂肪酸の分解(Fatty acid degradation)、鞭毛集合(Flagellar assembly)、脂肪酸の生合成(Fatty acid biosynthesis)、PPARシグナルパスウェイ(PPAR signaling pathway)、ペプチドグリカンの生合成(Peptidoglycan biosynthesis)、ヌクレオチド代謝(Nucleotide metabolism)、プリン代謝(Purine metabolism)、フェニルアラニン代謝(Phenylalanine metabolism)及び脂肪酸の代謝(Fatty acid metabolism)からなる群から1又は複数選択されるゲノムパスウェイであり、
前記代謝産物が、乳酸、ピルビン酸、グルコース、2-オキソ酪酸、グリセリン酸、オクタン酸、シトルリン、2-ヒドロキシ酪酸及びピペコリン酸からなる群から1又は複数選択される代謝産物であり、
前記遺伝子が、MAPKパスウェイ、Type I IFN receptor complexパスウェイ、及びTCRシグナルパスウェイに関連する遺伝子、並びにBCL11B、ERCC3、ERCC6、FCRL1、FCRL3、MS4A1及びTCF7からなる群から1又は複数選択される遺伝子であり、
前記SNPが、以下のrs番号:rs2228145.1;rs7190199;及びrs7185320からなる群から1又は複数選択されるSNPである、
方法を提供する。 That is, in one embodiment, the present invention is a method of predicting a response to an immune checkpoint inhibitor in a subject suffering from cancer.
(1) Below:
(I) Abundance of microorganisms in the feces or intestinal contents of the subject;
(Ii) Genomic pathway score in the fecal or intestinal contents of the subject;
(Iii) Abundance of metabolites in the blood, serum or plasma of the subject;
(Iv) Gene expression levels in the subject's blood, serum or plasma; and (v) Single nucleotide polymorphisms (SNPs) of one or more genes selected from the group consisting of IL6R and NLRC5 in the subject.
A step of determining the presence or absence of one or more selected values or SNPs from a group consisting of
(2) Including the step of predicting the response to the immune checkpoint inhibitor in the subject by using the value obtained in the step (1) or the presence or absence of SNP as an index.
The microorganism is one or more selected from the group consisting of the genus Geobacillus, the genus Gordonibacter, the genus Odoribacter, the genus Veillonella, the genus Corynebacterium, the genus Polychromonas, and the genus Arthrobacter.
The genomic pathways include bacterial invasion of epithelial cells, fatty acid metabolism, flagellar metabolism, fatty acid biosynthesis (Fatty acid metabolism), fatty acid biosynthesis (Fatty acid metabolism), and fatty acid biosynthesis (Fatty acid metabolism). pathway), peptide glycan biosynthesis (Peptidoglycan biosynthesis), nucleotide metabolism (Nucleotide metabolism), purine metabolism (Purine metabolism), phenylalanine metabolism (Phenylalanine metabolism) It is a metabolic pathway,
The metabolite is one or more selected metabolites from the group consisting of lactic acid, pyruvic acid, glucose, 2-oxobutyric acid, glyceric acid, octanoic acid, citrulin, 2-hydroxybutyric acid and pipecholinic acid.
The gene is one or more selected from the group consisting of MAPK pathway, Type I IFN receptor complex pathway, TCR signal pathway-related gene, and BCL11B, ERCC3, ERCC6, FCRL1, FCRL3, MS4A1 and TCF7. ,
The SNP is one or a plurality of SNPs selected from the group consisting of the following rs numbers: rs2228145.1; rs71900199; and rs7185320.
Provide a method.
本明細書において、「癌」とは、特に限定されないが、例えば、白血病(例えば、急性骨髄性白血病、慢性骨髄性白血病、急性リンパ性白血病、慢性リンパ性白血病)、悪性リンパ腫(ホジキンリンパ腫、非ホジキンリンパ腫(例えば、成人T細胞白血病、濾胞性リンパ腫、びまん性大細胞型B細胞性リンパ腫))、多発性骨髄腫、骨髄異形成症候群、頭頸部癌、食道癌、食道腺癌、胃癌、大腸癌、結腸癌、直腸癌、肝臓癌(例えば、肝細胞癌)、胆嚢・胆管癌、胆道癌、膵臓癌、甲状腺癌、肺癌(例えば、非小細胞肺癌(例えば、扁平上皮非小細胞肺癌、非扁平上皮非小細胞肺癌)、小細胞肺癌)、乳癌、卵巣癌(例えば、漿液性卵巣癌)、子宮頚癌、子宮体癌、子宮内膜癌、膣癌、外陰部癌、腎癌(例えば、腎細胞癌)、尿路上皮癌(例えば、膀胱癌、上部尿路癌)、前立腺癌、精巣腫瘍(例えば、胚細胞腫瘍)、骨・軟部肉腫、皮膚癌(例えば、ブドウ膜悪性黒色腫、悪性黒色腫、メルケル細胞癌)、神経膠腫、脳腫瘍(例えば、膠芽腫)、胸膜中皮腫および原発不明癌)が挙げられる。本発明において、免疫チェックポイント阻害剤に対する応答を予測する可能な癌としては、好ましくは、胃癌である。より好ましくは、切除不能進行性胃癌である。
As used herein, the term "cancer" is not particularly limited, and is, for example, leukemia (eg, acute myeloid leukemia, chronic myeloid leukemia, acute lymphocytic leukemia, chronic lymphocytic leukemia), malignant lymphoma (hodgkin lymphoma, non-cancer). Hodgkin lymphoma (eg, adult T-cell leukemia, follicular lymphoma, diffuse large B-cell lymphoma), multiple myeloma, myelodystrophy syndrome, head and neck cancer, esophageal cancer, esophageal adenocarcinoma, gastric cancer, colon Cancer, colon cancer, rectal cancer, liver cancer (eg, hepatocellular carcinoma), bile sac / bile duct cancer, biliary tract cancer, pancreatic cancer, thyroid cancer, lung cancer (eg, non-small cell lung cancer (eg, squamous epithelial non-small cell lung cancer), Non-flat epithelial non-small cell lung cancer), small cell lung cancer), breast cancer, ovarian cancer (eg, serous ovarian cancer), cervical cancer, uterine body cancer, endometrial cancer, vaginal cancer, genital cancer, renal cancer (eg, serous ovarian cancer) For example, renal cell cancer), urinary tract epithelial cancer (eg, bladder cancer, upper urinary tract cancer), prostate cancer, testis tumor (eg, embryonic cell tumor), bone / soft sarcoma, skin cancer (eg, grape membrane malignant black) Tumors, malignant melanomas, merkel cell carcinomas), gliomas, brain tumors (eg, glioblastoma), pleural dermatomas and cancers of unknown primary origin. In the present invention, gastric cancer is preferable as a cancer capable of predicting a response to an immune checkpoint inhibitor. More preferably, it is unresectable advanced gastric cancer.
本明細書において「癌(悪性腫瘍)治療」とは、例えば、(i)癌の増殖を減少させる、(ii)癌に起因する症状を低減させる、(iii)癌患者の生活の質を向上させる、(iv)既に投与されている他の抗癌薬または癌治療補助薬の用量を低減させる、および/または(v)癌患者の生存を延長させるために行われる治療を含む。また、治療は再発抑制を含む。「再発抑制」とは、癌治療あるいは癌切除手術によって癌病変が完全にあるいは実質的に消滅あるいは取り除かれた患者における癌の再発を予防的に抑止することを意味する。
As used herein, the term "cancer (malignant tumor) treatment" refers to, for example, (i) reducing the growth of cancer, (ii) reducing symptoms caused by cancer, and (iii) improving the quality of life of cancer patients. Includes treatments performed to (iv) reduce the dose of other anticancer drugs or cancer treatment aids already administered, and / or (v) prolong the survival of the cancer patient. Treatment also includes suppression of recurrence. "Relapse suppression" means prophylactically suppressing cancer recurrence in patients whose cancer lesions have been completely or substantially eliminated or removed by cancer treatment or cancer resection surgery.
ここで、「他の抗癌薬」としては、例えば、アルキル化薬、白金製剤、代謝拮抗剤(例えば、葉酸代謝拮抗薬、ピリジン代謝阻害薬、プリン代謝阻害薬)、リボヌクレオチドリダクターゼ阻害薬、ヌクレオチドアナログ、トポイソメラーゼ阻害薬、微小管重合阻害薬、微小管脱重合阻害薬、抗腫瘍性抗生物質、サイトカイン製剤、抗ホルモン薬、分子標的薬および癌免疫治療薬が挙げられる。
Here, examples of the "other anticancer drug" include alkylating agents, platinum preparations, antimetabolites (eg, antimetabolites, pyridine metabolism inhibitors, purine metabolism inhibitors), ribonucleotide reductase inhibitors, and the like. Included are nucleotide analogs, topoisomerase inhibitors, microtube polymerization inhibitors, microtube depolymerization inhibitors, antitumor antibiotics, cytokine preparations, antihormonal agents, molecular targeting agents and cancer immunotherapeutic agents.
本発明の治療剤は、(1)癌の治療効果の増強のために、(2)組み合わせて使用される他の薬剤の投与量の低減および/または(3)組み合わせて使用される他の薬剤の副作用の軽減のために、上記の癌の治療目的に使用される一種以上の他の薬剤(主に、抗癌薬)とともに組み合わせて使用してもよい。本発明において、他の薬剤とともに組み合わせて処方する場合の投与形態には、1つの製剤中に両成分を配合した配合剤の形態であっても、また別々の製剤としての投与形態であってもよい。本発明の治療剤等と他の薬剤を別々に投与する場合には、本発明の治療剤等を先に投与し、その投与の後に他の薬剤を投与してもよいし、他の薬剤を先に投与し、本発明の治療剤等を後に投与してもよく、また、上記投与において、一定期間、両薬剤が同時に投与される期間があってもよい。また、各々の薬剤の投与方法は同じでも異なっていてもよい。薬剤の性質により、本発明の治療剤等と他の薬剤を含むキットとして提供することもできる。ここで、他の薬剤の投与量は、臨床上用いられている用量を基準として適宜選択することができる。また、他の薬剤は任意の2種以上を適宜の割合で組み合わせて投与してもよい。また、前記他の薬剤には、現在までに見出されているものだけでなく今後見出されるものも含まれる。
The therapeutic agents of the present invention are (1) reduced doses of other agents used in combination and / or (3) other agents used in combination to enhance the therapeutic effect of cancer. In order to reduce the side effects of the above, it may be used in combination with one or more other drugs (mainly anticancer drugs) used for the therapeutic purpose of the above-mentioned cancers. In the present invention, the dosage form when prescribing in combination with other drugs may be a combination drug form in which both components are mixed in one preparation, or an administration form as separate preparations. good. When the therapeutic agent or the like of the present invention and another drug are separately administered, the therapeutic agent or the like of the present invention may be administered first, and then the other agent may be administered, or the other agent may be administered. It may be administered first and the therapeutic agent of the present invention or the like may be administered later, or in the above administration, there may be a period during which both agents are simultaneously administered for a certain period of time. Moreover, the administration method of each drug may be the same or different. Depending on the nature of the drug, it can also be provided as a kit containing the therapeutic agent of the present invention and other drugs. Here, the dose of the other drug can be appropriately selected based on the clinically used dose. In addition, other drugs may be administered in combination of any two or more at an appropriate ratio. In addition, the other drugs include not only those found so far but also those found in the future.
本明細書において、「免疫チェックポイント阻害剤」とは、免疫チェックポイント分子を阻害し、抑制性共シグナルを伝達することで免疫抑制機能を発揮する薬剤を意味する。免疫チェックポイント分子としては、CTLA-4、PD-1、PD-L1(programmed cell death-ligand 1)、PD-L2(programmed cell death-ligand 2)、LAG-3(Lymphocyte activation gene 3)、TIM3(T cell immunoglobulin and mucin-3)、BTLA(B and T lympho-cyte attenuator)、B7H3、B7H4、2B4、CD160、A2aR(adenosine A2a receptor)、KIR(killer inhibitory receptor)、VISTA(V-domain Ig-containing suppressor of T cell activation)、IDO1(Indoleamine 2,3-dioxygenase)、ArginaseI、TIGIT(T cell immunoglobulin and ITIM domain)、CD115等が知られているが(Nature Reviews Cancer、12、252-264ページ、2012年、Cancer Cell、27、450-461ページ、2015年を参照)、定義に一致する働きを有する分子であれば特に限定されない。
As used herein, the term "immune checkpoint inhibitor" means an agent that exerts an immunosuppressive function by inhibiting an immune checkpoint molecule and transmitting an inhibitory co-signal. Examples of immune checkpoint molecules include CTLA-4, PD-1, PD-L1 (programmed cell death-ligand 1), PD-L2 (programmed cell date-ligand 2), LAG-3 (Lymphometry activationTime3). (T cell immunoglobulin and mucin-3), BTLA (B and T lympho-cyte attenator), B7H3, B7H4, 2B4, CD160, A2aR (adenosine A2a receptor), IR Contining support of T cell activation), IDO1 (Indoreamine 2,3-dioxygene), ArginaseI, TIGIT (T cell immunoglobulin and ITIM doman), CD115, etc. 2012, Cancer Cell, 27, 450-461, 2015), and the molecule is not particularly limited as long as it has a function consistent with the definition.
本発明において、適用し得る免疫チェックポイント阻害剤としては、免疫チェックポイント分子の機能(シグナル)を抑制しうる物質であれば特に限定されない。
In the present invention, the applicable immune checkpoint inhibitor is not particularly limited as long as it is a substance capable of suppressing the function (signal) of the immune checkpoint molecule.
免疫チェックポイント阻害剤として好ましくは、ヒト免疫チェックポイント分子の阻害剤であり、さらに好ましくは、ヒト免疫チェックポイント分子に対する中和抗体である。
The immune checkpoint inhibitor is preferably an inhibitor of a human immune checkpoint molecule, and more preferably a neutralizing antibody against the human immune checkpoint molecule.
免疫チェックポイント阻害剤として、例えば、CTLA-4、PD-1、PD-L1、PD-L2、LAG-3、TIM3、BTLA、B7H3、B7H4、2B4、CD160、A2aR、KIR、VISTAおよびTIGITからなる群から選択される免疫チェックポイント分子の阻害剤が挙げられる。以下に免疫チェックポイント阻害剤の例を挙げるが、免疫チェックポイント阻害剤はこれらに限定されない。
Immune checkpoint inhibitors consist of, for example, CTLA-4, PD-1, PD-L1, PD-L2, LAG-3, TIM3, BTLA, B7H3, B7H4, 2B4, CD160, A2aR, KIR, VISTA and TIGIT. Included are inhibitors of immune checkpoint molecules selected from the group. Examples of immune checkpoint inhibitors are given below, but immune checkpoint inhibitors are not limited to these.
免疫チェックポイント阻害剤としては、例えば、抗CTLA-4抗体(例えば、Ipilimumab(YERVOY(登録商標))、Tremelimumab、AGEN-1884)、抗PD-1抗体(例えば、ニボルマブ(オプジーボ(登録商標))、REGN-2810、Pembrolizumab(KEYTRUDA(登録商標))、PDR-001、BGB-A317、AMP-514(MEDI0680)、BCD-100、IBI-308、JS-001、PF-06801591、TSR-042)、抗PD-L1抗体(例えば、Atezolizumab(RG7446、MPDL3280A)、Avelumab(PF-06834635、MSB0010718C)、Durvalumab(MEDI4736)、BMS-936559、CA-170、LY-3300054)、抗PD-L2抗体(例えば、rHIgM12B7)、PD-L1融合タンパク質、PD-L2融合タンパク質(例えば、AMP-224)、抗Tim-3抗体(例えば、MBG453)、抗LAG-3抗体(例えば、BMS-986016、LAG525)、抗KIR抗体(例えば、Lirilumab)等である。また、上記既知の抗体の重鎖および軽鎖相補性決定領域(CDRs)または可変領域(VR)を含む抗体も免疫チェックポイント阻害剤の一態様である。例えば、抗PD-1抗体の更なる一態様としては、例えばニボルマブの重鎖および軽鎖相補性決定領域(CDRs)または可変領域(VR)を含む抗体が挙げられる。
Examples of immune checkpoint inhibitors include anti-CTLA-4 antibody (eg, Ipilimumab (YERVOY®), Tremerimumab, AGEN-1884), anti-PD-1 antibody (eg, nivolumab (registered trademark)). , REGN-2810, Pembrolizumab (KEYTRUDA®), PDR-001, BGB-A317, AMP-514 (MEDI0680), BCD-100, IBI-308, JS-001, PF-06801591, TSR-042), Anti-PD-L1 antibody (eg, Atezolizumab (RG7446, MPDL3280A), Averumab (PF-06834635, MSB0010718C), Durvalumab (MEDI4736), BMS-936559, CA-170, LY-3300054), anti-PD-L2 antibody, eg. rHIgM12B7), PD-L1 fusion protein, PD-L2 fusion protein (eg, AMP-224), anti-Tim-3 antibody (eg, MBG453), anti-LAG-3 antibody (eg, BMS-986016, LAG525), anti-KIR Antibodies (eg, Lilylumab) and the like. Antibodies comprising the heavy and light chain complementarity determining regions (CDRs) or variable regions (VR) of the known antibodies are also aspects of immune checkpoint inhibitors. For example, further embodiments of anti-PD-1 antibodies include antibodies comprising, for example, nivolumab heavy and light chain complementarity determining regions (CDRs) or variable regions (VR).
本発明において適用し得る免疫チェックポイント阻害剤として好ましくは、抗CTLA-4抗体、抗PD-1抗体、抗PD-L1抗体、抗PD-L2抗体、PD-L1融合タンパク質、PD-L2融合タンパク質である。さらに好ましくは、抗PD-1抗体、抗PD-L1抗体、抗PD-L2抗体、PD-L1融合タンパク質、PD-L2融合タンパク質である。特に好ましくは、抗PD-1抗体である。抗PD-1抗体として好ましくは、ニボルマブの重鎖および軽鎖相補性決定領域(CDRs)または可変領域(VR)を含む抗体(ニボルマブを含む)であり、さらに好ましくは、ニボルマブである。
The immune checkpoint inhibitor applicable in the present invention is preferably anti-CTLA-4 antibody, anti-PD-1 antibody, anti-PD-L1 antibody, anti-PD-L2 antibody, PD-L1 fusion protein, PD-L2 fusion protein. Is. More preferably, it is an anti-PD-1 antibody, an anti-PD-L1 antibody, an anti-PD-L2 antibody, a PD-L1 fusion protein, and a PD-L2 fusion protein. Particularly preferred is an anti-PD-1 antibody. The anti-PD-1 antibody is preferably an antibody (including nivolumab) containing the heavy and light chain complementarity determining regions (CDRs) or variable regions (VR) of nivolumab, and more preferably nivolumab.
これら免疫チェックポイント阻害剤のうちのいずれか1種または任意の複数種の抗体あるいは融合タンパク質を本発明において適用することができる。
An antibody or fusion protein of any one of these immune checkpoint inhibitors or any plurality of types can be applied in the present invention.
本発明において、免疫チェックポイント阻害剤に対する応答が良好であると判定された対象に用いられ得る免疫チェックポイント阻害剤の投与量は、年齢、体重、症状、治療効果、投与方法、処理時間等により異なるが、最適な所望の効果をもたらすように調整される。
In the present invention, the dose of the immune checkpoint inhibitor that can be used for a subject determined to have a good response to the immune checkpoint inhibitor depends on age, body weight, symptoms, therapeutic effect, administration method, treatment time, and the like. Different, but adjusted to produce the optimum desired effect.
例えば、抗PD-1抗体を使用する場合、投与量の一態様は、0.1~20mg/kg体重である。また、ニボルマブの重鎖および軽鎖相補性決定領域(CDRs)または可変領域(VR)を含む抗体(例えばニボルマブ)を使用する場合、投与量の一態様は、0.3~10mg/kg体重であり、好ましくは、成人には、ニボルマブとして(1)1回1mg/kg(体重)を3週間間隔で、(2)1回3mg/kg(体重)を2週間間隔で、(3)1回2mg/kg(体重)を3週間間隔で、(4)1回80mgを3週間間隔で、(5)1回240mgを2週間間隔で、(6)1回360mgを3週間間隔で、または(7)1回480mgを4週間間隔で点滴静脈内注射にて投与され得る。
For example, when using an anti-PD-1 antibody, one aspect of the dose is 0.1 to 20 mg / kg body weight. Also, when using an antibody (eg, nivolumab) containing nivolumab heavy and light chain complementarity determining regions (CDRs) or variable regions (VR), one aspect of the dose is 0.3-10 mg / kg body weight. Yes, preferably, for adults, (1) 1 mg / kg (body weight) once at 3 week intervals, (2) 3 mg / kg (body weight) once at 2 week intervals, (3) once as nivolumab. 2 mg / kg (body weight) at 3 week intervals, (4) 80 mg once at 3 week intervals, (5) 240 mg once at 2 week intervals, (6) 360 mg once at 3 week intervals, or ( 7) A single dose of 480 mg can be administered by intravenous drip infusion at 4-week intervals.
本明細書において、「糞便」とは、腸管から体外に排出されたものをいい、「腸内容物」とは、腸管から対外に排出される前の内容物をいう。本発明において、癌を罹患する対象における糞便又は腸内容物における微生物の存在量を決定することにより、その微生物の存在量から、対象における免疫チェックポイント阻害剤に対する応答性を予測することが可能となる。
In the present specification, "feces" refers to those excreted from the intestinal tract to the outside of the body, and "intestinal contents" refers to the contents before being excreted from the intestinal tract to the outside. In the present invention, by determining the abundance of microorganisms in fecal or intestinal contents in a subject suffering from cancer, it is possible to predict the responsiveness to an immune checkpoint inhibitor in the subject from the abundance of the microorganisms. Become.
本明細書において、「微生物の存在量の値を決定するステップ」とは、所望の微生物の存在の有無を決定することであってもよく、所望の微生物の絶対的な存在量を決定することであってもよく、所望の微生物の相対的な存在量を決定することであってもよい。
As used herein, the "step of determining the value of the abundance of microorganisms" may be to determine the presence or absence of a desired microorganism, and to determine the absolute abundance of a desired microorganism. It may be, or it may be to determine the relative abundance of the desired microorganism.
微生物の存在量の値を決定するステップは、公知の微生物の同定方法を用いることよって決定することができるが、例えば、微生物の存在量は、メタゲノム解析によって決定することができる。メタゲノム解析とは、培養というプロセスを経ずに微生物菌叢のゲノム総体の解析を行うことをいい、本発明において適用し得るメタゲノム解析は、公知の方法、例えば次世代シークエンサーを用いた方法及び解析により実施することが可能である。メタゲノム解析による微生物の同定は、例えば、リボソーム小サブユニット中の16SrRNA遺伝子の塩基配列の比較による微生物の分類により、同定する方法であってもよく、微生物の他のゲノム領域の配列によって菌種を同定する方法であってもよく、特に限定されない。また、メタゲノム解析を行うことにより、該当する微生物の存在量を決定することもできる。
The step of determining the value of the abundance of microorganisms can be determined by using a known method for identifying microorganisms, and for example, the abundance of microorganisms can be determined by metagenomic analysis. Metagenomic analysis refers to analysis of the entire genome of the microbial flora without going through the process of culturing, and metagenomic analysis applicable in the present invention is a known method, for example, a method and analysis using a next-generation sequencer. It is possible to carry out by. Identification of microorganisms by metagenome analysis may be, for example, a method of identification by classification of microorganisms by comparing the base sequences of 16S rRNA genes in small ribosome subunits, and the bacterial species may be identified by the sequences of other genomic regions of the microorganisms. It may be an identification method and is not particularly limited. It is also possible to determine the abundance of the corresponding microorganism by performing metagenomic analysis.
一実施態様において、対象の糞便又は腸内容物における微生物のうち、Geobacillus属、Gordonibacter属、Odoribacter属、Veillonella属、Corynebacterium属、Porphyromonas属、及びArthrobacter属からなる群から1又は複数選択される微生物の存在量を指標とすることにより、対象における免疫チェックポイント阻害剤に対する応答を予測することができることを、本発明者らは初めて見出した。例えば、本発明者らは、免疫チェックポイント阻害剤に対して良好な応答を示す癌を罹患する患者において、Geobacillus属、Gordonibacter属、又はVeillonella属の微生物の存在量が、免疫チェックポイント阻害剤に対して良好な応答を示さない癌を罹患する患者よりも、有意に高いことを見出した。すなわち、一実施態様において、対象における糞便又は腸内容物において、Geobacillus属、Gordonibacter属、又はVeillonella属の微生物の存在量が、所定の閾値より高い場合、当該対象における免疫チェックポイント阻害剤に対する応答が良好であると予測することができるが、Veillonella属の微生物の存在量を指標とすることが、より好ましい。
In one embodiment, among the microorganisms in the feces or intestinal contents of the subject, one or a plurality of microorganisms selected from the group consisting of the genera Geobacillus, the genus Gordonibacter, the genus Odoribacter, the genus Veillonella, the genus Corynebacterium, the genus Porphyromonas, and the genus Arthrobacter. For the first time, the present inventors have found that the response to an immune checkpoint inhibitor in a subject can be predicted by using the abundance as an index. For example, we present that the abundance of Geobacillus, Gordonibacter, or Veillonella microorganisms is an immune checkpoint inhibitor in patients suffering from cancer that responds well to immune checkpoint inhibitors. On the other hand, it was found to be significantly higher than patients suffering from cancer that did not show a good response. That is, in one embodiment, when the abundance of Geobacillus, Gordonibacter, or Veillonella microorganisms in the feces or intestinal contents of a subject is higher than a predetermined threshold, the response to the immune checkpoint inhibitor in the subject is Although it can be predicted to be good, it is more preferable to use the abundance of microorganisms of the genus Veillonella as an index.
また、他の態様において、対象における糞便又は腸内容物において、Geobacillus属、Gordonibacter属、又はVeillonella属の微生物の存在量が、所定の閾値より低い場合、当該対象における免疫チェックポイント阻害剤に対する応答が不良であると予測することができるが、Veillonella属の微生物の存在量を指標とすることが、より好ましい。
In another embodiment, when the abundance of Geobacillus, Gordonibacter, or Veillonella microorganisms in the feces or intestinal contents of the subject is lower than a predetermined threshold, the response to the immune checkpoint inhibitor in the subject is Although it can be predicted to be defective, it is more preferable to use the abundance of microorganisms of the genus Veillonella as an index.
一実施態様において、対象の糞便又は腸内容物における微生物のうち、Odoribacter属の微生物の存在量を指標とすることにより、対象における免疫チェックポイント阻害剤に対する応答を予測することができることを、本発明者らは初めて見出した。例えば、本発明者らは、免疫チェックポイント阻害剤に対して良好な応答を示す癌を罹患する患者において、Odoribacter属の微生物の存在量が、免疫チェックポイント阻害剤に対して良好な応答を示さない癌を罹患する患者よりも、有意に低いことを見出した。すなわち、一実施態様において、対象における糞便又は腸内容物において、Odoribacter属の微生物の存在量が、所定の閾値より低い場合、当該対象における免疫チェックポイント阻害剤に対する応答が良好であると予測することができる。
In one embodiment, it is possible to predict the response to an immune checkpoint inhibitor in a subject by using the abundance of microorganisms of the genus Odoribacter as an index among the microorganisms in the feces or intestinal contents of the subject. They found it for the first time. For example, we have shown that the abundance of microorganisms of the genus Odoribacter shows a good response to immune checkpoint inhibitors in patients suffering from cancer who show a good response to immune checkpoint inhibitors. It was found to be significantly lower than patients with no cancer. That is, in one embodiment, when the abundance of microorganisms of the genus Odoribacter in the fecal or intestinal contents of a subject is lower than a predetermined threshold, it is predicted that the response to the immune checkpoint inhibitor in the subject is good. Can be done.
また、他の態様において、対象における糞便又は腸内容物において、Odoribacter属の微生物の存在量が、所定の閾値より高い場合、当該対象における免疫チェックポイント阻害剤に対する応答が不良であると予測することができる。
Further, in another embodiment, when the abundance of microorganisms of the genus Odoribacter in the feces or intestinal contents of the subject is higher than a predetermined threshold value, it is predicted that the response to the immune checkpoint inhibitor in the subject is poor. Can be done.
また、他の態様において、対象における糞便又は腸内容物において、Arthrobacter属の微生物の存在量が所定の閾値より高い場合は、前記対象において、免疫チェックポイント阻害剤により皮膚の有害事象を誘発すると予測することができる。
In another embodiment, if the abundance of Arthrobacter microorganisms in the feces or intestinal contents of the subject is higher than a predetermined threshold, it is predicted that the immune checkpoint inhibitor will induce skin adverse events in the subject. can do.
本発明において、「所定の閾値」または「カットオフ値」の具体的な値については、解析方法や、測定条件などによって変更されるために限定されないが、例えば、免疫チェックポイント阻害剤に対して良好な応答を示す癌を罹患する患者群(non-PD群)と、免疫チェックポイント阻害剤に対して良好な応答を示さない癌を罹患する患者群(PD群)を比較する臨床研究;免疫チェックポイント阻害剤を投与した癌を罹患する患者の全生存期間(OS)及び無増悪生存期間(PFS)解析;免疫チェックポイント阻害剤を投与した癌を罹患する患者における有害事象の有無を比較した解析等により、別途決定されるものであってもよい。
In the present invention, the specific value of the "predetermined threshold" or "cutoff value" is not limited because it is changed depending on the analysis method, measurement conditions, etc., but for example, for an immune checkpoint inhibitor. A clinical study comparing a group of patients with cancer that responds well (non-PD group) to a group of patients with cancer that does not respond well to immune checkpoint inhibitors (PD group); Overall survival (OS) and progression-free survival (PFS) analysis of patients with cancer treated with checkpoint inhibitors; the presence or absence of adverse events in patients with cancer treated with immune checkpoint inhibitors was compared. It may be determined separately by analysis or the like.
本明細書において、「ゲノムパスウェイ」とは、対象における糞便又は腸内容物から得られた塩基配列によって同定され得るパスウェイ(代謝系又はシグナル伝達系における分子間の相互作用ネットワーク)であり、例えば、KEGG(Kyoto Encyclopedia of Genes and Genomes)PATHWAYデータベース(https://www.genome.jp/kegg/pathway.html)に登録されているパスウェイである。ゲノムパスウェイは、対象における糞便又は腸内容物から、例えば上述のメタゲノム解析と同様の方法によって得られ得るメタゲノムデータセットから、上記のKEGG PATHWAYデータベースを用いて同定可能である。本発明者らは、対象の糞便又は腸内容物から得られ得るメタゲノムデータセットを解析することによって、上皮細胞における細菌侵入(Bacterial invasion of epithelial cells)、脂肪酸の分解(Fatty acid degradation)、鞭毛集合(Flagellar assembly)、脂肪酸の生合成(Fatty acid biosynthesis)、及びPPARシグナルパスウェイ(PPAR signaling pathway)からなる群から1又は複数選択されるゲノムパスウェイのスコアが、免疫チェックポイント阻害剤に対して良好な応答を示す癌を罹患する患者群(non-PD群)と、免疫チェックポイント阻害剤に対して良好な応答を示さない癌を罹患する患者群(PD群)において、有意な差があることを見出した。また、ペプチドグリカンの生合成(Peptidoglycan biosynthesis)、ヌクレオチド代謝(Nucleotide metabolism)、プリン代謝(Purine metabolism)、フェニルアラニン代謝(Phenylalanine metabolism)及び脂肪酸の代謝(Fatty acid metabolism))からなる群から1又は複数選択されるゲノムパスウェイのスコアが、免疫チェックポイント阻害剤に対して良好な応答を示す癌を罹患する患者群(生存群、又は増悪なし群)と、免疫チェックポイント阻害剤に対して良好な応答を示さない癌を罹患する患者群(死亡群、又は増悪あり群)において、有意な差があることを見出した。
As used herein, a "genome pathway" is a pathway (inter-molecular interaction network in a metabolic or signaling system) that can be identified by a base sequence obtained from a fecal or intestinal content in a subject, eg, KEGG (Kyoto Encyclopedia of Genes and Genomes) PATHWAY database (https://www.genome.jp/kegg/pathway.html) is a pathway registered. Genome pathways can be identified using the above KEGG PATHWAY database from fecal or intestinal contents in the subject, for example from metagenomic datasets that can be obtained by methods similar to the metagenomic analysis described above. By analyzing the metagenome datasets that can be obtained from the feces or intestinal contents of the subject, the present inventors have bacterial invasion of epithelial cells, fatty acid degradation, and fluff aggregation. The score of one or more genomic pathways selected from the group consisting of (Flagellar assembly), fatty acid biosynthesis, and PPAR signal pathway (PPAR signing pathway) is good for immune checkpoint inhibitors. There is a significant difference between the group of patients with cancer that responds (non-PD group) and the group of patients with cancer that does not respond well to immune checkpoint inhibitors (PD group). I found it. In addition, peptide glycan biosynthesis (Peptidoglycan biosynthesis), nucleotide metabolism (Nucleotide metabolism), purine metabolism (Purine metabolism), phenylalanine metabolism (Phenylalanine metabolism) and metabolism of fatty acids (selected from Phenelylanine metabolism) and metabolism of fatty acids Metabolic pathway scores show good responses to cancer-affected patients (survival group or no exacerbation group) who respond well to immune checkpoint inhibitors and to immune checkpoint inhibitors. We found that there was a significant difference in the group of patients with no cancer (death group or group with exacerbations).
すなわち、一実施態様において、対象の糞便又は腸内容物におけるゲノムパスウェイのうち、上皮細胞における細菌侵入(Bacterial invasion of epithelial cells)、脂肪酸の分解(Fatty acid degradation)、鞭毛集合(Flagellar assembly)PPARシグナルパスウェイ(PPAR signaling pathway)及び/又はフェニルアラニン代謝(Phenylalanine metabolism)のスコアが、所定の閾値より低い場合、前記対象における免疫チェックポイント阻害剤に対する応答が良好であると予測することができる。また、他の態様において、対象の糞便又は腸内容物におけるゲノムパスウェイのうち、上皮細胞における細菌侵入(Bacterial invasion of epithelial cells)、脂肪酸の分解(Fatty acid degradation)、鞭毛集合(Flagellar assembly)PPARシグナルパスウェイ(PPAR signaling pathway)及び/又はフェニルアラニン代謝(Phenylalanine metabolism)のスコアが、所定の閾値より高い場合、前記対象における免疫チェックポイント阻害剤に対する応答が不良であると予測することができる。
That is, in one embodiment, among the genomic pathways in the feces or intestinal contents of the subject, bacterial invasion of epithelial cells, fatty acid metabolism, and flagellar assembly PPAR signals. When the score of PPAR signing passage and / or phenylalanine metabolism is lower than a predetermined threshold, it can be predicted that the response to the immune checkpoint inhibitor in the subject is good. In other embodiments, among the genomic pathways in the feces or intestinal contents of the subject, bacterial invasion of epithelial cells, fatty acid metabolism, and flagellar assembly PPAR signals. If the PPAR signing passage and / or phenylalanine metabolism scores are higher than a predetermined threshold, it can be predicted that the response to the immune checkpoint inhibitor in the subject is poor.
また、一実施態様において、対象の糞便又は腸内容物におけるゲノムパスウェイのうち、脂肪酸の生合成(Fatty acid biosynthesis)、ヌクレオチド代謝(Nucleotide metabolism)及び/又はペプチドグリカンの生合成(Peptidoglycan biosynthesis)のスコアが、所定の閾値より高い場合は、前記対象における免疫チェックポイント阻害剤に対する応答が良好であると予測することができる。また、他の実施態様において、対象の糞便又は腸内容物におけるゲノムパスウェイのうち、脂肪酸の生合成(Fatty acid biosynthesis)、ヌクレオチド代謝(Nucleotide metabolism)及び/又はペプチドグリカンの生合成(Peptidoglycan biosynthesis)のスコアが、所定の閾値より低い場合は、前記対象における免疫チェックポイント阻害剤に対する応答が不良であると予測することができる。
Further, in one embodiment, among the genomic pathways in the feces or intestinal contents of the subject, fatty acid biosynthesis (Fatty acid metabolism), nucleotide metabolism (Nucleotide metabolism) and / or peptide glycan biosynthesis (Peptidoglycan biosynthesis). If it is higher than a predetermined threshold, it can be predicted that the response to the immune checkpoint inhibitor in the subject is good. Further, in another embodiment, among the genomic pathways in the feces or intestinal contents of the subject, fatty acid biosynthesis, nucleotide metabolism (Nucleotide metabolism) and / or peptide glycan biosynthesis (Peptidoglycan biosynthesis). However, if it is lower than a predetermined threshold, it can be predicted that the response to the immune checkpoint inhibitor in the subject is poor.
また、他の態様において、対象の糞便又は腸内容物におけるゲノムパスウェイのうち、脂肪酸の代謝(Fatty acid metabolism)のスコアが、所定の閾値より高い場合は、前記対象において、免疫チェックポイント阻害剤により皮膚の有害事象を誘発すると予測することができる。
In another embodiment, if the fatty acid metabolism (Fatty acid metabolism) score of the genomic pathway in the feces or intestinal contents of the subject is higher than a predetermined threshold, the subject is subjected to an immune checkpoint inhibitor. It can be predicted to induce adverse skin events.
本発明において用いられるゲノムパスウェイのスコアは、対象の糞便又は腸内容物におけるメタゲノム解析を行い、得られるメタゲノムデータセットをKEGG PATHWAYデータベースに入力することによって、決定することができ、例えば、参考文献:Abubucker et al.PLoS Computational Biology 2012,(8)6 e1002358.を参考にすれば実施可能である。
The genomic pathway score used in the present invention can be determined by performing metagenomic analysis on the fecal or intestinal contents of the subject and inputting the resulting metagenomic dataset into the KEGG PHATWAY database, eg, References: Abubucker et al. PLoS Computational Biology 2012, (8) 6 e1002588. It can be implemented by referring to.
一実施態様において、本発明は、対象の血液、血清又は血漿における代謝産物の存在量を決定することによって、対象における免疫チェックポイント阻害剤に対する応答を予測することを可能とする。本発明者らは、対象の血液、血清又は血漿において、代謝産物、特に、乳酸、ピルビン酸、グルコース、2-オキソ酪酸、グリセリン酸、オクタン酸、シトルリン、2-ヒドロキシ酪酸及びピペコリン酸からなる群から1又は複数選択される代謝産物の存在量を指標とすることで、対象における免疫チェックポイント阻害剤に対する応答を予測することができることを見出した。すなわち、一実施態様において、対象の血液、血清又は血漿に存在する代謝産物のうち、乳酸、ピルビン酸、グルコース、グリセリン酸、オクタン酸、2-ヒドロキシ酪酸又は2-オキソ酪酸の存在量が、所定の閾値より低い場合、対象における免疫チェックポイント阻害剤に対する応答が良好であると予測することができる。また、他の実施態様において、対象の血液、血清又は血漿に存在する代謝産物のうち、乳酸、ピルビン酸、グルコース、グリセリン酸、オクタン酸、2-ヒドロキシ酪酸又は2-オキソ酪酸の存在量が、所定の閾値より高い場合、対象における免疫チェックポイント阻害剤に対する応答が不良であると予測することができる。
In one embodiment, the invention makes it possible to predict a response to an immune checkpoint inhibitor in a subject by determining the abundance of metabolites in the subject's blood, serum or plasma. The present inventors consist of metabolites, particularly lactic acid, pyruvate, glucose, 2-oxobutyric acid, glyceric acid, octanoic acid, citrulin, 2-hydroxybutyric acid and pipecholinic acid in the target blood, serum or plasma. It has been found that the response to an immune checkpoint inhibitor in a subject can be predicted by using the abundance of one or more selected metabolites as an index. That is, in one embodiment, the abundance of lactic acid, pyruvate, glucose, glyceric acid, octanoic acid, 2-hydroxybutyric acid or 2-oxobutyric acid among the metabolites present in the target blood, serum or plasma is predetermined. If it is lower than the threshold of, it can be predicted that the response to the immune checkpoint inhibitor in the subject is good. Further, in another embodiment, the abundance of lactic acid, pyruvate, glucose, glyceric acid, octanoic acid, 2-hydroxybutyric acid or 2-oxobutyric acid among the metabolites present in the blood, serum or plasma of the subject is determined. If it is higher than a predetermined threshold, it can be predicted that the response to the immune checkpoint inhibitor in the subject is poor.
また、他の実施態様において、対象の血液、血清又は血漿に存在する代謝産物のうち、ピペコリン酸及び/又はシトルリンの存在量が所定の閾値より高い場合は、前記対象における免疫チェックポイント阻害剤に対する応答が良好であると予測することが可能である。また、さらに別の実施態様において、対象の血液、血清又は血漿に存在する代謝産物のうち、ピペコリン酸及び/又はシトルリンの存在量が所定の閾値より低い場合は、前記対象における免疫チェックポイント阻害剤に対する応答が不良であると予測することが可能である。
Further, in another embodiment, when the abundance of pipecolic acid and / or citrulline among the metabolites present in the blood, serum or plasma of the subject is higher than a predetermined threshold value, the immune checkpoint inhibitor in the subject is referred to. It is possible to predict that the response will be good. In still another embodiment, if the abundance of pipecolic acid and / or citrulline among the metabolites present in the blood, serum or plasma of the subject is lower than a predetermined threshold, the immune checkpoint inhibitor in the subject. It is possible to predict that the response to is poor.
血液、血清又は血漿に存在する代謝産物の存在量を決定する方法は、特に限定されるわけではないが、公知のメタボローム解析方法を用いて決定すればよく、例えば、質量分析法や、核磁気共鳴法などによって決定されてもよい。質量分析法とは、血液、血清又は血漿試料を、イオン源を用いて気体状のイオンとし(イオン化)、分析部において、真空中で運動させ電磁気力を用いて、或いは飛行時間差によりイオン化した血液、血清又は血漿試料を質量電荷比に応じて分離し、検出できる質量分析計を用いた測定方法のことをいう。イオン源を用いてイオン化する方法としては、電子イオン化(EI)法、化学イオン化(CI)法、電界脱離イオン化(FD)法、高速原子衝撃(FAB)法、マトリックス支援レーザー脱離イオン化(MALDI)法、エレクトロスプレーイオン化(ESI)法等の方法を適宜選択することができ、また、分析部において、イオン化した血液、血清又は血漿試料を分離する方法としては、磁場偏向型、四重極型、イオントラップ型、飛行時間(TOF)型、フーリエ変換イオンサイクロトロン共鳴型等の分離方法を適宜選択することができる。また、2以上の質量分析法を組み合わせたタンデム型質量分析(MS/MS)を利用することができる。また、ガスクロマトグラフィー(GC)や液体クロマトグラフィー(LC)や高速液体クロマトグラフィー(HPLC)により、代謝物質群を夾雑物から分離・精製して分析してもよい。
The method for determining the abundance of metabolites present in blood, serum or plasma is not particularly limited, but may be determined using a known metabolome analysis method, for example, mass spectrometry or nuclear magnetic resonance. It may be determined by a resonance method or the like. In mass spectrometry, a blood, serum or plasma sample is converted into gaseous ions using an ion source (ionization), and the blood is ionized by moving it in a vacuum in a vacuum and using electromagnetic force or by a flight time difference in the analysis unit. , A measurement method using a mass spectrometer that can separate and detect serum or plasma samples according to the mass-to-charge ratio. Methods of ionization using an ion source include electron ionization (EI) method, chemical ionization (CI) method, electrospray ionization (FD) method, fast atom bombardment (FAB) method, and matrix-assisted laser desorption ionization (MALDI). ) Method, electrospray ionization (ESI) method, etc. can be appropriately selected, and the method for separating the ionized blood, serum, or plasma sample in the analysis unit is a magnetic field deflection type or a quadrupole type. , Ion trap type, flight time (TOF) type, Fourier transformed ion cyclotron resonance type and the like can be appropriately selected. Further, tandem mass spectrometry (MS / MS), which is a combination of two or more mass spectrometry methods, can be used. Further, the metabolites may be separated / purified from the contaminants and analyzed by gas chromatography (GC), liquid chromatography (LC) or high performance liquid chromatography (HPLC).
一実施態様において、前記ステップ(1)は、(iv)対象の血液、血清又は血漿における遺伝子の発現量を決定するステップであってもよい。この場合、決定する遺伝子は、MAPKパスウェイ、Type I IFN receptor complexパスウェイ及びTCRシグナルパスウェイからなる群から1又は複数選択されるパスウェイに関連する遺伝子であることが好ましい。本発明者らは、対象の血液、血清又は血漿における遺伝子の発現量を解析した結果、MAPKパスウェイ、Type I IFN receptor complexパスウェイ及びTCRシグナルパスウェイからなる群から1又は複数選択されるパスウェイに関連する遺伝子の発現が、免疫チェックポイント阻害剤に対して良好な応答を示す癌を罹患する患者群(non-PD群)と、免疫チェックポイント阻害剤に対して良好な応答を示さない癌を罹患する患者群(PD群)において、有意な差があることを見出した。また、本発明者らは、対象の血液、血清又は血漿における遺伝子の発現量を解析した結果、以下の遺伝子:BCL11B、ERCC3、ERCC6、FCRL1、FCRL3、MS4A1及びTCF7の発現が、免疫チェックポイント阻害剤に対して良好な応答を示す癌を罹患する患者群(生存群)と、免疫チェックポイント阻害剤に対して良好な応答を示さない癌を罹患する患者群(死亡群)において、有意な差があることを見出した。
In one embodiment, the step (1) may be (iv) a step of determining the expression level of the gene in the blood, serum or plasma of the target. In this case, the gene to be determined is preferably a gene related to one or a plurality of pathways selected from the group consisting of MAPK pathway, Type I IFN receptor compact pathway and TCR signal pathway. As a result of analyzing the expression level of the gene in the target blood, serum or plasma, the present inventors relate to one or a plurality of pathways selected from the group consisting of MAPK pathway, Type I IFN receptor complex pathway and TCR signal pathway. Patients with cancer whose gene expression responds favorably to immune checkpoint inhibitors (non-PD group) and cancers that do not respond favorably to immune checkpoint inhibitors We found that there was a significant difference in the patient group (PD group). In addition, as a result of analyzing the expression level of genes in the target blood, serum or plasma, the present inventors showed that the expression of the following genes: BCL11B, ERCC3, ERCC6, FCRL1, FCRL3, MS4A1 and TCF7 inhibited immune checkpoints. Significant difference between the group of patients with cancer who responded well to the drug (survival group) and the group of patients with cancer who did not respond well to immune checkpoint inhibitors (death group) I found that there is.
本明細書において、「MAPKパスウェイ(MAPKシグナルパスウェイともいう)」とは、MAP kinase(mitogen-activated protein kinase)が関与するシグナルパスウェイのことをいい、MAPKは、代謝、増殖、分裂、運動、アポトーシスなど、細胞のさまざまな機能に関与するセリン/トレオニン・キナーゼである。本発明において、免疫チェックポイント阻害剤に対する応答を予測するために用いられ得るMAPKパスウェイ関連遺伝子は、例えば、MAPKAPK5、MAPKAPK5-AS1、MAP3K14、MAPK3K7、MAP3K1、MAPK9、MAP3K5及びMAPK14から1又は複数選択される遺伝子が挙げられる。
In the present specification, the "MAPK pathway (also referred to as MAPK signal pathway)" refers to a signal pathway in which MAP kinase (mitogen-activated proteininase) is involved, and MAPK refers to metabolism, proliferation, division, motility, and apoptosis. It is a serine / threonine kinase that is involved in various functions of cells. In the present invention, the MAPK pathway-related genes that can be used to predict the response to an immune checkpoint inhibitor are selected, for example, one or more from MAPKAPK5, MAPKAPK5-AS1, MAP3K14, MAPK3K7, MAP3K1, MAPK9, MAP3K5 and MAPK14. Genes can be mentioned.
本明細書において、「Type I IFN receptor complexパスウェイ」に関連する遺伝子とは、PIK3R1、PTPN11、STAT1、FYN、EIF4B、RAC1、MAP3K1、RPS6KB1、PDCD4、REL、MAPK14、RPS6KA5、STAT2、CRK、MAP2K6、RAPGEF1などが挙げられる。
In the present specification, the genes related to "Type I IFN receptor complex pathway" are PIK3R1, PTPN11, STAT1, FYN, EIF4B, RAC1, MAP3K1, RPS6KB1, PDCD4, REL, MAPK14, RPS6KA5, ST. RAPGEF1 and the like can be mentioned.
本明細書において、「TCRシグナルパスウェイ」に関連する遺伝子とは、MAP3K14、CD4、FYN、DLG1、PDK1、NFKB1、MALT1、LAT、SOS1、MAP3K7、IL10、GRAP2、CD40LG、PIK3CA、PRKCQ、NFATC2、CALM1などが挙げられる。
In the present specification, the genes related to the "TCR signal pathway" are MAP3K14, CD4, FYN, DLG1, PDK1, NFKB1, MALT1, LAT, SOS1, MAP3K7, IL10, GRAP2, CD40LG, PIK3CA, PRKCQ, NFATC2, CALM1. And so on.
一実施態様において、MAPKパスウェイ、Type I IFN receptor complexパスウェイ及びTCRシグナルパスウェイからなる群から1又は複数選択されるパスウェイに関連する遺伝子の発現量(例えば、任意の方法により測定した算出した発現スコア)が、所定の閾値より高い場合、免疫チェックポイント阻害剤に対する応答が良好であると予測することができる。また、他の実施態様において、MAPKパスウェイ、Type I IFN receptor complexパスウェイ及びTCRシグナルパスウェイからなる群から1又は複数選択されるパスウェイに関連する遺伝子の発現量(例えば、任意の方法により測定した算出した発現スコア)が、所定の閾値より低い場合、免疫チェックポイント阻害剤に対する応答が不良であると予測することができる。
In one embodiment, the expression level of a gene associated with one or more pathways selected from the group consisting of MAPK pathway, Type I IFN receptor complex pathway and TCR signal pathway (eg, an expression score calculated by any method). However, if it is higher than a predetermined threshold, it can be predicted that the response to the immune checkpoint inhibitor is good. Further, in another embodiment, the expression level of a gene related to one or a plurality of pathways selected from the group consisting of MAPK pathway, Type I IFN receptor compact pathway and TCR signal pathway (for example, calculated by any method). When the expression score) is lower than a predetermined threshold, it can be predicted that the response to the immune checkpoint inhibitor is poor.
一実施態様において、BCL11B、ERCC3、ERCC6、FCRL1、FCRL3、MS4A1及びTCF7からなる群から1又は複数選択される遺伝子の発現量(例えば、任意の方法により測定した算出した発現スコア)が、所定の閾値より高い場合、免疫チェックポイント阻害剤に対する応答が良好であると予測することができる。また、他の実施態様において、BCL11B、ERCC3、ERCC6、FCRL1、FCRL3、MS4A1及びTCF7からなる群から1又は複数選択される遺伝子の発現量(例えば、任意の方法により測定した算出した発現スコア)が、所定の閾値より低い場合、免疫チェックポイント阻害剤に対する応答が不良であると予測することができる。
In one embodiment, the expression level of one or more genes selected from the group consisting of BCL11B, ERCC3, ERCC6, FCRL1, FCRL3, MS4A1 and TCF7 (eg, an expression score calculated by any method) is predetermined. If it is higher than the threshold, it can be predicted that the response to the immune checkpoint inhibitor is good. Further, in another embodiment, the expression level of one or a plurality of genes selected from the group consisting of BCL11B, ERCC3, ERCC6, FCRL1, FCRL3, MS4A1 and TCF7 (for example, the calculated expression score measured by an arbitrary method) is determined. If it is lower than a predetermined threshold, it can be predicted that the response to the immune checkpoint inhibitor is poor.
一実施態様において、対象の血液、血清又は血漿における遺伝子の発現量を決定するステップは、公知のトランスクリプトーム解析によって決定されるものであってもよい。
In one embodiment, the step of determining the expression level of a gene in the blood, serum or plasma of a subject may be determined by known transcriptome analysis.
一実施態様において、前記ステップ(1)は、(v)前記対象におけるIL6R及びNLRC5からなる群から1又は複数選択される遺伝子の一塩基多型(SNP)の有無を決定するステップであってもよく、ここで当該SNPは、以下のrs番号:rs2228145.1;rs7190199;及びrs7185320からなる群から1又は複数選択されるSNPであり得る。本発明者らは、免疫チェックポイント阻害剤を投与した癌を罹患する患者(皮膚の有害事象あり群/なし群)の全血ゲノムSNPsアレイ解析を実施した結果、特定のSNPと皮膚の有害事象の発生との間に相関があることを見出した。すなわち、対象が、rs2228145.1;rs7190199;及びrs7185320からなる群から1又は複数選択されるSNPを有する場合は、免疫チェックポイント阻害剤により皮膚の有害事象を誘発すると予測することができる。
In one embodiment, step (1) may be (v) determine the presence or absence of a single nucleotide polymorphism (SNP) in one or more selected genes from the group consisting of IL6R and NLRC5 in the subject. Frequently, the SNP here may be one or more selected SNPs from the group consisting of the following rs numbers: rs2228145.1; rs7190199; and rs7185320. As a result of performing whole blood genomic SNPs array analysis of patients suffering from cancer to whom an immune checkpoint inhibitor was administered (group with / without skin adverse events), the present inventors performed specific SNP and skin adverse events. We found that there was a correlation with the occurrence of. That is, if the subject has one or more SNPs selected from the group consisting of rs2228145.1; rs7190199; and rs7185320, it can be predicted that immune checkpoint inhibitors will induce skin adverse events.
本発明にかかる、癌を罹患する対象における、免疫チェックポイント阻害剤に対する応答を予測する方法は、上記の
(i)前記対象の糞便又は腸内容物における微生物の存在量;
(ii)前記対象の糞便又は腸内容物におけるゲノムパスウェイのスコア;
(iii)前記対象の血液、血清又は血漿における代謝産物の存在量;
(iv)前記対象の血液、血清又は血漿における遺伝子の発現量;及び
(v)前記対象におけるIL6R及びNLRC5からなる群から1又は複数選択される遺伝子の一塩基多型(SNP)
からなる群から1又は複数選択される値又はSNPの有無を組み合わせた指標により、対象における免疫チェックポイント阻害剤に対する応答を予測するものであってもよい。上記の指標を組み合わせることにより、より正診率が高くなる。 The method of predicting the response to an immune checkpoint inhibitor in a subject suffering from cancer according to the present invention is described in (i) the abundance of microorganisms in the fecal or intestinal contents of the subject;
(Ii) Genomic pathway score in the fecal or intestinal contents of the subject;
(Iii) Abundance of metabolites in the blood, serum or plasma of the subject;
(Iv) Gene expression levels in the subject's blood, serum or plasma; and (v) Single nucleotide polymorphisms (SNPs) of one or more genes selected from the group consisting of IL6R and NLRC5 in the subject.
A value selected from one or more of the group consisting of SNPs or an index combining the presence or absence of SNPs may be used to predict the response to an immune checkpoint inhibitor in a subject. By combining the above indicators, the correct diagnosis rate will be higher.
本発明の方法により、免疫チェックポイント阻害剤に対する応答が良好と判定された対象に、免疫チェックポイント阻害剤を投与することにより、治療効果が高まることが期待されるばかりでなく、医療経済にも貢献することができる。従って、一実施態様において、本発明は、癌を罹患する対象を治療する方法であって、
(1)以下:
(i)前記対象の糞便又は腸内容物における微生物の存在量;
(ii)前記対象の糞便又は腸内容物におけるゲノムパスウェイのスコア;
(iii)前記対象の血液、血清又は血漿における代謝産物の存在量;
(iv)前記対象の血液、血清又は血漿における遺伝子の発現量;及び
(v)前記対象におけるIL6R及びNLRC5からなる群から1又は複数選択される遺伝子の一塩基多型(SNP)
からなる群から1又は複数選択される値又はSNPの有無を決定するステップ、
(2)前記ステップ(1)で得られる値又はSNPの有無を指標として、前記対象における免疫チェックポイント阻害剤に対する応答を予測するステップ、
(3)免疫チェックポイント阻害剤に対する応答が良好と判定された前記対象に、前記免疫チェックポイント阻害剤を投与するステップ、
を含み、
前記微生物が、Geobacillus属、Gordonibacter属、Odoribacter属、Veillonella属、Corynebacterium属、Porphyromonas属、及びArthrobacter属からなる群から1又は複数選択される微生物であり、
前記ゲノムパスウェイが、上皮細胞における細菌侵入(Bacterial invasion of epithelial cells)、脂肪酸の分解(Fatty acid degradation)、鞭毛集合(Flagellar assembly)、脂肪酸の生合成(Fatty acid biosynthesis)、PPARシグナルパスウェイ(PPAR signaling pathway)、ペプチドグリカンの生合成(Peptidoglycan biosynthesis)、ヌクレオチド代謝(Nucleotide metabolism)、プリン代謝(Purine metabolism)、フェニルアラニン代謝(Phenylalanine metabolism)及び脂肪酸の代謝(Fatty acid metabolism)からなる群から1又は複数選択されるゲノムパスウェイであり、
前記代謝産物が、乳酸、ピルビン酸、グルコース、2-オキソ酪酸、グリセリン酸、オクタン酸、シトルリン、2-ヒドロキシ酪酸及びピペコリン酸からなる群から1又は複数選択される代謝産物であり、
前記遺伝子が、MAPKパスウェイ、Type I IFN receptor complexパスウェイ、及びTCRシグナルパスウェイに関連する遺伝子、並びにBCL11B、ERCC3、ERCC6、FCRL1、FCRL3、MS4A1及びTCF7からなる群から1又は複数選択される遺伝子であり、
前記SNPが、以下のrs番号:rs2228145.1;rs7190199;及びrs7185320からなる群から1又は複数選択されるSNPである、
方法、を提供するものであってもよい。 By administering the immune checkpoint inhibitor to a subject determined to have a good response to the immune checkpoint inhibitor by the method of the present invention, not only the therapeutic effect is expected to be enhanced, but also the medical economy is expected to be improved. Can contribute. Therefore, in one embodiment, the present invention is a method of treating a subject suffering from cancer.
(1) Below:
(I) Abundance of microorganisms in the feces or intestinal contents of the subject;
(Ii) Genomic pathway score in the fecal or intestinal contents of the subject;
(Iii) Abundance of metabolites in the blood, serum or plasma of the subject;
(Iv) Gene expression levels in the subject's blood, serum or plasma; and (v) Single nucleotide polymorphisms (SNPs) of one or more genes selected from the group consisting of IL6R and NLRC5 in the subject.
A step of determining the presence or absence of one or more selected values or SNPs from a group consisting of
(2) A step of predicting a response to an immune checkpoint inhibitor in the subject using the value obtained in the step (1) or the presence or absence of an SNP as an index.
(3) A step of administering the immune checkpoint inhibitor to the subject determined to have a good response to the immune checkpoint inhibitor.
Including
The microorganism is one or more selected from the group consisting of the genus Geobacillus, the genus Gordonibacter, the genus Odoribacter, the genus Veillonella, the genus Corynebacterium, the genus Polychromonas, and the genus Arthrobacter.
The genomic pathways include bacterial invasion of epithelial cells, fatty acid metabolism, flagellar metabolism, fatty acid biosynthesis (Fatty acid metabolism), fatty acid biosynthesis (Fatty acid metabolism), and fatty acid biosynthesis (Fatty acid metabolism). pathway), peptide glycan biosynthesis (Peptidoglycan biosynthesis), nucleotide metabolism (Nucleotide metabolism), purine metabolism (Purine metabolism), phenylalanine metabolism (Phenylalanine metabolism) It is a metabolic pathway,
The metabolite is one or more selected metabolites from the group consisting of lactic acid, pyruvic acid, glucose, 2-oxobutyric acid, glyceric acid, octanoic acid, citrulin, 2-hydroxybutyric acid and pipecholinic acid.
The gene is one or more selected from the group consisting of MAPK pathway, Type I IFN receptor complex pathway, TCR signal pathway-related gene, and BCL11B, ERCC3, ERCC6, FCRL1, FCRL3, MS4A1 and TCF7. ,
The SNP is one or a plurality of SNPs selected from the group consisting of the following rs numbers: rs2228145.1; rs71900199; and rs7185320.
It may provide a method.
また、一実施態様において、本発明は、記憶部11、入力部12、データ処理部14、及び出力部15を含む、癌を有する対象における免疫チェックポイント阻害剤にする応答性を判定するためのシステム10であって、
記憶部11は、
(1-i)糞便又は腸内容物における微生物の存在量;
(1-ii)糞便又は腸内容物におけるゲノムパスウェイのスコア;
(1-iii)血液、血清又は血漿における代謝産物の存在量;
(1-iv)血液、血清又は血漿における遺伝子の発現量;及び
(1-v)IL6R及びNLRC5からなる群から1又は複数選択される遺伝子の一塩基多型(SNP)
からなる群から1又は複数選択される免疫チェックポイント阻害剤にする応答性を判定するためのカットオフ値を記憶し、
記憶部11は、入力部12から、
(2-i)前記対象の糞便又は腸内容物における微生物の存在量;
(2-ii)前記対象の糞便又は腸内容物におけるゲノムパスウェイのスコア;
(2-iii)前記対象の血液、血清又は血漿における代謝産物の存在量;
(2-iv)前記対象の血液、血清又は血漿における遺伝子の発現量;及び
(2-v)前記対象におけるIL6R及びNLRC5からなる群から1又は複数選択される遺伝子の一塩基多型(SNP)
からなる群から1又は複数選択される値又はSNPの有無が入力され、記憶部11に記憶し、
データ処理部14が、記憶された前記値又はSNPの有無を、前記カットオフ値と比較して、前記対象における免疫チェックポイント阻害剤にする応答性を判定し、
出力部15が、前記対象における癌の免疫チェックポイント阻害剤にする応答性の判定結果を出力する、
ことを特徴とする、システム10であってもよい(図26)。 Further, in one embodiment, the present invention is for determining the responsiveness to an immune checkpoint inhibitor in a subject having cancer, including astorage unit 11, an input unit 12, a data processing unit 14, and an output unit 15. System 10
Thestorage unit 11
(1-i) Abundance of microorganisms in feces or intestinal contents;
(1-ii) Genomic pathway scores in fecal or intestinal contents;
(1-iii) Abundance of metabolites in blood, serum or plasma;
(1-iv) Gene expression levels in blood, serum or plasma; and (1-v) Single nucleotide polymorphisms (SNPs) of one or more selected genes from the group consisting of IL6R and NLRC5.
Memorize the cutoff value for determining responsiveness to one or more selected immune checkpoint inhibitors from the group consisting of
Thestorage unit 11 is connected to the input unit 12 from the input unit 12.
(2-i) Abundance of microorganisms in the feces or intestinal contents of the subject;
(2-ii) Genomic pathway score in the fecal or intestinal contents of the subject;
(2-iii) Abundance of metabolites in the blood, serum or plasma of the subject;
(2-iv) Gene expression level in the blood, serum or plasma of the subject; and (2-v) Single nucleotide polymorphism (SNP) of a gene selected one or more from the group consisting of IL6R and NLRC5 in the subject.
A value selected one or more from the group consisting of SNPs or the presence or absence of SNP is input and stored in thestorage unit 11.
Thedata processing unit 14 compares the presence or absence of the stored value or SNP with the cutoff value to determine the responsiveness to the immune checkpoint inhibitor in the subject.
Theoutput unit 15 outputs a determination result of responsiveness to the immune checkpoint inhibitor of cancer in the subject.
Thesystem 10 may be characterized in that (FIG. 26).
記憶部11は、
(1-i)糞便又は腸内容物における微生物の存在量;
(1-ii)糞便又は腸内容物におけるゲノムパスウェイのスコア;
(1-iii)血液、血清又は血漿における代謝産物の存在量;
(1-iv)血液、血清又は血漿における遺伝子の発現量;及び
(1-v)IL6R及びNLRC5からなる群から1又は複数選択される遺伝子の一塩基多型(SNP)
からなる群から1又は複数選択される免疫チェックポイント阻害剤にする応答性を判定するためのカットオフ値を記憶し、
記憶部11は、入力部12から、
(2-i)前記対象の糞便又は腸内容物における微生物の存在量;
(2-ii)前記対象の糞便又は腸内容物におけるゲノムパスウェイのスコア;
(2-iii)前記対象の血液、血清又は血漿における代謝産物の存在量;
(2-iv)前記対象の血液、血清又は血漿における遺伝子の発現量;及び
(2-v)前記対象におけるIL6R及びNLRC5からなる群から1又は複数選択される遺伝子の一塩基多型(SNP)
からなる群から1又は複数選択される値又はSNPの有無が入力され、記憶部11に記憶し、
データ処理部14が、記憶された前記値又はSNPの有無を、前記カットオフ値と比較して、前記対象における免疫チェックポイント阻害剤にする応答性を判定し、
出力部15が、前記対象における癌の免疫チェックポイント阻害剤にする応答性の判定結果を出力する、
ことを特徴とする、システム10であってもよい(図26)。 Further, in one embodiment, the present invention is for determining the responsiveness to an immune checkpoint inhibitor in a subject having cancer, including a
The
(1-i) Abundance of microorganisms in feces or intestinal contents;
(1-ii) Genomic pathway scores in fecal or intestinal contents;
(1-iii) Abundance of metabolites in blood, serum or plasma;
(1-iv) Gene expression levels in blood, serum or plasma; and (1-v) Single nucleotide polymorphisms (SNPs) of one or more selected genes from the group consisting of IL6R and NLRC5.
Memorize the cutoff value for determining responsiveness to one or more selected immune checkpoint inhibitors from the group consisting of
The
(2-i) Abundance of microorganisms in the feces or intestinal contents of the subject;
(2-ii) Genomic pathway score in the fecal or intestinal contents of the subject;
(2-iii) Abundance of metabolites in the blood, serum or plasma of the subject;
(2-iv) Gene expression level in the blood, serum or plasma of the subject; and (2-v) Single nucleotide polymorphism (SNP) of a gene selected one or more from the group consisting of IL6R and NLRC5 in the subject.
A value selected one or more from the group consisting of SNPs or the presence or absence of SNP is input and stored in the
The
The
The
当該システム10は、さらに分析測定部13を含むものであってもよく、前記分析測定部13が、前記対象の糞便又は腸内容物における微生物の存在量又はゲノムパスウェイのスコアを決定し、
前記分析測定部13が、前記対象の血液、血清又は血漿のおける代謝産物の存在量を決定し、
前記分析測定部13が、前記対象の血液、血清又は血漿における遺伝子の発現量を決定し、及び/又は
前記分析測定部13が、におけるIL6R及びNLRC5からなる群から1又は複数選択される遺伝子の一塩基多型(SNP)を決定し、
前記入力部12に代わり、又は前記入力部12を介して、前記分析測定部13で決定された前記微生物の存在量、前記ゲノムパスウェイのスコア、は前記代謝産物の存在量、前記遺伝子の発現量及び/又は前記SNPの有無を入力するものであってもよい(図26)。 Thesystem 10 may further include an analytical measurement unit 13, which determines the abundance of microorganisms or the genomic pathway score in the fecal or intestinal content of the subject.
The analysis andmeasurement unit 13 determines the abundance of metabolites in the blood, serum or plasma of the subject.
The analysis andmeasurement unit 13 determines the expression level of the gene in the blood, serum or plasma of the subject, and / or the analysis and measurement unit 13 is one or a plurality of genes selected from the group consisting of IL6R and NLRC5. Determine single nucleotide polymorphisms (SNPs)
The abundance of the microorganism, the score of the genomic pathway, the abundance of the metabolite, the expression level of the gene determined by the analysis /measurement unit 13 in place of or through the input unit 12. And / or the presence or absence of the SNP may be input (FIG. 26).
前記分析測定部13が、前記対象の血液、血清又は血漿のおける代謝産物の存在量を決定し、
前記分析測定部13が、前記対象の血液、血清又は血漿における遺伝子の発現量を決定し、及び/又は
前記分析測定部13が、におけるIL6R及びNLRC5からなる群から1又は複数選択される遺伝子の一塩基多型(SNP)を決定し、
前記入力部12に代わり、又は前記入力部12を介して、前記分析測定部13で決定された前記微生物の存在量、前記ゲノムパスウェイのスコア、は前記代謝産物の存在量、前記遺伝子の発現量及び/又は前記SNPの有無を入力するものであってもよい(図26)。 The
The analysis and
The analysis and
The abundance of the microorganism, the score of the genomic pathway, the abundance of the metabolite, the expression level of the gene determined by the analysis /
記憶部11は、RAM、ROM、フラッシュメモリ等のメモリ装置、ハードディスクドライブ等の固定ディスク装置、又はフレキシブルディスク、光ディスク等の可搬用の記憶装置等を有する。記憶部11は、分析測定部13で測定したデータ、入力部12から入力されたデータ及び指示、データ処理部14で行った演算処理結果等の他、情報処理装置の各種処理に用いられるコンピュータプログラム、データベース等を記憶する。コンピュータプログラムは、例えばCD-ROM、DVD-ROM等のコンピュータ読み取り可能な記録媒体や、インターネットを介してインストールされてもよい。コンピュータプログラムは、公知のセットアッププログラム等を用いて記憶部11にインストールされる。
The storage unit 11 has a memory device such as RAM, ROM, and flash memory, a fixed disk device such as a hard disk drive, or a portable storage device such as a flexible disk and an optical disk. The storage unit 11 is a computer program used for various processes of the information processing device, such as data measured by the analysis and measurement unit 13, data and instructions input from the input unit 12, calculation processing results performed by the data processing unit 14, and the like. , Database etc. are stored. The computer program may be installed via a computer-readable recording medium such as a CD-ROM or a DVD-ROM, or via the Internet. The computer program is installed in the storage unit 11 using a known setup program or the like.
入力部12は、インターフェイス等であり、キーボード、マウス等の操作部も含む。これにより、入力部12は、分析測定部13で測定したデータ、データ処理部14で行う演算処理の指示等を入力することができる。また、入力部12は、例えば分析測定部13が外部にある場合は、操作部とは別に、測定したデータ等をネットワークや記憶媒体を介して入力することができるインターフェイス部を含んでもよい。
The input unit 12 is an interface or the like, and includes an operation unit such as a keyboard and a mouse. As a result, the input unit 12 can input the data measured by the analysis and measurement unit 13, the instruction of the arithmetic processing performed by the data processing unit 14, and the like. Further, for example, when the analysis / measurement unit 13 is located outside, the input unit 12 may include an interface unit capable of inputting measured data or the like via a network or a storage medium, in addition to the operation unit.
分析測定部13は、前述の微生物の存在量、ゲノムパスウェイのスコア、代謝産物の存在量、遺伝子の発現量及び/又はSNPの測定工程を行う。したがって、分析測定部13は、微生物の存在量、ゲノムパスウェイのスコア、代謝産物の存在量、遺伝子の発現量及び/又はSNPの測定を可能にする構成を有する。分析測定部13は、以下のものに限定されることを意図するものではないが、例えば、メタゲノム解析を実施可能な次世代シークエンサー、代謝産物の存在量を決定することが可能な質量分析計や核磁気共鳴装置等、公知の機器を単独又は組み合わせて用いることができる。分析測定部13は、システム10とは別に構成されていてもよく、測定したデータ等をネットワークや記憶媒体を用いて入力部12を介して入力してもよい。
The analysis and measurement unit 13 performs the above-mentioned steps of measuring the abundance of microorganisms, the score of the genome pathway, the abundance of metabolites, the expression level of genes and / or SNP. Therefore, the analysis / measurement unit 13 has a configuration that enables measurement of the abundance of microorganisms, the score of the genomic pathway, the abundance of metabolites, the expression level of genes and / or SNP. The analysis and measurement unit 13 is not intended to be limited to the following, but for example, a next-generation sequencer capable of performing metagenome analysis, a mass spectrometer capable of determining the abundance of metabolites, and the like. Known devices such as nuclear magnetic resonance devices can be used alone or in combination. The analysis / measurement unit 13 may be configured separately from the system 10, and the measured data or the like may be input via the input unit 12 using a network or a storage medium.
データ処理部14は、入力部12又は分析測定部13から入力された値と、免疫チェックポイント阻害剤にする応答性を判定するためのカットオフ値とから、対象における癌の免疫チェックポイント阻害剤にする応答性を判定することができる。データ処理部14は、記憶部11に記憶しているプログラムに従って、分析測定部13で測定され記憶部11に記憶されたデータに対して、各種の演算処理を実行する。演算処理は、データ処理部14に含まれるCPUによりおこなわれる。このCPUは、分析測定部13、入力部12、記憶部11、及び出力部15を制御する機能モジュールを含み、各種の制御を行うことができる。これらの各部は、それぞれ独立した集積回路、マイクロプロセッサ、ファームウェア等で構成されてもよい。
The data processing unit 14 uses the value input from the input unit 12 or the analysis measurement unit 13 and the cutoff value for determining the responsiveness to the immune checkpoint inhibitor to determine the immune checkpoint inhibitor of the cancer in the subject. Responsiveness can be determined. The data processing unit 14 executes various arithmetic processes on the data measured by the analysis and measurement unit 13 and stored in the storage unit 11 according to the program stored in the storage unit 11. The arithmetic processing is performed by the CPU included in the data processing unit 14. This CPU includes a functional module that controls an analysis measurement unit 13, an input unit 12, a storage unit 11, and an output unit 15, and can perform various controls. Each of these parts may be composed of an independent integrated circuit, a microprocessor, firmware, or the like.
出力部15は、データ処理部で演算処理を行った結果を出力するように構成さる。出力部15は、演算処理の結果を直接表示する液晶ディスプレイ等の表示装置、プリンタ等の出力手段であってもよいし、外部記憶装置への出力又はネットワークを介して出力するためのインターフェイス部であってもよい。
The output unit 15 is configured to output the result of performing arithmetic processing in the data processing unit. The output unit 15 may be a display device such as a liquid crystal display that directly displays the result of arithmetic processing, an output means such as a printer, or an interface unit for outputting to an external storage device or outputting via a network. There may be.
[検査・測定キット]
本発明は、本発明にかかる評価項目((1-i)糞便又は腸内容物における微生物の存在量;(1-ii)糞便又は腸内容物におけるゲノムパスウェイのスコア;(1-iii)血液、血清又は血漿における代謝産物の存在量;(1-iv)血液、血清又は血漿における遺伝子の発現量;または(1-v)IL6R及びNLRC5からなる群から1又は複数選択される遺伝子の一塩基多型(SNP))を測定するための検査または測定キットに関する発明をも含む。 [Inspection / Measurement Kit]
The present invention relates to the endpoints of the invention ((1-i) abundance of microorganisms in feces or intestinal contents; (1-ii) scores of genomic pathways in feces or intestinal contents; (1-iii) blood, Abundance of metabolites in serum or plasma; (1-iv) expression of genes in blood, serum or plasma; or (1-v) one or more genes selected from the group consisting of IL6R and NLRC5. Also includes inventions relating to inspections or measurement kits for measuring type (SNP)).
本明細書において、明示的に引用される全ての特許文献及び非特許文献若しくは参考文献の内容は、全て本明細書の一部としてここに引用し得る。
All patent documents and non-patent documents or references explicitly cited herein may be cited herein as part of this specification.
以下、実施例に基づいて本発明を詳細に説明するが、本発明はこれらの実施例に限定されるものではない。当業者は本明細書の記載に基づいて容易に本発明に修飾・変更を加えることができ、それらは本発明の技術的範囲に含まれる。
Hereinafter, the present invention will be described in detail based on examples, but the present invention is not limited to these examples. Those skilled in the art can easily modify or modify the present invention based on the description of the present specification, and these are included in the technical scope of the present invention.
切除不能進行性胃癌症例におけるニボルマブのバイオマーカー探索を含めた観察研究(DELIVER試験)(JACCRO GC-08)で得られた検体(薬剤投与前)を用いて以下の解析を行った。DELIVER試験に関する詳細は、UMIN-CTR 臨床試験登録情報(UMIN試験ID:UMIN000030850)より確認できる。
The following analysis was performed using the sample (before drug administration) obtained in an observational study (DELIVER study) (JACCRO GC-08) including the search for biomarkers of nivolumab in cases of unresectable advanced gastric cancer. Details regarding the DELIVER test can be confirmed from the UMIN-CTR clinical trial registration information (UMIN test ID: UMIN000030850).
なお、実施例及び図面において、「前半」とは、トレーニングコホート(Training cohort)を意味し、「後半」とは、バリデーションコホート(Validation cohort)を意味している。
In the examples and drawings, the "first half" means a training cohort, and the "second half" means a validation cohort.
[実施例1]
<材料及び解析方法>
1.糞便メタゲノム解析
1-1.検体の採取
478症例(前半196サンプル+後半282サンプル)から専用スプーンで小豆程度の大きさの糞便を採取後、ただちにグアニジン溶液入りの容器に入れた。容器を5~6回振って中身を混合した後、1週間以内に医療機関へ提出し、-20℃または-80℃で保管した。 [Example 1]
<Materials and analysis methods>
1. 1. Fecal metagenomic analysis
1-1. Sample collection From 478 cases (196 samples in the first half + 282 samples in the second half), feces about the size of azuki beans were collected with a special spoon and immediately placed in a container containing a guanidine solution. After shaking thecontainer 5 to 6 times to mix the contents, the container was submitted to a medical institution within 1 week and stored at −20 ° C. or −80 ° C.
<材料及び解析方法>
1.糞便メタゲノム解析
1-1.検体の採取
478症例(前半196サンプル+後半282サンプル)から専用スプーンで小豆程度の大きさの糞便を採取後、ただちにグアニジン溶液入りの容器に入れた。容器を5~6回振って中身を混合した後、1週間以内に医療機関へ提出し、-20℃または-80℃で保管した。 [Example 1]
<Materials and analysis methods>
1. 1. Fecal metagenomic analysis
1-1. Sample collection From 478 cases (196 samples in the first half + 282 samples in the second half), feces about the size of azuki beans were collected with a special spoon and immediately placed in a container containing a guanidine solution. After shaking the
1-2.検体の調製
検体にジルコニアビーズを加え、菌体を破砕(5m/s, 2分間)した後、磁気ビーズを用いて精製、溶出し、メタゲノムDNAを抽出した。(参考文献:Hosomi et al. Scientific Reports 2017, (7) 4339.) 1-2. Preparation of sample Zirconia beads were added to the sample, the cells were disrupted (5 m / s, 2 minutes), and then purified and eluted using magnetic beads to extract metagenomic DNA. (Reference: Hosomi et al. Scientific Reports 2017, (7) 4339.)
検体にジルコニアビーズを加え、菌体を破砕(5m/s, 2分間)した後、磁気ビーズを用いて精製、溶出し、メタゲノムDNAを抽出した。(参考文献:Hosomi et al. Scientific Reports 2017, (7) 4339.) 1-2. Preparation of sample Zirconia beads were added to the sample, the cells were disrupted (5 m / s, 2 minutes), and then purified and eluted using magnetic beads to extract metagenomic DNA. (Reference: Hosomi et al. Scientific Reports 2017, (7) 4339.)
アガロースゲル電気泳動で品質を確認し、NanoPhotometer spectrophotometer (IMPLEN, CA, USA)とQubit 2.0 Flurometer (Life Technologies, CA, USA)を用いて、濃度の確認を行った。
The quality was confirmed by agarose gel electrophoresis, and the concentration was confirmed using NanoPhotometer spectrophotometer (IMPLEN, CA, USA) and Qubit 2.0 Flurometer (Life Technologies, CA, USA).
1-3.シークエンシング
シークエンスライブラリは、ゲノムDNAを1μg を用いてNEBNext Ultra DNA Library Prep Kit for Illumina (NEB, USA)で調整した。また、ライブラリ精製には、AMPure XP systemを用い、シークエンスライブラリの品質はAgilent2100 Bioanalyzer (Agilent Technologies, Santa Clara, CA)で確認した。シークエンスライブラリのシークエンスは、NovaSeq6000(Illumina, Inc., San Diego, CA) を使用し、150bpペアエンドで実施した。 1-3. Sequencing The sequencing library was prepared with 1 μg of genomic DNA in the NEBNext Ultra DNA Library Prep Kit for Illumina (NEB, USA). The APIPure XP system was used for library purification, and the quality of the sequence library was confirmed by Agilent 2100 Bioanalyzer (Agilent Technologies, Santa Clara, CA). The sequence of the sequence library was performed using NovaSeq6000 (Illumina, Inc., San Diego, CA) with a 150 bp pair end.
シークエンスライブラリは、ゲノムDNAを1μg を用いてNEBNext Ultra DNA Library Prep Kit for Illumina (NEB, USA)で調整した。また、ライブラリ精製には、AMPure XP systemを用い、シークエンスライブラリの品質はAgilent2100 Bioanalyzer (Agilent Technologies, Santa Clara, CA)で確認した。シークエンスライブラリのシークエンスは、NovaSeq6000(Illumina, Inc., San Diego, CA) を使用し、150bpペアエンドで実施した。 1-3. Sequencing The sequencing library was prepared with 1 μg of genomic DNA in the NEBNext Ultra DNA Library Prep Kit for Illumina (NEB, USA). The APIPure XP system was used for library purification, and the quality of the sequence library was confirmed by Agilent 2100 Bioanalyzer (Agilent Technologies, Santa Clara, CA). The sequence of the sequence library was performed using NovaSeq6000 (Illumina, Inc., San Diego, CA) with a 150 bp pair end.
2.血液細胞RNA発現解析(RNA-Seq)
2-1.検体の採取
439症例(前半174サンプル+後半265サンプル)から採取したRNA抽出用血液は、EDTA-2K入り採血管に採取後、ただちに10回以上転倒混和し、-20℃または-80℃で保管した。 2. 2. Blood cell RNA expression analysis (RNA-Seq)
2-1. Sample collection Blood for RNA extraction collected from 439 cases (174 samples in the first half + 265 samples in the second half) is collected in a blood collection tube containing EDTA-2K, immediately miscible 10 times or more, and stored at -20 ° C or -80 ° C. did.
2-2.検体の調製
Total RNAは、全血をTRIzol(商標) LS Reagent(Thermo Fisher)に溶解後、miRNeasy Micro Kit (QIAGEN, Valencia, CA, USA)にて抽出した。Total RNAの品質はAgilent 2100 Bioanalyzer RNA 6000 Pico Kit (Agilent Technologies, Santa Clara, CA)による電気泳動で確認した。 2-2. Specimen Preparation Total RNA was extracted from whole blood in TRIzol ™ LS Reagent (Thermo Fisher) and then with miRNeasy Micro Kit (QIAGEN, Valencia, CA, USA). The quality of Total RNA was confirmed by electrophoresis with Agilent 2100 Bioanalyzer RNA 6000 Pico Kit (Agilent Technologies, Santa Clara, CA).
Total RNAは、全血をTRIzol(商標) LS Reagent(Thermo Fisher)に溶解後、miRNeasy Micro Kit (QIAGEN, Valencia, CA, USA)にて抽出した。Total RNAの品質はAgilent 2100 Bioanalyzer RNA 6000 Pico Kit (Agilent Technologies, Santa Clara, CA)による電気泳動で確認した。 2-2. Specimen Preparation Total RNA was extracted from whole blood in TRIzol ™ LS Reagent (Thermo Fisher) and then with miRNeasy Micro Kit (QIAGEN, Valencia, CA, USA). The quality of Total RNA was confirmed by electrophoresis with Agilent 2100 Bioanalyzer RNA 6000 Pico Kit (Agilent Technologies, Santa Clara, CA).
2-3.シークエンシング
シークエンスライブラリは、Total RNA を用いてNEBNext Ultra II Directional RNA Library Prep Kit for Illumina (New England Biolabs, MA)およびNEBNext rRNA Depletion Kit (Human/Mouse/Rat) (New England Biolabs, MA)で調整した。シークエンスライブラリの品質はAgilent 2200 TapeStation High Sensitivity D1000 (Agilent Technologies, Santa Clara, CA)で確認し、濃度はKOD SYBR qPCR Mix(TOYOBO)を用いたqPCRで測定した。シークエンスライブラリのシークエンスは、NovaSeq6000(Illumina, Inc., San Diego, CA) を使用し、50bpペアエンドで実施した。 2-3. Sequencing Sequencing libraries use Total RNA for NEBNext Ultra II Directional RNA Library Prep Kit for Illumina (New England Biolabs, MA) and NEBNextRan (NEBNextRanb. .. The quality of the sequence library was confirmed by Agilent 2200 TapeStation High Sensitivity D1000 (Agilent Technologies, Santa Clara, CA), and the concentration was measured by KOD SYBR qPCR Mix (TOYOBO). The sequence of the sequence library was performed using NovaSeq6000 (Illumina, Inc., San Diego, CA) with a 50 bp pair end.
シークエンスライブラリは、Total RNA を用いてNEBNext Ultra II Directional RNA Library Prep Kit for Illumina (New England Biolabs, MA)およびNEBNext rRNA Depletion Kit (Human/Mouse/Rat) (New England Biolabs, MA)で調整した。シークエンスライブラリの品質はAgilent 2200 TapeStation High Sensitivity D1000 (Agilent Technologies, Santa Clara, CA)で確認し、濃度はKOD SYBR qPCR Mix(TOYOBO)を用いたqPCRで測定した。シークエンスライブラリのシークエンスは、NovaSeq6000(Illumina, Inc., San Diego, CA) を使用し、50bpペアエンドで実施した。 2-3. Sequencing Sequencing libraries use Total RNA for NEBNext Ultra II Directional RNA Library Prep Kit for Illumina (New England Biolabs, MA) and NEBNextRan (NEBNextRanb. .. The quality of the sequence library was confirmed by Agilent 2200 TapeStation High Sensitivity D1000 (Agilent Technologies, Santa Clara, CA), and the concentration was measured by KOD SYBR qPCR Mix (TOYOBO). The sequence of the sequence library was performed using NovaSeq6000 (Illumina, Inc., San Diego, CA) with a 50 bp pair end.
3.メタボローム解析
3-1.検体の採取
489症例(前半195サンプル+後半294サンプル)から採取した血漿用血液は、EDTA-2K入り採血管に採取後、ただちに10回以上転倒混和し、1200xgで10分間の遠心分離を行い、分離された上澄み液(血漿)を分取し分注管に分注し、-20℃または-80℃で保管した。 3. 3. Metabolome analysis
3-1. Plasma blood collected from 489 cases (first half 195 samples + second half 294 samples) was collected in a blood collection tube containing EDTA-2K, immediately miscible 10 times or more, and centrifuged at 1200 xg for 10 minutes. The separated supernatant (plasma) was separated, dispensed into a dispensing tube, and stored at −20 ° C. or −80 ° C.
3-1.検体の採取
489症例(前半195サンプル+後半294サンプル)から採取した血漿用血液は、EDTA-2K入り採血管に採取後、ただちに10回以上転倒混和し、1200xgで10分間の遠心分離を行い、分離された上澄み液(血漿)を分取し分注管に分注し、-20℃または-80℃で保管した。 3. 3. Metabolome analysis
3-1. Plasma blood collected from 489 cases (
3-2.検体の調製及び測定
各血漿サンプル50μlから代謝物を抽出したのち、メチルオキシム化およびトリメチルシリル化の2種類の誘導体化反応を行った。誘導体化したサンプルをガスクロマトグラフ質量分析計(島津製作所・GCMS-QP2010 Ultra)によるメタボローム解析に供し、有機酸、糖、アミノ酸など105種類の代謝物の定量をおこなった。具体的な手法は以下の参考文献の方法に従った(参考文献:Rodriguez-Martinez et al. Anal. Chem., 2017, 89 (21), pp 11405-11412)。 3-2. Preparation and measurement of samples After extracting metabolites from 50 μl of each plasma sample, two types of derivatization reactions, methyl oximation and trimethylsilylation, were carried out. The derivatized sample was subjected to metabolome analysis by a gas chromatograph mass spectrometer (Shimadzu Corporation, GCMS-QP2010 Ultra), and 105 kinds of metabolites such as organic acids, sugars and amino acids were quantified. The specific method followed the method of the following references (references: Rodriguez-Martinez et al. Anal. Chem., 2017, 89 (21), pp 11405-11421).
各血漿サンプル50μlから代謝物を抽出したのち、メチルオキシム化およびトリメチルシリル化の2種類の誘導体化反応を行った。誘導体化したサンプルをガスクロマトグラフ質量分析計(島津製作所・GCMS-QP2010 Ultra)によるメタボローム解析に供し、有機酸、糖、アミノ酸など105種類の代謝物の定量をおこなった。具体的な手法は以下の参考文献の方法に従った(参考文献:Rodriguez-Martinez et al. Anal. Chem., 2017, 89 (21), pp 11405-11412)。 3-2. Preparation and measurement of samples After extracting metabolites from 50 μl of each plasma sample, two types of derivatization reactions, methyl oximation and trimethylsilylation, were carried out. The derivatized sample was subjected to metabolome analysis by a gas chromatograph mass spectrometer (Shimadzu Corporation, GCMS-QP2010 Ultra), and 105 kinds of metabolites such as organic acids, sugars and amino acids were quantified. The specific method followed the method of the following references (references: Rodriguez-Martinez et al. Anal. Chem., 2017, 89 (21), pp 11405-11421).
4.PD(腫瘍増大)群とnon-PD(非腫瘍増大)群の比較
PD群とnon-PD群とは、本実施例において、以下のように定義した。 4. Comparison of PD (tumor growth) group and non-PD (non-tumor growth) group The PD group and non-PD group were defined as follows in this example.
PD群とnon-PD群とは、本実施例において、以下のように定義した。 4. Comparison of PD (tumor growth) group and non-PD (non-tumor growth) group The PD group and non-PD group were defined as follows in this example.
・PD群:治療を開始して初回の画像評価で腫瘍の増大を認める症例群
・non-PD群:治療を開始して初回の画像評価で腫瘍の大きさが維持されているか、または縮小している症例群 -PD group: A group of cases in which tumor growth is observed in the first image evaluation after starting treatment-Non-PD group: Tumor size is maintained or reduced in the first image evaluation after treatment is started Case group
・non-PD群:治療を開始して初回の画像評価で腫瘍の大きさが維持されているか、または縮小している症例群 -PD group: A group of cases in which tumor growth is observed in the first image evaluation after starting treatment-Non-PD group: Tumor size is maintained or reduced in the first image evaluation after treatment is started Case group
上記と定義し、糞便メタゲノム解析、血液細胞RNA発現解析、メタボローム解析の結果をPD群とnon-PD群で比較検討した。
Defined as above, the results of fecal metagenomic analysis, blood cell RNA expression analysis, and metabolome analysis were compared and examined between the PD group and the non-PD group.
<結果>
1.糞便メタゲノム解析
1-1.種属の多様性(Complexity)
多様性を示す指標として、ACE、CHAO1を用いてスコア化した結果、PR群で多様性が高いことが示された(図1)。なお、ACE、CHAO1の計算方法は以下の参考文献に従った(Chao et al. Stopping rules and estimation for recapture debugging with unequal failure rates. Biometrika, 1993, 80, 193-201.)。本結果から、糞便中の種属の多様性は、免疫チェックポイント阻害剤の効果予測バイオマーカーになりうる。 <Result>
1. 1. Fecal metagenomic analysis
1-1. Species diversity
As a result of scoring using ACE and CHAO1 as indicators of diversity, it was shown that the PR group had high diversity (Fig. 1). The calculation method of ACE and CHAO1 was in accordance with the following references (Chao et al. Stopping rules and estimation for debugging with unequal fare rates. From this result, the diversity of species in feces can be a biomarker for predicting the effect of immune checkpoint inhibitors.
1-2.PD(腫瘍増大)群 vs non-PD群における相関性解析
前半196サンプルのうち、臨床情報(薬剤効果あり/なしについての情報)が取得された180サンプルの糞便メタゲノムデータとの相関係数を計算し、その数値より、PD群 vs nonPD群で有意差がある菌種、および、機能的KEGGパスウエイを同定した。(図2、図3) 1-2. Correlation analysis in the PD (tumor growth) group vs non-PD group Of the 196 samples in the first half, the correlation coefficient with the fecal metagenome data of 180 samples for which clinical information (information on drug effect / non-drug effect) was obtained was calculated. Then, from the numerical values, bacterial species having a significant difference between the PD group vs. nonPD group and the functional KEGG pathway were identified. (Fig. 2, Fig. 3)
前半196サンプルのうち、臨床情報(薬剤効果あり/なしについての情報)が取得された180サンプルの糞便メタゲノムデータとの相関係数を計算し、その数値より、PD群 vs nonPD群で有意差がある菌種、および、機能的KEGGパスウエイを同定した。(図2、図3) 1-2. Correlation analysis in the PD (tumor growth) group vs non-PD group Of the 196 samples in the first half, the correlation coefficient with the fecal metagenome data of 180 samples for which clinical information (information on drug effect / non-drug effect) was obtained was calculated. Then, from the numerical values, bacterial species having a significant difference between the PD group vs. nonPD group and the functional KEGG pathway were identified. (Fig. 2, Fig. 3)
菌種については属レベルで、Geobacillus属、Gordonibacter属、Sebaldella属等がマーカーとして抽出され、機能的KEGGパスウェイについては、Bacterial invasion of epithelial cells, Flagellar assembly, Fatty acid degradation等が抽出された。
For bacterial species, Geobacillus, Gordonibacter, Sebaldella, etc. were extracted as markers at the genus level, and for the functional KEGG pathway, Bacterial invasion of epithelial cells, Fragellar fatty acid, etc. were extracted.
次に、前半で得られたマーカーを検証するために、後半282サンプルのうち、臨床情報(薬剤効果あり/なしについての情報)が取得された257サンプルの糞便メタゲノムデータを取得し、同様の解析を行った。
Next, in order to verify the markers obtained in the first half, fecal metagenomic data of 257 samples from which clinical information (information about drug effect / non-drug effect) was obtained out of the latter 282 samples was obtained and the same analysis was performed. Was done.
その結果、機能KEGGパスウエイについては、Bacterial invasion of epithelial cellsがPD群 vs non-PD群で有意差があるパスウエイとして再現した。(図4~6)
As a result, regarding the functional KEGG pathway, the bacterial invasion of epithelial cells was reproduced as a pathway with a significant difference between the PD group and the non-PD group. (Figs. 4-6)
さらに、詳細に機能KEGGパスウエイを調べたところ、PPAR Signaling pathway、Fatty acid関連のパスウェイが、PD群 vs nonPD群で差が見られた。(図7、図8)
Furthermore, when the functional KEGG pathway was investigated in detail, differences in PPAR Signaling pathway and Fatty acid-related pathways were found between the PD group and the nonPD group. (Figs. 7 and 8)
また、出現頻度の多い菌種(0.01%以上)に絞り込み、同様の解析を行った。
In addition, the same analysis was performed by narrowing down to the bacterial species (0.01% or more) that frequently appear.
その結果、前半では、Eubacterium属、Actinomyces属、Odoribacter属、Gordonibacter属、Eggerthlla属、Veillonella属が、PD群 vs nonPD群で有意差がみられ、後半では、Odoribacter属、Veillonella属、Parabacteroides属、Streptococcus属がPD群 vs nonPD群で有意差がみられた。
As a result, in the first half, there was a significant difference between the genus Eubacterium, the genus Actinomyces, the genus Odoribacter, the genus Gordonibacter, the genus Egerthlla, and the genus Velilonella, and in the latter half, the genus Odoribactercycle There was a significant difference in the genus between the PD group vs. the nonPD group.
前半、後半で共通する菌種として、Odoribacter属とVeillonella属の2種類が同定された。(図9、図10)
Two species, the genus Odribacter and the genus Veillonella, were identified as common bacterial species in the first half and the second half. (Figs. 9 and 10)
一方、菌種の全体のプロファイルを解析したところ、PD群 vs non-PD群で差はみられなかった。(図11、図12)
On the other hand, when the overall profile of the bacterial species was analyzed, no difference was observed between the PD group vs. the non-PD group. (Figs. 11 and 12)
2.血漿メタボローム解析
前半195サンプルのうち、臨床情報(薬剤効果あり/なしについての情報)が取得された181サンプルについてGC-MS解析データを用い、PD群 vs nonPD群の相関係数を計算し、解析を行った。その結果、乳酸、ピルビン酸、グルコース、2-オキソ酪酸、グリセリン酸、及びピペコリン酸など、図13のような代謝物が、差のあるマーカーとして得られた。 2. 2. Among the 195 samples in the first half of the plasma metabolome analysis , 181 samples for which clinical information (information on drug effect / non-drug effect) was acquired were analyzed by calculating the correlation coefficient of PD group vs nonPD group using GC-MS analysis data. Was done. As a result, metabolites as shown in FIG. 13, such as lactic acid, pyruvic acid, glucose, 2-oxobutyric acid, glyceric acid, and pipecolic acid, were obtained as markers with differences.
前半195サンプルのうち、臨床情報(薬剤効果あり/なしについての情報)が取得された181サンプルについてGC-MS解析データを用い、PD群 vs nonPD群の相関係数を計算し、解析を行った。その結果、乳酸、ピルビン酸、グルコース、2-オキソ酪酸、グリセリン酸、及びピペコリン酸など、図13のような代謝物が、差のあるマーカーとして得られた。 2. 2. Among the 195 samples in the first half of the plasma metabolome analysis , 181 samples for which clinical information (information on drug effect / non-drug effect) was acquired were analyzed by calculating the correlation coefficient of PD group vs nonPD group using GC-MS analysis data. Was done. As a result, metabolites as shown in FIG. 13, such as lactic acid, pyruvic acid, glucose, 2-oxobutyric acid, glyceric acid, and pipecolic acid, were obtained as markers with differences.
注目すべきは、様々な短鎖脂肪酸(乳酸、オキソ酪酸)がPD群 vs nonPD群を判別するマーカーとして同定された。(図14-1)
Of note, various short-chain fatty acids (lactic acid, oxobutyric acid) were identified as markers to discriminate between the PD group and the nonPD group. (Fig. 14-1)
また、前半及び後半サンプル群の両方においてPD群 vs nonPD群を判別可能な代謝産物マーカーについて解析を行った結果、乳酸、ピルビン酸、グルコース、グリセリン酸、オクタン酸、シトルリンが同定された(図14-2、図14-3)。
In addition, as a result of analyzing metabolite markers that can discriminate between the PD group and the nonPD group in both the first half and the second half sample groups, lactic acid, pyruvic acid, glucose, glyceric acid, octanoic acid, and citrulline were identified (FIG. 14). -2, Fig. 14-3).
同定された、PD群 vs non-PD群で差のある代謝物と、前述の糞便メタゲノム解析の結果(PD群 vs non-PD群で差のあるパスウエイ)の両方を、KEGGパスウェイ図に表示し、その関係性を調べてみると、一部のパスウェイと代謝物について相関関係があることがわかった。(図15)
Both the identified metabolites that differ between the PD group vs non-PD group and the results of the above-mentioned fecal metagenome analysis (pathways that differ between the PD group vs non-PD group) are displayed on the KEGG pathway diagram. , When examining the relationship, it was found that there is a correlation between some pathways and metabolites. (Fig. 15)
このことにより、腸内で得られた機能的な代謝パスウエイ情報が、血中の代謝物を反映していると考えられる。
From this, it is considered that the functional metabolic pathway information obtained in the intestine reflects the metabolites in the blood.
3.全血遺伝子発現解析(RNA-Seq)
前半174サンプルのうち、臨床情報(薬剤効果あり/なしについての情報)が取得された161サンプルについて、全血液中の遺伝子発現プロファイルを測定し、PD群 vs non-PD群の相関係数を計算し、解析を行った。その結果、図16のような遺伝子がマーカーとして同定された。 3. 3. Whole blood gene expression analysis (RNA-Seq)
Of the 174 samples in the first half, the gene expression profile in the whole blood was measured for 161 samples for which clinical information (information about drug effect / non-drug effect) was obtained, and the correlation coefficient between the PD group vs non-PD group was calculated. And analyzed. As a result, the gene shown in FIG. 16 was identified as a marker.
さらに遺伝子発現データから、機能的なアノテーション情報により(GO-Term)、PD群 vs non-PD群で差のある遺伝子群が特定のGO-Termに偏りがあるかどうかを調べた結果、MAPKパスウエイ、TCRシグナルパスウェイ、NF-kB、サイトカインシグナリング(例えば、Type I IFN receptor complex)等のパスウェイが、PD群 vs non-PD群で、その発現量に差があることがわかった。(図17-1~図17-7)
Furthermore, as a result of investigating whether or not the gene group having a difference between the PD group vs. non-PD group is biased to a specific GO-Term by functional annotation information (GO-Term) from the gene expression data, the MAPK pathway. , TCR signal pathway, NF-kB, cytokine signaling (for example, Type I IFN receptor complex), etc. were found to have different expression levels in the PD group vs non-PD group. (Fig. 17-1 to Fig. 17-7)
4.マーカー組み合わせによる薬剤効果予測
これまで同定したいくつかの効果予測バイオマーカーについて、複数のマーカーを組み合わせることによって、効果予測精度が向上するかどうかの検討を行った。 4. Prediction of drug effect by marker combination For some of the effect prediction biomarkers identified so far, we investigated whether the accuracy of effect prediction could be improved by combining multiple markers.
これまで同定したいくつかの効果予測バイオマーカーについて、複数のマーカーを組み合わせることによって、効果予測精度が向上するかどうかの検討を行った。 4. Prediction of drug effect by marker combination For some of the effect prediction biomarkers identified so far, we investigated whether the accuracy of effect prediction could be improved by combining multiple markers.
まず、種属の組合せで、Odoribacter属とVeliionella属の2種属を用いて、それぞれの頻度情報(発現量)を正規化し、その値を足し算することによりスコア化し、PD群 vs non-PD群の比較を行った結果、AUCが0.571~0.584、p値が0.020~0.036であった。(図18)
First, in the combination of species, the frequency information (expression level) of each of the two genera, Odoribacter and Verionella, is normalized and scored by adding the values, and the PD group vs non-PD group. As a result of comparison, the AUC was 0.571 to 0.584 and the p value was 0.020 to 0.036. (Fig. 18)
また、4つの種属の組合せ(Gordonibacter属、Geobacillus属、Odoribacter属、Veillonella属)でスコア化を行い、薬剤効果について予測した結果、AUCが0.571~0.634、p値が0.001~0.036で、効果ありの予測が最大60%、効果なしの予測が最大70%の正診率であった。(図19)
In addition, the AUC was 0.571 to 0.634 and the p value was 0.001 as a result of scoring with a combination of four species (Gordonibacter, Geobacillus, Odoribacter, Veillonella) and predicting the drug effect. At ~ 0.036, the correct diagnosis rate was up to 60% for the prediction with the effect and up to 70% for the prediction without the effect. (Fig. 19)
次に、前半サンプルの代謝物の組合せでは、ピルビン酸(Pyruvic acid),ピペコリン酸(Pipecolinic acid),グリセリン酸(Glyceric acid)の3つの代謝物を用いてスコア化した結果、AUCが0.708、効果ありの予測が51%、効果なしの予測が84%の正診率であった。(図20-1)
Next, in the combination of metabolites of the first half sample, AUC was 0.708 as a result of scoring using three metabolites of pyruvic acid (Pyruvic acid), pipecolic acid (Pipecolic acid), and glyceric acid (Glyceric acid). The correct diagnosis rate was 51% for the prediction that there was an effect and 84% for the prediction that there was no effect. (Fig. 20-1)
後半サンプルの代謝物の組合せにおいても検証した結果、効果ありの予測が53%、効果なしの予測が62%の正診率であった。(図20-2)
As a result of verifying the combination of metabolites in the latter half of the sample, the correct diagnosis rate was 53% for the prediction that there was an effect and 62% for the prediction that there was no effect. (Fig. 20-2)
ピルビン酸(Pyruvic acid),グリセリン酸(Glyceric acid)及び乳酸(Lactic acid)の3つの代謝物を用いてスコア化した。前半サンプルでは、効果ありの予測が51%、効果なしの予測が73%の正診率であり、後半サンプルでは、効果ありの予測が60%、効果なしの予測が60の正診率であった。(図20-3、図20-4)
Scores were made using three metabolites, pyruvic acid, glyceric acid, and lactic acid. In the first half sample, the correct diagnosis rate is 51% for the prediction with effect and 73% for the prediction without effect, and in the second half sample, the correct diagnosis rate is 60% for the prediction with effect and 60% for the prediction without effect. rice field. (Fig. 20-3, Fig. 20-4)
血液遺伝子発現マーカーの組合せ(前半サンプル)では、18遺伝子(TCR signaling pathway, MAPK signaling pathway, IF typeI signaling pathway等に含まれる遺伝子:CD247, STAT1, CCR5, CBLB, FYB, PIK3R1, RIPK1, STK38, FYN GATA3, CD3G, CD4, AEBP2, EIF4B, MAPKAPK5, PTPN11, MAP3K14, BID)の発現量を用いてスコア化した結果、AUCが0.598、効果ありの予測が43%、効果なしの予測が73%の正診率であった。(図21-1)
In the combination of blood gene expression markers (first half sample), genes contained in 18 genes (TCR signing pathway, MAPK signing pathway, IF typeI signing pathway, etc .: CD247, STAT1, CCR5, CB, BK3, BP1, BP, BP, BP, BP, and CFB, As a result of scoring using the expression levels of GATA3, CD3G, CD4, AEBP2, EIF4B, MAPKAPK5, PTPN11, MAP3K14, BID), AUC was 0.598, the prediction with effect was 43%, and the prediction without effect was 73%. It was the correct diagnosis rate. (Fig. 21-1)
後半サンプルも同様に、上記18遺伝子の発現量を用いてスコア化した結果、効果ありの予測が53%、効果なしの予測が59%の正診率であった。(図21-2)
Similarly, as a result of scoring the latter half sample using the expression levels of the above 18 genes, the correct diagnosis rate was 53% for the prediction with the effect and 59% for the prediction without the effect. (Fig. 21-2)
さらに、糞便の種属、パスウェイ、血漿代謝物を合わせて、いくつかの組合せでスコア化を行い、効果予測を行った。
Furthermore, the genus of feces, pathways, and plasma metabolites were combined and scored in several combinations to predict the effect.
組合せに用いたバイオマーカーは以下の15種類である。
Bacterial Invasion of epithelial cells, Fatty acid degradation, Flagellar assembly, Fatty acid biosynthesis, PPAR signaling pathway, Geobacillus, Gordonibacter, Odoribacter, Veillonella, Lactic acid, Pyruvic acid, Glucose, 2-Oxobutyric acid, Glyceric acid, Pipecolinic acid The following 15 types of biomarkers were used for the combination.
Bacterial Invasion of epithelial cells, Fatty acid degradation, Flagellar assembly, Fatty acid biosynthesis, PPAR signaling pathway, Geobacillus, Gordonibacter, Odoribacter, Veillonella, Lactic acid, Pyruvic acid, Glucose, 2-Oxobutyric acid, Glyceric acid, Pipecolinic acid
このうち、4~15個のマーカーを組み合わせてスコア化した結果、AUCが0.631~0.682、p値が0.00003~0.0025で、効果ありの予測が最大67%、効果なしの予測が最大74%の正診率であった。(図22~25)
Of these, as a result of scoring by combining 4 to 15 markers, the AUC was 0.631 to 0.682, the p-value was 0.00003 to 0.0025, the prediction of effectiveness was up to 67%, and there was no effect. Was predicted to have a correct diagnosis rate of up to 74%. (Figs. 22 to 25)
このように、複数のバイオマーカーを組み合わせて効果予測を行うことにより、より安定でロバストな予測が可能になると考えられる。
In this way, it is thought that more stable and robust prediction will be possible by predicting the effect by combining multiple biomarkers.
[実施例2]
糞便メタゲノム解析、血液細胞RNA発現解析(RNA-Seq)及びメタボローム解析の結果を用いた全生存期間(OS)解析及び無増悪生存期間(PFS)解析 [Example 2]
Overall survival (OS) analysis and progression-free survival (PFS) analysis using the results of fecal metagenome analysis, blood cell RNA expression analysis (RNA-Seq) and metabolome analysis
糞便メタゲノム解析、血液細胞RNA発現解析(RNA-Seq)及びメタボローム解析の結果を用いた全生存期間(OS)解析及び無増悪生存期間(PFS)解析 [Example 2]
Overall survival (OS) analysis and progression-free survival (PFS) analysis using the results of fecal metagenome analysis, blood cell RNA expression analysis (RNA-Seq) and metabolome analysis
実施例1と同一のサンプルを用いて、糞便メタゲノム解析、血液細胞RNA発現解析(RNA-Seq)及びメタボローム解析を実施してデータを取得し、それにより全生存期間(OS)及び無増悪生存期間(PFS)解析を行った。
Using the same sample as in Example 1, fecal metagenome analysis, blood cell RNA expression analysis (RNA-Seq) and metabolome analysis were performed to obtain data, thereby resulting in overall survival (OS) and progression-free survival. (PFS) analysis was performed.
本実施例のOS解析において、生存群と死亡群とは、以下のように定義した。
In the OS analysis of this example, the survival group and the death group were defined as follows.
・生存群:観察期間中に生存が確認された群
・死亡群:観察期間中に死亡が確認された群 ・ Survival group: Group confirmed to be alive during the observation period ・ Death group: Group confirmed to be dead during the observation period
・死亡群:観察期間中に死亡が確認された群 ・ Survival group: Group confirmed to be alive during the observation period ・ Death group: Group confirmed to be dead during the observation period
また、本実施例のPFS解析において、増悪あり群と増悪なし群とは、以下のように定義した。
Further, in the PFS analysis of this example, the group with exacerbation and the group without exacerbation were defined as follows.
・増悪あり群:観察期間中に増悪ありと確認された群
・増悪なし群:観察期間中に増悪なしと確認された群 ・ Group with exacerbation: Group confirmed to have exacerbation during the observation period ・ Group without exacerbation: Group confirmed to have no exacerbation during the observation period
・増悪なし群:観察期間中に増悪なしと確認された群 ・ Group with exacerbation: Group confirmed to have exacerbation during the observation period ・ Group without exacerbation: Group confirmed to have no exacerbation during the observation period
上記と定義し、糞便メタゲノム解析、血液細胞RNA発現解析、メタボローム解析の結果を生存群と死亡群、及び増悪あり群と増悪なし群で比較検討した。
Defined as above, the results of fecal metagenomic analysis, blood cell RNA expression analysis, and metabolome analysis were compared and examined in the surviving group and the dead group, and the exacerbation group and the non-exacerbation group.
生存群と死亡群の便メタゲノムを比較したOS解析及び増悪あり群と増悪なし群とを比較したPFS解析から、2群間で発現量に有意差を認めたマーカーを図27及び28に示す。
Figures 27 and 28 show the markers that showed a significant difference in the expression level between the two groups from the OS analysis comparing the stool metagenomics of the surviving group and the dead group and the PFS analysis comparing the exacerbation group and the exacerbation non-exacerbation group.
OS解析及びPFS解析の両者において、機能的KEGGパスウェイの中でもヌクレオチド代謝(Nucleotide metabolism)パスウェイの発現スコアが高い方が、生存期間の長期化及び癌の増悪無し、すなわち、免疫チェックポイント阻害剤による治療効果が高いことが明らかとなった。(図29~32)
In both OS analysis and PFS analysis, the one with a higher expression score of the nucleotide metabolism pathway among the functional KEGG pathways prolongs survival and does not exacerbate cancer, that is, treatment with an immune checkpoint inhibitor. It became clear that the effect was high. (Figs. 29-32)
また、多様性を示す指標であるCHAO1を用いてスコア化して、生存群と死亡群(OS解析)及び増悪あり群と増悪なし群(PFS解析)の糞便中の菌種の多様性をそれぞれ解析した結果、種属の多様性が高い方が、生存期間の長期化及び癌の増悪無し、すなわち、免疫チェックポイント阻害剤による治療効果が高いことが明らかとなった。(図33~36)
In addition, the diversity of bacterial species in feces of the surviving group and the dead group (OS analysis) and the exacerbation group and the exacerbation non-exacerbation group (PFS analysis) was analyzed by scoring using CHAO1 which is an index showing diversity. As a result, it was clarified that the higher the diversity of species, the longer the survival time and the exacerbation of cancer, that is, the higher the therapeutic effect of the immune checkpoint inhibitor. (Figs. 33-36)
さらに、生存群と死亡群(OS解析)を比較した結果、機能的KEGGパスウェイの中でもペプチドグリカンの生合成(Peptidoglycan biosynthesis)パスウェイの発現スコアが高い方が、生存期間の長期化、すなわち、免疫チェックポイント阻害剤による治療効果が高いことが明らかとなった。(図37~38)
Furthermore, as a result of comparing the survival group and the death group (OS analysis), the higher the expression score of the peptidoglycan biosynthesis pathway among the functional KEGG pathways, the longer the survival period, that is, the immune checkpoint. It became clear that the therapeutic effect of the inhibitor was high. (Figs. 37-38)
また、生存群と死亡群(OS解析)の血漿中代謝産物の量を比較した結果、血漿中の2-ヒドロキシ酪酸(2-Hydroxybutyric acid)及び2-オキソ酪酸(2-Oxobutryic acid)の発現スコアが高い方が、生存期間の長期化、すなわち、免疫チェックポイント阻害剤による治療効果が高いことが明らかとなった。(図39~42)
In addition, as a result of comparing the amounts of plasma metabolites in the survival group and the death group (OS analysis), the expression scores of 2-hydroxybutyric acid (2-Hydroxybutyric acid) and 2-oxobutyric acid (2-Oxobutryic acid) in plasma were compared. It was clarified that the higher the plasma value, the longer the survival time, that is, the higher the therapeutic effect of the immune checkpoint inhibitor. (Figs. 39-42)
血液細胞のRNA発現解析(RNA-Seq)データを正規化後、生存群と死亡群のデータについて群間比較を行い、前半サンプルと後半サンプルで再現するマーカー候補遺伝子を抽出した。Medianの差が0.5以上、かつ、t-testのP値が0.01以下となるマーカー遺伝子を探索した結果、図43に示す7つの遺伝子(BCL11B、ERCC3、ERCC6、FCRL1、FCRL3、MS4A1及びTCF7)が抽出された。これらの7つの遺伝子の発現スコアを合計し、生存群と死亡群で比較した結果、生存群で有意に高いことが示された。(図44及び45)
After normalizing the RNA expression analysis (RNA-Seq) data of blood cells, the data of the surviving group and the dead group were compared between the groups, and the marker candidate genes to be reproduced in the first half sample and the second half sample were extracted. As a result of searching for a marker gene having a Median difference of 0.5 or more and a t-test P value of 0.01 or less, the seven genes shown in FIG. 43 (BCL11B, ERCC3, ERCC6, FCRL1, FCRL3, MS4A1) And TCF7) were extracted. The expression scores of these seven genes were totaled and compared between the surviving group and the dead group, and as a result, it was shown to be significantly higher in the surviving group. (FIGS. 44 and 45)
増悪あり群と増悪なし群とを比較したPFS解析から、機能的KEGGパスウェイの中でもフェニルアラニン代謝(Phenylalanine metabolism)パスウェイの発現スコアが低い方が、癌の増悪なし、すなわち、免疫チェックポイント阻害剤による治療効果が高いことが明らかとなった。(図46~47)
From the PFS analysis comparing the exacerbation group and the non-exacerbation group, among the functional KEGG pathways, the one with the lower expression score of the phenylalanine metabolism pathway means that there is no exacerbation of cancer, that is, treatment with an immune checkpoint inhibitor. It became clear that the effect was high. (Figs. 46-47)
増悪あり群と増悪なし群とを比較したPFS解析から、血漿中のグリセリン酸(Glyceric acid)が低い方が、癌の増悪なし、すなわち、免疫チェックポイント阻害剤による治療効果が高いことが明らかとなった。(図48~49)
From the PFS analysis comparing the group with exacerbation and the group without exacerbation, it is clear that the lower the plasma glyceric acid, the more the cancer is not exacerbated, that is, the therapeutic effect of the immune checkpoint inhibitor is higher. became. (Figs. 48-49)
[実施例3]
糞便メタゲノムによる有害事象解析
実施例1と同一のサンプルを用いて、糞便メタゲノム解析を実施し、皮膚の有害事象がある56サンプルとそれ以外のサンプル間の群間比較を行い、前半サンプルと後半サンプルとで再現するマーカーを抽出した。Medianの差が0.01以上、かつ、t-testのP値が0.05以下となるマーカーを探索した。 [Example 3]
Adverse event analysis by fecal metagenomics Using the same sample as in Example 1, fecal metagenomic analysis was performed, and a comparison between 56 samples with skin adverse events and other samples was performed, and the first half sample and the second half sample were compared. The marker to be reproduced with was extracted. A marker having a Median difference of 0.01 or more and a t-test P value of 0.05 or less was searched for.
本実施例の有害事象解析において、有害事象あり群と有害事象なし群とは、以下のように定義した。
In the adverse event analysis of this example, the group with adverse events and the group without adverse events were defined as follows.
・有害事象あり群:観察期間中に、ざ瘡様皮疹、皮膚乾燥、そう痒症のいずれかの有害事象がみられた群
・有害事象なし群:観察期間中に、ざ瘡様皮疹、皮膚乾燥、そう痒症のいずれかの有害事象がみられなかった群 ・ Group with adverse events: Group with any adverse events of acne-like rash, dry skin, or pruritus during the observation period ・ Group without adverse events: Group with acne-like rash, skin during the observation period Group without any adverse events of dryness or pruritus
・有害事象なし群:観察期間中に、ざ瘡様皮疹、皮膚乾燥、そう痒症のいずれかの有害事象がみられなかった群 ・ Group with adverse events: Group with any adverse events of acne-like rash, dry skin, or pruritus during the observation period ・ Group without adverse events: Group with acne-like rash, skin during the observation period Group without any adverse events of dryness or pruritus
その結果、菌種としてはArthrobacter属、機能的KEGGパスウェイとしては脂肪酸の代謝(Fatty acid metabolism)が皮膚の有害事象の発生を予測するマーカーとなり得ることが示された。(図50)
As a result, it was shown that the genus Artrobacter as a bacterial species and the metabolism of fatty acids (Fatty acid metabolism) as a functional KEGG pathway can be markers for predicting the occurrence of skin adverse events. (Fig. 50)
[実施例4]
糞便メタゲノムによる有害事象解析
実施例1と同一のサンプルを用いて、全血サンプルからゲノム一塩基多型(SNPs)アレイ解析を行った。前半の175サンプルと後半の265サンプルのそれぞれからゲノムDNAを抽出し、ラベル化を行った。それらについてマイクロアレイ(イルミナ社製:Infinium Asian Screening ArrayBeadChip(~60万マーカー)によるSNPs解析を行った。データ解析には、GenomeStudio Softwareを使用した。 [Example 4]
Adverse event analysis by fecal metagenomics Genome single nucleotide polymorphisms (SNPs) array analysis was performed from whole blood samples using the same sample as in Example 1. Genomic DNA was extracted from each of the 175 samples in the first half and the 265 samples in the second half and labeled. SNPs analysis was performed on them by a microarray (Illumina: Infinium Screening ArrayBedChip (~ 600,000 markers). GenomeStudio Software was used for data analysis.
上記実施例3と同じ定義で分類した有害事象あり群(50サンプル)と有害事象なし群(390サンプル)の群間比較を行い、免疫関連遺伝子をターゲットとしたSNPsマーカーを抽出した。(図51)これらのマーカーのうち、タンパク質をコーディングするエキソン部分に存在するSNPsとして、IL6R遺伝子上のrs2228145.1、NLRC5遺伝子上のrs7190199、rs7185320が関連するもとして同定された。
A comparison was made between the group with adverse events (50 samples) and the group without adverse events (390 samples) classified according to the same definition as in Example 3, and SNPs markers targeting immune-related genes were extracted. (FIG. 51) Among these markers, rs2228145.1 on the IL6R gene, rs7190199 on the NLRC5 gene, and rs7185320 were identified as SNPs present in the exon moiety coding the protein.
Claims (29)
- 癌を罹患する対象における、免疫チェックポイント阻害剤に対する応答を予測する方法であって、
(1)以下:
(i)前記対象の糞便又は腸内容物における微生物の存在量;
(ii)前記対象の糞便又は腸内容物におけるゲノムパスウェイのスコア;
(iii)前記対象の血液、血清又は血漿における代謝産物の存在量;
(iv)前記対象の血液、血清又は血漿における遺伝子の発現量;及び
(v)前記対象におけるIL6R及びNLRC5からなる群から1又は複数選択される遺伝子の一塩基多型(SNP)
からなる群から1又は複数選択される値又はSNPの有無を決定するステップ、
(2)前記ステップ(1)で得られる値又はSNPの有無を指標として、前記対象における免疫チェックポイント阻害剤に対する応答を予測するステップ
を含み、
前記微生物が、Geobacillus属、Gordonibacter属、Odoribacter属、Veillonella属、Corynebacterium属、Porphyromonas属、及びArthrobacter属からなる群から1又は複数選択される微生物であり、
前記ゲノムパスウェイが、上皮細胞における細菌侵入(Bacterial invasion of epithelial cells)、脂肪酸の分解(Fatty acid degradation)、鞭毛集合(Flagellar assembly)、脂肪酸の生合成(Fatty acid biosynthesis)、PPARシグナルパスウェイ(PPAR signaling pathway)、ペプチドグリカンの生合成(Peptidoglycan biosynthesis)、ヌクレオチド代謝(Nucleotide metabolism)、プリン代謝(Purine metabolism)、フェニルアラニン代謝(Phenylalanine metabolism)及び脂肪酸の代謝(Fatty acid metabolism)からなる群から1又は複数選択されるゲノムパスウェイであり、
前記代謝産物が、乳酸、ピルビン酸、グルコース、2-オキソ酪酸、グリセリン酸、オクタン酸、シトルリン、2-ヒドロキシ酪酸及びピペコリン酸からなる群から1又は複数選択される代謝産物であり、
前記遺伝子が、MAPKパスウェイ、Type I IFN receptor complexパスウェイ、及びTCRシグナルパスウェイに関連する遺伝子、並びにBCL11B、ERCC3、ERCC6、FCRL1、FCRL3、MS4A1及びTCF7からなる群から1又は複数選択される遺伝子であり、
前記SNPが、以下のrs番号:rs2228145.1;rs7190199;及びrs7185320からなる群から1又は複数選択されるSNPである、
方法。 A method of predicting the response to immune checkpoint inhibitors in subjects with cancer.
(1) Below:
(I) Abundance of microorganisms in the feces or intestinal contents of the subject;
(Ii) Genomic pathway score in the fecal or intestinal contents of the subject;
(Iii) Abundance of metabolites in the blood, serum or plasma of the subject;
(Iv) Gene expression levels in the subject's blood, serum or plasma; and (v) Single nucleotide polymorphisms (SNPs) of one or more genes selected from the group consisting of IL6R and NLRC5 in the subject.
A step of determining the presence or absence of one or more selected values or SNPs from a group consisting of
(2) Including the step of predicting the response to the immune checkpoint inhibitor in the subject by using the value obtained in the step (1) or the presence or absence of SNP as an index.
The microorganism is one or more selected from the group consisting of the genus Geobacillus, the genus Gordonibacter, the genus Odoribacter, the genus Veillonella, the genus Corynebacterium, the genus Polychromonas, and the genus Arthrobacter.
The genomic pathways include bacterial invasion of epithelial cells, fatty acid metabolism, flagellar metabolism, fatty acid biosynthesis (Fatty acid metabolism), fatty acid biosynthesis (Fatty acid metabolism), and fatty acid biosynthesis (Fatty acid metabolism). pathway), peptide glycan biosynthesis (Peptidoglycan biosynthesis), nucleotide metabolism (Nucleotide metabolism), purine metabolism (Purine metabolism), phenylalanine metabolism (Phenylalanine metabolism) It is a metabolic pathway,
The metabolite is one or more selected metabolites from the group consisting of lactic acid, pyruvic acid, glucose, 2-oxobutyric acid, glyceric acid, octanoic acid, citrulin, 2-hydroxybutyric acid and pipecholinic acid.
The gene is one or more selected from the group consisting of MAPK pathway, Type I IFN receptor complex pathway, TCR signal pathway-related gene, and BCL11B, ERCC3, ERCC6, FCRL1, FCRL3, MS4A1 and TCF7. ,
The SNP is one or a plurality of SNPs selected from the group consisting of the following rs numbers: rs2228145.1; rs71900199; and rs7185320.
Method. - 前記ステップ(1)が、(i)前記対象の糞便又は腸内容物における微生物の存在量を決定するステップである、請求項1に記載の方法。 The method according to claim 1, wherein the step (1) is (i) a step of determining the abundance of microorganisms in the feces or intestinal contents of the subject.
- 前記Geobacillus属、前記Gordonibacter属、及び/又は前記Veillonella属の微生物の存在量が、所定の閾値より高い場合、並びに/あるいは、
前記Odoribacter属の微生物の存在量が、所定の閾値より低い場合は、前記対象における免疫チェックポイント阻害剤に対する応答が良好であると予測する、請求項1又は2に記載の方法。 When the abundance of microorganisms of the genus Geobacillus, the genus Gordonibacter, and / or the genus Veillonella is higher than a predetermined threshold, and / or.
The method according to claim 1 or 2, wherein when the abundance of the microorganism of the genus Odoribacter is lower than a predetermined threshold value, the response to the immune checkpoint inhibitor in the subject is predicted to be good. - 前記Veillonella属の微生物の存在量が、所定の閾値より高い場合、並びに/あるいは、
前記Odoribacter属の微生物の存在量が、所定の閾値より低い場合は、前記対象における免疫チェックポイント阻害剤に対する応答が良好であると予測する、請求項1又は2に記載の方法。 When the abundance of the microorganism of the genus Veillonella is higher than a predetermined threshold value, and / or
The method according to claim 1 or 2, wherein when the abundance of the microorganism of the genus Odoribacter is lower than a predetermined threshold value, the response to the immune checkpoint inhibitor in the subject is predicted to be good. - 前記Geobacillus属、前記Gordonibacter属、及び/又は前記Veillonella属の微生物の存在量が所定の閾値より低い場合、並びに/あるいは、
前記Odoribacter属の微生物の存在量が所定の閾値より高い場合は、前記対象における免疫チェックポイント阻害剤に対する応答が不良であると予測する、請求項1又は2に記載の方法。 When the abundance of microorganisms of the genus Geobacillus, the genus Gordonibacter, and / or the genus Veillonella is lower than a predetermined threshold, and / or.
The method according to claim 1 or 2, wherein when the abundance of the microorganism of the genus Odribacter is higher than a predetermined threshold value, the response to the immune checkpoint inhibitor in the subject is predicted to be poor. - 前記Veillonella属の微生物の存在量が所定の閾値より低い場合、並びに/あるいは、
前記Odoribacter属の微生物の存在量が所定の閾値より高い場合は、前記対象における免疫チェックポイント阻害剤に対する応答が不良であると予測する、請求項1又は2に記載の方法。 When the abundance of the microorganism of the genus Veillonella is lower than a predetermined threshold value, and / or
The method according to claim 1 or 2, wherein when the abundance of the microorganism of the genus Odribacter is higher than a predetermined threshold value, the response to the immune checkpoint inhibitor in the subject is predicted to be poor. - 前記Arthrobacter属の微生物の存在量が所定の閾値より高い場合は、前記対象において、免疫チェックポイント阻害剤により皮膚の有害事象を誘発すると予測する、請求項1又は2に記載の方法。 The method according to claim 1 or 2, wherein when the abundance of the microorganism belonging to the genus Arthrobacter is higher than a predetermined threshold value, it is predicted that the immune checkpoint inhibitor induces an adverse skin event in the subject.
- 前記微生物の存在量が、メタゲノム解析によって決定される、請求項1~7のいずれか1項に記載の方法。 The method according to any one of claims 1 to 7, wherein the abundance of the microorganism is determined by metagenomic analysis.
- 前記ステップ(1)が、(ii)前記対象の糞便又は腸内容物におけるゲノムパスウェイのスコアを決定するステップである、請求項1に記載の方法。 The method according to claim 1, wherein the step (1) is (ii) a step of determining the score of the genomic pathway in the fecal or intestinal contents of the subject.
- 前記上皮細胞における細菌侵入(Bacterial invasion of epithelial cells)、前記脂肪酸の分解(Fatty acid degradation)、前記鞭毛集合(Flagellar assembly)、前記PPARシグナルパスウェイ(PPAR signaling pathway)及び/又は前記フェニルアラニン代謝(Phenylalanine metabolism)のスコアが、所定の閾値より低い場合、並びに/あるいは、
前記脂肪酸の生合成(Fatty acid biosynthesis)、前記ヌクレオチド代謝(Nucleotide metabolism)及び/又は前記ペプチドグリカンの生合成(Peptidoglycan biosynthesis)のスコアが、所定の閾値より高い場合は、前記対象における免疫チェックポイント阻害剤に対する応答が良好であると予測する、請求項1又は9に記載の方法。 Bacterial invasion of epithelial cells, Fatty acid degradation, Flagellal assembly, PPAR signal pathway (PPAR signal pathway) ) Is lower than a predetermined threshold, and / or
If the scores of Fatty acid biosynthesis, Nucleotide metabolism and / or Peptidoglycan biosynthesis are higher than a predetermined threshold, the immunocheck point in the subject. The method of claim 1 or 9, wherein the response to is expected to be good. - 前記上皮細胞における細菌侵入(Bacterial invasion of epithelial cells)及び/又は前記フェニルアラニン代謝(Phenylalanine metabolism)のスコアが、所定の閾値より低い場合、並びに/あるいは、
前記ヌクレオチド代謝(Nucleotide metabolism)及び/又は前記ペプチドグリカンの生合成(Peptidoglycan biosynthesis)のスコアが、所定の閾値より高い場合は、前記対象における免疫チェックポイント阻害剤に対する応答が良好であると予測する、請求項1又は9に記載の方法。 When the score of bacterial invasion of epithelial cells and / or the phenylalanine metabolism in the epithelial cells is lower than a predetermined threshold, and / or,
If the score of the nucleotide metabolism (Nucleotide metabolism) and / or the biosynthesis of the peptidoglycan (Peptidoglycan biosynthesis) is higher than a predetermined threshold, the response to the immune checkpoint inhibitor in the subject is predicted to be good. Item 2. The method according to Item 1 or 9. - 前記上皮細胞における細菌侵入(Bacterial invasion of epithelial cells)、前記脂肪酸の分解(Fatty acid degradation)、前記鞭毛集合(Flagellar assembly)、前記PPARシグナルパスウェイ(PPAR signaling pathway)及び/又は前記フェニルアラニン代謝(Phenylalanine metabolism)のスコアが、所定の閾値より高い場合、並びに/あるいは、
前記脂肪酸の生合成(Fatty acid biosynthesis)、前記ヌクレオチド代謝(Nucleotide metabolism)及び/又は前記ペプチドグリカンの生合成(Peptidoglycan biosynthesis)のスコアが、所定の閾値より低い場合は、前記対象における免疫チェックポイント阻害剤に対する応答が不良であると予測する、請求項1又は9に記載の方法。 Bacterial invasion of epithelial cells, Fatty acid degradation, Flagellal assembly, PPAR signal pathway (PPAR signal pathway) ) Is higher than a predetermined threshold, and / or
If the scores of Fatty acid biosynthesis, Nucleotide metabolism and / or Peptidoglycan biosynthesis are lower than a predetermined threshold, the immune check point in the subject. The method of claim 1 or 9, wherein the response to is predicted to be poor. - 前記上皮細胞における細菌侵入(Bacterial invasion of epithelial cells)及び/又は前記フェニルアラニン代謝(Phenylalanine metabolism)のスコアが、所定の閾値より高い場合、並びに/あるいは、
前記ヌクレオチド代謝(Nucleotide metabolism)及び/又は前記ペプチドグリカンの生合成(Peptidoglycan biosynthesis)のスコアが、所定の閾値より低い場合は、前記対象における免疫チェックポイント阻害剤に対する応答が不良であると予測する、請求項1又は9に記載の方法。 When the score of bacterial invasion of epithelial cells and / or the phenylalanine metabolism in the epithelial cells is higher than a predetermined threshold, and / or,
Claims that if the Nucleotide metabolism and / or the biosynthesis of the peptidoglycan score is lower than a predetermined threshold, the response to the immune checkpoint inhibitor in the subject is predicted to be poor. Item 2. The method according to Item 1 or 9. - 前記脂肪酸の代謝(Fatty acid metabolism)のスコアが、所定の閾値より高い場合は、前記対象において、免疫チェックポイント阻害剤により皮膚の有害事象を誘発すると予測する、請求項1又は9に記載の方法。 The method according to claim 1 or 9, wherein when the fatty acid metabolism (Fatty acid metabolism) score is higher than a predetermined threshold value, the immune checkpoint inhibitor is predicted to induce an adverse skin event in the subject. ..
- 前記ゲノムパスウェイのスコアが、メタゲノム解析によって決定される、請求項1及び9~14のいずれか1項に記載の方法。 The method according to any one of claims 1 and 9 to 14, wherein the score of the genome pathway is determined by metagenomic analysis.
- 前記ステップ(1)が、(iii)前記対象の血液、血清又は血漿における代謝産物の存在量を決定するステップである、請求項1に記載の方法。 The method according to claim 1, wherein the step (1) is (iii) a step of determining the abundance of metabolites in the blood, serum or plasma of the subject.
- 前記乳酸、前記ピルビン酸、前記グルコース、前記グリセリン酸、前記オクタン酸、前記2-ヒドロキシ酪酸及び/又は前記2-オキソ酪酸の存在量が所定の閾値より低い場合、並びに/あるいは、
前記ピペコリン酸及び/又は前記シトルリンの存在量が所定の閾値より高い場合は、前記対象における免疫チェックポイント阻害剤に対する応答が良好であると予測する、請求項1又は16に記載の方法。 When the abundance of the lactic acid, the pyruvic acid, the glucose, the glyceric acid, the octanic acid, the 2-hydroxybutyric acid and / or the 2-oxobutyric acid is lower than a predetermined threshold value, and / or.
The method of claim 1 or 16, wherein if the abundance of pipecolic acid and / or citrulline is higher than a predetermined threshold, the response to the immune checkpoint inhibitor in the subject is predicted to be good. - 前記乳酸、前記ピルビン酸、前記グルコース、前記グリセリン酸、前記オクタン酸、前記2-ヒドロキシ酪酸及び/又は前記2-オキソ酪酸の存在量が所定の閾値より高い場合、並びに/あるいは、
前記ピペコリン酸及び/又は前記シトルリンの存在量が所定の閾値より低い場合は、前記対象における免疫チェックポイント阻害剤に対する応答が不良であると予測する、請求項1又は16に記載の方法。 When the abundance of the lactic acid, the pyruvic acid, the glucose, the glyceric acid, the octanic acid, the 2-hydroxybutyric acid and / or the 2-oxobutyric acid is higher than a predetermined threshold value, and / or.
The method of claim 1 or 16, wherein if the abundance of pipecolic acid and / or citrulline is below a predetermined threshold, the response to the immune checkpoint inhibitor in the subject is predicted to be poor. - 前記代謝産物の存在量が、メタボローム解析によって決定される、請求項1及び16~18のいずれか一項に記載の方法。 The method according to any one of claims 1 and 16 to 18, wherein the abundance of the metabolite is determined by metabolome analysis.
-
前記ステップ(1)が、(iv)前記対象の血液、血清又は血漿における遺伝子の発現量を決定するステップである、請求項1に記載の方法。
The method according to claim 1, wherein the step (1) is (iv) a step of determining the expression level of the gene in the blood, serum or plasma of the subject. - 前記MAPKパスウェイ、前記Type I IFN receptor complexパスウェイ、及び前記TCRシグナルパスウェイに関連する遺伝子からなる群から1又は複数選択されるパスウェイに関連する遺伝子の発現量が、所定の閾値より高い場合、あるいは
前記BCL11B、前記ERCC3、前記ERCC6、前記FCRL1、前記FCRL3、前記MS4A1及び前記TCF7からなる群から1又は複数選択される遺伝子の発現量が、所定の閾値より高い場合は、前記対象における免疫チェックポイント阻害剤に対する応答が良好であると予測する、請求項1又は20に記載の方法。 When the expression level of a gene related to a pathway selected one or more from the group consisting of the MAPK pathway, the Type I IFN receptor complex pathway, and the gene related to the TCR signal pathway is higher than a predetermined threshold, or the above-mentioned If the expression level of one or more genes selected from the group consisting of BCL11B, ERCC3, ERCC6, FCRL1, FCRL3, MS4A1 and TCF7 is higher than a predetermined threshold, immune checkpoint inhibition in the subject. The method of claim 1 or 20, wherein the response to the agent is predicted to be good. - 前記MAPKパスウェイ、前記Type I IFN receptor complexパスウェイ、及び前記TCRシグナルパスウェイに関連する遺伝子からなる群から1又は複数選択されるパスウェイに関連する遺伝子の発現量が、所定の閾値より低い場合、あるいは
前記BCL11B、前記ERCC3、前記ERCC6、前記FCRL1、前記FCRL3、前記MS4A1及び前記TCF7からなる群から1又は複数選択される遺伝子の発現量が、所定の閾値より低い場合は、前記対象における免疫チェックポイント阻害剤に対する応答が不良であると予測する、請求項1又は20に記載の方法。 When the expression level of one or a plurality of genes related to the pathway selected from the group consisting of the MAPK pathway, the Type I IFN receptor complex pathway, and the genes related to the TCR signal pathway is lower than a predetermined threshold, or the above-mentioned If the expression level of one or more genes selected from the group consisting of BCL11B, ERCC3, ERCC6, FCRL1, FCRL3, MS4A1 and TCF7 is lower than a predetermined threshold, immune checkpoint inhibition in the subject. The method of claim 1 or 20, wherein the response to the agent is predicted to be poor. - 前記遺伝子の発現量が、トランスクリプトーム解析によって決定される、請求項20~22のいずれか一項に記載の方法。 The method according to any one of claims 20 to 22, wherein the expression level of the gene is determined by transcriptome analysis.
- 前記ステップ(1)が、(v)前記対象における前記IL6R及び前記NLRC5からなる群から1又は複数選択される遺伝子の一塩基多型(SNP)の有無を決定するステップである、請求項1に記載の方法。 The step (1) is a step of (v) determining the presence or absence of a single nucleotide polymorphism (SNP) of one or a plurality of genes selected from the group consisting of the IL6R and the NLRC5 in the subject. The method described.
- 前記SNPを有する場合は、前記対象において、免疫チェックポイント阻害剤により皮膚の有害事象を誘発すると予測する、請求項1又は24に記載の方法。 The method according to claim 1 or 24, wherein if the SNP is present, the immune checkpoint inhibitor is predicted to induce an adverse skin event in the subject.
- 前記癌が胃癌である、請求項1~25のいずれか一項に記載の方法。 The method according to any one of claims 1 to 25, wherein the cancer is gastric cancer.
- 前記免疫チェックポイント阻害剤が、CTLA-4、PD-1、PD-L1、PD-L2、LAG-3、TIM3、BTLA、B7H3、B7H4、2B4、CD160、A2aR、KIR、VISTA、IDO1、Arginase I、TIGIT、およびCD115からなる群から選択される免疫チェックポイント分子の阻害剤である、請求項1~26のいずれか一項に記載の方法。 The immune checkpoint inhibitors are CTLA-4, PD-1, PD-L1, PD-L2, LAG-3, TIM3, BTLA, B7H3, B7H4, 2B4, CD160, A2aR, KIR, VISTA, IDO1, Arginase I. , TIGIT, and the method of any one of claims 1-26, which is an inhibitor of an immune checkpoint molecule selected from the group consisting of CD115.
- 前記免疫チェックポイント阻害剤が、抗PD-1抗体である、請求項1~26のいずれか一項に記載の方法。 The method according to any one of claims 1 to 26, wherein the immune checkpoint inhibitor is an anti-PD-1 antibody.
- 請求項1~28のいずれか一項に記載の方法により免疫チェックポイント阻害剤に対する応答が良好と判定されたがん患者に投与されることを特徴とする、免疫チェックポイント阻害剤を含有するがん治療剤。 It contains an immune checkpoint inhibitor, which is administered to a cancer patient determined to have a good response to the immune checkpoint inhibitor by the method according to any one of claims 1 to 28. Immune drug.
Priority Applications (1)
| Application Number | Priority Date | Filing Date | Title |
|---|---|---|---|
| JP2022550635A JPWO2022059785A1 (en) | 2020-09-18 | 2021-09-17 |
Applications Claiming Priority (2)
| Application Number | Priority Date | Filing Date | Title |
|---|---|---|---|
| JP2020157940 | 2020-09-18 | ||
| JP2020-157940 | 2020-09-18 |
Publications (1)
| Publication Number | Publication Date |
|---|---|
| WO2022059785A1 true WO2022059785A1 (en) | 2022-03-24 |
Family
ID=80776174
Family Applications (1)
| Application Number | Title | Priority Date | Filing Date |
|---|---|---|---|
| PCT/JP2021/034399 WO2022059785A1 (en) | 2020-09-18 | 2021-09-17 | Method for predicting response to immune checkpoint inhibitor |
Country Status (3)
| Country | Link |
|---|---|
| JP (1) | JPWO2022059785A1 (en) |
| TW (1) | TW202227643A (en) |
| WO (1) | WO2022059785A1 (en) |
-
2021
- 2021-09-17 TW TW110134919A patent/TW202227643A/en unknown
- 2021-09-17 WO PCT/JP2021/034399 patent/WO2022059785A1/en active Application Filing
- 2021-09-17 JP JP2022550635A patent/JPWO2022059785A1/ja active Pending
Non-Patent Citations (10)
| Title |
|---|
| ABDEL-WAHAB NOHA; DIAB ADI; YU ROBERT K.; FUTREAL ANDREW; CRISWELL LINDSEY A.; TAYAR JEAN H.; DADU RAMONA; SHANNON VICKIE; SHETE S: "Genetic determinants of immune-related adverse events in patients with melanoma receiving immune checkpoint inhibitors", CANCER IMMUNOLOGY IMMUNOTHERAPY, vol. 70, no. 7, 7 January 2021 (2021-01-07), Berlin/Heidelberg , pages 1939 - 1949, XP037479859, ISSN: 0340-7004, DOI: 10.1007/s00262-020-02797-0 * |
| BARTOUSKOVA M, SPISAROVÁ M, VITÁSKOVÁ D, ŠTUDENTOVÁ H,HUDCOVÁ M, ADAM T, MELICHAR B: "Association between neopterin and citrulline, a biomarker of gut function, during treatment with nivolumab", PTERIDINES, vol. 28, no. 1, 1 January 2017 (2017-01-01), pages 38, XP009535225, ISSN: 2195-4720 * |
| CHATRATH AJAY, RATAN AAKROSH, DUTTA ANINDYA: "Germline variants predictive of tumor mutational burden and immune checkpoint inhibitor efficacy", ISCIENCE, vol. 24, no. 3, 1 March 2021 (2021-03-01), US , pages 1 - 22, XP055912600, ISSN: 2589-0042, DOI: 10.1016/j.isci.2021.102248 * |
| DIMITRIOU FLORENTIA; HOGAN SABRINA; MENZIES ALEXANDER M.; DUMMER REINHARD; LONG GEORGINA V.: "Interleukin-6 blockade for prophylaxis and management of immune-related adverse events in cancer immunotherapy", EUROPEAN JOURNAL OF CANCER, vol. 157, 15 September 2021 (2021-09-15), Amsterdam NL , pages 214 - 224, XP086842431, ISSN: 0959-8049, DOI: 10.1016/j.ejca.2021.08.031 * |
| MASATAKA ICHIKAWA: "Relationship between gut bacteria and immunity and malignant tumors", JAPANESE JOURNAL OF CANCER AND CHEMOTHERAPY, vol. 46, no. 12, 1 January 2019 (2019-01-01), JP , pages 1807 - 1813, XP009535226, ISSN: 0385-0684 * |
| MUDD T. WILLIAM; LU CHUNWAN; KLEMENT JOHN D.; LIU KEBIN: "MS4A1 expression and function in T cells in the colorectal cancer tumor microenvironment", CELLULAR IMMUNOLOGY, vol. 360, 14 December 2020 (2020-12-14), US , XP086468303, ISSN: 0008-8749, DOI: 10.1016/j.cellimm.2020.104260 * |
| OLBRYT MAGDALENA, RAJCZYKOWSKI MARCIN, WIDŁAK WIESŁAWA: "Biological Factors behind Melanoma Response to Immune Checkpoint Inhibitors", INTERNATIONAL JOURNAL OF MOLECULAR SCIENCES, vol. 21, no. 11, pages 1 - 20, XP055912603, DOI: 10.3390/ijms21114071 * |
| OZCAN MINE, JANIKOVITS JONAS, VON KNEBEL DOEBERITZ MAGNUS, KLOOR MATTHIAS: "Complex pattern of immune evasion in MSI colorectal cancer", ONCOIMMUNOLOGY, vol. 7, no. 7, 3 July 2018 (2018-07-03), pages 1 - 10, XP055912652, DOI: 10.1080/2162402X.2018.1445453 * |
| SONG PENG: "Relationship between intestinal flora structure and metabolite analysis and immunotherapy efficacy in Chinese NSCLC patients", THORACIC CANCER, vol. 11, 23 April 2020 (2020-04-23), pages 1621 - 1632, XP055912534 * |
| SOUMAYA KOUIDHI, FARHAT BEN AYED, AMEL BENAMMAR ELGAAIED: "Targeting Tumor Metabolism: A New Challenge to Improve Immunotherapy", FRONTIERS IN IMMUNOLOGY, vol. 9, XP055757404, DOI: 10.3389/fimmu.2018.00353 * |
Also Published As
| Publication number | Publication date |
|---|---|
| TW202227643A (en) | 2022-07-16 |
| JPWO2022059785A1 (en) | 2022-03-24 |
Similar Documents
| Publication | Publication Date | Title |
|---|---|---|
| Daemen et al. | Pan-cancer metabolic signature predicts co-dependency on glutaminase and de novo glutathione synthesis linked to a high-mesenchymal cell state | |
| Freeman-Cook et al. | Expanding control of the tumor cell cycle with a CDK2/4/6 inhibitor | |
| US11584961B2 (en) | Biomarkers for inflammatory skin disease | |
| Qu et al. | A proteogenomic analysis of clear cell renal cell carcinoma in a Chinese population | |
| Chao et al. | Biomarkers of nucleic acid oxidation–A summary state-of-the-art | |
| Scherr et al. | Differential expression of miR-17∼ 92 identifies BCL2 as a therapeutic target in BCR-ABL-positive B-lineage acute lymphoblastic leukemia | |
| JP2016518124A (en) | Tumor cell response markers for anticancer therapy | |
| Boyer et al. | Multiomic characterization of pancreatic cancer-associated macrophage polarization reveals deregulated metabolic programs driven by the GM-CSF–PI3K pathway | |
| Wang et al. | Spatial metabolomics identifies distinct tumor-specific subtypes in gastric cancer patients | |
| US20220325359A1 (en) | Non-coding rna for detection of cancer | |
| WO2020149026A1 (en) | Prediction and/or determination marker for effectiveness of treatment with drug containing pd-1 signal inhibitor | |
| Tu et al. | An ion-current-based, comprehensive and reproducible proteomic strategy for comparative characterization of the cellular responses to novel anti-cancer agents in a prostate cell model | |
| He et al. | Gene set enrichment analysis and meta-analysis to identify six key genes regulating and controlling the prognosis of esophageal squamous cell carcinoma | |
| US20230235406A1 (en) | Immunoglobulin expression levels as biomarker for proteasome inhibitor response | |
| Ryzhakov et al. | Defactinib inhibits PYK2 phosphorylation of IRF5 and reduces intestinal inflammation | |
| Zeneyedpour et al. | Neoantigens in chronic obstructive pulmonary disease and lung cancer: a point of view | |
| Zheng et al. | Metabolic-dysregulation-based iEESI-MS reveals potential biomarkers associated with early-stage and progressive colorectal cancer | |
| Hwang et al. | CREB5 reprograms FOXA1 nuclear interactions to promote resistance to androgen receptor-targeting therapies | |
| Wang et al. | Expression and clinical significance of VISTA, B7-H3, and PD-L1 in glioma | |
| Shi et al. | Multilevel proteomic analyses reveal molecular diversity between diffuse-type and intestinal-type gastric cancer | |
| Li et al. | Biomarkers for the prediction of esophageal cancer neoadjuvant chemoradiotherapy response: A systemic review | |
| WO2022059785A1 (en) | Method for predicting response to immune checkpoint inhibitor | |
| Griffiths et al. | Novel ageing-biomarker discovery using data-intensive technologies | |
| Heo et al. | Combined biomarker for prediction of response to an immune checkpoint inhibitor in metastatic gastric cancer | |
| Jakkampudi et al. | Kynurenine pathway alteration in acute pancreatitis and its role as a biomarker of infected necrosis |
Legal Events
| Date | Code | Title | Description |
|---|---|---|---|
| 121 | Ep: the epo has been informed by wipo that ep was designated in this application |
Ref document number: 21869467 Country of ref document: EP Kind code of ref document: A1 |
|
| ENP | Entry into the national phase |
Ref document number: 2022550635 Country of ref document: JP Kind code of ref document: A |
|
| NENP | Non-entry into the national phase |
Ref country code: DE |
|
| 122 | Ep: pct application non-entry in european phase |
Ref document number: 21869467 Country of ref document: EP Kind code of ref document: A1 |