WO2021241580A1 - Abnormality/irregularity cause identifying apparatus, abnormality/irregularity cause identifying method, and abnormality/irregularity cause identifying program - Google Patents
Abnormality/irregularity cause identifying apparatus, abnormality/irregularity cause identifying method, and abnormality/irregularity cause identifying program Download PDFInfo
- Publication number
- WO2021241580A1 WO2021241580A1 PCT/JP2021/019802 JP2021019802W WO2021241580A1 WO 2021241580 A1 WO2021241580 A1 WO 2021241580A1 JP 2021019802 W JP2021019802 W JP 2021019802W WO 2021241580 A1 WO2021241580 A1 WO 2021241580A1
- Authority
- WO
- WIPO (PCT)
- Prior art keywords
- process data
- abnormality
- degree
- cause
- modulation
- Prior art date
Links
Images


Classifications
-
- G—PHYSICS
- G05—CONTROLLING; REGULATING
- G05B—CONTROL OR REGULATING SYSTEMS IN GENERAL; FUNCTIONAL ELEMENTS OF SUCH SYSTEMS; MONITORING OR TESTING ARRANGEMENTS FOR SUCH SYSTEMS OR ELEMENTS
- G05B23/00—Testing or monitoring of control systems or parts thereof
- G05B23/02—Electric testing or monitoring
- G05B23/0205—Electric testing or monitoring by means of a monitoring system capable of detecting and responding to faults
- G05B23/0218—Electric testing or monitoring by means of a monitoring system capable of detecting and responding to faults characterised by the fault detection method dealing with either existing or incipient faults
- G05B23/0221—Preprocessing measurements, e.g. data collection rate adjustment; Standardization of measurements; Time series or signal analysis, e.g. frequency analysis or wavelets; Trustworthiness of measurements; Indexes therefor; Measurements using easily measured parameters to estimate parameters difficult to measure; Virtual sensor creation; De-noising; Sensor fusion; Unconventional preprocessing inherently present in specific fault detection methods like PCA-based methods
-
- G—PHYSICS
- G05—CONTROLLING; REGULATING
- G05B—CONTROL OR REGULATING SYSTEMS IN GENERAL; FUNCTIONAL ELEMENTS OF SUCH SYSTEMS; MONITORING OR TESTING ARRANGEMENTS FOR SUCH SYSTEMS OR ELEMENTS
- G05B23/00—Testing or monitoring of control systems or parts thereof
- G05B23/02—Electric testing or monitoring
- G05B23/0205—Electric testing or monitoring by means of a monitoring system capable of detecting and responding to faults
- G05B23/0218—Electric testing or monitoring by means of a monitoring system capable of detecting and responding to faults characterised by the fault detection method dealing with either existing or incipient faults
- G05B23/0224—Process history based detection method, e.g. whereby history implies the availability of large amounts of data
- G05B23/024—Quantitative history assessment, e.g. mathematical relationships between available data; Functions therefor; Principal component analysis [PCA]; Partial least square [PLS]; Statistical classifiers, e.g. Bayesian networks, linear regression or correlation analysis; Neural networks
-
- G—PHYSICS
- G05—CONTROLLING; REGULATING
- G05B—CONTROL OR REGULATING SYSTEMS IN GENERAL; FUNCTIONAL ELEMENTS OF SUCH SYSTEMS; MONITORING OR TESTING ARRANGEMENTS FOR SUCH SYSTEMS OR ELEMENTS
- G05B23/00—Testing or monitoring of control systems or parts thereof
- G05B23/02—Electric testing or monitoring
- G05B23/0205—Electric testing or monitoring by means of a monitoring system capable of detecting and responding to faults
- G05B23/0218—Electric testing or monitoring by means of a monitoring system capable of detecting and responding to faults characterised by the fault detection method dealing with either existing or incipient faults
- G05B23/0243—Electric testing or monitoring by means of a monitoring system capable of detecting and responding to faults characterised by the fault detection method dealing with either existing or incipient faults model based detection method, e.g. first-principles knowledge model
- G05B23/0254—Electric testing or monitoring by means of a monitoring system capable of detecting and responding to faults characterised by the fault detection method dealing with either existing or incipient faults model based detection method, e.g. first-principles knowledge model based on a quantitative model, e.g. mathematical relationships between inputs and outputs; functions: observer, Kalman filter, residual calculation, Neural Networks
-
- G—PHYSICS
- G05—CONTROLLING; REGULATING
- G05B—CONTROL OR REGULATING SYSTEMS IN GENERAL; FUNCTIONAL ELEMENTS OF SUCH SYSTEMS; MONITORING OR TESTING ARRANGEMENTS FOR SUCH SYSTEMS OR ELEMENTS
- G05B23/00—Testing or monitoring of control systems or parts thereof
- G05B23/02—Electric testing or monitoring
- G05B23/0205—Electric testing or monitoring by means of a monitoring system capable of detecting and responding to faults
- G05B23/0259—Electric testing or monitoring by means of a monitoring system capable of detecting and responding to faults characterized by the response to fault detection
- G05B23/0275—Fault isolation and identification, e.g. classify fault; estimate cause or root of failure
-
- G—PHYSICS
- G05—CONTROLLING; REGULATING
- G05B—CONTROL OR REGULATING SYSTEMS IN GENERAL; FUNCTIONAL ELEMENTS OF SUCH SYSTEMS; MONITORING OR TESTING ARRANGEMENTS FOR SUCH SYSTEMS OR ELEMENTS
- G05B2223/00—Indexing scheme associated with group G05B23/00
- G05B2223/02—Indirect monitoring, e.g. monitoring production to detect faults of a system
-
- Y—GENERAL TAGGING OF NEW TECHNOLOGICAL DEVELOPMENTS; GENERAL TAGGING OF CROSS-SECTIONAL TECHNOLOGIES SPANNING OVER SEVERAL SECTIONS OF THE IPC; TECHNICAL SUBJECTS COVERED BY FORMER USPC CROSS-REFERENCE ART COLLECTIONS [XRACs] AND DIGESTS
- Y02—TECHNOLOGIES OR APPLICATIONS FOR MITIGATION OR ADAPTATION AGAINST CLIMATE CHANGE
- Y02P—CLIMATE CHANGE MITIGATION TECHNOLOGIES IN THE PRODUCTION OR PROCESSING OF GOODS
- Y02P90/00—Enabling technologies with a potential contribution to greenhouse gas [GHG] emissions mitigation
- Y02P90/02—Total factory control, e.g. smart factories, flexible manufacturing systems [FMS] or integrated manufacturing systems [IMS]
Definitions
- the present disclosure relates to an abnormal modulation cause identification device, an abnormal modulation cause identification method, and an abnormal modulation cause identification program.
- Patent Document 1 a technique for estimating the cause of an abnormality has been proposed using the operation data received from the plant. For example, a technique has been proposed in which the weighting of the probability of occurrence of the first abnormal event that has occurred in the past is heavier than the weighting of the probability of occurrence of the second abnormal event that has not occurred, and the cause of the sign of the abnormality is estimated (. Patent Document 1).
- Patent Document 2 the contribution rate indicating the contribution ratio of the process variable indicating the state of the process to be diagnosed is estimated, and based on the contribution rate, the pre-defined registration events are selected.
- Patent Document 2 A technique for estimating an event that may be the cause of an abnormality has also been proposed.
- the deviation index from the normal state of the process is calculated, and it occurs in the process based on the deviation index pattern set consisting of the deviation index calculated for each submodel.
- a technique for estimating the cause of an abnormal state has also been proposed (Patent Document 3).
- the monitoring contribution to the monitoring abnormality is calculated for each of the plurality of operation data constituting the monitoring operation data, and the diagnosis target data group composed of the top N operation data having a large monitoring contribution is extracted and diagnosed.
- the matching index of the target data group and the diagnostic reference data group composed of the top M driving data having a large reference contribution included in the reference driving data is calculated, and the matching index is equal to or higher than the matching judgment threshold.
- a technique for predicting plant abnormalities based on the above has also been proposed (Patent Document 4).
- JP-A-2018-109851 Japanese Unexamined Patent Publication No. 2018-120343 JP-A-2019-16039 Japanese Unexamined Patent Publication No. 2019-57164
- the anomaly modulation cause identification device continuously outputs data by a plurality of sensors provided in the production facility that performs a batch process of sequentially processing the processing target for each predetermined processing unit and a continuous process of continuously processing the processing target thereafter.
- the process data acquisition unit that reads the process data from the storage device that stores the process data to be stored, the range of the completion timing of the batch process, and the output timing of the process data in the continuous process are the residence time of the processing target in the production facility.
- An abnormality determination unit that calculates the degree of abnormality indicating the degree of modulation of the process data using the preprocessing unit associated with the preprocessing unit, the process data in the batch process associated with the preprocessing unit, and the process data in the continuous process.
- the causal relationship information defines the process data used for calculating the degree of abnormality for each of the process data output by the plurality of sensors according to the timing, period, or interval in the process performed by the production equipment, and the abnormality determination unit determines.
- the degree of abnormality may be calculated using the value extracted based on the timing, period, or interval defined by the causal relationship information. For example, timing, duration, or intervals can be defined based on the so-called knowledge base. If the values used to calculate the degree of abnormality can be defined in detail for the associated process data, the accuracy of abnormality judgment can be improved and the load on the system can be reduced by reducing unnecessary operations. Can be done.
- the abnormality determination unit uses a neural network model that compresses and restores the values of process data output by a plurality of sensors included in a predetermined combination in a continuous process, and the difference between the input and output of the neural network model.
- the degree of abnormality may be calculated according to the above. Especially in a continuous process, it is difficult to identify the characteristic timing at which the influence of an abnormality appears in the process data, but by evaluating the characteristics of the process data output by multiple sensors collectively, it is easy to identify the cause of the abnormal modulation. Become. Further, for example, if the process data of a plurality of sensors that change based on one cause are collectively evaluated according to the knowledge base, the accuracy of abnormality detection and cause identification can be improved.
- the contents described in the means for solving the problems can be combined as much as possible without departing from the problems and technical ideas of the present disclosure. Further, the content of the means for solving the problem can be provided as a device such as a computer or a system including a plurality of devices, a method executed by the computer, or a program executed by the computer. A recording medium for holding the program may be provided.
- FIG. 1 is a diagram showing an example of a system according to the present embodiment.
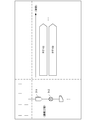
- FIG. 2 is a schematic diagram showing an example of a process performed by the equipment provided in the plant.
- FIG. 3 is a diagram for explaining an example of process data in a batch process.
- FIG. 4 is a diagram showing an example of a process line definition table set in advance.
- FIG. 5 is a diagram showing an example of a tag definition table set in advance.
- FIG. 6 is a diagram for explaining an example of process data in a continuous process.
- FIG. 7 is a diagram showing an example of traceability information.
- FIG. 8 is a diagram for explaining the correspondence between the process data in the continuous process and the serial number in the batch process.
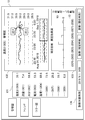
- FIG. 9 is a diagram showing an example of information registered in advance in the knowledge base.
- FIG. 9 is a diagram showing an example of information registered in advance in the knowledge base.
- FIG. 10 is a diagram showing an example of a logic tree showing the relationship between modulation and its cause.
- FIG. 11 is a diagram for explaining a process data synchronization process.
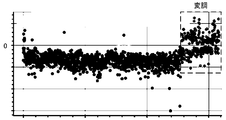
- FIG. 12 is a diagram for explaining an example of calculating the degree of abnormality of time-series data based on the distance from the reference.
- FIG. 13 is a diagram for explaining an example of calculating the degree of abnormality by the distance from the reference in consideration of the positive and negative directions of the time series data.
- FIG. 14 is a diagram for explaining abnormality detection using an autoencoder.
- FIG. 15 is a block diagram showing an example of the configuration of the abnormal modulation cause identification device.
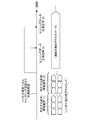
- FIG. 16 is a processing flow diagram showing an example of learning processing executed by the abnormal modulation cause identification device.
- FIG. 17 is a diagram showing an example of an action table.
- FIG. 18 is a processing flow diagram showing an example of abnormality detection processing executed by the abnormality modulation cause identification device.
- FIG. 19 is a diagram showing an example of a screen output to the input / output device.
- FIG. 20 is a diagram showing another example of the screen output to the input / output device.
- FIG. 1 is a diagram showing an example of a system according to the present embodiment.
- the system 100 includes an abnormal modulation cause identification device 1, a control station 2, and a plant 3.
- the system 100 is, for example, a distributed control system (DCS), and includes a plurality of control stations 2. That is, the control system of the plant 3 is divided into a plurality of sections, and each control section is distributed and controlled by the control station 2.
- the control station 2 is an existing facility in the DCS, and receives a state signal output from a sensor or the like included in the plant 3 or outputs a control signal to the plant 3. Then, based on the control signal, actuators such as valves and other equipment included in the plant 3 are controlled.
- the abnormal modulation cause identification device 1 acquires the status signal (process data) of the plant 3 via the control station 2.
- the process data includes the temperature, pressure, flow rate, etc. of the raw material and the intermediate product to be processed, and the set values that determine the operating conditions of the equipment provided in the plant 3.
- the anomaly modulation cause identification device 1 creates an anomaly detection model based on a knowledge base that stores a correspondence relationship between a assumed cause and an influence appearing as an anomaly, for example.
- a model for identifying anomalous modulation, its precursors, and its causes is created based on a method for detecting deviations from the permissible range for changes in process data created based on a knowledge base.
- the anomalous modulation cause identification device 1 can detect the occurrence or a sign of the anomalous modulation by using the model and the process data. Further, the anomalous modulation cause identification device 1 obtains, for example, a candidate for operating conditions for suppressing anomalous modulation based on a table that stores the cause of the anomalous modulation and an action for dealing with the cause and the identified cause. , May be presented to the user.
- FIG. 2 is a schematic diagram showing an example of a process performed by the equipment provided in the plant.
- the process may include a batch process 31 and a continuous process 32.
- the processing target is sequentially processed for each predetermined processing unit, and for example, processing such as receiving, holding, and discharging the raw material to each device is performed in order.
- the processing targets to be continuously introduced are continuously processed, and for example, processing such as acceptance, holding, and discharge of raw materials is performed in parallel.
- the process may include a plurality of series 33 that perform the same processing in parallel.
- the equipment that performs each treatment includes, for example, a reactor, a distillation apparatus, a heat exchanger, a compressor, a pump, a tank, etc., and these are connected via piping.
- sensors, valves, and the like are provided at predetermined positions of equipment and piping.
- the sensor may include a thermometer, a flow meter, a pressure gauge, a level meter, a densitometer, and the like.
- the sensor monitors the operating status of each device and outputs a status signal.
- the sensor included in the plant 3 is attached with a "tag" which is identification information for identifying each of the sensors. That is, the type of process data can be specified based on the tag.
- the abnormal modulation cause identification device 1 and the control station 2 manage the input / output signals to each device based on the tags.
- FIG. 3 is a diagram for explaining an example of process data in a batch process.
- the left column of FIG. 3 shows a portion of the process of batch step 31 shown in FIG. Specifically, the process includes a shredder 301, a cyclone 302, a pretreatment 303, a precooler 304, and a reactor 305. Further, these processes are classified into a pretreatment step, a precooling step, and a reaction step.
- the right column of FIG. 3 shows an example of process data acquired in each process. In the preprocessing step, time series data is acquired from the sensors whose tags are 001 and 002. In the precooling step, time series data is acquired from the sensors whose tags are 003 and 004.
- time series data is acquired from the sensors whose tags are 005, 006 and 007.
- the processing target associated with the serial number also referred to as “manufacturing number”, “batch number”, “control number”
- the serial number is identification information for identifying the processing targets to be collectively processed in the batch process.
- time-series data relating to the processing target associated with the subsequent serial number is obtained.
- the control station 2 manages a serial number and a step indicating a processing stage in a subdivided process constituting a batch process.
- the step is reset by the PLC (Programmable Logic Controller, sequencer) in the plant 3 connected to the control station 2, it is appropriate (for example, in the PLC) according to the timing of communication between the control station 2 and the plant 3.
- the serial number of the process data output from the control station 2 may be adopted (after the set time has elapsed after the step is switched). Further, the set time may be set for each production line or for each subdivided process.
- FIG. 4 is a diagram showing an example of a process line definition table that is set in advance.
- the process line definition table may be a so-called database table or a file of a predetermined format such as CSV. Further, the process line definition table is also created in advance by the user and read out by the abnormal modulation cause identification device 1.
- the process line definition table includes each attribute of series, process, manufacturing number, step, and product type. Identification information for identifying the process series is registered in the series field. In the process field, identification information indicating the subdivided process in the batch process is registered. In the serial number field, a serial number, which is identification information for identifying the processing targets to be collectively processed in the batch process, is registered. In the step field, the definition of the timing of a plurality of steps indicating the stage of processing in the process is registered. The type of processing target is registered in the field of product type.
- FIG. 5 is a diagram showing an example of a tag definition table set in advance.
- the tag definition table defines the acquisition timing of process data obtained from the sensor corresponding to each tag.
- the tag definition table may be a so-called database table or a file having a predetermined format such as CSV (Comma Separated Values). Further, the tag definition table is created in advance by the user and read out by the abnormal modulation cause identification device 1.
- the tag definition table includes each attribute of tag, series, process, and collection interval.
- a tag that is identification information of the sensor is registered in the tag field.
- Identification information for identifying the process series is registered in the series field.
- identification information indicating the subdivided process in the batch process is registered in the process field.
- identification information indicating the interval for acquiring the output value of the sensor is registered in the collection interval field.
- FIG. 6 is a diagram for explaining an example of process data in a continuous process.
- the left column of FIG. 6 shows a part of the process of the continuous process 32 shown in FIG. Specifically, the process includes a tank 311 and a pump 312.
- the right column of FIG. 6 shows an example of process data acquired in each process.
- time-series data associated with the tag and not associated with the serial number is continuously acquired from the sensor.
- time series data is acquired from each sensor whose tags are 102 and 103.
- the equipment continuously accepts the processing target and continuously performs the processing.
- FIG. 7 is a diagram showing an example of traceability information.
- the traceability information includes each attribute of sampling interval and residence time. In the field of sampling interval, an interval for sampling for process inspection by, for example, a reduction method in a continuous process is registered. In the residence time field, the time during which the processing target stays from the completion of the batch process to the arrival of the process included in the continuous process is registered.
- FIG. 8 is a diagram for explaining the correspondence between the process data in the continuous process and the serial number in the batch process.
- the process data is acquired, for example, at the intervals set in the traceability information.
- the process data in the continuous process can trace back the residence time of the processing target from the completion of the batch process to the time of measurement by the sensor, and can be associated with the serial number group in which the completion time of the batch process is included in the predetermined period.
- the accuracy of identifying the cause of abnormality can be improved by associating the serial number in batch processing with the measurement timing in continuous processes.
- FIG. 9 is a diagram showing an example of information registered in advance in the knowledge base.
- the knowledge base shall be stored in advance in the storage device of the abnormal modulation cause identification device 1.
- the table of FIG. 9 contains a column of "effects" corresponding to each of the sensors (tags) and a row indicating the "possible cause” of the modulation. That is, the direction of the value fluctuation is registered in the column corresponding to the sensor affected by the cause such as "cause 1" and "cause 2" shown in each row.
- the direction of fluctuation is indicated by “up” indicating an increase (rise) or “down” indicating a decrease (fall) of the output value of the sensor.
- the combination of cause and effect is not always one-to-one.
- the process data calculation method, extraction timing, threshold value used for abnormality determination, and the like are defined in association with each sensor.
- the calculation method line information indicating the calculation to be performed on the output value of each sensor is registered. In this embodiment, the calculation is performed by using a machine learning method such as a hoteling method, a k-nearest neighbor method, DTW Barycenter Averaging, Autoencoder, or a graphical lasso.
- the extraction timing line information indicating the timing of extracting the value used for abnormality determination among the output values of each sensor is registered. For example, in batch processing, the timing may be defined by a step indicating a processing stage in each step, a specific period, a time point, or the like.
- a threshold value which is a criterion for determining an abnormality in each abnormality determination method.
- the threshold value may include, for example, an upper limit and a lower limit.
- the knowledge base defines a combination of causal relationships between the causal event and the resulting effect of modulation of process data.
- the combination of causal relationships can be expressed in a tree format in which the modulation that appears as an effect is the root, the assumed cause is the leaf, and the events that appear in the process from the cause to the modulation are connected in a hierarchical manner along the time series. ..
- HAZOP Hazard and Operability Study
- HAZOP is, for example, a detection means at a monitoring point by instrumentation equipment constituting the plant, a control range (upper and lower thresholds and alarm setting points), a deviation from the control range (abnormality, modulation), and a control range.
- control range upper and lower thresholds and alarm setting points
- deviation from the control range abnormality, modulation
- control range lower thresholds and alarm setting points
- a deviation from the control range abnormality, modulation
- control range a control range
- logic detection means to determine which assumed cause caused deviation, influence of deviation, action to be taken when deviation occurs, action for the action , It is a method to associate these and enumerate them comprehensively.
- HAZOP HAZOP
- FTA fault Tree Analysis
- FMEA Finset Mode and Effect Analysis
- ETA Event Tree Analysis
- the knowledge base may be created based on the contents, the contents extracted from the work standard and the technical standard.
- abnormality detection is performed based on parameters that are considered to have a causal relationship in the knowledge base.
- the abnormality modulation cause identification device 1 extracts the data at a predetermined timing from the process data acquired from the plant 3, and determines the abnormality by a predetermined method. ..
- FIG. 10 is a diagram showing an example of a logic tree showing the relationship between modulation and its cause.
- the logic tree can be created based on the knowledge base shown in FIG. Further, in the logic tree of FIG. 10, the upstream side in the production process and the early events in the time series are arranged on the left side, and the downstream side in the production process and the subsequent events in the time series are arranged on the right side. , It is connected in a hierarchical manner with arrows toward the modulation that appears as an effect from the assumed cause.
- the logic tree branches and connects when there are multiple possible causes for one modulation in the knowledge base table, and displays a bundle of events that commonly appear in the process from the assumed cause to the modulation.
- the thick solid rectangle located at the upstream end of each branch corresponds to the assumed cause of the knowledge base table, and the numbers in parentheses in FIGS. 9 and 10 correspond to it.
- the thin solid rectangle corresponds to the influence of the knowledge base table and represents the phenomenon that can be observed by the process data. For each of these effects, an operation is performed according to the operation method defined in the knowledge base table.
- a model including a mathematical formula for performing the above calculation is defined, and the model can be used to detect an abnormality or a sign thereof, and to support identification of the cause.
- the above-mentioned operation may include, for example, the following method. Further, the abnormal modulation cause identification device 1 may display these calculation results.
- Hotelling method For example, assuming that multiple process data obtained from one sensor follow a predetermined probability density function, the population mean and standard deviation are estimated from the sample mean and sample standard deviation calculated using the process data. A given probability density function is, for example, a normal distribution. Then, the degree of anomaly is obtained based on the distance from the average of the population to the process data to be verified. For example, the degree of anomaly is determined based on the square of the Mahalanobis distance. The instantaneous value of the process data itself may be used, or the degree of abnormality based on the hoteling theory can be determined by using the maximum value, minimum value, integral value, standard deviation, differential coefficient (slope), etc. of the process data in a predetermined period. It may be calculated. According to the hoteling method, outliers from a predetermined standard can be detected.
- a given probability density function is, for example, a normal distribution.
- the degree of anomaly is obtained based on the distance from the average of the population to the process data to be verified. For example, the degree
- time-series process data obtained from one or more sensors is vectorized or matrixed, and the distance between the data is calculated.
- the distance may be Euclidean distance, Mahalanobis distance or Manhattan distance.
- the degree of abnormality is determined according to the distance from the data to be verified to the data closest to the kth.
- the judgment is made based on the relationship with other data. Therefore, for example, when normal values can be classified into a plurality of clusters, outliers far from any of the plurality of clusters can be detected.
- FIG. 11 is a diagram for explaining a process data synchronization process. For each value that is an element included in the time series data of batch processing with different serial numbers, the shortest distance between the values included in the different time series data is calculated as a whole, and the integrated value of the shortest distance is minimized. In addition, the time series data is slid in the time axis direction for alignment.
- a plurality of time-series data are synchronized based on the similarity of the time-series data.
- the degree of abnormality is calculated by the k-nearest neighbor method or the hoteling theory based on the integrated value of the distances between the synchronized time series data.
- anomalies can be detected based on the degree of similarity between time series data.
- FIG. 12 is a diagram for explaining an example in which the degree of abnormality is calculated based on the magnitude of the distance from the reference for the time series data.
- FIG. 13 is a diagram for explaining an example of calculating the degree of abnormality by the distance from the reference in consideration of the positive and negative directions for the same time series data.
- the vertical axis represents, for example, the degree of deviation from the average. Modulation actually occurs in the portion indicated by the broken line rectangle, but it is difficult to detect it only from the values shown in the example of FIG. On the other hand, in the example of FIG. 13, since the positive and negative directions tend to deviate in the opposite direction, it is easy to detect the modulation.
- the degree of anomaly as shown in FIG. 13 can be obtained by obtaining the degree of deviation from the reference as a positive or negative signed value without squaring the distance.
- a positive or negative sign is determined for a characteristic point such as a maximum value in time series data by, for example, the following formula, and the calculated value is multiplied by the magnitude of the distance.
- Code determination formula ( ⁇ -x) /
- the sign representing the above can be determined. Further, by using a signed value indicating the degree of deviation from the standard, the degree of abnormality as shown in FIG. 13 can be obtained, and false detection can be suppressed. Further, as a characteristic point in the time series data, in addition to the maximum value, the minimum value, the difference between the process data at a certain time point and the process data at another time point, and the like may be used.
- FIG. 14 is a diagram for explaining abnormality detection using an autoencoder.
- abnormality determination is performed based on the characteristics of the relationship of process data from a plurality of sensors.
- a neural network for example, a model that can compress (encode) and restore (decode) input data by using the process data itself of continuous processing or batch processing, which is input data, as a teacher value is created. do.
- the number of nodes in the input layer and the output layer corresponds to the number of sensors, and the number of nodes in the intermediate layer is smaller than the number of sensors.
- the information input to the input layer is compressed in the intermediate layer and restored in the output layer.
- the connection structure between the layers is not limited to full coupling.
- the learning process is performed using the process data in the normal state as training data, and a model is created in which the parameters are adjusted so that the difference between the value of the input layer and the value of the output layer becomes small.
- the process data to be verified is input, and the degree of abnormality is calculated according to the difference between the value of the input layer and the value of the output layer. That is, when abnormal process data is input, the information compressed in the intermediate layer cannot be properly restored in the output layer, and the difference between the values of the input layer and the output layer becomes large. Abnormality detection can be performed based on this. According to the autoencoder, an abnormality can be detected based on the characteristics of the relationship between output values between a plurality of sensors.
- the dependency between variables is quantified based on the covariance matrix of process data from multiple sensors in continuous processing or batch processing, and expressed as a sparse graph as a reference. In the normal state, it can be judged that the dependency between variables does not greatly deviate from the standard. Then, in the abnormality determination process, the dependency between the variables is obtained using the process data to be verified, and the degree of abnormality is calculated according to the magnitude of the difference from the above-mentioned reference. According to the graphical lasso, the correlation between process data can be quantified, and the degree of abnormality can be detected based on the collapse of the relationship.
- the threshold value used for abnormality detection in each method is as little as possible to make an erroneous judgment in the normal state using the process data actually obtained in the operation of the plant 3, and in the case of an abnormality, the occurrence of the abnormality and its sign are promptly detected. You may search for a value that can be detected and register it in the knowledge base shown in FIG.
- FIG. 15 is a block diagram showing an example of the configuration of the abnormal modulation cause identification device 1.
- the anomalous modulation cause identification device 1 is a general computer, and includes a communication interface (I / F) 11, a storage device 12, an input / output device 13, and a processor 14.
- the communication I / F 11 may be, for example, a network card or a communication module, and communicates with another computer based on a predetermined protocol.
- the storage device 12 includes a main storage device such as a RAM (Random Access Memory) and a ROM (Read Only Memory), and an auxiliary storage device (secondary) such as an HDD (Hard-Disk Drive), an SSD (Solid State Drive), and a flash memory. It may be a storage device).
- the main storage device temporarily stores a program read by the processor 14 and information transmitted to and received from another computer, and secures a work area of the processor 14.
- the auxiliary storage device stores programs executed by the processor 14, information transmitted to and received from other computers, and the like.
- the input / output device 13 is, for example, a user interface such as an input device such as a keyboard and a mouse, an output device such as a monitor, and an input / output device such as a touch panel.
- the processor 14 is an arithmetic processing unit such as a CPU (Central Processing Unit), and performs each process according to the present embodiment by executing a program. In the example of FIG. 15, a functional block is shown in the processor 14.
- the processor 14 functions as a process data acquisition unit 141, a preprocessing unit 142, a learning processing unit 143, an abnormality determination unit 144, a cause diagnosis unit 145, and an output control unit 146 by executing a predetermined program.
- the process data acquisition unit 141 acquires process data from a sensor included in the plant 3 and stores it in the storage device 12 via, for example, the communication I / F 11 and the control station 2. As mentioned above, the process data is associated with the sensor by a tag.
- the preprocessing unit 142 processes the process data when creating the abnormality detection model. For example, the preprocessing unit 142 associates the process data with the serial number. That is, based on the above-mentioned traceability information held in the storage device 12 in advance, the process data corresponding to a predetermined tag, system and serial number in batch processing, and the process data corresponding to a predetermined tag in continuous processing and at a predetermined timing. Associate with the output process data. In addition, data for a predetermined period used for abnormality determination is extracted based on the set values in a table such as a knowledge base, and feature quantities corresponding to each method are calculated. In the learning process, the pre-processing unit 142 performs data cleansing and extracts training data by excluding data in the unsteady operation period, data at the time of abnormality, and outliers such as noise. good.
- the learning processing unit 143 creates an abnormality detection model including one or more operations based on, for example, a knowledge base, and stores it in the storage device 12. At this time, the learning processing unit 143 determines the parameters learned from the characteristics of the training data. When the learning process is performed using the output values of a plurality of sensors, normalization may be performed as appropriate.
- the abnormality determination unit 144 calculates the degree of abnormality using the process data and the abnormality detection model. That is, in the learning process, the abnormality determination unit 144 calculates the degree of abnormality using the test data for performing cross-validation and the abnormality detection model. Further, in the abnormality determination process, the degree of abnormality is calculated using the process data acquired from the plant 3.
- the cause diagnosis unit 145 calculates the degree of establishment (accuracy) for each of the plurality of assumed causes using the calculated degree of abnormality.
- the degree of establishment is calculated based on the ratio and degree of the influence appearing in the process data among the influences associated with each assumed cause in the knowledge base, for example, using the degree of abnormality calculated by the abnormality determination unit. ..
- an action indicating an action to be taken for the cause may be stored in the storage device 12 in association with each of the assumed causes so that the action can be presented to the user.
- the output control unit 146 issues an alarm when an abnormality is detected, or outputs the degree of establishment for each assumed cause, for example, via the input / output device 13.
- the above-mentioned components are appropriately connected via the bus 15 according to the operation of the user.
- one device shown in FIG. 15 includes a process data acquisition unit 141, a preprocessing unit 142, a learning processing unit 143, an abnormality determination unit 144, a cause diagnosis unit 145, and an output control unit 146, but at least one.
- the functions of the units may be distributed and provided in different devices.
- FIG. 16 is a processing flow diagram showing an example of learning processing executed by the abnormal modulation cause identification device 1.
- the processor 14 of the abnormal modulation cause identification device 1 executes the process as shown in FIG. 16 by executing a predetermined program.
- the learning process is executed at an arbitrary timing using the process data obtained by the past operation of the plant 3.
- the learning process mainly includes a pre-process (FIG. 16: S1), a model construction process (S2), and a verification process (S3). That is, a part of the process data may be used as training data, and the other may be used as test data to perform cross-validation. It is assumed that the above-mentioned table or the like is created by the user and stored in the storage device 12 in advance.
- the pre-processing, learning processing, and verification processing are described in one processing flow shown in FIG. 16, but at least a part of the pre-processing, verification processing, and the like are distributed to different devices and executed. May be good.
- the process data acquisition unit 141 of the abnormal modulation cause identification device 1 acquires the process data (FIG. 16: S11). In this step, from the process data as shown in FIGS. 3 and 6, the data used for the abnormality detection model is extracted. It is assumed that the process data is stored in the storage device 12 in a file of a predetermined format such as OPC data, a so-called database table, CSV, or the like. Further, the process data includes attributes such as date and time and tags, and particularly in the process data of batch processing, attributes such as serial numbers and steps may be further included.
- the preprocessing unit 142 of the abnormal modulation cause identification device 1 associates the process data of continuous processing with the serial number (FIG. 16: S12).
- the process data acquired in the continuous process is associated with the serial number group of the process data acquired in the batch process, and the process data used in the calculation of the degree of abnormality is associated. .. That is, in the knowledge base shown in FIG. 9 and the logic tree shown in FIG. 11, when a certain cause affects both the process data of batch processing and the process data of continuous processing, it is based on the data linked in this step. The degree of abnormality and the degree of establishment are calculated.
- the preprocessing unit 142 extracts and processes the data used in the abnormality determination model (FIG. 16: S13). In this step, the preprocessing unit 142 extracts data for a predetermined period used for abnormality determination based on the set values of a table such as a knowledge base, and calculates a feature amount according to each method.
- the preprocessing unit 142 extracts the process data at a predetermined timing and period, and the instantaneous value which is the process data itself, the maximum value, the minimum value, and the integral of the process data. A value, a difference, an integral value of the reaction rate, a differential coefficient at a predetermined time point, and the like are calculated and stored in the storage device 12.
- the time-series process data is vectorized or matrixed.
- synchronous processing is performed on a plurality of process data, and average time-series data is obtained.
- synchronization processing is performed for a plurality of process data.
- the preprocessing unit 142 may perform predetermined data cleansing on the process data.
- the data cleansing process is a process for eliminating outliers, and various methods can be adopted.
- the moving average value may be calculated using the latest data.
- the difference between the moving average value and the measured value is taken, and the standard deviation ⁇ representing the variation in the difference is obtained.
- a value that does not fall within a predetermined confidence interval such as an interval from the average value of the probability distribution -3 ⁇ to the average of the probability distribution + 3 ⁇ (also referred to as a 3 ⁇ interval) may be excluded.
- the difference between the measured values before and after may be excluded from the value that does not fall within the 3 ⁇ interval.
- the learning processing unit 143 of the abnormality modulation cause identification device 1 performs the abnormality detection model construction processing (FIG. 16: S2).
- an anomaly detection model including an abnormality degree calculation is created based on the knowledge base shown in FIG. Specifically, for one or more "impacts" associated with each of the "assumed causes” in FIG. 9, the degree of abnormality by the method registered in the "calculation method” is calculated, and the table is expressed by the combination of the degree of abnormality. Create an anomaly detection model. Further, the learning processing unit 143 adjusts the parameters of the model by using the training data depending on the method of abnormality detection.
- the weighting coefficient between layers is adjusted so that the information of the input process data can be restored after being compressed.
- the dependency between variables is quantified based on the covariance matrix of process data from multiple sensors. Then, the learning processing unit 143 stores the created abnormality detection model in the storage device 12.
- the abnormality determination unit 144 of the abnormality modulation cause identification device 1 calculates the degree of abnormality using the created abnormality detection model and the test data (FIG. 16: S31). In this step, the abnormality determination unit 144 calculates the abnormality degree according to the method of calculating the abnormality degree. For example, when calculating the degree of anomaly by the hoteling method, the sample mean and sample standard deviation of the population are estimated using the process data, and the degree of anomaly is obtained based on the distance from the average of the population to the process data to be verified. ..
- the distance between the data is calculated, and the degree of abnormality is calculated according to the distance from the data to be verified to the data closest to the k-th.
- the degree of anomaly is obtained by the k-nearest neighbor method or the hoteling theory based on the integrated value of the distances between the time-series data synchronized in the preprocessing.
- the process data to be verified is input to the autoencoder, and the degree of abnormality is obtained according to the difference between the value of the input layer and the value of the output layer.
- the degree of anomaly by the graphical lasso the dependency between variables is obtained using the process data to be verified, and the degree of abnormality according to the magnitude of the difference from the reference dependency is obtained.
- the cause diagnosis unit 145 of the abnormal modulation cause identification device 1 obtains the degree of establishment of the assumed cause using the calculated degree of abnormality (FIG. 16: S32).
- the degree of establishment is calculated based on the ratio of the modulation associated with the influence.
- the cause (2) in FIG. 9 is associated with three effects: an increase in the water content of the tag 002, an increase in the temperature 1 of the tag 004, and a decrease in the temperature 2 of the tag 005.
- the degree of abnormality calculated for each of the effects in S31 of FIG. 16 the ratio of the three effects whose degree of abnormality exceeds the threshold value may be defined as the degree of establishment.
- the degree of establishment can be 66.7%. Further, in the calculation of the degree of establishment, further weighting may be performed according to the type of influence (tag) or based on the magnitude of the degree of abnormality. For example, as the degree of establishment, the sum may be obtained after multiplying each influence by a weight.
- the output control unit 146 outputs the degree of abnormality calculated in S31 and the degree of establishment calculated in S32 in order for the user to evaluate the created model (FIG. 16: S33).
- cross-validation is performed using test data different from the training data used for building the model among the process data collected in the past operation of the plant 3.
- it is verified whether the alarm and the action to deal with it are output by appropriately detecting the abnormality using the process data at the time when the abnormality occurred in the past.
- the learning processing unit 143 determines whether or not the abnormality can be detected with sufficient accuracy (FIG. 16: S4).
- the threshold value registered in the knowledge base (in other words, the normal range of process data) is corrected so that the abnormality can be detected appropriately, and after S31. Repeat the process.
- S4 the operation using the abnormality detection model and the threshold value created in S2 is performed. It should be noted that at least a part of the judgment of S4 may be made by the user.
- FIG. 17 is a diagram showing an example of an action table.
- the table of FIG. 17 includes the cause, action 1, and action 2 attributes.
- the cause field the cause corresponding to the assumed cause of the knowledge base is registered.
- information indicating the action to be taken by the operator of the plant 3 in order to eliminate the corresponding cause is registered.
- FIG. 18 is a processing flow diagram showing an example of anomaly detection processing executed by the anomaly modulation cause identification device 1.
- the processor 14 of the anomalous modulation cause identification device 1 executes a process as shown in FIG. 18 by executing a predetermined program.
- the anomaly detection process is executed in near real time using the process data obtained by the operation of the plant 3.
- the abnormality detection process mainly includes a pre-process (FIG. 18: S10), a model read process (S20), and an abnormality determination process (S30).
- FIG. 18 the same reference numerals are given to the steps corresponding to the learning process shown in FIG. 16, and the differences from the learning process will be mainly described below.
- the process will be described as processing by the same device as the device that performs the learning process, but the device that performs the abnormality detection process may be different from the device that performs the learning process. Further, it is assumed that the table of the abnormality detection model, the threshold value, the knowledge base, etc. created in the learning process is stored in the storage device 12 in advance.
- the process data acquisition unit 141 of the abnormal modulation cause identification device 1 acquires the process data (FIG. 18: S11). It is assumed that the process data is stored in the storage device 12 in a file of a predetermined format such as OPC data, a so-called database table, CSV, or the like. This step is almost the same as S11 in FIG. 16, but the data regarding the process in operation in the plant 3 is acquired. Further, the preprocessing unit 142 of the abnormal modulation cause identification device 1 associates the process data of continuous processing with the serial number (FIG. 18: S12). This step is the same as S12 in FIG. Then, the preprocessing unit 142 extracts and processes the data used in the abnormality determination model (FIG. 18: S13). This step is almost the same as S13 in FIG. 16, but it is not necessary to perform data cleansing.
- a predetermined format such as OPC data, a so-called database table, CSV, or the like. This step is almost the same as S11 in FIG. 16, but the data regarding the
- the abnormality determination unit 144 of the abnormality modulation cause identification device 1 reads out the abnormality detection model created in the learning process from the storage device 12 (FIG. 18: S20). Further, the abnormality determination unit 144 calculates the degree of abnormality using the created abnormality detection model and the process data obtained by the operation of the plant 3 (FIG. 18: S31). This step is the same as S31 in FIG. Further, the cause diagnosis unit 145 of the abnormality modulation cause identification device 1 obtains the establishment degree of the assumed cause using the calculated abnormality degree (FIG. 18: S32). This step is the same as S32 in FIG.
- the output control unit 146 outputs the degree of abnormality calculated in S31 and the degree of establishment calculated in S32, and issues an alarm when any of the degree of abnormality exceeds a predetermined threshold value (FIG. FIG. 18: S303).
- a predetermined threshold value FIG. FIG. 18: S303.
- the process data indicating the operating state of the plant 3, the degree of abnormality, and the degree of establishment of the assumed cause are presented to the user via the input / output device 13.
- FIG. 19 is a diagram showing an example of a screen output to the input / output device 13.
- FIG. 19 is an example of the main control chart, and shows the transition of individual process data as a line graph.
- the area 131 displayed on the input / output device 13 displays a plurality of combinations of the identification information of the process data acquired from the plant 3 and the latest value.
- the control chart of the area 132 shows the transition of the value for a specific process data as a line graph.
- the vertical axis represents the value of the process data, and the horizontal axis represents the time axis.
- the solid line represents the true value and the broken line represents the estimated value.
- the true value is the process data itself for which the degree of abnormality is calculated, and the estimated value may be an estimated value by regression analysis of the process data for which the degree of abnormality is calculated.
- the thin broken line represents the upper limit and the lower limit of the normal range (in other words, the threshold value for abnormality detection).
- the numerical value of the process data at the time indicated by the pointer is displayed. You may.
- the cause of the modulation of the process data displayed in the region 132 or the tag that can identify it is displayed on the horizontal axis, and the vertical axis represents the degree of establishment of the cause as a bar graph.
- the degree of establishment is calculated by the cause diagnosis unit 145 based on the degree of abnormality calculated by the abnormality determination unit 144 for the event that is assumed to be the assumed cause of the modulation of the process data.
- the user can recognize the candidate of the cause of the modulation and its accuracy based on the magnitude of the degree of establishment, and can easily identify the cause of the modulation.
- the factor effect diagram shall be displayed by the output control unit 146 after the abnormality determination unit 144 calculates the degree of abnormality at the designated time or the current time when the "diagnosis" button in the area 134 is pressed. Then, when the user operates an input / output device 13 such as a pointing device and selects one of the bar graphs in the factor effect diagram, the cause of the modulation corresponding to the bar graph is highlighted in the logic tree.
- FIG. 20 is a diagram showing another example of the screen output to the input / output device 13 by the output control unit 146.
- FIG. 20 is an example of a tree diagram, and a logic tree as shown in FIG. 10 is displayed.
- the effect corresponding to the process data of tag 004 is highlighted on the logic tree. Highlighting is performed by changing the display mode, for example, changing the color or changing the line type.
- the corresponding rectangles are hatched.
- the thick lined rectangle connected to the upstream side of the logic tree represents the expected cause of the effect.
- Each cause may be displayed as shown in the balloon in FIG. 20, or the influence on the process data other than the cause may be displayed.
- the degree of establishment of each cause calculated in S32 of FIG. 18 may be further displayed, or the action may be further displayed. Further, the cause may be displayed when the user moves the pointer on each rectangle.
- the process trend of each tag shown in the factor effect diagram may be displayed, and in particular, the process trend of the tag that can identify the cause of the modulation is displayed.
- the process trend uses the process data stored in the storage device 12 to calculate a value for each period such as, for example, every predetermined time, every predetermined number of days, every predetermined number of months, or every season, and plots it on a graph. It was done.
- the output control unit 146 may output a log of the degree of abnormality at a timing when the degree of abnormality calculated by each calculation method exceeds a predetermined threshold value, for example.
- a log of the expected cause and the degree of establishment may be output.
- the above-described embodiment has been described by taking a chemical plant as an example, it can be applied to a manufacturing process in a general production facility.
- the lot number may be used as a processing unit, and the processing according to the batch process in the embodiment may be applied.
- At least a part of the function of the abnormal modulation cause identification device 1 may be distributed to a plurality of devices to be realized, or the same function may be provided by a plurality of devices in parallel. Further, at least a part of the functions of the abnormal modulation cause identification device 1 may be provided on the so-called cloud.
- the present disclosure also includes a method for executing the above-mentioned processing, a computer program, and a computer-readable recording medium on which the program is recorded.
- the recording medium on which the program is recorded can perform the above-mentioned processing by causing the computer to execute the program.
- the computer-readable recording medium means a recording medium that can be read from a computer by accumulating information such as data and programs by electrical, magnetic, optical, mechanical, or chemical action.
- recording media those that can be removed from the computer include flexible disks, magneto-optical disks, optical disks, magnetic tapes, memory cards, and the like.
- HDD High Density Digital
- SSD Solid State Drive
- ROM Read Only Memory
Abstract
The present invention improves abnormality/irregularity cause identifying performance in a production facility. This abnormality/irregularity cause identifying apparatus is provided with: a process data acquisition unit that reads process data ongoingly outputted by a plurality of sensors provided to a production facility for performing a batch step for processing process targets on a unit-by-unit basis for each predetermined unit to be processed and a continuous step for continuously processing the process targets after the batch step; a pre-processing unit that forms association between a range of a completion timing of the batch step and an output timing of the process data in the continuous step, on the basis of a retention time of the process targets in the production facility; an abnormality determination unit that calculates a degree of abnormality by using the process data in the batch step and the process data in the continuous step, the association between which has been formed by the pre-processing unit; and a cause diagnosis unit that, regarding the process data outputted by the plurality of sensors, determines whether a degree of abnormality calculated by the abnormality determination unit satisfies a predetermined criterion.
Description
本開示は、異常変調原因特定装置、異常変調原因特定方法及び異常変調原因特定プログラムに関する。
The present disclosure relates to an abnormal modulation cause identification device, an abnormal modulation cause identification method, and an abnormal modulation cause identification program.
従来、プラントから受信する運転データを用いて、異常の原因を推定するための技術が提案されていた。例えば、過去に発生した第一異常事象の発生確率の重み付けを、未発生の第二異常事象の発生確率の重み付けよりも重くして、異常の予兆の原因を推定する技術が提案されている(特許文献1)。また、診断対象プロセスの異常が検出された場合に、診断対象プロセスの状態を示すプロセス変数の寄与の割合を示す寄与率を推定し、寄与率に基づいて、予め定義された登録事象の中から異常の要因である可能性のある事象を推定する技術も提案されている(特許文献2)。
Conventionally, a technique for estimating the cause of an abnormality has been proposed using the operation data received from the plant. For example, a technique has been proposed in which the weighting of the probability of occurrence of the first abnormal event that has occurred in the past is heavier than the weighting of the probability of occurrence of the second abnormal event that has not occurred, and the cause of the sign of the abnormality is estimated (. Patent Document 1). In addition, when an abnormality in the process to be diagnosed is detected, the contribution rate indicating the contribution ratio of the process variable indicating the state of the process to be diagnosed is estimated, and based on the contribution rate, the pre-defined registration events are selected. A technique for estimating an event that may be the cause of an abnormality has also been proposed (Patent Document 2).
また、プロセスの状態を予測する複数のサブモデルを用いて、プロセスの正常状態からの逸脱指標を算出し、サブモデルごとに算出した逸脱指標からなる逸脱指標パターンセットに基づいて、プロセスで発生した異常状態の原因を推定する技術も提案されている(特許文献3)。また、監視運転データを構成する複数の運転データの各々について監視異常度に対する監視寄与度を算出し、監視寄与度の大きい上位N個の運転データにより構成される診断対象データ群を抽出し、診断対象データ群と、参照運転データに含まれる参照寄与度の大きい上位M個の運転データにより構成される診断参照データ群との合致指標を算出し、合致指標が合致判定閾値以上となる参照運転データに基づいてプラントの異常を予測する技術も提案されている(特許文献4)。
In addition, using multiple submodels that predict the state of the process, the deviation index from the normal state of the process is calculated, and it occurs in the process based on the deviation index pattern set consisting of the deviation index calculated for each submodel. A technique for estimating the cause of an abnormal state has also been proposed (Patent Document 3). In addition, the monitoring contribution to the monitoring abnormality is calculated for each of the plurality of operation data constituting the monitoring operation data, and the diagnosis target data group composed of the top N operation data having a large monitoring contribution is extracted and diagnosed. The matching index of the target data group and the diagnostic reference data group composed of the top M driving data having a large reference contribution included in the reference driving data is calculated, and the matching index is equal to or higher than the matching judgment threshold. A technique for predicting plant abnormalities based on the above has also been proposed (Patent Document 4).
一般的に、生産設備においては、異常変調を予防し、安全性、安定性、生産物の品質、コスト等への影響を抑制することが望ましい。本技術は、生産設備における異常変調の原因の特定性能を向上させることを目的とする。
In general, in production equipment, it is desirable to prevent abnormal modulation and suppress the effects on safety, stability, product quality, cost, etc. The purpose of this technology is to improve the ability to identify the cause of abnormal modulation in production equipment.
異常変調原因特定装置は、所定の処理単位ごとに処理対象を逐次処理するバッチ工程と、その後に処理対象を連続的に処理する連続工程とを行う生産設備が備える複数のセンサによって継続的に出力されるプロセスデータを記憶する記憶装置から、プロセスデータを読み出すプロセスデータ取得部と、バッチ工程の完了タイミングの範囲と、連続工程におけるプロセスデータの出力タイミングとを、生産設備内における処理対象の滞留時間に基づいて対応付ける前処理部と、前処理部が対応付けたバッチ工程におけるプロセスデータと連続工程におけるプロセスデータとを用いて、プロセスデータの変調の程度を表す異常度を算出する異常判定部と、原因と、当該原因から生じる影響として現れる複数のセンサが出力するプロセスデータの変調との組合せを定義する因果関係情報を用いて、複数のセンサが出力するプロセスデータについて、異常判定部が算出した異常度が所定の基準を満たすか判断する原因診断部とを備える。
The anomaly modulation cause identification device continuously outputs data by a plurality of sensors provided in the production facility that performs a batch process of sequentially processing the processing target for each predetermined processing unit and a continuous process of continuously processing the processing target thereafter. The process data acquisition unit that reads the process data from the storage device that stores the process data to be stored, the range of the completion timing of the batch process, and the output timing of the process data in the continuous process are the residence time of the processing target in the production facility. An abnormality determination unit that calculates the degree of abnormality indicating the degree of modulation of the process data using the preprocessing unit associated with the preprocessing unit, the process data in the batch process associated with the preprocessing unit, and the process data in the continuous process. Anomalies calculated by the anomaly determination unit for process data output by multiple sensors using causal relationship information that defines the combination of the cause and the modulation of process data output by multiple sensors that appear as an effect resulting from the cause. It is equipped with a cause diagnosis unit that determines whether the degree meets a predetermined standard.
上述のようなバッチ工程と連続工程とを含む場合、一般的にバッチ工程における処理対象と連続工程における処理対象とを紐づけることが困難であった。上述のような滞留時間を予め定めておき、処理対象の対応付けに用いることで、バッチ工程におけるプロセスデータと連続工程におけるプロセスデータとを対応付けることができる。同一の処理対象を測定したプロセスデータを精度よく対応付けることにより、プロセスデータに基づく異常度の算出の精度も向上する。したがって、生産設備における異常変調の原因の特定性能を向上させることができる。
When the batch process and the continuous process as described above are included, it is generally difficult to link the processing target in the batch process with the processing target in the continuous process. By predetermining the residence time as described above and using it for associating the processing target, it is possible to associate the process data in the batch process with the process data in the continuous process. By accurately associating the process data obtained by measuring the same processing target with accuracy, the accuracy of calculating the degree of abnormality based on the process data is also improved. Therefore, it is possible to improve the ability to identify the cause of abnormal modulation in production equipment.
また、因果関係情報は、異常度の算出に用いるプロセスデータを、複数のセンサが出力するプロセスデータの各々について、生産設備が行う工程におけるタイミング、期間、又は間隔によって定義し、異常判定部は、前処理部が対応付けたプロセスデータのうち、因果関係情報が定義するタイミング、期間、又は間隔に基づいて抽出された値を用いて異常度の算出を行うようにしてもよい。例えば、タイミング、期間、又は間隔は、いわゆる知識ベースに基づいて定義することができる。対応付けられたプロセスデータについて、異常度の算出に用いる値を詳細に定義できるようにすれば、異常判定の精度を向上させ得ると共に、不要な演算を削減することでシステムの負荷を低減することができる。
In addition, the causal relationship information defines the process data used for calculating the degree of abnormality for each of the process data output by the plurality of sensors according to the timing, period, or interval in the process performed by the production equipment, and the abnormality determination unit determines. Of the process data associated with the preprocessing unit, the degree of abnormality may be calculated using the value extracted based on the timing, period, or interval defined by the causal relationship information. For example, timing, duration, or intervals can be defined based on the so-called knowledge base. If the values used to calculate the degree of abnormality can be defined in detail for the associated process data, the accuracy of abnormality judgment can be improved and the load on the system can be reduced by reducing unnecessary operations. Can be done.
また、異常判定部は、連続工程において、予め定められた組合せに含まれる複数のセンサが出力するプロセスデータの値を圧縮及び復元するニューラルネットワークモデルを用いて、当該ニューラルネットワークモデルの入出力の差に応じた異常度を算出するようにしてもよい。特に連続工程においては異常の影響がプロセスデータに現れる特徴的なタイミングを特定しづらいところ、複数のセンサが出力するプロセスデータの特徴をひとまとめにして評価することで異常変調の原因の特定が容易になる。また、例えば知識ベースに従って、ひとつの原因に基づいて変化する複数のセンサのプロセスデータをまとめて評価すれば、異常検知や原因特定の精度を向上させることができる。
In addition, the abnormality determination unit uses a neural network model that compresses and restores the values of process data output by a plurality of sensors included in a predetermined combination in a continuous process, and the difference between the input and output of the neural network model. The degree of abnormality may be calculated according to the above. Especially in a continuous process, it is difficult to identify the characteristic timing at which the influence of an abnormality appears in the process data, but by evaluating the characteristics of the process data output by multiple sensors collectively, it is easy to identify the cause of the abnormal modulation. Become. Further, for example, if the process data of a plurality of sensors that change based on one cause are collectively evaluated according to the knowledge base, the accuracy of abnormality detection and cause identification can be improved.
なお、課題を解決するための手段に記載の内容は、本開示の課題や技術的思想を逸脱しない範囲で可能な限り組み合わせることができる。また、課題を解決するための手段の内容は、コンピュータ等の装置若しくは複数の装置を含むシステム、コンピュータが実行する方法、又はコンピュータに実行させるプログラムとして提供することができる。なお、プログラムを保持する記録媒体を提供するようにしてもよい。
The contents described in the means for solving the problems can be combined as much as possible without departing from the problems and technical ideas of the present disclosure. Further, the content of the means for solving the problem can be provided as a device such as a computer or a system including a plurality of devices, a method executed by the computer, or a program executed by the computer. A recording medium for holding the program may be provided.
開示の技術によれば、生産設備における異常原因の特定精度を向上させることができる。
According to the disclosed technology, it is possible to improve the accuracy of identifying the cause of abnormality in production equipment.
以下、図面を参照しつつ異常変調原因特定装置の実施形態について説明する。
Hereinafter, an embodiment of the abnormal modulation cause identification device will be described with reference to the drawings.
<実施形態>
図1は、本実施形態に係るシステムの一例を表す図である。システム100は、異常変調原因特定装置1と、制御ステーション2と、プラント3とを含む。システム100は、例えば分散型制御システム(DCS:Distributed Control System)であり、複数の制御ステーション2を含む。すなわち、プラント3の制御系は複数の区画に分割され、各制御区画が制御ステーション2によって分散制御される。制御ステーション2は、DCSにおける既存の設備であり、プラント3が備えるセンサ等から出力される状態信号を受信したり、プラント3に対して制御信号を出力する。そして、制御信号に基づいて、プラント3が備えるバルブ等のアクチュエータやその他の機器が制御される。 <Embodiment>
FIG. 1 is a diagram showing an example of a system according to the present embodiment. Thesystem 100 includes an abnormal modulation cause identification device 1, a control station 2, and a plant 3. The system 100 is, for example, a distributed control system (DCS), and includes a plurality of control stations 2. That is, the control system of the plant 3 is divided into a plurality of sections, and each control section is distributed and controlled by the control station 2. The control station 2 is an existing facility in the DCS, and receives a state signal output from a sensor or the like included in the plant 3 or outputs a control signal to the plant 3. Then, based on the control signal, actuators such as valves and other equipment included in the plant 3 are controlled.
図1は、本実施形態に係るシステムの一例を表す図である。システム100は、異常変調原因特定装置1と、制御ステーション2と、プラント3とを含む。システム100は、例えば分散型制御システム(DCS:Distributed Control System)であり、複数の制御ステーション2を含む。すなわち、プラント3の制御系は複数の区画に分割され、各制御区画が制御ステーション2によって分散制御される。制御ステーション2は、DCSにおける既存の設備であり、プラント3が備えるセンサ等から出力される状態信号を受信したり、プラント3に対して制御信号を出力する。そして、制御信号に基づいて、プラント3が備えるバルブ等のアクチュエータやその他の機器が制御される。 <Embodiment>
FIG. 1 is a diagram showing an example of a system according to the present embodiment. The
異常変調原因特定装置1は、制御ステーション2を介してプラント3の状態信号(プロセスデータ)を取得する。プロセスデータは、原料や中間的な生産物である処理対象の温度、圧力、流量等や、プラント3が備える機器の運転条件を定める設定値等を含む。また、異常変調原因特定装置1は、想定される原因と、例えば異常として現れる影響との対応関係を記憶する知識ベースに基づく異常検知モデルを作成する。例えば、知識ベースに基づいて作成された、プロセスデータの変化について許容範囲からの逸脱を検知する手法に基づいて異常変調やその予兆、その原因を特定するためのモデルが作成される。そして、異常変調原因特定装置1は、モデルとプロセスデータとを用いて、異常変調の発生又はその予兆を検知することができる。また、異常変調原因特定装置1は、異常変調の原因及びそれに対処するためのアクションを記憶するテーブルと、特定された原因とに基づいて、例えば異常変調を抑制するための運転条件の候補を求め、ユーザに提示してもよい。
The abnormal modulation cause identification device 1 acquires the status signal (process data) of the plant 3 via the control station 2. The process data includes the temperature, pressure, flow rate, etc. of the raw material and the intermediate product to be processed, and the set values that determine the operating conditions of the equipment provided in the plant 3. Further, the anomaly modulation cause identification device 1 creates an anomaly detection model based on a knowledge base that stores a correspondence relationship between a assumed cause and an influence appearing as an anomaly, for example. For example, a model for identifying anomalous modulation, its precursors, and its causes is created based on a method for detecting deviations from the permissible range for changes in process data created based on a knowledge base. Then, the anomalous modulation cause identification device 1 can detect the occurrence or a sign of the anomalous modulation by using the model and the process data. Further, the anomalous modulation cause identification device 1 obtains, for example, a candidate for operating conditions for suppressing anomalous modulation based on a table that stores the cause of the anomalous modulation and an action for dealing with the cause and the identified cause. , May be presented to the user.
図2は、プラントが備える機器によって行われるプロセスの一例を示す模式的な図である。本実施形態では、プロセスは、バッチ工程31と連続工程32とを含み得る。バッチ工程31においては、所定の処理単位ごとに処理対象が逐次処理され、例えば各機器への原料の受入れ、保持、排出といった処理が順に行われる。連続工程32においては、継続して導入される処理対象が連続的に処理され、例えば、原料の受入れ、保持、排出といった処理が並行して行われる。また、プロセスは、並列に同一の処理を行う複数の系列33を含み得る。
FIG. 2 is a schematic diagram showing an example of a process performed by the equipment provided in the plant. In this embodiment, the process may include a batch process 31 and a continuous process 32. In the batch process 31, the processing target is sequentially processed for each predetermined processing unit, and for example, processing such as receiving, holding, and discharging the raw material to each device is performed in order. In the continuous step 32, the processing targets to be continuously introduced are continuously processed, and for example, processing such as acceptance, holding, and discharge of raw materials is performed in parallel. Further, the process may include a plurality of series 33 that perform the same processing in parallel.
各処理を行う機器は、例えば反応器、蒸留装置、熱交換器、圧縮機、ポンプ、タンク等を含み、これらが配管を介して接続されている。また、機器や配管の所定の位置には、センサやバルブ等が設けられる。センサは、温度計、流量計、圧力計、レベル計、濃度計等を含み得る。また、センサは、各機器の運転状態を監視し、状態信号を出力する。また、プラント3が備えるセンサは、センサの各々を特定するための識別情報である「タグ」が付されているものとする。すなわち、タグに基づいてプロセスデータの種類を特定することができる。そして、異常変調原因特定装置1及び制御ステーション2は、各機器への入出力信号を、タグに基づいて管理する。
The equipment that performs each treatment includes, for example, a reactor, a distillation apparatus, a heat exchanger, a compressor, a pump, a tank, etc., and these are connected via piping. In addition, sensors, valves, and the like are provided at predetermined positions of equipment and piping. The sensor may include a thermometer, a flow meter, a pressure gauge, a level meter, a densitometer, and the like. In addition, the sensor monitors the operating status of each device and outputs a status signal. Further, it is assumed that the sensor included in the plant 3 is attached with a "tag" which is identification information for identifying each of the sensors. That is, the type of process data can be specified based on the tag. Then, the abnormal modulation cause identification device 1 and the control station 2 manage the input / output signals to each device based on the tags.
<バッチ工程>
図3は、バッチ工程におけるプロセスデータの一例を説明するための図である。図3の左側の列は、図2に示したバッチ工程31のプロセスの一部を示す。具体的には、プロセスは、シュレッダー301と、サイクロン302と、前処理303と、予冷機304と、反応機305とを含む。また、これらのプロセスは、前処理工程、予冷工程、反応工程に分類されている。図3の右側の列は、各プロセスにおいて取得されるプロセスデータの一例を示す。前処理工程においては、タグが001及び002であるセンサから時系列のデータが取得される。予冷工程においては、タグが003及び004であるセンサから時系列のデータが取得される。反応工程においては、タグが005、006及び007であるセンサから時系列のデータが取得される。また、バッチ工程においては、製造番号(「製番」、「バッチナンバー」、「管理番号」とも呼ぶ)と対応付けられた処理対象を、断続的に処理する。すなわち、製造番号は、バッチ工程においてまとめて処理される処理対象を識別するための識別情報である。図3に示すように、時間の経過と共に、後続の製造番号と対応付けられた処理対象に関する時系列のデータが得られる。本実施形態では、制御ステーション2が、製造番号や、バッチ工程を構成する細分化された工程における処理の段階を示すステップを管理するものとする。なお、ステップを、制御ステーション2と接続されたプラント3内のPLC(Programmable Logic Controller,シーケンサ)によってリセットする場合には、制御ステーション2とプラント3との通信のタイミングに応じて適宜(例えばPLCにおいてステップが切り替わった後、設定時間経過後に)制御ステーション2から出力されるプロセスデータの製造番号を採用するようにしてもよい。また、設定時間は、製造ラインごと、細分化された工程ごとに設定できるようにしてもよい。 <Batch process>
FIG. 3 is a diagram for explaining an example of process data in a batch process. The left column of FIG. 3 shows a portion of the process ofbatch step 31 shown in FIG. Specifically, the process includes a shredder 301, a cyclone 302, a pretreatment 303, a precooler 304, and a reactor 305. Further, these processes are classified into a pretreatment step, a precooling step, and a reaction step. The right column of FIG. 3 shows an example of process data acquired in each process. In the preprocessing step, time series data is acquired from the sensors whose tags are 001 and 002. In the precooling step, time series data is acquired from the sensors whose tags are 003 and 004. In the reaction process, time series data is acquired from the sensors whose tags are 005, 006 and 007. Further, in the batch process, the processing target associated with the serial number (also referred to as “manufacturing number”, “batch number”, “control number”) is intermittently processed. That is, the serial number is identification information for identifying the processing targets to be collectively processed in the batch process. As shown in FIG. 3, with the passage of time, time-series data relating to the processing target associated with the subsequent serial number is obtained. In the present embodiment, the control station 2 manages a serial number and a step indicating a processing stage in a subdivided process constituting a batch process. When the step is reset by the PLC (Programmable Logic Controller, sequencer) in the plant 3 connected to the control station 2, it is appropriate (for example, in the PLC) according to the timing of communication between the control station 2 and the plant 3. The serial number of the process data output from the control station 2 may be adopted (after the set time has elapsed after the step is switched). Further, the set time may be set for each production line or for each subdivided process.
図3は、バッチ工程におけるプロセスデータの一例を説明するための図である。図3の左側の列は、図2に示したバッチ工程31のプロセスの一部を示す。具体的には、プロセスは、シュレッダー301と、サイクロン302と、前処理303と、予冷機304と、反応機305とを含む。また、これらのプロセスは、前処理工程、予冷工程、反応工程に分類されている。図3の右側の列は、各プロセスにおいて取得されるプロセスデータの一例を示す。前処理工程においては、タグが001及び002であるセンサから時系列のデータが取得される。予冷工程においては、タグが003及び004であるセンサから時系列のデータが取得される。反応工程においては、タグが005、006及び007であるセンサから時系列のデータが取得される。また、バッチ工程においては、製造番号(「製番」、「バッチナンバー」、「管理番号」とも呼ぶ)と対応付けられた処理対象を、断続的に処理する。すなわち、製造番号は、バッチ工程においてまとめて処理される処理対象を識別するための識別情報である。図3に示すように、時間の経過と共に、後続の製造番号と対応付けられた処理対象に関する時系列のデータが得られる。本実施形態では、制御ステーション2が、製造番号や、バッチ工程を構成する細分化された工程における処理の段階を示すステップを管理するものとする。なお、ステップを、制御ステーション2と接続されたプラント3内のPLC(Programmable Logic Controller,シーケンサ)によってリセットする場合には、制御ステーション2とプラント3との通信のタイミングに応じて適宜(例えばPLCにおいてステップが切り替わった後、設定時間経過後に)制御ステーション2から出力されるプロセスデータの製造番号を採用するようにしてもよい。また、設定時間は、製造ラインごと、細分化された工程ごとに設定できるようにしてもよい。 <Batch process>
FIG. 3 is a diagram for explaining an example of process data in a batch process. The left column of FIG. 3 shows a portion of the process of
図4は、予め設定しておく工程ライン定義テーブルの一例を示す図である。工程ライン定義テーブルは、系列及び工程ごとに、製造番号、各工程における処理の段階を示すステップの定義、各工程において処理される処理対象の品種が登録される。工程ライン定義テーブルは、いわゆるデータベースのテーブルであってもよいし、CSVのような所定の形式のファイルであってもよい。また、工程ライン定義テーブルも、予めユーザによって作成され、異常変調原因特定装置1によって読み出される。
FIG. 4 is a diagram showing an example of a process line definition table that is set in advance. In the process line definition table, the serial number, the definition of the step indicating the processing stage in each process, and the product type to be processed in each process are registered for each series and process. The process line definition table may be a so-called database table or a file of a predetermined format such as CSV. Further, the process line definition table is also created in advance by the user and read out by the abnormal modulation cause identification device 1.
工程ライン定義テーブルは、系列、工程、製番、ステップ、品種の各属性を含む。系列のフィールドには、プロセスの系列を特定するための識別情報が登録される。工程のフィールドには、バッチ工程における細分化された工程を示す識別情報が登録される。製番のフィールドには、バッチ工程においてまとめて処理される処理対象を識別するための識別情報である製造番号が登録される。ステップのフィールドには、当該工程における処理の段階を示す複数のステップのタイミングの定義が登録される。品種のフィールドには、処理対象の種別が登録される。
The process line definition table includes each attribute of series, process, manufacturing number, step, and product type. Identification information for identifying the process series is registered in the series field. In the process field, identification information indicating the subdivided process in the batch process is registered. In the serial number field, a serial number, which is identification information for identifying the processing targets to be collectively processed in the batch process, is registered. In the step field, the definition of the timing of a plurality of steps indicating the stage of processing in the process is registered. The type of processing target is registered in the field of product type.
図5は、予め設定しておくタグ定義テーブルの一例を示す図である。タグ定義テーブルは、各タグに対応するセンサから得られるプロセスデータの取得タイミングを定義する。
なお、タグ定義テーブルは、いわゆるデータベースのテーブルであってもよいし、CSV(Comma Separated Values)のような所定の形式のファイルであってもよい。また、タグ定義テーブルは、予めユーザによって作成され、異常変調原因特定装置1によって読み出される。 FIG. 5 is a diagram showing an example of a tag definition table set in advance. The tag definition table defines the acquisition timing of process data obtained from the sensor corresponding to each tag.
The tag definition table may be a so-called database table or a file having a predetermined format such as CSV (Comma Separated Values). Further, the tag definition table is created in advance by the user and read out by the abnormal modulationcause identification device 1.
なお、タグ定義テーブルは、いわゆるデータベースのテーブルであってもよいし、CSV(Comma Separated Values)のような所定の形式のファイルであってもよい。また、タグ定義テーブルは、予めユーザによって作成され、異常変調原因特定装置1によって読み出される。 FIG. 5 is a diagram showing an example of a tag definition table set in advance. The tag definition table defines the acquisition timing of process data obtained from the sensor corresponding to each tag.
The tag definition table may be a so-called database table or a file having a predetermined format such as CSV (Comma Separated Values). Further, the tag definition table is created in advance by the user and read out by the abnormal modulation
タグ定義テーブルは、タグ、系列、工程、収集間隔の各属性を含む。タグのフィールドには、センサの識別情報であるタグが登録される。系列のフィールドには、プロセスの系列を特定するための識別情報が登録される。工程のフィールドには、バッチ工程における細分化された工程を示す識別情報が登録される。収集間隔のフィールドには、センサの出力値を取得する間隔を示す情報が登録される。
The tag definition table includes each attribute of tag, series, process, and collection interval. A tag that is identification information of the sensor is registered in the tag field. Identification information for identifying the process series is registered in the series field. In the process field, identification information indicating the subdivided process in the batch process is registered. In the collection interval field, information indicating the interval for acquiring the output value of the sensor is registered.
<連続工程>
図6は、連続工程におけるプロセスデータの一例を説明するための図である。図6の左側の列は、図2に示した連続工程32のプロセスの一部を示す。具体的には、プロセスは、タンク311と、ポンプ312とを含む。図6の右側の列は、各プロセスにおいて取得されるプロセスデータの一例を示す。連続工程32においては、タグと対応付けられ、製造番号とは対応付けられていない時系列のデータが、センサから継続して取得される。連続工程においては、タグが102及び103である各センサから時系列のデータが取得される。連続工程においては、機器が連続的に処理対象を受け入れ、継続して処理を行う。 <Continuous process>
FIG. 6 is a diagram for explaining an example of process data in a continuous process. The left column of FIG. 6 shows a part of the process of thecontinuous process 32 shown in FIG. Specifically, the process includes a tank 311 and a pump 312. The right column of FIG. 6 shows an example of process data acquired in each process. In the continuous process 32, time-series data associated with the tag and not associated with the serial number is continuously acquired from the sensor. In the continuous process, time series data is acquired from each sensor whose tags are 102 and 103. In the continuous process, the equipment continuously accepts the processing target and continuously performs the processing.
図6は、連続工程におけるプロセスデータの一例を説明するための図である。図6の左側の列は、図2に示した連続工程32のプロセスの一部を示す。具体的には、プロセスは、タンク311と、ポンプ312とを含む。図6の右側の列は、各プロセスにおいて取得されるプロセスデータの一例を示す。連続工程32においては、タグと対応付けられ、製造番号とは対応付けられていない時系列のデータが、センサから継続して取得される。連続工程においては、タグが102及び103である各センサから時系列のデータが取得される。連続工程においては、機器が連続的に処理対象を受け入れ、継続して処理を行う。 <Continuous process>
FIG. 6 is a diagram for explaining an example of process data in a continuous process. The left column of FIG. 6 shows a part of the process of the
バッチ工程の後に連続工程を行う場合、バッチ工程における処理対象と連続工程における処理対象とを紐づけるために、本実施形態では予めユーザによって設定されるトレーサビリティ情報を用いる。図7は、トレーサビリティ情報の一例を示す図である。トレーサビリティ情報は、サンプリング間隔及び滞留時間の各属性を含む。サンプリング間隔のフィールドには、連続工程において例えば縮分法による工程検査のためのサンプリングを行う間隔が登録される。滞留時間のフィールドには、バッチ工程の完了から、連続工程に含まれるプロセスに到達するまでに処理対象が滞留する時間が登録される。
When the continuous process is performed after the batch process, the traceability information set in advance by the user is used in this embodiment in order to associate the processing target in the batch process with the processing target in the continuous process. FIG. 7 is a diagram showing an example of traceability information. The traceability information includes each attribute of sampling interval and residence time. In the field of sampling interval, an interval for sampling for process inspection by, for example, a reduction method in a continuous process is registered. In the residence time field, the time during which the processing target stays from the completion of the batch process to the arrival of the process included in the continuous process is registered.
図8は、連続工程におけるプロセスデータとバッチ工程における製造番号との対応付けを説明するための図である。プロセスデータの取得は、例えばトレーサビリティ情報に設定された間隔で行われる。また、バッチ工程の後に連続工程を行う場合、所定の期間に完了したバッチ工程による生成物が、連続工程の処理対象としてタンク等に導入される。したがって、連続工程におけるプロセスデータは、バッチ工程の完了からセンサによる測定時までの処理対象の滞留時間を遡り、バッチ工程の完了時刻が所定の期間に含まれる製造番号群と対応付けることができる。このような紐づけにより、バッチ工程と連続工程とが続けて実施される場合において、バッチ工程におけるプロセスデータを利用する異常原因の特定精度を向上させることができる。
FIG. 8 is a diagram for explaining the correspondence between the process data in the continuous process and the serial number in the batch process. The process data is acquired, for example, at the intervals set in the traceability information. Further, when a continuous process is performed after the batch process, the product of the batch process completed in a predetermined period is introduced into a tank or the like as a processing target of the continuous process. Therefore, the process data in the continuous process can trace back the residence time of the processing target from the completion of the batch process to the time of measurement by the sensor, and can be associated with the serial number group in which the completion time of the batch process is included in the predetermined period. By such associating, when the batch process and the continuous process are continuously carried out, it is possible to improve the accuracy of identifying the cause of the abnormality using the process data in the batch process.
以上のように、バッチ処理における製造番号と連続工程における測定タイミングとの対応付けにより、異常原因の特定精度を向上させることができる。
As described above, the accuracy of identifying the cause of abnormality can be improved by associating the serial number in batch processing with the measurement timing in continuous processes.
図9は、知識ベースに予め登録される情報の一例を示す図である。知識ベースは、異常変調原因特定装置1の記憶装置に予め記憶されるものとする。図9のテーブルは、センサ(タグ)の各々に対応する「影響」の列と、変調の「想定原因」を示す行とを含む。すなわち、各行に示す「原因1」、「原因2」等の原因によって影響を受けるセンサに対応する列に、値の変動の方向が登録されている。知識ベースにおいては、変動の方向を、センサの出力値の増加(上昇)を表す「上」又は減少(降下)を表す「下」で表示している。
なお、図9に示すように、原因と影響の組み合わせは1対1とは限らない。また、各センサに対応付けて、プロセスデータの演算方法、抽出タイミング、異常判定に用いる閾値等が定められている。演算方法の行には、各センサの出力値に対して行う演算を示す情報が登録される。なお、本実施形態においては、例えば、ホテリング法、k近傍法、DTW Barycenter Averaging、Autoencoder、グラフィカルラッソ等の機械学習手法を用いて演算を行うものとする。抽出タイミングの行には、各センサの出力値のうち異常判定に用いる値を抽出するタイミングを示す情報が登録される。タイミングは、例えばバッチ処理においては、各工程における処理の段階を示すステップや特定の期間、時点等で定義してもよい。また、連続処理においては、図7に示したようなサンプリング間隔等によって定義してもよい。閾値の行には、各異常判定手法において異常と判定する基準である閾値が登録される。閾値は、例えば上限及び下限の2つを含むものであってもよい。以上のように、知識ベースは、原因となる事象と、それに起因して生じるプロセスデータの変調である影響との因果関係の組合せを定義する。また、因果関係の組合せは、影響として現れる変調を根とし、その想定原因を葉とし、原因から変調に至る過程で現れる事象を時系列に沿った階層状に接続したツリー形式で表すことができる。 FIG. 9 is a diagram showing an example of information registered in advance in the knowledge base. The knowledge base shall be stored in advance in the storage device of the abnormal modulationcause identification device 1. The table of FIG. 9 contains a column of "effects" corresponding to each of the sensors (tags) and a row indicating the "possible cause" of the modulation. That is, the direction of the value fluctuation is registered in the column corresponding to the sensor affected by the cause such as "cause 1" and "cause 2" shown in each row. In the knowledge base, the direction of fluctuation is indicated by "up" indicating an increase (rise) or "down" indicating a decrease (fall) of the output value of the sensor.
As shown in FIG. 9, the combination of cause and effect is not always one-to-one. Further, the process data calculation method, extraction timing, threshold value used for abnormality determination, and the like are defined in association with each sensor. In the calculation method line, information indicating the calculation to be performed on the output value of each sensor is registered. In this embodiment, the calculation is performed by using a machine learning method such as a hoteling method, a k-nearest neighbor method, DTW Barycenter Averaging, Autoencoder, or a graphical lasso. In the extraction timing line, information indicating the timing of extracting the value used for abnormality determination among the output values of each sensor is registered. For example, in batch processing, the timing may be defined by a step indicating a processing stage in each step, a specific period, a time point, or the like. Further, in the continuous processing, it may be defined by a sampling interval or the like as shown in FIG. In the threshold line, a threshold value, which is a criterion for determining an abnormality in each abnormality determination method, is registered. The threshold value may include, for example, an upper limit and a lower limit. As described above, the knowledge base defines a combination of causal relationships between the causal event and the resulting effect of modulation of process data. In addition, the combination of causal relationships can be expressed in a tree format in which the modulation that appears as an effect is the root, the assumed cause is the leaf, and the events that appear in the process from the cause to the modulation are connected in a hierarchical manner along the time series. ..
なお、図9に示すように、原因と影響の組み合わせは1対1とは限らない。また、各センサに対応付けて、プロセスデータの演算方法、抽出タイミング、異常判定に用いる閾値等が定められている。演算方法の行には、各センサの出力値に対して行う演算を示す情報が登録される。なお、本実施形態においては、例えば、ホテリング法、k近傍法、DTW Barycenter Averaging、Autoencoder、グラフィカルラッソ等の機械学習手法を用いて演算を行うものとする。抽出タイミングの行には、各センサの出力値のうち異常判定に用いる値を抽出するタイミングを示す情報が登録される。タイミングは、例えばバッチ処理においては、各工程における処理の段階を示すステップや特定の期間、時点等で定義してもよい。また、連続処理においては、図7に示したようなサンプリング間隔等によって定義してもよい。閾値の行には、各異常判定手法において異常と判定する基準である閾値が登録される。閾値は、例えば上限及び下限の2つを含むものであってもよい。以上のように、知識ベースは、原因となる事象と、それに起因して生じるプロセスデータの変調である影響との因果関係の組合せを定義する。また、因果関係の組合せは、影響として現れる変調を根とし、その想定原因を葉とし、原因から変調に至る過程で現れる事象を時系列に沿った階層状に接続したツリー形式で表すことができる。 FIG. 9 is a diagram showing an example of information registered in advance in the knowledge base. The knowledge base shall be stored in advance in the storage device of the abnormal modulation
As shown in FIG. 9, the combination of cause and effect is not always one-to-one. Further, the process data calculation method, extraction timing, threshold value used for abnormality determination, and the like are defined in association with each sensor. In the calculation method line, information indicating the calculation to be performed on the output value of each sensor is registered. In this embodiment, the calculation is performed by using a machine learning method such as a hoteling method, a k-nearest neighbor method, DTW Barycenter Averaging, Autoencoder, or a graphical lasso. In the extraction timing line, information indicating the timing of extracting the value used for abnormality determination among the output values of each sensor is registered. For example, in batch processing, the timing may be defined by a step indicating a processing stage in each step, a specific period, a time point, or the like. Further, in the continuous processing, it may be defined by a sampling interval or the like as shown in FIG. In the threshold line, a threshold value, which is a criterion for determining an abnormality in each abnormality determination method, is registered. The threshold value may include, for example, an upper limit and a lower limit. As described above, the knowledge base defines a combination of causal relationships between the causal event and the resulting effect of modulation of process data. In addition, the combination of causal relationships can be expressed in a tree format in which the modulation that appears as an effect is the root, the assumed cause is the leaf, and the events that appear in the process from the cause to the modulation are connected in a hierarchical manner along the time series. ..
知識ベースは、例えばHAZOP(Hazard and Operability Study)に基づいてユーザが予め作成するものとする。HAZOPは、例えば、プラントを構成する計装機器による監視ポイントでの検知手段、管理範囲(上下限の閾値でありアラームの設定点)、管理範囲からのずれ(異常、変調)、管理範囲からのずれが発生する想定原因の列挙、いずれの想定原因によりずれが発生したかを判断するロジック(検知手段)、ずれが発生したことによる影響、ずれが発生した場合にとる処置、その処置に対するアクションに関し、これらを関連付けて網羅的に列挙するための手法である。なお、HAZOPに限らず、FTA(Fault Tree Analysis)、FMEA(Failure Mode and Effect Analysis)、ETA(Event Tree Analysis)又はこれらを応用した手法や、これらに類する手法、オペレータへのヒアリング結果から抽出された内容、作業標準書や技術標準書から抽出された内容に基づいて知識ベースを作成するようにしてもよい。本実施形態では、知識ベースにおいて因果関係を有するとされているパラメータに基づいて異常検知を行う。
The knowledge base shall be created in advance by the user based on, for example, HAZOP (Hazard and Operability Study). HAZOP is, for example, a detection means at a monitoring point by instrumentation equipment constituting the plant, a control range (upper and lower thresholds and alarm setting points), a deviation from the control range (abnormality, modulation), and a control range. List of possible causes of deviation, logic (detection means) to determine which assumed cause caused deviation, influence of deviation, action to be taken when deviation occurs, action for the action , It is a method to associate these and enumerate them comprehensively. Not limited to HAZOP, it is extracted from FTA (Fault Tree Analysis), FMEA (Failure Mode and Effect Analysis), ETA (Event Tree Analysis) or methods applying these, similar methods, and interview results with operators. The knowledge base may be created based on the contents, the contents extracted from the work standard and the technical standard. In this embodiment, abnormality detection is performed based on parameters that are considered to have a causal relationship in the knowledge base.
以上のようなテーブルに設定される情報に基づいて、異常変調原因特定装置1は、プラント3から取得したプロセスデータのうち所定のタイミングのデータを抽出し、予め定められた手法によって異常判定を行う。図10は、変調とその原因との関係を表すロジックツリーの一例を示す図である。ロジックツリーは、図9に示した知識ベースに基づいて作成することができる。また、図10のロジックツリーは、生産工程における上流側であって時系列上の早期の事象を左側に配置し、生産工程における下流側であって時系列上の後続の事象を右側に配置し、想定原因から影響として現れる変調に向かって矢印で階層状に接続したものである。また、ロジックツリーは、知識ベーステーブルにおける1つの変調に対して複数の想定原因が存在する場合は分岐させて接続し、想定原因から変調までの過程において共通して現れる事象を束ねて表示している。各分岐の上流側の端部に位置する太い実線の矩形は、知識ベーステーブルの想定原因に相当し、図9及び図10の括弧内の数字が対応している。また、細い実線の矩形は、知識ベーステーブルの影響に相当し、プロセスデータによって観察できる事象を表している。このような影響の各々について、知識ベーステーブルで定められた演算方法に応じた演算が行われる。また、各想定原因について、上記演算を行うための数式を含むモデルが定義され、モデルを用いて異常又はその予兆を検知したり、その原因特定を支援できるようになる。
Based on the information set in the table as described above, the abnormality modulation cause identification device 1 extracts the data at a predetermined timing from the process data acquired from the plant 3, and determines the abnormality by a predetermined method. .. FIG. 10 is a diagram showing an example of a logic tree showing the relationship between modulation and its cause. The logic tree can be created based on the knowledge base shown in FIG. Further, in the logic tree of FIG. 10, the upstream side in the production process and the early events in the time series are arranged on the left side, and the downstream side in the production process and the subsequent events in the time series are arranged on the right side. , It is connected in a hierarchical manner with arrows toward the modulation that appears as an effect from the assumed cause. In addition, the logic tree branches and connects when there are multiple possible causes for one modulation in the knowledge base table, and displays a bundle of events that commonly appear in the process from the assumed cause to the modulation. There is. The thick solid rectangle located at the upstream end of each branch corresponds to the assumed cause of the knowledge base table, and the numbers in parentheses in FIGS. 9 and 10 correspond to it. In addition, the thin solid rectangle corresponds to the influence of the knowledge base table and represents the phenomenon that can be observed by the process data. For each of these effects, an operation is performed according to the operation method defined in the knowledge base table. Further, for each assumed cause, a model including a mathematical formula for performing the above calculation is defined, and the model can be used to detect an abnormality or a sign thereof, and to support identification of the cause.
<演算方法>
上述の演算は、例えば次のような手法を含むものであってもよい。また、異常変調原因特定装置1は、これらの演算結果を表示するようにしてもよい。 <Calculation method>
The above-mentioned operation may include, for example, the following method. Further, the abnormal modulationcause identification device 1 may display these calculation results.
上述の演算は、例えば次のような手法を含むものであってもよい。また、異常変調原因特定装置1は、これらの演算結果を表示するようにしてもよい。 <Calculation method>
The above-mentioned operation may include, for example, the following method. Further, the abnormal modulation
・ホテリング法(T2法)
例えば1つのセンサから得られる複数のプロセスデータが所定の確率密度関数に従うと仮定し、プロセスデータを用いて算出される標本平均及び標本標準偏差から、母集団の平均及び標準偏差を推定する。所定の確率密度関数は、例えば正規分布である。そして、母集団の平均から検証対象のプロセスデータまでの距離に基づいて異常度を求める。例えばマハラノビス距離の2乗に基づいて異常度が決定される。なお、プロセスデータそのものの瞬時値を用いてもよいし、所定期間におけるプロセスデータの最大値、最小値、積分値、標準偏差、又は微分係数(傾き)等を用いてホテリング理論に基づく異常度を算出するようにしてもよい。ホテリング法によれば、所定の基準からの外れ値を検知することができる。 · Hotelling method (T 2 method)
For example, assuming that multiple process data obtained from one sensor follow a predetermined probability density function, the population mean and standard deviation are estimated from the sample mean and sample standard deviation calculated using the process data. A given probability density function is, for example, a normal distribution. Then, the degree of anomaly is obtained based on the distance from the average of the population to the process data to be verified. For example, the degree of anomaly is determined based on the square of the Mahalanobis distance. The instantaneous value of the process data itself may be used, or the degree of abnormality based on the hoteling theory can be determined by using the maximum value, minimum value, integral value, standard deviation, differential coefficient (slope), etc. of the process data in a predetermined period. It may be calculated. According to the hoteling method, outliers from a predetermined standard can be detected.
・k近傍法
例えば1以上のセンサから得られる時系列のプロセスデータをベクトル化又は行列化し、データ同士の距離を算出する。距離は、ユークリッド距離でもよいし、マハラノビス距離やマンハッタン距離であってもよい。そして、検証対象のデータからk番目に近いデータとの距離に応じて異常度を判定する。k近傍法においては他のデータとの関係に基づいて判断する。したがって、例えば正常値が複数のクラスターに分類できるような場合においては、複数のクラスターのいずれからも遠い外れ値を検知することができる。 -K-nearest neighbor method For example, time-series process data obtained from one or more sensors is vectorized or matrixed, and the distance between the data is calculated. The distance may be Euclidean distance, Mahalanobis distance or Manhattan distance. Then, the degree of abnormality is determined according to the distance from the data to be verified to the data closest to the kth. In the k-nearest neighbor method, the judgment is made based on the relationship with other data. Therefore, for example, when normal values can be classified into a plurality of clusters, outliers far from any of the plurality of clusters can be detected.
例えば1以上のセンサから得られる時系列のプロセスデータをベクトル化又は行列化し、データ同士の距離を算出する。距離は、ユークリッド距離でもよいし、マハラノビス距離やマンハッタン距離であってもよい。そして、検証対象のデータからk番目に近いデータとの距離に応じて異常度を判定する。k近傍法においては他のデータとの関係に基づいて判断する。したがって、例えば正常値が複数のクラスターに分類できるような場合においては、複数のクラスターのいずれからも遠い外れ値を検知することができる。 -K-nearest neighbor method For example, time-series process data obtained from one or more sensors is vectorized or matrixed, and the distance between the data is calculated. The distance may be Euclidean distance, Mahalanobis distance or Manhattan distance. Then, the degree of abnormality is determined according to the distance from the data to be verified to the data closest to the kth. In the k-nearest neighbor method, the judgment is made based on the relationship with other data. Therefore, for example, when normal values can be classified into a plurality of clusters, outliers far from any of the plurality of clusters can be detected.
・DTW(Dynamic Time Wrapping) Barycenter Averaging
異なるバッチ処理におけるプロセスデータのような複数の時系列データに基づいて、平均的な時系列データを算出することができる。例えば、バッチ処理における対応する区間の、異なる製造番号のプロセスデータについて、それぞれ上記平均的な時系列データとの距離を算出することができる。図11は、プロセスデータの同期処理を説明するための図である。製造番号が異なるバッチ処理の時系列データに含まれる要素である個々の値について、異なる時系列データに含まれる値同士の最短距離を総当たり的に求め、最短距離の積算値が最も小さくなるように、時間軸方向に時系列データをスライドさせて位置合わせを行う。すなわち、時系列データの類似度に基づいて、複数の時系列データを同期させる。このようにすれば、プラント3において実施される工程におけるステップが時系列上で対応するように、複数のプロセスデータを重ねて表示できるようになる。そして、同期させた時系列データ同士の距離の積算値に基づき、k近傍法やホテリング理論により異常度を演算する。DTW Barycenter Averagingによれば、時系列データ間の類否の程度に基づいて異常を検知することができる。 ・ DTW (Dynamic Time Wrapping) Barycenter Averaging
Average time series data can be calculated based on multiple time series data such as process data in different batch processes. For example, it is possible to calculate the distance from the average time series data for each process data of different serial numbers in the corresponding section in batch processing. FIG. 11 is a diagram for explaining a process data synchronization process. For each value that is an element included in the time series data of batch processing with different serial numbers, the shortest distance between the values included in the different time series data is calculated as a whole, and the integrated value of the shortest distance is minimized. In addition, the time series data is slid in the time axis direction for alignment. That is, a plurality of time-series data are synchronized based on the similarity of the time-series data. By doing so, it becomes possible to superimpose and display a plurality of process data so that the steps in the process performed in theplant 3 correspond in time series. Then, the degree of abnormality is calculated by the k-nearest neighbor method or the hoteling theory based on the integrated value of the distances between the synchronized time series data. According to DTW Barycenter Averaging, anomalies can be detected based on the degree of similarity between time series data.
異なるバッチ処理におけるプロセスデータのような複数の時系列データに基づいて、平均的な時系列データを算出することができる。例えば、バッチ処理における対応する区間の、異なる製造番号のプロセスデータについて、それぞれ上記平均的な時系列データとの距離を算出することができる。図11は、プロセスデータの同期処理を説明するための図である。製造番号が異なるバッチ処理の時系列データに含まれる要素である個々の値について、異なる時系列データに含まれる値同士の最短距離を総当たり的に求め、最短距離の積算値が最も小さくなるように、時間軸方向に時系列データをスライドさせて位置合わせを行う。すなわち、時系列データの類似度に基づいて、複数の時系列データを同期させる。このようにすれば、プラント3において実施される工程におけるステップが時系列上で対応するように、複数のプロセスデータを重ねて表示できるようになる。そして、同期させた時系列データ同士の距離の積算値に基づき、k近傍法やホテリング理論により異常度を演算する。DTW Barycenter Averagingによれば、時系列データ間の類否の程度に基づいて異常を検知することができる。 ・ DTW (Dynamic Time Wrapping) Barycenter Averaging
Average time series data can be calculated based on multiple time series data such as process data in different batch processes. For example, it is possible to calculate the distance from the average time series data for each process data of different serial numbers in the corresponding section in batch processing. FIG. 11 is a diagram for explaining a process data synchronization process. For each value that is an element included in the time series data of batch processing with different serial numbers, the shortest distance between the values included in the different time series data is calculated as a whole, and the integrated value of the shortest distance is minimized. In addition, the time series data is slid in the time axis direction for alignment. That is, a plurality of time-series data are synchronized based on the similarity of the time-series data. By doing so, it becomes possible to superimpose and display a plurality of process data so that the steps in the process performed in the
平均のような基準からの乖離について、正負の符号を付した異常度を算出するようにしてもよい。図12は、時系列データについて基準からの距離の大きさによって異常度を算出する例を説明するための図である。図13は、同じ時系列データについて正負の方向を考慮した、基準からの距離によって異常度を算出する例を説明するための図である。それぞれ、縦軸は例えば平均からの乖離の程度を表すものとする。破線の矩形で示す部分においては実際のところ変調が発生しているが、図12の例に示す値のみからでは検知が困難である。一方、図13の例においては正負の方向が逆に乖離する傾向が表れているため、変調の検知が容易になっている。
Regarding the deviation from the standard such as the average, the degree of abnormality with positive and negative signs may be calculated. FIG. 12 is a diagram for explaining an example in which the degree of abnormality is calculated based on the magnitude of the distance from the reference for the time series data. FIG. 13 is a diagram for explaining an example of calculating the degree of abnormality by the distance from the reference in consideration of the positive and negative directions for the same time series data. In each case, the vertical axis represents, for example, the degree of deviation from the average. Modulation actually occurs in the portion indicated by the broken line rectangle, but it is difficult to detect it only from the values shown in the example of FIG. On the other hand, in the example of FIG. 13, since the positive and negative directions tend to deviate in the opposite direction, it is easy to detect the modulation.
例えば上述のホテリング法においては、距離を2乗せずに、基準からの乖離の程度を正又は負の符号付きの値として求めることで、図13のような異常度が求められる。DTW Barycenter Averaging等においては、時系列データにおける極大値等の特徴的な点について例えば次の式により正又は負の符号を決定すると共に、算出された値を距離の大きさに乗じる。
符号決定式=(μ-x)/|μ-x|
なお、μは、訓練データの平均値(基準値)、xは検証対象のプロセスデータである。このように、符号決定式によれば、時系列データの所定の時点における基準値と、対応する時点における検証対象のプロセスデータとの大小関係に応じて、上記の時点における基準との乖離の方向を表す符号を決定することができる。また、基準からの乖離の程度を示す、符号付きの値を用いることで、図13のような異常度を求めることができ、誤検知を抑えることができる。また、時系列データにおける特徴的な点として、極大値のほか、極小値や、ある時点のプロセスデータと別の時点のプロセスデータとの差等を用いてもよい。 For example, in the above-mentioned hoteling method, the degree of anomaly as shown in FIG. 13 can be obtained by obtaining the degree of deviation from the reference as a positive or negative signed value without squaring the distance. In DTW Barycenter Averaging and the like, a positive or negative sign is determined for a characteristic point such as a maximum value in time series data by, for example, the following formula, and the calculated value is multiplied by the magnitude of the distance.
Code determination formula = (μ-x) / | μ-x |
Note that μ is the average value (reference value) of the training data, and x is the process data to be verified. As described above, according to the sign determination formula, the direction of deviation from the reference value at the above time point according to the magnitude relationship between the reference value of the time series data at a predetermined time point and the process data to be verified at the corresponding time point. The sign representing the above can be determined. Further, by using a signed value indicating the degree of deviation from the standard, the degree of abnormality as shown in FIG. 13 can be obtained, and false detection can be suppressed. Further, as a characteristic point in the time series data, in addition to the maximum value, the minimum value, the difference between the process data at a certain time point and the process data at another time point, and the like may be used.
・オートエンコーダ(自己符号化器)
図14は、オートエンコーダを用いた異常検知を説明するための図である。本手法では、複数のセンサからのプロセスデータの関係の特徴に基づいて異常判定を行う。具体的には、ニューラルネットワークを用いて、例えば入力データである連続処理やバッチ処理のプロセスデータそのものを教師値とし、入力データの圧縮(エンコード)及び復元(デコード)を行うことができるモデルを作成する。ニューラルネットワークは、例えば、入力層及び出力層のノード数がセンサの数に対応し、中間層のノード数はセンサの数よりも少ない。入力層に入力された情報は、中間層において圧縮され、出力層において復元される。なお、中間層は複数存在してもよく、層間の接続構造は全結合には限定されない。そして、正常時のプロセスデータを訓練データとして学習処理を行い、入力層の値と出力層の値との差が小さくなるようにパラメータを調整したモデルが作成される。また、異常判定処理においては、検証対象のプロセスデータを入力し、入力層の値と出力層の値との差に応じた異常度を演算する。すなわち、異常のあるプロセスデータが入力された場合、中間層において圧縮された情報を出力層において適切に復元することができず、入力層と出力層の値の差が大きくなるため、この差に基づいて異常検知を行うことができる。オートエンコーダによれば、複数のセンサ間の出力値の関係の特徴に基づいて異常を検知することができる。 ・ Autoencoder (self-encoder)
FIG. 14 is a diagram for explaining abnormality detection using an autoencoder. In this method, abnormality determination is performed based on the characteristics of the relationship of process data from a plurality of sensors. Specifically, using a neural network, for example, a model that can compress (encode) and restore (decode) input data by using the process data itself of continuous processing or batch processing, which is input data, as a teacher value is created. do. In a neural network, for example, the number of nodes in the input layer and the output layer corresponds to the number of sensors, and the number of nodes in the intermediate layer is smaller than the number of sensors. The information input to the input layer is compressed in the intermediate layer and restored in the output layer. It should be noted that a plurality of intermediate layers may exist, and the connection structure between the layers is not limited to full coupling. Then, the learning process is performed using the process data in the normal state as training data, and a model is created in which the parameters are adjusted so that the difference between the value of the input layer and the value of the output layer becomes small. Further, in the abnormality determination process, the process data to be verified is input, and the degree of abnormality is calculated according to the difference between the value of the input layer and the value of the output layer. That is, when abnormal process data is input, the information compressed in the intermediate layer cannot be properly restored in the output layer, and the difference between the values of the input layer and the output layer becomes large. Abnormality detection can be performed based on this. According to the autoencoder, an abnormality can be detected based on the characteristics of the relationship between output values between a plurality of sensors.
・グラフィカルラッソ
例えば連続処理やバッチ処理における複数のセンサからのプロセスデータの共分散行列に基づいて変数間の依存関係を数値化し、基準となる疎なグラフとして表す。正常時においては、変数間の依存関係は、基準から大きく崩れないものと判断できる。そして、異常判定処理においては、検証対象のプロセスデータを用いて、変数間の依存関係を求め、上述した基準との差異の大きさに応じた異常度を演算する。グラフィカルラッソによれば、プロセスデータ間の相関関係を数値化することができ、関係の崩れに基づいて異常度を検知することができる。 -Graphical lasso For example, the dependency between variables is quantified based on the covariance matrix of process data from multiple sensors in continuous processing or batch processing, and expressed as a sparse graph as a reference. In the normal state, it can be judged that the dependency between variables does not greatly deviate from the standard. Then, in the abnormality determination process, the dependency between the variables is obtained using the process data to be verified, and the degree of abnormality is calculated according to the magnitude of the difference from the above-mentioned reference. According to the graphical lasso, the correlation between process data can be quantified, and the degree of abnormality can be detected based on the collapse of the relationship.
例えば連続処理やバッチ処理における複数のセンサからのプロセスデータの共分散行列に基づいて変数間の依存関係を数値化し、基準となる疎なグラフとして表す。正常時においては、変数間の依存関係は、基準から大きく崩れないものと判断できる。そして、異常判定処理においては、検証対象のプロセスデータを用いて、変数間の依存関係を求め、上述した基準との差異の大きさに応じた異常度を演算する。グラフィカルラッソによれば、プロセスデータ間の相関関係を数値化することができ、関係の崩れに基づいて異常度を検知することができる。 -Graphical lasso For example, the dependency between variables is quantified based on the covariance matrix of process data from multiple sensors in continuous processing or batch processing, and expressed as a sparse graph as a reference. In the normal state, it can be judged that the dependency between variables does not greatly deviate from the standard. Then, in the abnormality determination process, the dependency between the variables is obtained using the process data to be verified, and the degree of abnormality is calculated according to the magnitude of the difference from the above-mentioned reference. According to the graphical lasso, the correlation between process data can be quantified, and the degree of abnormality can be detected based on the collapse of the relationship.
その他、一般的な異常検知手法やこれらを応用した手法をさらに用いるようにしてもよい。また、それぞれの手法において異常検知に用いる閾値は、プラント3の運転において実際に得られたプロセスデータを用いて、正常時には誤判定をすることができるだけ少なく、異常時には異常の発生やその予兆を速やかに検知できるような値を探索し、図9に示した知識ベースに登録しておくようにしてもよい。
In addition, general anomaly detection methods and methods applying these may be further used. In addition, the threshold value used for abnormality detection in each method is as little as possible to make an erroneous judgment in the normal state using the process data actually obtained in the operation of the plant 3, and in the case of an abnormality, the occurrence of the abnormality and its sign are promptly detected. You may search for a value that can be detected and register it in the knowledge base shown in FIG.
<装置構成>
図15は、異常変調原因特定装置1の構成の一例を示すブロック図である。異常変調原因特定装置1は、一般的なコンピュータであり、通信インターフェース(I/F)11と、記憶装置12と、入出力装置13と、プロセッサ14とを備えている。通信I/F11は、例えばネットワークカードや通信モジュールであってもよく、所定のプロトコルに基づき、他のコンピュータと通信を行う。記憶装置12は、RAM(Random Access Memory)やROM(Read Only Memory)等の主記憶装置、及びHDD(Hard-Disk Drive)やSSD(Solid State Drive)、フラッシュメモリ等の補助記憶装置(二次記憶装置)であってもよい。主記憶装置は、プロセッサ14が読み出すプログラムや他のコンピュータとの間で送受信する情報を一時的に記憶したり、プロセッサ14の作業領域を確保したりする。補助記憶装置は、プロセッサ14が実行するプログラムや他のコンピュータとの間で送受信する情報等を記憶する。入出力装置13は、例えば、キーボード、マウス等の入力装置、モニタ等の出力装置、タッチパネルのような入出力装置等のユーザインターフェースである。プロセッサ14は、CPU(Central Processing Unit)等の演算処理装置であり、プログラムを実行することにより本実施形態に係る各処理を行う。図15の例では、プロセッサ14内に機能ブロックを示している。すなわち、プロセッサ14は、所定のプログラムを実行することにより、プロセスデータ取得部141、前処理部142、学習処理部143、異常判定部144、原因診断部145及び出力制御部146として機能する。 <Device configuration>
FIG. 15 is a block diagram showing an example of the configuration of the abnormal modulationcause identification device 1. The anomalous modulation cause identification device 1 is a general computer, and includes a communication interface (I / F) 11, a storage device 12, an input / output device 13, and a processor 14. The communication I / F 11 may be, for example, a network card or a communication module, and communicates with another computer based on a predetermined protocol. The storage device 12 includes a main storage device such as a RAM (Random Access Memory) and a ROM (Read Only Memory), and an auxiliary storage device (secondary) such as an HDD (Hard-Disk Drive), an SSD (Solid State Drive), and a flash memory. It may be a storage device). The main storage device temporarily stores a program read by the processor 14 and information transmitted to and received from another computer, and secures a work area of the processor 14. The auxiliary storage device stores programs executed by the processor 14, information transmitted to and received from other computers, and the like. The input / output device 13 is, for example, a user interface such as an input device such as a keyboard and a mouse, an output device such as a monitor, and an input / output device such as a touch panel. The processor 14 is an arithmetic processing unit such as a CPU (Central Processing Unit), and performs each process according to the present embodiment by executing a program. In the example of FIG. 15, a functional block is shown in the processor 14. That is, the processor 14 functions as a process data acquisition unit 141, a preprocessing unit 142, a learning processing unit 143, an abnormality determination unit 144, a cause diagnosis unit 145, and an output control unit 146 by executing a predetermined program.
図15は、異常変調原因特定装置1の構成の一例を示すブロック図である。異常変調原因特定装置1は、一般的なコンピュータであり、通信インターフェース(I/F)11と、記憶装置12と、入出力装置13と、プロセッサ14とを備えている。通信I/F11は、例えばネットワークカードや通信モジュールであってもよく、所定のプロトコルに基づき、他のコンピュータと通信を行う。記憶装置12は、RAM(Random Access Memory)やROM(Read Only Memory)等の主記憶装置、及びHDD(Hard-Disk Drive)やSSD(Solid State Drive)、フラッシュメモリ等の補助記憶装置(二次記憶装置)であってもよい。主記憶装置は、プロセッサ14が読み出すプログラムや他のコンピュータとの間で送受信する情報を一時的に記憶したり、プロセッサ14の作業領域を確保したりする。補助記憶装置は、プロセッサ14が実行するプログラムや他のコンピュータとの間で送受信する情報等を記憶する。入出力装置13は、例えば、キーボード、マウス等の入力装置、モニタ等の出力装置、タッチパネルのような入出力装置等のユーザインターフェースである。プロセッサ14は、CPU(Central Processing Unit)等の演算処理装置であり、プログラムを実行することにより本実施形態に係る各処理を行う。図15の例では、プロセッサ14内に機能ブロックを示している。すなわち、プロセッサ14は、所定のプログラムを実行することにより、プロセスデータ取得部141、前処理部142、学習処理部143、異常判定部144、原因診断部145及び出力制御部146として機能する。 <Device configuration>
FIG. 15 is a block diagram showing an example of the configuration of the abnormal modulation
プロセスデータ取得部141は、例えば通信I/F11及び制御ステーション2を介して、プラント3が備えるセンサからプロセスデータを取得し、記憶装置12に記憶させる。上述したように、プロセスデータは、タグによってセンサと対応付けられている。
The process data acquisition unit 141 acquires process data from a sensor included in the plant 3 and stores it in the storage device 12 via, for example, the communication I / F 11 and the control station 2. As mentioned above, the process data is associated with the sensor by a tag.
前処理部142は、異常検知モデルの作成に際し、プロセスデータを加工する。例えば前処理部142は、プロセスデータと製造番号とを紐付けする。すなわち、予め記憶装置12に保持されている上述したトレーサビリティ情報に基づいて、バッチ処理における所定のタグ、系統及び製造番号に該当するプロセスデータと、連続処理における所定のタグに該当し所定のタイミングで出力されたプロセスデータとを紐づける。また、知識ベース等のテーブルの設定値に基づき異常判定に用いる所定期間のデータを抽出し、各手法に応じた特徴量を演算する。なお、学習処理においては、前処理部142はデータクレンジングを行い、非定常の運転期間におけるデータや、異常発生時のデータ、ノイズ等の外れ値を除外して訓練データを抽出するようにしてもよい。
The preprocessing unit 142 processes the process data when creating the abnormality detection model. For example, the preprocessing unit 142 associates the process data with the serial number. That is, based on the above-mentioned traceability information held in the storage device 12 in advance, the process data corresponding to a predetermined tag, system and serial number in batch processing, and the process data corresponding to a predetermined tag in continuous processing and at a predetermined timing. Associate with the output process data. In addition, data for a predetermined period used for abnormality determination is extracted based on the set values in a table such as a knowledge base, and feature quantities corresponding to each method are calculated. In the learning process, the pre-processing unit 142 performs data cleansing and extracts training data by excluding data in the unsteady operation period, data at the time of abnormality, and outliers such as noise. good.
学習処理部143は、例えば知識ベースに基づいて1以上の演算を含む異常検知モデルを作成し、記憶装置12に記憶させる。このとき、学習処理部143は、訓練データの特徴を学習したパラメータを決定する。なお、複数のセンサの出力値を用いて学習処理を行う場合は、適宜正規化を行うようにしてもよい。
The learning processing unit 143 creates an abnormality detection model including one or more operations based on, for example, a knowledge base, and stores it in the storage device 12. At this time, the learning processing unit 143 determines the parameters learned from the characteristics of the training data. When the learning process is performed using the output values of a plurality of sensors, normalization may be performed as appropriate.
異常判定部144は、プロセスデータと異常検知モデルとを用いて異常度を算出する。
すなわち、異常判定部144は、学習処理においては、交差検証を行うためのテストデータと異常検知モデルとを用いて異常度を算出する。また、異常判定処理においては、プラント3から取得されるプロセスデータを用いて異常度を算出する。 Theabnormality determination unit 144 calculates the degree of abnormality using the process data and the abnormality detection model.
That is, in the learning process, theabnormality determination unit 144 calculates the degree of abnormality using the test data for performing cross-validation and the abnormality detection model. Further, in the abnormality determination process, the degree of abnormality is calculated using the process data acquired from the plant 3.
すなわち、異常判定部144は、学習処理においては、交差検証を行うためのテストデータと異常検知モデルとを用いて異常度を算出する。また、異常判定処理においては、プラント3から取得されるプロセスデータを用いて異常度を算出する。 The
That is, in the learning process, the
原因診断部145は、算出された異常度を用いて、複数の想定原因の各々について成立度(確度)を算出する。成立度は、例えば、異常判定部が算出した異常度を用いて、知識ベースにおいて各想定原因に関連付けられている影響のうち、プロセスデータに現れている影響の割合やその程度に基づいて算出する。また、想定原因の各々に対応付けて、原因に対してとるべき対処を表すアクションを記憶装置12に記憶させておき、ユーザへアクションを提示できるようにしてもよい。
The cause diagnosis unit 145 calculates the degree of establishment (accuracy) for each of the plurality of assumed causes using the calculated degree of abnormality. The degree of establishment is calculated based on the ratio and degree of the influence appearing in the process data among the influences associated with each assumed cause in the knowledge base, for example, using the degree of abnormality calculated by the abnormality determination unit. .. Further, an action indicating an action to be taken for the cause may be stored in the storage device 12 in association with each of the assumed causes so that the action can be presented to the user.
出力制御部146は、例えば入出力装置13を介して、異常を検知した場合にアラームを発報したり、想定原因ごとの成立度を出力したりする。出力制御部146は、ユーザの操作に応じて適宜以上のような構成要素が、バス15を介して接続されている。なお、便宜上、図15に示す1つの装置がプロセスデータ取得部141、前処理部142、学習処理部143、異常判定部144、原因診断部145及び出力制御部146を備えているが、少なくとも一部の機能を異なる装置に分散させて設けるようにしてもよい。
The output control unit 146 issues an alarm when an abnormality is detected, or outputs the degree of establishment for each assumed cause, for example, via the input / output device 13. In the output control unit 146, the above-mentioned components are appropriately connected via the bus 15 according to the operation of the user. For convenience, one device shown in FIG. 15 includes a process data acquisition unit 141, a preprocessing unit 142, a learning processing unit 143, an abnormality determination unit 144, a cause diagnosis unit 145, and an output control unit 146, but at least one. The functions of the units may be distributed and provided in different devices.
<学習処理>
図16は、異常変調原因特定装置1が実行する学習処理の一例を示す処理フロー図である。異常変調原因特定装置1のプロセッサ14は、所定のプログラムを実行することにより、図16に示すような処理を実行する。学習処理は、プラント3の過去の運転によって得られたプロセスデータを用いて任意のタイミングで実行される。また、学習処理は、主として前処理(図16:S1)、モデル構築処理(S2)、及び検証処理(S3)を含む。すなわち、プロセスデータの一部を訓練データとし、その他をテストデータとし、交差検証を行うようにしてもよい。なお、上述のテーブル等がユーザによって作成され、予め記憶装置12に記憶されているものとする。便宜上、図16に示す1つの処理フローに前処理、学習処理、及び検証処理を記載しているが、例えば前処理や検証処理等、少なくとも一部を異なる装置に分散させて実行するようにしてもよい。 <Learning process>
FIG. 16 is a processing flow diagram showing an example of learning processing executed by the abnormal modulationcause identification device 1. The processor 14 of the abnormal modulation cause identification device 1 executes the process as shown in FIG. 16 by executing a predetermined program. The learning process is executed at an arbitrary timing using the process data obtained by the past operation of the plant 3. Further, the learning process mainly includes a pre-process (FIG. 16: S1), a model construction process (S2), and a verification process (S3). That is, a part of the process data may be used as training data, and the other may be used as test data to perform cross-validation. It is assumed that the above-mentioned table or the like is created by the user and stored in the storage device 12 in advance. For convenience, the pre-processing, learning processing, and verification processing are described in one processing flow shown in FIG. 16, but at least a part of the pre-processing, verification processing, and the like are distributed to different devices and executed. May be good.
図16は、異常変調原因特定装置1が実行する学習処理の一例を示す処理フロー図である。異常変調原因特定装置1のプロセッサ14は、所定のプログラムを実行することにより、図16に示すような処理を実行する。学習処理は、プラント3の過去の運転によって得られたプロセスデータを用いて任意のタイミングで実行される。また、学習処理は、主として前処理(図16:S1)、モデル構築処理(S2)、及び検証処理(S3)を含む。すなわち、プロセスデータの一部を訓練データとし、その他をテストデータとし、交差検証を行うようにしてもよい。なお、上述のテーブル等がユーザによって作成され、予め記憶装置12に記憶されているものとする。便宜上、図16に示す1つの処理フローに前処理、学習処理、及び検証処理を記載しているが、例えば前処理や検証処理等、少なくとも一部を異なる装置に分散させて実行するようにしてもよい。 <Learning process>
FIG. 16 is a processing flow diagram showing an example of learning processing executed by the abnormal modulation
異常変調原因特定装置1のプロセスデータ取得部141は、プロセスデータを取得する(図16:S11)。本ステップでは、図3や図6に示したようなプロセスデータのうち、異常検知モデルに用いられるデータが抽出される。プロセスデータは、OPCデータ、いわゆるデータベースのテーブル、CSV等のような所定の形式のファイルで記憶装置12に記憶されているものとする。また、プロセスデータは、日時、タグ等の属性を含み、特にバッチ処理のプロセスデータにおいては製番、ステップ等の属性をさらに含むようにしてもよい。
The process data acquisition unit 141 of the abnormal modulation cause identification device 1 acquires the process data (FIG. 16: S11). In this step, from the process data as shown in FIGS. 3 and 6, the data used for the abnormality detection model is extracted. It is assumed that the process data is stored in the storage device 12 in a file of a predetermined format such as OPC data, a so-called database table, CSV, or the like. Further, the process data includes attributes such as date and time and tags, and particularly in the process data of batch processing, attributes such as serial numbers and steps may be further included.
また、異常変調原因特定装置1の前処理部142は、連続処理のプロセスデータについて、製造番号との紐づけを行う(図16:S12)。本ステップでは、図8に示したように、連続工程において取得されるプロセスデータと、バッチ処理において取得されるプロセスデータの製造番号群とを対応付け、異常度の算出において使用するプロセスデータを対応付ける。すなわち、図9に示した知識ベースや図11に示したロジックツリーにおいて、ある原因がバッチ処理のプロセスデータにも連続処理のプロセスデータにも影響する場合、本ステップで紐づけられたデータに基づいて異常度や成立度の算出を行う。
Further, the preprocessing unit 142 of the abnormal modulation cause identification device 1 associates the process data of continuous processing with the serial number (FIG. 16: S12). In this step, as shown in FIG. 8, the process data acquired in the continuous process is associated with the serial number group of the process data acquired in the batch process, and the process data used in the calculation of the degree of abnormality is associated. .. That is, in the knowledge base shown in FIG. 9 and the logic tree shown in FIG. 11, when a certain cause affects both the process data of batch processing and the process data of continuous processing, it is based on the data linked in this step. The degree of abnormality and the degree of establishment are calculated.
そして、前処理部142は、異常判定モデルにおいて使用するデータの抽出及び加工を行う(図16:S13)。本ステップでは、前処理部142は、知識ベース等のテーブルの設定値に基づき異常判定に用いる所定期間のデータを抽出し、各手法に応じた特徴量を演算する。
Then, the preprocessing unit 142 extracts and processes the data used in the abnormality determination model (FIG. 16: S13). In this step, the preprocessing unit 142 extracts data for a predetermined period used for abnormality determination based on the set values of a table such as a knowledge base, and calculates a feature amount according to each method.
例えば、ホテリング法による異常度を算出する場合は、前処理部142は、所定のタイミングや期間のプロセスデータを抽出し、プロセスデータそのものである瞬時値や、プロセスデータの最大値、最小値、積分値、若しくは差分、反応速度の積分値、所定の時点の微分係数等を算出し、記憶装置12に格納する。また、k近接法による異常度を算出する場合は、時系列のプロセスデータをベクトル化又は行列化する。また、DTW Barycenter Averagingによる異常度を算出する場合は、複数のプロセスデータについて同期処理を行い、平均的な時系列データを求める。また、オートエンコーダやグラフィカルラッソによる異常度を算出する場合は、複数のプロセスデータについて同期処理を行う。
For example, when calculating the degree of abnormality by the hoteling method, the preprocessing unit 142 extracts the process data at a predetermined timing and period, and the instantaneous value which is the process data itself, the maximum value, the minimum value, and the integral of the process data. A value, a difference, an integral value of the reaction rate, a differential coefficient at a predetermined time point, and the like are calculated and stored in the storage device 12. When calculating the degree of anomaly by the k-nearest neighbor method, the time-series process data is vectorized or matrixed. In addition, when calculating the degree of abnormality by DTWBarycenterAveraging, synchronous processing is performed on a plurality of process data, and average time-series data is obtained. In addition, when calculating the degree of abnormality by the autoencoder or the graphical lasso, synchronization processing is performed for a plurality of process data.
なお、前処理部142は、プロセスデータについて所定のデータクレンジングを実施してもよい。データクレンジング処理は、外れ値を排除する処理であり、様々な手法を採用することができる。例えば、直近のデータを用いて移動平均値を算出してもよい。また、移動平均値と実測値との差をとり、差分のばらつきを表す標準偏差σを求める。そして、例えば確率分布の平均値-3σから確率分布の平均+3σまでの区間(3σ区間とも呼ぶ)のような所定の信頼区間に入らない値を除外してもよい。同様に、前後の実測値の差について、3σ区間に入らない値を除外してもよい。
The preprocessing unit 142 may perform predetermined data cleansing on the process data. The data cleansing process is a process for eliminating outliers, and various methods can be adopted. For example, the moving average value may be calculated using the latest data. In addition, the difference between the moving average value and the measured value is taken, and the standard deviation σ representing the variation in the difference is obtained. Then, a value that does not fall within a predetermined confidence interval, such as an interval from the average value of the probability distribution -3σ to the average of the probability distribution + 3σ (also referred to as a 3σ interval), may be excluded. Similarly, the difference between the measured values before and after may be excluded from the value that does not fall within the 3σ interval.
その後、異常変調原因特定装置1の学習処理部143は、異常検知モデル構築処理を行う(図16:S2)。本ステップでは、図9に示した知識ベースに基づいて、異常度の演算を含む異常検知モデルを作成する。具体的には、図9の「想定原因」の各々に対応付けられた1以上の「影響」について、それぞれ「演算方法」に登録された手法による異常度を算出し、異常度の組み合わせで表される異常検知モデルを作成する。また、学習処理部143は、異常検知の手法によっては訓練データを用いてモデルのパラメータを調整する。例えば、オートエンコーダによる異常度を算出する場合は、入力されたプロセスデータの情報を圧縮した後に復元できるように、層間の重み係数を調整する。グラフィカルラッソによる異常度を算出する場合は、複数のセンサからのプロセスデータの共分散行列に基づいて変数間の依存関係を数値化する。そして、学習処理部143は作成した異常検知モデルを記憶装置12に記憶させる。
After that, the learning processing unit 143 of the abnormality modulation cause identification device 1 performs the abnormality detection model construction processing (FIG. 16: S2). In this step, an anomaly detection model including an abnormality degree calculation is created based on the knowledge base shown in FIG. Specifically, for one or more "impacts" associated with each of the "assumed causes" in FIG. 9, the degree of abnormality by the method registered in the "calculation method" is calculated, and the table is expressed by the combination of the degree of abnormality. Create an anomaly detection model. Further, the learning processing unit 143 adjusts the parameters of the model by using the training data depending on the method of abnormality detection. For example, when calculating the degree of abnormality by the autoencoder, the weighting coefficient between layers is adjusted so that the information of the input process data can be restored after being compressed. When calculating the degree of anomaly by graphical lasso, the dependency between variables is quantified based on the covariance matrix of process data from multiple sensors. Then, the learning processing unit 143 stores the created abnormality detection model in the storage device 12.
異常変調原因特定装置1の異常判定部144は、作成された異常検知モデルと、テストデータとを用いて、異常度の算出を行う(図16:S31)。本ステップでは、異常判定部144は、異常度算出の手法に応じて異常度を算出する。例えば、ホテリング法による異常度を算出する場合、プロセスデータを用いて母集団の標本平均及び標本標準偏差を推定し、母集団の平均から検証対象のプロセスデータまでの距離に基づいて異常度を求める。k近傍法による異常度を算出する場合は、データ同士の距離を算出し、検証対象のデータからk番目に近いデータとの距離に応じた異常度を算出する。DTW Barycenter Averagingによる異常度を算出する場合は、前処理において同期させた時系列データ同士の距離の積算値に基づき、k近傍法やホテリング理論により異常度を求める。オートエンコーダによる異常度を算出する場合は、検証対象のプロセスデータをオートエンコーダに入力し、入力層の値と出力層の値との差に応じた異常度を求める。グラフィカルラッソによる異常度を算出する場合は、検証対象のプロセスデータを用いて、変数間の依存関係を求め、基準となる依存関係との差異の大きさに応じた異常度を求める。
The abnormality determination unit 144 of the abnormality modulation cause identification device 1 calculates the degree of abnormality using the created abnormality detection model and the test data (FIG. 16: S31). In this step, the abnormality determination unit 144 calculates the abnormality degree according to the method of calculating the abnormality degree. For example, when calculating the degree of anomaly by the hoteling method, the sample mean and sample standard deviation of the population are estimated using the process data, and the degree of anomaly is obtained based on the distance from the average of the population to the process data to be verified. .. When calculating the degree of abnormality by the k-nearest neighbor method, the distance between the data is calculated, and the degree of abnormality is calculated according to the distance from the data to be verified to the data closest to the k-th. When calculating the degree of anomaly by DTWBarycenter Averaging, the degree of anomaly is obtained by the k-nearest neighbor method or the hoteling theory based on the integrated value of the distances between the time-series data synchronized in the preprocessing. When calculating the degree of abnormality by the autoencoder, the process data to be verified is input to the autoencoder, and the degree of abnormality is obtained according to the difference between the value of the input layer and the value of the output layer. When calculating the degree of anomaly by the graphical lasso, the dependency between variables is obtained using the process data to be verified, and the degree of abnormality according to the magnitude of the difference from the reference dependency is obtained.
異常変調原因特定装置1の原因診断部145は、算出された異常度を用いて想定原因の成立度を求める(図16:S32)。本ステップでは、知識ベースの想定原因の各々について、影響として対応付けられた変調が表れた割合に基づいて、成立度を算出する。例えば、図9の原因(2)には、タグ002の水分の上昇、タグ004の温度1の上昇、及びタグ005の温度2の下降という3つの影響が対応付けられている。図16のS31において影響の各々について算出された異常度を用いて、3つの影響のうち異常度が閾値を超えたものの割合を成立度としてもよい。仮に3つの影響のうち2つについて異常度が閾値を超えた場合、例えば成立度は66.7%とすることができる。また、成立度の算出において、影響(タグ)の種類に応じて、又は異常度の大きさに基づいて、さらに重み付けを行ってもよい。例えば、成立度として、各影響について重みを乗じた上で総和を求めるようにしてもよい。
The cause diagnosis unit 145 of the abnormal modulation cause identification device 1 obtains the degree of establishment of the assumed cause using the calculated degree of abnormality (FIG. 16: S32). In this step, for each of the assumed causes of the knowledge base, the degree of establishment is calculated based on the ratio of the modulation associated with the influence. For example, the cause (2) in FIG. 9 is associated with three effects: an increase in the water content of the tag 002, an increase in the temperature 1 of the tag 004, and a decrease in the temperature 2 of the tag 005. Using the degree of abnormality calculated for each of the effects in S31 of FIG. 16, the ratio of the three effects whose degree of abnormality exceeds the threshold value may be defined as the degree of establishment. If the degree of abnormality exceeds the threshold value for two of the three effects, for example, the degree of establishment can be 66.7%. Further, in the calculation of the degree of establishment, further weighting may be performed according to the type of influence (tag) or based on the magnitude of the degree of abnormality. For example, as the degree of establishment, the sum may be obtained after multiplying each influence by a weight.
また、出力制御部146は、作成されたモデルをユーザが評価するために、S31で算出された異常度及びS32で算出された成立度を出力する(図16:S33)。本ステップでは、プラント3の過去の運転において収集されたプロセスデータのうち、モデルの構築に用いた訓練データとは異なるテストデータを用いて交差検証を行う。また、本ステップにおいては過去に異常が発生した時点のプロセスデータも用いて適切に異常を検知してアラームやこれに対処するためのアクションが出力されるか検証する。また、学習処理部143は、十分な精度で異常を検知できるか判断する(図16:S4)。精度が十分でないと判断された場合(S4:NO)、適切に異常を検知できるように、知識ベースに登録されている閾値(換言すれば、プロセスデータの正常範囲)を修正し、S31以降の処理を繰り返す。S4において十分な精度で異常を検知できると判断された場合(S4:YES)、S2において作成された異常検知モデルや閾値を用いた運用を行う。なお、S4の判断の少なくとも一部は、ユーザによってなされるようにしてもよい。
Further, the output control unit 146 outputs the degree of abnormality calculated in S31 and the degree of establishment calculated in S32 in order for the user to evaluate the created model (FIG. 16: S33). In this step, cross-validation is performed using test data different from the training data used for building the model among the process data collected in the past operation of the plant 3. In addition, in this step, it is verified whether the alarm and the action to deal with it are output by appropriately detecting the abnormality using the process data at the time when the abnormality occurred in the past. Further, the learning processing unit 143 determines whether or not the abnormality can be detected with sufficient accuracy (FIG. 16: S4). If it is determined that the accuracy is not sufficient (S4: NO), the threshold value registered in the knowledge base (in other words, the normal range of process data) is corrected so that the abnormality can be detected appropriately, and after S31. Repeat the process. When it is determined in S4 that the abnormality can be detected with sufficient accuracy (S4: YES), the operation using the abnormality detection model and the threshold value created in S2 is performed. It should be noted that at least a part of the judgment of S4 may be made by the user.
なお、アクションについては、例えば想定原因に対応付けて、これに対処するためにプラント3のオペレータが行うべきアクションが予め記憶装置12に記憶されているものとする。図17は、アクションテーブルの一例を示す図である。図17のテーブルは、原因、アクション1、及びアクション2の各属性を含む。原因のフィールドには、知識ベースの想定原因に対応する原因が登録されている。アクション1及びアクション2のフィールドには、対応する原因を解消するためにプラント3のオペレータが行うべき処置を表す情報が登録されている。
Regarding the action, for example, it is assumed that the action to be taken by the operator of the plant 3 in order to deal with the assumed cause is stored in the storage device 12 in advance. FIG. 17 is a diagram showing an example of an action table. The table of FIG. 17 includes the cause, action 1, and action 2 attributes. In the cause field, the cause corresponding to the assumed cause of the knowledge base is registered. In the fields of action 1 and action 2, information indicating the action to be taken by the operator of the plant 3 in order to eliminate the corresponding cause is registered.
<異常検知処理>
図18は、異常変調原因特定装置1が実行する異常検知処理の一例を示す処理フロー図である。異常変調原因特定装置1のプロセッサ14は、所定のプログラムを実行することにより、図18に示すような処理を実行する。異常検知処理は、プラント3の運転によって得られたプロセスデータを用いて、ほぼリアルタイムに実行される。異常検知処理は、主として前処理(図18:S10)、モデル読出処理(S20)、及び異常判定処理(S30)を含む。図18には、図16に示した学習処理と対応する工程に同一の符号を付し、以下では学習処理との相違点を中心に説明する。便宜上、学習処理を行う装置と同一の装置による処理として説明するが、異常検知処理を行う装置は、学習処理を行う装置とは異なるものであってもよい。また、学習処理において作成された異常検知モデルや閾値、知識ベース等のテーブルが、予め記憶装置12に記憶されているものとする。 <Anomaly detection processing>
FIG. 18 is a processing flow diagram showing an example of anomaly detection processing executed by the anomaly modulationcause identification device 1. The processor 14 of the anomalous modulation cause identification device 1 executes a process as shown in FIG. 18 by executing a predetermined program. The anomaly detection process is executed in near real time using the process data obtained by the operation of the plant 3. The abnormality detection process mainly includes a pre-process (FIG. 18: S10), a model read process (S20), and an abnormality determination process (S30). In FIG. 18, the same reference numerals are given to the steps corresponding to the learning process shown in FIG. 16, and the differences from the learning process will be mainly described below. For convenience, the process will be described as processing by the same device as the device that performs the learning process, but the device that performs the abnormality detection process may be different from the device that performs the learning process. Further, it is assumed that the table of the abnormality detection model, the threshold value, the knowledge base, etc. created in the learning process is stored in the storage device 12 in advance.
図18は、異常変調原因特定装置1が実行する異常検知処理の一例を示す処理フロー図である。異常変調原因特定装置1のプロセッサ14は、所定のプログラムを実行することにより、図18に示すような処理を実行する。異常検知処理は、プラント3の運転によって得られたプロセスデータを用いて、ほぼリアルタイムに実行される。異常検知処理は、主として前処理(図18:S10)、モデル読出処理(S20)、及び異常判定処理(S30)を含む。図18には、図16に示した学習処理と対応する工程に同一の符号を付し、以下では学習処理との相違点を中心に説明する。便宜上、学習処理を行う装置と同一の装置による処理として説明するが、異常検知処理を行う装置は、学習処理を行う装置とは異なるものであってもよい。また、学習処理において作成された異常検知モデルや閾値、知識ベース等のテーブルが、予め記憶装置12に記憶されているものとする。 <Anomaly detection processing>
FIG. 18 is a processing flow diagram showing an example of anomaly detection processing executed by the anomaly modulation
異常変調原因特定装置1のプロセスデータ取得部141は、プロセスデータを取得する(図18:S11)。プロセスデータは、OPCデータ、いわゆるデータベースのテーブル、CSV等のような所定の形式のファイルで記憶装置12に記憶されているものとする。本ステップは図16のS11とほぼ同様であるが、プラント3において運転中のプロセスに関するデータが取得される。また、異常変調原因特定装置1の前処理部142は、連続処理のプロセスデータについて、製造番号との紐づけを行う(図18:S12)。本ステップは、図16のS12と同様である。そして、前処理部142は、異常判定モデルにおいて使用するデータの抽出及び加工を行う(図18:S13)。本ステップは、図16のS13とほぼ同様であるが、データクレンジングを行う必要はない。
The process data acquisition unit 141 of the abnormal modulation cause identification device 1 acquires the process data (FIG. 18: S11). It is assumed that the process data is stored in the storage device 12 in a file of a predetermined format such as OPC data, a so-called database table, CSV, or the like. This step is almost the same as S11 in FIG. 16, but the data regarding the process in operation in the plant 3 is acquired. Further, the preprocessing unit 142 of the abnormal modulation cause identification device 1 associates the process data of continuous processing with the serial number (FIG. 18: S12). This step is the same as S12 in FIG. Then, the preprocessing unit 142 extracts and processes the data used in the abnormality determination model (FIG. 18: S13). This step is almost the same as S13 in FIG. 16, but it is not necessary to perform data cleansing.
その後、異常変調原因特定装置1の異常判定部144は、学習処理において作成された異常検知モデルを記憶装置12から読み出す(図18:S20)。また、異常判定部144は、作成された異常検知モデルと、プラント3の運転によって得られたプロセスデータとを用いて、異常度の算出を行う(図18:S31)。本ステップは、図16のS31と同様である。また、異常変調原因特定装置1の原因診断部145は、算出された異常度を用いて想定原因の成立度を求める(図18:S32)。本ステップは、図16のS32と同様である。
After that, the abnormality determination unit 144 of the abnormality modulation cause identification device 1 reads out the abnormality detection model created in the learning process from the storage device 12 (FIG. 18: S20). Further, the abnormality determination unit 144 calculates the degree of abnormality using the created abnormality detection model and the process data obtained by the operation of the plant 3 (FIG. 18: S31). This step is the same as S31 in FIG. Further, the cause diagnosis unit 145 of the abnormality modulation cause identification device 1 obtains the establishment degree of the assumed cause using the calculated abnormality degree (FIG. 18: S32). This step is the same as S32 in FIG.
また、出力制御部146は、S31で算出された異常度及びS32で算出された成立度を出力すると共に、いずれかの異常度が予め定められた閾値を超える場合、アラームを発報する(図18:S303)。本ステップでは、プラント3の運転の状態を示すプロセスデータや異常度、想定原因の成立度が、入出力装置13を介してユーザに提示される。
Further, the output control unit 146 outputs the degree of abnormality calculated in S31 and the degree of establishment calculated in S32, and issues an alarm when any of the degree of abnormality exceeds a predetermined threshold value (FIG. FIG. 18: S303). In this step, the process data indicating the operating state of the plant 3, the degree of abnormality, and the degree of establishment of the assumed cause are presented to the user via the input / output device 13.
図19は、入出力装置13に出力される画面の一例を示す図である。図19は、メインの管理図の一例であり、個別のプロセスデータの推移を折れ線グラフで表している。入出力装置13に表示された領域131は、プラント3から取得されるプロセスデータの識別情報と最新の値との組み合わせを複数表示している。領域132の管理図は、特定のプロセスデータについて値の推移を折れ線グラフで表している。なお、縦軸はプロセスデータの値を表し、横軸は時間軸を表す。また、図19の例では実線が真値を表し、破線が推算値を表すものとする。なお、真値は、異常度を算出する対象のプロセスデータそのものであり、推算値は、異常度の算出対象のプロセスデータの回帰分析による推算値であってもよい。細い破線は、正常範囲の上限及び下限(換言すれば異常検知のための閾値)を表すものとする。なお、図19に吹出しで示すように、ユーザがポインティングデバイス等の入出力装置13を操作し、グラフ上にポインタを移動させた場合、ポインタが指示する時点のプロセスデータの数値を表示するようにしてもよい。領域133の要因効果図は、横軸に領域132に表示されたプロセスデータの変調の原因、またはそれを特定できるタグを表示し、縦軸はその原因の成立度を棒グラフで表す。成立度が大きいほど、プロセスデータの変調の原因として可能性が高いことを示している。また、成立度は、原因診断部145が、プロセスデータの変調の想定原因とされる事象について、異常判定部144で算出される異常度に基づいて算出する。ユーザは、成立度の大きさに基づいて、変調の原因の候補とその確度を認識することができ、容易に変調原因を特定できる。また、要因効果図は、領域134の「診断」ボタンが押下された場合に、異常判定部144が指定時刻又は現在時刻における異常度を算出し、出力制御部146によって表示されるものとする。
そして、ユーザがポインティングデバイス等の入出力装置13を操作し、要因効果図の棒グラフのいずれかを選択した場合、棒グラフに対応する変調の原因がロジックツリーにおいて強調表示される。 FIG. 19 is a diagram showing an example of a screen output to the input /output device 13. FIG. 19 is an example of the main control chart, and shows the transition of individual process data as a line graph. The area 131 displayed on the input / output device 13 displays a plurality of combinations of the identification information of the process data acquired from the plant 3 and the latest value. The control chart of the area 132 shows the transition of the value for a specific process data as a line graph. The vertical axis represents the value of the process data, and the horizontal axis represents the time axis. Further, in the example of FIG. 19, the solid line represents the true value and the broken line represents the estimated value. The true value is the process data itself for which the degree of abnormality is calculated, and the estimated value may be an estimated value by regression analysis of the process data for which the degree of abnormality is calculated. The thin broken line represents the upper limit and the lower limit of the normal range (in other words, the threshold value for abnormality detection). As shown in FIG. 19, when the user operates an input / output device 13 such as a pointing device and moves the pointer on the graph, the numerical value of the process data at the time indicated by the pointer is displayed. You may. In the factor effect diagram of the region 133, the cause of the modulation of the process data displayed in the region 132 or the tag that can identify it is displayed on the horizontal axis, and the vertical axis represents the degree of establishment of the cause as a bar graph. The higher the degree of establishment, the higher the possibility of the cause of the modulation of the process data. Further, the degree of establishment is calculated by the cause diagnosis unit 145 based on the degree of abnormality calculated by the abnormality determination unit 144 for the event that is assumed to be the assumed cause of the modulation of the process data. The user can recognize the candidate of the cause of the modulation and its accuracy based on the magnitude of the degree of establishment, and can easily identify the cause of the modulation. Further, the factor effect diagram shall be displayed by the output control unit 146 after the abnormality determination unit 144 calculates the degree of abnormality at the designated time or the current time when the "diagnosis" button in the area 134 is pressed.
Then, when the user operates an input /output device 13 such as a pointing device and selects one of the bar graphs in the factor effect diagram, the cause of the modulation corresponding to the bar graph is highlighted in the logic tree.
そして、ユーザがポインティングデバイス等の入出力装置13を操作し、要因効果図の棒グラフのいずれかを選択した場合、棒グラフに対応する変調の原因がロジックツリーにおいて強調表示される。 FIG. 19 is a diagram showing an example of a screen output to the input /
Then, when the user operates an input /
図20は、出力制御部146によって入出力装置13に出力される画面の他の例を示す図である。図20はツリー図の一例であり、図10に示したようなロジックツリーが表示されている。例えば図19においてタグ004の棒グラフが選択された場合、タグ004のプロセスデータに対応する影響がロジックツリー上において強調表示される。強調表示は、例えば色の変更や線種の変更など、表示態様の変更によってなされる。図20においては、対応する矩形にハッチングを施している。また、ロジックツリーの上流側に接続された太線の矩形は、影響の想定原因を表している。図20において吹出しで示すように各原因を表示するようにしてもよいし、原因以外のプロセスデータへの影響を表示するようにしてもよい。なお、図18のS32において算出された各原因の成立度をさらに表示したり、アクションをさらに表示したりしてもよい。また、原因は、各矩形上にユーザがポインタを移動させた場合に表示するようにしてもよい。
FIG. 20 is a diagram showing another example of the screen output to the input / output device 13 by the output control unit 146. FIG. 20 is an example of a tree diagram, and a logic tree as shown in FIG. 10 is displayed. For example, when the bar graph of tag 004 is selected in FIG. 19, the effect corresponding to the process data of tag 004 is highlighted on the logic tree. Highlighting is performed by changing the display mode, for example, changing the color or changing the line type. In FIG. 20, the corresponding rectangles are hatched. In addition, the thick lined rectangle connected to the upstream side of the logic tree represents the expected cause of the effect. Each cause may be displayed as shown in the balloon in FIG. 20, or the influence on the process data other than the cause may be displayed. The degree of establishment of each cause calculated in S32 of FIG. 18 may be further displayed, or the action may be further displayed. Further, the cause may be displayed when the user moves the pointer on each rectangle.
なお、図19、図20に示す「トレンド」ボタンを押下した場合、要因効果図に上げられた各タグのプロセストレンドを表示してもよく、特に変調の原因を特定できるタグのプロセストレンドを表示してもよい。。プロセストレンドは、記憶装置12に記憶されたプロセスデータを用いて、例えば、所定時間ごと、所定日数ごと、所定月数ごと、又は季節ごとのような期間毎の値を算出し、グラフ上にプロットしたものである。
When the "trend" button shown in FIGS. 19 and 20 is pressed, the process trend of each tag shown in the factor effect diagram may be displayed, and in particular, the process trend of the tag that can identify the cause of the modulation is displayed. You may. .. The process trend uses the process data stored in the storage device 12 to calculate a value for each period such as, for example, every predetermined time, every predetermined number of days, every predetermined number of months, or every season, and plots it on a graph. It was done.
また、出力制御部146は、例えば各演算方法により算出される異常度が所定の閾値を超えたタイミングで、異常度のログを出力するようにしてもよい。また、想定原因や成立度のログを出力するようにしてもよい。各ログは、日時、製造番号、演算方法や異常検知モデル等を紐づけて出力することにより、異常変調の解析を容易にすることができる。
Further, the output control unit 146 may output a log of the degree of abnormality at a timing when the degree of abnormality calculated by each calculation method exceeds a predetermined threshold value, for example. In addition, a log of the expected cause and the degree of establishment may be output. By outputting each log in association with the date and time, the serial number, the calculation method, the abnormality detection model, and the like, it is possible to facilitate the analysis of the abnormality modulation.
<変形例>
各実施形態における各構成及びそれらの組み合わせ等は、一例であって、本発明の主旨から逸脱しない範囲内で、適宜、構成の付加、省略、置換、及びその他の変更が可能である。本開示は、実施形態によって限定されることはなく、クレームの範囲によってのみ限定される。また、本明細書に開示された各々の態様は、本明細書に開示された他のいかなる特徴とも組み合わせることができる。 <Modification example>
Each configuration and a combination thereof in each embodiment is an example, and the configurations can be added, omitted, replaced, and other changes as appropriate without departing from the gist of the present invention. The present disclosure is not limited by embodiments, but only by the scope of the claims. Also, each aspect disclosed herein can be combined with any other feature disclosed herein.
また、上述した実施形態では化学プラントを例に説明したが、一般的な生産設備における製造プロセスに適用することができる。例えば、実施形態におけるバッチ工程の製造番号に代えてロット番号を処理単位として、実施形態におけるバッチ工程に準じた処理を適用してもよい。
Further, although the above-described embodiment has been described by taking a chemical plant as an example, it can be applied to a manufacturing process in a general production facility. For example, instead of the serial number of the batch process in the embodiment, the lot number may be used as a processing unit, and the processing according to the batch process in the embodiment may be applied.
異常変調原因特定装置1の機能の少なくとも一部は、複数の装置に分散して実現するようにしてもよいし、同一の機能を複数の装置が並列に提供するようにしてもよい。また、異常変調原因特定装置1の機能の少なくとも一部は、いわゆるクラウド上に設けるようにしてもよい。
At least a part of the function of the abnormal modulation cause identification device 1 may be distributed to a plurality of devices to be realized, or the same function may be provided by a plurality of devices in parallel. Further, at least a part of the functions of the abnormal modulation cause identification device 1 may be provided on the so-called cloud.
また、本開示は、上述した処理を実行する方法やコンピュータプログラム、当該プログラムを記録した、コンピュータ読み取り可能な記録媒体を含む。当該プログラムが記録された記録媒体は、プログラムをコンピュータに実行させることにより、上述の処理が可能となる。
The present disclosure also includes a method for executing the above-mentioned processing, a computer program, and a computer-readable recording medium on which the program is recorded. The recording medium on which the program is recorded can perform the above-mentioned processing by causing the computer to execute the program.
ここで、コンピュータ読み取り可能な記録媒体とは、データやプログラム等の情報を電気的、磁気的、光学的、機械的、または化学的作用によって蓄積し、コンピュータから読み取ることができる記録媒体をいう。このような記録媒体のうちコンピュータから取り外し可能なものとしては、フレキシブルディスク、光磁気ディスク、光ディスク、磁気テープ、メモリカード等がある。また、コンピュータに固定された記録媒体としては、HDDやSSD(Solid State Drive)、ROM等がある。
Here, the computer-readable recording medium means a recording medium that can be read from a computer by accumulating information such as data and programs by electrical, magnetic, optical, mechanical, or chemical action. Among such recording media, those that can be removed from the computer include flexible disks, magneto-optical disks, optical disks, magnetic tapes, memory cards, and the like. Further, as the recording medium fixed to the computer, there are HDD, SSD (Solid State Drive), ROM and the like.
1: 異常変調原因特定装置
11: 通信I/F
12: 記憶装置
13: 入出力装置
14: プロセッサ
141: プロセスデータ取得部
142: 前処理部
143: 学習処理部
144: 異常判定部
145: 原因診断部
146: 出力制御部
2: 制御ステーション
3: プラント 1: Abnormal modulation cause identification device 11: Communication I / F
12: Storage device 13: Input / output device 14: Processor 141: Process data acquisition unit 142: Preprocessing unit 143: Learning processing unit 144: Abnormality determination unit 145: Cause diagnosis unit 146: Output control unit 2: Control station 3: Plant
Claims (5)
- 所定の処理単位ごとに処理対象を逐次処理するバッチ工程と、その後に前記処理対象を連続的に処理する連続工程とを行う生産設備が備える複数のセンサによって継続的に出力されるプロセスデータを記憶する記憶装置から、前記プロセスデータを読み出すプロセスデータ取得部と、
前記バッチ工程の完了タイミングの範囲と、前記連続工程における前記プロセスデータの出力タイミングとを、前記生産設備内における前記処理対象の滞留時間に基づいて対応付ける前処理部と、
前記前処理部が対応付けた前記バッチ工程におけるプロセスデータと前記連続工程におけるプロセスデータとを用いて、前記プロセスデータの変調の程度を表す異常度を算出する異常判定部と、
原因と、当該原因から生じる影響として現れる前記複数のセンサが出力するプロセスデータの変調との組合せを定義する因果関係情報を用いて、前記複数のセンサが出力するプロセスデータについて、前記異常判定部が算出した異常度が所定の基準を満たすか判断する原因診断部と、
を備える異常変調原因特定装置。 Stores process data continuously output by a plurality of sensors provided in a production facility that performs a batch process of sequentially processing a processing target for each predetermined processing unit and a continuous process of continuously processing the processing target thereafter. A process data acquisition unit that reads the process data from the storage device
A pretreatment unit that associates the range of completion timing of the batch process with the output timing of the process data in the continuous process based on the residence time of the processing target in the production equipment.
An abnormality determination unit that calculates an abnormality degree indicating the degree of modulation of the process data by using the process data in the batch process and the process data in the continuous process associated with the preprocessing unit.
Using the causal relationship information that defines the combination of the cause and the modulation of the process data output by the plurality of sensors appearing as the influence caused by the cause, the abnormality determination unit determines the process data output by the plurality of sensors. The cause diagnosis unit that determines whether the calculated degree of abnormality meets the prescribed criteria,
Anomalous modulation cause identification device. - 前記因果関係情報は、前記異常度の算出に用いるプロセスデータを、前記複数のセンサが出力するプロセスデータの各々について、前記生産設備が行う工程におけるタイミング、期間、又は間隔によって定義し、
前記異常判定部は、前記前処理部が対応付けた前記プロセスデータのうち、前記因果関係情報が定義するタイミング、期間、又は間隔に基づいて抽出された値を用いて異常度の算出を行う
請求項1に記載の異常変調原因特定装置。 The causal relationship information defines the process data used for calculating the degree of abnormality for each of the process data output by the plurality of sensors by the timing, period, or interval in the process performed by the production equipment.
The abnormality determination unit calculates the degree of abnormality using the value extracted based on the timing, period, or interval defined by the causal relationship information from the process data associated with the preprocessing unit. Item 1. The device for identifying the cause of abnormal modulation according to Item 1. - 前記異常判定部は、前記連続工程において、予め定められた組合せに含まれる複数のセンサが出力するプロセスデータの値を圧縮及び復元するニューラルネットワークモデルを用いて、当該ニューラルネットワークモデルの入出力の差に応じた異常度を算出する
請求項1又は2に記載の異常変調原因特定装置。 The abnormality determination unit uses a neural network model that compresses and restores the values of process data output by a plurality of sensors included in a predetermined combination in the continuous process, and makes a difference between the input and output of the neural network model. The device for identifying the cause of anomalous modulation according to claim 1 or 2, which calculates the degree of anomaly according to the above. - 所定の処理単位ごとに処理対象を逐次処理するバッチ工程と、その後に前記処理対象を連続的に処理する連続工程とを行う生産設備が備える複数のセンサによって継続的に出力されるプロセスデータを記憶する記憶装置から、前記プロセスデータを読み出し、
前記バッチ工程の完了タイミングの範囲と、前記連続工程における前記プロセスデータの出力タイミングとを、前記生産設備内における前記処理対象の滞留時間に基づいて対応付け、
対応付けられた前記バッチ工程におけるプロセスデータと前記連続工程におけるプロセスデータとを用いて、前記プロセスデータの変調の程度を表す異常度を算出し、
原因と、当該原因から生じる影響として現れる前記複数のセンサが出力するプロセスデータの変調との組合せを定義する因果関係情報を用いて、前記複数のセンサが出力するプロセスデータについて、算出された異常度が所定の基準を満たすか判断する
処理をコンピュータが実行する異常変調原因特定方法。 Stores process data continuously output by a plurality of sensors provided in a production facility that performs a batch process in which processing targets are sequentially processed for each predetermined processing unit and a continuous process in which the processing targets are continuously processed thereafter. Read the process data from the storage device
The range of the completion timing of the batch process and the output timing of the process data in the continuous process are associated with each other based on the residence time of the processing target in the production facility.
Using the associated process data in the batch process and the process data in the continuous process, the degree of abnormality indicating the degree of modulation of the process data is calculated.
The degree of anomaly calculated for the process data output by the plurality of sensors using the causal relationship information that defines the combination of the cause and the modulation of the process data output by the plurality of sensors appearing as the effect caused by the cause. A method of identifying the cause of anomalous modulation, in which the computer performs a process to determine if it meets a given criterion. - 所定の処理単位ごとに処理対象を逐次処理するバッチ工程と、その後に前記処理対象を連続的に処理する連続工程とを行う生産設備が備える複数のセンサによって継続的に出力されるプロセスデータを記憶する記憶装置から、前記プロセスデータを読み出し、
前記バッチ工程の完了タイミングの範囲と、前記連続工程における前記プロセスデータの出力タイミングとを、前記生産設備内における前記処理対象の滞留時間に基づいて対応付け、
対応付けられた前記バッチ工程におけるプロセスデータと前記連続工程におけるプロセスデータとを用いて、前記プロセスデータの変調の程度を表す異常度を算出し、
原因と、当該原因から生じる影響として現れる前記複数のセンサが出力するプロセスデータの変調との組合せを定義する因果関係情報を用いて、前記複数のセンサが出力するプロセスデータについて、算出された異常度が所定の基準を満たすか判断する
処理をコンピュータに実行させる異常変調原因特定プログラム。 Stores process data continuously output by a plurality of sensors provided in a production facility that performs a batch process in which processing targets are sequentially processed for each predetermined processing unit and a continuous process in which the processing targets are continuously processed thereafter. Read the process data from the storage device
The range of the completion timing of the batch process and the output timing of the process data in the continuous process are associated with each other based on the residence time of the processing target in the production facility.
Using the associated process data in the batch process and the process data in the continuous process, the degree of abnormality indicating the degree of modulation of the process data is calculated.
The degree of anomaly calculated for the process data output by the plurality of sensors using the causal relationship information that defines the combination of the cause and the modulation of the process data output by the plurality of sensors appearing as the influence caused by the cause. An abnormal modulation cause identification program that causes a computer to execute a process to determine whether or not meets a predetermined standard.
Priority Applications (4)
| Application Number | Priority Date | Filing Date | Title |
|---|---|---|---|
| US17/928,029 US20230213924A1 (en) | 2020-05-29 | 2021-05-25 | Abnormal irregularity cause identifying device, abnormal irregularity cause identifying method, and abnormal irregularity cause identifying program |
| EP21812645.6A EP4160339A1 (en) | 2020-05-29 | 2021-05-25 | Abnormality/irregularity cause identifying apparatus, abnormality/irregularity cause identifying method, and abnormality/irregularity cause identifying program |
| JP2022526583A JPWO2021241580A1 (en) | 2020-05-29 | 2021-05-25 | |
| CN202180039073.XA CN115698881A (en) | 2020-05-29 | 2021-05-25 | Abnormal modulation cause identification device, abnormal modulation cause identification method, and abnormal modulation cause identification program |
Applications Claiming Priority (2)
| Application Number | Priority Date | Filing Date | Title |
|---|---|---|---|
| JP2020095040 | 2020-05-29 | ||
| JP2020-095040 | 2020-05-29 |
Publications (1)
| Publication Number | Publication Date |
|---|---|
| WO2021241580A1 true WO2021241580A1 (en) | 2021-12-02 |
Family
ID=78744083
Family Applications (1)
| Application Number | Title | Priority Date | Filing Date |
|---|---|---|---|
| PCT/JP2021/019802 WO2021241580A1 (en) | 2020-05-29 | 2021-05-25 | Abnormality/irregularity cause identifying apparatus, abnormality/irregularity cause identifying method, and abnormality/irregularity cause identifying program |
Country Status (5)
| Country | Link |
|---|---|
| US (1) | US20230213924A1 (en) |
| EP (1) | EP4160339A1 (en) |
| JP (1) | JPWO2021241580A1 (en) |
| CN (1) | CN115698881A (en) |
| WO (1) | WO2021241580A1 (en) |
Cited By (3)
| Publication number | Priority date | Publication date | Assignee | Title |
|---|---|---|---|---|
| US20220221850A1 (en) * | 2020-08-05 | 2022-07-14 | Chiyoda Corporation | Method for managing plant, plant design device, and plant management device |
| WO2023127748A1 (en) * | 2021-12-27 | 2023-07-06 | 株式会社ダイセル | Abnormality detection device, abnormality detection method, and abnormality detection program |
| WO2023233927A1 (en) * | 2022-06-03 | 2023-12-07 | オムロン株式会社 | Abnormality detection device, abnormality detection method, and program |
Citations (8)
| Publication number | Priority date | Publication date | Assignee | Title |
|---|---|---|---|---|
| JPH06309584A (en) * | 1993-04-27 | 1994-11-04 | Toshiba Corp | Plant operation support device |
| WO2018104985A1 (en) * | 2016-12-08 | 2018-06-14 | 日本電気株式会社 | Abnormality analysis method, program, and system |
| JP2018109851A (en) | 2016-12-28 | 2018-07-12 | 三菱日立パワーシステムズ株式会社 | Diagnostic device, diagnostic method and program |
| JP2018120343A (en) | 2017-01-24 | 2018-08-02 | 株式会社東芝 | Process diagnostic device, process diagnostic method, and process diagnostic system |
| JP2018524668A (en) * | 2015-05-13 | 2018-08-30 | バイエル、アクチエンゲゼルシャフトBayer Aktiengesellschaft | Process control system for the control and regulation of modular plants for the production of biopharmaceuticals and biopolymer products |
| JP2019016039A (en) | 2017-07-04 | 2019-01-31 | Jfeスチール株式会社 | Method for diagnosing abnormal state of process and abnormal state diagnosis apparatus |
| JP2019057164A (en) | 2017-09-21 | 2019-04-11 | 三菱日立パワーシステムズ株式会社 | Plant abnormality monitoring system |
| WO2020031570A1 (en) * | 2018-08-10 | 2020-02-13 | 日本電信電話株式会社 | Abnormality detection device, probability distribution learning device, self-encoder learning device, data conversion device, and program |
-
2021
- 2021-05-25 EP EP21812645.6A patent/EP4160339A1/en active Pending
- 2021-05-25 WO PCT/JP2021/019802 patent/WO2021241580A1/en unknown
- 2021-05-25 JP JP2022526583A patent/JPWO2021241580A1/ja active Pending
- 2021-05-25 US US17/928,029 patent/US20230213924A1/en active Pending
- 2021-05-25 CN CN202180039073.XA patent/CN115698881A/en active Pending
Patent Citations (8)
| Publication number | Priority date | Publication date | Assignee | Title |
|---|---|---|---|---|
| JPH06309584A (en) * | 1993-04-27 | 1994-11-04 | Toshiba Corp | Plant operation support device |
| JP2018524668A (en) * | 2015-05-13 | 2018-08-30 | バイエル、アクチエンゲゼルシャフトBayer Aktiengesellschaft | Process control system for the control and regulation of modular plants for the production of biopharmaceuticals and biopolymer products |
| WO2018104985A1 (en) * | 2016-12-08 | 2018-06-14 | 日本電気株式会社 | Abnormality analysis method, program, and system |
| JP2018109851A (en) | 2016-12-28 | 2018-07-12 | 三菱日立パワーシステムズ株式会社 | Diagnostic device, diagnostic method and program |
| JP2018120343A (en) | 2017-01-24 | 2018-08-02 | 株式会社東芝 | Process diagnostic device, process diagnostic method, and process diagnostic system |
| JP2019016039A (en) | 2017-07-04 | 2019-01-31 | Jfeスチール株式会社 | Method for diagnosing abnormal state of process and abnormal state diagnosis apparatus |
| JP2019057164A (en) | 2017-09-21 | 2019-04-11 | 三菱日立パワーシステムズ株式会社 | Plant abnormality monitoring system |
| WO2020031570A1 (en) * | 2018-08-10 | 2020-02-13 | 日本電信電話株式会社 | Abnormality detection device, probability distribution learning device, self-encoder learning device, data conversion device, and program |
Cited By (4)
| Publication number | Priority date | Publication date | Assignee | Title |
|---|---|---|---|---|
| US20220221850A1 (en) * | 2020-08-05 | 2022-07-14 | Chiyoda Corporation | Method for managing plant, plant design device, and plant management device |
| US11665193B2 (en) * | 2020-08-05 | 2023-05-30 | Chiyoda Corporation | Method for managing plant, plant design device, and plant management device |
| WO2023127748A1 (en) * | 2021-12-27 | 2023-07-06 | 株式会社ダイセル | Abnormality detection device, abnormality detection method, and abnormality detection program |
| WO2023233927A1 (en) * | 2022-06-03 | 2023-12-07 | オムロン株式会社 | Abnormality detection device, abnormality detection method, and program |
Also Published As
| Publication number | Publication date |
|---|---|
| JPWO2021241580A1 (en) | 2021-12-02 |
| CN115698881A (en) | 2023-02-03 |
| EP4160339A1 (en) | 2023-04-05 |
| US20230213924A1 (en) | 2023-07-06 |
Similar Documents
| Publication | Publication Date | Title |
|---|---|---|
| WO2021241580A1 (en) | Abnormality/irregularity cause identifying apparatus, abnormality/irregularity cause identifying method, and abnormality/irregularity cause identifying program | |
| WO2021241576A1 (en) | Abnormal modulation cause identification device, abnormal modulation cause identification method, and abnormal modulation cause identification program | |
| EP2905665B1 (en) | Information processing apparatus, diagnosis method, and program | |
| US10747188B2 (en) | Information processing apparatus, information processing method, and, recording medium | |
| Ma et al. | Hierarchical monitoring and root-cause diagnosis framework for key performance indicator-related multiple faults in process industries | |
| US20170103148A1 (en) | System-analyzing device, analysis-model generation method, system analysis method, and system-analyzing program | |
| WO2021241578A1 (en) | Abnormal modulation cause identifying device, abnormal modulation cause identifying method, and abnormal modulation cause identifying program | |
| JP2000259223A (en) | Plant monitoring device | |
| JPH08234832A (en) | Device and method for monitoring and diagnostic plant | |
| US20190026632A1 (en) | Information processing device, information processing method, and recording medium | |
| Li et al. | Canonical variate residuals-based contribution map for slowly evolving faults | |
| WO2023127748A1 (en) | Abnormality detection device, abnormality detection method, and abnormality detection program | |
| WO2021241579A1 (en) | Abnormal modulation cause identifying device, abnormal modulation cause identifying method, and abnormal modulation cause identifying program | |
| Fei et al. | Online process monitoring for complex systems with dynamic weighted principal component analysis | |
| WO2021241577A1 (en) | Abnormal modulation cause display device, abnormal modulation cause display method, and abnormal modulation cause display program | |
| JP6885321B2 (en) | Process status diagnosis method and status diagnosis device | |
| US20230057943A1 (en) | Prediction apparatus, prediction method, and program | |
| Wang et al. | An intelligent process fault diagnosis system integrating Andrews plot, PCA and neural networks | |
| JP7467876B2 (en) | PERFORMANCE CHANGE DETECTION DEVICE, PERFORMANCE CHANGE DETECTION METHOD, AND PROGRAM | |
| WO2021157666A1 (en) | Control device, control method, and program | |
| EP4206838A1 (en) | Forecasting and anomaly detection method for low density polyethylene autoclave reactor | |
| WO2021157670A1 (en) | Prediction apparatus, prediction method, and program | |
| Fan et al. | Stationary Feature Extract and Process Monitoring Based on Autoencoder | |
| Wang et al. | Fault modeling and prognosis based on combined relative analysis and autoregressive modeling |
Legal Events
| Date | Code | Title | Description |
|---|---|---|---|
| 121 | Ep: the epo has been informed by wipo that ep was designated in this application |
Ref document number: 21812645 Country of ref document: EP Kind code of ref document: A1 |
|
| ENP | Entry into the national phase |
Ref document number: 2022526583 Country of ref document: JP Kind code of ref document: A |
|
| NENP | Non-entry into the national phase |
Ref country code: DE |
|
| ENP | Entry into the national phase |
Ref document number: 2021812645 Country of ref document: EP Effective date: 20230102 |