WO2021237245A1 - Methods and systems for determining optimum pressure drawdown in a production well for a shale gas reservoir - Google Patents

Methods and systems for determining optimum pressure drawdown in a production well for a shale gas reservoir Download PDF

Info

Publication number
WO2021237245A1
WO2021237245A1 PCT/US2021/070589 US2021070589W WO2021237245A1 WO 2021237245 A1 WO2021237245 A1 WO 2021237245A1 US 2021070589 W US2021070589 W US 2021070589W WO 2021237245 A1 WO2021237245 A1 WO 2021237245A1
Authority
WO
WIPO (PCT)
Prior art keywords
pressure
permeability
sample
stress
pore
Prior art date
Legal status (The legal status is an assumption and is not a legal conclusion. Google has not performed a legal analysis and makes no representation as to the accuracy of the status listed.)
Ceased
Application number
PCT/US2021/070589
Other languages
French (fr)
Inventor
Hui-hai LIU
Yanhui HAN
Zhuang SUN
Current Assignee (The listed assignees may be inaccurate. Google has not performed a legal analysis and makes no representation or warranty as to the accuracy of the list.)
Saudi Arabian Oil Co
Aramco Services Co
Original Assignee
Saudi Arabian Oil Co
Aramco Services Co
Priority date (The priority date is an assumption and is not a legal conclusion. Google has not performed a legal analysis and makes no representation as to the accuracy of the date listed.)
Filing date
Publication date
Application filed by Saudi Arabian Oil Co, Aramco Services Co filed Critical Saudi Arabian Oil Co
Publication of WO2021237245A1 publication Critical patent/WO2021237245A1/en
Priority to SA522441112A priority Critical patent/SA522441112B1/en
Anticipated expiration legal-status Critical
Ceased legal-status Critical Current

Links

Classifications

    • GPHYSICS
    • G01MEASURING; TESTING
    • G01NINVESTIGATING OR ANALYSING MATERIALS BY DETERMINING THEIR CHEMICAL OR PHYSICAL PROPERTIES
    • G01N15/00Investigating characteristics of particles; Investigating permeability, pore-volume or surface-area of porous materials
    • G01N15/08Investigating permeability, pore-volume, or surface area of porous materials
    • G01N15/082Investigating permeability by forcing a fluid through a sample
    • G01N15/0826Investigating permeability by forcing a fluid through a sample and measuring fluid flow rate, i.e. permeation rate or pressure change
    • EFIXED CONSTRUCTIONS
    • E21EARTH OR ROCK DRILLING; MINING
    • E21BEARTH OR ROCK DRILLING; OBTAINING OIL, GAS, WATER, SOLUBLE OR MELTABLE MATERIALS OR A SLURRY OF MINERALS FROM WELLS
    • E21B49/00Testing the nature of borehole walls; Formation testing; Methods or apparatus for obtaining samples of soil or well fluids, specially adapted to earth drilling or wells
    • E21B49/008Testing the nature of borehole walls; Formation testing; Methods or apparatus for obtaining samples of soil or well fluids, specially adapted to earth drilling or wells by injection test; by analysing pressure variations in an injection or production test, e.g. for estimating the skin factor
    • EFIXED CONSTRUCTIONS
    • E21EARTH OR ROCK DRILLING; MINING
    • E21BEARTH OR ROCK DRILLING; OBTAINING OIL, GAS, WATER, SOLUBLE OR MELTABLE MATERIALS OR A SLURRY OF MINERALS FROM WELLS
    • E21B43/00Methods or apparatus for obtaining oil, gas, water, soluble or meltable materials or a slurry of minerals from wells
    • E21B43/12Methods or apparatus for controlling the flow of the obtained fluid to or in wells
    • E21B43/121Lifting well fluids
    • EFIXED CONSTRUCTIONS
    • E21EARTH OR ROCK DRILLING; MINING
    • E21BEARTH OR ROCK DRILLING; OBTAINING OIL, GAS, WATER, SOLUBLE OR MELTABLE MATERIALS OR A SLURRY OF MINERALS FROM WELLS
    • E21B49/00Testing the nature of borehole walls; Formation testing; Methods or apparatus for obtaining samples of soil or well fluids, specially adapted to earth drilling or wells
    • E21B49/006Measuring wall stresses in the borehole
    • EFIXED CONSTRUCTIONS
    • E21EARTH OR ROCK DRILLING; MINING
    • E21BEARTH OR ROCK DRILLING; OBTAINING OIL, GAS, WATER, SOLUBLE OR MELTABLE MATERIALS OR A SLURRY OF MINERALS FROM WELLS
    • E21B49/00Testing the nature of borehole walls; Formation testing; Methods or apparatus for obtaining samples of soil or well fluids, specially adapted to earth drilling or wells
    • E21B49/02Testing the nature of borehole walls; Formation testing; Methods or apparatus for obtaining samples of soil or well fluids, specially adapted to earth drilling or wells by mechanically taking samples of the soil
    • GPHYSICS
    • G01MEASURING; TESTING
    • G01NINVESTIGATING OR ANALYSING MATERIALS BY DETERMINING THEIR CHEMICAL OR PHYSICAL PROPERTIES
    • G01N15/00Investigating characteristics of particles; Investigating permeability, pore-volume or surface-area of porous materials
    • G01N15/08Investigating permeability, pore-volume, or surface area of porous materials
    • G01N15/0806Details, e.g. sample holders, mounting samples for testing
    • GPHYSICS
    • G01MEASURING; TESTING
    • G01NINVESTIGATING OR ANALYSING MATERIALS BY DETERMINING THEIR CHEMICAL OR PHYSICAL PROPERTIES
    • G01N7/00Analysing materials by measuring the pressure or volume of a gas or vapour
    • G01N7/10Analysing materials by measuring the pressure or volume of a gas or vapour by allowing diffusion of components through a porous wall and measuring a pressure or volume difference

Definitions

  • Example embodiments generally relate to the oil and gas industry. More specifically, embodiments relate to methods and systems for determining optimum pressure drawdown in a production well for a shale gas reservoir.
  • Pressure drawdown which is defined as the difference between initial reservoir pore pressure and the fluid pressure in a production well, is a key parameter to control and optimize gas production from a shale gas reservoir.
  • a larger pressure drawdown is expected to give a larger production rate at a given production time because a larger pressure drawdown corresponds to a larger fluid pressure gradient between the reservoir and the production well, and thus a larger gas flow rate to the well.
  • the relation between the pressure drawdown and gas production is not straightforward.
  • Fluid production causes a decrease in pore pressure and thus an increase in effective stress on the subsurface formation.
  • the compacted reservoir can reduce the porosity and permeability, which tends to reduce the production rate.
  • pressure drawdown and impact the production
  • stress dependency of permeability The combination of the two mechanisms results in the potential existence of the optimum pressure drawdown corresponding to the highest production rate.
  • the production rate decreases with further increasing pressure drawdown for a given reservoir. Therefore, it is important to understand the conditions for a controlled drawdown, and the conditions where the pressure drawdown does not exceed the optimum pressure drawdown.
  • the determination of the optimum pressure drawdown is important for drawdown management in field operations. This disclosure develops a simple and practical method to estimate optimum pressure drawdown based on reservoir properties.
  • Example embodiments disclosed provide a method for increasing normalized production rate of a reservoir by optimizing the pressure drawdown of the subsurface formation.
  • One example embodiment is a method for optimizing production of a hydrocarbon from a subsurface formation.
  • the method includes acquiring a sample of the subsurface formation, positioning the sample in a pressure vessel comprising a fluid and a pressure gauge and applying a constant confining pressure, P c , running a first test by equilibrating the sample at a predetermined first pore gas pressure, p i applying a predetermined constant second gas pressure, po, to an inlet of the sample, the second gas pressure being greater than the first pore gas pressure, measuring a third pore gas pressure,p , as a function of time, t, at a location along the axis of the sample in the pressure vessel, measuring permeability of the sample at a plurality of effective stresses, wherein each effective stress is the difference between the constant confining pressure and a pore pressure, and determining permeability of the sample as a function of effective stress using the formula: where k is permeability at effective stress is the permeability at zero effective stress, and
  • the method may also include determining stress sensitivity factor based on the formula: where ‘k’ is the permeability and ' o c rr ' is the effective stress.
  • the method may also include upscaling the permeability values determined for the core sample using the formula: where n is the total number of rock samples that are collected from the reservoir under consideration and have measurement results for the stress sensitivity factor, and ⁇ t is the stress sensitivity factor for the i th rock sample.
  • the method may also include determining the optimum pressure drawdown for the subsurface formation, , using the formula
  • the method may also include controlling the pressure drawdown in a field operation such that it does not exceed
  • Another example embodiment is a non-transitory computer-readable medium having computer executable instructions that cause a computer to perform the operations of reading a measurement of a first pore gas pressure, p i , of a gas after equilibrating the sample in a pressure vessel comprising a fluid and a pressure gauge that reads the constant confining pressure P c after it is applied, reading a measurement of a predetermined constant second gas pressure, p 0 , applied to an inlet of the sample, the second gas pressure being greater than the first pore gas pressure, reading a measurement of a third pore gas pressure, p, at time, t, at a location along the axis of the sample in the pressure vessel, measuring permeability of the sample at a plurality of effective stresses, wherein each effective stress is the difference between the constant confining pressure and a pore pressure, and determining permeability of the sample as a function of effective stress using the formula: where k is permeability at effective stress is the permeability at zero
  • the medium may also include computer executable instructions for determining stress sensitivity factor based on the formula: where ‘k’ is the permeability and ‘ ⁇ eff ’ is the effective stress. [00012]
  • the medium may also include computer executable instructions for upscaling the permeability values determined for the core sample using the formula: where n is the total number of rock samples that are collected from the reservoir under consideration and have measurement results for the stress sensitivity factor, and ⁇ i is the stress sensitivity factor for the i th rock sample.
  • the medium may also include computer executable instructions for determining the optimum pressure drawdown for the subsurface formation, using the formula
  • the medium may also include computer executable instructions for controlling the pressure drawdown in a field operation such that it does not exceed
  • Another embodiment is a method for optimizing production of a hydrocarbon from a subsurface formation.
  • the method includes measuring permeability of a sample of the subsurface formation at a plurality of effective stresses, wherein each effective stress is the difference between a constant confining pressure and a pore pressure; and determining permeability of the subsurface formation as a function of effective stresses using the formula: where k is permeability at effective stress ⁇ e ff, k 0 is the permeability at zero effective stress, and ⁇ is the stress sensitivity factor of the permeability for the sample.
  • the method may also include determining stress sensitivity factor based on the formula: where ‘k’ is the permeability and ‘ ⁇ eff ’ is the effective stress.
  • the method may also include upscaling the permeability values determined for the core sample using the formula: where n is the total number of rock samples that are collected from the reservoir under consideration and have measurement results for the stress sensitivity factor, and ⁇ t is the stress sensitivity factor for the i th rock sample.
  • the method may also include determining the optimum pressure drawdown for the subsurface formation, , using the formula
  • the method may also include controlling the pressure drawdown in a field operation such that it does not exceed ⁇ P 0 .
  • FIG. 1 is a graph illustrating the existence of optimum pressure drawdown in a stress-sensitive shale gas reservoir, according to one example embodiment of the disclosure.
  • FIG. 2 illustrates numerical grids and a snapshot of the numerical simulation with color representing the reservoir pore pressure, according to one example embodiment of the disclosure.
  • FIG. 3 is a graph illustrating cumulative production Q versus square root of time t, according to one example embodiment of the disclosure.
  • FIG. 4 is a graph illustrating the effect of initial reservoir permeability fco on the production behavior, according to some example embodiments of the disclosure.
  • FIG. 5 is a graph illustrating the effect of the stress sensitivity factor ⁇ on the production behavior characterized by relative change in C, according to one example embodiment of the disclosure.
  • FIG. 6 is a graph illustrating optimum drawdown as a function of the stress sensitivity ⁇ based on numerical simulations, according to one example embodiment of the disclosure.
  • FIG. 7 shows a special purpose computer and various forms of computer readable media for optimizing pressure drawdown of a subsurface formation and increasing normalized production rate of the reservoir, according to some example embodiments of the disclosure.
  • Pressure drawdown which is defined as the difference between initial reservoir pore pressure and the fluid pressure in a production well, is a key parameter to control and optimize gas production from a shale gas reservoir.
  • a larger pressure drawdown is expected to give a larger production rate at a given production time because a larger pressure drawdown corresponds to a larger fluid pressure gradient between the reservoir and the production well, and thus a larger gas flow rate to the well.
  • the relation between the pressure drawdown and gas production is not straightforward.
  • Fluid production causes a decrease in pore pressure and thus an increase in effective stress on the subsurface formation.
  • the compacted reservoir can reduce the porosity and permeability, which tends to reduce the production rate.
  • pressure drawdown and impact the production
  • the combination of the two mechanisms results in the potential existence of the optimum pressure drawdown corresponding to the highest production rate, and the relationship is illustrated in FIG. 1, for example. As illustrated in this figure, beyond an optimum pressure drawdown 10, the production rate decreases with further increasing pressure drawdown for a given reservoir.
  • one objective of the disclosure is to develop a simple and practical approach to estimate optimum pressure drawdown based on reservoir properties.
  • the stress sensitivity of a shale gas reservoir can be characterized by the stress sensitivity factor of permeability ‘a’ as shown in Equation 1. where ‘k’ is permeability and ‘ ⁇ eff ’ is the effective stress. A larger ‘a’ value corresponds to a larger degree of sensitivity of permeability to the stress. Therefore, for a zero ‘a’ value, the permeability has nothing to do with the stress.
  • the stress sensitivity parameter ‘a’ can be accurately measured for core samples in laboratory. However, because of the subsurface heterogeneity, for a shale gas reservoir, different rock core samples may have different ‘a’ values. These values can be upscaled to the reservoir scale in order to use Eq. (2).
  • the upscaled stress sensitivity factor of permeability is shown to be the average of the core sample values. With the upscaled stress sensitivity factor, the optimum pressure drawdown can be determined using Eq. (2).
  • the pressure drawdown should be controlled in such a way that the actual pressure drawdown does not exceed Further increasing the pressure drawdown in a production well beyond the optimum pressure drawdown would not increase the production and, instead, is subject to a risk to reservoir damage.
  • the following section discussed the development of the relationship between the optimum pressure drawdown and the stress sensitivity factor shown in Eq. (2).
  • TOUGH2 is a numerical simulator for multiphase, multicomponent fluid flow and heat transfer
  • FLAC3D is a commercial code designed for rock and soil mechanics.
  • the coupled TOUGH2-FLAC3D simulator has been widely used in a number of areas including carbon dioxide geological sequestration, nuclear waste disposal, development of geothermal energy, and production from hydrate-bearing sediments.
  • One embodiment is directed to a method for determining the optimum pressure drawdown with the TOUGH2-FLAC3D simulator, as illustrated in FIG. 2, for example.
  • the geometry of hydraulic fractures is often represented as identical and parallel vertical fractures.
  • the top part 30 is the cap rock, which is assumed to be impermeable.
  • the reservoir rock 40 has the same height as hydraulic fracture 50.
  • the domain size corresponds to half of the fracture spacing because of the symmetry resulting from the identical individual hydraulic fractures. It should also be noted that only half width of a hydraulic fracture is included here. As a result of the symmetry, a quarter of the domain involving fluid flow in the reservoir is used for the simulation on the Y-Z plane.
  • the symmetry requires the insignificant effect of gravity on flow process in both the reservoir rock 40 and the hydraulic fracture 50.
  • the fracture spacing can be set to be 60 feet, fracture height of 80 feet, fracture length of 100 feet, fracture width (aperture) of 0.01 feet, and a cap rock height of 30 feet. It should be noted here that these numbers are merely examples that may be typical values for unconventional reservoirs, and any number that may be suitable for the purpose may be used. Grids become finer along the positive X-direction and the hydraulic fracture is represented by the layer of finest grids.
  • the well node 60 represents the intersection between horizontal wellbore and hydraulic fracture and is maintained at a constant pressure. Reservoir rock 40 and cap rock 30 have a Young’s modulus of 40 GPa and a Poisson’s ratio of 0.32.
  • Cap rock 30 has zero porosity and permeability serving as a mechanical overburden.
  • a constant overburden stress of 11600 psi is then applied on the top of the cap rock 30 and confines the displacement of other boundaries.
  • the horizontal stress is, for example, 10,000 psi and the pore pressure is, for example, 8,000 psi.
  • Fluid flow has no-flow boundary conditions on all the sides of model domain shown in Fig 2.
  • the reservoir fluids are a gas phase methane and water at its residual saturation to approximately represent dry-gas reservoir conditions.
  • Reservoir temperature is 280 °F, a typical value for a shale formation buried at a depth of 10,000 feet, for example.
  • the stress sensitivity factor for fracture permeability ‘b’ is given as 5x 10 -4 psi -1 .
  • the pore compressibility values for the reservoir and hydraulic fracture are given as 1.5x10 -4 and 2.5x10 -4 psi -1 , respectively.
  • the reservoir is assumed transversely isotropic with a vertical to horizontal permeability ratio of 0.001. This disclosure focuses on the impact of reservoir properties on the optimum pressure drawdown, including the initial permeability kro and the stress sensitivity factor ⁇ .
  • FIG. 3 shows cumulative production rate as a function of square root of production time for a constant pressure drawdown of 5,000 psi, an initial pore pressure of 8,000 psi, and a stress sensitivity factor ⁇ of 5x10⁻⁴ psi -1 .
  • FIG. 3 illustrates two flow regimes 70, 80.
  • the production rate is initially a nonlinear function of square root of time due to fracture fluid storage and the flow regime 70 only lasts for a short period of time.
  • the second flow regime 80 the relation between the cumulative production rate and square root of time becomes linear and can be expressed as: where parameter ‘C’ is the slope of the straight line as shown in FIG. 3.
  • the second flow regime 80 is called linear flow regime in which production is controlled by fluid flow from rock formation to hydraulic fractures.
  • Many shale gas wells are produced in the linear flow regime for over 10 or 20 years, indicating that majority of shale gas may be recovered in the linear flow regime during the life time of a production well. Therefore, parameter ‘C’ can represent the production performance for these wells.
  • FIG. 3 shows how to calculate the parameter ‘C’ from the change of cumulative production with time.
  • the optimum pressure drawdown is defined for the linear flow regime.
  • the optimum pressure drawdown herein corresponds to the highest production rate in the linear flow regime at a given production time. In this case, the optimum pressure drawdown can be determined based on the parameter ‘C’ defined in Eq. (9).
  • the next step is to investigate how the initial reservoir permeability kro affects the production behavior.
  • the example values for the initial reservoir permeability kro, used are 50 nD, 200 nD and 1,000 nD. Reservoirs with a high permeability exhibit a large production rate under both flow regimes. However, the change in permeability, as shown in Fig 4, only shows a slight impact on the relative production behavior as indicated by the parameter CN that is the ratio of C value to the specific C value under the condition of 7,500 psi drawdown for a given permeability. The results indicate that the reservoir permeability should not affect determining the optimum pressure drawdown in practice due to the fact that the relation between the pressure drawdown and production exhibits a similar relative trend for a large range of permeability from 50 nD to 1,000 nD.
  • the stress sensitivity factor ⁇ represents the level of reservoir sensitivity to the change in stress state. A larger ⁇ corresponds to a more stress- sensitive formation.
  • Experimental measurement indicates that for shale reservoirs the parameter ⁇ is often larger than 10 -4 psi -1 .
  • Fig. 5 shows the effect of stress sensitivity factor ⁇ on the relative changes in parameter C with respect to Co corresponding to the C value at the 1,000 psi drawdown.
  • a large stress sensitivity factor ⁇ results in a small production rate due to the significant reduction in reservoir permeability.
  • is smaller than 10 -3 psi -1
  • the production rate for the linear flow regime keeps increasing as the drawdown increases.
  • is larger than 10 -3 psi -1
  • the optimum pressure drawdown exists and the production rate, or relative value of C, starts to decrease with further increase of the pressure drawdown beyond the optimum pressure drawdown.
  • Fig. 5 indicates that a reservoir with a high level of stress sensitivity (large a) has the optimum drawdown which sets the upper limit of the drawdown for a better reservoir performance.
  • Numerical simulations were performed based on various a and the optimum drawdown as a function of a-1 is plotted in Fig. 6. The linear fitting of numerical simulation results in Fig 6 gives an expression for the optimum pressure drawdown as described by Eq. (2).
  • One embodiment is a method for determining optimum pressure drawdown in a production well for a shale gas reservoir.
  • the method includes collecting rock core samples from the shale gas reservoir under consideration. Cylindrical core plugs can be obtained by drilling these core samples along the horizontal direction because the horizontal permeability determines hydrocarbon flow from the reservoir to the production wells.
  • the core plugs are about 1 to 2 inches in diameter and 1 to 2 inches in length. All the surfaces of a plug are cleaned and rendered dust free to any avoid leakage in the subsequent steps.
  • permeability values are measured in a laboratory for three or more effective stresses, which is defined as confining stress minus pore pressure.
  • the pressure pulse decay method may be used for the permeability measurements.
  • the pulse-decay test setup generally consists of two gas reservoirs and a sample holder with controlled confining stress for test samples. Initially, the system is in equilibrium with a given gas pressure. A small pressure pulse is then introduced into the upstream gas reservoir, such that the pulse does not have a significant disturbance to the gas pressure in the system.
  • the pore pressure in the core plug should be larger than 2,500 psi to eliminate the diffusion effects and pressure pulse is about 5% of the pore pressure.
  • the pressures at the two gas reservoirs are monitored as a function of time.
  • the pressure evolution results are used for determining the permeability of the core plug for the given pore pressure and confining stress.
  • the permeability can be measured for the fixed pore pressure and different confining stresses.
  • the permeability measurements are organized as a function of the effective stresses.
  • the permeability measurements are fit with equation 10.
  • k permeability at effective stress is the permeability at zero effective stress
  • is the stress sensitivity factor of the permeability for the rock sample.
  • the stress sensitivity factor determined from the core samples is upscaled.
  • different rock plugs may give different ⁇ values.
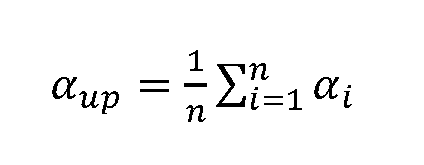
  • the upscaled factor ⁇ up is calculated by averaging these a values.
  • n is the total number of rock samples that are collected from the reservoir under consideration and have measurement results for the stress sensitivity factor
  • ⁇ i is the stress sensitivity factor for the i th rock sample.
  • the pressure drawdown is controlled such that it does not exceed Further increasing the pressure drawdown in a production well beyond the optimum pressure drawdown would not increase the production and, instead, is subject to a risk of reservoir damage.
  • Another example embodiment is a special purpose computer configured to execute specific computer instructions in a computer program stored in computer readable media.
  • the code can be stored on, for example, a computer readable medium, such as a floppy disk 164 which may be read by a disk drive 158, CD-ROM 162, which may be read by a disk drive 156, or a magnetic (or other type) hard drive 160 forming part of a general purpose programmable computer.
  • the computer includes a central processing unit 150, a user input device such as a keyboard 154 and a user display 152 such as a flat panel display or cathode ray tube display.
  • the computer readable medium includes logic operable to cause the computer to execute acts as set forth previously and explained with respect to the previous figures.
  • the non-transitory computer-readable medium having computer executable instructions cause a computer to perform the operations of collecting rock core samples from the shale gas reservoir under consideration. Cylindrical core plugs can be obtained by drilling these core samples along the horizontal direction because the horizontal permeability determines hydrocarbon flow from the reservoir to the production wells.
  • the core plugs are about 1 to 2 inches in diameter and 1 to 2 inches in length. All the surfaces of a plug are cleaned and rendered dust free to any avoid leakage in the subsequent steps.
  • permeability values are measured in a laboratory for three or more effective stresses, which is defined as confining stress minus pore pressure.
  • the pressure pulse decay method may be used for the permeability measurements.
  • the pulse-decay test setup generally consists of two gas reservoirs and a sample holder with controlled confining stress for test samples. Initially, the system is in equilibrium with a given gas pressure. A small pressure pulse is then introduced into the upstream gas reservoir, such that the pulse does not have a significant disturbance to the gas pressure in the system.
  • the pore pressure in the core plug should be larger than 2,500 psi to eliminate the diffusion effects and pressure pulse is about 5% of the pore pressure.
  • the pressures at the two gas reservoirs are monitored as a function of time.
  • the pressure evolution results are used for determining the permeability of the core plug for the given pore pressure and confining stress.
  • the permeability can be measured for the fixed pore pressure and different confining stresses.
  • the permeability measurements are organized as a function of the effective stresses.
  • the permeability measurements are fit with equation 10.
  • k permeability at effective stress is the permeability at zero effective stress
  • is the stress sensitivity factor of the permeability for the rock sample.
  • the stress sensitivity factor determined from the core samples is upscaled.
  • different rock plugs may give different ⁇ values.
  • the upscaled factor ⁇ up is calculated by averaging these a values.
  • n is the total number of rock samples that are collected from the reservoir under consideration and have measurement results for the stress sensitivity factor
  • ⁇ i is the stress sensitivity factor for the / th rock sample.
  • the pressure drawdown is controlled such that it does not exceed ⁇ P 0 . Further increasing the pressure drawdown in a production well beyond the optimum pressure drawdown would not increase the production and, instead, is subject to a risk of reservoir damage.
  • example methods and systems disclosed here include conducting three or more pressure-dependent permeability tests having different effective stresses (confining stress minus pore pressure) and multiple different values of pore pressure.
  • the Specification which includes the Summary, Brief Description of the Drawings and the Detailed Description, and the appended Claims refer to particular features (including process or method steps) of the disclosure. Those of skill in the art understand that the invention includes all possible combinations and uses of particular features described in the Specification. Those of skill in the art understand that the disclosure is not limited to or by the description of embodiments given in the Specification.
  • Conditional language such as, among others, “can,” “could,” “might,” or “may,” unless specifically stated otherwise, or otherwise understood within the context as used, is generally intended to convey that certain implementations could include, while other implementations do not include, certain features, elements, and/or operations. Thus, such conditional language generally is not intended to imply that features, elements, and/or operations are in any way required for one or more implementations or that one or more implementations necessarily include logic for deciding, with or without user input or prompting, whether these features, elements, and/or operations are included or are to be performed in any particular implementation.

Landscapes

  • Life Sciences & Earth Sciences (AREA)
  • Physics & Mathematics (AREA)
  • Engineering & Computer Science (AREA)
  • Mining & Mineral Resources (AREA)
  • Geology (AREA)
  • Chemical & Material Sciences (AREA)
  • Fluid Mechanics (AREA)
  • Analytical Chemistry (AREA)
  • Environmental & Geological Engineering (AREA)
  • Geochemistry & Mineralogy (AREA)
  • General Life Sciences & Earth Sciences (AREA)
  • Biochemistry (AREA)
  • General Health & Medical Sciences (AREA)
  • Pathology (AREA)
  • Health & Medical Sciences (AREA)
  • Immunology (AREA)
  • General Physics & Mathematics (AREA)
  • Dispersion Chemistry (AREA)
  • Soil Sciences (AREA)
  • Investigating Strength Of Materials By Application Of Mechanical Stress (AREA)
  • Organic Low-Molecular-Weight Compounds And Preparation Thereof (AREA)
  • Heterocyclic Carbon Compounds Containing A Hetero Ring Having Oxygen Or Sulfur (AREA)
  • Medicines Containing Antibodies Or Antigens For Use As Internal Diagnostic Agents (AREA)
  • Compounds Of Unknown Constitution (AREA)

Abstract

Methods and systems for increasing normalized production rate of an oil and gas reservoir by optimizing the pressure drawdown of the subsurface formation are disclosed. The method includes determining permeability of the subsurface formation as a function of effective stresses, determining stress sensitivity factor, upscaling the permeability values determined for the core sample, determining the optimum pressure drawdown for the subsurface formation, controlling the pressure drawdown in a field operation such that it does not exceed the optimum pressure drawdown for the subsurface formation.

Description

METHODS AND SYSTEMS FOR DETERMINING OPTIMUM PRESSURE DRAWDOWN IN A PRODUCTION WELL FOR A SHALE GAS RESERVOIR
TECHNICAL FIELD
[0001] Example embodiments generally relate to the oil and gas industry. More specifically, embodiments relate to methods and systems for determining optimum pressure drawdown in a production well for a shale gas reservoir.
BACKGROUND
[0002] Pressure drawdown, which is defined as the difference between initial reservoir pore pressure and the fluid pressure in a production well, is a key parameter to control and optimize gas production from a shale gas reservoir. In general, a larger pressure drawdown is expected to give a larger production rate at a given production time because a larger pressure drawdown corresponds to a larger fluid pressure gradient between the reservoir and the production well, and thus a larger gas flow rate to the well. However, for stress-sensitive shale gas reservoirs, the relation between the pressure drawdown and gas production is not straightforward.
[0003] Fluid production causes a decrease in pore pressure and thus an increase in effective stress on the subsurface formation. The compacted reservoir can reduce the porosity and permeability, which tends to reduce the production rate. Thus, during production process in a stress-sensitive unconventional reservoir, there exists two competing mechanisms that are related to the pressure drawdown and impact the production; pressure gradient between the reservoir and production well, and stress dependency of permeability. The combination of the two mechanisms results in the potential existence of the optimum pressure drawdown corresponding to the highest production rate. Beyond an optimum pressure drawdown, the production rate decreases with further increasing pressure drawdown for a given reservoir. Therefore, it is important to understand the conditions for a controlled drawdown, and the conditions where the pressure drawdown does not exceed the optimum pressure drawdown. Thus, the determination of the optimum pressure drawdown is important for drawdown management in field operations. This disclosure develops a simple and practical method to estimate optimum pressure drawdown based on reservoir properties. SUMMARY
[0004] Example embodiments disclosed provide a method for increasing normalized production rate of a reservoir by optimizing the pressure drawdown of the subsurface formation.
[0005] One example embodiment is a method for optimizing production of a hydrocarbon from a subsurface formation. The method includes acquiring a sample of the subsurface formation, positioning the sample in a pressure vessel comprising a fluid and a pressure gauge and applying a constant confining pressure, Pc, running a first test by equilibrating the sample at a predetermined first pore gas pressure, p i applying a predetermined constant second gas pressure, po, to an inlet of the sample, the second gas pressure being greater than the first pore gas pressure, measuring a third pore gas pressure,p , as a function of time, t, at a location along the axis of the sample in the pressure vessel, measuring permeability of the sample at a plurality of effective stresses, wherein each effective stress is the difference between the constant confining pressure and a pore pressure, and determining permeability of the sample as a function of effective stress using the formula:
Figure imgf000004_0001
where k is permeability at effective stress is the permeability at zero effective stress,
Figure imgf000004_0004
and a is the stress sensitivity factor of the permeability for the sample.
[0006] The method may also include determining stress sensitivity factor based on the formula:
Figure imgf000004_0002
where ‘k’ is the permeability and ' ocrr' is the effective stress.
[0007] The method may also include upscaling the permeability values determined for the core sample using the formula:
Figure imgf000004_0003
where n is the total number of rock samples that are collected from the reservoir under consideration and have measurement results for the stress sensitivity factor, and αt is the stress sensitivity factor for the ith rock sample.
[0008] The method may also include determining the optimum pressure drawdown for the subsurface formation, , using the formula
Figure imgf000005_0001
Figure imgf000005_0002
[0009] The method may also include controlling the pressure drawdown in a field operation such that it does not exceed
Figure imgf000005_0003
[00010] Another example embodiment is a non-transitory computer-readable medium having computer executable instructions that cause a computer to perform the operations of reading a measurement of a first pore gas pressure, pi, of a gas after equilibrating the sample in a pressure vessel comprising a fluid and a pressure gauge that reads the constant confining pressure Pc after it is applied, reading a measurement of a predetermined constant second gas pressure, p0, applied to an inlet of the sample, the second gas pressure being greater than the first pore gas pressure, reading a measurement of a third pore gas pressure, p, at time, t, at a location along the axis of the sample in the pressure vessel, measuring permeability of the sample at a plurality of effective stresses, wherein each effective stress is the difference between the constant confining pressure and a pore pressure, and determining permeability of the sample as a function of effective stress using the formula:
Figure imgf000005_0006
where k is permeability at effective stress is the permeability at zero effective stress,
Figure imgf000005_0004
and α is the stress sensitivity factor of the permeability for the sample.
[00011] The medium may also include computer executable instructions for determining stress sensitivity factor based on the formula:
Figure imgf000005_0005
where ‘k’ is the permeability and ‘σeff’ is the effective stress. [00012] The medium may also include computer executable instructions for upscaling the permeability values determined for the core sample using the formula:
Figure imgf000006_0001
where n is the total number of rock samples that are collected from the reservoir under consideration and have measurement results for the stress sensitivity factor, and αi is the stress sensitivity factor for the ith rock sample.
[00013] The medium may also include computer executable instructions for determining the optimum pressure drawdown for the subsurface formation,
Figure imgf000006_0006
using the formula
Figure imgf000006_0002
[00014] The medium may also include computer executable instructions for controlling the pressure drawdown in a field operation such that it does not exceed
Figure imgf000006_0005
[00015] Another embodiment is a method for optimizing production of a hydrocarbon from a subsurface formation. The method includes measuring permeability of a sample of the subsurface formation at a plurality of effective stresses, wherein each effective stress is the difference between a constant confining pressure and a pore pressure; and determining permeability of the subsurface formation as a function of effective stresses using the formula:
Figure imgf000006_0003
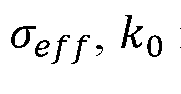
where k is permeability at effective stress σ eff, k0 is the permeability at zero effective stress, and α is the stress sensitivity factor of the permeability for the sample.
[00016] The method may also include determining stress sensitivity factor based on the formula:
Figure imgf000006_0004
where ‘k’ is the permeability and ‘σeff’ is the effective stress.
[00017] The method may also include upscaling the permeability values determined for the core sample using the formula:
Figure imgf000007_0001
where n is the total number of rock samples that are collected from the reservoir under consideration and have measurement results for the stress sensitivity factor, and αt is the stress sensitivity factor for the ith rock sample.
[00018] The method may also include determining the optimum pressure drawdown for the subsurface formation, , using the formula
Figure imgf000007_0003
Figure imgf000007_0002
[00019] The method may also include controlling the pressure drawdown in a field operation such that it does not exceed ΔP0.
BRIEF DESCRIPTION OF THE DRAWINGS
[00020] The foregoing aspects, features, and advantages of embodiments of the present disclosure will further be appreciated when considered with reference to the following description of embodiments and accompanying drawings. In describing embodiments of the disclosure illustrated in the appended drawings, specific terminology will be used for the sake of clarity. However, the disclosure is not intended to be limited to the specific terms used, and it is to be understood that each specific term includes equivalents that operate in a similar manner to accomplish a similar purpose.
[00021] FIG. 1 is a graph illustrating the existence of optimum pressure drawdown in a stress-sensitive shale gas reservoir, according to one example embodiment of the disclosure.
[00022] FIG. 2 illustrates numerical grids and a snapshot of the numerical simulation with color representing the reservoir pore pressure, according to one example embodiment of the disclosure.
[00023] FIG. 3 is a graph illustrating cumulative production Q versus square root of time t, according to one example embodiment of the disclosure.
[00024] FIG. 4 is a graph illustrating the effect of initial reservoir permeability fco on the production behavior, according to some example embodiments of the disclosure. [00025] FIG. 5 is a graph illustrating the effect of the stress sensitivity factor α on the production behavior characterized by relative change in C, according to one example embodiment of the disclosure.
[00026] FIG. 6 is a graph illustrating optimum drawdown
Figure imgf000008_0001
as a function of the stress sensitivity α based on numerical simulations, according to one example embodiment of the disclosure.
[00027] FIG. 7 shows a special purpose computer and various forms of computer readable media for optimizing pressure drawdown of a subsurface formation and increasing normalized production rate of the reservoir, according to some example embodiments of the disclosure.
DETAILED DESCRIPTION
[00028] Advantages and features of the present disclosure and methods of accomplishing the same will be apparent by referring to embodiments described below in detail in connection with the accompanying drawings. The disclosed embodiments and configurations are not limited to the embodiments disclosed below and may be implemented in various different forms. The embodiments are provided only for completing the disclosure and for fully representing the scope of the disclosure to those skilled in the art.
[00029] For simplicity and clarity of illustration, the drawing figures illustrate the general manner of construction, and descriptions and details of well-known features and techniques may be omitted to avoid unnecessarily obscuring the discussion of the described embodiments. Additionally, elements in the drawing figures are not necessarily drawn to scale. For example, the dimensions of some of the elements in the figures may be exaggerated relative to other elements to help improve understanding of the various example embodiments
[00030] Pressure drawdown, which is defined as the difference between initial reservoir pore pressure and the fluid pressure in a production well, is a key parameter to control and optimize gas production from a shale gas reservoir. In general, a larger pressure drawdown is expected to give a larger production rate at a given production time because a larger pressure drawdown corresponds to a larger fluid pressure gradient between the reservoir and the production well, and thus a larger gas flow rate to the well. However, for stress-sensitive shale gas reservoirs, the relation between the pressure drawdown and gas production is not straightforward.
[00031] Fluid production causes a decrease in pore pressure and thus an increase in effective stress on the subsurface formation. The compacted reservoir can reduce the porosity and permeability, which tends to reduce the production rate. Thus, during production process in a stress-sensitive unconventional reservoir, there exists two competing mechanisms that are related to the pressure drawdown and impact the production; pressure gradient between the reservoir and production well, and stress dependency of permeability. The combination of the two mechanisms results in the potential existence of the optimum pressure drawdown corresponding to the highest production rate, and the relationship is illustrated in FIG. 1, for example. As illustrated in this figure, beyond an optimum pressure drawdown 10, the production rate decreases with further increasing pressure drawdown for a given reservoir. Therefore, it is important to understand the conditions for a controlled drawdown, and the conditions where the pressure drawdown does not exceed the optimum pressure drawdown. Thus, the determination of the optimum pressure drawdown is important for drawdown management in field operations. Accordingly, one objective of the disclosure is to develop a simple and practical approach to estimate optimum pressure drawdown based on reservoir properties.
ANALYTICAL METHOD FOR DETERMINING OPTIMUM PRESSURE DRAWDOWN IN A PRODUCTION WELL FOR A SHALE GAS RESERVOIR
[00032] The following sections provide an example method for determining optimum pressure drawdown in a production well for a shale gas reservoir. The stress sensitivity of a shale gas reservoir can be characterized by the stress sensitivity factor of permeability ‘a’ as shown in Equation 1.
Figure imgf000009_0001
where ‘k’ is permeability and ‘σeff’ is the effective stress. A larger ‘a’ value corresponds to a larger degree of sensitivity of permeability to the stress. Therefore, for a zero ‘a’ value, the permeability has nothing to do with the stress.
[00033] Based on a sensitivity study it was found that the optimum pressure drawdown, is related to the stress sensitivity parameter of permeability as shown in Equation 2.
Figure imgf000010_0001
[00034] The stress sensitivity parameter ‘a’ can be accurately measured for core samples in laboratory. However, because of the subsurface heterogeneity, for a shale gas reservoir, different rock core samples may have different ‘a’ values. These values can be upscaled to the reservoir scale in order to use Eq. (2). The upscaled stress sensitivity factor of permeability is shown to be the average of the core sample values. With the upscaled stress sensitivity factor, the optimum pressure drawdown can be determined using Eq. (2).
[00035] In field operations, the pressure drawdown should be controlled in such a way that the actual pressure drawdown does not exceed
Figure imgf000010_0002
Further increasing the pressure drawdown in a production well beyond the optimum pressure drawdown would not increase the production and, instead, is subject to a risk to reservoir damage. The following section discussed the development of the relationship between the optimum pressure drawdown and the stress sensitivity factor shown in Eq. (2).
[00036] In a stress-sensitive reservoir, fluid flow and rock deformation are highly coupled. During the production, the reservoir pore pressure declines and then reservoir stress condition changes accordingly. The stress change impacts both reservoir permeability and porosity that determine fluid flow and also pore pressure. An accurate simulation of fluid flow in a stress-sensitive reservoir requires a coupled reservoir fluid flow and geomechanics model. In the following paragraphs, the modeling approach derived by linking two established codes TOUGH2 and FLAC3D is used. TOUGH2 is a numerical simulator for multiphase, multicomponent fluid flow and heat transfer, and FLAC3D is a commercial code designed for rock and soil mechanics. The coupled TOUGH2-FLAC3D simulator has been widely used in a number of areas including carbon dioxide geological sequestration, nuclear waste disposal, development of geothermal energy, and production from hydrate-bearing sediments.
[00037] One embodiment is directed to a method for determining the optimum pressure drawdown with the TOUGH2-FLAC3D simulator, as illustrated in FIG. 2, for example. In this example, the geometry of hydraulic fractures is often represented as identical and parallel vertical fractures. In Fig 2, the top part 30 is the cap rock, which is assumed to be impermeable. The reservoir rock 40 has the same height as hydraulic fracture 50. Along the X direction, the domain size corresponds to half of the fracture spacing because of the symmetry resulting from the identical individual hydraulic fractures. It should also be noted that only half width of a hydraulic fracture is included here. As a result of the symmetry, a quarter of the domain involving fluid flow in the reservoir is used for the simulation on the Y-Z plane. The symmetry requires the insignificant effect of gravity on flow process in both the reservoir rock 40 and the hydraulic fracture 50. The fracture spacing can be set to be 60 feet, fracture height of 80 feet, fracture length of 100 feet, fracture width (aperture) of 0.01 feet, and a cap rock height of 30 feet. It should be noted here that these numbers are merely examples that may be typical values for unconventional reservoirs, and any number that may be suitable for the purpose may be used. Grids become finer along the positive X-direction and the hydraulic fracture is represented by the layer of finest grids. The well node 60 represents the intersection between horizontal wellbore and hydraulic fracture and is maintained at a constant pressure. Reservoir rock 40 and cap rock 30 have a Young’s modulus of 40 GPa and a Poisson’s ratio of 0.32. Cap rock 30 has zero porosity and permeability serving as a mechanical overburden. A constant overburden stress of 11600 psi is then applied on the top of the cap rock 30 and confines the displacement of other boundaries. Initially the horizontal stress is, for example, 10,000 psi and the pore pressure is, for example, 8,000 psi. Fluid flow has no-flow boundary conditions on all the sides of model domain shown in Fig 2. The reservoir fluids are a gas phase methane and water at its residual saturation to approximately represent dry-gas reservoir conditions. Reservoir temperature is 280 °F, a typical value for a shale formation buried at a depth of 10,000 feet, for example. The hydraulic properties of reservoir and fracture change with the stress state and follow exponential relationships with the normal effective stress, which can be given as follows:
Figure imgf000011_0001
where ‘0’ is porosity, ‘k’ is permeability, ‘a’ and ‘b’ are stress sensitivity factors of reservoir permeability and fracture permeability, respectively, ‘CP’ is pore compressibility,
Figure imgf000012_0001
is the increment of effective stress that is defined as the total stress minus pore pressure for a Biot coefficient of one. Subscripts ‘r’ and ‘f denote properties for reservoir and hydraulic fracture, respectively. Subscripts V, ‘y’, ‘z’, ‘0’ denote X, Y, Z-directions, and initial condition, respectively. The stress sensitivity factor for fracture permeability ‘b’ is given as 5x 10⁻⁴ psi-1. The pore compressibility values for the reservoir and hydraulic fracture are given as 1.5x10⁻⁴ and 2.5x10⁻⁴ psi-1, respectively. The properties at the zero stress state are set as 0m =1.0, km = 3,000 D and Φm = 0.1. The reservoir is assumed transversely isotropic with a vertical to horizontal permeability ratio of 0.001. This disclosure focuses on the impact of reservoir properties on the optimum pressure drawdown, including the initial permeability kro and the stress sensitivity factor α.
[00038] FIG. 3 shows cumulative production rate as a function of square root of production time for a constant pressure drawdown of 5,000 psi, an initial pore pressure of 8,000 psi, and a stress sensitivity factor α of 5x10⁻⁴ psi-1. FIG. 3 illustrates two flow regimes 70, 80. The production rate is initially a nonlinear function of square root of time due to fracture fluid storage and the flow regime 70 only lasts for a short period of time. In the second flow regime 80, the relation between the cumulative production rate and square root of time becomes linear and can be expressed as:
Figure imgf000012_0002
where parameter ‘C’ is the slope of the straight line as shown in FIG. 3.
[00039] The second flow regime 80 is called linear flow regime in which production is controlled by fluid flow from rock formation to hydraulic fractures. Many shale gas wells are produced in the linear flow regime for over 10 or 20 years, indicating that majority of shale gas may be recovered in the linear flow regime during the life time of a production well. Therefore, parameter ‘C’ can represent the production performance for these wells. FIG. 3 shows how to calculate the parameter ‘C’ from the change of cumulative production with time. The optimum pressure drawdown is defined for the linear flow regime. The optimum pressure drawdown herein corresponds to the highest production rate in the linear flow regime at a given production time. In this case, the optimum pressure drawdown can be determined based on the parameter ‘C’ defined in Eq. (9). [00040] The next step is to investigate how the initial reservoir permeability kro affects the production behavior. The example values for the initial reservoir permeability kro, used are 50 nD, 200 nD and 1,000 nD. Reservoirs with a high permeability exhibit a large production rate under both flow regimes. However, the change in permeability, as shown in Fig 4, only shows a slight impact on the relative production behavior as indicated by the parameter CN that is the ratio of C value to the specific C value under the condition of 7,500 psi drawdown for a given permeability. The results indicate that the reservoir permeability should not affect determining the optimum pressure drawdown in practice due to the fact that the relation between the pressure drawdown and production exhibits a similar relative trend for a large range of permeability from 50 nD to 1,000 nD.
[00041] Since the optimum pressure drawdown is not sensitive to the reservoir permeability, we can then fix the initial reservoir permeability kro as 200 nD and investigate the effect of stress sensitivity factor α. The stress sensitivity factor α represents the level of reservoir sensitivity to the change in stress state. A larger α corresponds to a more stress- sensitive formation. Experimental measurement indicates that for shale reservoirs the parameter α is often larger than 10-4 psi-1.
[00042] Fig. 5 shows the effect of stress sensitivity factor α on the relative changes in parameter C with respect to Co corresponding to the C value at the 1,000 psi drawdown. A large stress sensitivity factor α results in a small production rate due to the significant reduction in reservoir permeability. When α is smaller than 10-3 psi-1, the production rate for the linear flow regime keeps increasing as the drawdown increases. However, when α is larger than 10-3 psi-1, the optimum pressure drawdown exists and the production rate, or relative value of C, starts to decrease with further increase of the pressure drawdown beyond the optimum pressure drawdown.
[00043] Fig. 5 indicates that a reservoir with a high level of stress sensitivity (large a) has the optimum drawdown which sets the upper limit of the drawdown for a better reservoir performance. Numerical simulations were performed based on various a and the optimum drawdown as a function of a-1 is plotted in Fig. 6. The linear fitting of numerical simulation results in Fig 6 gives an expression for the optimum pressure drawdown
Figure imgf000013_0001
as described by Eq. (2). EXAMPLE METHOD FOR DETERMINING OPTIMUM PRESSURE DRAWDOWN IN A PRODUCTION WELL FOR A SHALE GAS RESERVOIR
[00044] One embodiment is a method for determining optimum pressure drawdown in a production well for a shale gas reservoir. The method includes collecting rock core samples from the shale gas reservoir under consideration. Cylindrical core plugs can be obtained by drilling these core samples along the horizontal direction because the horizontal permeability determines hydrocarbon flow from the reservoir to the production wells. The core plugs are about 1 to 2 inches in diameter and 1 to 2 inches in length. All the surfaces of a plug are cleaned and rendered dust free to any avoid leakage in the subsequent steps.
[00045] In the next step, for each core plug, permeability values are measured in a laboratory for three or more effective stresses, which is defined as confining stress minus pore pressure. For example, the pressure pulse decay method may be used for the permeability measurements. The pulse-decay test setup generally consists of two gas reservoirs and a sample holder with controlled confining stress for test samples. Initially, the system is in equilibrium with a given gas pressure. A small pressure pulse is then introduced into the upstream gas reservoir, such that the pulse does not have a significant disturbance to the gas pressure in the system. The pore pressure in the core plug should be larger than 2,500 psi to eliminate the diffusion effects and pressure pulse is about 5% of the pore pressure. The pressures at the two gas reservoirs are monitored as a function of time. The pressure evolution results are used for determining the permeability of the core plug for the given pore pressure and confining stress. The permeability can be measured for the fixed pore pressure and different confining stresses. For each rock plug, the permeability measurements are organized as a function of the effective stresses. Then, the permeability measurements are fit with equation 10.
Figure imgf000014_0001
where k is permeability at effective stress is the permeability at zero effective stress,
Figure imgf000014_0002
and α is the stress sensitivity factor of the permeability for the rock sample. It should be noted here that that Eq. (10) is equivalent to Eq. (1).
[00046] In the next step, the stress sensitivity factor determined from the core samples is upscaled. For each formation, different rock plugs may give different α values. The upscaled factor αup is calculated by averaging these a values.
Figure imgf000015_0001
where n is the total number of rock samples that are collected from the reservoir under consideration and have measurement results for the stress sensitivity factor, and αi is the stress sensitivity factor for the ith rock sample.
[00047] In the last step, the optimum pressure drawdown in the production well,
Figure imgf000015_0002
, is determined using the formula
Figure imgf000015_0003
[00048] In the field operations, the pressure drawdown is controlled such that it does not exceed Further increasing the pressure drawdown in a production well beyond the optimum pressure drawdown would not increase the production and, instead, is subject to a risk of reservoir damage.
COMPUTER READABLE MEDIUM
[00049] Another example embodiment is a special purpose computer configured to execute specific computer instructions in a computer program stored in computer readable media. Referring to FIG. 7, the foregoing process as explained with reference to FIGS. 1-6 can be embodied in computer-readable code. The code can be stored on, for example, a computer readable medium, such as a floppy disk 164 which may be read by a disk drive 158, CD-ROM 162, which may be read by a disk drive 156, or a magnetic (or other type) hard drive 160 forming part of a general purpose programmable computer. The computer, as known in the art, includes a central processing unit 150, a user input device such as a keyboard 154 and a user display 152 such as a flat panel display or cathode ray tube display. According to this aspect, the computer readable medium includes logic operable to cause the computer to execute acts as set forth previously and explained with respect to the previous figures. The non-transitory computer-readable medium having computer executable instructions cause a computer to perform the operations of collecting rock core samples from the shale gas reservoir under consideration. Cylindrical core plugs can be obtained by drilling these core samples along the horizontal direction because the horizontal permeability determines hydrocarbon flow from the reservoir to the production wells. The core plugs are about 1 to 2 inches in diameter and 1 to 2 inches in length. All the surfaces of a plug are cleaned and rendered dust free to any avoid leakage in the subsequent steps.
[00050] In the next step, for each core plug, permeability values are measured in a laboratory for three or more effective stresses, which is defined as confining stress minus pore pressure. For example, the pressure pulse decay method may be used for the permeability measurements. The pulse-decay test setup generally consists of two gas reservoirs and a sample holder with controlled confining stress for test samples. Initially, the system is in equilibrium with a given gas pressure. A small pressure pulse is then introduced into the upstream gas reservoir, such that the pulse does not have a significant disturbance to the gas pressure in the system. The pore pressure in the core plug should be larger than 2,500 psi to eliminate the diffusion effects and pressure pulse is about 5% of the pore pressure. The pressures at the two gas reservoirs are monitored as a function of time. The pressure evolution results are used for determining the permeability of the core plug for the given pore pressure and confining stress. The permeability can be measured for the fixed pore pressure and different confining stresses. For each rock plug, the permeability measurements are organized as a function of the effective stresses. Then, the permeability measurements are fit with equation 10.
Figure imgf000016_0001
where k is permeability at effective stress is the permeability at zero effective stress,
Figure imgf000016_0003
and α is the stress sensitivity factor of the permeability for the rock sample. It should be noted here that that Eq. (10) is equivalent to Eq. (1).
[00051] In the next step, the stress sensitivity factor determined from the core samples is upscaled. For each formation, different rock plugs may give different α values. The upscaled factor αup is calculated by averaging these a values.
Figure imgf000016_0002
where n is the total number of rock samples that are collected from the reservoir under consideration and have measurement results for the stress sensitivity factor, and αi is the stress sensitivity factor for the /th rock sample.
[00052] In the last step, the optimum pressure drawdown in the production well, ΔP0, is determined using the formula
Figure imgf000017_0001
[00053] In the field operations, the pressure drawdown is controlled such that it does not exceed ΔP0. Further increasing the pressure drawdown in a production well beyond the optimum pressure drawdown would not increase the production and, instead, is subject to a risk of reservoir damage.
[00054] Therefore, example methods and systems disclosed here include conducting three or more pressure-dependent permeability tests having different effective stresses (confining stress minus pore pressure) and multiple different values of pore pressure. The Specification, which includes the Summary, Brief Description of the Drawings and the Detailed Description, and the appended Claims refer to particular features (including process or method steps) of the disclosure. Those of skill in the art understand that the invention includes all possible combinations and uses of particular features described in the Specification. Those of skill in the art understand that the disclosure is not limited to or by the description of embodiments given in the Specification.
[00055] Those of skill in the art also understand that the terminology used for describing particular embodiments does not limit the scope or breadth of the disclosure. In interpreting the Specification and appended Claims, all terms should be interpreted in the broadest possible manner consistent with the context of each term. All technical and scientific terms used in the Specification and appended Claims have the same meaning as commonly understood by one of ordinary skill in the art to which this invention belongs unless defined otherwise.
[00056] As used in the Specification and appended Claims, the singular forms “a,” “an,” and “the” include plural references unless the context clearly indicates otherwise. The verb “comprises” and its conjugated forms should be interpreted as referring to elements, components or steps in a non-exclusive manner. The referenced elements, components or steps may be present, utilized or combined with other elements, components or steps not expressly referenced.
[00057] Conditional language, such as, among others, “can,” “could,” “might,” or “may,” unless specifically stated otherwise, or otherwise understood within the context as used, is generally intended to convey that certain implementations could include, while other implementations do not include, certain features, elements, and/or operations. Thus, such conditional language generally is not intended to imply that features, elements, and/or operations are in any way required for one or more implementations or that one or more implementations necessarily include logic for deciding, with or without user input or prompting, whether these features, elements, and/or operations are included or are to be performed in any particular implementation.
[00058] The systems and methods described herein, therefore, are well adapted to carry out the objects and attain the ends and advantages mentioned, as well as others inherent therein. While example embodiments of the system and method have been given for purposes of disclosure, numerous changes exist in the details of procedures for accomplishing the desired results. These and other similar modifications may readily suggest themselves to those skilled in the art, and are intended to be encompassed within the spirit of the system and method disclosed herein and the scope of the appended claims.

Claims

1. A method for optimizing production of a hydrocarbon from a subsurface formation, the method comprising: acquiring a sample of the subsurface formation; positioning the sample in a pressure vessel comprising a fluid and a pressure gauge and applying a constant confining pressure, Pc; running a first test by equilibrating the sample at a predetermined first pore gas pressure,
Pi applying a predetermined constant second gas pressure, p0, to an inlet of the sample, the second gas pressure being greater than the first pore gas pressure; measuring a third pore gas pressure, p, as a function of time, t, at a location along the axis of the sample in the pressure vessel; measuring permeability of the sample at a plurality of effective stresses, wherein each effective stress is the difference between the constant confining pressure and a pore pressure; and determining permeability of the sample as a function of effective stress using the formula:
Figure imgf000019_0001
where k is permeability at effective stress is the permeability at zero effective stress,
Figure imgf000019_0002
and α is the stress sensitivity factor of the permeability for the sample.
2. The method according to claim 1, further comprising: determining stress sensitivity factor based on the formula:
Figure imgf000019_0003
where ‘k’ is the permeability and ' σeff' is the effective stress.
3. The method according to claim 2, further comprising: upscaling the permeability values determined for the core sample using the formula:
Figure imgf000019_0004
where n is the total number of rock samples that are collected from the reservoir under consideration and have measurement results for the stress sensitivity factor, and αt is the stress sensitivity factor for the ith rock sample.
4. The method according to claim 3, further comprising: determining the optimum pressure drawdown for the subsurface formation, AP0, using the formula
Figure imgf000020_0001
5. The method according to claim 4, further comprising: controlling the pressure drawdown in a field operation such that it does not exceed ΔP0.
6. The method according to any of the preceding claims, wherein the sample is about 1 to 2 inches in diameter and 1 to 2 inches in length.
7. The method according to any of the preceding claims, wherein the first pore gas pressure in the sample is larger than 2,500 psi, and the second gas pressure is about 5% of the first pore pressure.
8. The method according to any of the preceding claims, wherein the subsurface formation comprises at least one of shale, limestone, and sandstone.
9. A non-transitory computer-readable medium having computer executable instructions that cause a computer to perform the operations of: reading a measurement of a first pore gas pressure, pi, of a gas after equilibrating the sample in a pressure vessel comprising a fluid and a pressure gauge that reads the constant confining pressure Pc after it is applied; reading a measurement of a predetermined constant second gas pressure, p0, applied to an inlet of the sample, the second gas pressure being greater than the first pore gas pressure; reading a measurement of a third pore gas pressure, p, at time, t, at a location along the axis of the sample in the pressure vessel; measuring permeability of the sample at a plurality of effective stresses, wherein each effective stress is the difference between the constant confining pressure and a pore pressure; and determining permeability of the sample as a function of effective stress using the formula:
Figure imgf000021_0001
where k is permeability at effective stress is the permeability at zero effective stress,
Figure imgf000021_0002
and α is the stress sensitivity factor of the permeability for the sample.
10. The medium according to claim 9, further comprising computer executable instructions for: determining stress sensitivity factor based on the formula:
Figure imgf000021_0003
where ‘k’ is the permeability and ‘σeff’ is the effective stress.
11. The medium according to claim 10, further comprising computer executable instructions for: upscaling the permeability values determined for the core sample using the formula:
Figure imgf000021_0004
where n is the total number of rock samples that are collected from the reservoir under consideration and have measurement results for the stress sensitivity factor, and αt is the stress sensitivity factor for the /th rock sample.
12. The medium according to claim 11, further comprising computer executable instructions for: determining the optimum pressure drawdown for the subsurface formation, AP0, using the formula
Figure imgf000021_0005
13. The medium according to claim 12, further comprising computer executable instructions for: controlling the pressure drawdown in a field operation such that it does not exceed
DRo.
14. The medium according to any of claims 9-13, wherein the sample is about 1 to 2 inches in diameter and 1 to 2 inches in length.
15. The medium according to any of claims 9-14, wherein the first pore gas pressure in the sample is larger than 2,500 psi, and the second gas pressure is about 5% of the first pore pressure.
16. The medium according to any of claims 9-15, wherein the subsurface formation comprises at least one of shale, limestone, and sandstone.
17. A method for optimizing production of a hydrocarbon from a subsurface formation, the method comprising: measuring permeability of a sample of the subsurface formation at a plurality of effective stresses, wherein each effective stress is the difference between a constant confining pressure and a pore pressure; and determining permeability of the sample as a function of effective stress using the formula:
Figure imgf000022_0001
where k is permeability at effective stress is the permeability at zero effective stress,
Figure imgf000022_0002
and α is the stress sensitivity factor of the permeability for the sample.
18. The method according to claim 17, further comprising: determining stress sensitivity factor based on the formula:
Figure imgf000022_0003
where ‘k’ is the permeability and ‘σeff’ is the effective stress.
19. The method according to claim 18, further comprising: upscaling the permeability values determined for the core sample using the formula:
Figure imgf000022_0004
where n is the total number of rock samples that are collected from the reservoir under consideration and have measurement results for the stress sensitivity factor, and αt is the stress sensitivity factor for the ith rock sample.
20. The method according to claim 19, further comprising: determining the optimum pressure drawdown for the subsurface formation, ΔP0, using the formula
Figure imgf000023_0001
21. The method according to claim 21, further comprising: controlling the pressure drawdown in a field operation such that it does not exceed
DRo.
PCT/US2021/070589 2020-05-21 2021-05-21 Methods and systems for determining optimum pressure drawdown in a production well for a shale gas reservoir Ceased WO2021237245A1 (en)

Priority Applications (1)

Application Number Priority Date Filing Date Title
SA522441112A SA522441112B1 (en) 2020-05-21 2022-10-27 Methods and systems for determining optimum pressure drawdown in a production well for a shale gas reservoir

Applications Claiming Priority (2)

Application Number Priority Date Filing Date Title
US16/879,953 2020-05-21
US16/879,953 US11591905B2 (en) 2020-05-21 2020-05-21 Methods and systems for determining optimum pressure drawdown in a production well for a shale gas reservoir

Publications (1)

Publication Number Publication Date
WO2021237245A1 true WO2021237245A1 (en) 2021-11-25

Family

ID=76972029

Family Applications (1)

Application Number Title Priority Date Filing Date
PCT/US2021/070589 Ceased WO2021237245A1 (en) 2020-05-21 2021-05-21 Methods and systems for determining optimum pressure drawdown in a production well for a shale gas reservoir

Country Status (3)

Country Link
US (1) US11591905B2 (en)
SA (1) SA522441112B1 (en)
WO (1) WO2021237245A1 (en)

Families Citing this family (3)

* Cited by examiner, † Cited by third party
Publication number Priority date Publication date Assignee Title
CN112219105A (en) * 2018-06-05 2021-01-12 沙特阿拉伯石油公司 System and method for analyzing natural gas flow in a subterranean reservoir
CN115060875B (en) * 2022-06-17 2024-10-22 大连理工大学 Method for determining hydrate reservoir production pressure interval based on Darcy's law
CN119715979B (en) * 2023-09-26 2025-09-23 中国石油天然气集团有限公司 Method for determining blocking thickness of siltstone layer based on temperature-pressure field simulation

Citations (3)

* Cited by examiner, † Cited by third party
Publication number Priority date Publication date Assignee Title
RU2538563C1 (en) * 2013-11-05 2015-01-10 Анатолий Фёдорович Косолапов Optimal pressure drawdown determination method
CN109490162A (en) * 2018-10-25 2019-03-19 广东石油化工学院 Consider that the compact oil reservoir capillary pressure under the conditions of stress sensitive calculates method
US20190234859A1 (en) * 2015-12-14 2019-08-01 Saudi Arabian Oil Company Methods and Systems for Determining Gas Permeability of a Subsurface Formation

Family Cites Families (10)

* Cited by examiner, † Cited by third party
Publication number Priority date Publication date Assignee Title
GB2351350B (en) * 1999-06-23 2001-09-12 Sofitech Nv Cavity stability prediction method for wellbores
US6860147B2 (en) 2002-09-30 2005-03-01 Alberta Research Council Inc. Process for predicting porosity and permeability of a coal bed
GB201210532D0 (en) * 2012-06-14 2012-07-25 Darcy Technologies Ltd Subterranean formation methods and apparatus
TWI536943B (en) 2012-11-27 2016-06-11 Yun Cheng Huang Sprinkler water drip filter coffee machine
CN103528934B (en) 2013-10-29 2016-05-25 中国石油大学(北京) Measure the cross-correlation method of Oil in Super-low Permeability rock permeability stress sensitivity
CN104834807B (en) 2015-03-18 2017-11-03 成都北方石油勘探开发技术有限公司 A kind of stress sensitive reservoir relative permeability computational methods based on fractal theory
US10571605B2 (en) * 2016-03-28 2020-02-25 Exxonmobil Upstream Research Company Method and system for modeling and simulating a fractured reservoir
US11346197B2 (en) * 2016-12-13 2022-05-31 Halliburton Energy Services, Inc. Enhancing subterranean formation stimulation and production using target downhole wave shapes
CN107389521B (en) 2017-06-22 2021-04-30 中国石油天然气集团公司 Method for determining physical properties of coal rock from logging data based on coal core experiment
CN109339774B (en) 2018-10-18 2021-09-28 中国石油化工股份有限公司 Boundary layer-based nonlinear seepage numerical simulation method for low-permeability deformation medium

Patent Citations (3)

* Cited by examiner, † Cited by third party
Publication number Priority date Publication date Assignee Title
RU2538563C1 (en) * 2013-11-05 2015-01-10 Анатолий Фёдорович Косолапов Optimal pressure drawdown determination method
US20190234859A1 (en) * 2015-12-14 2019-08-01 Saudi Arabian Oil Company Methods and Systems for Determining Gas Permeability of a Subsurface Formation
CN109490162A (en) * 2018-10-25 2019-03-19 广东石油化工学院 Consider that the compact oil reservoir capillary pressure under the conditions of stress sensitive calculates method

Non-Patent Citations (3)

* Cited by examiner, † Cited by third party
Title
ANKIT MIRANI ET AL: "Production-Pressure-Drawdown Management for Fractured Horizontal Wells in Shale-Gas Formations", vol. 21, no. 3, 13 August 2018 (2018-08-13), pages 550 - 565, XP009529850, ISSN: 0885-9248, Retrieved from the Internet <URL:https://onepetro.org/REE/article-abstract/21/03/550/207442/Production-Pressure-Drawdown-Management-for?redirectedFrom=fulltext> DOI: 10.2118/181365-PA *
SUN ZHUANG ET AL: "The optimum pressure drawdown for production from a shale gas reservoir: A numerical study with a coupled geomechanics and reservoir model", JOURNAL OF NATURAL SCIENCE AND ENGINEERING, 1 February 2021 (2021-02-01), pages 1 - 9, XP055837945, Retrieved from the Internet <URL:https://www.sciencedirect.com/science/article/pii/S187551002100055X/pdfft?md5=f9f317e0b848429a5cab83f122ac7126&pid=1-s2.0-S187551002100055X-main.pdf> *
WANG JUNLEI ET AL: "An Integrated Approach To Optimize Bottomhole-Pressure-Drawdown Management for a Hydraulically Fractured Well Using a Transient Inflow Performance Relationship", vol. 23, no. 1, 17 February 2020 (2020-02-17), pages 95 - 111, XP009529851, ISSN: 1094-6470, Retrieved from the Internet <URL:http://onepetro.org/REE/article-pdf/23/01/095/2334540/spe-195688-pa.pdf> [retrieved on 20190708], DOI: 10.2118/195688-PA *

Also Published As

Publication number Publication date
SA522441112B1 (en) 2024-06-04
US20210363882A1 (en) 2021-11-25
US11591905B2 (en) 2023-02-28

Similar Documents

Publication Publication Date Title
Honarpour et al. Characterization of critical fluid, rock, and rock-fluid properties-impact on reservoir performance of liquid-rich shales
CN105190366B (en) The continuous capillary pressure curve of surface lower stratum is determined using saturation degree and nuclear magnetic resonance log data
Postler Pressure integrity test interpretation
CN107735668A (en) Method for determining the unconventional liquid imbibition in low-permeability material
EA023601B1 (en) Method for measuring rock wettability
WO2021237245A1 (en) Methods and systems for determining optimum pressure drawdown in a production well for a shale gas reservoir
CA2392618C (en) Improved method and apparatus for predicting the fluid characteristics in a well hole
CA2888205A1 (en) Predicting performance of gas condensate reservoirs
Chhatre* et al. Effect of stress, creep, and fluid type on steady state permeability measurements in tight liquid unconventional reservoirs
Soares et al. An experimental study for mechanical formation damage
Preene Design and interpretation of packer permeability tests for geotechnical purposes
Altman et al. Applied learnings in reservoir simulation of unconventional plays
Sun et al. The optimum pressure drawdown for production from a shale gas reservoir: A numerical study with a coupled geomechanics and reservoir model
De Kok Monitoring Injectivity for CO2 Injection in Depleted Gas Reservoirs
Zhang et al. Field permeability tests: importance of calibration and synchronous monitoring for barometric pressure sensors
Chapuis et al. Barometric fluctuations and duration of variable-head (slug) field permeability tests
US11442192B2 (en) Methods and systems for quantification of NAPL transmissivity
Badrouchi et al. Comparing different methods of permeability measurement for Bakken core samples: steady-state vs. aspike & multi-pulse
Ali Developments in measurement and interpretation techniques in coreflood tests to determine relative permeabilities
Kim et al. Multi-scale analysis of CO2 injection as improved shale gas recovery method
CN114060015B (en) Method and device for evaluating gas content of compact sandstone
Shchipanov et al. A new approach to deformable fractured reservoir characterization: case study of the Ekofisk field
Yazkov et al. Complex phase behavior study of a near-critical gas condensate fluid in a tight HPHT Reservoir
Wang et al. Semianalytical Model for Monitoring Fracture Liquid-Loading in Vertical Fractured Gas Wells
Edris et al. Implementation of coupled 3D geomechanics and discrete fracture network (DFN) models in field development optimisation: A case study from carbonate reservoir, Abu Dhabi

Legal Events

Date Code Title Description
121 Ep: the epo has been informed by wipo that ep was designated in this application

Ref document number: 21743360

Country of ref document: EP

Kind code of ref document: A1

NENP Non-entry into the national phase

Ref country code: DE

32PN Ep: public notification in the ep bulletin as address of the adressee cannot be established

Free format text: NOTING OF LOSS OF RIGHTS PURSUANT TO RULE 112(1) EPC (EPO FORM 1205A DATED 28.04.2023)

122 Ep: pct application non-entry in european phase

Ref document number: 21743360

Country of ref document: EP

Kind code of ref document: A1

WWE Wipo information: entry into national phase

Ref document number: 522441112

Country of ref document: SA

WWG Wipo information: grant in national office

Ref document number: 522441112

Country of ref document: SA