WO2021192197A1 - Sales assistance system, sales assistance method, and program recording medium - Google Patents
Sales assistance system, sales assistance method, and program recording medium Download PDFInfo
- Publication number
- WO2021192197A1 WO2021192197A1 PCT/JP2020/013914 JP2020013914W WO2021192197A1 WO 2021192197 A1 WO2021192197 A1 WO 2021192197A1 JP 2020013914 W JP2020013914 W JP 2020013914W WO 2021192197 A1 WO2021192197 A1 WO 2021192197A1
- Authority
- WO
- WIPO (PCT)
- Prior art keywords
- sales
- customer
- time point
- prediction
- target customer
- Prior art date
Links
Images


Classifications
-
- G—PHYSICS
- G06—COMPUTING; CALCULATING OR COUNTING
- G06Q—INFORMATION AND COMMUNICATION TECHNOLOGY [ICT] SPECIALLY ADAPTED FOR ADMINISTRATIVE, COMMERCIAL, FINANCIAL, MANAGERIAL OR SUPERVISORY PURPOSES; SYSTEMS OR METHODS SPECIALLY ADAPTED FOR ADMINISTRATIVE, COMMERCIAL, FINANCIAL, MANAGERIAL OR SUPERVISORY PURPOSES, NOT OTHERWISE PROVIDED FOR
- G06Q30/00—Commerce
- G06Q30/02—Marketing; Price estimation or determination; Fundraising
- G06Q30/0201—Market modelling; Market analysis; Collecting market data
- G06Q30/0202—Market predictions or forecasting for commercial activities
-
- G—PHYSICS
- G06—COMPUTING; CALCULATING OR COUNTING
- G06Q—INFORMATION AND COMMUNICATION TECHNOLOGY [ICT] SPECIALLY ADAPTED FOR ADMINISTRATIVE, COMMERCIAL, FINANCIAL, MANAGERIAL OR SUPERVISORY PURPOSES; SYSTEMS OR METHODS SPECIALLY ADAPTED FOR ADMINISTRATIVE, COMMERCIAL, FINANCIAL, MANAGERIAL OR SUPERVISORY PURPOSES, NOT OTHERWISE PROVIDED FOR
- G06Q10/00—Administration; Management
Definitions
- the present invention relates to a technique for predicting actions recommended in sales activities, and more particularly to a technique for predicting actions that increase the possibility of receiving an order.
- a sales support system that supports marketing activities and sales activities is widely used. As one of the functions of the sales support system, it may be provided with a function of presenting a proposal of an approach method to a customer. As a technique for presenting a proposal for such a method of approaching a customer, for example, a technique such as Patent Document 1 is disclosed.
- Patent Document 1 relates to a technique for presenting a new customer and a sales method based on a learned model generated based on past achievements.
- the trained model generator of Patent Document 1 estimates the segment to which a new customer belongs based on the trained model, and presents an approach method according to the segment.
- Patent Document 2 discloses a sales activity support system that calculates the success probability from the operation results of the maintenance target
- Patent Document 3 discloses a sales activity support system that predicts the success probability according to the attributes of the partner candidate. Has been done.
- Patent Document 1 Patent Document 2
- Patent Document 3 cannot present to customers who have already started sales activities what kind of sales activities should be carried out after the present time. ..
- the present invention achieves the success probability of sales activities, improvement of sales, efficiency of sales activities, etc. by predicting actions after the present time necessary to increase the possibility of receiving orders in order to solve the above problems.
- the purpose is to provide a sales support system, a sales support method, and a program recording medium that can support the above.
- the sales support system of the present invention includes an acquisition unit and a prediction unit.
- the data acquisition unit acquires sales process time-series data indicating the time-series order of a plurality of actions included in the sales activity for the target customer at the first time point, and customer attribute data regarding the attributes of the target customer.
- the forecasting unit uses the forecasting model and the sales process time series data and customer attribute data acquired by the acquisition unit to take actions after the first time point in sales activities for the target customer and actions after the first time point.
- the forecast model is a plurality of customer attribute data and a plurality of customers regarding the attributes of a plurality of customers who have performed sales activities related to a plurality of sales process time series data and a plurality of sales process time series data at a time point earlier than the first time point. It is generated by machine learning using the success or failure of sales activities for each.
- the sales support method of the present invention acquires sales process time-series data indicating the time-series order of a plurality of actions included in sales activities for the target customer at the first time point, and customer attribute data regarding the attributes of the target customer. ..
- the sales support method of the present invention uses a prediction model, sales process time series data, and customer attribute data to perform actions after the first time point in sales activities for a target customer and actions after the first time point. Predict the success rate of sales activities for the target customer in the case of.
- the forecast model is a plurality of customer attribute data and a plurality of customers regarding the attributes of a plurality of customers who have performed sales activities related to a plurality of sales process time series data and a plurality of sales process time series data at a time point earlier than the first time point. It is generated by machine learning using the success or failure of sales activities for each.
- the program recording medium of the present invention records a sales support program.
- the sales support program is a computer that acquires sales process time-series data showing the time-series order of multiple actions included in sales activities for the target customer at the first time, and customer attribute data related to the attributes of the target customer.
- the sales support program uses a forecast model, sales process time-series data, and customer attribute data to perform actions after the first time point in sales activities for the target customer and actions after the first time point.
- the forecast model is a plurality of customer attribute data and a plurality of customers regarding the attributes of a plurality of customers who have performed sales activities related to a plurality of sales process time series data and a plurality of sales process time series data at a time point earlier than the first time point. It is generated by machine learning using the success or failure of sales activities for each.
- the present invention by predicting actions after the present time necessary to increase the possibility of receiving an order, it is possible to suitably support sales activities such as success probability of sales activities, improvement of sales, and efficiency of sales activities. Can be done.
- FIG. 1 is a diagram showing an outline of the configuration of the sales support system of the present embodiment.
- the sales support system of this embodiment includes a prediction system 100 and a sales data management server 300.
- the prediction system 100 and the sales data management server 300 are connected via a network.
- the sales support system of the present embodiment is a system that predicts the sales process after the forecast time when there is a high possibility of receiving an order from the activity history of the sales activities already executed by the current time, that is, the forecast time, using the forecast model.
- a sales process is a chronological sequence of actions taken from the first action on a customer in a sales activity to the result of an order or loss of orders.
- the sales process may also include customer approaches and actions during the marketing phase.
- an action is an individual sales action performed by a sales person with respect to a customer.
- actions include holding a seminar for a customer, calling a customer, sending an e-mail newsletter to a customer, hearing a customer, visiting a customer, discussing with a customer, negotiating with a customer / negotiation (including price negotiation and product proposal).
- Product and system demonstrations to customers, exhibition invitations, factory tours, customer get-togethers, but not limited to any actions taken as part of general sales activities.
- the sales support system in this embodiment is not limited to the sales process with a high possibility of receiving an order, but can predict the sales process including the action to be taken after the present time.
- the sales support system in the present embodiment can predict a sales process including an action with a low possibility of receiving an order.
- "sales process having a high possibility of receiving an order” also means "a sales process including an action to be taken after the present time” or "a sales process including an action having a low possibility of receiving an order”. use.
- the prediction system 100 includes a prediction model generation device 10 and a prediction device 20.
- the prediction model generation device 10 and the prediction device 20 are connected via a network. Further, the prediction model generation device 10 and the prediction device 20 may be formed as an integrated device. Further, the functions of the respective parts constituting the prediction model generation device 10 and the prediction device 20 may be realized by devices different from each other.
- FIG. 2 is a diagram showing a configuration of the prediction model generation device 10.
- the prediction model generation device 10 includes an acquisition unit 11, a storage unit 12, a graph data generation unit 13, a prediction model generation unit 14, a prediction model storage unit 15, and a prediction model output unit 16.
- the prediction model generation device 10 is a device that generates a prediction model used when predicting a sales process after a prediction time point at which there is a high possibility of receiving an order from the activity history of sales activities that have already been performed.
- the acquisition unit 11 acquires the data used to generate the prediction model.
- the acquisition unit 11 acquires the identification information of the customer who has been the target of the sales activity in the past, the attribute of the customer, and the data of the success or failure of the order as the data used for generating the prediction model. For example, the acquisition unit 11 acquires the data of the customer's company name as the customer's identification information, and acquires the data of the customer's industry as the customer's attribute.
- the acquisition unit 11 acquires the activity history data for each case from the first approach to the customer to the determination of the success / failure result of the order from the sales data management server 300 for the past sales activities.
- the activity history data includes information on the actions performed in the sales activities for each case and the date and time when each action was executed. That is, the activity history data is data showing the time-series order of a plurality of actions performed in the sales activity.
- activity history data is also referred to as “sales process time series data”.
- the storage unit 12 stores each data input from the acquisition unit 11.
- the graph data generation unit 13 generates a graph showing the sales process related to the sales process time series data as graph structure data from the sales process time series data.
- the graph generated by the graph data generation unit 13 is composed of a node showing each action in the sales activity and an edge showing the order relationship between each action in the sales activity.
- the graph structure data shows the time series order of each action in the sales activity.
- the graph structure data can indicate the order and time interval between actions represented by the nodes at both ends of the edge, depending on the length of the edge that constitutes the graph structure data. If there are no edges between the nodes in the graph, it indicates that there is no order relationship between the actions represented by the nodes. That is, the edges that make up the graph structure are not stretched between nodes that represent unordered actions. Therefore, the graph structure data shows the sales process. Actions in sales activities may include actions in the marketing stage that have not started sales activities such as sales of specific products.
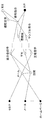
- FIG. 3 schematically shows an example of a graph generated by the graph data generation unit 13.
- FIG. 3 shows a graph generated from the activity history of a plurality of projects as one graph.
- the white circles in FIG. 3 indicate each action in the sales process set as a node.
- the black circle in FIG. 3 indicates the first action for each case, that is, the action for first contacting the customer in the sales activity of the target case.
- the action when first contacting the customer is also called an entry point.
- the prediction model generation unit 14 generates a prediction model for predicting a sales process with a high possibility of receiving an order based on graph structure data, attribute data related to nodes constituting the graph, and a label indicating the success or failure of sales activities.
- the prediction model generation unit 14 generates a prediction model by machine learning using the graph structure data generated from the activity history, the learning data of the customer's industry, and the success or failure of the order as a result of the sales activity as a label.
- the prediction model generation unit 14 generates a prediction model by calculating the feature amount of the graph by machine learning using NN (Neural Network) or deep learning (deep learning).
- the predictive model may be generated using any machine learning technique, such as supervised learning, unsupervised learning, semi-supervised learning or reinforcement learning.
- the prediction model generation unit 14 generates a prediction model by calculating the feature amount of the graph by, for example, the STAR method.
- a prediction model is generated by calculating the feature amount of the graph by inputting the graph structure data at a plurality of time points.
- Dongkuan Xu et al. "Spatio-Temporal Attentive RNN for Node Classification in Temporal Attributed Graphs", Proceedings of the Twenty-Eighth International Joint Conference on Artificial Intelligence Search on 27th] Internet ⁇ URL: https://www.ijcai.org/Proceedings/2019/0548.pdf>.
- the prediction model generation unit 14 may generate a prediction model by calculating the feature amount of the graph by the TGNet method.
- TGNet method machine learning is performed by inputting dynamic data, static data, and label data, and a trained model is generated. Details of the TGNet method are described in Qi Song, et al., "TGNet: Learning to Rank Nodes in Temporal Graphs", Proceedings of the 27th ACM International Conference on Information and Knowledge Management, p.97-106.
- the prediction model generation unit 14 may generate a prediction model by extracting the feature amount using, for example, a method for extracting the feature amount such as the Netwalk method, and combining a method for analyzing the feature amount such as the InerHAT method. good. Details of the Network method are described in Wenchow Yu, et al., "NetWalk: A Flexible Deep Embedding Approach for Anomaly Detection in Dynamic Networks", KDD 2018, p.2672-2681. The details of the InerHAT method are described in Zeyu Li, et al., “Interpretable Click-Through Rate Prediction through Hierarchical Attention", WSDM 2020: The Thirteenth ACM International Conference on Web Search and Data Mining.
- the prediction model generation unit 14 may generate a prediction model by using another method as long as it is a method of analyzing graph data and extracting a feature pattern.
- the prediction model storage unit 15 stores the prediction model generated by the prediction model generation unit 14.
- the prediction model output unit 16 outputs the prediction model stored in the prediction model storage unit 15 to the prediction device 20.
- Each process in the acquisition unit 11, the graph data generation unit 13, the prediction model generation unit 14, and the prediction model output unit 16 is performed by executing a computer program on the CPU (Central Processing Unit). Further, a GPU (Graphics Processing Unit) may be combined with the CPU.
- CPU Central Processing Unit
- GPU Graphics Processing Unit
- the storage unit 12 and the prediction model storage unit 15 are configured by using, for example, a hard disk drive.
- the storage unit 12 and the prediction model storage unit 15 may be composed of a non-volatile semiconductor storage device or a combination of a plurality of types of storage devices.
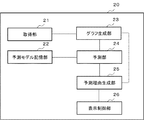
- FIG. 4 is a diagram showing the configuration of the prediction device 20.
- the prediction device 20 includes an acquisition unit 21, a prediction model storage unit 22, a graph generation unit 23, a prediction unit 24, a prediction reason generation unit 25, and a display control unit 26.
- the acquisition unit 21 acquires input data when predicting a sales process with a high possibility of receiving an order using a prediction model.
- the acquisition unit 21 acquires activity history data of the current time, that is, the action executed until the forecast is made, among the forecasted sales activities. ..
- the acquisition unit 21 acquires the type of business of the customer to be sold as customer attribute data.
- the customer attribute data is data related to the attributes of the customer to be sold, and is not limited to the type of business of the customer to be sold.
- customer attribute data includes, but is not limited to, customer industry, sales, annual profit, number of employees, purchase record, location of sales office or factory, information about members, place of residence, and so on.
- Any data related to customer attributes may be used.
- the customer attribute data may be data including at least one of the above-mentioned information.
- the prediction model storage unit 22 stores the prediction model generated by the prediction model generation device 10.
- the graph generation unit 23 generates graph structure data from the activity history data up to the present time.
- the graph structure data generated from the activity history is composed of a node showing each action in the sales process and an edge showing the time series order of each action in the sales process by connecting between two consecutive actions.
- the forecasting unit 24 predicts a sales process with a high possibility of receiving an order from the input data based on the forecasting model stored in the forecasting model storage unit 22.
- the forecasting unit 24 inputs the graph structure data based on the activity history of the sales activities performed so far for the sales target customer and the industry of the sales target customer of the attribute data corresponding to the node of the graph structure data.
- a sales process with a high probability of receiving an order is information indicating the actions after the present time and the order of each action that can increase the possibility of receiving an order.
- the prediction reason generation unit 25 generates the reason for the prediction by the prediction unit 24.
- the display control unit 26 controls the display unit (not shown) included in the prediction device 20 or the display device outside the prediction device 20 so as to display the prediction result to which the reason for the prediction is added. Further, the display control unit 26 may control the display on the display device by transmitting the prediction result with the reason for the prediction added to the terminal of the user who uses the prediction result, but the display control method is based on this. Not limited. Thereby, the present invention can more preferably support the sales activity by presenting the reason to the sales person in addition to the action after the present time.
- the display control unit 26 may control the display device so that only the prediction result is displayed on the display device. Even by displaying the forecast result, it is possible to appropriately support the sales activity by presenting the reason to the sales person in addition to the action after the present time.
- Each process in the acquisition unit 21, the graph generation unit 23, the prediction unit 24, the prediction reason generation unit 25, and the display control unit 26 is performed by executing a computer program on the CPU.
- the prediction model storage unit 22 is configured by using, for example, a hard disk drive.
- the prediction model storage unit 22 may be composed of a non-volatile semiconductor storage device or a combination of a plurality of types of storage devices.
- the sales data management server 300 manages activity history data for each sales activity.
- the activity history data for example, data input by a sales person via a terminal device is used.
- the activity history data may be data extracted from the business diary.
- the sales data management server 300 has a sales activity of "March 2", which is the date and time, from the business diary in which the sales person describes "Introduce product A to company X by e-mail on March 2".
- “Company X" which is the target of the above, and "email” indicating the action in the sales activity may be extracted as activity history data.
- the business data management server 300 transmits the activity history data to the prediction model generation device 10.
- FIG. 5 is a diagram showing an operation flow when the prediction model generation device 10 generates a prediction model for predicting a sales process with a high possibility of receiving an order.
- the acquisition unit 11 acquires the customer's industry that was the target of the plurality of sales activities performed in the past as attribute data, and the success / failure data of the order for each sales activity (step S11).
- the success / failure data of the order is information indicating whether the order for each sales activity is successful or unsuccessful.
- Each data acquired by the acquisition unit 11 may be input by an operator, or may be acquired from another server having each data.
- the acquisition unit 11 may acquire information indicating the actual result of whether or not an order has been received for each sales activity from the sales data management server 300. When each data is acquired, the acquisition unit 11 stores each acquired data in the storage unit 12.
- FIG. 6 is a diagram showing an example of customer information used as attribute data.
- the attribute data includes the customer's company name and industry.
- FIG. 7 is a diagram showing an example of order success / failure data used as a label.
- the order success / failure data includes the activity history number which is the identification information of the activity history, the company name of the customer, the product which has been operated, and the result of the order success / failure.
- the acquisition unit 11 acquires activity history data for each sales activity from the sales data management server 300 as sales process time-series data (step S12). When the sales process time series data is acquired, the acquisition unit 11 stores the acquired sales process time series data in the storage unit 12.
- FIG. 8 is a diagram showing an example of sales process time series data.
- the activity history number which is the identification information of the activity history, and the date when each action is performed in the sales activity are linked.
- the activity history number in FIG. 8 corresponds to the activity history number in FIG. 7.
- the graph data generation unit 13 When the sales process time series data is stored in the storage unit 12, the graph data generation unit 13 generates graph structure data based on the sales process time series data (step S13). When the graph structure data is generated, the graph data generation unit 13 sends the generated graph structure data to the prediction model generation unit 14.
- the prediction model generation unit 14 reads out each data used for generating the prediction model from the storage unit 12.
- machine learning that uses graph structure data based on multiple activity histories and the industry of each of multiple customers, which is customer attribute data, as input data, and uses the success or failure of orders for each sales activity as labels.
- the prediction model generation unit 14 stores the generated prediction model as a learned model in the prediction model storage unit 15.
- the prediction model output unit 16 outputs the prediction model to the prediction device 20 (step S15).
- the prediction model input to the prediction device 20 is stored in the prediction model storage unit 22.
- the prediction model generated by the prediction model generation device 10 may be updated by re-learning.
- the prediction model generation unit 14 relearns the graph data generated from the activity history performed based on the prediction result, the customer's industry as input data, and the presence or absence of order acquisition as the label of the input data.
- the prediction model of the prediction model storage unit 15 is updated. By performing re-learning based on the prediction result in this way, the prediction accuracy by the trained model is improved.
- the prediction model generation unit 14 may newly generate a prediction model using the input data and the label.
- FIG. 9 is a diagram showing an operation flow when predicting a sales process with a high possibility of receiving an order by using a prediction model in the prediction device 20.
- the acquisition unit 21 acquires the sales process time-series data showing the activity history of the sales activity to be predicted up to the present time and the customer attribute data including the type of business of the customer who is performing the sales activity (step S21). ).
- the graph generation unit 23 generates graph structure data from the sales process time series data up to the present time (step S22).
- the graph generation unit 23 sends the generated graph structure data and the data of the industry of the customer to be predicted to the prediction unit 24.
- the prediction unit 24 Upon receiving the graph structure data of the activity history, the prediction unit 24 inputs the graph structure data of the activity history and the industry of the target customer, which is the attribute data, using the prediction model stored in the prediction model storage unit 22. As a result, the sales process with a high possibility of receiving an order and the success probability of the order are predicted (step S23). When the sales process with a high possibility of receiving an order is predicted, the prediction unit 24 sends the data of the sales process with a high possibility of receiving an order and the success probability of the order as a prediction result to the prediction reason generation unit 25. The success probability is calculated based on the degree of similarity between the actions taken so far and each candidate, and the order record of each candidate. The forecast results include data on sales processes that are likely to receive orders, information on edges that contribute more to order acquisition than other edges, and information on success probabilities.
- the prediction reason generation unit 25 Upon receiving the prediction result, the prediction reason generation unit 25 extracts the reason for the prediction (step S24).
- the reason for the prediction is information for presenting the reason for the prediction by the prediction unit 24 to the user. For example, the prediction reason generation unit 25 extracts an edge having a high contribution to the success of an order from the sales process data included in the prediction result, and the action corresponding to the nodes at both ends of the extracted edge is an important action for the order. If so, the inclusion of it is presented as the reason for the prediction.
- the reason for prediction generation unit 25 When the reason for prediction is extracted, the reason for prediction generation unit 25 outputs the reason for prediction to the display control unit 26.
- the display control unit 26 controls the display device and displays the prediction result and the reason for the prediction on the display device (step S25).
- the display control unit 26 controls transmission of data of the prediction result and the reason for the prediction to the user's terminal so that the prediction result and the reason for the prediction are displayed on the display device of the user's terminal using the prediction result. You may.
- FIG. 10 is a diagram showing an example of display data of the prediction result.
- the display data of the prediction result in FIG. 10 shows the executed actions showing the activity history up to the prediction time, the recommended process candidates showing the actions to be performed in the future and their order, the success probability, and the reason why each recommended process candidate was selected. It is composed of.
- the success probability is an index that is calculated based on the degree of similarity between the actions taken so far and each candidate and the order record of each candidate, and indicates the possibility of winning an order.
- FIG. 10 shows an example in which a plurality of candidates for a sales process having a high possibility of receiving an order are shown as a prediction result.
- the reasons for predicting that there is a high possibility of receiving an order are that the order record is high in the same industry and that the order from the exhibition to the social gathering contributes greatly to the success of the order. It is shown.
- the user of the prediction result predicts the sales process to be applied to the customer to be sold. You can select by referring to the reason.
- a plurality of candidates are shown as sales processes having a high possibility of receiving an order. For example, if the sales process shown in the uppermost row is the first forecast result, the second forecast result is the sales process having the next highest probability of success of the order after the first forecast result.
- the name of the attribute data used for prediction may be used as it is.
- the prediction reason generation unit 25 may extract, for example, that the customer's industry is the manufacturing industry as the reason for the prediction. good. Further, the prediction reason generation unit 25 may present the prediction reason based on the template defined in advance.
- the prediction reason generation unit 25 holds a template for prediction reasons such as "because it is a sales process suitable for XX customers", and the success probability of receiving an order is high when the industry is "manufacturing”. Sometimes the reason for the prediction "because it is a sales process suitable for manufacturing customers" may be generated from the template.
- the action indicated by the node may be displayed (pop-up display) only when the mouse cursor is placed on the node on the display screen (when the mouse cursor is placed). Further, when the part of the node on the display screen is clicked or tapped, the action indicated by the node may be displayed. Further, the sales process having a high possibility of receiving an order or the action part having a high contribution to the success of an order may be highlighted on the screen. The highlighting is done by, for example, bold bold, color, flash or magnitude of movement in the animated display. As a result, visibility to the user can be improved.
- the edges of the graph structure data used when generating the prediction model show only the order of actions, but the edges may include the length of time between actions. That is, the graph generation unit 23 can generate graph structure data including information on the length of time between actions at the edge. In this way, by making a prediction using a prediction model generated using graph structure data that includes information on the length of time between actions at the edge, it is possible to predict the appropriate timing for each action. become. Further, when the prediction result is displayed as shown in FIG. 10, when the cursor is placed on the edge on the display screen, the time interval indicated by the edge, that is, the time interval between each action may be displayed. Further, on the display screen, when the edge portion is clicked or tapped, the time interval indicated by the edge may be displayed. As a result, it is possible to improve the success probability and efficiency of sales activities by presenting an appropriate timing for performing each predicted action to a user such as a sales person.
- the prediction model when the prediction model is generated, the information of the industry of the customer who conducts the sales activity is input as the attribute data, but the attribute data of the customer does not have to be used as the input data. If the customer's industry, which is the customer's attribute data, is not used as an input when generating the forecast model, the forecast of the sales process with a high possibility of receiving an order is based on the activity history up to the time of the forecast and the order received in the past sales activities. It is done only by similarity with the sales process that has a high probability of success.
- the customer attribute data when generating and forecasting the forecast model includes the customer's industry, sales, annual profit, number of employees, purchase record, location of sales office or factory, instead of information on the customer's industry. Information on one or more attributes of family structure and place of residence may be used as input data. Further, the above customer attribute data may be used in addition to the customer attribute data indicating the customer's industry.
- the attribute data when generating and forecasting the forecast model includes the classification of the product or service to be sold, the product or service to be sold, the sales of the customer to be sold, and the sales person, instead of the attribute data of the customer.
- the position of the sales person, or the information of one or more attributes of the company or the sales person who is the target of the sales activity such as the class of the sales person may be used as the input data.
- the above attribute data may be used in addition to the customer attribute data. Further, when the attribute data of the customer or the sales person who is the target of these sales activities is used for generating the prediction model, it can be used for input as the attribute data even in the prediction stage.
- the reason for the forecast is that instead of the order of the two actions included in the sales process, the customer's industry, sales, annual profit, number of employees, purchase record, classification of products or services to be sold, products to be sold or At least one item may be included among the service, the sales of the customer to be sold, the sales person, and the position of the sales person.
- the sales support system of the present embodiment generates graph structure data based on the activity history data in the prediction model generation device 10, and inputs the graph structure data which is time series data and the customer's industry which is attribute data. Predictive models are generated by machine learning. In addition, the sales support system of the present embodiment predicts a sales process with a high possibility of receiving an order from the activity history of the currently executing sales activity in the prediction device 20 based on the generated prediction model. .. The sales support system of the present embodiment makes a prediction using a prediction model generated based on the graph structure data of the activity history, and the possibility of receiving an order from the degree of similarity with the history of the sales activity currently being performed. Can predict high sales processes.
- the sales support system of this embodiment can be used for future actions to be taken for the order from the present time onward. Candidates can be presented. Therefore, the sales support system of the present embodiment can predict the actions after the present time necessary to increase the possibility of receiving an order in the sales activity. As a result, the sales support system of the present embodiment can suitably support sales activities such as success probability of sales activities, improvement of sales, and efficiency of sales activities.
- FIG. 11 is a diagram showing an outline of the configuration of the sales support system of the present embodiment.
- the sales support system of this embodiment includes an acquisition unit 31 and a prediction unit 32.
- the acquisition unit 31 and the prediction unit 32 may be provided in a single device, or may be provided in different devices.
- the acquisition unit 31 acquires sales process time-series data indicating the time-series order of a plurality of actions included in the sales activity for the target customer at the first time point, and customer attribute data regarding the attributes of the target customer.
- the first time point refers to an action in sales activities and a time point for predicting the probability of success. That is, the acquisition unit 31 acquires data indicating in time series the actions included in the sales activities performed on the target customer up to the time of prediction as the sales process time series data.
- the acquisition unit 31 is an example of acquisition means.
- An example of the acquisition unit 31 is the acquisition unit 21 of the prediction device 20 of the first embodiment.
- the forecasting unit 32 uses the forecasting model and the sales process time series data and customer attribute data acquired by the acquisition unit 31 to perform actions after the first time point in sales activities for the target customer and after the first time point. Predict the success rate of sales activities for the target customer when an action is taken.
- the forecast model is a plurality of customer attribute data and a plurality of customers regarding the attributes of a plurality of customers who have performed sales activities related to a plurality of sales process time series data and a plurality of sales process time series data at a time point earlier than the first time point. It is generated by machine learning using the success or failure of sales activities for each.
- the prediction unit 32 is an example of a prediction means.
- An example of the prediction unit 32 is the prediction unit 24 of the prediction device 20 of the first embodiment.
- FIG. 12 is a diagram showing an operation flow of the sales support system of the present embodiment.
- the acquisition unit 31 acquires the sales process time-series data indicating the time-series order of a plurality of actions included in the sales activity for the target customer at the first time point and the customer attribute data regarding the attributes of the target customer (step). S31). Specifically, the acquisition unit 31 acquires sales process time-series data showing the order of actions already executed up to the first time point in the sales activity in chronological order, and customer attribute data of the target customer of sales. ..
- the prediction unit 32 uses the prediction model, the sales process time series data, and the customer attribute data to perform actions after the first time point in the sales activity for the target customer. Predict the success rate of sales activities for the target customer when the action after the first time point is performed (step S32). Specifically, the forecasting unit 32 inputs the sales process time series data and the customer attribute data, and uses the forecasting model to perform actions with a high probability of successful order for sales activities after the first time point, which is the forecasting time point. Predict.
- the sales support system of the present embodiment inputs the activity history up to the first time point, which is the prediction time point, and the customer's attributes into the prediction model, so that the action in the sales activity after the prediction time point of the possibility of successful order can be taken. I'm predicting.
- the forecast model is generated based on the sales process time series data, which is the activity history of the sales activity past the first time when the forecast is performed, and the attributes of the target customer. Therefore, the sales support system of the present embodiment can predict actions with a high probability of success in sales activities after the time of prediction. Therefore, the sales support system of the present embodiment can predict the actions after the present time necessary to increase the possibility of receiving an order.
- FIG. 13 shows an example of the configuration of a computer 40 that executes a computer program that performs each process in the prediction model generation device 10 and the prediction device 20.
- the computer 40 includes a CPU 41, a memory 42, a storage device 43, an input / output I / F (Interface) 44, and a communication I / F 45.
- each process in the sales data management server 300 of the first embodiment and the sales support system of the second embodiment can also be performed by executing a computer program on a computer such as the computer 70.
- the CPU 41 reads a computer program that performs each process from the storage device 43 and executes it.
- the arithmetic processing unit that executes the computer program may be configured by a combination of a CPU and a GPU instead of the CPU 41.
- the memory 42 is configured by a DRAM (Dynamic Random Access Memory) or the like, and a computer program executed by the CPU 41 and data being processed are temporarily stored.
- the storage device 43 stores a computer program executed by the CPU 41.
- the storage device 43 is composed of, for example, a non-volatile semiconductor storage device. Other storage devices such as a hard disk drive may be used as the storage device 43.
- the input / output I / F 44 is an interface for receiving input from an operator and outputting display data and the like.
- the communication I / F 45 is an interface for transmitting and receiving data between each device in the sales support system and the terminal of the user.
- the computer program used to execute each process can be stored in a recording medium and distributed.
- a recording medium for example, a magnetic tape for data recording or a magnetic disk such as a hard disk can be used.
- an optical disk such as a CD-ROM (Compact Disc Read Only Memory) can also be used.
- a non-volatile semiconductor storage device may be used as the recording medium.
- the prediction model generated by machine learning using the success or failure of the sales activity for the target customer, the sales process time series data acquired by the acquisition means, and the customer attribute data are used.
- Appendix 2 The action after the first time point in the sales activity for the target customer predicted by the prediction means and the success probability of the sales activity for the target customer when the action after the first time point is performed are determined.
- the prediction means is different from the first prediction result, and is different from the first prediction result, and the action for the target customer after the first time point in the sales activity for the target customer and the sales for the target customer when the action after the first time point is performed. Predict the success rate of the activity and
- the display control means is different from the first prediction result, and the sales to the target customer when the action after the first time point in the sales activity for the target customer and the action after the first time point are performed are performed.
- the sales support system according to Appendix 2, which controls the display device to display the second prediction result including the success probability of the activity and the first prediction result.
- Appendix 4 Generates graph structure data relating to a graph consisting of a node showing each of a plurality of actions included in sales activities for the target customer and an edge showing the order relationship between the plurality of actions related to the node, corresponding to the first prediction result. Further equipped with graph generation means to The sales support system according to Appendix 2 or 3, wherein the display control means controls the display device so as to further display a prediction result including graph structure data generated by the graph generation means.
- the edge further indicates the time interval between the plurality of actions.
- the display control means receives the selection of the node in the graph structure data displayed on the display device
- the display control means controls the display device so as to display the action indicated by the node according to the graph structure data.
- the sales support system according to Appendix 4, wherein when the display control means receives the selection of an edge in the graph structure data displayed on the display device, the display control means controls the display device so as to display the time interval indicated by the edge.
- Appendix 6 A plurality of sales process time series data at a time point earlier than the first time point, a plurality of customer attribute data regarding attributes of a plurality of customers who have performed sales activities related to the plurality of sales process time series data, and the plurality of customer attribute data.
- the sales support system according to any one of Appendix 1 to 5, further comprising a prediction model generation means for generating the prediction model by machine learning using the success or failure of sales activities for each customer.
- Appendix 7 The sales support system according to Appendix 6, wherein the prediction model generation means relearns the prediction model based on the first prediction result.
- [Appendix 8] Acquire the sales process time series data showing the time series order of a plurality of actions included in the sales activity for the target customer at the first time point, and the customer attribute data related to the attribute of the target customer.
- the prediction model generated by machine learning using the success or failure of the sales activity for the target customer, the sales process time series data, and the customer attribute data, after the first time point in the sales activity for the target customer.
- a sales support method for predicting an action and a success probability of a sales activity for the target customer when the action after the first time point is performed.
- Appendix 10 The action after the first time point in the sales activity for the target customer, which is different from the first prediction result, and the success probability of the sales activity for the target customer when the action after the first time point is performed. Predict, The action after the first time point in the sales activity for the target customer, which is different from the first prediction result, and the success probability of the sales activity for the target customer when the action after the first time point is performed. 9. The sales support method according to Appendix 9, which controls the display device to display the second prediction result and the first prediction result including the above.
- Appendix 11 Generates graph structure data relating to a graph consisting of a node showing each of a plurality of actions included in sales activities for the target customer and an edge showing the order relationship between the plurality of actions related to the node, corresponding to the first prediction result. death, The sales support method according to Appendix 9 or 10, wherein the display device is controlled so as to further display the generated graph structure data.
- the edge includes a time interval between the plurality of actions.
- the display device is controlled to display the action indicated by the node.
- the sales support method according to Appendix 11 which controls the display device so as to display the time interval indicated by the edge when the selection of the edge in the graph structure data displayed on the display device is accepted.
- Appendix 13 A plurality of sales process time series data at a time point earlier than the first time point, a plurality of customer attribute data regarding attributes of a plurality of customers who have performed sales activities related to the plurality of sales process time series data, and the plurality of customer attribute data.
- the sales support method according to any one of Appendix 8 to 12, which generates the prediction model by machine learning using the success or failure of sales activities for each customer.
- Appendix 14 The sales support method according to Appendix 13, which relearns the prediction model based on the first prediction result.
- [Appendix 15] A process of acquiring sales process time-series data indicating the time-series order of a plurality of actions included in sales activities for the target customer at the first time point, and customer attribute data regarding the attributes of the target customer.
- the prediction model generated by machine learning using the success or failure of the sales activity for the target customer, the sales process time series data, and the customer attribute data, after the first time point in the sales activity for the target customer.
- a program recording medium that records a sales support program that causes a computer to execute.
- Prediction model generator 11 Acquisition unit 12 Storage unit 13 Graph data generation unit 14 Prediction model generation unit 15 Prediction model storage unit 16 Prediction model output unit 20 Prediction device 21 Acquisition unit 22 Prediction model storage unit 23 Graph generation unit 24 Prediction unit 25 Prediction reason generation unit 26 Display control unit 31 Acquisition unit 32 Prediction unit 40 Computer 41 CPU 42 Memory 43 Storage device 44 I / O I / F 45 Communication I / F 100 Forecasting system 300 Sales data management server
Landscapes
- Business, Economics & Management (AREA)
- Engineering & Computer Science (AREA)
- Strategic Management (AREA)
- Accounting & Taxation (AREA)
- Development Economics (AREA)
- Finance (AREA)
- Entrepreneurship & Innovation (AREA)
- Marketing (AREA)
- Economics (AREA)
- Physics & Mathematics (AREA)
- General Business, Economics & Management (AREA)
- General Physics & Mathematics (AREA)
- Theoretical Computer Science (AREA)
- Game Theory and Decision Science (AREA)
- Data Mining & Analysis (AREA)
- Human Resources & Organizations (AREA)
- Operations Research (AREA)
- Quality & Reliability (AREA)
- Tourism & Hospitality (AREA)
- Management, Administration, Business Operations System, And Electronic Commerce (AREA)
Abstract
In order to predict a future action required to increase the probability of receiving an order, this sales assistance system is configured to comprise an acquisition unit 31 and a prediction unit 32. The acquisition unit 31 acquires: sales process time series data indicating the time series sequence of a plurality of actions included in sales activity for a target customer at a first time point; and customer attribute data of the target customer. The prediction unit 32 uses a prediction model, the sales process time series data, and the customer attribute data to predict a sales activity action for the target customer subsequent to the first time point, and the probability of success of the sales activity for the target customer if the action is taken. The prediction model is generated by machine learning that utilizes: a plurality of sales process time series data pieces further in the past than the first time point; customer attribute data pieces for a plurality of customers subjected to sales activity; and the success/failure of sales activity on each of the plurality of customers.
Description
本発明は、営業活動において推奨されるアクションを予測する技術に関するものであり、特に、受注の可能性を高めるアクションを予測する技術に関するものである。
The present invention relates to a technique for predicting actions recommended in sales activities, and more particularly to a technique for predicting actions that increase the possibility of receiving an order.
マーケティング活動および営業活動を支援する営業支援システムが広く用いられている。営業支援システムの1つの機能として、顧客へのアプローチ方法の案を提示する機能が備えられていることがある。そのような顧客へのアプローチ方法の案を提示する技術としては、例えば、特許文献1のような技術が開示されている。
A sales support system that supports marketing activities and sales activities is widely used. As one of the functions of the sales support system, it may be provided with a function of presenting a proposal of an approach method to a customer. As a technique for presenting a proposal for such a method of approaching a customer, for example, a technique such as Patent Document 1 is disclosed.
特許文献1は、過去の実績に基づいて生成された学習済みモデルを基に、新規の顧客と営業方法を提示する技術に関するものである。特許文献1の学習済みモデルの生成装置は、学習済みモデルを基に新規の顧客が属するセグメントを推定し、セグメントに応じたアプローチ方法を提示している。また、特許文献2には、保守対象の稼働実績から成功確率を算出する営業活動支援システム、特許文献3には、相手先候補の属性等に応じて成功確率を予測する営業活動支援システムが開示されている。
Patent Document 1 relates to a technique for presenting a new customer and a sales method based on a learned model generated based on past achievements. The trained model generator of Patent Document 1 estimates the segment to which a new customer belongs based on the trained model, and presents an approach method according to the segment. Further, Patent Document 2 discloses a sales activity support system that calculates the success probability from the operation results of the maintenance target, and Patent Document 3 discloses a sales activity support system that predicts the success probability according to the attributes of the partner candidate. Has been done.
しかしながら、特許文献1、特許文献2および特許文献3の技術は、既に営業活動が開始されている顧客に対して、現時点以降に、どのような営業活動を行えばよいかを提示することはできない。
However, the technologies of Patent Document 1, Patent Document 2 and Patent Document 3 cannot present to customers who have already started sales activities what kind of sales activities should be carried out after the present time. ..
本発明は、上記の課題を解決するため、受注の可能性を高めるために必要な現時点以降におけるアクションを予測することにより、営業活動の成功確率や売上の向上、営業活動の効率化などの達成を支援することを可能とする営業支援システム、営業支援方法およびプログラム記録媒体を提供することを目的する。
The present invention achieves the success probability of sales activities, improvement of sales, efficiency of sales activities, etc. by predicting actions after the present time necessary to increase the possibility of receiving orders in order to solve the above problems. The purpose is to provide a sales support system, a sales support method, and a program recording medium that can support the above.
以上の課題を解決するため、本発明の営業支援システムは、取得部と、予測部を備えている。データ取得部は、第1の時点における対象顧客に対する営業活動に含まれる複数のアクションの時系列順序を示す営業プロセス時系列データと、対象顧客の属性に関する顧客属性データと、を取得する。予測部は、予測モデルと取得部により取得される営業プロセス時系列データ及び顧客属性データと、を用いて、対象顧客に対する営業活動における第1の時点以降のアクションと、第1の時点以降のアクションを行った場合の対象顧客に対する営業活動の成功確率と、を予測する。予測モデルは、第1の時点よりも過去の時点における複数の営業プロセス時系列データと複数の営業プロセス時系列データに関する営業活動を行った複数の顧客の属性に関する複数の顧客属性データと複数の顧客それぞれに対する営業活動の成否とを用いた機械学習によって生成されている。
In order to solve the above problems, the sales support system of the present invention includes an acquisition unit and a prediction unit. The data acquisition unit acquires sales process time-series data indicating the time-series order of a plurality of actions included in the sales activity for the target customer at the first time point, and customer attribute data regarding the attributes of the target customer. The forecasting unit uses the forecasting model and the sales process time series data and customer attribute data acquired by the acquisition unit to take actions after the first time point in sales activities for the target customer and actions after the first time point. Predict the success rate of sales activities for the target customer when The forecast model is a plurality of customer attribute data and a plurality of customers regarding the attributes of a plurality of customers who have performed sales activities related to a plurality of sales process time series data and a plurality of sales process time series data at a time point earlier than the first time point. It is generated by machine learning using the success or failure of sales activities for each.
本発明の営業支援方法は、第1の時点における対象顧客に対する営業活動に含まれる複数のアクションの時系列順序を示す営業プロセス時系列データと、対象顧客の属性に関する顧客属性データと、を取得する。本発明の営業支援方法は、予測モデルと営業プロセス時系列データ及び顧客属性データと、を用いて、対象顧客に対する営業活動における第1の時点以降のアクションと、第1の時点以降のアクションを行った場合の対象顧客に対する営業活動の成功確率と、を予測する。予測モデルは、第1の時点よりも過去の時点における複数の営業プロセス時系列データと複数の営業プロセス時系列データに関する営業活動を行った複数の顧客の属性に関する複数の顧客属性データと複数の顧客それぞれに対する営業活動の成否とを用いた機械学習によって生成されている。
The sales support method of the present invention acquires sales process time-series data indicating the time-series order of a plurality of actions included in sales activities for the target customer at the first time point, and customer attribute data regarding the attributes of the target customer. .. The sales support method of the present invention uses a prediction model, sales process time series data, and customer attribute data to perform actions after the first time point in sales activities for a target customer and actions after the first time point. Predict the success rate of sales activities for the target customer in the case of. The forecast model is a plurality of customer attribute data and a plurality of customers regarding the attributes of a plurality of customers who have performed sales activities related to a plurality of sales process time series data and a plurality of sales process time series data at a time point earlier than the first time point. It is generated by machine learning using the success or failure of sales activities for each.
本発明のプログラム記録媒体は、営業支援プログラムを記録している。営業支援プログラムは、第1の時点における対象顧客に対する営業活動に含まれる複数のアクションの時系列順序を示す営業プロセス時系列データと、対象顧客の属性に関する顧客属性データと、を取得する処理をコンピュータに実行させる。営業支援プログラムは、予測モデルと営業プロセス時系列データ及び顧客属性データと、を用いて、対象顧客に対する営業活動における第1の時点以降のアクションと、第1の時点以降のアクションを行った場合の対象顧客に対する営業活動の成功確率と、を予測する処理をコンピュータに実行させる。予測モデルは、第1の時点よりも過去の時点における複数の営業プロセス時系列データと複数の営業プロセス時系列データに関する営業活動を行った複数の顧客の属性に関する複数の顧客属性データと複数の顧客それぞれに対する営業活動の成否とを用いた機械学習によって生成されている。
The program recording medium of the present invention records a sales support program. The sales support program is a computer that acquires sales process time-series data showing the time-series order of multiple actions included in sales activities for the target customer at the first time, and customer attribute data related to the attributes of the target customer. To execute. The sales support program uses a forecast model, sales process time-series data, and customer attribute data to perform actions after the first time point in sales activities for the target customer and actions after the first time point. Have the computer execute the process of predicting the success rate of sales activities for the target customer. The forecast model is a plurality of customer attribute data and a plurality of customers regarding the attributes of a plurality of customers who have performed sales activities related to a plurality of sales process time series data and a plurality of sales process time series data at a time point earlier than the first time point. It is generated by machine learning using the success or failure of sales activities for each.
本発明によると、受注の可能性を高めるために必要な現時点以降におけるアクションを予測することにより、営業活動の成功確率、売上の向上、営業活動の効率化など、営業活動を好適に支援することができる。
According to the present invention, by predicting actions after the present time necessary to increase the possibility of receiving an order, it is possible to suitably support sales activities such as success probability of sales activities, improvement of sales, and efficiency of sales activities. Can be done.
(第1の実施形態)
本発明の第1の実施形態について図を参照して詳細に説明する。図1は、本実施形態の営業支援システムの構成の概要を示す図である。本実施形態の営業支援システムは、予測システム100と、営業データ管理サーバ300を備えている。予測システム100と、営業データ管理サーバ300は、ネットワークを介して接続されている。 (First Embodiment)
The first embodiment of the present invention will be described in detail with reference to the drawings. FIG. 1 is a diagram showing an outline of the configuration of the sales support system of the present embodiment. The sales support system of this embodiment includes aprediction system 100 and a sales data management server 300. The prediction system 100 and the sales data management server 300 are connected via a network.
本発明の第1の実施形態について図を参照して詳細に説明する。図1は、本実施形態の営業支援システムの構成の概要を示す図である。本実施形態の営業支援システムは、予測システム100と、営業データ管理サーバ300を備えている。予測システム100と、営業データ管理サーバ300は、ネットワークを介して接続されている。 (First Embodiment)
The first embodiment of the present invention will be described in detail with reference to the drawings. FIG. 1 is a diagram showing an outline of the configuration of the sales support system of the present embodiment. The sales support system of this embodiment includes a
本実施形態の営業支援システムは、現時点、すなわち、予測時点までに既に実行した営業活動の活動履歴から、受注の可能性の高い予測時点以降の営業プロセスを、予測モデルを用いて予測するシステムである。営業プロセスとは、営業活動における顧客への最初のアクションから受注または失注の結果が出るまでに行われる一連のアクションの時系列順序のことをいう。また、営業プロセスには、マーケティング段階における顧客へのアプローチおよびアクションが含まれていてもよい。また、アクションとは、顧客に対して営業担当者が行う個々の営業行動である。例えば、アクションは、顧客に対するセミナ開催、顧客に対する電話、顧客に対するメルマガ送信、顧客に対するヒアリング、顧客への訪問、顧客との議論、顧客との交渉・商談(価格交渉や製品の提案を含む。)、顧客に対する製品やシステムのデモンストレーション、展示会招待、工場見学、顧客との懇親会、を含むが、これらに限定されず、一般的な営業活動の一環で行われるあらゆる行動を含む。
The sales support system of the present embodiment is a system that predicts the sales process after the forecast time when there is a high possibility of receiving an order from the activity history of the sales activities already executed by the current time, that is, the forecast time, using the forecast model. be. A sales process is a chronological sequence of actions taken from the first action on a customer in a sales activity to the result of an order or loss of orders. The sales process may also include customer approaches and actions during the marketing phase. In addition, an action is an individual sales action performed by a sales person with respect to a customer. For example, actions include holding a seminar for a customer, calling a customer, sending an e-mail newsletter to a customer, hearing a customer, visiting a customer, discussing with a customer, negotiating with a customer / negotiation (including price negotiation and product proposal). , Product and system demonstrations to customers, exhibition invitations, factory tours, customer get-togethers, but not limited to any actions taken as part of general sales activities.
尚、本実施形態における営業支援システムは、受注の可能性の高い営業プロセスに限らず、現時点以降に取るべきアクションを含む営業プロセスを予測することができる。例えば、本実施形態における営業支援システムは、受注可能性の低いアクションを含む営業プロセスを予測することも可能である。これにより、営業担当者に対する教育を行うことができる。以降、本明細書では、「受注の可能性の高い営業プロセス」は、「現時点以降に取るべきアクションを含む営業プロセス」や「受注可能性の低いアクションを含む営業プロセス」をも意味する言葉として使用する。
The sales support system in this embodiment is not limited to the sales process with a high possibility of receiving an order, but can predict the sales process including the action to be taken after the present time. For example, the sales support system in the present embodiment can predict a sales process including an action with a low possibility of receiving an order. As a result, it is possible to educate the sales staff. Hereinafter, in the present specification, "sales process having a high possibility of receiving an order" also means "a sales process including an action to be taken after the present time" or "a sales process including an action having a low possibility of receiving an order". use.
予測システム100は、予測モデル生成装置10と、予測装置20を備えている。予測モデル生成装置10と、予測装置20は、ネットワークを介して接続されている。また、予測モデル生成装置10と、予測装置20は、一体の装置として形成されていてもよい。また、予測モデル生成装置10と予測装置20を構成する各部の機能は、互いに異なる装置で実現されてもよい。
The prediction system 100 includes a prediction model generation device 10 and a prediction device 20. The prediction model generation device 10 and the prediction device 20 are connected via a network. Further, the prediction model generation device 10 and the prediction device 20 may be formed as an integrated device. Further, the functions of the respective parts constituting the prediction model generation device 10 and the prediction device 20 may be realized by devices different from each other.
予測モデル生成装置10の構成について説明する。図2は、予測モデル生成装置10の構成を示す図である。予測モデル生成装置10は、取得部11と、記憶部12と、グラフデータ生成部13と、予測モデル生成部14と、予測モデル記憶部15と、予測モデル出力部16を備えている。予測モデル生成装置10は、既に行っている営業活動の活動履歴から、受注の可能性の高い予測時点以降の営業プロセスを予測する際に用いる予測モデルを生成する装置である。
The configuration of the prediction model generation device 10 will be described. FIG. 2 is a diagram showing a configuration of the prediction model generation device 10. The prediction model generation device 10 includes an acquisition unit 11, a storage unit 12, a graph data generation unit 13, a prediction model generation unit 14, a prediction model storage unit 15, and a prediction model output unit 16. The prediction model generation device 10 is a device that generates a prediction model used when predicting a sales process after a prediction time point at which there is a high possibility of receiving an order from the activity history of sales activities that have already been performed.
取得部11は、予測モデルの生成に用いるデータを取得する。取得部11は、予測モデルの生成に用いるデータとして、過去において営業活動の対象となった顧客の識別情報、顧客の属性および受注成否のデータを取得する。取得部11は、例えば、顧客の識別情報として顧客の社名のデータを取得し、顧客の属性としての顧客の業種のデータを取得する。
The acquisition unit 11 acquires the data used to generate the prediction model. The acquisition unit 11 acquires the identification information of the customer who has been the target of the sales activity in the past, the attribute of the customer, and the data of the success or failure of the order as the data used for generating the prediction model. For example, the acquisition unit 11 acquires the data of the customer's company name as the customer's identification information, and acquires the data of the customer's industry as the customer's attribute.
取得部11は、過去の営業活動について、顧客への最初のアプローチから受注の成否の結果の確定までの案件ごとの活動履歴のデータを営業データ管理サーバ300から取得する。活動履歴のデータは、案件ごとの営業活動で行われたアクションと、各アクションが実行された日時の情報を含む。すなわち、活動履歴のデータは、営業活動で行われた複数のアクションの時系列順序を示すデータである。
The acquisition unit 11 acquires the activity history data for each case from the first approach to the customer to the determination of the success / failure result of the order from the sales data management server 300 for the past sales activities. The activity history data includes information on the actions performed in the sales activities for each case and the date and time when each action was executed. That is, the activity history data is data showing the time-series order of a plurality of actions performed in the sales activity.
尚、以降、本明細書では、「活動履歴のデータ」を、「営業プロセス時系列データ」ともいう。
Hereinafter, in this specification, "activity history data" is also referred to as "sales process time series data".
記憶部12は、取得部11から入力された各データを記憶する。
The storage unit 12 stores each data input from the acquisition unit 11.
グラフデータ生成部13は、営業プロセス時系列データから、当該営業プロセス時系列データに関する営業プロセスを示すグラフをグラフ構造データとして生成する。グラフデータ生成部13により生成されるグラフは、営業活動における各アクションを示すノードと、当該営業活動における各アクション間の順序関係を示すエッジによって構成される。グラフ構造データは、営業活動における各アクションの時系列順序を示す。具体的には、グラフ構造データは、それを構成するエッジの長さにより、当該エッジの両端のノードが表すアクション間の順序及び時間間隔を示すことができる。グラフにおけるノード間にエッジがない場合、当該ノードが表すアクション間には順序関係がないことを示す。すなわち、グラフ構造を構成するエッジは、順序関係がないアクションを表すノード間には張られない。そのため、グラフ構造データは、営業プロセスを示したものとなる。営業活動におけるアクションには、具体的な商品の販売等の営業活動を開始していないマーケティング段階におけるアクションが含まれていてもよい。
The graph data generation unit 13 generates a graph showing the sales process related to the sales process time series data as graph structure data from the sales process time series data. The graph generated by the graph data generation unit 13 is composed of a node showing each action in the sales activity and an edge showing the order relationship between each action in the sales activity. The graph structure data shows the time series order of each action in the sales activity. Specifically, the graph structure data can indicate the order and time interval between actions represented by the nodes at both ends of the edge, depending on the length of the edge that constitutes the graph structure data. If there are no edges between the nodes in the graph, it indicates that there is no order relationship between the actions represented by the nodes. That is, the edges that make up the graph structure are not stretched between nodes that represent unordered actions. Therefore, the graph structure data shows the sales process. Actions in sales activities may include actions in the marketing stage that have not started sales activities such as sales of specific products.
図3は、グラフデータ生成部13が生成するグラフの例を模式的に示している。図3は、複数の案件の活動履歴から生成されたグラフを1つのグラフとして示している。図3の白の丸は、ノードとして設定されている営業プロセスにおける各アクションを示している。図3の黒の丸は、案件ごとの最初のアクション、すなわち、対象となる案件の営業活動において、最初に顧客と接する際のアクションを示している。また、対象となる案件の営業活動において、最初に顧客と接する際のアクションは、エントリポイントともいう。
FIG. 3 schematically shows an example of a graph generated by the graph data generation unit 13. FIG. 3 shows a graph generated from the activity history of a plurality of projects as one graph. The white circles in FIG. 3 indicate each action in the sales process set as a node. The black circle in FIG. 3 indicates the first action for each case, that is, the action for first contacting the customer in the sales activity of the target case. In addition, in the sales activities of the target project, the action when first contacting the customer is also called an entry point.
予測モデル生成部14は、グラフ構造データ、グラフを構成するノードに関する属性データおよび営業活動の成否を示すラベルを基に、受注の可能性の高い営業プロセスを予測するための予測モデルを生成する。予測モデル生成部14は、活動履歴から生成されたグラフ構造データと、顧客の業種を学習データ、営業活動の結果である受注の成否をラベルとして用いた機械学習によって予測モデルを生成する。予測モデル生成部14は、NN(Neural Network)やディープラーニング(深層学習)を用いた機械学習によって、グラフの特徴量を算出することで予測モデルを生成する。予測モデルは、教師あり学習、教師なし学習、半教師あり学習または強化学習など、どのような機械学習手法を用いて生成されてもよい。
The prediction model generation unit 14 generates a prediction model for predicting a sales process with a high possibility of receiving an order based on graph structure data, attribute data related to nodes constituting the graph, and a label indicating the success or failure of sales activities. The prediction model generation unit 14 generates a prediction model by machine learning using the graph structure data generated from the activity history, the learning data of the customer's industry, and the success or failure of the order as a result of the sales activity as a label. The prediction model generation unit 14 generates a prediction model by calculating the feature amount of the graph by machine learning using NN (Neural Network) or deep learning (deep learning). The predictive model may be generated using any machine learning technique, such as supervised learning, unsupervised learning, semi-supervised learning or reinforcement learning.
予測モデル生成部14は、例えば、STAR法によってグラフの特徴量を算出することで予測モデルを生成する。STAR法は、複数の時点におけるグラフ構造データを入力として、グラフの特徴量を算出することで予測モデルを生成する。STAR法の詳細は、Dongkuan Xu et al., " Spatio-Temporal Attentive RNN for Node Classification in Temporal Attributed Graphs", Proceedings of the Twenty-Eighth International Joint Conference on Artificial Intelligence (IJCAI-19), [2020年2月27日検索] Internet <URL: https://www.ijcai.org/Proceedings/2019/0548.pdf>に記載されている。
The prediction model generation unit 14 generates a prediction model by calculating the feature amount of the graph by, for example, the STAR method. In the STAR method, a prediction model is generated by calculating the feature amount of the graph by inputting the graph structure data at a plurality of time points. For details on the STAR method, see Dongkuan Xu et al., "Spatio-Temporal Attentive RNN for Node Classification in Temporal Attributed Graphs", Proceedings of the Twenty-Eighth International Joint Conference on Artificial Intelligence Search on 27th] Internet <URL: https://www.ijcai.org/Proceedings/2019/0548.pdf>.
予測モデル生成部14は、TGNet法によってグラフの特徴量を算出することで予測モデルを生成してもよい。TGNet法は、動的データおよび静的データと、ラベルデータを入力として機械学習を行い、学習済みモデルを生成する。TGNet法の詳細は、Qi Song, et al., "TGNet: Learning to Rank Nodes in Temporal Graphs", Proceedings of the 27th ACM International Conference on Information and Knowledge Management, p.97-106に記載されている。
The prediction model generation unit 14 may generate a prediction model by calculating the feature amount of the graph by the TGNet method. In the TGNet method, machine learning is performed by inputting dynamic data, static data, and label data, and a trained model is generated. Details of the TGNet method are described in Qi Song, et al., "TGNet: Learning to Rank Nodes in Temporal Graphs", Proceedings of the 27th ACM International Conference on Information and Knowledge Management, p.97-106.
予測モデル生成部14は、例えば、Netwalk法などの特徴量を抽出する手法を用いて特徴量を抽出し、InerHAT法などの特徴量の分析を行う手法を組み合わせることで予測モデルを生成してもよい。Netwalk法の詳細は、Wenchow Yu, et al., "NetWalk: A Flexible Deep Embedding Approach for Anomaly Detection in Dynamic Networks", KDD 2018, p.2672-2681に記載されている。また、InerHAT法の詳細は、Zeyu Li, et al., "Interpretable Click-Through Rate Prediction through Hierarchical Attention", WSDM 2020: The Thirteenth ACM International Conference on Web Search and Data Miningに記載されている。また、InerHAT法に代えてGradient Boosting法などの予測技術を用いてもよい。予測モデル生成部14は、グラフデータを解析し、特徴パターンを抽出する手法であれば、他の手法を用いて予測モデルを生成してもよい。
The prediction model generation unit 14 may generate a prediction model by extracting the feature amount using, for example, a method for extracting the feature amount such as the Netwalk method, and combining a method for analyzing the feature amount such as the InerHAT method. good. Details of the Network method are described in Wenchow Yu, et al., "NetWalk: A Flexible Deep Embedding Approach for Anomaly Detection in Dynamic Networks", KDD 2018, p.2672-2681. The details of the InerHAT method are described in Zeyu Li, et al., "Interpretable Click-Through Rate Prediction through Hierarchical Attention", WSDM 2020: The Thirteenth ACM International Conference on Web Search and Data Mining. Further, instead of the InerHAT method, a prediction technique such as the Grandient Boosting method may be used. The prediction model generation unit 14 may generate a prediction model by using another method as long as it is a method of analyzing graph data and extracting a feature pattern.
予測モデル記憶部15は、予測モデル生成部14が生成した予測モデルを記憶する。
The prediction model storage unit 15 stores the prediction model generated by the prediction model generation unit 14.
予測モデル出力部16は、予測モデル記憶部15に記憶されている予測モデルを予測装置20に出力する。
The prediction model output unit 16 outputs the prediction model stored in the prediction model storage unit 15 to the prediction device 20.
取得部11、グラフデータ生成部13、予測モデル生成部14および予測モデル出力部16における各処理は、CPU(Central Processing Unit)上でコンピュータプログラムを実行することで行われる。また、CPUにGPU(Graphics Processing Unit)が組み合わされていてもよい。
Each process in the acquisition unit 11, the graph data generation unit 13, the prediction model generation unit 14, and the prediction model output unit 16 is performed by executing a computer program on the CPU (Central Processing Unit). Further, a GPU (Graphics Processing Unit) may be combined with the CPU.
記憶部12および予測モデル記憶部15は、例えば、ハードディスクドライブを用いて構成されている。記憶部12および予測モデル記憶部15は、不揮発性の半導体記憶装置または複数の種類の記憶装置の組み合わせによって構成されていてもよい。
The storage unit 12 and the prediction model storage unit 15 are configured by using, for example, a hard disk drive. The storage unit 12 and the prediction model storage unit 15 may be composed of a non-volatile semiconductor storage device or a combination of a plurality of types of storage devices.
予測装置20の構成について説明する。図4は、予測装置20の構成を示す図である。予測装置20は、取得部21と、予測モデル記憶部22と、グラフ生成部23と、予測部24と、予測理由生成部25と、表示制御部26を備えている。
The configuration of the prediction device 20 will be described. FIG. 4 is a diagram showing the configuration of the prediction device 20. The prediction device 20 includes an acquisition unit 21, a prediction model storage unit 22, a graph generation unit 23, a prediction unit 24, a prediction reason generation unit 25, and a display control unit 26.
取得部21は、受注の可能性の高い営業プロセスを、予測モデルを用いて予測する際の入力データを取得する。取得部21は、受注の可能性の高い営業プロセスの予測に用いる入力データとして、予測対象の営業活動のうち、現時点、すなわち予測を行うまでに実行されたアクションについての活動履歴のデータを取得する。また、取得部21は、営業対象となる顧客の業種を顧客属性データとして取得する。尚、顧客属性データは、営業対象となる顧客の属性に関するデータであり、営業対象となる顧客の業種に限定されない。例えば、顧客属性データは、顧客の業種、売上高、年間利益、従業員数、購入実績、営業所または工場の所在地、構成員に関する情報、居住地、などに関するデータであるが、これらに限定されず、顧客の属性に関するデータであればどのようなデータでもよい。また、顧客属性データは、上述した情報の少なくとも一つを含むデータであってもよい。
The acquisition unit 21 acquires input data when predicting a sales process with a high possibility of receiving an order using a prediction model. As input data used for forecasting a sales process with a high possibility of receiving an order, the acquisition unit 21 acquires activity history data of the current time, that is, the action executed until the forecast is made, among the forecasted sales activities. .. In addition, the acquisition unit 21 acquires the type of business of the customer to be sold as customer attribute data. The customer attribute data is data related to the attributes of the customer to be sold, and is not limited to the type of business of the customer to be sold. For example, customer attribute data includes, but is not limited to, customer industry, sales, annual profit, number of employees, purchase record, location of sales office or factory, information about members, place of residence, and so on. , Any data related to customer attributes may be used. Further, the customer attribute data may be data including at least one of the above-mentioned information.
予測モデル記憶部22は、予測モデル生成装置10が生成した予測モデルを記憶している。
The prediction model storage unit 22 stores the prediction model generated by the prediction model generation device 10.
グラフ生成部23は、現時点までの活動履歴のデータからグラフ構造データを生成する。活動履歴から生成されるグラフ構造データは、営業プロセスにおける各アクションを示すノードと、連続した2つのアクション間接続することで営業プロセスにおける各アクションの時系列の順序を示すエッジによって構成されている。
The graph generation unit 23 generates graph structure data from the activity history data up to the present time. The graph structure data generated from the activity history is composed of a node showing each action in the sales process and an edge showing the time series order of each action in the sales process by connecting between two consecutive actions.
予測部24は、予測モデル記憶部22に記憶されている予測モデルに基づいて、入力データから受注の可能性の高い営業プロセスを予測する。予測部24は、営業対象の顧客に対してそれまでに行った営業活動の活動履歴に基づくグラフ構造データと、グラフ構造データのノードに対応する属性データの営業対象の顧客の業種を入力とし、予測モデルを用いて、受注の可能性の高い営業プロセスを予測する。受注の可能性の高い営業プロセスとは、受注の可能性を高めることができる現時点以降のアクションと各アクションの順序を示す情報のことをいう。
The forecasting unit 24 predicts a sales process with a high possibility of receiving an order from the input data based on the forecasting model stored in the forecasting model storage unit 22. The forecasting unit 24 inputs the graph structure data based on the activity history of the sales activities performed so far for the sales target customer and the industry of the sales target customer of the attribute data corresponding to the node of the graph structure data. Use a forecasting model to forecast sales processes that are likely to receive orders. A sales process with a high probability of receiving an order is information indicating the actions after the present time and the order of each action that can increase the possibility of receiving an order.
予測理由生成部25は、予測部24による予測の理由を生成する。
The prediction reason generation unit 25 generates the reason for the prediction by the prediction unit 24.
表示制御部26は、予測の理由が付加された予測結果を表示するように予測装置20が有する表示部(不図示)または予測装置20の外部にある表示装置を制御する。また、表示制御部26は、予測結果を利用する利用者の端末に予測の理由を付加した予測結果を送信することで表示装置への表示を制御してもよいが、表示制御方法はこれに限定されない。これにより、本願発明は、営業担当者に対して現時点以降のアクションに加えてその理由を提示することにより、営業活動をより好適に支援することができる。
The display control unit 26 controls the display unit (not shown) included in the prediction device 20 or the display device outside the prediction device 20 so as to display the prediction result to which the reason for the prediction is added. Further, the display control unit 26 may control the display on the display device by transmitting the prediction result with the reason for the prediction added to the terminal of the user who uses the prediction result, but the display control method is based on this. Not limited. Thereby, the present invention can more preferably support the sales activity by presenting the reason to the sales person in addition to the action after the present time.
尚、表示制御部26は、予測結果だけを表示装置に表示するように当該表示装置を制御してもよい。予測結果を表示だけでも、営業担当者に対して現時点以降のアクションに加えてその理由を提示することにより、営業活動を好適に支援することができる。
Note that the display control unit 26 may control the display device so that only the prediction result is displayed on the display device. Even by displaying the forecast result, it is possible to appropriately support the sales activity by presenting the reason to the sales person in addition to the action after the present time.
取得部21、グラフ生成部23、予測部24、予測理由生成部25および表示制御部26における各処理は、CPU上でコンピュータプログラムを実行することで行われる。
Each process in the acquisition unit 21, the graph generation unit 23, the prediction unit 24, the prediction reason generation unit 25, and the display control unit 26 is performed by executing a computer program on the CPU.
予測モデル記憶部22は、例えば、ハードディスクドライブを用いて構成されている。予測モデル記憶部22は、不揮発性の半導体記憶装置または複数の種類の記憶装置の組み合わせによって構成されていてもよい。
The prediction model storage unit 22 is configured by using, for example, a hard disk drive. The prediction model storage unit 22 may be composed of a non-volatile semiconductor storage device or a combination of a plurality of types of storage devices.
図1において、営業データ管理サーバ300は、営業活動ごとの活動履歴のデータを管理している。活動履歴のデータは、例えば、営業担当者によって、端末装置を介して入力されたデータが用いられる。活動履歴のデータは、営業日誌から抽出されたデータであってもよい。例えば、営業データ管理サーバ300は、営業担当者が、「3月2日にX社にメールで商品Aを紹介」と記載した営業日誌から、日時である「3月2日」と、営業活動の対象である「X社」と、営業活動におけるアクションを示す「メール」を活動履歴のデータとして抽出してもよい。営業データ管理サーバ300は、活動履歴のデータを予測モデル生成装置10に送信する。
In FIG. 1, the sales data management server 300 manages activity history data for each sales activity. As the activity history data, for example, data input by a sales person via a terminal device is used. The activity history data may be data extracted from the business diary. For example, the sales data management server 300 has a sales activity of "March 2", which is the date and time, from the business diary in which the sales person describes "Introduce product A to company X by e-mail on March 2". "Company X", which is the target of the above, and "email" indicating the action in the sales activity may be extracted as activity history data. The business data management server 300 transmits the activity history data to the prediction model generation device 10.
<学習フェーズ>
本実施形態の営業支援システムの動作について説明する。始めに、受注の可能性の高い営業プロセスを予測する際に用いる予測モデルを生成する際の動作について説明する。図5は、予測モデル生成装置10が受注の可能性の高い営業プロセスを予測するための予測モデルを生成する際の動作フローを示す図である。 <Learning phase>
The operation of the sales support system of this embodiment will be described. First, the operation when generating a forecast model used when forecasting a sales process with a high possibility of receiving an order will be described. FIG. 5 is a diagram showing an operation flow when the predictionmodel generation device 10 generates a prediction model for predicting a sales process with a high possibility of receiving an order.
本実施形態の営業支援システムの動作について説明する。始めに、受注の可能性の高い営業プロセスを予測する際に用いる予測モデルを生成する際の動作について説明する。図5は、予測モデル生成装置10が受注の可能性の高い営業プロセスを予測するための予測モデルを生成する際の動作フローを示す図である。 <Learning phase>
The operation of the sales support system of this embodiment will be described. First, the operation when generating a forecast model used when forecasting a sales process with a high possibility of receiving an order will be described. FIG. 5 is a diagram showing an operation flow when the prediction
取得部11は、属性データとして用いる過去に行われた複数の営業活動において対象となった顧客の業種と、営業活動ごとの受注の成否のデータを取得する(ステップS11)。受注の成否のデータは、当該営業活動ごとの受注が成功したかまたは失敗したかを示す情報である。取得部11による取得される各データは、作業者によって入力されてもよく、各データを有する他のサーバから取得されてもよい。取得部11は、営業データ管理サーバ300から営業活動ごとの受注の有無の実績を示す情報を取得してもよい。各データを取得すると、取得部11は、取得した各データを記憶部12に記憶する。
The acquisition unit 11 acquires the customer's industry that was the target of the plurality of sales activities performed in the past as attribute data, and the success / failure data of the order for each sales activity (step S11). The success / failure data of the order is information indicating whether the order for each sales activity is successful or unsuccessful. Each data acquired by the acquisition unit 11 may be input by an operator, or may be acquired from another server having each data. The acquisition unit 11 may acquire information indicating the actual result of whether or not an order has been received for each sales activity from the sales data management server 300. When each data is acquired, the acquisition unit 11 stores each acquired data in the storage unit 12.
図6は、属性データとして用いる顧客の情報の一例を示す図である。図6の例では、属性データは、顧客の社名と業種を含む。また、図7は、ラベルとして用いる受注成否のデータの一例を示す図である。図7の例では、受注成否データは、活動履歴の識別情報である活動履歴番号と、顧客の社名と、営業を行った商材と、受注成否の結果を含む。
FIG. 6 is a diagram showing an example of customer information used as attribute data. In the example of FIG. 6, the attribute data includes the customer's company name and industry. Further, FIG. 7 is a diagram showing an example of order success / failure data used as a label. In the example of FIG. 7, the order success / failure data includes the activity history number which is the identification information of the activity history, the company name of the customer, the product which has been operated, and the result of the order success / failure.
取得部11は、営業データ管理サーバ300から営業活動ごとの活動履歴のデータを営業プロセス時系列データとして取得する(ステップS12)。営業プロセス時系列データを取得すると、取得部11は、取得した営業プロセス時系列データを記憶部12に記憶する。
The acquisition unit 11 acquires activity history data for each sales activity from the sales data management server 300 as sales process time-series data (step S12). When the sales process time series data is acquired, the acquisition unit 11 stores the acquired sales process time series data in the storage unit 12.
図8は、営業プロセス時系列データの一例を示す図である。図8の営業プロセス時系列データでは、活動履歴の識別情報である活動履歴番号と、営業活動において各アクションを行った日付が紐付いている。図8の活動履歴番号は、図7の活動履歴番号と対応している。
FIG. 8 is a diagram showing an example of sales process time series data. In the sales process time series data of FIG. 8, the activity history number, which is the identification information of the activity history, and the date when each action is performed in the sales activity are linked. The activity history number in FIG. 8 corresponds to the activity history number in FIG. 7.
記憶部12に営業プロセス時系列データが記憶されると、グラフデータ生成部13は、営業プロセス時系列データを基にグラフ構造データを生成する(ステップS13)。グラフ構造データを生成すると、グラフデータ生成部13は、生成したグラフ構造データを予測モデル生成部14に送る。
When the sales process time series data is stored in the storage unit 12, the graph data generation unit 13 generates graph structure data based on the sales process time series data (step S13). When the graph structure data is generated, the graph data generation unit 13 sends the generated graph structure data to the prediction model generation unit 14.
グラフ構造データが入力されると、予測モデル生成部14は、予測モデルの生成に用いる各データを記憶部12から読み出す。各データを読み出すと、複数の活動履歴に基づいたグラフ構造データと、顧客の属性データである複数の顧客それぞれの業種を入力データとし、営業活動ごとの受注の成否をラベルとして用いた、機械学習を行い受注の可能性が高い営業プロセスを予測するための予測モデルを生成する(ステップS14)。
When the graph structure data is input, the prediction model generation unit 14 reads out each data used for generating the prediction model from the storage unit 12. When each data is read out, machine learning that uses graph structure data based on multiple activity histories and the industry of each of multiple customers, which is customer attribute data, as input data, and uses the success or failure of orders for each sales activity as labels. To generate a prediction model for predicting a sales process with a high possibility of receiving an order (step S14).
予測モデルを生成すると、予測モデル生成部14は、生成した予測モデルを学習済みモデルとして予測モデル記憶部15に記憶する。予測モデルが記憶されると、予測モデル出力部16は、予測モデルを予測装置20に出力する(ステップS15)。予測装置20に入力された予測モデルは、予測モデル記憶部22に記憶される。
When the prediction model is generated, the prediction model generation unit 14 stores the generated prediction model as a learned model in the prediction model storage unit 15. When the prediction model is stored, the prediction model output unit 16 outputs the prediction model to the prediction device 20 (step S15). The prediction model input to the prediction device 20 is stored in the prediction model storage unit 22.
予測モデル生成装置10が生成した予測モデルは、再学習によって更新されてもよい。例えば、予測モデル生成部14は、予測結果に基づいて行った活動履歴から生成したグラフのデータと、顧客の業種を入力データ、受注の獲得の有無を当該入力データのラベルとして再学習を行って、予測モデル記憶部15の予測モデルを更新する。そのように、予測結果を基に再学習を行うことで、学習済みモデルによる予測精度が向上する。また、予測モデル生成部14は、当該入力データおよびラベルを用いて新たに予測モデルを生成してもよい。
The prediction model generated by the prediction model generation device 10 may be updated by re-learning. For example, the prediction model generation unit 14 relearns the graph data generated from the activity history performed based on the prediction result, the customer's industry as input data, and the presence or absence of order acquisition as the label of the input data. , The prediction model of the prediction model storage unit 15 is updated. By performing re-learning based on the prediction result in this way, the prediction accuracy by the trained model is improved. In addition, the prediction model generation unit 14 may newly generate a prediction model using the input data and the label.
<予測フェーズ>
次に予測装置20において、受注の可能性が高い営業プロセスを予測する際の動作について説明する。図9は、予測装置20において、受注の可能性が高い営業プロセスを予測モデルを用いて予測する際の動作フローを示す図である。 <Forecast phase>
Next, the operation of theprediction device 20 when predicting a sales process with a high possibility of receiving an order will be described. FIG. 9 is a diagram showing an operation flow when predicting a sales process with a high possibility of receiving an order by using a prediction model in the prediction device 20.
次に予測装置20において、受注の可能性が高い営業プロセスを予測する際の動作について説明する。図9は、予測装置20において、受注の可能性が高い営業プロセスを予測モデルを用いて予測する際の動作フローを示す図である。 <Forecast phase>
Next, the operation of the
取得部21は、予測の対象となる営業活動の現時点までに行われた活動履歴を示す営業プロセス時系列データと、営業活動を行っている顧客の業種を含む顧客属性データを取得する(ステップS21)。取得部21が営業プロセス時系列データと顧客属性データを取得すると、グラフ生成部23は、現時点までの営業プロセス時系列データからグラフ構造データを生成する(ステップS22)。グラフ構造データを生成すると、グラフ生成部23は、生成したグラフ構造データと、予測対象の顧客の業種のデータを予測部24に送る。活動履歴のグラフ構造データを受け取ると、予測部24は、予測モデル記憶部22に記憶されている予測モデルを用いて、活動履歴のグラフ構造データと、属性データである対象の顧客の業種を入力として、受注の可能性が高い営業プロセスと、受注の成功確率を予測する(ステップS23)。受注の可能性が高い営業プロセスを予測すると、予測部24は、受注の可能性が高い営業プロセスのデータと、受注の成功確率を予測結果として予測理由生成部25に送る。成功確率は、現時点までに行ったアクションと各候補との類似度と、各候補における受注実績に基づいて算出される。予測結果には、受注の可能性が高い営業プロセスのデータと、受注獲得への寄与度が他のエッジよりも高いエッジの情報と、成功確率の情報が含まれている。
The acquisition unit 21 acquires the sales process time-series data showing the activity history of the sales activity to be predicted up to the present time and the customer attribute data including the type of business of the customer who is performing the sales activity (step S21). ). When the acquisition unit 21 acquires the sales process time series data and the customer attribute data, the graph generation unit 23 generates graph structure data from the sales process time series data up to the present time (step S22). When the graph structure data is generated, the graph generation unit 23 sends the generated graph structure data and the data of the industry of the customer to be predicted to the prediction unit 24. Upon receiving the graph structure data of the activity history, the prediction unit 24 inputs the graph structure data of the activity history and the industry of the target customer, which is the attribute data, using the prediction model stored in the prediction model storage unit 22. As a result, the sales process with a high possibility of receiving an order and the success probability of the order are predicted (step S23). When the sales process with a high possibility of receiving an order is predicted, the prediction unit 24 sends the data of the sales process with a high possibility of receiving an order and the success probability of the order as a prediction result to the prediction reason generation unit 25. The success probability is calculated based on the degree of similarity between the actions taken so far and each candidate, and the order record of each candidate. The forecast results include data on sales processes that are likely to receive orders, information on edges that contribute more to order acquisition than other edges, and information on success probabilities.
予測結果を受け取ると、予測理由生成部25は、予測の理由を抽出する(ステップS24)。予測の理由は、予測部24による予測の理由を利用者に提示するための情報である。例えば、予測理由生成部25は、予測結果に含まれる営業プロセスのデータから受注成功への寄与度の高いエッジを抽出し、当該抽出したエッジの両端のノードに対応するアクションが受注に重要なアクションであるとして、それを含むことを予測の理由として提示する。
Upon receiving the prediction result, the prediction reason generation unit 25 extracts the reason for the prediction (step S24). The reason for the prediction is information for presenting the reason for the prediction by the prediction unit 24 to the user. For example, the prediction reason generation unit 25 extracts an edge having a high contribution to the success of an order from the sales process data included in the prediction result, and the action corresponding to the nodes at both ends of the extracted edge is an important action for the order. If so, the inclusion of it is presented as the reason for the prediction.
予測の理由を抽出すると、予測理由生成部25は、予測の理由を表示制御部26に出力する。
When the reason for prediction is extracted, the reason for prediction generation unit 25 outputs the reason for prediction to the display control unit 26.
予測結果と予測の理由を受け取ると、表示制御部26は、表示装置を制御して予測結果と予測の理由を当該表示装置に表示する(ステップS25)。表示制御部26は、予測結果を利用する利用者の端末の表示装置に予測結果と予測の理由が表示されるように、利用者の端末への予測結果と予測の理由のデータの送信を制御してもよい。
Upon receiving the prediction result and the reason for the prediction, the display control unit 26 controls the display device and displays the prediction result and the reason for the prediction on the display device (step S25). The display control unit 26 controls transmission of data of the prediction result and the reason for the prediction to the user's terminal so that the prediction result and the reason for the prediction are displayed on the display device of the user's terminal using the prediction result. You may.
図10は、予測結果の表示データの一例を示す図である。図10の予測結果の表示データは、予測時点までの活動履歴を示す実行済みアクション、今後、行うべきアクションとその順序を示す推奨プロセスの候補、成功確率および各推奨プロセスの候補が選択された理由によって構成されている。成功確率は、現時点までに行ったアクションと各候補との類似度と、各候補における受注実績に基づいて算出され、受注獲得の可能性を示す指標である。また、図10は、予測結果として、受注可能性の高い営業プロセスの候補が複数、示されている例を示している。
FIG. 10 is a diagram showing an example of display data of the prediction result. The display data of the prediction result in FIG. 10 shows the executed actions showing the activity history up to the prediction time, the recommended process candidates showing the actions to be performed in the future and their order, the success probability, and the reason why each recommended process candidate was selected. It is composed of. The success probability is an index that is calculated based on the degree of similarity between the actions taken so far and each candidate and the order record of each candidate, and indicates the possibility of winning an order. Further, FIG. 10 shows an example in which a plurality of candidates for a sales process having a high possibility of receiving an order are shown as a prediction result.
図10の最上段の候補では、受注の可能性が高いとの予測の理由として、同業者で受注実績が高いこと、展示会から懇親会の順序で行うことが受注成功への寄与が大きいことが示されている。このように、予測結果として複数の営業プロセスの候補と、受注可能性が高いと予測した際の理由を示すことで、予測結果の利用者は、営業対象の顧客に適用する営業プロセスを、予測理由を参照して選択することができる。また、図10では、受注可能性の高い営業プロセスとして複数の候補が示されている。例えば、最上段に示された営業プロセスを第1の予測結果とすると、その下段に第2の予測結果として第1の予測結果の次に受注の成功確率が高い営業プロセスが示される。
In the top candidate in Fig. 10, the reasons for predicting that there is a high possibility of receiving an order are that the order record is high in the same industry and that the order from the exhibition to the social gathering contributes greatly to the success of the order. It is shown. In this way, by showing multiple sales process candidates as the prediction result and the reason for predicting that the possibility of receiving an order is high, the user of the prediction result predicts the sales process to be applied to the customer to be sold. You can select by referring to the reason. Further, in FIG. 10, a plurality of candidates are shown as sales processes having a high possibility of receiving an order. For example, if the sales process shown in the uppermost row is the first forecast result, the second forecast result is the sales process having the next highest probability of success of the order after the first forecast result.
予測の理由には、予測に用いた属性データの名称がそのまま用いられてもよい。予測結果に対して、例えば、顧客の業種が製造業であることの寄与が大きいとき、予測理由生成部25は、例えば、顧客の業種が製造業であることを予測の理由として抽出してもよい。また、予測理由生成部25は、あらかじめ定義されたテンプレートを基に予測理由を提示してもよい。予測理由生成部25は、例えば、「XXのお客様に適している営業プロセスであるため」などの予測理由のテンプレートを保持し、業種が「製造業」であったときに受注の成功確率が高いときに「製造業のお客様に適している営業プロセスであるため」という予測の理由を当該テンプレートから生成してもよい。
For the reason for prediction, the name of the attribute data used for prediction may be used as it is. For example, when the contribution of the customer's industry to the manufacturing industry is large with respect to the prediction result, the prediction reason generation unit 25 may extract, for example, that the customer's industry is the manufacturing industry as the reason for the prediction. good. Further, the prediction reason generation unit 25 may present the prediction reason based on the template defined in advance. The prediction reason generation unit 25 holds a template for prediction reasons such as "because it is a sales process suitable for XX customers", and the success probability of receiving an order is high when the industry is "manufacturing". Sometimes the reason for the prediction "because it is a sales process suitable for manufacturing customers" may be generated from the template.
図10のように予測結果を表示する際に、表示画面上でノードにマウスカーソルを置いたとき(合わせたとき)にのみノードが示すアクションが表示(ポップアップ表示)されるようにしてもよい。また、表示画面上のノードの部分のクリックまたはタップが行われた際に、ノードが示すアクションが表示されるようにしてもよい。また、受注可能性の高い営業プロセスまたは受注成功への寄与度の高いアクション部分が画面上において強調して表示されるようにしてもよい。強調する表示は、例えば、太線太字、色、フラッシュまたはアニメーション表示における動きの大小によって行われる。これにより、ユーザに対する視認性を向上させることができる。
When displaying the prediction result as shown in FIG. 10, the action indicated by the node may be displayed (pop-up display) only when the mouse cursor is placed on the node on the display screen (when the mouse cursor is placed). Further, when the part of the node on the display screen is clicked or tapped, the action indicated by the node may be displayed. Further, the sales process having a high possibility of receiving an order or the action part having a high contribution to the success of an order may be highlighted on the screen. The highlighting is done by, for example, bold bold, color, flash or magnitude of movement in the animated display. As a result, visibility to the user can be improved.
上記の説明では、予測モデルの生成の際に用いるグラフ構造データのエッジは、アクションの順序のみを示しているが、エッジにアクション間の時間の長さが含まれていてもよい。すなわち、グラフ生成部23は、エッジにアクション間の時間の長さの情報を含むグラフ構造データを生成することができる。このように、エッジにアクション間の時間の長さの情報を含むグラフ構造データを用いて生成した予測モデルを用いて予測を行うことで、各アクションを行う適切なタイミングについても予測することが可能になる。また、図10のように予測結果を表示する際に、表示画面上でエッジにカーソルを置くと、エッジが示す時間間隔、すなわち、各アクション間の時間間隔が表示されるようにしてもよい。また、表示画面上において、エッジの部分のクリックまたはタップが行われた際に、エッジが示す時間間隔が表示されるようにしてもよい。これにより、営業担当者などのユーザに対して、予測された各アクションを行う適切なタイミングを提示することにより、営業活動の成功確率の向上や効率化を図ることができる。
In the above explanation, the edges of the graph structure data used when generating the prediction model show only the order of actions, but the edges may include the length of time between actions. That is, the graph generation unit 23 can generate graph structure data including information on the length of time between actions at the edge. In this way, by making a prediction using a prediction model generated using graph structure data that includes information on the length of time between actions at the edge, it is possible to predict the appropriate timing for each action. become. Further, when the prediction result is displayed as shown in FIG. 10, when the cursor is placed on the edge on the display screen, the time interval indicated by the edge, that is, the time interval between each action may be displayed. Further, on the display screen, when the edge portion is clicked or tapped, the time interval indicated by the edge may be displayed. As a result, it is possible to improve the success probability and efficiency of sales activities by presenting an appropriate timing for performing each predicted action to a user such as a sales person.
上記の説明では、予測モデルの生成を行う際に、属性データとして営業活動を行う対象の顧客の業種の情報を入力としているが、顧客の属性データは、入力データとして用いられなくてもよい。予測モデルの生成の際に顧客の属性データである顧客の業種を入力として用いない場合には、受注可能性の高い営業プロセスの予測は、予測時点までの活動履歴と、過去の営業活動において受注の成功確率が高い営業プロセスとの類似性のみによって行われる。
In the above explanation, when the prediction model is generated, the information of the industry of the customer who conducts the sales activity is input as the attribute data, but the attribute data of the customer does not have to be used as the input data. If the customer's industry, which is the customer's attribute data, is not used as an input when generating the forecast model, the forecast of the sales process with a high possibility of receiving an order is based on the activity history up to the time of the forecast and the order received in the past sales activities. It is done only by similarity with the sales process that has a high probability of success.
また、予測モデルの生成および予測を行う際の顧客属性データには、顧客の業種の情報に代えて、顧客の業種、売上高、年間利益、従業員数、購入実績、営業所または工場の所在地、家族構成、居住地のうち1つまたは複数の属性の情報が入力データとして用いられてもよい。また、上記の顧客属性データは、顧客の業種を示す顧客属性データに加えて用いられてもよい。
In addition, the customer attribute data when generating and forecasting the forecast model includes the customer's industry, sales, annual profit, number of employees, purchase record, location of sales office or factory, instead of information on the customer's industry. Information on one or more attributes of family structure and place of residence may be used as input data. Further, the above customer attribute data may be used in addition to the customer attribute data indicating the customer's industry.
予測モデルの生成および予測を行う際の属性データには、顧客の属性データに代えて、営業対象の商品もしくはサービスの分類、営業対象の商品もしくはサービス、営業対象の顧客の売上高、営業担当者、営業担当者の役職、または営業担当者の階級などの営業活動の対象となる企業または営業担当者のうち1つまたは複数の属性の情報が入力データとして用いられてもよい。また、上記の属性データは、顧客の属性データに加えて用いられてもよい。また、これらの営業活動の対象となる顧客または営業担当者の属性データを予測モデルの生成に用いた場合には、予測段階においても属性データとして入力に用いることができる。
The attribute data when generating and forecasting the forecast model includes the classification of the product or service to be sold, the product or service to be sold, the sales of the customer to be sold, and the sales person, instead of the attribute data of the customer. , The position of the sales person, or the information of one or more attributes of the company or the sales person who is the target of the sales activity such as the class of the sales person may be used as the input data. Further, the above attribute data may be used in addition to the customer attribute data. Further, when the attribute data of the customer or the sales person who is the target of these sales activities is used for generating the prediction model, it can be used for input as the attribute data even in the prediction stage.
予測の理由には、営業プロセスに含まれる2つのアクションの順番に代えて、顧客の業種、売上高、年間利益、従業員数、購入実績、営業対象の商品もしくはサービスの分類、営業対象の商品もしくはサービス、営業対象の顧客の売上高、営業担当者、営業担当者の役職のうち、少なくとも一つの項目が含まれていてもよい。
The reason for the forecast is that instead of the order of the two actions included in the sales process, the customer's industry, sales, annual profit, number of employees, purchase record, classification of products or services to be sold, products to be sold or At least one item may be included among the service, the sales of the customer to be sold, the sales person, and the position of the sales person.
本実施形態の営業支援システムは、予測モデル生成装置10において活動履歴のデータを基にグラフ構造データを生成し、時系列のデータであるグラフ構造データと、属性データである顧客の業種を入力として機械学習によって予測モデルを生成している。また、本実施形態の営業支援システムは、生成した予測モデルを基に予測装置20において現在、実行中の営業活動の現時点までの活動履歴から、受注の可能性の高い営業プロセスを予測している。本実施形態の営業支援システムは、活動履歴のグラフ構造データを基に生成された予測モデルを用いて予測を行うことで、現在、行っている営業活動の履歴との類似度から受注の可能性の高い営業プロセスを予測することができる。現在、行っている営業活動の履歴との類似度から受注の可能性の高い営業プロセスを予測することで、本実施形態の営業支援システムは、現時点以降において受注のために行うべき今後のアクションの候補を提示することができる。そのため、本実施形態の営業支援システムは、営業活動において受注の可能性を高めるために必要な現時点以降におけるアクションを予測することができる。その結果、本実施形態の営業支援システムは、営業活動の成功確率、売上の向上、営業活動の効率化など、営業活動を好適に支援することができる。
The sales support system of the present embodiment generates graph structure data based on the activity history data in the prediction model generation device 10, and inputs the graph structure data which is time series data and the customer's industry which is attribute data. Predictive models are generated by machine learning. In addition, the sales support system of the present embodiment predicts a sales process with a high possibility of receiving an order from the activity history of the currently executing sales activity in the prediction device 20 based on the generated prediction model. .. The sales support system of the present embodiment makes a prediction using a prediction model generated based on the graph structure data of the activity history, and the possibility of receiving an order from the degree of similarity with the history of the sales activity currently being performed. Can predict high sales processes. By predicting the sales process that is likely to receive an order from the similarity with the history of the current sales activity, the sales support system of this embodiment can be used for future actions to be taken for the order from the present time onward. Candidates can be presented. Therefore, the sales support system of the present embodiment can predict the actions after the present time necessary to increase the possibility of receiving an order in the sales activity. As a result, the sales support system of the present embodiment can suitably support sales activities such as success probability of sales activities, improvement of sales, and efficiency of sales activities.
(第2の実施形態)
本発明の第2の実施形態について図を参照して詳細に説明する。図11は、本実施形態の営業支援システムの構成の概要を示す図である。本実施形態の営業支援システムは、取得部31と、予測部32を備えている。尚、本実施形態の営業支援システムでは、取得部31と予測部32が単一の装置に備えられてもよいし、それぞれが異なる装置に備えられてもよい。 (Second Embodiment)
A second embodiment of the present invention will be described in detail with reference to the drawings. FIG. 11 is a diagram showing an outline of the configuration of the sales support system of the present embodiment. The sales support system of this embodiment includes anacquisition unit 31 and a prediction unit 32. In the sales support system of the present embodiment, the acquisition unit 31 and the prediction unit 32 may be provided in a single device, or may be provided in different devices.
本発明の第2の実施形態について図を参照して詳細に説明する。図11は、本実施形態の営業支援システムの構成の概要を示す図である。本実施形態の営業支援システムは、取得部31と、予測部32を備えている。尚、本実施形態の営業支援システムでは、取得部31と予測部32が単一の装置に備えられてもよいし、それぞれが異なる装置に備えられてもよい。 (Second Embodiment)
A second embodiment of the present invention will be described in detail with reference to the drawings. FIG. 11 is a diagram showing an outline of the configuration of the sales support system of the present embodiment. The sales support system of this embodiment includes an
取得部31は、第1の時点における対象顧客に対する営業活動に含まれる複数のアクションの時系列順序を示す営業プロセス時系列データと、対象顧客の属性に関する顧客属性データと、を取得する。具体的に第1の時点とは、営業活動におけるアクションと、成功確率を予測する時点のことをいう。すなわち、取得部31は、予測する時点までの対象顧客に対して行われた営業活動に含まれるアクションを時系列で示すデータを営業プロセス時系列データとして取得する。取得部31は、取得手段の一例である。また、取得部31の一例は、第1の実施形態の予測装置20の取得部21である。
The acquisition unit 31 acquires sales process time-series data indicating the time-series order of a plurality of actions included in the sales activity for the target customer at the first time point, and customer attribute data regarding the attributes of the target customer. Specifically, the first time point refers to an action in sales activities and a time point for predicting the probability of success. That is, the acquisition unit 31 acquires data indicating in time series the actions included in the sales activities performed on the target customer up to the time of prediction as the sales process time series data. The acquisition unit 31 is an example of acquisition means. An example of the acquisition unit 31 is the acquisition unit 21 of the prediction device 20 of the first embodiment.
予測部32は予測モデルと取得部31により取得される営業プロセス時系列データ及び顧客属性データと、を用いて、対象顧客に対する営業活動における第1の時点以降のアクションと、第1の時点以降のアクションを行った場合の対象顧客に対する営業活動の成功確率と、を予測する。予測モデルは、第1の時点よりも過去の時点における複数の営業プロセス時系列データと複数の営業プロセス時系列データに関する営業活動を行った複数の顧客の属性に関する複数の顧客属性データと複数の顧客それぞれに対する営業活動の成否とを用いた機械学習によって生成されている。予測部32は、予測手段の一例である。また、予測部32の一例は、第1の実施形態の予測装置20の予測部24である。
The forecasting unit 32 uses the forecasting model and the sales process time series data and customer attribute data acquired by the acquisition unit 31 to perform actions after the first time point in sales activities for the target customer and after the first time point. Predict the success rate of sales activities for the target customer when an action is taken. The forecast model is a plurality of customer attribute data and a plurality of customers regarding the attributes of a plurality of customers who have performed sales activities related to a plurality of sales process time series data and a plurality of sales process time series data at a time point earlier than the first time point. It is generated by machine learning using the success or failure of sales activities for each. The prediction unit 32 is an example of a prediction means. An example of the prediction unit 32 is the prediction unit 24 of the prediction device 20 of the first embodiment.
本実施形態の営業支援システムの動作について説明する。図12は、本実施形態の営業支援システムの動作フローを示す図である。始めに、取得部31は、第1の時点における対象顧客に対する営業活動に含まれる複数のアクションの時系列順序を示す営業プロセス時系列データと、対象顧客の属性に関する顧客属性データを取得する(ステップS31)。具体的に、取得部31は、営業活動のうち第1の時点までに既に実行されているアクションの順序を時系列で示す営業プロセス時系列データと、営業の対象顧客の顧客属性データと取得する。営業プロセス時系列データと顧客属性データを取得すると、予測部32は、予測モデルと、営業プロセス時系列データ及び顧客属性データを用いて、対象顧客に対する営業活動における第1の時点以降のアクションと、第1の時点以降のアクションを行った場合の対象顧客に対する営業活動の成功確率を予測する(ステップS32)。具体的に、予測部32は、営業プロセス時系列データと顧客属性データを入力として、予測モデルを用いて、予測時点である第1の時点以降における営業活動について、受注の成功確率の高いアクションを予測する。
The operation of the sales support system of this embodiment will be described. FIG. 12 is a diagram showing an operation flow of the sales support system of the present embodiment. First, the acquisition unit 31 acquires the sales process time-series data indicating the time-series order of a plurality of actions included in the sales activity for the target customer at the first time point and the customer attribute data regarding the attributes of the target customer (step). S31). Specifically, the acquisition unit 31 acquires sales process time-series data showing the order of actions already executed up to the first time point in the sales activity in chronological order, and customer attribute data of the target customer of sales. .. When the sales process time series data and the customer attribute data are acquired, the prediction unit 32 uses the prediction model, the sales process time series data, and the customer attribute data to perform actions after the first time point in the sales activity for the target customer. Predict the success rate of sales activities for the target customer when the action after the first time point is performed (step S32). Specifically, the forecasting unit 32 inputs the sales process time series data and the customer attribute data, and uses the forecasting model to perform actions with a high probability of successful order for sales activities after the first time point, which is the forecasting time point. Predict.
本実施形態の営業支援システムは、予測モデルに、予測時点である第1の時点までの活動履歴と顧客の属性を入力することで、受注成功の可能性の予測時点以降の営業活動におけるアクションを予測している。また、予測モデルは、予測を行う第1の時点よりも過去の営業活動の活動履歴である営業プロセス時系列データと、対象顧客の属性を基に生成されている。よって、本実施形態の営業支援システムは、予測時点以降の営業活動における成功確率の高いアクションを予測することができる。そのため、本実施形態の営業支援システムは、受注の可能性を高めるために必要な現時点以降におけるアクションを予測することができる。
The sales support system of the present embodiment inputs the activity history up to the first time point, which is the prediction time point, and the customer's attributes into the prediction model, so that the action in the sales activity after the prediction time point of the possibility of successful order can be taken. I'm predicting. In addition, the forecast model is generated based on the sales process time series data, which is the activity history of the sales activity past the first time when the forecast is performed, and the attributes of the target customer. Therefore, the sales support system of the present embodiment can predict actions with a high probability of success in sales activities after the time of prediction. Therefore, the sales support system of the present embodiment can predict the actions after the present time necessary to increase the possibility of receiving an order.
第1の実施形態の予測モデル生成装置10および予測装置20における各処理は、コンピュータプログラムをコンピュータで実行することによって行うことができる。図13は、予測モデル生成装置10および予測装置20における各処理を行うコンピュータプログラムを実行するコンピュータ40の構成の例を示したものである。コンピュータ40は、CPU41と、メモリ42と、記憶装置43と、入出力I/F(Interface)44と、通信I/F45を備えている。また、第1の実施形態の営業データ管理サーバ300、第2の実施形態の営業支援システムにおける各処理も、同様にコンピュータ70のようなコンピュータでコンピュータプログラムを実行することによって行うことができる。
Each process in the prediction model generation device 10 and the prediction device 20 of the first embodiment can be performed by executing a computer program on a computer. FIG. 13 shows an example of the configuration of a computer 40 that executes a computer program that performs each process in the prediction model generation device 10 and the prediction device 20. The computer 40 includes a CPU 41, a memory 42, a storage device 43, an input / output I / F (Interface) 44, and a communication I / F 45. Further, each process in the sales data management server 300 of the first embodiment and the sales support system of the second embodiment can also be performed by executing a computer program on a computer such as the computer 70.
CPU41は、記憶装置43から各処理を行うコンピュータプログラムを読み出して実行する。コンピュータプログラムを実行する演算処理部は、CPU41に代えて、CPUとGPUとの組み合わせによって構成されていてもよい。メモリ42は、DRAM(Dynamic Random Access Memory)等によって構成され、CPU41が実行するコンピュータプログラムや処理中のデータが一時的に記憶される。記憶装置43は、CPU41が実行するコンピュータプログラムを記憶している。記憶装置43は、例えば、不揮発性の半導体記憶装置によって構成されている。記憶装置43には、ハードディスクドライブ等の他の記憶装置が用いられてもよい。入出力I/F44は、作業者からの入力の受付および表示データ等の出力を行うインタフェースである。通信I/F45は、営業支援システム内の各装置および利用者の端末等との間でデータの送受信を行うインタフェースである。
The CPU 41 reads a computer program that performs each process from the storage device 43 and executes it. The arithmetic processing unit that executes the computer program may be configured by a combination of a CPU and a GPU instead of the CPU 41. The memory 42 is configured by a DRAM (Dynamic Random Access Memory) or the like, and a computer program executed by the CPU 41 and data being processed are temporarily stored. The storage device 43 stores a computer program executed by the CPU 41. The storage device 43 is composed of, for example, a non-volatile semiconductor storage device. Other storage devices such as a hard disk drive may be used as the storage device 43. The input / output I / F 44 is an interface for receiving input from an operator and outputting display data and the like. The communication I / F 45 is an interface for transmitting and receiving data between each device in the sales support system and the terminal of the user.
また、各処理の実行に用いられるコンピュータプログラムは、記録媒体に格納して頒布することもできる。記録媒体としては、例えば、データ記録用磁気テープや、ハードディスクなどの磁気ディスクを用いることができる。また、記録媒体としては、CD-ROM(Compact Disc Read Only Memory)等の光ディスクを用いることもできる。不揮発性の半導体記憶装置を記録媒体として用いてもよい。
In addition, the computer program used to execute each process can be stored in a recording medium and distributed. As the recording medium, for example, a magnetic tape for data recording or a magnetic disk such as a hard disk can be used. Further, as the recording medium, an optical disk such as a CD-ROM (Compact Disc Read Only Memory) can also be used. A non-volatile semiconductor storage device may be used as the recording medium.
上記の実施形態の一部又は全部は、以下の付記のようにも記載されうるが、以下には限られない。
Part or all of the above embodiments may be described as in the following appendix, but are not limited to the following.
[付記1]
第1の時点における対象顧客に対する営業活動に含まれる複数のアクションの時系列順序を示す営業プロセス時系列データと、前記対象顧客の属性に関する顧客属性データと、を取得する取得手段と、
前記第1の時点よりも過去の時点における複数の営業プロセス時系列データと前記複数の営業プロセス時系列データに関する営業活動を行った複数の顧客の属性に関する複数の顧客属性データと前記複数の顧客それぞれに対する営業活動の成否とを用いた機械学習によって生成される予測モデルと、前記取得手段により取得される前記営業プロセス時系列データ及び前記顧客属性データと、を用いて、前記対象顧客に対する営業活動における前記第1の時点以降のアクションと、前記第1の時点以降のアクションを行った場合の前記対象顧客に対する営業活動の成功確率と、を予測する予測手段と、
を備える営業支援システム。 [Appendix 1]
An acquisition means for acquiring sales process time-series data indicating the time-series order of a plurality of actions included in sales activities for the target customer at the first time point, and customer attribute data regarding the attributes of the target customer.
A plurality of customer attribute data relating to the attributes of a plurality of sales process time series data and a plurality of customers who have performed sales activities related to the plurality of sales process time series data at a time point earlier than the first time point, and each of the plurality of customers. In the sales activity for the target customer, the prediction model generated by machine learning using the success or failure of the sales activity for the target customer, the sales process time series data acquired by the acquisition means, and the customer attribute data are used. A predictive means for predicting the action after the first time point and the success probability of the sales activity for the target customer when the action after the first time point is performed.
Sales support system equipped with.
[付記2]
前記予測手段により予測される、前記対象顧客に対する営業活動における前記第1の時点以降のアクションと、前記第1の時点以降のアクションを行った場合の前記対象顧客に対する営業活動の成功確率と、を含む第1の予測結果を表示するよう表示装置を制御する表示制御手段
をさらに備える付記1に記載の営業支援システム。 [Appendix 2]
The action after the first time point in the sales activity for the target customer predicted by the prediction means and the success probability of the sales activity for the target customer when the action after the first time point is performed are determined. The sales support system according toAppendix 1, further comprising a display control means for controlling the display device so as to display the first prediction result including the first prediction result.
前記予測手段により予測される、前記対象顧客に対する営業活動における前記第1の時点以降のアクションと、前記第1の時点以降のアクションを行った場合の前記対象顧客に対する営業活動の成功確率と、を含む第1の予測結果を表示するよう表示装置を制御する表示制御手段
をさらに備える付記1に記載の営業支援システム。 [Appendix 2]
The action after the first time point in the sales activity for the target customer predicted by the prediction means and the success probability of the sales activity for the target customer when the action after the first time point is performed are determined. The sales support system according to
[付記3]
前記予測手段は、前記第1の予測結果とは異なる、前記対象顧客に対する営業活動における前記第1の時点以降のアクションと、前記第1の時点以降のアクションを行った場合の前記対象顧客に対する営業活動の成功確率と、を予測し、
表示制御手段は、前記第1の予測結果とは異なる、前記対象顧客に対する営業活動における前記第1の時点以降のアクションと、前記第1の時点以降のアクションを行った場合の前記対象顧客に対する営業活動の成功確率とを含む第2の予測結果及び前記第1の予測結果を表示するよう前記表示装置を制御する
付記2に記載の営業支援システム。 [Appendix 3]
The prediction means is different from the first prediction result, and is different from the first prediction result, and the action for the target customer after the first time point in the sales activity for the target customer and the sales for the target customer when the action after the first time point is performed. Predict the success rate of the activity and
The display control means is different from the first prediction result, and the sales to the target customer when the action after the first time point in the sales activity for the target customer and the action after the first time point are performed are performed. The sales support system according toAppendix 2, which controls the display device to display the second prediction result including the success probability of the activity and the first prediction result.
前記予測手段は、前記第1の予測結果とは異なる、前記対象顧客に対する営業活動における前記第1の時点以降のアクションと、前記第1の時点以降のアクションを行った場合の前記対象顧客に対する営業活動の成功確率と、を予測し、
表示制御手段は、前記第1の予測結果とは異なる、前記対象顧客に対する営業活動における前記第1の時点以降のアクションと、前記第1の時点以降のアクションを行った場合の前記対象顧客に対する営業活動の成功確率とを含む第2の予測結果及び前記第1の予測結果を表示するよう前記表示装置を制御する
付記2に記載の営業支援システム。 [Appendix 3]
The prediction means is different from the first prediction result, and is different from the first prediction result, and the action for the target customer after the first time point in the sales activity for the target customer and the sales for the target customer when the action after the first time point is performed. Predict the success rate of the activity and
The display control means is different from the first prediction result, and the sales to the target customer when the action after the first time point in the sales activity for the target customer and the action after the first time point are performed are performed. The sales support system according to
[付記4]
前記第1の予測結果に対応する、前記対象顧客に対する営業活動に含まれる複数のアクションそれぞれを示すノード及び前記ノードに関する前記複数のアクション間の順序関係を示すエッジから成るグラフに関するグラフ構造データを生成するグラフ生成手段
をさらに備え、
前記表示制御手段は、前記グラフ生成手段により生成されるグラフ構造データを含む予測結果をさらに表示するよう前記表示装置を制御する
付記2または3に記載の営業支援システム。 [Appendix 4]
Generates graph structure data relating to a graph consisting of a node showing each of a plurality of actions included in sales activities for the target customer and an edge showing the order relationship between the plurality of actions related to the node, corresponding to the first prediction result. Further equipped with graph generation means to
The sales support system according to Appendix 2 or 3, wherein the display control means controls the display device so as to further display a prediction result including graph structure data generated by the graph generation means.
前記第1の予測結果に対応する、前記対象顧客に対する営業活動に含まれる複数のアクションそれぞれを示すノード及び前記ノードに関する前記複数のアクション間の順序関係を示すエッジから成るグラフに関するグラフ構造データを生成するグラフ生成手段
をさらに備え、
前記表示制御手段は、前記グラフ生成手段により生成されるグラフ構造データを含む予測結果をさらに表示するよう前記表示装置を制御する
付記2または3に記載の営業支援システム。 [Appendix 4]
Generates graph structure data relating to a graph consisting of a node showing each of a plurality of actions included in sales activities for the target customer and an edge showing the order relationship between the plurality of actions related to the node, corresponding to the first prediction result. Further equipped with graph generation means to
The sales support system according to
[付記5]
前記エッジは、さらに前記複数のアクション間の時間間隔を示し、
前記表示制御手段は、前記表示装置に表示されるグラフ構造データにおけるノードの選択を受け付けると、当該ノードが示すアクションをグラフ構造データに合わせて表示するよう前記表示装置を制御し、
前記表示制御手段は、前記表示装置に表示されるグラフ構造データにおけるエッジの選択を受け付けると、当該エッジが示す時間間隔を表示するよう前記表示装置を制御する
付記4に記載の営業支援システム。 [Appendix 5]
The edge further indicates the time interval between the plurality of actions.
When the display control means receives the selection of the node in the graph structure data displayed on the display device, the display control means controls the display device so as to display the action indicated by the node according to the graph structure data.
The sales support system according to Appendix 4, wherein when the display control means receives the selection of an edge in the graph structure data displayed on the display device, the display control means controls the display device so as to display the time interval indicated by the edge.
[付記6]
前記第1の時点よりも過去の時点における複数の営業プロセス時系列データと、前記複数の営業プロセス時系列データに関する営業活動を行った複数の顧客の属性に関する複数の顧客属性データと、前記複数の顧客それぞれに対する営業活動の成否とを用いた機械学習によって前記予測モデルを生成する予測モデル生成手段
をさらに備える付記1から5いずれか一項に記載の営業支援システム。 [Appendix 6]
A plurality of sales process time series data at a time point earlier than the first time point, a plurality of customer attribute data regarding attributes of a plurality of customers who have performed sales activities related to the plurality of sales process time series data, and the plurality of customer attribute data. The sales support system according to any one ofAppendix 1 to 5, further comprising a prediction model generation means for generating the prediction model by machine learning using the success or failure of sales activities for each customer.
前記第1の時点よりも過去の時点における複数の営業プロセス時系列データと、前記複数の営業プロセス時系列データに関する営業活動を行った複数の顧客の属性に関する複数の顧客属性データと、前記複数の顧客それぞれに対する営業活動の成否とを用いた機械学習によって前記予測モデルを生成する予測モデル生成手段
をさらに備える付記1から5いずれか一項に記載の営業支援システム。 [Appendix 6]
A plurality of sales process time series data at a time point earlier than the first time point, a plurality of customer attribute data regarding attributes of a plurality of customers who have performed sales activities related to the plurality of sales process time series data, and the plurality of customer attribute data. The sales support system according to any one of
[付記7]
前記予測モデル生成手段は、第1の予測結果に基づいて、前記予測モデルを再学習する付記6に記載の営業支援システム。 [Appendix 7]
The sales support system according to Appendix 6, wherein the prediction model generation means relearns the prediction model based on the first prediction result.
前記予測モデル生成手段は、第1の予測結果に基づいて、前記予測モデルを再学習する付記6に記載の営業支援システム。 [Appendix 7]
The sales support system according to Appendix 6, wherein the prediction model generation means relearns the prediction model based on the first prediction result.
[付記8]
第1の時点における対象顧客に対する営業活動に含まれる複数のアクションの時系列順序を示す営業プロセス時系列データと、前記対象顧客の属性に関する顧客属性データと、を取得し、
前記第1の時点よりも過去の時点における複数の営業プロセス時系列データと前記複数の営業プロセス時系列データに関する営業活動を行った複数の顧客の属性に関する複数の顧客属性データと前記複数の顧客それぞれに対する営業活動の成否とを用いた機械学習によって生成される予測モデルと、前記営業プロセス時系列データ及び前記顧客属性データと、を用いて、前記対象顧客に対する営業活動における前記第1の時点以降のアクションと、前記第1の時点以降のアクションを行った場合の前記対象顧客に対する営業活動の成功確率と、を予測する
営業支援方法。 [Appendix 8]
Acquire the sales process time series data showing the time series order of a plurality of actions included in the sales activity for the target customer at the first time point, and the customer attribute data related to the attribute of the target customer.
A plurality of customer attribute data relating to the attributes of a plurality of sales process time series data and a plurality of customers who have performed sales activities related to the plurality of sales process time series data at a time point earlier than the first time point, and each of the plurality of customers. Using the prediction model generated by machine learning using the success or failure of the sales activity for the target customer, the sales process time series data, and the customer attribute data, after the first time point in the sales activity for the target customer. A sales support method for predicting an action and a success probability of a sales activity for the target customer when the action after the first time point is performed.
[付記9]
前記予測モデルを用いて予測される、前記対象顧客に対する営業活動における前記第1の時点以降のアクションと、前記第1の時点以降のアクションを行った場合の前記対象顧客に対する営業活動の成功確率と、を含む第1の予測結果を表示するよう表示装置を制御する
付記8に記載の営業支援方法。 [Appendix 9]
The action after the first time point in the sales activity for the target customer predicted using the prediction model, and the success probability of the sales activity for the target customer when the action after the first time point is performed. The sales support method according to Appendix 8, wherein the display device is controlled so as to display the first prediction result including.
[付記10]
前記第1の予測結果とは異なる、前記対象顧客に対する営業活動における前記第1の時点以降のアクションと、前記第1の時点以降のアクションを行った場合の前記対象顧客に対する営業活動の成功確率と、を予測し、
前記第1の予測結果とは異なる、前記対象顧客に対する営業活動における前記第1の時点以降のアクションと、前記第1の時点以降のアクションを行った場合の前記対象顧客に対する営業活動の成功確率とを含む第2の予測結果及び前記第1の予測結果を表示するよう前記表示装置を制御する
付記9に記載の営業支援方法。 [Appendix 10]
The action after the first time point in the sales activity for the target customer, which is different from the first prediction result, and the success probability of the sales activity for the target customer when the action after the first time point is performed. Predict,
The action after the first time point in the sales activity for the target customer, which is different from the first prediction result, and the success probability of the sales activity for the target customer when the action after the first time point is performed. 9. The sales support method according to Appendix 9, which controls the display device to display the second prediction result and the first prediction result including the above.
[付記11]
前記第1の予測結果に対応する、前記対象顧客に対する営業活動に含まれる複数のアクションそれぞれを示すノード及び前記ノードに関する前記複数のアクション間の順序関係を示すエッジから成るグラフに関するグラフ構造データを生成し、
生成された前記グラフ構造データをさらに表示するよう前記表示装置を制御する
付記9または10に記載の営業支援方法。 [Appendix 11]
Generates graph structure data relating to a graph consisting of a node showing each of a plurality of actions included in sales activities for the target customer and an edge showing the order relationship between the plurality of actions related to the node, corresponding to the first prediction result. death,
The sales support method according toAppendix 9 or 10, wherein the display device is controlled so as to further display the generated graph structure data.
前記第1の予測結果に対応する、前記対象顧客に対する営業活動に含まれる複数のアクションそれぞれを示すノード及び前記ノードに関する前記複数のアクション間の順序関係を示すエッジから成るグラフに関するグラフ構造データを生成し、
生成された前記グラフ構造データをさらに表示するよう前記表示装置を制御する
付記9または10に記載の営業支援方法。 [Appendix 11]
Generates graph structure data relating to a graph consisting of a node showing each of a plurality of actions included in sales activities for the target customer and an edge showing the order relationship between the plurality of actions related to the node, corresponding to the first prediction result. death,
The sales support method according to
[付記12]
前記エッジに、前記複数のアクション間の時間間隔を含ませ、
前記表示装置に表示されるグラフ構造データにおけるノードの選択を受け付けると、当該ノードが示すアクションを表示するよう前記表示装置を制御し、
前記表示装置に表示されるグラフ構造データにおけるエッジの選択を受け付けると、当該エッジが示す時間間隔を表示するよう前記表示装置を制御する
付記11に記載の営業支援方法。 [Appendix 12]
The edge includes a time interval between the plurality of actions.
When the selection of a node in the graph structure data displayed on the display device is accepted, the display device is controlled to display the action indicated by the node.
The sales support method according toAppendix 11, which controls the display device so as to display the time interval indicated by the edge when the selection of the edge in the graph structure data displayed on the display device is accepted.
前記エッジに、前記複数のアクション間の時間間隔を含ませ、
前記表示装置に表示されるグラフ構造データにおけるノードの選択を受け付けると、当該ノードが示すアクションを表示するよう前記表示装置を制御し、
前記表示装置に表示されるグラフ構造データにおけるエッジの選択を受け付けると、当該エッジが示す時間間隔を表示するよう前記表示装置を制御する
付記11に記載の営業支援方法。 [Appendix 12]
The edge includes a time interval between the plurality of actions.
When the selection of a node in the graph structure data displayed on the display device is accepted, the display device is controlled to display the action indicated by the node.
The sales support method according to
[付記13]
前記第1の時点よりも過去の時点における複数の営業プロセス時系列データと、前記複数の営業プロセス時系列データに関する営業活動を行った複数の顧客の属性に関する複数の顧客属性データと、前記複数の顧客それぞれに対する営業活動の成否とを用いた機械学習によって前記予測モデルを生成する
付記8から12いずれか一項に記載の営業支援方法。 [Appendix 13]
A plurality of sales process time series data at a time point earlier than the first time point, a plurality of customer attribute data regarding attributes of a plurality of customers who have performed sales activities related to the plurality of sales process time series data, and the plurality of customer attribute data. The sales support method according to any one of Appendix 8 to 12, which generates the prediction model by machine learning using the success or failure of sales activities for each customer.
[付記14]
第1の予測結果に基づいて、前記予測モデルを再学習する付記13に記載の営業支援方法。 [Appendix 14]
The sales support method according toAppendix 13, which relearns the prediction model based on the first prediction result.
第1の予測結果に基づいて、前記予測モデルを再学習する付記13に記載の営業支援方法。 [Appendix 14]
The sales support method according to
[付記15]
第1の時点における対象顧客に対する営業活動に含まれる複数のアクションの時系列順序を示す営業プロセス時系列データと、前記対象顧客の属性に関する顧客属性データと、を取得する処理と、
前記第1の時点よりも過去の時点における複数の営業プロセス時系列データと前記複数の営業プロセス時系列データに関する営業活動を行った複数の顧客の属性に関する複数の顧客属性データと前記複数の顧客それぞれに対する営業活動の成否とを用いた機械学習によって生成される予測モデルと、前記営業プロセス時系列データ及び前記顧客属性データと、を用いて、前記対象顧客に対する営業活動における前記第1の時点以降のアクションと、前記第1の時点以降のアクションを行った場合の前記対象顧客に対する営業活動の成功確率と、を予測する処理と、
をコンピュータに実行させる営業支援プログラムを記録したプログラム記録媒体。 [Appendix 15]
A process of acquiring sales process time-series data indicating the time-series order of a plurality of actions included in sales activities for the target customer at the first time point, and customer attribute data regarding the attributes of the target customer.
A plurality of customer attribute data relating to the attributes of a plurality of sales process time series data and a plurality of customers who have performed sales activities related to the plurality of sales process time series data at a time point earlier than the first time point, and each of the plurality of customers. Using the prediction model generated by machine learning using the success or failure of the sales activity for the target customer, the sales process time series data, and the customer attribute data, after the first time point in the sales activity for the target customer. A process for predicting an action and a success probability of a sales activity for the target customer when the action after the first time point is performed.
A program recording medium that records a sales support program that causes a computer to execute.
以上、上述した実施形態を模範的な例として本発明を説明した。しかしながら、本発明は、上述した実施形態には限定されない。即ち、本発明は、本発明のスコープ内において、当業者が理解し得る様々な態様を適用することができる。
The present invention has been described above using the above-described embodiment as a model example. However, the present invention is not limited to the above-described embodiments. That is, the present invention can apply various aspects that can be understood by those skilled in the art within the scope of the present invention.
10 予測モデル生成装置
11 取得部
12 記憶部
13 グラフデータ生成部
14 予測モデル生成部
15 予測モデル記憶部
16 予測モデル出力部
20 予測装置
21 取得部
22 予測モデル記憶部
23 グラフ生成部
24 予測部
25 予測理由生成部
26 表示制御部
31 取得部
32 予測部
40 コンピュータ
41 CPU
42 メモリ
43 記憶装置
44 入出力I/F
45 通信I/F
100 予測システム
300 営業データ管理サーバ 10Prediction model generator 11 Acquisition unit 12 Storage unit 13 Graph data generation unit 14 Prediction model generation unit 15 Prediction model storage unit 16 Prediction model output unit 20 Prediction device 21 Acquisition unit 22 Prediction model storage unit 23 Graph generation unit 24 Prediction unit 25 Prediction reason generation unit 26 Display control unit 31 Acquisition unit 32 Prediction unit 40 Computer 41 CPU
42Memory 43 Storage device 44 I / O I / F
45 Communication I / F
100Forecasting system 300 Sales data management server
11 取得部
12 記憶部
13 グラフデータ生成部
14 予測モデル生成部
15 予測モデル記憶部
16 予測モデル出力部
20 予測装置
21 取得部
22 予測モデル記憶部
23 グラフ生成部
24 予測部
25 予測理由生成部
26 表示制御部
31 取得部
32 予測部
40 コンピュータ
41 CPU
42 メモリ
43 記憶装置
44 入出力I/F
45 通信I/F
100 予測システム
300 営業データ管理サーバ 10
42
45 Communication I / F
100
Claims (15)
- 第1の時点における対象顧客に対する営業活動に含まれる複数のアクションの時系列順序を示す営業プロセス時系列データと、前記対象顧客の属性に関する顧客属性データと、を取得する取得手段と、
前記第1の時点よりも過去の時点における複数の営業プロセス時系列データと前記複数の営業プロセス時系列データに関する営業活動を行った複数の顧客の属性に関する複数の顧客属性データと前記複数の顧客それぞれに対する営業活動の成否とを用いた機械学習によって生成される予測モデルと、前記取得手段により取得される前記営業プロセス時系列データ及び前記顧客属性データと、を用いて、前記対象顧客に対する営業活動における前記第1の時点以降のアクションと、前記第1の時点以降のアクションを行った場合の前記対象顧客に対する営業活動の成功確率と、を予測する予測手段と、
を備える営業支援システム。 An acquisition means for acquiring sales process time-series data indicating the time-series order of a plurality of actions included in sales activities for the target customer at the first time point, and customer attribute data regarding the attributes of the target customer.
A plurality of customer attribute data relating to the attributes of a plurality of sales process time series data and a plurality of customers who have performed sales activities related to the plurality of sales process time series data at a time point earlier than the first time point, and each of the plurality of customers. In the sales activity for the target customer, the prediction model generated by machine learning using the success or failure of the sales activity for the target customer, the sales process time series data acquired by the acquisition means, and the customer attribute data are used. A predictive means for predicting the action after the first time point and the success probability of the sales activity for the target customer when the action after the first time point is performed.
Sales support system equipped with. - 前記予測手段により予測される、前記対象顧客に対する営業活動における前記第1の時点以降のアクションと、前記第1の時点以降のアクションを行った場合の前記対象顧客に対する営業活動の成功確率と、を含む第1の予測結果を表示するよう表示装置を制御する表示制御手段
をさらに備える請求項1に記載の営業支援システム。 The action after the first time point in the sales activity for the target customer predicted by the prediction means and the success probability of the sales activity for the target customer when the action after the first time point is performed are determined. The sales support system according to claim 1, further comprising a display control means for controlling the display device so as to display the first prediction result including the first prediction result. - 前記予測手段は、前記第1の予測結果とは異なる、前記対象顧客に対する営業活動における前記第1の時点以降のアクションと、前記第1の時点以降のアクションを行った場合の前記対象顧客に対する営業活動の成功確率と、を予測し、
表示制御手段は、前記第1の予測結果とは異なる、前記対象顧客に対する営業活動における前記第1の時点以降のアクションと、前記第1の時点以降のアクションを行った場合の前記対象顧客に対する営業活動の成功確率とを含む第2の予測結果及び前記第1の予測結果を表示するよう前記表示装置を制御する
請求項2に記載の営業支援システム。 The prediction means is different from the first prediction result, and is different from the first prediction result, and the action for the target customer after the first time point in the sales activity for the target customer and the sales for the target customer when the action after the first time point is performed. Predict the success rate of the activity and
The display control means is different from the first prediction result, and the sales to the target customer when the action after the first time point in the sales activity for the target customer and the action after the first time point are performed are performed. The sales support system according to claim 2, wherein the display device is controlled to display the second prediction result including the success probability of the activity and the first prediction result. - 前記第1の予測結果に対応する、前記対象顧客に対する営業活動に含まれる複数のアクションそれぞれを示すノード及び前記ノードに関する前記複数のアクション間の順序関係を示すエッジから成るグラフに関するグラフ構造データを生成するグラフ生成手段
をさらに備え、
前記表示制御手段は、前記グラフ生成手段により生成されるグラフ構造データを含む予測結果をさらに表示するよう前記表示装置を制御する
請求項2または3に記載の営業支援システム。 Generates graph structure data relating to a graph consisting of a node showing each of a plurality of actions included in sales activities for the target customer and an edge showing the order relationship between the plurality of actions related to the node, corresponding to the first prediction result. Further equipped with graph generation means to
The sales support system according to claim 2 or 3, wherein the display control means controls the display device so as to further display a prediction result including graph structure data generated by the graph generation means. - 前記エッジは、さらに前記複数のアクション間の時間間隔を示し、
前記表示制御手段は、前記表示装置に表示されるグラフ構造データにおけるノードの選択を受け付けると、当該ノードが示すアクションをグラフ構造データに合わせて表示するよう前記表示装置を制御し、
前記表示制御手段は、前記表示装置に表示されるグラフ構造データにおけるエッジの選択を受け付けると、当該エッジが示す時間間隔を表示するよう前記表示装置を制御する
請求項4に記載の営業支援システム。 The edge further indicates the time interval between the plurality of actions.
When the display control means receives the selection of the node in the graph structure data displayed on the display device, the display control means controls the display device so as to display the action indicated by the node according to the graph structure data.
The sales support system according to claim 4, wherein the display control means controls the display device so as to display the time interval indicated by the edge when the selection of the edge in the graph structure data displayed on the display device is received. - 前記第1の時点よりも過去の時点における複数の営業プロセス時系列データと、前記複数の営業プロセス時系列データに関する営業活動を行った複数の顧客の属性に関する複数の顧客属性データと、前記複数の顧客それぞれに対する営業活動の成否とを用いた機械学習によって前記予測モデルを生成する予測モデル生成手段
をさらに備える請求項1から5いずれか一項に記載の営業支援システム。 A plurality of sales process time series data at a time point earlier than the first time point, a plurality of customer attribute data regarding attributes of a plurality of customers who have performed sales activities related to the plurality of sales process time series data, and the plurality of customer attribute data. The sales support system according to any one of claims 1 to 5, further comprising a prediction model generation means for generating the prediction model by machine learning using the success or failure of sales activities for each customer. - 前記予測モデル生成手段は、第1の予測結果に基づいて、前記予測モデルを再学習する請求項6に記載の営業支援システム。 The sales support system according to claim 6, wherein the prediction model generation means relearns the prediction model based on the first prediction result.
- 第1の時点における対象顧客に対する営業活動に含まれる複数のアクションの時系列順序を示す営業プロセス時系列データと、前記対象顧客の属性に関する顧客属性データと、を取得し、
前記第1の時点よりも過去の時点における複数の営業プロセス時系列データと前記複数の営業プロセス時系列データに関する営業活動を行った複数の顧客の属性に関する複数の顧客属性データと前記複数の顧客それぞれに対する営業活動の成否とを用いた機械学習によって生成される予測モデルと、前記営業プロセス時系列データ及び前記顧客属性データと、を用いて、前記対象顧客に対する営業活動における前記第1の時点以降のアクションと、前記第1の時点以降のアクションを行った場合の前記対象顧客に対する営業活動の成功確率と、を予測する
営業支援方法。 Acquire the sales process time series data showing the time series order of a plurality of actions included in the sales activity for the target customer at the first time point, and the customer attribute data related to the attribute of the target customer.
A plurality of customer attribute data relating to the attributes of a plurality of sales process time series data and a plurality of customers who have performed sales activities related to the plurality of sales process time series data at a time point earlier than the first time point, and each of the plurality of customers. Using the prediction model generated by machine learning using the success or failure of the sales activity for the target customer, the sales process time series data, and the customer attribute data, after the first time point in the sales activity for the target customer. A sales support method for predicting an action and a success probability of a sales activity for the target customer when the action after the first time point is performed. - 前記予測モデルを用いて予測される、前記対象顧客に対する営業活動における前記第1の時点以降のアクションと、前記第1の時点以降のアクションを行った場合の前記対象顧客に対する営業活動の成功確率と、を含む第1の予測結果を表示するよう表示装置を制御する
請求項8に記載の営業支援方法。 The action after the first time point in the sales activity for the target customer predicted using the prediction model, and the success probability of the sales activity for the target customer when the action after the first time point is performed. The sales support method according to claim 8, wherein the display device is controlled so as to display the first prediction result including. - 前記第1の予測結果とは異なる、前記対象顧客に対する営業活動における前記第1の時点以降のアクションと、前記第1の時点以降のアクションを行った場合の前記対象顧客に対する営業活動の成功確率と、を予測し、
前記第1の予測結果とは異なる、前記対象顧客に対する営業活動における前記第1の時点以降のアクションと、前記第1の時点以降のアクションを行った場合の前記対象顧客に対する営業活動の成功確率とを含む第2の予測結果及び前記第1の予測結果を表示するよう前記表示装置を制御する
請求項9に記載の営業支援方法。 The action after the first time point in the sales activity for the target customer, which is different from the first prediction result, and the success probability of the sales activity for the target customer when the action after the first time point is performed. Predict,
The action after the first time point in the sales activity for the target customer, which is different from the first prediction result, and the success probability of the sales activity for the target customer when the action after the first time point is performed. The sales support method according to claim 9, wherein the display device is controlled to display the second prediction result and the first prediction result including the above. - 前記第1の予測結果に対応する、前記対象顧客に対する営業活動に含まれる複数のアクションそれぞれを示すノード及び前記ノードに関する前記複数のアクション間の順序関係を示すエッジから成るグラフに関するグラフ構造データを生成し、
生成された前記グラフ構造データをさらに表示するよう前記表示装置を制御する
請求項9または10に記載の営業支援方法。 Generates graph structure data relating to a graph consisting of a node showing each of a plurality of actions included in sales activities for the target customer and an edge showing the order relationship between the plurality of actions related to the node, corresponding to the first prediction result. death,
The sales support method according to claim 9 or 10, wherein the display device is controlled so as to further display the generated graph structure data. - 前記エッジに、前記複数のアクション間の時間間隔を含ませ、
前記表示装置に表示されるグラフ構造データにおけるノードの選択を受け付けると、当該ノードが示すアクションを表示するよう前記表示装置を制御し、
前記表示装置に表示されるグラフ構造データにおけるエッジの選択を受け付けると、当該エッジが示す時間間隔を表示するよう前記表示装置を制御する
請求項11に記載の営業支援方法。 The edge includes a time interval between the plurality of actions.
When the selection of a node in the graph structure data displayed on the display device is accepted, the display device is controlled to display the action indicated by the node.
The sales support method according to claim 11, wherein when the selection of an edge in the graph structure data displayed on the display device is accepted, the display device is controlled to display the time interval indicated by the edge. - 前記第1の時点よりも過去の時点における複数の営業プロセス時系列データと、前記複数の営業プロセス時系列データに関する営業活動を行った複数の顧客の属性に関する複数の顧客属性データと、前記複数の顧客それぞれに対する営業活動の成否とを用いた機械学習によって前記予測モデルを生成する
請求項8から12いずれか一項に記載の営業支援方法。 A plurality of sales process time series data at a time point earlier than the first time point, a plurality of customer attribute data regarding attributes of a plurality of customers who have performed sales activities related to the plurality of sales process time series data, and the plurality of customer attribute data. The sales support method according to any one of claims 8 to 12, wherein the prediction model is generated by machine learning using the success or failure of sales activities for each customer. - 第1の予測結果に基づいて、前記予測モデルを再学習する請求項13に記載の営業支援方法。 The sales support method according to claim 13, which relearns the prediction model based on the first prediction result.
- 第1の時点における対象顧客に対する営業活動に含まれる複数のアクションの時系列順序を示す営業プロセス時系列データと、前記対象顧客の属性に関する顧客属性データと、を取得する処理と、
前記第1の時点よりも過去の時点における複数の営業プロセス時系列データと前記複数の営業プロセス時系列データに関する営業活動を行った複数の顧客の属性に関する複数の顧客属性データと前記複数の顧客それぞれに対する営業活動の成否とを用いた機械学習によって生成される予測モデルと、前記営業プロセス時系列データ及び前記顧客属性データと、を用いて、前記対象顧客に対する営業活動における前記第1の時点以降のアクションと、前記第1の時点以降のアクションを行った場合の前記対象顧客に対する営業活動の成功確率と、を予測する処理と、
をコンピュータに実行させる営業支援プログラムを記録したプログラム記録媒体。 A process of acquiring sales process time-series data indicating the time-series order of a plurality of actions included in sales activities for the target customer at the first time point, and customer attribute data regarding the attributes of the target customer.
A plurality of customer attribute data relating to the attributes of a plurality of sales process time series data and a plurality of customers who have performed sales activities related to the plurality of sales process time series data at a time point earlier than the first time point, and each of the plurality of customers. Using the prediction model generated by machine learning using the success or failure of the sales activity for the target customer, the sales process time series data, and the customer attribute data, after the first time point in the sales activity for the target customer. A process for predicting an action and a success probability of a sales activity for the target customer when the action after the first time point is performed.
A program recording medium that records a sales support program that causes a computer to execute.
Priority Applications (4)
| Application Number | Priority Date | Filing Date | Title |
|---|---|---|---|
| JP2022510305A JP7491367B2 (en) | 2020-03-27 | 2020-03-27 | Sales support system, sales support method, and sales support program |
| US17/802,999 US20230099749A1 (en) | 2020-03-27 | 2020-03-27 | Sales assistance system, sales assistance method, and program recording medium |
| PCT/JP2020/013914 WO2021192197A1 (en) | 2020-03-27 | 2020-03-27 | Sales assistance system, sales assistance method, and program recording medium |
| JP2024079816A JP2024105572A (en) | 2020-03-27 | 2024-05-16 | Sales support system, sales support method, and sales support program |
Applications Claiming Priority (1)
| Application Number | Priority Date | Filing Date | Title |
|---|---|---|---|
| PCT/JP2020/013914 WO2021192197A1 (en) | 2020-03-27 | 2020-03-27 | Sales assistance system, sales assistance method, and program recording medium |
Publications (1)
| Publication Number | Publication Date |
|---|---|
| WO2021192197A1 true WO2021192197A1 (en) | 2021-09-30 |
Family
ID=77891024
Family Applications (1)
| Application Number | Title | Priority Date | Filing Date |
|---|---|---|---|
| PCT/JP2020/013914 WO2021192197A1 (en) | 2020-03-27 | 2020-03-27 | Sales assistance system, sales assistance method, and program recording medium |
Country Status (3)
| Country | Link |
|---|---|
| US (1) | US20230099749A1 (en) |
| JP (2) | JP7491367B2 (en) |
| WO (1) | WO2021192197A1 (en) |
Citations (2)
| Publication number | Priority date | Publication date | Assignee | Title |
|---|---|---|---|---|
| JP2005322094A (en) * | 2004-05-11 | 2005-11-17 | Hitachi Ltd | Business support method and business support system |
| JP2019079302A (en) * | 2017-10-25 | 2019-05-23 | 日本電気株式会社 | Sales activity support system, sales activity support method and sales activity support program |
-
2020
- 2020-03-27 US US17/802,999 patent/US20230099749A1/en active Pending
- 2020-03-27 WO PCT/JP2020/013914 patent/WO2021192197A1/en active Application Filing
- 2020-03-27 JP JP2022510305A patent/JP7491367B2/en active Active
-
2024
- 2024-05-16 JP JP2024079816A patent/JP2024105572A/en active Pending
Patent Citations (2)
| Publication number | Priority date | Publication date | Assignee | Title |
|---|---|---|---|---|
| JP2005322094A (en) * | 2004-05-11 | 2005-11-17 | Hitachi Ltd | Business support method and business support system |
| JP2019079302A (en) * | 2017-10-25 | 2019-05-23 | 日本電気株式会社 | Sales activity support system, sales activity support method and sales activity support program |
Also Published As
| Publication number | Publication date |
|---|---|
| JP2024105572A (en) | 2024-08-06 |
| JPWO2021192197A1 (en) | 2021-09-30 |
| US20230099749A1 (en) | 2023-03-30 |
| JP7491367B2 (en) | 2024-05-28 |
Similar Documents
| Publication | Publication Date | Title |
|---|---|---|
| Helo et al. | Artificial intelligence in operations management and supply chain management: An exploratory case study | |
| Babu et al. | Exploring big data-driven innovation in the manufacturing sector: evidence from UK firms | |
| US20190378074A1 (en) | Method, apparatus, and system for data analytics model selection for real-time data visualization | |
| JP2020087023A (en) | Order acceptance prediction model generating method, order acceptance prediction model, order acceptance predicting apparatus, order acceptance predicting method, and order acceptance predicting program | |
| Harsoor et al. | Forecast of sales of Walmart store using big data applications | |
| Khatri | Integration of natural language processing, self-service platforms, predictive maintenance, and prescriptive analytics for cost reduction, personalization, and real-time insights customer service and operational efficiency | |
| US11887167B2 (en) | Utilizing machine learning models to generate an optimized digital marketing simulation | |
| Zaman | Transformation of marketing decisions through artificial intelligence and digital marketing | |
| US11138536B1 (en) | Intelligent implementation project management | |
| Sardar et al. | The Future of Big Data in Customer Experience and Inventory Management | |
| WO2021192198A1 (en) | Sales assistance system, sales assistance method, and program recording medium | |
| WO2021192197A1 (en) | Sales assistance system, sales assistance method, and program recording medium | |
| Chashmi et al. | Predicting customer turnover using recursive neural networks | |
| Soni et al. | Big data analytics for market prediction via consumer insight | |
| JP7533571B2 (en) | People flow prediction system, people flow prediction method, and people flow prediction program | |
| JP7556385B2 (en) | Sales support system, sales support method, and sales support program | |
| Mesir | The role of artificial intelligence in decision making in small businesses | |
| Ajay et al. | Analyzing and Predicting the Sales Forecasting using Modified Random Forest and Decision Tree Algorithm | |
| US20220198464A1 (en) | Methods for automated predictive modeling to assess customer confidence and devices thereof | |
| Bhuvaneswari et al. | Predicting periodical sales of products using a machine learning algorithm | |
| Stoychev | The potential benefits of implementing machine learning in supply chain management | |
| Hütsch et al. | A Structured Literature Review on the Application of Machine Learning in Retail. | |
| Quayson et al. | Machine Learning and Supply Chain Management | |
| US11436633B2 (en) | Machine learning predictive deviation and remediation | |
| Rath et al. | Applications of Machine Learning in Industrial Reliability Model |
Legal Events
| Date | Code | Title | Description |
|---|---|---|---|
| 121 | Ep: the epo has been informed by wipo that ep was designated in this application |
Ref document number: 20926640 Country of ref document: EP Kind code of ref document: A1 |
|
| ENP | Entry into the national phase |
Ref document number: 2022510305 Country of ref document: JP Kind code of ref document: A |
|
| NENP | Non-entry into the national phase |
Ref country code: DE |
|
| 122 | Ep: pct application non-entry in european phase |
Ref document number: 20926640 Country of ref document: EP Kind code of ref document: A1 |