WO2021187231A1 - Affected tree diagnosis system, affected tree diagnosis method, and affected tree diagnosis program - Google Patents
Affected tree diagnosis system, affected tree diagnosis method, and affected tree diagnosis program Download PDFInfo
- Publication number
- WO2021187231A1 WO2021187231A1 PCT/JP2021/009241 JP2021009241W WO2021187231A1 WO 2021187231 A1 WO2021187231 A1 WO 2021187231A1 JP 2021009241 W JP2021009241 W JP 2021009241W WO 2021187231 A1 WO2021187231 A1 WO 2021187231A1
- Authority
- WO
- WIPO (PCT)
- Prior art keywords
- tree
- image
- diseased
- diagnosed
- diagnosis
- Prior art date
Links
Images


Classifications
-
- A—HUMAN NECESSITIES
- A01—AGRICULTURE; FORESTRY; ANIMAL HUSBANDRY; HUNTING; TRAPPING; FISHING
- A01G—HORTICULTURE; CULTIVATION OF VEGETABLES, FLOWERS, RICE, FRUIT, VINES, HOPS OR SEAWEED; FORESTRY; WATERING
- A01G7/00—Botany in general
-
- G—PHYSICS
- G06—COMPUTING; CALCULATING OR COUNTING
- G06T—IMAGE DATA PROCESSING OR GENERATION, IN GENERAL
- G06T7/00—Image analysis
Definitions
- the present invention relates to a diseased tree diagnosis system, a diseased tree diagnosis, and a diseased tree diagnosis program.
- root rot is known as a disease of Hevea brasiliensis. Root rot kills trees by infecting roots with pathogens and causing tissue rot. If the affected tree is left unattended, it will be transmitted to the surrounding healthy trees, so it is desirable to detect the disease early and deal with it. The diagnosis of this disease was made, for example, by a skilled worker looking at the color and condition of the leaves to make an estimate and digging the roots of a tree suspected of having the disease to determine whether or not it was infected.
- Patent Document 1 a plurality of images of plant diseases and corresponding diagnosis results are captured as learning data, image feature data related to plant diseases is created and held, and an input for inputting an image to be diagnosed is input.
- a plant disease diagnostic system including a unit and an analysis unit that identifies which diagnostic result the input image is classified by using the deep learning device has been proposed.
- Patent Document 1 an image of a plant disease and a diagnosis result are taken in to create image feature data, and which diagnosis result the input image corresponds to is identified.
- the lesion is clear on the input image, it can be diagnosed, but if the main lesion appears at the root and the lesion on the ground is slight, such as a rubber tree, it should be diagnosed accurately.
- the leaves of a diseased rubber tree have a stronger yellow tint than that of a healthy one, but young healthy leaves have a similar color and are difficult to diagnose by leaf color.
- the shape of the leaves was not significantly different from that of the healthy ones. For example, even if the leaves of the diseased tree were individually photographed to create image feature data, the disease could not be diagnosed accurately.
- an object of the present invention is to provide a technique capable of diagnosing a disease of a tree with high accuracy.
- the diseased tree diagnostic system of the present invention is used.
- the target acquisition unit that acquires the image of the tree to be diagnosed, The image of the tree, the information indicating the range in which the leaf group is shown in the image, and the information indicating whether or not the diseased characteristic is present in the range are used as teacher data, and the affected leaf group is included from the image of the tree.
- the image of the tree may be a bird's-eye view image taken from above the tree.
- the leaf group exists between a first height set a predetermined distance below the upper end of the tree and a second height set a predetermined distance below the first height. It may be something to do.
- the diseased tree diagnosis system processes at least one of rotation, movement, enlargement, reduction, inversion, color change, noise addition, blurring, high frequency component enhancement, and distortion with respect to the image of the tree to be diagnosed.
- the image after image processing is used as teacher data different from the image before image processing, and a pre-processing unit for increasing the number of the teacher data is further provided.
- the model creation unit may perform machine learning using the increased teacher data.
- the diseased tree diagnosis system further includes a position specifying unit that identifies the position where the diseased tree exists based on the position in the image of the tree diagnosed as the diseased tree in the image to be diagnosed. May be good.
- the positioning unit determines the position of the air vehicle when the image to be diagnosed is photographed and the diseased tree.
- the position where the diseased tree exists may be specified based on the position of the tree diagnosed as having the disease in the image.
- the diseased tree diagnosis method of the present invention is used. Steps to acquire an image of the tree to be diagnosed, The image of the tree, the information indicating the range in which the leaf group is shown in the image, and the information indicating whether or not the diseased characteristic is present in the range are used as teacher data, and the affected leaf group is included from the image of the tree.
- a step of diagnosing a tree including a diseased leaf group as a diseased tree by inputting an image of the tree to be diagnosed into a machine-learned diagnostic model for diagnosing a tree as a diseased tree.
- the present invention may be a diseased tree diagnosis program for causing a computer to execute each step of the diseased tree diagnosis method. Further, the present invention may be a storage medium in which the diseased tree diagnosis program can be read by a computer and stored non-temporarily.
- the machine learning device of the present invention A data acquisition unit that acquires an image of a tree, information indicating a range in which a group of leaves is shown in the image, and information indicating whether or not the area has a disease characteristic as teacher data.
- a model generation unit that generates a diagnostic model for diagnosing a tree including a diseased leaf group as a diseased tree from an image of the tree by machine learning using the teacher data. To be equipped.
- the present invention can provide a technique capable of diagnosing a disease of a tree with high accuracy.
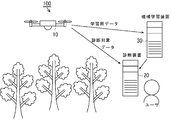
- FIG. 1 is a schematic configuration diagram of a diseased tree diagnosis system 100 according to the present embodiment.
- the diseased tree diagnosis system 100 includes a flying object 10, a diagnostic device 20, and a machine learning device 30.
- the diseased tree diagnosis system 100 takes an image of the tree to be diagnosed from the sky by the flying object 10, and uses a diagnostic model (neural network) created by deep learning to obtain the diseased tree from the image of the tree to be diagnosed. Diagnose.
- the diseased tree diagnosis system 100 of the present embodiment accurately grasps the characteristics of the disease appearing in the leaf group and diagnoses the diseased tree with high accuracy by performing the diagnosis based on the state of the leaf group photographed from above. I am trying to be able to do it.
- Hevea brasiliensis root rot is a disease caused by infection of the roots of Hevea brasiliensis root rot (Rigidoporus microporus), which is a type of filamentous fungus. As the disease progresses, the roots rot and the trees die. In addition, as the disease progresses, pathogens infect the roots of surrounding healthy trees and cause the disease, so it is desirable to detect the disease at an early stage and deal with it. However, lesions in the early stages of illness occur mainly in the underground roots, with slight changes in the above-ground part. For example, the leaves turn yellow when the roots cannot absorb enough water.
- the diseased tree diagnosis system 100 of the present embodiment diagnoses the disease based on the image of the leaf group. This makes it possible to make an accurate diagnosis based not only on the color of the leaves but also on the way the leaves are attached, particularly the density of the leaves and the angle of the leaves with respect to the branches. In addition, by using an image taken from above the tree, the leaves shown in this image are in a position where they can be seen from the sky, and those that have turned yellow due to poor sunlight can be excluded, so that the diagnosis can be made accurately.
- FIG. 2 is a configuration diagram of the flying object 10.
- the flying object 10 is a small unmanned aerial vehicle (drone) including a drive unit 11, a control unit 12, a photographing device 13, and a position information acquisition unit 14.
- the drive unit 11 obtains buoyancy by rotating the propeller by a motor or an internal combustion engine, and obtains thrust by tilting the rotation axis of the propeller with respect to the vertical axis.
- the configuration of the drive unit is not limited to this, and other configurations may be used. For example, it may be configured to have a balloon for obtaining buoyancy and a propeller for obtaining thrust.
- the control unit 12 receives an operation by the user, controls the drive unit 11 according to the operation, and controls the flight state of the flying object 10. In addition, the control unit 12 controls the photographing device 13 to control operations such as starting and stopping shooting and changing the shooting direction.
- the photographing device 13 forms an image of a tree as a diagnosis target on the light receiving surface of the image sensor 13B by the photographing lens 13A, converts the image into an electric signal by the image pickup element 13B, and acquires the data of the photographed image. Further, the photographing device 13 of the present embodiment records the data of the photographed image together with the photographing time.
- the position information acquisition unit 14 acquires position information by a satellite positioning system or the like, and records its own position (also referred to as a shooting position) when shooting with the shooting device 13 in association with the shot image. For example, position information (latitude, longitude, etc.) is acquired at a predetermined cycle and recorded as log data together with the acquisition time. As a result, by collating the shooting time of the shot image with the log data, it is possible to determine where the flying object 10 was located at the time of shooting.
- the log data may record attitude information indicating in which direction the flying object 10 is facing, together with the position information.
- the flying object 10 is not limited to a small unmanned aerial vehicle, but may be a manned airplane, a helicopter, an artificial satellite, or the like.
- FIG. 3 is a configuration diagram of the diagnostic device 20.
- the diagnostic apparatus 20 includes a target acquisition unit 21, a diagnostic unit 22, a diagnosis result output unit 23, and a position specifying unit 24.
- the target acquisition unit 21 acquires image data of the tree to be diagnosed from the flying object 10.
- the acquisition of the image data is connected to the flying object 10 via, for example, a communication cable or a communication network, and is received from the flying object 10 by communication.
- the flying object 10 may store the image data of the tree to be diagnosed in a storage medium such as a memory card, and the diagnostic device 20 may read the image data from the storage medium and acquire the image data.
- the diagnosis unit 22 receives the disease from the image of the tree using the image of the tree, the information indicating the range in which the leaf group is shown in the image, and the information indicating whether or not the disease has a characteristic of the disease in the range as teacher data.
- a diagnostic model in which machine learning is performed to diagnose a tree containing a diseased leaf group as a diseased tree, a tree including a diseased leaf group is diagnosed as a diseased tree. do.
- the diagnosis result output unit 23 outputs the result of the diagnosis by the diagnosis unit 22.
- the output of the result of this diagnosis is, for example, display on a display device, printing by a printer, storage on a storage medium, transmission to another device, or the like.
- the position specifying unit 24 identifies the position where the diseased tree exists based on the position in the image of the tree diagnosed as the diseased tree in the image to be diagnosed. For example, when the image of the diagnosis target is taken by an air vehicle flying over the tree, the position specifying unit determines the position of the air vehicle when the image of the diagnosis target is taken and the position of the air vehicle. Based on the position of the tree diagnosed as the diseased tree in the image, the position where the diseased tree exists is specified.
- FIG. 4 is a hardware configuration diagram of the diagnostic device 20.
- the diagnostic device 20 is a computer having a processor 222, a memory 223, an input / output IF (interface) 224, and a communication IF 225 connected to each other by a connection bus 221.
- the processor 222 processes the input information and outputs the processing result to control the entire apparatus.
- the processor 222 is also called a CPU (Central Processing Unit) or an MPU (Micro-processing unit).
- the processor 222 is not limited to a single processor, and may have a multiprocessor configuration. Further, it may be a multi-core configuration having a plurality of cores in a single chip connected by a single socket.
- Memory 223 includes a main storage device and an auxiliary storage device.
- the main storage device is used as a work area of the processor 222, a storage area for temporarily storing information processed by the processor 222, and a buffer area for communication data.
- the main storage device is a storage medium for the processor 222 to cache programs and data and expand a work area.
- the main storage device includes, for example, a RAM (RandomAccessMemory), a ROM (ReadOnlyMemory), and a flash memory.
- the auxiliary storage device is a storage medium that stores a program executed by the processor 222, data used for information processing, operation setting information, and the like.
- the auxiliary storage device is, for example, an HDD (Hard-disk Drive), an SSD (Solid State Drive), an EPROM (Erasable Programmable ROM), a flash memory, a USB memory, a memory card, or the like.
- the auxiliary storage device stores the image (photographed image) of the tree to be diagnosed received by the target acquisition unit 21 and the diagnosis result.
- the input / output IF224 is an interface for inputting / outputting data to / from a device connected to the diagnostic device 20.
- the input / output IF224 inputs / outputs data to / from a device such as a disk drive, an operation unit, or a display device that reads data from a storage medium such as a CD or DVD.
- the operation unit is an input unit such as a mouse, a keyboard, and a touch panel into which information for the diagnostic device 20 is input by an operator's operation.
- the display device is an output unit that displays and outputs information such as processing results to the operator.
- the communication IF25 is an interface (communication module) that communicates with other devices via the communication line N, and is also called a CCU (Communication Control Unit).
- a plurality of components of the diagnostic device 20 shown in FIG. 6 may be provided, or some components may not be provided.
- the diagnostic device 20 when the processor 222 executes the application program, the diagnostic device 20 is a processing unit such as a target acquisition unit 21, a diagnostic unit 22, a diagnosis result output unit 23, and a position specifying unit 24. Functions as. That is, the processor 222 can also be used as each processing unit depending on the software to be executed. However, some or all of the above processing units are dedicated LSIs (large scale integration) such as DSP (Digital Signal Processor), ASIC (Application Specific Integrated Circuit), FPGA (Field-Programmable Gate Array), logic circuits, and others. It may be formed by hardware such as a digital circuit of. Further, an analog circuit may be included in at least a part of each of the above processing units.
- LSIs large scale integration
- DSP Digital Signal Processor
- ASIC Application Specific Integrated Circuit
- FPGA Field-Programmable Gate Array
- logic circuits and others. It may be formed by hardware such as a digital circuit of. Further, an analog circuit may be included in at least a part of each
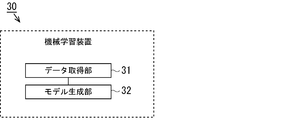
- FIG. 5 is a configuration diagram of the machine learning device 30. As shown in FIG. 5, the machine learning device 30 has a data acquisition unit 31 and a model generation unit 32.
- the data acquisition unit 31 acquires an image of the tree, information indicating the range in which the leaf group is shown in the image, and information indicating whether or not the disease has a characteristic in the range as teacher data.
- the model generation unit 32 generates a diagnostic model for diagnosing a tree including a diseased leaf group as a diseased tree from an image of the tree by machine learning using the teacher data.
- FIG. 6 is an explanatory diagram of processing using image data as teacher data.
- image 41 is an original image taken by the flying object 10. From this image 41, the area in which one tree is shown is extracted as the tree area 42. In the present embodiment, the tree area 42 is cut out at 800 ⁇ 800 pixels to 1500 ⁇ 1500 pixels.
- the leaf group is a group of a plurality of leaves, and includes, for example, 5 to 500 leaves.
- the number of leaves forming a leaf group may be appropriately determined according to the size (trunk diameter, tree height, etc.) and type of the tree, the age of the tree, the target detection accuracy, etc., and may be 10 to 300 or 10 to 50.
- the leaf group may include branches that support the leaves. Further, one leaf group may be a set of leaves derived from the same branch or a set of leaves within a predetermined distance from the tip of the branch.
- the predetermined distance is a value of 30 cm to 3 m, for example, 50 cm, 1 m, 2 m, and the like.
- the image of the leaf alone is not used as the teacher data, but the image of the leaf group (data of the tree region 42) is used as the teacher data.
- the teacher data of the present embodiment includes information such as the shape of a plurality of leaves, the distance between each leaf (leaf density), and the angle of the leaf with respect to the branch (how the leaves are attached), in addition to the color of the leaves. ..
- young leaves are soft and hang down as they move away from the branches, so the way the leaves are attached provides information on whether or not the leaves are young. Therefore, in the diagnostic model learned using the teacher data, if the leaves are dripping, it is judged to be healthy because the leaves are young, and if the leaves are not dripping, the leaves are judged to be healthy. It can be determined that there is a high possibility of yellowing.
- the diagnostic model learned using the teacher data can use the leaf density in the image of the leaf group as one of the information for diagnosing the disease.
- the image of the tree is learned, but the data used for the learning is not limited to the image of the tree.
- pre-learning is performed using an image set of general objects such as dogs and cats, and based on the pre-learned model, actual learning (transfer learning) is performed using images of trees to create a diagnostic model. good.
- transfer learning is performed using images of trees to create a diagnostic model. good.
- a diagnostic model with high detection accuracy can be generated even if the number of tree images is small, and the load of creating teacher data can be suppressed.
- the first height set to be a predetermined distance below the upper end of the tree and the first height set to be a predetermined distance below the first height are specified.
- a group of leaves existing between the second height set on the side may be specified.
- the first height is set at a distance of 50 cm to 5 m, such as 50 cm, 1 m, 3 m, etc., from the upper end of the tree.
- the second height is set to a distance of 50 cm to 10 m, such as 1 m, 3 m, 5 m, etc., from the first height.
- the first height may be set to a distance corresponding to 4% to 30% of the tree height, such as 4%, 6%, 20% of the tree height, from the upper end of the tree.
- the second height may be set to a distance corresponding to 6% to 50% of the tree height, such as 6%, 20%, 30% of the tree height, from the first height.
- the first height and the second height may be set according to the height (tree height) of the target tree.
- the tree height in this case is, for example, 10 m to 20 m.
- the target tree may be a tall tree of 5 m or more.
- the image of the tree to be diagnosed is subjected to at least one of rotation, movement, enlargement, reduction, inversion, color change, noise addition, blurring, high frequency component enhancement, and distortion, and after image processing.
- the image of is used as teacher data different from the image before image processing, and the number of teacher data may be increased. As a result, it is possible to generate a diagnostic model with high detection accuracy while suppressing the influence of brightness, image orientation, and the like.
- FIG. 7 is a hardware configuration diagram of the machine learning device 30.
- the machine learning device 30 is a computer having a processor 322, a memory 323, an input / output IF (interface) 324, and a communication IF 325 connected to each other by a connection bus 321.
- the processor 322 processes the input information and outputs the processing result to control the entire apparatus.
- the processor 322 is also called a CPU (Central Processing Unit) or an MPU (Micro-processing unit).
- the processor 322 is not limited to a single processor, and may have a multiprocessor configuration. Further, it may be a multi-core configuration having a plurality of cores in a single chip connected by a single socket.
- Memory 323 includes a main storage device and an auxiliary storage device.
- the main storage device is used as a work area of the processor 322, a storage area for temporarily storing information processed by the processor 322, and a buffer area for communication data.
- the main storage device is a storage medium for the processor 322 to cache programs and data and expand a work area.
- the main storage device includes, for example, a RAM (RandomAccessMemory), a ROM (ReadOnlyMemory), and a flash memory.
- the auxiliary storage device is a storage medium that stores a program executed by the processor 322, data used for information processing, operation setting information, and the like.
- the auxiliary storage device is, for example, an HDD (Hard-disk Drive), an SSD (Solid State Drive), an EPROM (Erasable Programmable ROM), a flash memory, a USB memory, a memory card, or the like.
- the input / output IF324 is an interface for inputting / outputting data to / from a device connected to the machine learning device 30.
- the input / output IF324 inputs / outputs data to / from a device such as a disk drive, an operation unit, or a display device that reads data from a storage medium such as a CD or DVD.
- the operation unit is an input unit such as a mouse, a keyboard, and a touch panel into which information for the machine learning device 30 is input by an operator's operation.
- the display device is an output unit that displays and outputs information such as processing results to the operator.
- the communication IF35 is an interface (communication module) that communicates with other devices via the communication line N, and is also called a CCU (Communication Control Unit).
- a plurality of components of the machine learning device 30 shown in FIG. 7 may be provided, or some components may not be provided.
- the processor 322 executes an application program, so that the machine learning device 30 functions as each processing unit such as a data acquisition unit 31 and a model generation unit 32. That is, the processor 322 can also be used as each processing unit depending on the software to be executed.
- some or all of the above processing units are dedicated LSIs (large scale integration) such as DSP (Digital Signal Processor), ASIC (Application Specific Integrated Circuit), FPGA (Field-Programmable Gate Array), logic circuits, and others. It may be formed by hardware such as a digital circuit of. Further, an analog circuit may be included in at least a part of each of the above processing units.
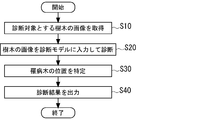
- FIG. 8 is a diagram showing a process in which the diagnostic device 20 diagnoses a diseased tree with respect to an image of a tree to be diagnosed.
- the diagnostic apparatus 20 executes the process of FIG. 8 when the start of diagnosis is instructed.
- step S10 the diagnostic device 20 acquires an image of the tree to be diagnosed.
- step S20 the diagnostic device 20 diagnoses the tree including the affected leaf group as a diseased tree by inputting the image of the tree acquired in step S10 into the diagnostic model generated by the machine learning device 30. , Diagnose a tree that does not contain the affected leaf group as a healthy tree.
- the diagnostic device 20 identifies the position where the diseased tree exists based on the position in the image of the tree diagnosed as the diseased tree in the image to be diagnosed.
- the diagnostic device 20 refers to the log data and is based on the position and attitude of the flying object 10 when the image to be diagnosed is taken, and the position of the tree diagnosed as the diseased tree in the image. , Identify the location of the diseased tree.
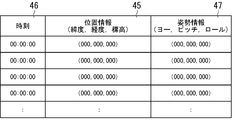
- FIG. 9 is a diagram showing an example of log data
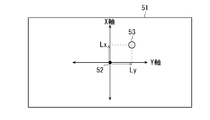
- FIG. 10 is an explanatory diagram of a process for identifying the position where the diseased tree exists based on the position in the image.
- the flying object 10 has the position information 45 of the flying object 10, the time information 46 indicating the time when the position information is acquired, and the attitude information 47 of the flying object 10 at the time.
- the position information 45 is, for example, information indicating a position using latitude and longitude (longitude / latitude) and altitude in the world geodetic system.
- the attitude information 47 is based on, for example, a state in which the flying object 10 is horizontal and faces a predetermined direction (for example, north), and the inclination from this reference state is indicated by rotation angles in the pitch direction, the roll direction, and the yaw direction. The value.
- the image 51 shown in FIG. 10 was taken by the photographing device 13, for example, the center of the image 51 is the origin 52, the X-axis passing through the origin 52 corresponds to the front-rear axis of the flying object 10, and the Y-axis is It corresponds to the left and right axes of the flying object 10.
- the flying object 10 arranges the photographing lens directly downward and the flying object 10 flies in a horizontal state, the object reflected in the center of the image 51 exists at the same latitude and longitude as the flying object 10.
- the object 53 is shown in the image 51 at a position separated from the origin 52 by a distance Lx in the X-axis direction and a distance Ly in the Y-axis direction.
- the distances corresponding to the distances Lx and Ly on the image 51 are obtained, for example, by the angle of view of the photographing lens and the altitude of the flying object 10 (height from the ground to the flying object).
- a position separated from the position of the flying object 10 by a distance corresponding to the distance Lx in the direction corresponding to the X-axis and a distance corresponding to the distance Lx in the direction corresponding to the X-axis is defined as the position where the object 53 exists. You can ask.
- the positional relationship between the position on the image and the position on the ground changes according to the tilt. Therefore, the position on the screen is changed according to the attitude information 47. Find the position on the ground corresponding to the position.
- step S40 the diagnostic device 20 outputs the position of the diseased tree obtained in step S30 as the result of the diagnosis.
- FIG. 11 is a diagram showing an example in which the positions of affected trees are plotted on a map.
- white “D”, “M”, and “L” indicate the diseased tree.
- “D” is severe
- “M” is moderate
- “L” is mildly affected tree.
- FIG. 12 is a diagram showing an SSD network structure. This technique is based on a feed-forward convolutional network, which produces a collection of fixed-length size bounding boxes, scores the existence of object class entities within those boxes, and finally.
- Non-maximum suppression is performed to generate a normal detection.
- the first layer of the network is based on the standard architecture used for image classification, which is the base network.
- the VGG-16 network was used as the base network, but it is not limited to this.
- Each added feature layer (or an existing feature layer in the base network) can generate a fixed set of detection predictions using a set of convolution filters. These are shown at the top of the SSD network structure in FIG.
- the basic element for predicting potential detection parameters is a small kernel of 3x3xp, which is relative to the category score, or the coordinates of the default box. Generate all shape offsets.
- the kernel produces an output value at each position of m ⁇ n to which it applies.
- the output value of the bounding box offset is measured against the position of the default box with respect to the position of each feature map.
- each feature map cell and a set of default bounding boxes are associated for multiple feature maps.
- the default boxes are convolved to fill the feature map tightly so that the position of each default box is fixed relative to its corresponding cell.
- c class scores and four offsets with respect to the shape of the original default box are calculated.
- the total number of filters applied around each position in the feature map is (c + 4) k, producing (c + 4) kmn outputs for the m ⁇ n feature map.
- the default box in this example applies to several feature maps with different resolutions. Using different default box shapes in some feature maps can efficiently discretize the output box shape. Also, in this example, the default box is matched with all correct boxes whose jaccard overlap is higher than the threshold (0.5). This simplifies the learning problem rather than having only one default box selected.
- ⁇ i x p ij ⁇ 1 can be obtained.
- the overall objective error function (loss function) is a weighted sum of the misalignment error (loc) and the classification error (conf) as in Equation A of FIG.
- N is the number of matching default boxes.
- the misalignment error is the Smooth L1 error between the parameters of the predicted box (l) and the correct answer box (g) (Equation B). Then, the offset is regressed with respect to the center (cx, xy) of the default bounding box (d) and its width (w) and height (h).
- the classification error is the softmax error for the certainty (c) of multiple classes (Equation C). In the next evaluation, the weight term ⁇ was set to 1 by cross-validation.
- FIG. 13 is a diagram showing a breakdown of a plurality of data sets.
- data of clones P2 to P3 and young to old trees were used.
- the data set (i) the data of the clone P2 and the block alone as the middle age of the tree were used, and in the data set (ii), the data of the clone P3 and the different ages of the tree from young to old were used.
- data set (iii) data of clones P2 to P4 and different clones of middle age were used.
- the dataset (iv) the entire data was used, and in the dataset (v), the data of the seriously affected trees were used.
- FIG. 14 is a diagram showing an example of the diagnosis result.
- H1 to H6 and D1 to D6 are tree regions extracted from the captured image by the diagnostic unit 22.
- the portion labeled with the rectangular frame is an image of the leaf group selected by the diagnostic unit 22.
- the diagnostic unit 22 of the present embodiment shows the selected leaf group having the characteristic of disease (hereinafter, also referred to as the diseased leaf group) in red, and in FIG. 14, the diseased leaf group is shown.
- the label is shaded with diagonal lines.
- the diagnostic unit 22 showed the frame and label of the selected leaf group of healthy ones having no characteristic of disease (hereinafter, also referred to as healthy leaf group) in blue.
- FIG. 14 FIG.
- the diagnostic unit 22 diagnoses the trees reflected in the tree regions H05, D1, D2, D4 to D6 having the diseased leaf group as the diseased tree, and the tree regions H01 to H4, H6, D3 having no diseased leaf group.
- the tree reflected in is diagnosed as a healthy tree.
- the trees in the tree areas H1 to H6 were healthy trees, and the trees in the tree areas D1 to D6 were diseased trees. .. That is, the tree region H5 mistakes a healthy tree for a diseased tree, the tree region D3 mistakes a diseased tree for a healthy tree, and the others are correct.
- TP is a case where the diagnosis result of the diagnosis unit 22 is illness and the confirmation result is illness.
- FP is a case where the diagnosis result of the diagnosis unit 22 is sick and the confirmation result is sound.
- FN is a case where the diagnosis result of the diagnosis unit 22 is sound and the confirmation result is illness.
- TN is a case where the diagnosis result of the diagnosis unit 22 is sound and the confirmation result is sound.
- the correct answer rate is the ratio at which the diagnosis result that the diagnosis unit 22 has determined to be "healthy” or “affected” and the actual confirmation result match, and is obtained from the following formula 1.
- Correct answer rate (TP + TN) / (TP + FP + TN + FN) ... Equation 1
- the precision rate is the ratio at which the diagnosis result of the diagnosis unit 22 as "affected” is actually “affected”, and is obtained from the following formula 2.
- Conformity rate TP / (TP + FP) ⁇ ⁇ ⁇ Equation 2
- Table 2 shows the results of evaluating the accuracy rate (Accuracy), precision rate (Precision), and recall rate (Recall) of the diagnosis results of the diagnosis unit 22 in comparison with the actual confirmation results.
- the morbidity rate is about 1%, so if all the trees are judged to be healthy, the correct answer rate will be 99%, but in this case, all the sick trees will be overlooked. Therefore, there is no point in increasing only the correct answer rate.
- the recall rate will be 100% and the diseased tree will not be overlooked, but the correct answer rate and the precision rate will be as low as 1%, and of course there is no point in diagnosing.
- the precision rate is low, when treating or cutting roots of a tree diagnosed as having a disease, it is confirmed that the root is actually healthy when the root is dug up, and the work such as digging up is wasted. Will often be. Therefore, it is desirable that the precision rate and the recall rate can be appropriately increased.
- the inventors of the present application repeatedly examined the SSD parameters shown in FIG. 12 to obtain the diagnostic result, and the loss function L (x, c, l, Focused on g).
- the inventors of this loss function L (x, c, l, g) under the condition that a plurality of trees are photographed from the sky and the characteristics of the leaf group are detected as in the present embodiment. It was found that the diagnostic accuracy can be improved by reducing the parameter ⁇ and increasing the weight of the classification error with respect to the misalignment error.
- Table 3 evaluates the diagnostic results when the parameter ⁇ is 0.5.
- the parameter ⁇ is not limited to 0.5, and may be, for example, in the range of 0.25 to 0.75.
- the diseased tree can be diagnosed with high accuracy.
- the accuracy is 20% or less. Therefore, the diagnostic device of the present embodiment greatly improves the diagnostic accuracy.
- the disease of Hevea brasiliensis has been described, but the diseased tree diagnosis system of this embodiment is not limited to Hevea brasiliensis, and if it is a disease characterized by disease in the leaf group, other diseases Can also be diagnosed.
Abstract
Provided is a technique which can diagnose a disease affecting a tree with high accuracy. This affected tree diagnosis system is provided with: a subject acquisition unit for acquiring an image of a tree of interest; a diagnosis unit for inputting the image of the tree of interest to a diagnosis model, which has experienced a machine learning for diagnosing a tree having affected leaves as an affected tree from the image of the tree, by employing, as learning data, an image of a tree, information showing an area in which leaves are therein in the image, and information showing whether or not a characteristic property of the affecting disease appears in the area, thereby diagnosing a tree having affected leaves as an affected tree; and a diagnosis result output unit for outputting the results of the diagnosis.
Description
本発明は、罹病木診断システム、罹病木診断、及び罹病木診断プログラムに関する。
The present invention relates to a diseased tree diagnosis system, a diseased tree diagnosis, and a diseased tree diagnosis program.
従来、パラゴムノキの病気として、根白腐病が知られている。根白腐病は、病原菌が根に感染し組織を腐敗させることで、樹木を枯死させる。罹病した木を放置すると、周囲の健全な木に伝染するため、罹病を早期に発見して対処することが望ましい。この罹病の診断は、例えば、熟練者が葉の色や状態を見て見当をつけ、罹病が疑われる木の根を掘って、感染しているか否かを確定していた。
Conventionally, root rot is known as a disease of Hevea brasiliensis. Root rot kills trees by infecting roots with pathogens and causing tissue rot. If the affected tree is left unattended, it will be transmitted to the surrounding healthy trees, so it is desirable to detect the disease early and deal with it. The diagnosis of this disease was made, for example, by a skilled worker looking at the color and condition of the leaves to make an estimate and digging the roots of a tree suspected of having the disease to determine whether or not it was infected.
また、特許文献1では、植物病の画像と対応する診断結果とを学習データとして複数取り込み、植物病に関する画像特徴データを作成し、保持する深層学習器と、診断対象とする画像を入力する入力部と、前記深層学習器を用いて、入力された画像がどの診断結果に分類されるかを識別する解析部とを備える植物病診断システムが提案されている。
Further, in Patent Document 1, a plurality of images of plant diseases and corresponding diagnosis results are captured as learning data, image feature data related to plant diseases is created and held, and an input for inputting an image to be diagnosed is input. A plant disease diagnostic system including a unit and an analysis unit that identifies which diagnostic result the input image is classified by using the deep learning device has been proposed.
早期に罹病を発見するためには、僅かな病変を見分ける必要があり、熟練者であっても診断が難しく、罹病か健全かを明確に診断できないケースもある。罹病の見落としを防ぐためには、明確に健全と判断できる樹木以外は、罹病木と診断することになる。このため、罹病と診断された木の根を掘り、根の状態を確認した際に、健全であること、即ち診断が誤っていたとの結果になる割合が多く、無駄に根を掘って確認する手間がかかるという問題があった。そこで、診断の精度、特に罹病と診断した場合の正確性(再現率)の向上が望まれていた。
In order to detect the disease at an early stage, it is necessary to distinguish a slight lesion, and even an expert is difficult to diagnose, and there are cases where it is not possible to clearly diagnose whether the disease is diseased or healthy. In order to prevent oversight of the disease, it is necessary to diagnose the diseased tree except for the trees that can be clearly judged to be healthy. For this reason, when digging the roots of a tree diagnosed with a disease and checking the root condition, there are many cases where the result is that the roots are healthy, that is, the diagnosis is incorrect, and it takes time and effort to dig and check the roots wastefully. There was a problem that it took. Therefore, it has been desired to improve the accuracy of diagnosis, particularly the accuracy (recall rate) when diagnosing a disease.
また、特許文献1では、植物病の画像と診断結果を取り込んで画像特徴データを作成し、入力画像がどの診断結果に該当するかを識別する。この場合、入力画像上で病変が明らかであれば、診断可能であるが、ゴムの木のように、主な病変が根に現れ、地上部の病変が僅かなものは、精度良く診断することができなかった。例えば、罹病したゴムの木の葉は黄色味が健全なものより強くなるが、若い健全な葉も同様の色であり、葉の色で診断することは困難である。同様に、葉の形状についても健全なものと大きな差はなく、例えば、罹病木の葉を個々に撮影して画像特徴データを作成しても、罹病を精度良く診断することはできなかった。
Further, in Patent Document 1, an image of a plant disease and a diagnosis result are taken in to create image feature data, and which diagnosis result the input image corresponds to is identified. In this case, if the lesion is clear on the input image, it can be diagnosed, but if the main lesion appears at the root and the lesion on the ground is slight, such as a rubber tree, it should be diagnosed accurately. I couldn't. For example, the leaves of a diseased rubber tree have a stronger yellow tint than that of a healthy one, but young healthy leaves have a similar color and are difficult to diagnose by leaf color. Similarly, the shape of the leaves was not significantly different from that of the healthy ones. For example, even if the leaves of the diseased tree were individually photographed to create image feature data, the disease could not be diagnosed accurately.
そこで、本発明は、樹木の罹病を高精度に診断可能にする技術の提供を目的とする。
Therefore, an object of the present invention is to provide a technique capable of diagnosing a disease of a tree with high accuracy.
上記課題を解決するため、本発明の罹病木診断システムは、
診断対象とする樹木の画像を取得する対象取得部と、
樹木の画像、当該画像内で葉群が写っている範囲を示す情報、及び前記範囲内に罹病の特徴を有するか否かを示す情報を教師データとして、樹木の画像から罹病している葉群を含む樹木を罹病木として診断するための機械学習を行った診断モデルに、前記診断対象とする樹木の画像を入力することにより、罹病している葉群を含む樹木を罹病木として診断する診断部と、
前記診断の結果を出力する診断結果出力部と、を備える。 In order to solve the above problems, the diseased tree diagnostic system of the present invention is used.
The target acquisition unit that acquires the image of the tree to be diagnosed,
The image of the tree, the information indicating the range in which the leaf group is shown in the image, and the information indicating whether or not the diseased characteristic is present in the range are used as teacher data, and the affected leaf group is included from the image of the tree. A diagnostic unit that diagnoses a tree including a diseased leaf group as a diseased tree by inputting an image of the tree to be diagnosed into a machine-learned diagnostic model for diagnosing a tree as a diseased tree.
It includes a diagnosis result output unit that outputs the result of the diagnosis.
前記樹木の画像は、前記樹木の上方から撮影した俯瞰画像であってもよい。
The image of the tree may be a bird's-eye view image taken from above the tree.
前記罹病木診断システムは、前記葉群が、前記樹木の上端より所定距離下側に設定された第一高さと、当該第一高さより所定距離下側に設定された第二高さとの間に存在するものであってもよい。
In the diseased tree diagnostic system, the leaf group exists between a first height set a predetermined distance below the upper end of the tree and a second height set a predetermined distance below the first height. It may be something to do.
前記罹病木診断システムは、前記診断対象とする樹木の画像に対して、回転、移動、拡大、縮小、反転、色変化、ノイズ付加、ぼかし、高周波成分強調、及び歪みのうち少なくとも1つの画像処理を施し、画像処理後の画像を画像処理前の画像と別の教師データとし、前記教師データの数を増加させる前処理部を更に備え、
前記モデル作成部が、増加された教師データを用いて機械学習を行ってもよい。 The diseased tree diagnosis system processes at least one of rotation, movement, enlargement, reduction, inversion, color change, noise addition, blurring, high frequency component enhancement, and distortion with respect to the image of the tree to be diagnosed. The image after image processing is used as teacher data different from the image before image processing, and a pre-processing unit for increasing the number of the teacher data is further provided.
The model creation unit may perform machine learning using the increased teacher data.
前記罹病木診断システムは、前記診断対象の画像において前記罹病木と診断された樹木の当該画像内の位置に基づいて、前記罹病木が存在している位置を特定する位置特定部を更に備えてもよい。
The diseased tree diagnosis system further includes a position specifying unit that identifies the position where the diseased tree exists based on the position in the image of the tree diagnosed as the diseased tree in the image to be diagnosed. May be good.
前記診断対象の画像が、前記樹木の上空を飛行する飛行体によって撮影された場合に、前記位置特定部が、前記診断対象の画像が撮影された時の前記飛行体の位置と、前記罹病木と診断された樹木の当該画像内の位置とに基づいて、前記罹病木が存在している位置を特定しても良い。
When the image to be diagnosed is photographed by an air vehicle flying over the tree, the positioning unit determines the position of the air vehicle when the image to be diagnosed is photographed and the diseased tree. The position where the diseased tree exists may be specified based on the position of the tree diagnosed as having the disease in the image.
上記課題を解決するため、本発明の罹病木診断方法は、
診断対象とする樹木の画像を取得するステップと、
樹木の画像、当該画像内で葉群が写っている範囲を示す情報、及び前記範囲内に罹病の特徴を有するか否かを示す情報を教師データとして、樹木の画像から罹病している葉群を含む樹木を罹病木として診断するための機械学習を行った診断モデルに、前記診断対象とする樹木の画像を入力することにより、罹病している葉群を含む樹木を罹病木として診断するステップと、
前記診断の結果を出力するステップと、
をコンピュータが実行する。 In order to solve the above problems, the diseased tree diagnosis method of the present invention is used.
Steps to acquire an image of the tree to be diagnosed,
The image of the tree, the information indicating the range in which the leaf group is shown in the image, and the information indicating whether or not the diseased characteristic is present in the range are used as teacher data, and the affected leaf group is included from the image of the tree. A step of diagnosing a tree including a diseased leaf group as a diseased tree by inputting an image of the tree to be diagnosed into a machine-learned diagnostic model for diagnosing a tree as a diseased tree.
The step of outputting the result of the diagnosis and
Is executed by the computer.
本発明は、前記罹病木診断方法の各ステップをコンピュータに実行させるための罹病木診断プログラムであってもよい。また、本発明は、前記罹病木診断プログラムをコンピュータが読み取り可能であって、非一時的に記憶する記憶媒体であってもよい。
The present invention may be a diseased tree diagnosis program for causing a computer to execute each step of the diseased tree diagnosis method. Further, the present invention may be a storage medium in which the diseased tree diagnosis program can be read by a computer and stored non-temporarily.
上記課題を解決するため本発明の機械学習装置は、
樹木の画像、当該画像内で葉群が写っている範囲を示す情報、及び前記範囲内に罹病の特徴を有するか否かを示す情報を教師データとして取得するデータ取得部と、
前記教師データを用いて機械学習することにより、樹木の画像から罹病している葉群を含む樹木を罹病木として診断する診断モデルを生成するモデル生成部と、
を備える。 In order to solve the above problems, the machine learning device of the present invention
A data acquisition unit that acquires an image of a tree, information indicating a range in which a group of leaves is shown in the image, and information indicating whether or not the area has a disease characteristic as teacher data.
A model generation unit that generates a diagnostic model for diagnosing a tree including a diseased leaf group as a diseased tree from an image of the tree by machine learning using the teacher data.
To be equipped.
本発明は、樹木の罹病を高精度に診断可能にする技術を提供することができる。
The present invention can provide a technique capable of diagnosing a disease of a tree with high accuracy.
〈第一実施形態〉
《装置構成》
以下本発明の一実施形態について図面を用いて説明する。図1は、本実施形態に係る罹病木診断システム100の概略構成図である。罹病木診断システム100は、飛行体10や、診断装置20、機械学習装置30を有している。罹病木診断システム100は、飛行体10によって上空から診断対象とする樹木の画像を撮影し、ディープラーニングによって作成した診断モデル(ニューラルネットワーク)を用いて、診断対象とする樹木の画像から罹病木を診断する。この診断モデルは、上方から撮影した樹木の俯瞰画像と、当該画像内で罹病の特徴を有する葉群が写っている範囲を示す情報とを教師データとしてディープラーニング(機械学習)を行ったものである。このように本実施形態の罹病木診断システム100は、上方から撮影した葉群の状態に基づいて診断を行うことにより、葉群に現れる罹病の特徴を的確に捉え、高精度に罹病木の診断を行うことができるようにしている。 <First Embodiment>
"Device configuration"
Hereinafter, an embodiment of the present invention will be described with reference to the drawings. FIG. 1 is a schematic configuration diagram of a diseasedtree diagnosis system 100 according to the present embodiment. The diseased tree diagnosis system 100 includes a flying object 10, a diagnostic device 20, and a machine learning device 30. The diseased tree diagnosis system 100 takes an image of the tree to be diagnosed from the sky by the flying object 10, and uses a diagnostic model (neural network) created by deep learning to obtain the diseased tree from the image of the tree to be diagnosed. Diagnose. In this diagnostic model, deep learning (machine learning) was performed using a bird's-eye view image of a tree taken from above and information indicating the range in which a group of leaves having a disease characteristic is shown in the image as teacher data. .. As described above, the diseased tree diagnosis system 100 of the present embodiment accurately grasps the characteristics of the disease appearing in the leaf group and diagnoses the diseased tree with high accuracy by performing the diagnosis based on the state of the leaf group photographed from above. I am trying to be able to do it.
《装置構成》
以下本発明の一実施形態について図面を用いて説明する。図1は、本実施形態に係る罹病木診断システム100の概略構成図である。罹病木診断システム100は、飛行体10や、診断装置20、機械学習装置30を有している。罹病木診断システム100は、飛行体10によって上空から診断対象とする樹木の画像を撮影し、ディープラーニングによって作成した診断モデル(ニューラルネットワーク)を用いて、診断対象とする樹木の画像から罹病木を診断する。この診断モデルは、上方から撮影した樹木の俯瞰画像と、当該画像内で罹病の特徴を有する葉群が写っている範囲を示す情報とを教師データとしてディープラーニング(機械学習)を行ったものである。このように本実施形態の罹病木診断システム100は、上方から撮影した葉群の状態に基づいて診断を行うことにより、葉群に現れる罹病の特徴を的確に捉え、高精度に罹病木の診断を行うことができるようにしている。 <First Embodiment>
"Device configuration"
Hereinafter, an embodiment of the present invention will be described with reference to the drawings. FIG. 1 is a schematic configuration diagram of a diseased
本実施形態では、パラゴムノキの病害診断の例を説明する。パラゴムノキの根白腐病は、糸状菌の一種であるパラゴムノキ根白腐病菌(Rigidoporus microporus, ネッタイスルメタケ)が根に感染することで引き起こされる病害である。病害が進行すると、根が腐敗し、樹木が枯死する。また、病害が進行する過程で、病原菌が周囲の健全な木の根にも感染して罹病させるので、罹病を早期に発見して対処することが望ましい。しかしながら、罹病初期の病変は、主に地下の根で起こり、地上部の変化は僅かである。例えば、根が水分を充分に吸収できなくなることで葉が黄変する。しかしながら、この黄変は僅かで、若い葉や日当たりの少ない葉も同様の色を呈することがあるため、葉の色だけから病害を診断することはできなかった。そこで本実施形態の罹病木診断システム100は、葉群の画像に基づいて罹病を診断する。これにより、葉の色だけでなく、葉の付き方、特に葉の密集度や、枝に対する葉の角度などに基づき、精度良く診断できる。また、樹木の上方から撮影した画像を用いることにより、この画像に写る葉は、上空から見通せる位置にあるものとなり、日当たりが悪いことによって黄変したものを除外できるので、精度良く診断できる。
In this embodiment, an example of disease diagnosis of Hevea brasiliensis will be described. Hevea brasiliensis root rot is a disease caused by infection of the roots of Hevea brasiliensis root rot (Rigidoporus microporus), which is a type of filamentous fungus. As the disease progresses, the roots rot and the trees die. In addition, as the disease progresses, pathogens infect the roots of surrounding healthy trees and cause the disease, so it is desirable to detect the disease at an early stage and deal with it. However, lesions in the early stages of illness occur mainly in the underground roots, with slight changes in the above-ground part. For example, the leaves turn yellow when the roots cannot absorb enough water. However, this yellowing was slight, and young leaves and leaves with less sunlight may exhibit the same color, so that the disease could not be diagnosed from the leaf color alone. Therefore, the diseased tree diagnosis system 100 of the present embodiment diagnoses the disease based on the image of the leaf group. This makes it possible to make an accurate diagnosis based not only on the color of the leaves but also on the way the leaves are attached, particularly the density of the leaves and the angle of the leaves with respect to the branches. In addition, by using an image taken from above the tree, the leaves shown in this image are in a position where they can be seen from the sky, and those that have turned yellow due to poor sunlight can be excluded, so that the diagnosis can be made accurately.
《飛行体》
図2は、飛行体10の構成図である。図2に示すように、飛行体10は、駆動部11や、制御部12、撮影装置13、位置情報取得部14を備えた小型無人機(ドローン)である。 《Flying body》
FIG. 2 is a configuration diagram of the flyingobject 10. As shown in FIG. 2, the flying object 10 is a small unmanned aerial vehicle (drone) including a drive unit 11, a control unit 12, a photographing device 13, and a position information acquisition unit 14.
図2は、飛行体10の構成図である。図2に示すように、飛行体10は、駆動部11や、制御部12、撮影装置13、位置情報取得部14を備えた小型無人機(ドローン)である。 《Flying body》
FIG. 2 is a configuration diagram of the flying
駆動部11は、モータ又は内燃機関によってプロペラを回転させることによって浮力を得ると共に、プロペラの回転軸を垂直軸に対して傾けることによって推力を得る。駆動部の構成はこれに限らず、他の構成であってもよい。例えば、浮力を得るための気球と推力を得るためのプロペラとを有する構成であってもよい。
The drive unit 11 obtains buoyancy by rotating the propeller by a motor or an internal combustion engine, and obtains thrust by tilting the rotation axis of the propeller with respect to the vertical axis. The configuration of the drive unit is not limited to this, and other configurations may be used. For example, it may be configured to have a balloon for obtaining buoyancy and a propeller for obtaining thrust.
制御部12は、ユーザによる操作を受け付けて、当該操作に応じて駆動部11を制御し、飛行体10の飛行状態を制御する。また、制御部12は、撮影装置13を制御し、撮影の開始や停止、撮影方向の変更などの動作を制御する。
The control unit 12 receives an operation by the user, controls the drive unit 11 according to the operation, and controls the flight state of the flying object 10. In addition, the control unit 12 controls the photographing device 13 to control operations such as starting and stopping shooting and changing the shooting direction.
撮影装置13は、撮影レンズ13Aにより、診断対象としての樹木の像を撮像素子13Bの受光面上に形成し、当該像を撮像素子13Bによって電気信号に変換して撮影画像のデータを取得する。また、本実施形態の撮影装置13は、撮影画像のデータをその撮影時刻と共に記録する。
The photographing device 13 forms an image of a tree as a diagnosis target on the light receiving surface of the image sensor 13B by the photographing lens 13A, converts the image into an electric signal by the image pickup element 13B, and acquires the data of the photographed image. Further, the photographing device 13 of the present embodiment records the data of the photographed image together with the photographing time.
位置情報取得部14は、衛星測位システム等によって位置情報を取得し、撮影装置13で撮影を行った際の自己の位置(撮影位置とも称す)を撮影画像と対応つけて記録する。例えば、位置情報(緯度・経度など)を所定周期で取得し、その取得時刻と共にログデータとして記録する。これにより、撮影画像の撮影時刻とログデータを照合することで、撮影時に飛行体10が何処に位置していたかが求められる。また、ログデータは、位置情報と共に、飛行体10が、どの方角に向いているのかを示す姿勢情報を記録してもよい。
The position information acquisition unit 14 acquires position information by a satellite positioning system or the like, and records its own position (also referred to as a shooting position) when shooting with the shooting device 13 in association with the shot image. For example, position information (latitude, longitude, etc.) is acquired at a predetermined cycle and recorded as log data together with the acquisition time. As a result, by collating the shooting time of the shot image with the log data, it is possible to determine where the flying object 10 was located at the time of shooting. In addition, the log data may record attitude information indicating in which direction the flying object 10 is facing, together with the position information.
なお、飛行体10は、小型無人機に限らず、有人の飛行機やヘリコプター、人工衛星等であってもよい。
The flying object 10 is not limited to a small unmanned aerial vehicle, but may be a manned airplane, a helicopter, an artificial satellite, or the like.
《診断装置》
図3は、診断装置20の構成図である。図3に示すように、診断装置20は、対象取得部21や、診断部22、診断結果出力部23、位置特定部24を有している。 《Diagnostic device》
FIG. 3 is a configuration diagram of thediagnostic device 20. As shown in FIG. 3, the diagnostic apparatus 20 includes a target acquisition unit 21, a diagnostic unit 22, a diagnosis result output unit 23, and a position specifying unit 24.
図3は、診断装置20の構成図である。図3に示すように、診断装置20は、対象取得部21や、診断部22、診断結果出力部23、位置特定部24を有している。 《Diagnostic device》
FIG. 3 is a configuration diagram of the
対象取得部21は、診断対象とする樹木の画像データを飛行体10から取得する。この画像データの取得は、例えば、通信ケーブル又は通信ネットワークを介して飛行体10と接続し、通信によって飛行体10から受信する。また、飛行体10が、診断対象とする樹木の画像データをメモリカード等の記憶媒体に記憶し、診断装置20が、この記憶媒体から当該画像データを読み出して取得してもよい。
The target acquisition unit 21 acquires image data of the tree to be diagnosed from the flying object 10. The acquisition of the image data is connected to the flying object 10 via, for example, a communication cable or a communication network, and is received from the flying object 10 by communication. Further, the flying object 10 may store the image data of the tree to be diagnosed in a storage medium such as a memory card, and the diagnostic device 20 may read the image data from the storage medium and acquire the image data.
診断部22は、樹木の画像、当該画像内で葉群が写っている範囲を示す情報、及び前記範囲内に罹病の特徴を有するか否かを示す情報を教師データとして、樹木の画像から罹病している葉群を含む樹木を罹病木として診断するための機械学習を行った診断モデルに、前記診断対象とする樹木の画像を入力することにより、罹病している葉群を含む樹木を罹病木として診断する。
The diagnosis unit 22 receives the disease from the image of the tree using the image of the tree, the information indicating the range in which the leaf group is shown in the image, and the information indicating whether or not the disease has a characteristic of the disease in the range as teacher data. By inputting an image of the tree to be diagnosed into a diagnostic model in which machine learning is performed to diagnose a tree containing a diseased leaf group as a diseased tree, a tree including a diseased leaf group is diagnosed as a diseased tree. do.
診断結果出力部23は、診断部22による診断の結果を出力する。この診断の結果の出力は、例えば、表示装置への表示、プリンタによる印刷、記憶媒体への記憶、他の装置への送信等である。
The diagnosis result output unit 23 outputs the result of the diagnosis by the diagnosis unit 22. The output of the result of this diagnosis is, for example, display on a display device, printing by a printer, storage on a storage medium, transmission to another device, or the like.
位置特定部24は、前記診断対象の画像において前記罹病木と診断された樹木の当該画像内の位置に基づいて、前記罹病木が存在している位置を特定する。例えば、前記診断対象の画像が、前記樹木の上空を飛行する飛行体によって撮影された場合に、前記位置特定部が、前記診断対象の画像が撮影された時の前記飛行体の位置と、前記罹病木と診断された樹木の当該画像内の位置とに基づいて、前記罹病木が存在している位置を特定する。
The position specifying unit 24 identifies the position where the diseased tree exists based on the position in the image of the tree diagnosed as the diseased tree in the image to be diagnosed. For example, when the image of the diagnosis target is taken by an air vehicle flying over the tree, the position specifying unit determines the position of the air vehicle when the image of the diagnosis target is taken and the position of the air vehicle. Based on the position of the tree diagnosed as the diseased tree in the image, the position where the diseased tree exists is specified.
図4は、診断装置20のハードウェア構成図である。診断装置20は、接続バス221によって相互に接続されたプロセッサ222、メモリ223、入出力IF(インターフェース)224、通信IF225を有するコンピュータである。プロセッサ222は、入力された情報を処理し、処理結果を出力することにより、装置全体の制御等を行う。プロセッサ222は、CPU(Central Processing Unit)や、MPU(Micro-processing unit)とも呼ばれる。プロセッサ222は、単一のプロセッサに限られず、マルチプロセッサ構成であってもよい。また、単一のソケットで接続される単一のチップ内に複数のコアを有したマルチコア構成であってもよい。
FIG. 4 is a hardware configuration diagram of the diagnostic device 20. The diagnostic device 20 is a computer having a processor 222, a memory 223, an input / output IF (interface) 224, and a communication IF 225 connected to each other by a connection bus 221. The processor 222 processes the input information and outputs the processing result to control the entire apparatus. The processor 222 is also called a CPU (Central Processing Unit) or an MPU (Micro-processing unit). The processor 222 is not limited to a single processor, and may have a multiprocessor configuration. Further, it may be a multi-core configuration having a plurality of cores in a single chip connected by a single socket.
メモリ223は、主記憶装置と補助記憶装置とを含む。主記憶装置は、プロセッサ222の作業領域、プロセッサ222で処理される情報を一時的に記憶する記憶領域、通信データのバッファ領域として使用される。主記憶装置は、プロセッサ222がプログラムやデータをキャッシュしたり、作業領域を展開したりするための記憶媒体である。主記憶装置は、例えば、RAM(Random Access Memory)やROM(Read Only Memory)、フラッシュメモリを含む。補助記憶装置は、プロセッサ222により実行されるプログラムや、情報処理に用いられるデータ、動作の設定情報などを記憶する記憶媒体である。補助記憶装置は、例えば、HDD(Hard-disk Drive)やSSD(Solid State Drive)、EPROM(Erasable Programmable ROM)、フラッシュメモリ、USBメモリ、メモリカード等である。また、補助記憶装置は、対象取得部21で受信した診断対象とする樹木の画像(撮影画像)や、診断結果を記憶する
Memory 223 includes a main storage device and an auxiliary storage device. The main storage device is used as a work area of the processor 222, a storage area for temporarily storing information processed by the processor 222, and a buffer area for communication data. The main storage device is a storage medium for the processor 222 to cache programs and data and expand a work area. The main storage device includes, for example, a RAM (RandomAccessMemory), a ROM (ReadOnlyMemory), and a flash memory. The auxiliary storage device is a storage medium that stores a program executed by the processor 222, data used for information processing, operation setting information, and the like. The auxiliary storage device is, for example, an HDD (Hard-disk Drive), an SSD (Solid State Drive), an EPROM (Erasable Programmable ROM), a flash memory, a USB memory, a memory card, or the like. In addition, the auxiliary storage device stores the image (photographed image) of the tree to be diagnosed received by the target acquisition unit 21 and the diagnosis result.
入出力IF224は、診断装置20に接続する機器との間でデータの入出力を行うインターフェースである。入出力IF224は、例えば、CDやDVD等の記憶媒体からデータを読み取るディスクドライブ、操作部、表示装置等の機器との間でデータの入出力を行う。操作部は、マウスやキーボード、タッチパネル等、オペレータの操作によって診断装置20に対する情報が入力される入力部である。表示装置は、処理結果などの情報をオペレータに対して表示出力する出力部である。
The input / output IF224 is an interface for inputting / outputting data to / from a device connected to the diagnostic device 20. The input / output IF224 inputs / outputs data to / from a device such as a disk drive, an operation unit, or a display device that reads data from a storage medium such as a CD or DVD. The operation unit is an input unit such as a mouse, a keyboard, and a touch panel into which information for the diagnostic device 20 is input by an operator's operation. The display device is an output unit that displays and outputs information such as processing results to the operator.
通信IF25は、通信回線Nを介して他の装置との通信を行うインターフェース(通信モジュール)であり、CCU(Communication Control Unit)とも称す。なお、図6に示した診断装置20の構成要素はそれぞれ複数設けられてもよいし、一部の構成要素を設けないようにしてもよい。
The communication IF25 is an interface (communication module) that communicates with other devices via the communication line N, and is also called a CCU (Communication Control Unit). A plurality of components of the diagnostic device 20 shown in FIG. 6 may be provided, or some components may not be provided.
本実施形態の診断装置20では、プロセッサ222が、アプリケーションプログラムを実行することにより、診断装置20は、対象取得部21や、診断部22、診断結果出力部23、位置特定部24といった各処理部として機能する。即ち、プロセッサ222は、実行するソフトウェアに応じて各処理部として兼用され得る。但し、上記各処理部の一部又は全部が、DSP(Digital Signal Processor)、ASIC(Application Specific Integrated Circuit)、FPGA(Field-Programmable Gate Array)等の専用LSI(large scale integration)、論理回路、その他のデジタル回路といったハードウェアで形成されたものであってもよい。また、上記各処理部の少なくとも一部にアナログ回路を含む構成としてもよい。
In the diagnostic device 20 of the present embodiment, when the processor 222 executes the application program, the diagnostic device 20 is a processing unit such as a target acquisition unit 21, a diagnostic unit 22, a diagnosis result output unit 23, and a position specifying unit 24. Functions as. That is, the processor 222 can also be used as each processing unit depending on the software to be executed. However, some or all of the above processing units are dedicated LSIs (large scale integration) such as DSP (Digital Signal Processor), ASIC (Application Specific Integrated Circuit), FPGA (Field-Programmable Gate Array), logic circuits, and others. It may be formed by hardware such as a digital circuit of. Further, an analog circuit may be included in at least a part of each of the above processing units.
《機械学習装置》
図5は、機械学習装置30の構成図である。図5に示すように、機械学習装置30は、データ取得部31や、モデル生成部32を有している。 《Machine learning device》
FIG. 5 is a configuration diagram of themachine learning device 30. As shown in FIG. 5, the machine learning device 30 has a data acquisition unit 31 and a model generation unit 32.
図5は、機械学習装置30の構成図である。図5に示すように、機械学習装置30は、データ取得部31や、モデル生成部32を有している。 《Machine learning device》
FIG. 5 is a configuration diagram of the
データ取得部31は、樹木の画像、当該画像内で葉群が写っている範囲を示す情報、及び前記範囲内に罹病の特徴を有するか否かを示す情報を教師データとして取得する。
The data acquisition unit 31 acquires an image of the tree, information indicating the range in which the leaf group is shown in the image, and information indicating whether or not the disease has a characteristic in the range as teacher data.
モデル生成部32は、前記教師データを用いて機械学習することにより、樹木の画像から罹病している葉群を含む樹木を罹病木として診断する診断モデルを生成する。
The model generation unit 32 generates a diagnostic model for diagnosing a tree including a diseased leaf group as a diseased tree from an image of the tree by machine learning using the teacher data.
図6は、画像データを教師データとする処理の説明図である。図6において、画像41は、飛行体10によって撮影したオリジナル画像である。この画像41から、一本の木が写っている領域を木領域42として抽出する。本実施形態では、この木領域42を800×800ピクセル~1500×1500ピクセルで切り出している。
FIG. 6 is an explanatory diagram of processing using image data as teacher data. In FIG. 6, image 41 is an original image taken by the flying object 10. From this image 41, the area in which one tree is shown is extracted as the tree area 42. In the present embodiment, the tree area 42 is cut out at 800 × 800 pixels to 1500 × 1500 pixels.
次に、アノテーションツールを用い、これらの木領域42内の葉群が写っている範囲43を指定し、この範囲43内に罹病の特徴を有するか否かを入力し、これら範囲43を示す情報及び罹病か否かの情報をxml形式で記述したメタデータ44を作成する。そして、木領域42のデータとメタデータ44を教師データとして学習に用いる。ここで葉群とは、複数の葉の集まりであって、例えば5~500枚の葉を含むものである。なお、葉群を成す葉の数は、樹木の大きさ(幹の直径、樹高等)や種類、樹齢、目標とする検出精度等によって適宜定めてよく、10~300枚や、10~50枚であってもよい。葉群は、葉を支える枝を含んでもよい。また、一つの葉群は、同じ枝から派生した葉の集合や、枝の先端から所定距離内にある葉の集合であってもよい。ここで所定距離とは、例えば、50cm、1m、2mなど、30cm~3mの値である。このように、本実施形態では、葉単体の画像を教師データとするのではなく、葉群の画像(木領域42のデータ)を教師データとする。このため、本実施形態の教師データは、葉の色に加え、複数の葉の形状や、各葉の間隔(葉の密度)、枝に対する葉の角度(葉の付き方)等の情報を含む。例えば、若い葉であれば、柔らかく、枝から離れるにつれて、しな垂れるので、葉の付き方が、若い葉か否かの情報となる。このため、当該教師データを用いて学習した診断モデルであれば、黄色味が強い葉群について、葉がしな垂れていれば、若い葉のため健全と判別し、葉がしな垂れていなければ黄変の可能性が高いと判別できる。また、罹病して根が吸収する水分が減ることによって葉が縮れた場合、健全な場合と比べて、隣接する葉との間隔が広くなり、葉群の画像において葉の占める割合(葉の密度)が低くなる。このため、当該教師データを用いて学習した診断モデルは、罹病を診断する情報の一つとして、葉群の画像における葉の密度を用いることができる。
Next, using an annotation tool, specify the range 43 in which the leaf groups in these tree regions 42 are shown, enter whether or not the range 43 has the characteristics of illness, and the information indicating these ranges 43 and the information indicating these ranges 43. Metadata 44 is created in which information on whether or not the patient is ill is described in XML format. Then, the data of the tree region 42 and the metadata 44 are used for learning as teacher data. Here, the leaf group is a group of a plurality of leaves, and includes, for example, 5 to 500 leaves. The number of leaves forming a leaf group may be appropriately determined according to the size (trunk diameter, tree height, etc.) and type of the tree, the age of the tree, the target detection accuracy, etc., and may be 10 to 300 or 10 to 50. There may be. The leaf group may include branches that support the leaves. Further, one leaf group may be a set of leaves derived from the same branch or a set of leaves within a predetermined distance from the tip of the branch. Here, the predetermined distance is a value of 30 cm to 3 m, for example, 50 cm, 1 m, 2 m, and the like. As described above, in the present embodiment, the image of the leaf alone is not used as the teacher data, but the image of the leaf group (data of the tree region 42) is used as the teacher data. Therefore, the teacher data of the present embodiment includes information such as the shape of a plurality of leaves, the distance between each leaf (leaf density), and the angle of the leaf with respect to the branch (how the leaves are attached), in addition to the color of the leaves. .. For example, young leaves are soft and hang down as they move away from the branches, so the way the leaves are attached provides information on whether or not the leaves are young. Therefore, in the diagnostic model learned using the teacher data, if the leaves are dripping, it is judged to be healthy because the leaves are young, and if the leaves are not dripping, the leaves are judged to be healthy. It can be determined that there is a high possibility of yellowing. In addition, when the leaves are shrunk due to the disease and the water absorbed by the roots is reduced, the distance between the leaves and the adjacent leaves is wider than in the healthy case, and the proportion of the leaves in the image of the leaf group (leaf density). Will be low. Therefore, the diagnostic model learned using the teacher data can use the leaf density in the image of the leaf group as one of the information for diagnosing the disease.
このように、本実施形態では、樹木の画像について学習を行うが、学習に用いるデータは樹木の画像のみに限られるものではない。例えば犬、猫などの一般物体の画像セットを用いて事前学習し、事前学習済みのモデルをベースに、樹木の画像を用いて本番の学習(転移学習)を行って診断モデルを作成してもよい。これにより樹木の画像の数が少なくても高い検出精度の診断モデルを生成でき、教師データを作成する負荷を抑えることができる。
As described above, in the present embodiment, the image of the tree is learned, but the data used for the learning is not limited to the image of the tree. For example, even if pre-learning is performed using an image set of general objects such as dogs and cats, and based on the pre-learned model, actual learning (transfer learning) is performed using images of trees to create a diagnostic model. good. As a result, a diagnostic model with high detection accuracy can be generated even if the number of tree images is small, and the load of creating teacher data can be suppressed.
また、アノテーションツールを用いて、木領域42内の葉群が写っている範囲43を指定する際、樹木の上端より所定距離下側に設定された第一高さと、当該第一高さより所定距離下側に設定された第二高さとの間に存在する葉群を指定してもよい。例えば、第一高さは、樹木の上端より、50cm、1m、3mなど、50cm~5mの距離に設定される。また、第二高さは、第一高さより、1m、3m、5mなど、50cm~10mの距離に設定される。また、第一高さは、樹木の上端より、樹高の4%、6%、20%など、樹高の4%~30%にあたる距離に設定されてもよい。また、第二高さは、第一高さより、樹高の6%、20%、30%など、樹高の6%~50%にあたる距離に設定されてもよい。なお、第一高さ及び第二高さは、対象とする樹木の高さ(樹高)に応じて設定してもよい。本実施形態では、対象とする樹木がパラゴムノキであるため、この場合の樹高は、例えば10m~20mである。これに限らず、対象の樹木は、5m以上の高木としてもよい。
In addition, when specifying the range 43 in which the leaf group in the tree area 42 is reflected by using the annotation tool, the first height set to be a predetermined distance below the upper end of the tree and the first height set to be a predetermined distance below the first height are specified. A group of leaves existing between the second height set on the side may be specified. For example, the first height is set at a distance of 50 cm to 5 m, such as 50 cm, 1 m, 3 m, etc., from the upper end of the tree. The second height is set to a distance of 50 cm to 10 m, such as 1 m, 3 m, 5 m, etc., from the first height. Further, the first height may be set to a distance corresponding to 4% to 30% of the tree height, such as 4%, 6%, 20% of the tree height, from the upper end of the tree. Further, the second height may be set to a distance corresponding to 6% to 50% of the tree height, such as 6%, 20%, 30% of the tree height, from the first height. The first height and the second height may be set according to the height (tree height) of the target tree. In the present embodiment, since the target tree is Hevea brasiliensis, the tree height in this case is, for example, 10 m to 20 m. Not limited to this, the target tree may be a tall tree of 5 m or more.
更に、診断対象とする樹木の画像に対して、回転、移動、拡大、縮小、反転、色変化、ノイズ付加、ぼかし、高周波成分強調、及び歪みのうち少なくとも1つの画像処理を施し、画像処理後の画像を画像処理前の画像と別の教師データとし、教師データの数を増加させてもよい。これにより、明るさや画像の向き等の影響を抑えて高い検出精度の診断モデルを生成できる。
Further, the image of the tree to be diagnosed is subjected to at least one of rotation, movement, enlargement, reduction, inversion, color change, noise addition, blurring, high frequency component enhancement, and distortion, and after image processing. The image of is used as teacher data different from the image before image processing, and the number of teacher data may be increased. As a result, it is possible to generate a diagnostic model with high detection accuracy while suppressing the influence of brightness, image orientation, and the like.
図7は、機械学習装置30のハードウェア構成図である。機械学習装置30は、接続バス321によって相互に接続されたプロセッサ322、メモリ323、入出力IF(インターフェース)324、通信IF325を有するコンピュータである。プロセッサ322は、入力された情報を処理し、処理結果を出力することにより、装置全体の制御等を行う。プロセッサ322は、CPU(Central Processing Unit)や、MPU(Micro-processing unit)とも呼ばれる。プロセッサ322は、単一のプロセッサに限られず、マルチプロセッサ構成であってもよい。また、単一のソケットで接続される単一のチップ内に複数のコアを有したマルチコア構成であってもよい。
FIG. 7 is a hardware configuration diagram of the machine learning device 30. The machine learning device 30 is a computer having a processor 322, a memory 323, an input / output IF (interface) 324, and a communication IF 325 connected to each other by a connection bus 321. The processor 322 processes the input information and outputs the processing result to control the entire apparatus. The processor 322 is also called a CPU (Central Processing Unit) or an MPU (Micro-processing unit). The processor 322 is not limited to a single processor, and may have a multiprocessor configuration. Further, it may be a multi-core configuration having a plurality of cores in a single chip connected by a single socket.
メモリ323は、主記憶装置と補助記憶装置とを含む。主記憶装置は、プロセッサ322の作業領域、プロセッサ322で処理される情報を一時的に記憶する記憶領域、通信データのバッファ領域として使用される。主記憶装置は、プロセッサ322がプログラムやデータをキャッシュしたり、作業領域を展開したりするための記憶媒体である。主記憶装置は、例えば、RAM(Random Access Memory)やROM(Read Only Memory)、フラッシュメモリを含む。補助記憶装置は、プロセッサ322により実行されるプログラムや、情報処理に用いられるデータ、動作の設定情報などを記憶する記憶媒体である。補助記憶装置は、例えば、HDD(Hard-disk Drive)やSSD(Solid State Drive)、EPROM(Erasable Programmable ROM)、フラッシュメモリ、USBメモリ、メモリカード等である。
Memory 323 includes a main storage device and an auxiliary storage device. The main storage device is used as a work area of the processor 322, a storage area for temporarily storing information processed by the processor 322, and a buffer area for communication data. The main storage device is a storage medium for the processor 322 to cache programs and data and expand a work area. The main storage device includes, for example, a RAM (RandomAccessMemory), a ROM (ReadOnlyMemory), and a flash memory. The auxiliary storage device is a storage medium that stores a program executed by the processor 322, data used for information processing, operation setting information, and the like. The auxiliary storage device is, for example, an HDD (Hard-disk Drive), an SSD (Solid State Drive), an EPROM (Erasable Programmable ROM), a flash memory, a USB memory, a memory card, or the like.
入出力IF324は、機械学習装置30に接続する機器との間でデータの入出力を行うインターフェースである。入出力IF324は、例えば、CDやDVD等の記憶媒体からデータを読み取るディスクドライブ、操作部、表示装置等の機器との間でデータの入出力を行う。操作部は、マウスやキーボード、タッチパネル等、オペレータの操作によって機械学習装置30に対する情報が入力される入力部である。表示装置は、処理結果などの情報をオペレータに対して表示出力する出力部である。
The input / output IF324 is an interface for inputting / outputting data to / from a device connected to the machine learning device 30. The input / output IF324 inputs / outputs data to / from a device such as a disk drive, an operation unit, or a display device that reads data from a storage medium such as a CD or DVD. The operation unit is an input unit such as a mouse, a keyboard, and a touch panel into which information for the machine learning device 30 is input by an operator's operation. The display device is an output unit that displays and outputs information such as processing results to the operator.
通信IF35は、通信回線Nを介して他の装置との通信を行うインターフェース(通信モジュール)であり、CCU(Communication Control Unit)とも称す。なお、図7に示した機械学習装置30の構成要素はそれぞれ複数設けられてもよいし、一部の構成要素を設けないようにしてもよい。
The communication IF35 is an interface (communication module) that communicates with other devices via the communication line N, and is also called a CCU (Communication Control Unit). A plurality of components of the machine learning device 30 shown in FIG. 7 may be provided, or some components may not be provided.
本実施形態の機械学習装置30では、プロセッサ322が、アプリケーションプログラムを実行することにより、機械学習装置30は、データ取得部31や、モデル生成部32といった各処理部として機能する。即ち、プロセッサ322は、実行するソフトウェアに応じて各処理部として兼用され得る。但し、上記各処理部の一部又は全部が、DSP(Digital Signal Processor)、ASIC(Application Specific Integrated Circuit)、FPGA(Field-Programmable Gate Array)等の専用LSI(large scale integration)、論理回路、その他のデジタル回路といったハードウェアで形成されたものであってもよい。また、上記各処理部の少なくとも一部にアナログ回路を含む構成としてもよい。
In the machine learning device 30 of the present embodiment, the processor 322 executes an application program, so that the machine learning device 30 functions as each processing unit such as a data acquisition unit 31 and a model generation unit 32. That is, the processor 322 can also be used as each processing unit depending on the software to be executed. However, some or all of the above processing units are dedicated LSIs (large scale integration) such as DSP (Digital Signal Processor), ASIC (Application Specific Integrated Circuit), FPGA (Field-Programmable Gate Array), logic circuits, and others. It may be formed by hardware such as a digital circuit of. Further, an analog circuit may be included in at least a part of each of the above processing units.
《診断方法》
図8は、診断装置20が、診断対象とする樹木の画像について、罹病木の診断を行う処理を示す図である。診断装置20は、診断の開始が指示された場合に図8の処理を実行する。 << Diagnosis method >>
FIG. 8 is a diagram showing a process in which thediagnostic device 20 diagnoses a diseased tree with respect to an image of a tree to be diagnosed. The diagnostic apparatus 20 executes the process of FIG. 8 when the start of diagnosis is instructed.
図8は、診断装置20が、診断対象とする樹木の画像について、罹病木の診断を行う処理を示す図である。診断装置20は、診断の開始が指示された場合に図8の処理を実行する。 << Diagnosis method >>
FIG. 8 is a diagram showing a process in which the
ステップS10にて、診断装置20は、診断対象とする樹木の画像を取得する。
In step S10, the diagnostic device 20 acquires an image of the tree to be diagnosed.
ステップS20にて、診断装置20は、機械学習装置30によって生成された診断モデルに、ステップS10で取得した樹木の画像を入力することにより、罹病している葉群を含む樹木を罹病木として診断し、罹病している葉群を含まない樹木を健全木として診断する。
In step S20, the diagnostic device 20 diagnoses the tree including the affected leaf group as a diseased tree by inputting the image of the tree acquired in step S10 into the diagnostic model generated by the machine learning device 30. , Diagnose a tree that does not contain the affected leaf group as a healthy tree.
ステップS30にて、診断装置20は、診断対象の画像において罹病木と診断された樹木の当該画像内の位置に基づいて、前記罹病木が存在している位置を特定する。例えば、診断装置20は、ログデータを参照し、診断対象の画像が撮影された時の前記飛行体10の位置及び姿勢、並びに罹病木と診断された樹木の当該画像内の位置とに基づいて、前記罹病木が存在している位置を特定する。
In step S30, the diagnostic device 20 identifies the position where the diseased tree exists based on the position in the image of the tree diagnosed as the diseased tree in the image to be diagnosed. For example, the diagnostic device 20 refers to the log data and is based on the position and attitude of the flying object 10 when the image to be diagnosed is taken, and the position of the tree diagnosed as the diseased tree in the image. , Identify the location of the diseased tree.
図9は、ログデータの一例を示す図、図10は画像内の位置に基づいて、前記罹病木が存在している位置を特定する処理の説明図である。
FIG. 9 is a diagram showing an example of log data, and FIG. 10 is an explanatory diagram of a process for identifying the position where the diseased tree exists based on the position in the image.
飛行体10は、図9に示すように、飛行体10の位置情報45と、当該位置情報を取得した時刻を示す時刻情報46と、当該時刻における飛行体10の姿勢情報47とを有している。位置情報45は、例えば、世界測地系における経緯度(経度・緯度)および標高を用いて位置を示す情報である。姿勢情報47は、例えば、飛行体10が水平で所定の方向(例えば北)を向いた状態を基準とし、この基準状態からの傾きをピッチ方向、ロール方向、及びヨー方向の回転角度で示した値である。
As shown in FIG. 9, the flying object 10 has the position information 45 of the flying object 10, the time information 46 indicating the time when the position information is acquired, and the attitude information 47 of the flying object 10 at the time. There is. The position information 45 is, for example, information indicating a position using latitude and longitude (longitude / latitude) and altitude in the world geodetic system. The attitude information 47 is based on, for example, a state in which the flying object 10 is horizontal and faces a predetermined direction (for example, north), and the inclination from this reference state is indicated by rotation angles in the pitch direction, the roll direction, and the yaw direction. The value.
図10に示す画像51は、撮影装置13で撮影されたものであり、例えば画像51の中心を原点52とし、この原点52を通るX軸が飛行体10の前後軸に相当し、Y軸が飛行体10の左右軸に相当する。飛行体10が、撮影レンズを真下に向けて配置し、飛行体10が水平状態で飛行した場合、画像51の中心に写る物体は、飛行体10と同じ緯度・経度に存在するものである。
The image 51 shown in FIG. 10 was taken by the photographing device 13, for example, the center of the image 51 is the origin 52, the X-axis passing through the origin 52 corresponds to the front-rear axis of the flying object 10, and the Y-axis is It corresponds to the left and right axes of the flying object 10. When the flying object 10 arranges the photographing lens directly downward and the flying object 10 flies in a horizontal state, the object reflected in the center of the image 51 exists at the same latitude and longitude as the flying object 10.
また、図10において物体53は、画像51において、原点52からX軸方向に距離Lxだけ離れ、Y軸方向に距離Lyだけ離れた位置に写っている。樹木が存在する地上面において、画像51上の距離Lx、Lyに相当する距離は、例えば撮影レンズの画角や飛行体10の標高(地上から飛行体までの高さ)によって求められる。そして、飛行体10の位置から、X軸に相当する方向へ距離Lxに相当する距離だけ離れ、X軸に相当する方向へ距離Lxに相当する距離だけ離れた位置を物体53が存在する位置として求めることができる。なお、飛行体10の姿勢が、基準状態から傾いている場合には、この傾きに応じて画像上の位置と地上の位置との位置関係が変わるので、姿勢情報47に応じて、画面上の位置に対応する地上での位置を求める。
Further, in FIG. 10, the object 53 is shown in the image 51 at a position separated from the origin 52 by a distance Lx in the X-axis direction and a distance Ly in the Y-axis direction. On the ground surface where trees exist, the distances corresponding to the distances Lx and Ly on the image 51 are obtained, for example, by the angle of view of the photographing lens and the altitude of the flying object 10 (height from the ground to the flying object). Then, a position separated from the position of the flying object 10 by a distance corresponding to the distance Lx in the direction corresponding to the X-axis and a distance corresponding to the distance Lx in the direction corresponding to the X-axis is defined as the position where the object 53 exists. You can ask. When the attitude of the flying object 10 is tilted from the reference state, the positional relationship between the position on the image and the position on the ground changes according to the tilt. Therefore, the position on the screen is changed according to the attitude information 47. Find the position on the ground corresponding to the position.
ステップS40にて、診断装置20は、ステップS30で求めた罹病木の位置などを診断の結果として出力する。図11は、マップ上に罹病木の位置をプロットした例を示す図である。なお、図11において、白抜きの「D」「M」「L」が罹病木を示している。なお、「D」は重度、「M」は中程度、「L」は軽度の罹病木である。
In step S40, the diagnostic device 20 outputs the position of the diseased tree obtained in step S30 as the result of the diagnosis. FIG. 11 is a diagram showing an example in which the positions of affected trees are plotted on a map. In FIG. 11, white "D", "M", and "L" indicate the diseased tree. In addition, "D" is severe, "M" is moderate, and "L" is mildly affected tree.
《Single Shot MultiBox Detector》
本実施形態の診断部22は、撮影画像から罹病の特徴を検出する手法として、Wei Liuらの論文であるSSD: Single Shot MultiBox Detector (2016)で提案されている手法を採用した。図12は、SSDネットワーク構造を示す図である。この手法は、フィードフォワード畳み込みネットワークに基づいており、固定長サイズのバウンディングボックスの集まり(collection)を生成し、物体クラスの実体がそれらのボックスの中に存在することをスコア付けし、そして最終的な検出を生成するためにnon-maximum suppression (NMS、例えば近隣ピクセルと注目しているピクセルの値を比較し、注目しているピクセルが最大値でないときは0にする処理)を行う。 《Single Shot MultiBox Detector》
Thediagnostic unit 22 of the present embodiment has adopted the method proposed in SSD: Single Shot MultiBox Detector (2016), which is a paper by Wei Liu et al., As a method for detecting the characteristics of the disease from the photographed image. FIG. 12 is a diagram showing an SSD network structure. This technique is based on a feed-forward convolutional network, which produces a collection of fixed-length size bounding boxes, scores the existence of object class entities within those boxes, and finally. Non-maximum suppression (NMS, for example, comparing the values of neighboring pixels with the value of the pixel of interest and setting it to 0 if the pixel of interest is not the maximum value) is performed to generate a normal detection.
本実施形態の診断部22は、撮影画像から罹病の特徴を検出する手法として、Wei Liuらの論文であるSSD: Single Shot MultiBox Detector (2016)で提案されている手法を採用した。図12は、SSDネットワーク構造を示す図である。この手法は、フィードフォワード畳み込みネットワークに基づいており、固定長サイズのバウンディングボックスの集まり(collection)を生成し、物体クラスの実体がそれらのボックスの中に存在することをスコア付けし、そして最終的な検出を生成するためにnon-maximum suppression (NMS、例えば近隣ピクセルと注目しているピクセルの値を比較し、注目しているピクセルが最大値でないときは0にする処理)を行う。 《Single Shot MultiBox Detector》
The
ネットワークの最初の方のレイヤは画像分類に使用される標準的なアーキテクチャに基づいており、これをベースネットワークとする。ベースネットワークにはVGG-16ネットワークを使用したが、これに限定されるものではない。
The first layer of the network is based on the standard architecture used for image classification, which is the base network. The VGG-16 network was used as the base network, but it is not limited to this.
畳み込み特徴レイヤをベースネットワークの最後尾に追加した。これらのレイヤはサイズを大きく減少させ,マルチスケールでの検出の予測を可能にする。検出を予測するための畳み込みモデルは各特徴レイヤに関して異なっている。
Added a convolution feature layer at the end of the base network. These layers significantly reduce the size and allow prediction of detection on a multi-scale scale. The convolution model for predicting detection is different for each feature layer.
追加された各特徴レイヤ(またはベースネットワークの既存の特徴レイヤとしてもよい)は畳み込みフィルタのセットを使って固定の検出予測のセットを生成可能である。これらは図12のSSDネットワーク構造のトップに示されている。pチャネルを持つサイズm×nの特徴レイヤに対して、潜在的な検出パラメタ予測のための基本要素は3×3×pの小さなカーネルであり、それはカテゴリのスコア、またはデフォルトボックスの座標に対しての形状オフセットを生成する。カーネルは、それが適用されるm×nの各位置において出力値を生成する。バウンディングボックスオフセットの出力値は、各フィーチャマップの位置に対するデフォルトボックスの位置に対して測定される。
Each added feature layer (or an existing feature layer in the base network) can generate a fixed set of detection predictions using a set of convolution filters. These are shown at the top of the SSD network structure in FIG. For feature layers of size mxn with p-channels, the basic element for predicting potential detection parameters is a small kernel of 3x3xp, which is relative to the category score, or the coordinates of the default box. Generate all shape offsets. The kernel produces an output value at each position of m × n to which it applies. The output value of the bounding box offset is measured against the position of the default box with respect to the position of each feature map.
この例では、ネットワークのトップで、複数フィーチャマップについて各フィーチャマップのセルとデフォルトバウンディングボックスのセットを関連付けている。その対応するセルに対して各デフォルトボックスの位置が固定されるように、デフォルトボックスは畳み込みのやり方でフィーチャマップを隙間なく敷き詰めている。各フィーチャマップのセルにおいて、クラスのインスタンスがそれらの各ボックス中に存在することを示すクラスごとのスコアと同様に、セル中のデフォルトボックスの形状に対するオフセットを予測する。具体的には、ある位置でk個のボックスそれぞれについて、c個のクラススコアと元のデフォルトボックスの形状に対するオフセット4つを計算する。この結果、フィーチャマップの各位置の周辺に適用されるフィルタは合計(c+4)k個となり、m×nのフィーチャマップに関して(c+4)kmn個の出力を生成する。本例のデフォルトボックスは、解像度の異なるいくつかのフィーチャマップに適用する。いくつかのフィーチャマップで異なるデフォルトボックスの形状を使用することは、出力されるボックスの形状を効率よく離散化できる。また、本例では、デフォルトボックスをjaccard overlapが閾値(0.5)よりも高い正解ボックス全てとマッチさせる。これにより1つのデフォルトボックスだけを選択させる方法よりも学習問題をシンプルにしている。
In this example, at the top of the network, each feature map cell and a set of default bounding boxes are associated for multiple feature maps. The default boxes are convolved to fill the feature map tightly so that the position of each default box is fixed relative to its corresponding cell. In each feature map cell, predict the offset to the shape of the default box in the cell, as well as the per-class score indicating that an instance of the class exists in each of those boxes. Specifically, for each of the k boxes at a certain position, c class scores and four offsets with respect to the shape of the original default box are calculated. As a result, the total number of filters applied around each position in the feature map is (c + 4) k, producing (c + 4) kmn outputs for the m × n feature map. The default box in this example applies to several feature maps with different resolutions. Using different default box shapes in some feature maps can efficiently discretize the output box shape. Also, in this example, the default box is matched with all correct boxes whose jaccard overlap is higher than the threshold (0.5). This simplifies the learning problem rather than having only one default box selected.
本例のSSDの訓練において、xp
ij = {1, 0}はカテゴリpでのi番目のデフォルトボックスとj番目の正解ボックスのマッチングを示すものとする。上記のマッチング戦略において、Σixp
ij ≧ 1を得ることができる。この場合、図12の式Aのように全体の目的誤差関数(損失関数)は、位置ずれ誤差(loc)と分類誤差(conf)の重み付き和である。
In the SSD training of this example, x p ij = {1, 0} indicates the matching of the i-th default box and the j-th correct answer box in the category p. In the above matching strategy, Σ i x p ij ≧ 1 can be obtained. In this case, the overall objective error function (loss function) is a weighted sum of the misalignment error (loc) and the classification error (conf) as in Equation A of FIG.
ここでNはマッチしたデフォルトボックスの数である。N=0の場合は誤差を0とする。位置ずれ誤差は予測されたボックス(l)と正解ボックス(g)のパラメタ間でのSmooth L1誤差である(式B)。そして、デフォルトバウンディングボックス(d)の中心(cx, xy)と、その幅(w)と高さ(h)についてオフセットを回帰する。分類誤差は複数クラスの確信度(c)に対するソフトマックス誤差である(式C)。次の評価ではクロスバリデーションにより、重み項αは1にセットした。
Here, N is the number of matching default boxes. When N = 0, the error is set to 0. The misalignment error is the Smooth L1 error between the parameters of the predicted box (l) and the correct answer box (g) (Equation B). Then, the offset is regressed with respect to the center (cx, xy) of the default bounding box (d) and its width (w) and height (h). The classification error is the softmax error for the certainty (c) of multiple classes (Equation C). In the next evaluation, the weight term α was set to 1 by cross-validation.
《診断結果の評価》
クローンや樹齢の差による診断結果への影響を確認するため、複数のデータセットで評価を行った。図13は、複数のデータセットの内訳を示す図である。図13の例では、クローンP2~P3、樹齢若年~老年の樹木のデータを用いた。このうち、データセット(i)では、クローンP2、樹齢壮年としたブロック単体のデータを用い、データセット(ii)では、クローンP3、樹齢若年~老年とした異なる樹齢のデータを用いた。また、データセット(iii)では、クローンP2~P4、樹齢壮年とした異なるクローンのデータを用いた。そして、データセット(iv)では、データ全体を用い、データセット(v)では、重篤な罹病木のデータを用いた。 << Evaluation of diagnostic results >>
Multiple datasets were evaluated to confirm the effect of differences in clones and tree age on diagnostic results. FIG. 13 is a diagram showing a breakdown of a plurality of data sets. In the example of FIG. 13, data of clones P2 to P3 and young to old trees were used. Of these, in the data set (i), the data of the clone P2 and the block alone as the middle age of the tree were used, and in the data set (ii), the data of the clone P3 and the different ages of the tree from young to old were used. In addition, in the data set (iii), data of clones P2 to P4 and different clones of middle age were used. Then, in the dataset (iv), the entire data was used, and in the dataset (v), the data of the seriously affected trees were used.
図14は、診断結果の一例を示す図である。図14において、H1~H6,D1~D6は、診断部22によって撮影画像から抽出された木領域である。木領域H1~H6,D1~D6において、矩形状の枠とラベルを付された箇所が診断部22によって選択された葉群の画像である。なお、本実施形態の診断部22は、選択した葉群のうち、罹病の特徴を有するもの(以下、罹病葉群とも称す)の枠及びラベルを赤色にして示したが、図14では、この罹病葉群のラベルに斜線の網掛けを付して示している。また、診断部22は、選択した葉群のうち、罹病の特徴を有しない健全なもの(以下、健全葉群とも称す)の枠及びラベルを青色にして示したが、図14では、この健全葉群のラベルを白塗りにして示している。図14の例において、診断部22は、罹病葉群を有する木領域H05,D1,D2,D4~D6に写る樹木を罹病木と診断し、罹病葉群を有しない木領域H01~H4,H6,D3に写る樹木を健全木と診断する。
FIG. 14 is a diagram showing an example of the diagnosis result. In FIG. 14, H1 to H6 and D1 to D6 are tree regions extracted from the captured image by the diagnostic unit 22. In the tree regions H1 to H6 and D1 to D6, the portion labeled with the rectangular frame is an image of the leaf group selected by the diagnostic unit 22. The diagnostic unit 22 of the present embodiment shows the selected leaf group having the characteristic of disease (hereinafter, also referred to as the diseased leaf group) in red, and in FIG. 14, the diseased leaf group is shown. The label is shaded with diagonal lines. In addition, the diagnostic unit 22 showed the frame and label of the selected leaf group of healthy ones having no characteristic of disease (hereinafter, also referred to as healthy leaf group) in blue. In FIG. 14, FIG. 14 shows the healthy leaf group of this healthy leaf group. The label is painted white. In the example of FIG. 14, the diagnostic unit 22 diagnoses the trees reflected in the tree regions H05, D1, D2, D4 to D6 having the diseased leaf group as the diseased tree, and the tree regions H01 to H4, H6, D3 having no diseased leaf group. The tree reflected in is diagnosed as a healthy tree.
この診断結果を評価するために、診断対象とした樹木の根を掘るなどして実際に確認したところ、木領域H1~H6の樹木は健全木、木領域D1~D6の樹木は罹病木であった。即ち、木領域H5は、健全木を罹病木と間違え、木領域D3は罹病木を健全木と間違え、その他は正解している。
In order to evaluate this diagnosis result, when the roots of the trees to be diagnosed were dug and actually confirmed, the trees in the tree areas H1 to H6 were healthy trees, and the trees in the tree areas D1 to D6 were diseased trees. .. That is, the tree region H5 mistakes a healthy tree for a diseased tree, the tree region D3 mistakes a diseased tree for a healthy tree, and the others are correct.
このように診断部22により「罹病」又は「健全」と診断した結果についてそれぞれ、実際に「罹病」か「健全」かを確認した結果を表1のように分類し、これらを用いて正解率(Accuracy)、適合率(Precision)、再現率(Recall)を求め、評価を行った。

As shown in Table 1, the results of actually confirming whether the results of the diagnosis of "disease" or "healthy" by the diagnosis unit 22 are "disease" or "healthy" are classified as shown in Table 1, and the correct answer rate is used. (Accuracy), precision rate (Precision), and recall rate (Recall) were calculated and evaluated.
ここで、TPは、診断部22の診断結果が罹病であり、その確認結果が罹病であった場合である。FPは、診断部22の診断結果が罹病であり、その確認結果が健全であった場合である。FNは、診断部22の診断結果が健全であり、その確認結果が罹病であった場合である。TNは、診断部22の診断結果が健全であり、その確認結果が健全であった場合である。
Here, TP is a case where the diagnosis result of the diagnosis unit 22 is illness and the confirmation result is illness. FP is a case where the diagnosis result of the diagnosis unit 22 is sick and the confirmation result is sound. FN is a case where the diagnosis result of the diagnosis unit 22 is sound and the confirmation result is illness. TN is a case where the diagnosis result of the diagnosis unit 22 is sound and the confirmation result is sound.
正解率は、診断部22が「健全」又は「罹病」とした診断結果と、実際の確認結果とが一致する割合であり、次の式1から求められる。
正解率=(TP+TN)/(TP+FP+TN+FN)・・・式1 The correct answer rate is the ratio at which the diagnosis result that thediagnosis unit 22 has determined to be "healthy" or "affected" and the actual confirmation result match, and is obtained from the following formula 1.
Correct answer rate = (TP + TN) / (TP + FP + TN + FN) ...Equation 1
正解率=(TP+TN)/(TP+FP+TN+FN)・・・式1 The correct answer rate is the ratio at which the diagnosis result that the
Correct answer rate = (TP + TN) / (TP + FP + TN + FN) ...
適合率は、診断部22が「罹病」とした診断結果が、実際に「罹病」である割合であり、次の式2から求められる。
適合率=TP/(TP+FP)・・・式2 The precision rate is the ratio at which the diagnosis result of thediagnosis unit 22 as "affected" is actually "affected", and is obtained from the following formula 2.
Conformity rate = TP / (TP + FP) ・ ・ ・ Equation 2
適合率=TP/(TP+FP)・・・式2 The precision rate is the ratio at which the diagnosis result of the
Conformity rate = TP / (TP + FP) ・ ・ ・ Equation 2
再現率は、実際に「罹病」であるものが、診断部22で「罹病」と診断される割合であり、次の式3から求められる。
再現率=TP/(TP+FN)・・・式3 The recall rate is the rate at which what is actually "affected" is diagnosed as "affected" by thediagnostic unit 22, and is calculated from the following formula 3.
Recall rate = TP / (TP + FN) ...Equation 3
再現率=TP/(TP+FN)・・・式3 The recall rate is the rate at which what is actually "affected" is diagnosed as "affected" by the
Recall rate = TP / (TP + FN) ...

表2は、診断部22の診断結果について、実際の確認結果と比較して、正解率(Accuracy)、適合率(Precision)、再現率(Recall)を評価した結果を示している。
Table 2 shows the results of evaluating the accuracy rate (Accuracy), precision rate (Precision), and recall rate (Recall) of the diagnosis results of the diagnosis unit 22 in comparison with the actual confirmation results.
表2に示すように、樹齢の異なるデータセット(ii)では、正解率及び再現率が低いという結果となった。これは、樹齢が異なることで、画像上の形態が異なるためと推定される。このため異なる樹齢のデータが含まれるデータセット(iv)についても同様に正解率の低下を招いていると推察される。
As shown in Table 2, the correct answer rate and recall rate were low in the datasets (ii) of different ages. It is presumed that this is because the morphology on the image is different due to the difference in tree age. For this reason, it is presumed that the correct answer rate also decreases for the dataset (iv) that contains data of different ages.
なお、罹病の程度が重いデータセット(v)については、比較的精度が高く、特に再現率が高い結果となった。これは、罹病の程度が重い樹木の場合、罹病の特徴が、画像上に明確に表れるためと推察される。但し、罹病の早期発見を目指しているため、罹病の程度が軽い樹木についても、このように高い精度を得られることが望まれる。
For the data set (v) with a heavy degree of illness, the accuracy was relatively high, and the recall rate was particularly high. It is presumed that this is because the characteristics of the disease are clearly shown on the image in the case of trees with a heavy degree of disease. However, since the aim is to detect the disease at an early stage, it is desired that such high accuracy can be obtained even for trees with a mild degree of disease.
適切に管理されたゴムノキ農園の場合、罹病率は1%程度であるので、仮に、全ての樹木を健全と判断すれば、正解率が99%となるが、この場合、全ての罹病木を見逃すことになるので、正解率だけを高めても意味がない。反対に全ての樹木を罹病と診断すれば、再現率は100%となり、罹病木の見逃しは無くなるが、正解率及び適合率が1%と低くなり、当然診断する意味がない。特に適合率が低いと、罹病と診断された樹木について、治療や伐根等の対処を行う際、根元を掘り起こしたところで、実際には健全であることが確認され、掘り起こす等の作業が無駄になることが多くなる。このため、適合率と再現率とをそれぞれ適切に高められることが望ましい。
In the case of a properly managed rubber tree plantation, the morbidity rate is about 1%, so if all the trees are judged to be healthy, the correct answer rate will be 99%, but in this case, all the sick trees will be overlooked. Therefore, there is no point in increasing only the correct answer rate. On the contrary, if all the trees are diagnosed as diseased, the recall rate will be 100% and the diseased tree will not be overlooked, but the correct answer rate and the precision rate will be as low as 1%, and of course there is no point in diagnosing. In particular, if the precision rate is low, when treating or cutting roots of a tree diagnosed as having a disease, it is confirmed that the root is actually healthy when the root is dug up, and the work such as digging up is wasted. Will often be. Therefore, it is desirable that the precision rate and the recall rate can be appropriately increased.
本願の発明者達は、診断部22の診断精度を改善するにあたり、図12に示したSSDのパラメタを変更して診断結果を求める等の検討を繰り返し、損失関数L(x,c,l,g)に着目した。この損失関数において、項αは、分類誤差と位置ずれ誤差の比重を変更するパラメタであり、表2の診断では、α=1としていた。発明者達は、鋭意検討の結果、本実施形態のように、上空から複数の樹木を撮影し、葉群の特徴を検出するという条件では、この損失関数L(x,c,l,g)のパラメタαを小さくし、位置ずれ誤差に対する分類誤差の比重を高めることにより、診断精度を向上させられることを見出した。
In order to improve the diagnostic accuracy of the diagnostic unit 22, the inventors of the present application repeatedly examined the SSD parameters shown in FIG. 12 to obtain the diagnostic result, and the loss function L (x, c, l, Focused on g). In this loss function, the term α is a parameter for changing the specific weights of the classification error and the misalignment error, and in the diagnosis in Table 2, α = 1. As a result of diligent studies, the inventors of this loss function L (x, c, l, g) under the condition that a plurality of trees are photographed from the sky and the characteristics of the leaf group are detected as in the present embodiment. It was found that the diagnostic accuracy can be improved by reducing the parameter α and increasing the weight of the classification error with respect to the misalignment error.
表3は、パラメタαを0.5とした場合の診断結果を評価したものである。

Table 3 evaluates the diagnostic results when the parameter α is 0.5.
表3に示すように、α=0.5とすることで、全体的に精度が改善し、特にデータ全体(iv)の再現性が向上し、88%を達成することができた。なお、パラメタαは、0.5に限定されるものではなく、例えば、0.25~0.75の範囲としてもよい。
As shown in Table 3, by setting α = 0.5, the accuracy was improved as a whole, and in particular, the reproducibility of the entire data (iv) was improved, and 88% could be achieved. The parameter α is not limited to 0.5, and may be, for example, in the range of 0.25 to 0.75.
上述のように、本実施形態によれば、高精度に罹病木の診断を行うことができる。従来、熟練者がパラゴムノキの地上部を目視して診断を行った場合には、20%以下の精度であったため、本実施形態の診断装置によって、診断精度が大きく向上する。
なお、本実施形態では、パラゴムノキの病害について説明したが、本実施形態の罹病木診断システムは、パラゴムノキに限定されるものではなく、葉群に罹病の特徴のでる病害であれば、他の病害についても診断できる。 As described above, according to the present embodiment, the diseased tree can be diagnosed with high accuracy. Conventionally, when a skilled person visually inspects the above-ground part of Hevea brasiliensis to make a diagnosis, the accuracy is 20% or less. Therefore, the diagnostic device of the present embodiment greatly improves the diagnostic accuracy.
In this embodiment, the disease of Hevea brasiliensis has been described, but the diseased tree diagnosis system of this embodiment is not limited to Hevea brasiliensis, and if it is a disease characterized by disease in the leaf group, other diseases Can also be diagnosed.
なお、上記の実施形態や変形例は、一例であり、上記構成に限定されるものではなく、発明の趣旨に反しない範囲で変更してもよい。例えば上記の実施形態や変形例の要素を組み合わせたり、一部の要素を省略したりしてもよい。
Note that the above-described embodiment and modification are merely examples, and are not limited to the above-mentioned configuration, and may be changed within a range not contrary to the gist of the invention. For example, the elements of the above embodiments and modifications may be combined, or some elements may be omitted.
10 :飛行体
11 :駆動部
12 :制御部
13 :撮影装置
13A :撮影レンズ
13B :撮像素子
14 :位置情報取得部
20 :診断装置
21 :対象取得部
22 :診断部
23 :診断結果出力部
24 :位置特定部
30 :機械学習装置
31 :データ取得部
32 :モデル生成部
100 :罹病木診断システム
10: Air vehicle 11: Drive unit 12: Control unit 13:Imaging device 13A: Imaging lens 13B: Imaging element 14: Position information acquisition unit 20: Diagnostic device 21: Target acquisition unit 22: Diagnostic unit 23: Diagnosis result output unit 24 : Position identification unit 30: Machine learning device 31: Data acquisition unit 32: Model generation unit 100: Diseased tree diagnosis system
11 :駆動部
12 :制御部
13 :撮影装置
13A :撮影レンズ
13B :撮像素子
14 :位置情報取得部
20 :診断装置
21 :対象取得部
22 :診断部
23 :診断結果出力部
24 :位置特定部
30 :機械学習装置
31 :データ取得部
32 :モデル生成部
100 :罹病木診断システム
10: Air vehicle 11: Drive unit 12: Control unit 13:
Claims (9)
- 診断対象とする樹木の画像を取得する対象取得部と、
樹木の画像、当該画像内で葉群が写っている範囲を示す情報、及び前記範囲内に罹病の特徴を有するか否かを示す情報を教師データとして、樹木の画像から罹病している葉群を含む樹木を罹病木として診断するための機械学習を行った診断モデルに、前記診断対象とする樹木の画像を入力することにより、罹病している葉群を含む樹木を罹病木として診断する診断部と、
前記診断の結果を出力する診断結果出力部と、
を備える罹病木診断システム。 The target acquisition unit that acquires the image of the tree to be diagnosed,
The image of the tree, the information indicating the range in which the leaf group is shown in the image, and the information indicating whether or not the diseased characteristic is present in the range are used as teacher data, and the affected leaf group is included from the image of the tree. A diagnostic unit that diagnoses a tree including a diseased leaf group as a diseased tree by inputting an image of the tree to be diagnosed into a machine-learned diagnostic model for diagnosing a tree as a diseased tree.
A diagnosis result output unit that outputs the result of the diagnosis and
A diseased tree diagnostic system equipped with. - 前記樹木の画像が、前記樹木の上方から撮影した俯瞰画像である請求項1に記載の罹病木診断システム。 The diseased tree diagnosis system according to claim 1, wherein the image of the tree is a bird's-eye view image taken from above the tree.
- 前記葉群が、前記樹木の上端より所定距離下側に設定された第一高さと、当該第一高さより所定距離下側に設定された第二高さとの間に存在するものである請求項1又は2に記載の罹病木診断システム。 Claim 1 in which the leaf group exists between a first height set a predetermined distance below the upper end of the tree and a second height set a predetermined distance below the first height. Or the diseased tree diagnostic system according to 2.
- 前記診断モデルが、前記樹木の画像に対して、回転、移動、拡大、縮小、反転、色変化、ノイズ付加、ぼかし、高周波成分強調、及び歪みのうち少なくとも1つの画像処理を施し、画像処理後の画像を画像処理前の画像と別の教師データとすることで増加させた教師データを用いて機械学習を行ったものである請求項1~3の何れか1項に記載の罹病木診断システム。 The diagnostic model performs at least one image processing of rotation, movement, enlargement, reduction, inversion, color change, noise addition, blurring, high frequency component enhancement, and distortion on the image of the tree, and after the image processing. The diseased tree diagnosis system according to any one of claims 1 to 3, wherein machine learning is performed using the teacher data increased by using the image of 1 as different teacher data from the image before image processing. ..
- 前記診断対象の画像において前記罹病木と診断された樹木の当該画像内の位置に基づいて、前記罹病木が存在している位置を特定する位置特定部を更に備えた請求項1~4の何れか1項に記載の罹病木診断システム。 Any of claims 1 to 4 further provided with a position specifying portion for specifying the position where the diseased tree exists based on the position in the image of the tree diagnosed as the diseased tree in the image to be diagnosed. The diseased tree diagnostic system according to item 1.
- 前記診断対象の画像が、前記樹木の上空を飛行する飛行体によって撮影された場合に、前記位置特定部が、前記診断対象の画像が撮影された時の前記飛行体の位置と、前記罹病木と診断された樹木の当該画像内の位置とに基づいて、前記罹病木が存在している位置を特定する請求項5に記載の罹病木診断システム。 When the image to be diagnosed is photographed by an air vehicle flying over the tree, the positioning unit determines the position of the air vehicle when the image to be diagnosed is photographed and the diseased tree. The diseased tree diagnosis system according to claim 5, wherein the position where the diseased tree exists is specified based on the position of the tree diagnosed as having the diseased tree in the image.
- 診断対象とする樹木の画像を取得するステップと、
樹木の画像、当該画像内で葉群が写っている範囲を示す情報、及び前記範囲内に罹病の特徴を有するか否かを示す情報を教師データとして、樹木の画像から罹病している葉群を含む樹木を罹病木として診断するための機械学習を行った診断モデルに、前記診断対象とする樹木の画像を入力することにより、罹病している葉群を含む樹木を罹病木として診断するステップと、
前記診断の結果を出力するステップと、
をコンピュータが実行する罹病木診断方法。 Steps to acquire an image of the tree to be diagnosed,
The image of the tree, the information indicating the range in which the leaf group is shown in the image, and the information indicating whether or not the diseased characteristic is present in the range are used as teacher data, and the affected leaf group is included from the image of the tree. A step of diagnosing a tree including a diseased leaf group as a diseased tree by inputting an image of the tree to be diagnosed into a machine-learned diagnostic model for diagnosing a tree as a diseased tree.
The step of outputting the result of the diagnosis and
A computer-operated method of diagnosing diseased trees. - 診断対象とする樹木の画像を取得するステップと、
樹木の画像、当該画像内で葉群が写っている範囲を示す情報、及び前記範囲内に罹病の特徴を有するか否かを示す情報を教師データとして、樹木の画像から罹病している葉群を含む樹木を罹病木として診断するための機械学習を行った診断モデルに、前記診断対象とする樹木の画像を入力することにより、罹病している葉群を含む樹木を罹病木として診断するステップと、
前記診断の結果を出力するステップと、
をコンピュータに実行させるための罹病木診断プログラム。 Steps to acquire an image of the tree to be diagnosed,
The image of the tree, the information indicating the range in which the leaf group is shown in the image, and the information indicating whether or not the diseased characteristic is present in the range are used as teacher data, and the affected leaf group is included from the image of the tree. A step of diagnosing a tree including a diseased leaf group as a diseased tree by inputting an image of the tree to be diagnosed into a machine-learned diagnostic model for diagnosing a tree as a diseased tree.
The step of outputting the result of the diagnosis and
A diseased tree diagnostic program that allows a computer to run. - 樹木の画像、当該画像内で葉群が写っている範囲を示す情報、及び前記範囲内に罹病の特徴を有するか否かを示す情報を教師データとして取得するデータ取得部と、
前記教師データを用いて機械学習することにより、樹木の画像から罹病している葉群を含む樹木を罹病木として診断する診断モデルを生成するモデル生成部と、
を備える機械学習装置。
A data acquisition unit that acquires an image of a tree, information indicating a range in which a group of leaves is shown in the image, and information indicating whether or not the area has a disease characteristic as teacher data.
A model generation unit that generates a diagnostic model for diagnosing a tree including a diseased leaf group as a diseased tree from an image of the tree by machine learning using the teacher data.
A machine learning device equipped with.
Applications Claiming Priority (2)
| Application Number | Priority Date | Filing Date | Title |
|---|---|---|---|
| JP2020045331A JP2021145557A (en) | 2020-03-16 | 2020-03-16 | Diseased tree diagnosis system, diseased tree diagnosis method and diseased tree diagnosis program |
| JP2020-045331 | 2020-03-16 |
Publications (1)
| Publication Number | Publication Date |
|---|---|
| WO2021187231A1 true WO2021187231A1 (en) | 2021-09-23 |
Family
ID=77771220
Family Applications (1)
| Application Number | Title | Priority Date | Filing Date |
|---|---|---|---|
| PCT/JP2021/009241 WO2021187231A1 (en) | 2020-03-16 | 2021-03-09 | Affected tree diagnosis system, affected tree diagnosis method, and affected tree diagnosis program |
Country Status (2)
| Country | Link |
|---|---|
| JP (1) | JP2021145557A (en) |
| WO (1) | WO2021187231A1 (en) |
Cited By (1)
| Publication number | Priority date | Publication date | Assignee | Title |
|---|---|---|---|---|
| CN115953686A (en) * | 2023-02-07 | 2023-04-11 | 开封市农林科学研究院 | Peanut pest detection method and system based on image processing |
Families Citing this family (1)
| Publication number | Priority date | Publication date | Assignee | Title |
|---|---|---|---|---|
| JP7004962B1 (en) * | 2021-02-05 | 2022-01-21 | エムラインシステム株式会社 | Unmanned aerial vehicle controls and unmanned aerial vehicle systems |
Citations (2)
| Publication number | Priority date | Publication date | Assignee | Title |
|---|---|---|---|---|
| JP2016168046A (en) * | 2015-03-09 | 2016-09-23 | 学校法人法政大学 | Plant disease diagnostic system, plant disease diagnostic method, and program |
| JP2017163934A (en) * | 2016-03-17 | 2017-09-21 | 国立大学法人信州大学 | Methods of calculating damage classification of pine wilt disease and apparatus for calculating damage classification of pine wilt disease |
-
2020
- 2020-03-16 JP JP2020045331A patent/JP2021145557A/en active Pending
-
2021
- 2021-03-09 WO PCT/JP2021/009241 patent/WO2021187231A1/en active Application Filing
Patent Citations (2)
| Publication number | Priority date | Publication date | Assignee | Title |
|---|---|---|---|---|
| JP2016168046A (en) * | 2015-03-09 | 2016-09-23 | 学校法人法政大学 | Plant disease diagnostic system, plant disease diagnostic method, and program |
| JP2017163934A (en) * | 2016-03-17 | 2017-09-21 | 国立大学法人信州大学 | Methods of calculating damage classification of pine wilt disease and apparatus for calculating damage classification of pine wilt disease |
Non-Patent Citations (1)
| Title |
|---|
| ANONYMOUS: "Established disease diagnosis technology for natural rubber resource "Havea brasiliensis"", BRIDGESTONE CORPORATION, 10 July 2012 (2012-07-10), pages 1 - 5, XP055859056, Retrieved from the Internet <URL:https://www.bridgestone.co.jp/corporate/news/2012071001.html> [retrieved on 20211109] * |
Cited By (2)
| Publication number | Priority date | Publication date | Assignee | Title |
|---|---|---|---|---|
| CN115953686A (en) * | 2023-02-07 | 2023-04-11 | 开封市农林科学研究院 | Peanut pest detection method and system based on image processing |
| CN115953686B (en) * | 2023-02-07 | 2023-07-28 | 开封市农林科学研究院 | Peanut pest detection method and system based on image processing |
Also Published As
| Publication number | Publication date |
|---|---|
| JP2021145557A (en) | 2021-09-27 |
Similar Documents
| Publication | Publication Date | Title |
|---|---|---|
| US11216683B2 (en) | Computer aided scanning method for medical device, medical device, and readable storage medium | |
| CN111524137B (en) | Cell identification counting method and device based on image identification and computer equipment | |
| US10509987B1 (en) | Learning method and learning device for object detector based on reconfigurable network for optimizing customers' requirements such as key performance index using target object estimating network and target object merging network, and testing method and testing device using the same | |
| WO2021187231A1 (en) | Affected tree diagnosis system, affected tree diagnosis method, and affected tree diagnosis program | |
| JP6798854B2 (en) | Target number estimation device, target number estimation method and program | |
| CN108921057B (en) | Convolutional neural network-based prawn form measuring method, medium, terminal equipment and device | |
| US10402692B1 (en) | Learning method and learning device for fluctuation-robust object detector based on CNN using target object estimating network adaptable to customers' requirements such as key performance index, and testing device using the same | |
| CN109919938B (en) | Method for obtaining optic disc segmentation atlas of glaucoma | |
| CN110929944A (en) | Wheat scab disease severity prediction method based on hyperspectral image and spectral feature fusion technology | |
| CN111666855B (en) | Animal three-dimensional parameter extraction method and system based on unmanned aerial vehicle and electronic equipment | |
| CN111754453A (en) | Pulmonary tuberculosis detection method and system based on chest radiography image and storage medium | |
| EP2107787A1 (en) | Image trimming device | |
| EP3605453A1 (en) | Convolutional neural network based inspection of blade-defects of a wind turbine | |
| CN113808098A (en) | Road disease identification method and device, electronic equipment and readable storage medium | |
| CN111626379B (en) | X-ray image detection method for pneumonia | |
| CN112861785A (en) | Shielded pedestrian re-identification method based on example segmentation and image restoration | |
| CN113116377A (en) | Ultrasonic imaging navigation method, ultrasonic device and storage medium | |
| CN113269752A (en) | Image detection method, device terminal equipment and storage medium | |
| CN113724185A (en) | Model processing method and device for image classification and storage medium | |
| CN114821346B (en) | Radar image intelligent identification method and system based on embedded platform | |
| CN111339993A (en) | X-ray image metal detection method and system | |
| CN111914766B (en) | Method for detecting business trip behavior of city management service | |
| CN110570417B (en) | Pulmonary nodule classification device and image processing equipment | |
| CN113379738A (en) | Method and system for detecting and positioning epidemic trees based on images | |
| KR20220085661A (en) | Revegetation system and method using lidar data and program recording medium |
Legal Events
| Date | Code | Title | Description |
|---|---|---|---|
| 121 | Ep: the epo has been informed by wipo that ep was designated in this application |
Ref document number: 21772137 Country of ref document: EP Kind code of ref document: A1 |
|
| NENP | Non-entry into the national phase |
Ref country code: DE |
|
| 122 | Ep: pct application non-entry in european phase |
Ref document number: 21772137 Country of ref document: EP Kind code of ref document: A1 |