WO2021064925A1 - 生成方法、生成プログラムおよび情報処理装置 - Google Patents
生成方法、生成プログラムおよび情報処理装置 Download PDFInfo
- Publication number
- WO2021064925A1 WO2021064925A1 PCT/JP2019/039019 JP2019039019W WO2021064925A1 WO 2021064925 A1 WO2021064925 A1 WO 2021064925A1 JP 2019039019 W JP2019039019 W JP 2019039019W WO 2021064925 A1 WO2021064925 A1 WO 2021064925A1
- Authority
- WO
- WIPO (PCT)
- Prior art keywords
- target
- sensor
- sensors
- information indicating
- unit
- Prior art date
- Legal status (The legal status is an assumption and is not a legal conclusion. Google has not performed a legal analysis and makes no representation as to the accuracy of the status listed.)
- Ceased
Links
Images










Classifications
-
- G—PHYSICS
- G01—MEASURING; TESTING
- G01S—RADIO DIRECTION-FINDING; RADIO NAVIGATION; DETERMINING DISTANCE OR VELOCITY BY USE OF RADIO WAVES; LOCATING OR PRESENCE-DETECTING BY USE OF THE REFLECTION OR RERADIATION OF RADIO WAVES; ANALOGOUS ARRANGEMENTS USING OTHER WAVES
- G01S7/00—Details of systems according to groups G01S13/00, G01S15/00, G01S17/00
- G01S7/48—Details of systems according to groups G01S13/00, G01S15/00, G01S17/00 of systems according to group G01S17/00
- G01S7/4808—Evaluating distance, position or velocity data
-
- G—PHYSICS
- G01—MEASURING; TESTING
- G01S—RADIO DIRECTION-FINDING; RADIO NAVIGATION; DETERMINING DISTANCE OR VELOCITY BY USE OF RADIO WAVES; LOCATING OR PRESENCE-DETECTING BY USE OF THE REFLECTION OR RERADIATION OF RADIO WAVES; ANALOGOUS ARRANGEMENTS USING OTHER WAVES
- G01S17/00—Systems using the reflection or reradiation of electromagnetic waves other than radio waves, e.g. lidar systems
- G01S17/87—Combinations of systems using electromagnetic waves other than radio waves
-
- G—PHYSICS
- G01—MEASURING; TESTING
- G01S—RADIO DIRECTION-FINDING; RADIO NAVIGATION; DETERMINING DISTANCE OR VELOCITY BY USE OF RADIO WAVES; LOCATING OR PRESENCE-DETECTING BY USE OF THE REFLECTION OR RERADIATION OF RADIO WAVES; ANALOGOUS ARRANGEMENTS USING OTHER WAVES
- G01S17/00—Systems using the reflection or reradiation of electromagnetic waves other than radio waves, e.g. lidar systems
- G01S17/88—Lidar systems specially adapted for specific applications
- G01S17/89—Lidar systems specially adapted for specific applications for mapping or imaging
-
- G—PHYSICS
- G06—COMPUTING OR CALCULATING; COUNTING
- G06T—IMAGE DATA PROCESSING OR GENERATION, IN GENERAL
- G06T7/00—Image analysis
- G06T7/70—Determining position or orientation of objects or cameras
- G06T7/73—Determining position or orientation of objects or cameras using feature-based methods
-
- G—PHYSICS
- G06—COMPUTING OR CALCULATING; COUNTING
- G06T—IMAGE DATA PROCESSING OR GENERATION, IN GENERAL
- G06T7/00—Image analysis
- G06T7/80—Analysis of captured images to determine intrinsic or extrinsic camera parameters, i.e. camera calibration
-
- G—PHYSICS
- G06—COMPUTING OR CALCULATING; COUNTING
- G06T—IMAGE DATA PROCESSING OR GENERATION, IN GENERAL
- G06T2207/00—Indexing scheme for image analysis or image enhancement
- G06T2207/10—Image acquisition modality
- G06T2207/10028—Range image; Depth image; 3D point clouds
-
- G—PHYSICS
- G06—COMPUTING OR CALCULATING; COUNTING
- G06T—IMAGE DATA PROCESSING OR GENERATION, IN GENERAL
- G06T2207/00—Indexing scheme for image analysis or image enhancement
- G06T2207/20—Special algorithmic details
- G06T2207/20072—Graph-based image processing
-
- G—PHYSICS
- G06—COMPUTING OR CALCULATING; COUNTING
- G06T—IMAGE DATA PROCESSING OR GENERATION, IN GENERAL
- G06T2207/00—Indexing scheme for image analysis or image enhancement
- G06T2207/30—Subject of image; Context of image processing
- G06T2207/30221—Sports video; Sports image
-
- G—PHYSICS
- G06—COMPUTING OR CALCULATING; COUNTING
- G06T—IMAGE DATA PROCESSING OR GENERATION, IN GENERAL
- G06T2207/00—Indexing scheme for image analysis or image enhancement
- G06T2207/30—Subject of image; Context of image processing
- G06T2207/30244—Camera pose
Definitions
- the present invention relates to a generation method and the like.
- a distance measuring device such as a laser sensor
- a distance measuring device such as a laser sensor
- the subject can be reproduced three-dimensionally by sensing the subject from each direction using multiple sensors placed around the subject and integrating the three-dimensional point cloud that is the measurement result of each sensor. it can.
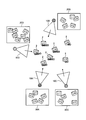
- FIG. 25 is a diagram showing the result of integrating the three-dimensional point cloud measured by a plurality of sensors.
- the sensors 10A, 10B, 10C, and 10D are arranged around (front and back) the subject 1, and the sensors 10A to 10D measure the subject 1 and obtain a three-dimensional point cloud.
- the three-dimensional point cloud 11A is data based on the measurement result of the sensor 10A.
- the three-dimensional point cloud 11B is data based on the measurement result of the sensor 10B.
- the three-dimensional point cloud 11C is data based on the measurement result of the sensor 10C.
- the three-dimensional point cloud 11D is data based on the measurement result of the sensor 10D.
- external parameters are used.
- the external parameter is information indicating the positional relationship between the plurality of sensors.
- Conventional techniques for calculating external parameters include, for example, prior art techniques 1 and 2.
- the prior art 1 will be described.
- the prior art 1 is an external calibration technique for calculating an external parameter of a sensor using a spherical target.
- the sphere target is observed a plurality of times by the first sensor and the second sensor while moving one sphere target.
- FIG. 26 is a diagram for explaining the prior art 1.
- the spherical targets 23a, 24a, 25a are associated with the spherical targets 23b, 24b, 25b, and the external parameters are based on the positional relationship of the three-dimensional point cloud of the associated spherical targets.
- Estimate the initial value of. Singular value decomposition is aligned to estimate the initial value.
- the external parameter between the first sensor and the second sensor is optimized by using the bundle estimation or the maximum likelihood estimation, and the external parameter is calculated. ..
- Image 16 shows the result of external calibration.
- the positions of the spherical targets 23a, 24a, 25a and the spherical targets 23b, 24b, 25b are matched.
- the conventional technique 2 is a technique of detecting a target by image processing, using two cameras as starting points, and using a DLT (Direct Linear Transform) algorithm to sequentially estimate external parameters of each camera.
- DLT Direct Linear Transform
- FIG. 27 and 28 are diagrams for explaining the prior art 2.
- FIG. 27 will be described.
- target 2 is observed by sensors 10A to 10D.
- target 2 is observed by sensors 10A-10D.
- target 2 is observed by sensors 10A-10D.
- target 2 is observed by sensors 10A, 10B, 10D.
- target 2 is observed by sensors 10A, 10B, 10D.
- target 2 is observed by sensors 10C, 10D.
- target 2 is observed by sensors 10C, 10D.
- the order in which the external parameters are estimated is predetermined.
- the sensors are selected in the order of the sensors 10B, 10C, and 10D with the sensor 10A as a reference, and the external parameters are estimated.
- the target 2 that can be used for estimation is the reference sensor or the target 2 at the time when it has already been observed by the selected sensor.
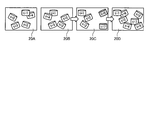
- the order in which the external parameters are estimated is predetermined. For example, as described in FIG. 28, when the sensors are selected in the order of the sensors 10B, 10C, and 10D with reference to the sensor 10A and the external parameters are estimated, the target that can be used for estimating the external parameters in the observation result 20C. Decreases and the distribution becomes biased. If the targets that can be used to estimate the external parameters are unevenly distributed, the estimation accuracy of the external parameters will be low. The decrease in the estimation accuracy also affects the estimation accuracy when the observation result 20D in the latter stage is selected and the external parameters are estimated.
- the present invention provides a generation method, a generation program, and an information processing apparatus capable of accurately generating information indicating a relative positional relationship, such as an arrangement position relationship and an angle of view relationship, for three or more sensors.
- the purpose is to provide.
- the computer executes the following processing.
- the computer acquires the detection result of the target at a plurality of time points by three or more sensors. Based on whether or not each of the three or more sensors detected the target at each time point, the computer sets the target at the same time point among multiple time points in each of the two sensor sets of the three or more sensor points. Specify the number of times when it was detected.
- the computer generates information indicating the connectivity regarding the estimation accuracy of the relative positional relationship between the sensors based on the number of times specified for each set of sensors and the variance of the target placement position at a plurality of time points.
- the computer generates information indicating the first relative positional relationship between the two connected sensors based on the information indicating the connectivity.
- the computer generates information indicating a second relative positional relationship between two sensors having no connectivity based on the information indicating the connectivity and the information indicating the first relative positional relationship.
- the computer outputs information indicating the first relative positional relationship and information indicating the second relative positional relationship as information indicating the positional relationship between the three or more sensors.
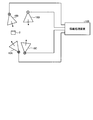
- FIG. 1 is a diagram showing an example of an information processing system according to the first embodiment.
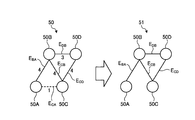
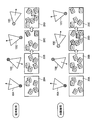
- FIG. 2 is a diagram (1) for explaining a process of generating a sensor connectivity graph.
- FIG. 3 is a diagram (2) for explaining a process of generating a sensor connectivity graph.
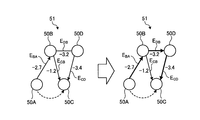
- FIG. 4 is a diagram for explaining a process of reflecting the variance of the target in the sensor connectivity graph.
- FIG. 5 is a diagram for explaining the calculation of external parameters of sensors that are not directly connected.
- FIG. 6 is a diagram for explaining the effect of the information processing apparatus according to the first embodiment.
- FIG. 7 is a functional block diagram showing the configuration of the information processing apparatus according to the first embodiment.
- FIG. 8 is a diagram showing an example of the data structure of the detection result table.
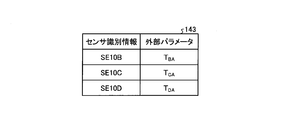
- FIG. 9 is a diagram showing an example of the data structure of the external parameter table.
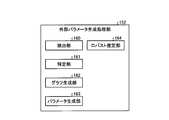
- FIG. 10 is a functional block diagram showing the configuration of the external parameter generation processing unit.
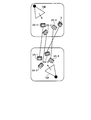
- FIG. 11 is a diagram (1) for explaining the processing of the robust estimation unit.
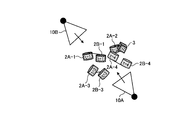
- FIG. 12 is a diagram (2) for explaining the processing of the robust estimation unit.
- FIG. 13 is a diagram (3) for explaining the processing of the robust estimation unit.
- FIG. 14 is a diagram (4) for explaining the processing of the robust estimation unit.
- FIG. 15 is a diagram (5) for explaining the processing of the robust estimation unit.
- FIG. 16 is a flowchart showing a processing procedure of the information processing apparatus according to the first embodiment.
- FIG. 17 is a flowchart showing a processing procedure of the sensor connectivity graph generation process.
- FIG. 16 is a flowchart showing a processing procedure of the information processing apparatus according to the first embodiment.
- FIG. 17 is a flowchart showing a processing procedure of the sensor connectivity graph generation process.
- FIG. 18 is a diagram (1) showing an example of external calibration using a spherical marker.
- FIG. 19 is a diagram (2) showing an example of external calibration using a spherical marker.
- FIG. 20 is a diagram (3) showing an example of external calibration using a spherical marker.
- FIG. 21 is a diagram for explaining the arrangement position of the target.
- FIG. 22 is a functional block diagram showing the configuration of the information processing apparatus according to the second embodiment.
- FIG. 23 is a flowchart showing a processing procedure of the information processing apparatus according to the second embodiment.
- FIG. 24 is a diagram showing an example of a hardware configuration of a computer that realizes a function similar to that of an information processing device.
- FIG. 24 is a diagram showing an example of a hardware configuration of a computer that realizes a function similar to that of an information processing device.
- FIG. 25 is a diagram showing the result of integrating the three-dimensional point cloud measured by a plurality of sensors.
- FIG. 26 is a diagram for explaining the prior art 1.
- FIG. 27 is a diagram (1) for explaining the prior art 2.
- FIG. 28 is a diagram (2) for explaining the prior art 2.
- FIG. 1 is a diagram showing an example of an information processing system according to the first embodiment.
- the information processing system according to the first embodiment includes sensors 10A, 10B, 10C, 10D and an information processing device 100.
- the sensors 10A to 10D and the information processing device 100 are connected by wire or wirelessly, respectively.
- the sensors 10A to 10D are shown in FIG. 1, the information processing system may have other sensors.
- the sensor 10A is a measuring device (laser sensor) that measures the distance between the point cloud constituting the subject (or the target 2) and the sensor 10A.
- the sensor 10A outputs the distance image data as the measurement result to the information processing device 100.
- the distance image data includes information in which each pixel and a distance value are associated with each other.
- the distance image data is converted into three-dimensional point cloud data by the information processing device 100.
- the three-dimensional point cloud data is information in which a point and the coordinates of a three-dimensional Cartesian coordinate system are associated with each other for the point cloud.
- the description of the sensor 10B is the same as the description of the sensor 10A.
- the sensors 10A to 10B are collectively referred to as "sensor 10" as appropriate.
- the three-dimensional point group data is data obtained by converting the data of the distance image measured by the sensor 10, but is appropriately expressed as the three-dimensional point group data measured by the sensor 10, and the data of the distance image is referred to as the three-dimensional point.
- the description of conversion to group data is omitted.
- the information processing system is a system that measures a subject (not shown) using a sensor 10 and evaluates the performance performed by the subject. As a preprocessing, an external calibration is performed using a target 2. To generate external parameters.
- the information processing system integrates the three-dimensional point cloud data measured by the sensor 10 based on the generated external parameters, generates the three-dimensional point cloud data of the entire subject, and evaluates the performance performed by the subject.
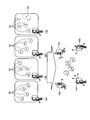
- the information processing device 100 of the information processing system executes a process of generating a sensor connectivity graph, a process of reflecting the distribution of targets in the sensor connectivity graph, and a process of specifying the order in which sensors are selected.
- target 2 is observed by sensor 10A.
- target 2 is observed by sensor 10A.
- target 2 is observed by sensors 10A, 10B.
- target 2 is observed by sensors 10A, 10B.
- target 2 is observed by sensors 10A and 10B.
- target 2 is observed by sensors 10A, 10B, 10C.
- target 2 is observed by sensors 10B, 10C.
- target 2 is observed by sensors 10B, 10D.
- target 2 is observed by sensors 10B, 10C, 10D.
- target 2 is observed by sensors 10C, 10D.
- target 2 is observed by sensors 10C, 10D.
- target 2 is observed by sensors 10B, 10C, 10D.
- target 2 is observed by sensors 10B, 10C, 10D.
- target 2 is observed by sensor 10C.
- the information processing device 100 specifies the number of times (hereinafter, the number of shares) when the target 2 is detected at the same time point among a plurality of time points in a set of two sensors among the sensors 10A to 10D.
- the number of shared sensors 10A and 10D is "0".
- the information processing device 100 generates a target shared number graph 50 based on the shared number specified for each of the two sensor sets.
- the target shared number graph 50 includes nodes 50A, 50B, 50C, and 50D.
- the node 50A is a node corresponding to the sensor 10A.
- the node 50B is a node corresponding to the sensor 10B.
- the node 50C is a node corresponding to the sensor 10C.
- the node 50D is a node corresponding to the sensor 10D.
- the nodes 50A to 50D are connected by the edge E, and each edge E is set with a weight according to the number of sharing.
- the information processing apparatus 100 since the sensor 10A, the shared number of pairs 10B is "4", the edge E BA for connecting the node 50A and node 50B, sets the weight "4".
- the information processing apparatus 100 since the sensor 10A, the shared number of sets of 10C is "1", the edge E CA connecting the node 50A and node 50D, sets the weight "1". Since the number of shared sensors 10A and 10D is "0", the node 50A and the node 50D are not connected by an edge.
- the information processing apparatus 100 since the sensor 10B, the shared number of sets of 10C is "4", the edge E BC which connects the node 50B and node 50C, sets the weight "4".
- the information processing apparatus 100 since the sensor 10B, the shared number of pairs 10D is "3", the edge E DB connecting the node 50B and node 50D, sets the weight "3".
- the information processing apparatus 100 generates the sensor connectivity graph 51 by leaving an edge having a weight of "3" or more among the edges E.
- the information processing apparatus 100 generates the sensor connectivity graph 51 by deleting the edge E CA from the target shared number graph 50 and leaving the edge E BA , E CB , E DB , and E CD. To do.
- FIG. 4 is a diagram for explaining a process of reflecting the variance of the target in the sensor connectivity graph.
- the information processing apparatus 100 calculates the variance ⁇ 2 of the position of the target group observed by the set of two sensors at each time point.
- the information processing apparatus 100 sets "-2log ⁇ " as the weight of each edge E, and reflects the variance of the target in the sensor connectivity graph. The smaller the edge weight, the larger the spatial variance (even distribution) of the positions of the target groups observed by the pair of two sensors.
- - the "2Logshiguma BA” is referred to as "-2.7”
- the information processing apparatus 100, the edge E BA sets the weight "-2.7".
- - the "2Logshiguma DB" is referred to as "-3.2”
- the information processing apparatus 100, the edge E DB sets the weight "-3.2”.
- the information processing device 100 executes a process of specifying the order of selecting sensors to be calculated for external parameters based on the result of reflecting the variance of the target 2 on the sensor connectivity graph 51.
- the information processing device 100 determines a route that minimizes the sum of the edges E by the shortest path search.
- the information processing apparatus 100 uses the Bellman-Ford method or the like to determine a route that minimizes the sum of the edges E.
- the path that minimizes the sum of each edge E is the order of the sensors so that the spatial dispersion of the positions of the target group is as large as possible.
- the route that minimizes the sum of each edge E is in the order of node 50A, node 50B, node 50D, and node 50C. It becomes. That is, the order of the sensors is sensor 10A, sensor 10B, sensor 10D, and sensor 10C so that the spatial dispersion of the positions of the target group becomes as large as possible.
- the information processing device 100 selects the sensor 10B, the sensor 10D, and the sensor C in this order with the sensor 10A as a reference, and estimates the external parameters.
- the external parameters of the sensor that is not directly connected to the reference sensor.
- FIG. 5 is a diagram for explaining the calculation of external parameters of sensors that are not directly connected.
- the node 50A, the node 50B, the node 50D, and the node 50C correspond to the sensor 10A, the sensor 10B, the sensor 10C, and the sensor 10D, respectively.
- the node 50A and the node 50C are not directly connected, but by executing the following processing, the reference sensor 10A and the sensor 10C are relative to each other. It is possible to calculate various positions and postures.
- the information processing device 100 calculates the relative position and orientation of the reference sensor 10A and the sensor 10C based on the equation (1).
- each T is a matrix containing a rotation matrix and a translation vector.
- T CA T CD T DB T BA ... (1)
- the information processing apparatus 100 executes observations by the sensors 10A to 10D while moving the target 2 at each time point, and indicates the number of times when the target 2 is detected at the same time. Identify the number of shares.
- the information processing apparatus 100 generates a target shared number graph 50 in which the shared number is an edge weight, and from the target shared number graph 50, a sensor connectivity graph 51 that leaves edges having an edge E weight of a predetermined number or more. To generate.
- the set of nodes connected in the sensor connectivity graph 51 shows a set of sensors in which the number of times the target 2 is observed at the same time is a predetermined number or more.
- the information processing apparatus 100 calculates the variance ⁇ 2 of the position of the target group observed by the set of two sensors at each time point, sets “-2log ⁇ ” as the weight of each edge E, and sets the variance of the target. Reflect in the sensor connectivity graph. In the sensor connectivity graph in which the weight of each edge E is defined as "-2log ⁇ ", the smaller the edge weight, the larger the spatial variance of the position of the target group observed by the pair of two sensors. ..
- the information processing device 100 specifies a route that minimizes the sum of the edges E, and specifies the order of the sensors 10 to be selected when calculating the external parameter based on the specified route.
- the order of the sensors can be specified so that the spatial dispersion of the positions of the target group becomes as large as possible so that the calculation of the external parameters of the sensor 10 is stable. Therefore, for three or more sensors, it is possible to accurately generate information indicating the relative positional relationship such as the arrangement positional relationship and the angle of view relationship.
- FIG. 6 is a diagram for explaining the effect of the information processing apparatus according to the first embodiment.
- the upper part of FIG. 6 shows the order of selection of the sensor 10 when the prior art 2 is used.
- the lower row shows the order of selection of the sensor 10 specified by the information processing apparatus 100.
- the sensors 10 are selected in a predetermined order, such as sensors 10A, 10B, 10C, and 10D.
- a predetermined order such as sensors 10A, 10B, 10C, and 10D.
- the targets that can be used for estimating the external parameters are reduced in the observation result 20C, and the distribution is biased. If the targets that can be used to estimate the external parameters are unevenly distributed, the estimation accuracy of the external parameters will be low.
- the sensors 10 are selected in the order of the sensors 10A, 10B, 10C, and 10D by using the sensor connectivity graph.
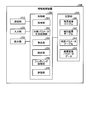
- FIG. 7 is a functional block diagram showing the configuration of the information processing apparatus according to the first embodiment.
- the information processing device 100 includes a communication unit 110, an input unit 120, a display unit 130, a storage unit 140, and a control unit 150.
- the communication unit 110 is a processing unit that receives distance image data from the sensor 10 shown in FIG.
- the communication unit 110 outputs the received distance image data to the control unit 150.
- the communication unit 110 is an example of a communication device.
- the input unit 120 is an input device that inputs various information to the information processing device 100.
- the input unit 120 corresponds to a keyboard, a mouse, a touch panel, and the like. For example, at each time point, the user operates the input unit 120 every time the installation of the target 2 is completed, and inputs information to the effect that the installation of the target 2 is completed to the information processing device 100.
- the display unit 130 is a display device that displays information output from the control unit 150. For example, the display unit 130 displays skill certification, scoring results, etc. of various competitions.
- the display unit 130 corresponds to a liquid crystal display, an organic EL (Electro-Luminescence) display, a touch panel, and the like.
- the storage unit 140 has a background image table 141, a detection result table 142, and an external parameter table 143.
- the storage unit 140 corresponds to semiconductor memory elements such as RAM (Random Access Memory) and flash memory (Flash Memory), and storage devices such as HDD (Hard Disk Drive).
- the background image table 141 is a table that stores background image data (distance image data) measured by each of the sensors 10A to 10D in the absence of the target 2.
- the detection result table 142 is a table that stores the point cloud and the position of the target 2 detected at each time point based on the observation result of the sensor 10.
- FIG. 8 is a diagram showing an example of the data structure of the detection result table.
- the detection result table 142 stores the sensor identification information and the point cloud information of the target 2 at each time point.
- the sensor identification information is information that identifies the sensor 10.
- the sensor identification information SE10A, SE10B, SE10C, SE10D correspond to the sensor 10A, the sensor 10B, the sensor 10C, and the sensor 10D, respectively.
- the point cloud information of the target is data showing the relationship between the three-dimensional point cloud of the target 2 and the three-dimensional coordinates of the points included in the point cloud. If the target is not detected at the time of the corresponding sensor identification information, "no target" is stored.
- the external parameter table 143 is a table that stores external parameters generated by the external parameter generation processing unit 152, which will be described later.
- FIG. 9 is a diagram showing an example of the data structure of the external parameter table. As shown in FIG. 9, the external parameter table 143 associates the sensor identification information with the external parameters.
- the sensor identification information is information that identifies the sensor 10.
- the external parameters are data indicating the position and orientation relative to the reference sensor 10. In the first embodiment, the reference sensor is the sensor 10A.
- the external parameter TBA is data indicating the relative position and orientation of the sensor 10B with respect to the sensor 10A.
- the external parameter T CA is data indicating the relative position and orientation of the sensor 10C with respect to the sensor 10A.
- the external parameter TDA is data indicating the relative position and orientation of the sensor 10D with respect to the sensor 10A.
- the control unit 150 includes an acquisition unit 151, an external parameter generation processing unit 152, an integration unit 153, a fitting processing unit 154, and an evaluation unit 155.
- the control unit 150 is realized by hard-wired logic such as CPU (Central Processing Unit), MPU (Micro Processing Unit), ASIC (Application Specific Integrated Circuit), FPGA (Field Programmable Gate Array), and the like.
- the acquisition unit 151 is a processing unit that acquires distance image data from the sensor 10 via the communication unit 110. For example, the timing at which the acquisition unit 151 acquires the data of the distance image is instructed by the user who operates the input unit 120.
- the acquisition unit 151 takes the difference between the distance image data and the background image data stored in the background image table 141, and generates background subtraction image data.
- the acquisition unit 151 outputs the background subtraction image data to the external parameter generation processing unit 152.
- the acquisition unit 151 generates background subtraction data corresponding to the sensor 10A by the difference between the distance image data measured by the sensor 10A and the background image data corresponding to the sensor 10A.
- the acquisition unit 151 generates background subtraction data corresponding to the sensor 10B by the difference between the distance image data measured by the sensor 10B and the background image data corresponding to the sensor 10B.
- the acquisition unit 151 generates background subtraction data corresponding to the sensor 10C by the difference between the distance image data measured by the sensor 10C and the background image data corresponding to the sensor 10C.
- the acquisition unit 151 generates background subtraction data corresponding to the sensor 10D by the difference between the distance image data measured by the sensor 10D and the background image data corresponding to the sensor 10D.
- the acquisition unit 151 repeatedly executes the above process each time the distance image data is acquired from the sensor 10 at each time point.
- the acquisition unit 151 may add the information at the time point t and the sensor identification information of the corresponding sensor 10 to the background subtraction data.
- the acquisition unit 151 When executing external calibration, the acquisition unit 151 outputs background subtraction data to the external parameter generation processing unit 152. The acquisition unit 151 outputs background subtraction data to the integration unit 153 when evaluating the performance performed by the subject (not shown). The acquisition unit 151 receives the timing of performing the external calibration and the timing of evaluating the performance from the input unit 120 operated by the user.
- the external parameter generation processing unit 152 is a processing unit that generates external parameters by executing the processes described in FIGS. 2 to 5.
- the external parameter generation processing unit 152 stores the generated external parameters in the external parameter table 143.
- FIG. 10 is a functional block diagram showing the configuration of the external parameter generation processing unit.
- the external parameter generation processing unit 152 includes a detection unit 160, a specific unit 161, a graph generation unit 162, a parameter generation unit 163, and a robust estimation unit 164.
- the detection unit 160 is a processing unit that detects the target 2 at a plurality of time points.
- the detection unit 160 clusters each pixel (pixels excluding the background portion) left in the background subtraction data, and classifies each pixel into a plurality of clusters.
- the detection unit 160 removes clusters in which the number of pixels belonging to the cluster is less than a predetermined number (the area of the cluster is less than the threshold value) among the clusters as noise.
- the detection unit 160 holds a conversion table that defines the relationship between the pixel position and distance values and the coordinates of the points and the Cartesian coordinate system.
- the detection unit 160 converts each pixel included in the cluster into a three-dimensional point cloud based on the conversion table.
- the detection unit 160 evaluates the error when the three-dimensional point cloud of each cluster is fitted to the preset three-dimensional model surface of the target 2.
- the detection unit 160 identifies the cluster with the smallest error when fitted as the target 2.
- the detection unit 160 may execute fitting based on ICP (Iterative Closest Point) or the like.
- ICP Intelligent Closest Point
- the three-dimensional point cloud of the cluster corresponding to the target 2 has a relationship between the point cloud and the coordinates of the Cartesian coordinate system of each point, and corresponds to the point cloud information.
- the detection unit 160 stores the above point cloud information in the detection result table 142 based on the sensor identification information and the time point information given to the background subtraction data.
- the detection unit 160 executes the above processing based on the background subtraction data, and when the target 2 is not observed by the sensor 10, the information without the target is stored in the detection result table 142.
- the detection unit 160 repeatedly executes the above process every time it acquires background subtraction data.
- the identification unit 161 is a processing unit that specifies the number of shares for each set of two sensors 10.
- the identification unit 161 acquires the data of the detection result table 142 and specifies whether or not the sensors 10A to 10D have detected the target at each time point.
- the identification unit 161 is a set of two sensors 10 among the sensors 10A to 10D, and specifies the number of times (number of shares) when the target 2 is detected at the same time point among a plurality of time points.
- the specific process for the specifying unit 161 to specify the number of shares corresponds to the process of the information processing device 100 described with reference to FIG.
- the identification unit 161 outputs the data of the number of shares specified for each set of the two sensors 10 to the graph generation unit 162. For example, when the observation result of the target 2 at each time point is the one described in FIG. 2, the shared number of the pair of sensors 10A and 10B is “4”. The number of shared sensors 10A and 10C is "1". The number of shared sensors 10A and 10D is "0". The number of shared sensors 10B and 10C is "4". The number of shared sensors 10B and 10D is "3". The number of shared sensors 10C and 10D is "4".
- the graph generation unit 162 is a processing unit that generates the sensor connectivity graph 51.
- the graph generation unit 162 generates the target shared number graph 50 based on the shared number data specified for each set of the two sensors 10.
- the number of shared sensors 10A and 10B is "4"
- the number of shared sensors 10A and 10C is "1”
- the number of shared sensors 10A and 10D is "0”
- the number of shared sensors 10B and 10C is "0”.
- the number is "4"
- the number of shared sensors 10B and 10D is "3".
- the graph generation unit 162 generates the sensor connectivity graph 51 by leaving an edge having a weight of “3” or more among the edges E.
- the graph generation unit 162 generates the sensor connectivity graph 51 by deleting the edge E CA from the target shared number graph 50 and leaving the edges E BA , E CB , E DB , and E CD. To do.
- the graph generation unit 162 executes a process of reflecting the variance of the target on the sensor connectivity graph 51. As described with reference to FIG. 4, the graph generation unit 162 calculates the variance ⁇ 2 of the position of the target group observed by the set of two sensors at each time point. The graph generation unit 162 sets "-2log ⁇ " as the weight of each edge E, and reflects the variance of the target in the sensor connectivity graph.
- the coordinates of the center of gravity of the coordinates of each point included in the point cloud information of the target 2 may be used as the position of the target 2.
- Graph generating unit 162 the set of sensor 10B and the sensor 10C, the set of the sensor 10B and the sensor 10D, and the same applies to the combination of the sensor 10C and the sensor 10D, variance sigma 2 CB, variance sigma 2 DB, variance sigma 2 Calculate the CD.
- the graph generation unit 162 outputs the data of the sensor connectivity graph 51 in which the edge weights are set to the parameter generation unit 163.
- the parameter generation unit 163 generates an external parameter between two connected sensors based on the sensor connectivity graph 51.
- the parameter generation unit 163 stores the external parameters in the external parameter table 143. Further, the parameter generation unit 163 may transmit the external parameter to a preset external device.
- the parameter generation unit 163 generates an external parameter between two sensors having no connectivity based on the sensor connectivity graph 51 and the generated external parameter.
- an example of the processing of the parameter generation unit 163 will be described.
- the parameter generation unit 163 executes a path that minimizes the sum of each edge E on the sensor connectivity graph 51 by searching for the shortest path. For example, the parameter generation unit 163 selects the path P such that the sum of the edges E is minimized by using the Bellman-Ford method or the like.
- the path P that minimizes the sum of the edges E is the node 50A, the node 50B, the node 50D, and the node 50C. In that order.
- the parameter generation unit 163 identifies the set of sensors 10A and 10B, the set of sensors 10B and 10D, and the set of sensors 10D and 10C as two connected sensors.
- the parameter generation unit 163 identifies the set of sensors 10A and 10C as two sensors having no connection.
- Parameter generation unit 163 performs the position of the target 2 at the time of sensor 10D, the relationship between the position of the target 2 at the time of sensor 10C, aligned with singular value decomposition to calculate the initial value of the external parameter T CD ..
- the parameter generation unit 163 executes optimization of the external parameters T BA , T DB , and T CD (fitting of the target 2 shape) by using bundle adjustment and maximum likelihood estimation , and finally the external parameters T BA , T DB. , T CD is calculated. Between the two sensors with connectivity, each external parameter T BA, T DB, T CD corresponds to "information indicating a first correlation positional relationship".
- the parameter generation unit 163 calculates the external parameter T CA based on the equation (1) and the external parameters T BA , T DB , and T CD.
- the external parameter T CA is an external parameter between two sensors that are not connected, and corresponds to "information indicating a second correlation positional relationship".
- the parameter generation unit 163 stores the external parameters T BA , T CA , and T DA based on the sensor 10A in the external parameter table 143.
- the parameter generation unit 163 calculates an external parameter TDA indicating the relative position and orientation of the sensor 10D with reference to the sensor 10A by the equation (2).
- the robust estimation unit 164 is a processing unit that detects erroneous detection of the target 2.
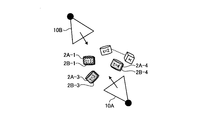
- 11 to 15 are diagrams for explaining the processing of the robust estimation unit.
- the description will be given based on the sensor 10A and the sensor 10B.
- the observation results of the sensor 10A and the sensor 10B are shown in FIG.
- the foreground object 3 is erroneously detected as the target 2 instead of the target 2 and stored in the detection result table 142.
- the robust estimation unit 164 associates the target 2 (foreground object 3) observed at the same point. That is, the robust estimation unit 164 associates the target 2A-1 with the target 2B-1. The robust estimation unit 164 associates the target 2A-2 with the foreground object 3. The robust estimation unit 164 associates the target 2A-3 with the target 2B-3. The robust estimation unit 164 associates the target 2A-4 with the target 2B-4.
- the robust estimation unit 164 calculates the external parameter TBA so that the total sum of the distances between the corresponding target pairs is minimized based on the above correspondence. For example, the robust estimation unit 164 optimizes the external parameter TBA between the sensor 10A and the sensor 10B by using the bundle estimation or the maximum likelihood estimation after estimating the initial value, and finally the external. Calculate the parameter TBA.
- Robust estimation unit 164 using the external parameters T BA, observations 30B position of each target 2, when correcting the sensor 10A in position relative, is as shown in FIG. 14. Due to the influence of erroneous correspondence (target 2A-2 and foreground object 3), the position of the associated target 2A-1,2B-1 pair, the position of the target 2A-3, 2B-3 pair, and the target 2A- The positions of the 4, 2B-4 pairs do not match.
- the robust estimation unit 164 determines that noise (foreground object 3) is observed when the average of the distances of the associated targets is equal to or greater than the threshold value, and executes the following processing. Robust estimation unit 164 of the set for each target associated at each time point, to the exclusion of one of the set, to calculate the extrinsic parameters T BA.
- the robust estimation unit 164 corrects the position of each target 2 (excluding the set of targets 2A-1 and 2B-1) of the observation result 30B to a position based on the sensor 10A by using the external parameter T BA1.
- the average (first average value) of the distances of the associated targets is calculated.
- the robust estimation unit 164 corrects the position of each target 2 (excluding the set of the target 2A-2 and the foreground object 3) of the observation result 30B to the position based on the sensor 10A by using the external parameter T BA2.
- the average (second average value) of the distances of the associated targets is calculated. For example, the result of correcting the position of each target 2 (excluding the set of the target 2A-2 and the foreground object 3) to the position based on the sensor 10A by using the external parameter T BA2 is shown in FIG. Become.
- each target 2 (excluding the set of targets 2A-3 and 2B-3) of the observation result 30B is corrected to the position based on the sensor 10A, and each associated target is corrected. Calculate the average of the distances (third average value).
- each target 2 (excluding the set of targets 2A-4 and 2B-4) of the observation result 30B is corrected to the position based on the sensor 10A, and each associated target is corrected. Calculate the average of the distances (fourth average value).
- the robust estimation unit 165 executes the above processing after the detection result table 142 is generated by the detection unit 160 and before the processing by the specific unit 161, the graph generation unit 162, and the parameter generation unit 163 is started. .. This makes it possible to remove noise (foreground object 3) that is erroneously detected other than the target.
- the integration unit 153, the fitting processing unit 154, and the evaluation unit 155 execute processing when the external calibration is completed and the subject starts acting by the external parameter generation processing unit 152.
- the integration unit 153 acquires background subtraction data of each sensor 10A to 10D from the acquisition unit 151. Using the conversion table, the integration unit 153 converts the relationship between each pixel included in the background subtraction data and the distance value into the relationship between the point cloud and the coordinates of the Cartesian coordinate system of each point.
- the converted background subtraction data is referred to as "three-dimensional point cloud data".
- the conversion table is a table that defines the relationship between the position and distance values of pixels and the coordinates of points and Cartesian coordinate systems.
- the integration unit 153 uses the sensor 10A as a reference sensor 10 and adjusts the three-dimensional point cloud data of the sensors 10B to 10D to the position and orientation of the sensor 10A. For example, integrating unit 153, using the external parameters T BA, the three-dimensional point group data of the sensor 10B, adjusted to the position and orientation of the sensor 10A. Integrating unit 153, using the external parameters T CA, 3D point cloud data of the sensor 10C, adjusted to the position and orientation of the sensor 10A. Integrating unit 153, using the external parameters T DA, the 3D point group data of the sensor 10D, adjusted to the position and orientation of the sensor 10A. The integration unit 153 acquires each external parameter from the external parameter table 143.
- the integration unit 153 integrates the three-dimensional point group data of the sensor 10A and the three-dimensional point group data of the sensors 10B to 10D according to the position and orientation of the sensor 10A to generate one three-dimensional point group data. ..
- the integration unit 153 outputs the generated three-dimensional point cloud data to the fitting processing unit 154.
- the integration unit 153 repeatedly executes the above process every time it acquires background subtraction data of the sensors 10A to 10D from the acquisition unit 151.
- the fitting processing unit 154 is a processing unit that executes fitting that applies the 3D model data of the subject to the 3D point cloud data.
- the fitting processing unit 154 identifies the skeleton model data of the subject based on the fitting result.
- the skeletal model data includes position information of each joint.
- the fitting processing unit outputs the skeleton model data to the evaluation unit 155.
- the fitting processing unit repeatedly executes the above processing each time it acquires three-dimensional point cloud data from the integration unit 153.
- the evaluation unit 155 is a processing unit that acquires skeletal model data in time series and evaluates the performance of the subject based on the transition of each joint coordinate of the skeletal model data. For example, the evaluation unit 155 evaluates the performance of the subject using a table (not shown) that defines the transition of each joint coordinate, the type of the technique, and the establishment or failure of the technique, and outputs the evaluation result to the display unit 130. To display.
- scoring competitions include trampoline, swimming dive, figure skating, karate kata, social dance, snowboarding, skateboarding, ski aerial, and surfing. It may also be applied to classical ballet, ski jumping, mogul air, turns, baseball, basketball form checks, and the like. It may also be applied to competitions such as kendo, judo, wrestling, and sumo. Furthermore, it can be used to evaluate whether or not the weightlifting barbell has been raised.
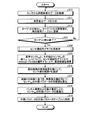
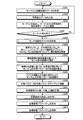
- FIG. 16 is a flowchart showing a processing procedure of the information processing apparatus according to the first embodiment.
- the acquisition unit 151 of the information processing device 100 acquires the distance image data from the sensor 10 (step S10).
- the acquisition unit 151 takes the difference between the distance image data and the background image data, and generates background subtraction data (step S11).
- the detection unit 160 of the information processing device 100 detects the target from the background subtraction data and registers the point cloud information of the target in the detection result table 142 (step S12). If the information processing apparatus 100 does not end the detection of the target (steps S13, No), the information processing apparatus 100 proceeds to step S10 again. On the other hand, when the information processing apparatus 100 ends the detection of the target (steps S13, Yes), the information processing apparatus 100 proceeds to step S14.
- the external parameter generation processing unit 152 (specific unit 161 and graph generation unit 162) of the information processing device 100 executes the sensor connectivity graph generation processing (step S14).
- the parameter generation unit 163 of the information processing apparatus 100 applies the Bellman-Ford method on the sensor connectivity graph 31 for the reference sensor i ref and other sensor i tar pairs (i ref , itar). , Search for the shortest route (step S15).
- the reference sensor iref corresponds to the sensor 10A.
- the parameter generation unit 163 selects the path P of the sensor group based on the search result of the shortest path (step S16).
- the parameter generation unit 163 calculates the initial value of the external parameter of the sensor itar using the singular value decomposition based on the order of the path P (step S17).
- Parameter generation unit 163, the bundle adjustment and maximum likelihood estimation, to optimize the external parameters of the sensor i tar (step S18).
- the parameter generation unit 163 stores the external parameters in the external parameter table 143 (step S19).
- the process of step S19 also corresponds to a process of transmitting an external parameter to an external device.
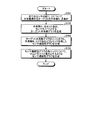
- FIG. 17 is a flowchart showing a processing procedure of the sensor connectivity graph generation process.
- the identification unit 161 of the information processing apparatus 100 totals the shared numbers Ni and j of the targets to be shared and observed for all the sensor sets (i and j) (step S101).
- the graph generation unit 162 of the information processing apparatus 100 generates a target shared number graph 50 in which the shared numbers Ni and j are edge weights and the sensor 10 is a node (step S102).
- the graph generation unit 162 generates a sensor connectivity graph that retains the edges of the target shared number graph such that the shared number Ni, j ⁇ 3 (step S103).
- the graph generation unit 162 generates a sensor connectivity graph having -2log ⁇ as an edge weight for each edge of the sensor connectivity graph (step S104).
- the information processing apparatus 100 executes observations by the sensors 10A to 10D while moving the target 2 at each time point, and specifies a shared number indicating the number of times when the target 2 is detected at the same time.
- the information processing apparatus 100 generates a target shared number graph 50 in which the shared number is an edge weight, and from the target shared number graph 50, a sensor connectivity graph 51 that leaves edges having an edge E weight of a predetermined number or more. To generate. This makes it possible to identify a set of sensors in which the number of times the target 2 is observed at the same time is equal to or greater than a predetermined number.
- the information processing apparatus 100 calculates the variance ⁇ 2 of the position of the target group observed by the set of two sensors at each time point, sets “-2log ⁇ ” as the weight of each edge E, and connects the variance of the target to the sensor. It is reflected in the sex graph 51.
- the weight of each edge E is defined as "-2log ⁇ ”
- the smaller the edge weight the larger the spatial variance of the position of the target group observed by the pair of two sensors. ..
- the information processing device 100 specifies a route that minimizes the sum of the edges E, and specifies the order of the sensors 10 to be selected when calculating the external parameter based on the specified route.
- the order of the sensors can be specified so that the spatial dispersion of the positions of the target group becomes as large as possible so that the calculation of the external parameters of the sensor 10 is stable. Therefore, according to the information processing apparatus 100, it is possible to accurately generate information indicating a relative positional relationship such as an arrangement positional relationship and an angle of view relationship for three or more sensors.
- the information processing apparatus 100 uses a cylindrical target 2 as a target, executes an external calibration, and generates an external parameter, but the present invention is not limited to this.
- the information processing apparatus 100 may use a spherical marker as a target.
- FIG. 18 to 20 are diagrams showing an example of external calibration using a spherical marker.
- the user observes the sphere marker 60 by the sensors 10A to 10D while moving the sphere marker 60 at each time point.
- the spherical marker 60 is moved by a user (not shown).
- the sensor 10A observes the observation result 61A at each time point.
- the sensor 10B observes the observation result 61B at each time point.
- the sensor 10C observes the observation result 61C at each time point.
- the sensor 10D observes the observation result 61D at each time point.
- the information processing device 100 generates background subtraction data 63 by taking the difference between the distance image data 62 and the background image data.
- the information processing device 100 generates background subtraction data 64 by removing noise from background subtraction data 63.
- the information processing device 100 detects the spherical marker 64a from the background subtraction data 64.
- the information processing apparatus 100 can robustly detect the spherical marker 64a with respect to the measurement noise by fitting the spherical marker 64a.
- the information processing device 100 generates a sensor connectivity graph based on the number of shared sphere markers 60 and the variance of the sphere markers 60, and generates external parameters.
- the information processing apparatus 100 accurately generates information (external parameters) indicating the relative positional relationship, such as the arrangement positional relationship and the angle of view relationship, even if the spherical marker 60 is used instead of the target 2. be able to.
- the information processing system according to the second embodiment by arranging the target at a predetermined position and measuring it, it is possible to calculate the position and orientation of an object other than the sensor in addition to generating external parameters.
- a gymnastic instrument will be used as an object other than the sensor, but the present invention is not limited to this.
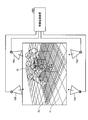
- FIG. 21 is a diagram for explaining the placement position of the target.
- the gymnastics device 70 is arranged.
- the sensors 10A to 10D are arranged around the gymnastics device 70.
- the sensors 10A to 10D are connected to the information processing device 200, respectively.
- the target P1 is arranged directly above the center of the gymnastics device 70.
- the target P2 is on the y-axis of the gymnastics device 70 and is arranged at a height H of the upper surface of the gymnastics device 70.
- the targets P3 to Pn are arranged at positions higher than P2 on the mat 72 having the same height from the floor surface 71. The heights from the floor surface 71 to the targets P3 to Pn are the same. It is a condition that the targets P3 to Pn are 3 or more.
- the information processing device 200 uses the positions of the targets P1 to Pn observed during the execution of the external calibration after the external calibration is executed, and the coordinate system of the gymnasium 70 is used. Xa axis, Ya axis, Za axis and origin Oa are calculated.
- the information processing device 200 fits a plane to the targets P3 to Pn, and specifies the normal of the plane as the Za axis.
- the information processing device 200 calculates the Xa axis based on the equations (3) and (4).
- P1 and P2 included in the formula (3) indicate the positions of the targets P1 and P2.
- the information processing device 200 calculates the Ya axis based on the equation (5).
- the information processing device 200 calculates the origin Oa based on the equation (6).
- H included in the formula (6) corresponds to the height of the upper surface of the gymnastics device 70.
- the volt (v, Za) included in the equation (6) is a function for calculating the inner product of v and Za.
- the reference sensor is the sensor 10A, and the coordinate conversion parameter TaA for converting the Xa axis, the Ya axis, the Za axis, and the origin Oa into the coordinates based on the sensor 10A is calculated.
- the coordinate transformation parameter TaA includes a rotation component R and a translational component t.
- the rotation component R is defined by the equation (7).
- the translational component t is defined by the equation (8). For example, by multiplying the three-dimensional coordinates obtained from the observation result of the sensor 10A by the coordinate conversion parameter TaA , the coordinate system based on the sensor 10A can be converted into the coordinate system of the gymnastics equipment 70.
- the coordinate system of the gym equipment 70 other than the sensor Xa, Ya, Za and the origin Oa can be calculated.
- the three-dimensional model of a subject is generated and displayed as an animation
- the three-dimensional model can be displayed as an animation by the coordinate system of the gymnastics device 70.
- FIG. 22 is a functional block diagram showing the configuration of the information processing apparatus according to the second embodiment.
- the information processing device 200 includes a communication unit 210, an input unit 220, a display unit 230, a storage unit 240, and a control unit 250.
- the communication unit 210 is a processing unit that receives distance image data from the sensor 10 shown in FIG.
- the communication unit 210 outputs the received distance image data to the control unit 250.
- the communication unit 210 is an example of a communication device.
- the input unit 220 is an input device that inputs various information to the information processing device 200.
- the input unit 220 corresponds to a keyboard, a mouse, a touch panel, and the like. For example, at each time point, the user operates the input unit 220 every time the installation of the target Pn is completed, and inputs information to the effect that the installation of the target Pn is completed to the information processing device 100.
- the display unit 230 is a display device that displays information output from the control unit 250. For example, the display unit 230 displays skill certification, scoring results, etc. of various competitions.
- the display unit 230 corresponds to a liquid crystal display, an organic EL (Electro-Luminescence) display, a touch panel, and the like.
- the storage unit 240 has a background image table 241, a detection result table 242, an external parameter table 243, and coordinate conversion parameter data 244.
- the storage unit 240 corresponds to a semiconductor memory element such as a RAM or a flash memory, or a storage device such as an HDD.
- the background image table 241 is a table that stores background image data (distance image data) measured by each of the sensors 10A to 10D in a state where the target Pn does not exist.
- the detection result table 242 is a table that stores the point cloud and the position of the target Pn detected at each time point based on the observation result of the sensor 10.
- the data structure of the detection result table 242 corresponds to the data structure of the detection result table 142 described with reference to FIG.
- the target is the target Pn instead of the target 2.
- the external parameter table 243 is a table that stores external parameters generated by the external parameter generation processing unit 252, which will be described later.
- the data structure of the external parameter table 243 corresponds to the external parameter table 143 described with reference to FIG.
- the coordinate transformation parameter data 244 has data of the coordinate transformation parameter TaA .
- the coordinate conversion parameter TaA is a parameter that converts the Xa axis, the Ya axis, the Za axis, and the origin Oa into coordinates based on the sensor 10A.
- the control unit 250 includes an acquisition unit 251, an external parameter generation processing unit 252, a calculation unit 253, an integration unit 254, a fitting processing unit 255, and an evaluation unit 256.
- the control unit 250 is realized by a CPU, an MPU, a hard-wired logic such as an ASIC or an FPGA, or the like.
- the acquisition unit 251 is a processing unit that acquires distance image data from the sensor 10 via the communication unit 210. For example, the timing at which the acquisition unit 251 acquires the data of the distance image is instructed by the user who operates the input unit 220.
- the acquisition unit 251 takes a difference between the distance image data and the background image data stored in the background image table 241 to generate background difference image data.
- the acquisition unit 251 outputs the background subtraction image data to the external parameter generation processing unit 252.
- the other description of the acquisition unit 251 is the same as the description of the acquisition unit 151 described in the first embodiment.
- the external parameter generation processing unit 252 is a processing unit that generates external parameters based on the data stored in the detection result table 242.
- the external parameter generation processing unit 252 stores the generated external parameters in the external parameter table 243.
- the description of the external parameter generation processing unit 252 is the same as the description of the external parameter generation processing unit 252 described in the first embodiment.
- the calculation unit 253 is a processing unit that calculates the Xa axis, Ya axis, and Za axis of the coordinate system of the coordinate system of the gymnastics equipment 70, and the origin Oa.
- the calculation unit 253 uses the sensor 10A as a reference sensor 10 and adjusts the three-dimensional point cloud data of the targets P1 to Pn observed by the sensors 10B to 10D to the position and orientation of the sensor 10A.
- the three-dimensional point cloud data of the targets P1 to Pn observed by the sensors 10B to 10D are stored in the detection result table 242.
- calculator 253 uses the external parameter T BA, the three-dimensional point group data sensor 10B has observed, adjusted to the position and orientation of the sensor 10A.
- the calculation unit 253 adjusts the three-dimensional point cloud data observed by the sensor 10C to the position and orientation of the sensor 10A by using the external parameter T CA.
- the calculation unit 253 acquires each external parameter from the external parameter table 243.
- the calculation unit 253 adjusts the three-dimensional point group data of the targets P1 to Pn observed by the sensors 10B to 10D to the position and orientation of the sensor 10A, and then adjusts the three-dimensional points of the targets P1 to Pn observed by the sensors 10A to 10D. Integrate group data.
- the calculation unit 253 fits a plane to the targets P3 to Pn, and specifies the normal of the plane as the Za axis.
- the calculation unit 253 calculates the Xa axis based on the equations (3) and (4).
- the calculation unit 253 calculates the Ya axis based on the equation (5).
- the calculation unit 253 calculates the origin Oa based on the equation (6).
- the calculation unit 253 calculates the coordinate conversion parameter TaA that converts the Xa axis, the Ya axis, the Za axis, and the origin Oa into the coordinates based on the sensor 10A. ..
- the calculation unit 253 stores the coordinate conversion parameter TaA in the storage unit 240.
- the integration unit 254, the fitting processing unit 255, and the evaluation unit 256 execute processing when the external calibration is completed and the subject starts acting by the external parameter generation processing unit 252.
- the integration unit 254 integrates the 3D point cloud data of the sensor 10A and the 3D point cloud data of the sensors 10B to 10D according to the position and orientation of the sensor 10A to generate one 3D point cloud data. It is a processing unit.
- the description of the integrated unit 254 is the same as the description of the integrated unit 153 described in the first embodiment.
- the integration unit 254 When the integration unit 254 receives an instruction from the evaluation unit 256 to convert to the coordinate system of the gymnastics equipment 70, the integration unit 254 multiplies the coordinates of the integrated three-dimensional point cloud data by the coordinate conversion parameter TaA. As a result, the three-dimensional point cloud data of the coordinate system based on the sensor 10A can be converted into the three-dimensional point cloud data of the coordinate system of the gymnastics equipment 70.
- the fitting processing unit 255 is a processing unit that executes fitting that applies the 3D model data of the subject to the 3D point cloud data.
- the fitting processing unit 255 identifies the skeleton model data of the subject based on the fitting result.
- the skeletal model data includes position information of each joint.
- the fitting processing unit outputs the skeleton model data to the evaluation unit 256.
- the fitting processing unit 255 repeatedly executes the above processing every time the three-dimensional point cloud data is acquired from the integration unit 254.
- the evaluation unit 256 is a processing unit that acquires skeletal model data in time series and evaluates the performance of the subject based on the transition of each joint coordinate of the skeletal model data. For example, the evaluation unit 256 evaluates the performance of the subject using a table (not shown) that defines the transition of each joint coordinate, the type of technique, and the establishment or failure of the technique, and outputs the evaluation result to the display unit 230. To display.
- the evaluation unit 256 may display the three-dimensional model in animation by the coordinate system of the gymnastics equipment 70. .. Further, the evaluation unit 256 may output an instruction to convert to the coordinate system of the gymnastics equipment 70 to the integration unit 254, and may convert the coordinates of the subject into the coordinate system of the gymnastics equipment 70 and display it.
- FIG. 23 is a flowchart showing a processing procedure of the information processing apparatus according to the second embodiment.
- the acquisition unit 251 of the information processing device 200 acquires the distance image data from the sensor 10 (step S201).
- the acquisition unit 251 takes the difference between the distance image data and the background image data, and generates background subtraction data (step S202).
- the external parameter generation processing unit 252 of the information processing device 200 detects the target from the background subtraction data and registers the point cloud information of the target in the detection result table 242 (step S203). If the information processing apparatus 200 does not end the detection of the target (steps S204, No), the information processing apparatus 200 proceeds to step S201 again. On the other hand, when the information processing apparatus 200 ends the detection of the target (step S204, Yes), the information processing apparatus 200 proceeds to step S205.
- the external parameter generation processing unit 252 of the information processing device 200 executes the sensor connectivity graph generation processing (step S205).
- the sensor connectivity graph generation process in step S205 corresponds to the processing procedure of the sensor connectivity graph generation process described with reference to FIG. 17 of the first embodiment.
- the external parameter generation processing unit 252 of the information processing apparatus 200 applies the Bellman-Ford method on the sensor connectivity graph 31 for the reference sensor i ref and other sensor i tar pairs (i ref , itar). By doing so, the shortest route is searched (step S206).
- the reference sensor iref corresponds to the sensor 10A.
- the external parameter generation processing unit 252 selects the path P of the sensor group based on the search result of the shortest path (step S207).
- the external parameter generation processing unit 252 calculates the initial value of the external parameter of the sensor itar using the singular value decomposition based on the order of the path P (step S208).
- External parameter generation processing unit 252 a bundle adjustment and maximum likelihood estimation, to optimize the external parameters of the sensor i tar (step S209).
- the external parameter generation processing unit 252 stores the external parameters in the external parameter table 243 (step S210).
- the calculation unit 253 of the information processing device 200 calculates the Xa axis, Ya axis, and Za axis of the gymnastics device 70 (step S211).
- the calculation unit 253 calculates the origin Oa of the gymnastics device 70 (step S212).
- the calculation unit 253 calculates the coordinate conversion parameter TaA (step S213).
- the calculation unit 253 stores the coordinate conversion parameter TaA in the coordinate conversion parameter data 244 (step S214).
- the information processing apparatus 200 uses the positions of the targets P1 to Pn observed at the time of executing the external calibration to use the Xa axis, Ya axis, Za axis and the origin Oa of the coordinate system of the gymnastics device 70. Can be calculated.
- the coordinate conversion parameter TaA when a three-dimensional model of a subject is generated and displayed as an animation, the three-dimensional model can be displayed as an animation by the coordinate system of the gymnastics equipment 70.
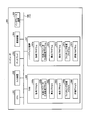
- FIG. 24 is a diagram showing an example of a hardware configuration of a computer that realizes a function similar to that of an information processing device.
- the computer 300 has a CPU 301 that executes various arithmetic processes, an input device 302 that receives data input from a user, and a display 303. Further, the computer 300 has a communication device 304 that receives distance image data from the sensor 10 and an interface device 305 that connects to various devices. The computer 300 has a RAM 306 that temporarily stores various information and a hard disk device 307. Then, each of the devices 301 to 307 is connected to the bus 308.
- the hard disk device 307 includes an acquisition program 307a, an external parameter generation processing program 307b, a calculation program 307c, an integration program 307d, a fitting processing program 307e, and an evaluation program 307f.
- the CPU 201 reads the acquisition program 307a, the external parameter generation processing program 307b, the calculation program 307c, the integration program 307d, the fitting processing program 307e, and the evaluation program 307f and deploys them in the RAM 306.
- the acquisition program 307a functions as the acquisition process 306a.
- the external parameter generation processing program 307b functions as the external parameter generation processing process 306b.
- the calculation program 307c functions as the calculation process 306c.
- the integration program 307d functions as the integration process 306d.
- the fitting processing program 307e functions as the fitting processing process 306e.
- the evaluation program 307f functions as the evaluation process 306f.
- the processing of the acquisition process 206a corresponds to the processing of the acquisition units 151 and 251.
- the processing of the external parameter generation processing process 306b corresponds to the processing of the external parameter generation processing units 152 and 252.
- the processing of the calculation process 306c corresponds to the processing of the calculation unit 253.
- the processing of the integration process 306d corresponds to the processing of the integration units 153 and 254.
- the processing of the fitting processing process 306e corresponds to the processing of the fitting processing units 154 and 255.
- the processing of the evaluation process 306f corresponds to the processing of the evaluation units 155 and 256.
- each program 307a to 307f does not necessarily have to be stored in the hard disk device 307 from the beginning.
- each program is stored in a "portable physical medium" such as a flexible disk (FD), a CD-ROM, a DVD disk, a magneto-optical disk, or an IC card inserted into the computer 300. Then, the computer 300 may read and execute each of the programs 307a to 307f.
- 10A, 10B, 10C, 10D Sensor 100 Information processing device 110 Communication unit 120 Input unit 130 Display unit 140, 240 Storage unit 141,241 Background image table 142,242 Detection result table 143,243 External parameter table 150,250 Control unit 151 , 251 Acquisition unit 152,252 External parameter generation processing unit 153,254 Integration unit 154,255 Fitting processing unit 155,256 Evaluation unit 160 Detection unit 161 Specific unit 162 Graph generation unit 163 Parameter generation unit 164 Robust estimation unit 244 Coordinate conversion parameter Data 253 calculation unit
Landscapes
- Engineering & Computer Science (AREA)
- Physics & Mathematics (AREA)
- General Physics & Mathematics (AREA)
- Electromagnetism (AREA)
- Computer Networks & Wireless Communication (AREA)
- Radar, Positioning & Navigation (AREA)
- Remote Sensing (AREA)
- Theoretical Computer Science (AREA)
- Computer Vision & Pattern Recognition (AREA)
- Length Measuring Devices With Unspecified Measuring Means (AREA)
- Length Measuring Devices By Optical Means (AREA)
- Measurement Of Optical Distance (AREA)
- Image Analysis (AREA)
Priority Applications (5)
| Application Number | Priority Date | Filing Date | Title |
|---|---|---|---|
| PCT/JP2019/039019 WO2021064925A1 (ja) | 2019-10-02 | 2019-10-02 | 生成方法、生成プログラムおよび情報処理装置 |
| CN201980100162.3A CN114430800B (zh) | 2019-10-02 | 2019-10-02 | 生成方法、记录介质和信息处理装置 |
| EP19947861.1A EP4040104B1 (en) | 2019-10-02 | 2019-10-02 | Generating information indicating relative positional relationships for three or more sensors |
| JP2021550867A JP7188612B2 (ja) | 2019-10-02 | 2019-10-02 | 生成方法、生成プログラムおよび情報処理装置 |
| US17/676,273 US12613341B2 (en) | 2019-10-02 | 2022-02-21 | Generation method, non-transitory computer-readable storage medium for storing generation program, and information processing apparatus |
Applications Claiming Priority (1)
| Application Number | Priority Date | Filing Date | Title |
|---|---|---|---|
| PCT/JP2019/039019 WO2021064925A1 (ja) | 2019-10-02 | 2019-10-02 | 生成方法、生成プログラムおよび情報処理装置 |
Related Child Applications (1)
| Application Number | Title | Priority Date | Filing Date |
|---|---|---|---|
| US17/676,273 Continuation US12613341B2 (en) | 2019-10-02 | 2022-02-21 | Generation method, non-transitory computer-readable storage medium for storing generation program, and information processing apparatus |
Publications (1)
| Publication Number | Publication Date |
|---|---|
| WO2021064925A1 true WO2021064925A1 (ja) | 2021-04-08 |
Family
ID=75336826
Family Applications (1)
| Application Number | Title | Priority Date | Filing Date |
|---|---|---|---|
| PCT/JP2019/039019 Ceased WO2021064925A1 (ja) | 2019-10-02 | 2019-10-02 | 生成方法、生成プログラムおよび情報処理装置 |
Country Status (5)
| Country | Link |
|---|---|
| US (1) | US12613341B2 (cg-RX-API-DMAC7.html) |
| EP (1) | EP4040104B1 (cg-RX-API-DMAC7.html) |
| JP (1) | JP7188612B2 (cg-RX-API-DMAC7.html) |
| CN (1) | CN114430800B (cg-RX-API-DMAC7.html) |
| WO (1) | WO2021064925A1 (cg-RX-API-DMAC7.html) |
Cited By (1)
| Publication number | Priority date | Publication date | Assignee | Title |
|---|---|---|---|---|
| CN115406374A (zh) * | 2022-08-03 | 2022-11-29 | 广州启量信息科技有限公司 | 一种基于点云图的投影面积计算方法及装置 |
Families Citing this family (1)
| Publication number | Priority date | Publication date | Assignee | Title |
|---|---|---|---|---|
| CN120723349A (zh) * | 2024-03-27 | 2025-09-30 | 深圳绿米联创科技有限公司 | 目标显示方法、目标检测方法、装置、设备和存储介质 |
Citations (4)
| Publication number | Priority date | Publication date | Assignee | Title |
|---|---|---|---|---|
| JP2014515530A (ja) * | 2011-05-27 | 2014-06-30 | クゥアルコム・インコーポレイテッド | モバイルデバイスのための平面マッピングおよびトラッキング |
| JP2016213808A (ja) * | 2015-04-29 | 2016-12-15 | パナソニックIpマネジメント株式会社 | カメラ選択方法及び映像配信システム |
| JP2019086476A (ja) | 2017-11-09 | 2019-06-06 | キヤノン株式会社 | 画像処理装置、画像処理方法、プログラムおよびキャリブレーション用具 |
| JP2019153863A (ja) * | 2018-03-01 | 2019-09-12 | ソニー株式会社 | 画像処理装置、符号化装置、復号化装置、画像処理方法、プログラム、符号化方法及び復号化方法 |
Family Cites Families (12)
| Publication number | Priority date | Publication date | Assignee | Title |
|---|---|---|---|---|
| JPH08287608A (ja) * | 1995-04-18 | 1996-11-01 | Fujitsu Ltd | 情報再生装置及び最尤等化検出方法 |
| JP3647584B2 (ja) * | 1996-12-26 | 2005-05-11 | 富士通株式会社 | 学習型自己定位装置 |
| EP1349114A3 (en) * | 2002-03-19 | 2011-06-15 | Canon Kabushiki Kaisha | Sensor calibration apparatus, sensor calibration method, program, storage medium, information processing method, and information processing apparatus |
| EP1862969A1 (en) * | 2006-06-02 | 2007-12-05 | Eidgenössische Technische Hochschule Zürich | Method and system for generating a representation of a dynamically changing 3D scene |
| JP5708305B2 (ja) * | 2011-06-30 | 2015-04-30 | 富士通株式会社 | 画像認識装置、画像認識方法及び画像認識用コンピュータプログラム |
| JP6370038B2 (ja) * | 2013-02-07 | 2018-08-08 | キヤノン株式会社 | 位置姿勢計測装置及び方法 |
| JP6415291B2 (ja) * | 2014-12-09 | 2018-10-31 | キヤノン株式会社 | 情報処理装置、情報処理方法、プログラム |
| US10171794B2 (en) | 2015-04-29 | 2019-01-01 | Panasonic Intellectual Property Management Co., Ltd. | Method for selecting cameras and image distribution system capable of appropriately selecting cameras |
| JPWO2017159382A1 (ja) * | 2016-03-16 | 2019-01-24 | ソニー株式会社 | 信号処理装置および信号処理方法 |
| JP6685836B2 (ja) * | 2016-05-30 | 2020-04-22 | 株式会社東芝 | 情報処理装置、および、情報処理方法 |
| JP7325332B2 (ja) * | 2017-11-20 | 2023-08-14 | パナソニック インテレクチュアル プロパティ コーポレーション オブ アメリカ | 三次元点群データ生成方法、および、三次元点群データ生成装置 |
| JP6632703B2 (ja) | 2018-12-27 | 2020-01-22 | キヤノン株式会社 | 制御装置、制御方法、及び、プログラム |
-
2019
- 2019-10-02 CN CN201980100162.3A patent/CN114430800B/zh active Active
- 2019-10-02 EP EP19947861.1A patent/EP4040104B1/en active Active
- 2019-10-02 JP JP2021550867A patent/JP7188612B2/ja active Active
- 2019-10-02 WO PCT/JP2019/039019 patent/WO2021064925A1/ja not_active Ceased
-
2022
- 2022-02-21 US US17/676,273 patent/US12613341B2/en active Active
Patent Citations (4)
| Publication number | Priority date | Publication date | Assignee | Title |
|---|---|---|---|---|
| JP2014515530A (ja) * | 2011-05-27 | 2014-06-30 | クゥアルコム・インコーポレイテッド | モバイルデバイスのための平面マッピングおよびトラッキング |
| JP2016213808A (ja) * | 2015-04-29 | 2016-12-15 | パナソニックIpマネジメント株式会社 | カメラ選択方法及び映像配信システム |
| JP2019086476A (ja) | 2017-11-09 | 2019-06-06 | キヤノン株式会社 | 画像処理装置、画像処理方法、プログラムおよびキャリブレーション用具 |
| JP2019153863A (ja) * | 2018-03-01 | 2019-09-12 | ソニー株式会社 | 画像処理装置、符号化装置、復号化装置、画像処理方法、プログラム、符号化方法及び復号化方法 |
Non-Patent Citations (2)
| Title |
|---|
| M. RUAN: "Extrinsic Calibration of 3D Sensors Using a Spherical Target", 3DV, 2014 |
| See also references of EP4040104A4 |
Cited By (1)
| Publication number | Priority date | Publication date | Assignee | Title |
|---|---|---|---|---|
| CN115406374A (zh) * | 2022-08-03 | 2022-11-29 | 广州启量信息科技有限公司 | 一种基于点云图的投影面积计算方法及装置 |
Also Published As
| Publication number | Publication date |
|---|---|
| EP4040104A1 (en) | 2022-08-10 |
| CN114430800B (zh) | 2024-04-02 |
| EP4040104A4 (en) | 2022-11-02 |
| JPWO2021064925A1 (cg-RX-API-DMAC7.html) | 2021-04-08 |
| EP4040104B1 (en) | 2024-12-04 |
| US20220179085A1 (en) | 2022-06-09 |
| CN114430800A (zh) | 2022-05-03 |
| JP7188612B2 (ja) | 2022-12-13 |
| US12613341B2 (en) | 2026-04-28 |
Similar Documents
| Publication | Publication Date | Title |
|---|---|---|
| KR102612347B1 (ko) | 장치 위치 측정을 위한 다중 동기화 통합 모델 | |
| EP2808645B1 (en) | Camera calibration device, camera calibration method, and camera calibration program | |
| JP5912191B2 (ja) | 追跡システムを最適化するためのシステムおよび方法 | |
| CN109697728A (zh) | 数据处理方法、装置、系统和存储介质 | |
| KR102369945B1 (ko) | 압력을 이용한 운동 자세 구분 방법 및 장치 | |
| WO2012081687A1 (en) | Information processing apparatus, information processing method, and program | |
| JP2014515530A (ja) | モバイルデバイスのための平面マッピングおよびトラッキング | |
| US20210170229A1 (en) | Systems and methods for providing strategic game recommendations in a sports contest using artificial intelligence | |
| US12067664B2 (en) | System and method for matching a test frame sequence with a reference frame sequence | |
| JP2017004268A (ja) | 画像処理装置、画像処理方法および画像処理プログラム | |
| JP2011248664A (ja) | 動作解析装置および動作解析方法 | |
| JP5494427B2 (ja) | 画像処理プログラムおよび画像処理装置 | |
| CN121266128A (zh) | 用于定位相机的方法和计算机可读存储介质、系统 | |
| CN110264503B (zh) | 一种基于cs搜索的图像配准方法 | |
| JP7188612B2 (ja) | 生成方法、生成プログラムおよび情報処理装置 | |
| Vagvolgyi et al. | Wide-angle, monocular head tracking using passive markers | |
| CN111223139B (zh) | 目标定位方法及终端设备 | |
| WO2018134866A1 (ja) | カメラ校正装置 | |
| CN115855442B (zh) | Ar眼镜测试方法及装置 | |
| US10042070B2 (en) | Method for locating mobile utensils presented before a network of magnetometers | |
| CN116433722A (zh) | 目标跟踪方法、电子设备、存储介质及程序产品 | |
| JP2018504252A (ja) | 画像レジストレーションの品質制御 | |
| CN114120085A (zh) | 标识定位方法及计算机可读存储介质 | |
| Cerfontaine et al. | Automatic multi-camera setup optimization for optical tracking | |
| CN116503387B (zh) | 图像检测方法、装置、设备、系统及可读存储介质 |
Legal Events
| Date | Code | Title | Description |
|---|---|---|---|
| 121 | Ep: the epo has been informed by wipo that ep was designated in this application |
Ref document number: 19947861 Country of ref document: EP Kind code of ref document: A1 |
|
| ENP | Entry into the national phase |
Ref document number: 2021550867 Country of ref document: JP Kind code of ref document: A |
|
| NENP | Non-entry into the national phase |
Ref country code: DE |
|
| ENP | Entry into the national phase |
Ref document number: 2019947861 Country of ref document: EP Effective date: 20220502 |