WO2020203552A1 - Line structure extraction device, method and program, and learned model - Google Patents
Line structure extraction device, method and program, and learned model Download PDFInfo
- Publication number
- WO2020203552A1 WO2020203552A1 PCT/JP2020/013334 JP2020013334W WO2020203552A1 WO 2020203552 A1 WO2020203552 A1 WO 2020203552A1 JP 2020013334 W JP2020013334 W JP 2020013334W WO 2020203552 A1 WO2020203552 A1 WO 2020203552A1
- Authority
- WO
- WIPO (PCT)
- Prior art keywords
- image
- line structure
- processing module
- point
- anchor
- Prior art date
Links
- 238000000605 extraction Methods 0.000 title claims abstract description 68
- 238000000034 method Methods 0.000 title claims abstract description 58
- 238000012545 processing Methods 0.000 claims abstract description 103
- 210000004204 blood vessel Anatomy 0.000 claims description 54
- 238000012549 training Methods 0.000 claims description 30
- 230000008569 process Effects 0.000 claims description 29
- 230000006870 function Effects 0.000 claims description 26
- 238000013528 artificial neural network Methods 0.000 claims description 15
- 230000002792 vascular Effects 0.000 claims description 12
- 238000010801 machine learning Methods 0.000 claims description 11
- 238000011176 pooling Methods 0.000 claims description 9
- 238000013527 convolutional neural network Methods 0.000 claims description 5
- 230000008859 change Effects 0.000 claims description 4
- 239000000284 extract Substances 0.000 claims description 4
- 210000003437 trachea Anatomy 0.000 claims description 3
- 230000004044 response Effects 0.000 abstract description 3
- 238000004364 calculation method Methods 0.000 description 40
- 238000010586 diagram Methods 0.000 description 23
- 210000004072 lung Anatomy 0.000 description 15
- 238000003860 storage Methods 0.000 description 13
- 238000002591 computed tomography Methods 0.000 description 10
- 238000001514 detection method Methods 0.000 description 10
- 210000004185 liver Anatomy 0.000 description 8
- 238000013500 data storage Methods 0.000 description 7
- 238000004891 communication Methods 0.000 description 6
- 210000004351 coronary vessel Anatomy 0.000 description 6
- 210000003484 anatomy Anatomy 0.000 description 4
- 210000000621 bronchi Anatomy 0.000 description 4
- 210000003240 portal vein Anatomy 0.000 description 4
- 238000005070 sampling Methods 0.000 description 4
- 210000003462 vein Anatomy 0.000 description 4
- 230000000747 cardiac effect Effects 0.000 description 3
- 230000004048 modification Effects 0.000 description 3
- 238000012986 modification Methods 0.000 description 3
- 238000012014 optical coherence tomography Methods 0.000 description 3
- 238000002600 positron emission tomography Methods 0.000 description 3
- 239000004065 semiconductor Substances 0.000 description 3
- 101000666856 Homo sapiens Vasoactive intestinal polypeptide receptor 1 Proteins 0.000 description 2
- XEEYBQQBJWHFJM-UHFFFAOYSA-N Iron Chemical compound [Fe] XEEYBQQBJWHFJM-UHFFFAOYSA-N 0.000 description 2
- 102100038388 Vasoactive intestinal polypeptide receptor 1 Human genes 0.000 description 2
- 238000004458 analytical method Methods 0.000 description 2
- 210000001367 artery Anatomy 0.000 description 2
- 239000013256 coordination polymer Substances 0.000 description 2
- 238000003745 diagnosis Methods 0.000 description 2
- 238000002059 diagnostic imaging Methods 0.000 description 2
- 238000003709 image segmentation Methods 0.000 description 2
- 238000002595 magnetic resonance imaging Methods 0.000 description 2
- 230000003287 optical effect Effects 0.000 description 2
- 210000000056 organ Anatomy 0.000 description 2
- 230000002093 peripheral effect Effects 0.000 description 2
- 238000009877 rendering Methods 0.000 description 2
- 230000001629 suppression Effects 0.000 description 2
- 208000031481 Pathologic Constriction Diseases 0.000 description 1
- 230000003187 abdominal effect Effects 0.000 description 1
- 230000004913 activation Effects 0.000 description 1
- 238000013459 approach Methods 0.000 description 1
- 230000002490 cerebral effect Effects 0.000 description 1
- 238000012937 correction Methods 0.000 description 1
- 230000007797 corrosion Effects 0.000 description 1
- 238000005260 corrosion Methods 0.000 description 1
- 238000005520 cutting process Methods 0.000 description 1
- 238000013135 deep learning Methods 0.000 description 1
- 230000000694 effects Effects 0.000 description 1
- 238000005401 electroluminescence Methods 0.000 description 1
- 238000005516 engineering process Methods 0.000 description 1
- 210000001035 gastrointestinal tract Anatomy 0.000 description 1
- 238000003384 imaging method Methods 0.000 description 1
- 230000010365 information processing Effects 0.000 description 1
- 229910052742 iron Inorganic materials 0.000 description 1
- JEIPFZHSYJVQDO-UHFFFAOYSA-N iron(III) oxide Inorganic materials O=[Fe]O[Fe]=O JEIPFZHSYJVQDO-UHFFFAOYSA-N 0.000 description 1
- 238000002955 isolation Methods 0.000 description 1
- 230000003902 lesion Effects 0.000 description 1
- 239000004973 liquid crystal related substance Substances 0.000 description 1
- 230000004807 localization Effects 0.000 description 1
- 238000004519 manufacturing process Methods 0.000 description 1
- 230000007246 mechanism Effects 0.000 description 1
- 230000001537 neural effect Effects 0.000 description 1
- 230000037361 pathway Effects 0.000 description 1
- 210000001147 pulmonary artery Anatomy 0.000 description 1
- 230000002685 pulmonary effect Effects 0.000 description 1
- 210000003492 pulmonary vein Anatomy 0.000 description 1
- 230000009467 reduction Effects 0.000 description 1
- 230000036262 stenosis Effects 0.000 description 1
- 208000037804 stenosis Diseases 0.000 description 1
- 239000000126 substance Substances 0.000 description 1
- 230000008685 targeting Effects 0.000 description 1
Images


Classifications
-
- G—PHYSICS
- G06—COMPUTING; CALCULATING OR COUNTING
- G06T—IMAGE DATA PROCESSING OR GENERATION, IN GENERAL
- G06T7/00—Image analysis
- G06T7/10—Segmentation; Edge detection
-
- G—PHYSICS
- G06—COMPUTING; CALCULATING OR COUNTING
- G06V—IMAGE OR VIDEO RECOGNITION OR UNDERSTANDING
- G06V10/00—Arrangements for image or video recognition or understanding
- G06V10/40—Extraction of image or video features
- G06V10/44—Local feature extraction by analysis of parts of the pattern, e.g. by detecting edges, contours, loops, corners, strokes or intersections; Connectivity analysis, e.g. of connected components
-
- A—HUMAN NECESSITIES
- A61—MEDICAL OR VETERINARY SCIENCE; HYGIENE
- A61B—DIAGNOSIS; SURGERY; IDENTIFICATION
- A61B5/00—Measuring for diagnostic purposes; Identification of persons
- A61B5/05—Detecting, measuring or recording for diagnosis by means of electric currents or magnetic fields; Measuring using microwaves or radio waves
- A61B5/055—Detecting, measuring or recording for diagnosis by means of electric currents or magnetic fields; Measuring using microwaves or radio waves involving electronic [EMR] or nuclear [NMR] magnetic resonance, e.g. magnetic resonance imaging
-
- A—HUMAN NECESSITIES
- A61—MEDICAL OR VETERINARY SCIENCE; HYGIENE
- A61B—DIAGNOSIS; SURGERY; IDENTIFICATION
- A61B6/00—Apparatus for radiation diagnosis, e.g. combined with radiation therapy equipment
- A61B6/50—Clinical applications
- A61B6/504—Clinical applications involving diagnosis of blood vessels, e.g. by angiography
-
- G—PHYSICS
- G01—MEASURING; TESTING
- G01T—MEASUREMENT OF NUCLEAR OR X-RADIATION
- G01T1/00—Measuring X-radiation, gamma radiation, corpuscular radiation, or cosmic radiation
- G01T1/16—Measuring radiation intensity
- G01T1/161—Applications in the field of nuclear medicine, e.g. in vivo counting
-
- G—PHYSICS
- G06—COMPUTING; CALCULATING OR COUNTING
- G06F—ELECTRIC DIGITAL DATA PROCESSING
- G06F18/00—Pattern recognition
- G06F18/20—Analysing
- G06F18/21—Design or setup of recognition systems or techniques; Extraction of features in feature space; Blind source separation
- G06F18/213—Feature extraction, e.g. by transforming the feature space; Summarisation; Mappings, e.g. subspace methods
-
- G—PHYSICS
- G06—COMPUTING; CALCULATING OR COUNTING
- G06F—ELECTRIC DIGITAL DATA PROCESSING
- G06F18/00—Pattern recognition
- G06F18/20—Analysing
- G06F18/21—Design or setup of recognition systems or techniques; Extraction of features in feature space; Blind source separation
- G06F18/214—Generating training patterns; Bootstrap methods, e.g. bagging or boosting
-
- G—PHYSICS
- G06—COMPUTING; CALCULATING OR COUNTING
- G06F—ELECTRIC DIGITAL DATA PROCESSING
- G06F18/00—Pattern recognition
- G06F18/20—Analysing
- G06F18/24—Classification techniques
- G06F18/243—Classification techniques relating to the number of classes
- G06F18/2431—Multiple classes
-
- G—PHYSICS
- G06—COMPUTING; CALCULATING OR COUNTING
- G06T—IMAGE DATA PROCESSING OR GENERATION, IN GENERAL
- G06T3/00—Geometric image transformation in the plane of the image
- G06T3/40—Scaling the whole image or part thereof
- G06T3/4046—Scaling the whole image or part thereof using neural networks
-
- G—PHYSICS
- G06—COMPUTING; CALCULATING OR COUNTING
- G06T—IMAGE DATA PROCESSING OR GENERATION, IN GENERAL
- G06T7/00—Image analysis
- G06T7/0002—Inspection of images, e.g. flaw detection
- G06T7/0012—Biomedical image inspection
-
- G—PHYSICS
- G06—COMPUTING; CALCULATING OR COUNTING
- G06V—IMAGE OR VIDEO RECOGNITION OR UNDERSTANDING
- G06V10/00—Arrangements for image or video recognition or understanding
- G06V10/20—Image preprocessing
- G06V10/25—Determination of region of interest [ROI] or a volume of interest [VOI]
-
- G—PHYSICS
- G06—COMPUTING; CALCULATING OR COUNTING
- G06V—IMAGE OR VIDEO RECOGNITION OR UNDERSTANDING
- G06V10/00—Arrangements for image or video recognition or understanding
- G06V10/40—Extraction of image or video features
- G06V10/44—Local feature extraction by analysis of parts of the pattern, e.g. by detecting edges, contours, loops, corners, strokes or intersections; Connectivity analysis, e.g. of connected components
- G06V10/443—Local feature extraction by analysis of parts of the pattern, e.g. by detecting edges, contours, loops, corners, strokes or intersections; Connectivity analysis, e.g. of connected components by matching or filtering
- G06V10/449—Biologically inspired filters, e.g. difference of Gaussians [DoG] or Gabor filters
- G06V10/451—Biologically inspired filters, e.g. difference of Gaussians [DoG] or Gabor filters with interaction between the filter responses, e.g. cortical complex cells
- G06V10/454—Integrating the filters into a hierarchical structure, e.g. convolutional neural networks [CNN]
-
- G—PHYSICS
- G06—COMPUTING; CALCULATING OR COUNTING
- G06V—IMAGE OR VIDEO RECOGNITION OR UNDERSTANDING
- G06V10/00—Arrangements for image or video recognition or understanding
- G06V10/70—Arrangements for image or video recognition or understanding using pattern recognition or machine learning
- G06V10/82—Arrangements for image or video recognition or understanding using pattern recognition or machine learning using neural networks
-
- G—PHYSICS
- G06—COMPUTING; CALCULATING OR COUNTING
- G06V—IMAGE OR VIDEO RECOGNITION OR UNDERSTANDING
- G06V10/00—Arrangements for image or video recognition or understanding
- G06V10/94—Hardware or software architectures specially adapted for image or video understanding
- G06V10/95—Hardware or software architectures specially adapted for image or video understanding structured as a network, e.g. client-server architectures
-
- A—HUMAN NECESSITIES
- A61—MEDICAL OR VETERINARY SCIENCE; HYGIENE
- A61B—DIAGNOSIS; SURGERY; IDENTIFICATION
- A61B6/00—Apparatus for radiation diagnosis, e.g. combined with radiation therapy equipment
- A61B6/52—Devices using data or image processing specially adapted for radiation diagnosis
- A61B6/5205—Devices using data or image processing specially adapted for radiation diagnosis involving processing of raw data to produce diagnostic data
-
- G—PHYSICS
- G06—COMPUTING; CALCULATING OR COUNTING
- G06T—IMAGE DATA PROCESSING OR GENERATION, IN GENERAL
- G06T2207/00—Indexing scheme for image analysis or image enhancement
- G06T2207/10—Image acquisition modality
- G06T2207/10072—Tomographic images
- G06T2207/10081—Computed x-ray tomography [CT]
-
- G—PHYSICS
- G06—COMPUTING; CALCULATING OR COUNTING
- G06T—IMAGE DATA PROCESSING OR GENERATION, IN GENERAL
- G06T2207/00—Indexing scheme for image analysis or image enhancement
- G06T2207/20—Special algorithmic details
- G06T2207/20081—Training; Learning
-
- G—PHYSICS
- G06—COMPUTING; CALCULATING OR COUNTING
- G06T—IMAGE DATA PROCESSING OR GENERATION, IN GENERAL
- G06T2207/00—Indexing scheme for image analysis or image enhancement
- G06T2207/20—Special algorithmic details
- G06T2207/20084—Artificial neural networks [ANN]
-
- G—PHYSICS
- G06—COMPUTING; CALCULATING OR COUNTING
- G06T—IMAGE DATA PROCESSING OR GENERATION, IN GENERAL
- G06T2207/00—Indexing scheme for image analysis or image enhancement
- G06T2207/30—Subject of image; Context of image processing
- G06T2207/30004—Biomedical image processing
- G06T2207/30056—Liver; Hepatic
-
- G—PHYSICS
- G06—COMPUTING; CALCULATING OR COUNTING
- G06T—IMAGE DATA PROCESSING OR GENERATION, IN GENERAL
- G06T2207/00—Indexing scheme for image analysis or image enhancement
- G06T2207/30—Subject of image; Context of image processing
- G06T2207/30004—Biomedical image processing
- G06T2207/30061—Lung
-
- G—PHYSICS
- G06—COMPUTING; CALCULATING OR COUNTING
- G06T—IMAGE DATA PROCESSING OR GENERATION, IN GENERAL
- G06T2207/00—Indexing scheme for image analysis or image enhancement
- G06T2207/30—Subject of image; Context of image processing
- G06T2207/30004—Biomedical image processing
- G06T2207/30101—Blood vessel; Artery; Vein; Vascular
-
- G—PHYSICS
- G06—COMPUTING; CALCULATING OR COUNTING
- G06T—IMAGE DATA PROCESSING OR GENERATION, IN GENERAL
- G06T2207/00—Indexing scheme for image analysis or image enhancement
- G06T2207/30—Subject of image; Context of image processing
- G06T2207/30172—Centreline of tubular or elongated structure
-
- G—PHYSICS
- G06—COMPUTING; CALCULATING OR COUNTING
- G06V—IMAGE OR VIDEO RECOGNITION OR UNDERSTANDING
- G06V2201/00—Indexing scheme relating to image or video recognition or understanding
- G06V2201/03—Recognition of patterns in medical or anatomical images
Definitions
- the present invention relates to a linear structure extraction device and method, a program, and a trained model, and particularly relates to an image processing technique and a machine learning technique for detecting a linear object from an image.
- Non-Patent Document 2 proposes a method of automatically detecting deteriorated parts of a structure such as iron rust, peeling, bolt corrosion, and concrete cracks from images of bridges and buildings using Faster R-CNN. Has been done.
- Patent Document 1 and Non-Patent Document 1 do not describe an application method for detecting a line structure from an image. In order to detect the line structure, it is conceivable to detect a linear object from the image by an image segmentation method. However, machine learning for realizing the task of image segmentation requires a large number of images with correct answer labels on a pixel-by-pixel basis, and it is difficult to create such correct answer images.
- Non-Patent Document 2 the Faster R-CNN algorithm is applied as it is to cracks in concrete, and bounding boxes containing cracks are continuously detected in the image.
- the detection result is a rectangular area indicated by the bounding box, and it is difficult to perform a reconstruction process for identifying a center line or the like representing a linear object area from the detection result output as such a rectangular area group. ..
- the present invention has been made in view of such circumstances, and an object of the present invention is to provide a line structure extraction device and method, a program, and a trained model capable of detecting a line structure in an image.
- the line structure extraction device is a line structure extraction device that extracts element points constituting a line structure from an image, and is one or more line structure extraction devices that form a line structure from an image in response to an image input.
- a learning model is provided that is trained to output element points as prediction results, and the training model includes a first processing module that accepts an image and generates a feature map showing the feature amount of the image by convolution processing, and a feature map.
- the second processing module arranges anchors, which are one or more reference shape regions having a predetermined shape and size, for each of the units. , Shift to move the anchor center point from the anchor center point of the anchor to the nearest point of the line structure element point by performing the convolution process using the feature amount of the unit position for each unit. It can be configured to calculate the quantity and the score for determining whether or not the line structure exists in the anchor.
- the reference shape region is a rectangular region when the image is a two-dimensional image and a rectangular parallelepiped region when the image is a three-dimensional image. be able to.
- the line structure is a representative line of a region having a thickness in an image, and a plurality of different sizes correspond to the thickness of the region having a thickness.
- Anchor can be used.
- the line structure is a representative line of a region having a thickness in the image
- the second processing module is the thickness of the region having a target thickness. It can be configured to be trained to change the size of the anchor accordingly.
- the line structure is a representative line of a region having a thickness in the image
- the second processing module is a region having a thickness for each anchor. It can be configured to be learned to calculate the deformation factor of the anchor in the direction of at least one side of the anchor according to the thickness around the nearest point.
- the region having a thickness may be a tubular structure, and the representative line may be a center line along the path of the tubular structure.
- each of the first processing module and the second processing module is configured by a neural network
- the first processing module includes a plurality of convolutional layers. It is configured by a convolutional neural network
- the second processing module has a convolutional layer different from that of the first processing module, and is configured by a region proposal network that predicts a candidate region including a line structure from a feature map. be able to.
- the line structure extraction device further includes a third processing module learned to classify each point with respect to the element points of the line structure predicted by the second processing module. It can be configured.
- the class classified by the third processing module includes at least one of the roots, branches, ends, and points on the branches in the tree structure of graph theory. It can be configured to include.
- the linear structure is a centerline along the path of the blood vessel, and the class classified by the third processing module is a particular anatomy in the vascular structure. It can be configured to include a name.
- the linear structure is a centerline along the path of the trachea
- the class classified by the third processing module is a particular anatomy in the tracheal structure. It can be configured to include a name.
- the third processing module is configured by a neural network, and the third processing module is predicted by the second processing module from the feature map.
- a region of interest pooling layer that cuts out the local image of the anchor including the element points and transforms the local image to a fixed size, and at least one of the convolution layer and the fully connected layer into which the local image transformed to the fixed size is input. It can be configured to include.
- the line structure extraction method is a line structure extraction method for extracting element points constituting a line structure from an image, and is one that constructs a line structure from an image in response to an image input.
- the learning model trained to output the above element points as the prediction result
- the input of the image to the training model is accepted, and the input image is convoluted by the first processing module to perform the convolution process of the image.
- Generate a feature map showing the feature quantity divide the feature map into multiple units with a predetermined size area in a grid pattern, and use the second processing module to make each unit closest to the unit center point.
- the point cloud is closer than the first interval with half the size of the unit as a guide. It is possible to further include deleting a part of the excess element points and selecting and leaving the element points at the degree of the first interval.
- the line structure is a representative line of a region having a thickness in an image, and is a point cloud of a plurality of element points predicted by a plurality of units.
- a configuration that further includes deleting a part of excess element points that are closer than the second interval with half the thickness as a guide, and selecting and leaving element points according to the degree of the second interval. Can be.
- an isolated point in which no other point exists within a predetermined threshold value is deleted from the point cloud of a plurality of element points predicted by a plurality of units. It can be configured to further include.
- the program according to still another aspect of the present disclosure is a program for realizing a function of extracting element points constituting a line structure from an image in a computer, and the function of accepting an image input and the input image
- the second It is a program that uses a processing module to make a computer realize a function of predicting the amount of shift from the center point of a unit to the element point of the line structure closest to each unit.
- the trained model according to still another aspect of the present disclosure is a trained model trained to output one or more element points constituting a line structure from an input image as a prediction result, and accepts the image.
- a trained model that includes a second processing module that calculates the amount of shift from the unit center point from a point to the nearest element point of the line structure.
- the parameters of the network constituting the first processing module and the second processing module are the training image and the position of the line structure included in the training image.
- the configuration can be determined by executing machine learning using a plurality of learning data in which information is combined.
- the line structure is a representative line of a region having a thickness in the image
- the training data is the thickness of the region having a thickness included in the training image.
- the configuration can include further information.
- the line structure extraction device is a non-temporary computer-readable medium in which a processor and an instruction for causing the processor to execute a process of extracting element points constituting the line structure from an image are stored.
- the processor accepts the input of the image and performs the convolution process of the input image by the first processing module to generate a feature map showing the feature amount of the image. And divide the feature map into multiple units with a default size area in a grid, and use the second processing module to move each unit from the unit center point to the nearest element point of the line structure. Calculate the amount of shift from the center point of the unit, and perform processing including.
- the element points of the line structure included in the image can be predicted by using the learning model, and the line structure can be detected by the point cloud of the element points.
- the line structure can be easily reconstructed from the point cloud of the predicted element points.
- the line point coordinates of the correct line structure for the training image may be used, and it is relatively easy to create such correct answer data.
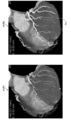
- FIG. 1 is an example of a Volume Rendering (VR) image obtained by a cardiac CT examination.
- FIG. 2 is a schematic diagram of a vascular pathway represented using nodes and edges.
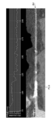
- FIG. 3 is an example of a CPR (Curved Planer Reconstruction) image of a coronary artery.
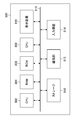
- FIG. 4 is a configuration diagram showing an outline of the Faster R-CNN applied to the embodiment of the present invention.
- FIG. 5 is an explanatory diagram schematically showing the content of processing in the linear structure extraction device according to the embodiment of the present invention.
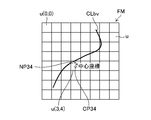
- FIG. 6 is a diagram schematically showing an example of the positional relationship between each pixel of the feature map processed by the Region Proposal Network (RPN) and the blood vessel center line.
- RPN Region Proposal Network
- FIG. 7 is an enlarged view of the unit near the center line CLbv.
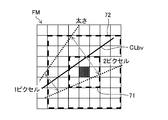
- FIG. 8 is an explanatory diagram of the anchor.
- FIG. 9 is a diagram showing an example in which three types of anchors having different sizes are used.
- FIG. 10 is a conceptual diagram showing an output example of RPN.
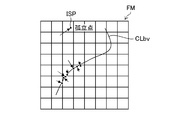
- FIG. 11 is an explanatory diagram of isolated points.
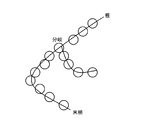
- FIG. 12 shows an example of a point cloud labeled with a component of a tree structure.
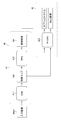
- FIG. 13 is an explanatory diagram schematically showing the network structure and the processing flow of the learning model mounted on the line structure extraction device.
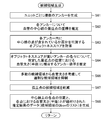
- FIG. 14 is a flowchart showing an example of processing contents by the line structure extraction device.
- FIG. 15 is a flowchart showing an example of the processing content applied to step S54 of FIG. FIG.
- FIG. 16 is a conceptual diagram of learning data.
- FIG. 17 is a functional block diagram showing a configuration example of a learning device that performs machine learning.
- FIG. 18 is a flowchart showing an example of a learning method of a learning model in the line structure extraction device according to the present embodiment.
- FIG. 19 is a block diagram showing an example of a computer hardware configuration.
- Example of detecting a tubular structure in a medical image An example of detecting a tubular structure from a medical image will be described as an embodiment of the present invention.
- advances in medical devices such as multi-slice CT (Computed Tomography) devices have led to the use of high-quality three-dimensional images for diagnostic imaging.
- the three-dimensional image is composed of a large number of slice images and has a large amount of information, it may take time for a doctor to find and diagnose a desired observation site.
- the visibility of the entire organ and / or the lesion is visible. It is being carried out to improve the efficiency of diagnosis. For example, when analyzing a cardiac CT image, particularly coronary artery analysis or cerebrovascular analysis, it is required to extract a vascular route from the image.
- FIG. 1 is an example of a VR image obtained by a cardiac CT examination.
- the image HVR1 shown on the left side of FIG. 1 is an example of a heart VR image
- the image HVR2 shown on the right side is an example of a heart VR image in which the coronary artery path Car is superimposed and displayed.
- FIG. 2 is a schematic diagram of the vascular route.
- the path of the blood vessel can be expressed by using a point cloud of coordinate points (node Nd) that continuously trace the center line CLbv of the blood vessel and an edge Eg representing an adjacency relationship between the nodes Nd.
- node Nd point cloud of coordinate points
- edge Eg representing an adjacency relationship between the nodes Nd.
- FIG. 3 is an example of a CPR image of a coronary artery.
- An example of a CPR image in the straight view mode is shown in the lower part of FIG. 3, and a graph of the average diameter for each position along the path of the blood vessel BV is displayed in the upper part of FIG.
- a portion of the blood vessel BV that bulges white is a plaque PLQ.
- the linear structure extraction device is applied to a process of extracting a center line (center line) of a tubular structure applied to support diagnostic imaging as described with reference to FIGS. 1 to 3.
- a center line of a tubular structure applied to support diagnostic imaging as described with reference to FIGS. 1 to 3.
- a blood vessel is an example of a "tubular structure” in the present disclosure
- a centerline of a blood vessel is an example of a "line structure” in the present disclosure.
- the line structure extraction device predicts a collection of points constituting the center line of a blood vessel from an input image, that is, a plurality of points on the center line, and labels the classification of each point.
- the point cloud on the center line may be paraphrased as a "point sequence”.
- the line structure extraction device improves the framework of Faster R-CNN, which is an object detection algorithm, and performs a process of predicting points on the line constituting the line structure from the image. That is, the object to be detected in the present embodiment is the center line of the blood vessel, and the output as the prediction result is the position information of the points that are the elements constituting the center line, that is, the points on the center line.
- the points that are the elements that make up the line structure are called "element points of the line structure”.
- the element points of the center line are referred to as "center line upper points”.
- the term "object” or “object” is not limited to a physically existing "substance”, and is, for example, a representative line or line of a region such as a crack or a gap, or a region having a size. Includes the concept of structural and linear elemental points.
- the centerline of a blood vessel is an example of a representative line of a tubular structure having a thickness. Since the explanation of the process using the three-dimensional image becomes complicated, the case where the input image is a two-dimensional image will be replaced and described below in order to facilitate understanding.
- FIG. 4 is a block diagram showing an outline of the Faster R-CNN applied to the embodiment of the present invention.
- the Faster R-CNN40 is a candidate region for each of the first neural network 41 that finds a region in which an object is likely to exist in the image of the input image IMipt and the candidate region RP obtained as the output of the first neural network 41. It is configured to include a second neural network 42 that performs a classification process that identifies what the object in the RP is.
- the first neural network 41 is configured to include a deep convolutional neural network (DCNN) 411 and a region proposal network (RPN) 412.
- DCNN441 is a neural network that extracts the features of the input image IMipt.
- the size and number of channels of the filter used for convolution of DCNN441 can be appropriately designed.
- the filter may be a 3 ⁇ 3 filter, and the number of channels in the hidden layer may be 256, 512, or the like.
- the feature map FM is output from DCNN411.
- the feature map FM is a convolution feature map obtained by a multi-layer convolution operation.
- the DCNN 411 may include a pooling layer, or may reduce the size of the feature map FM by setting the stride of the convolution filter to 2 or the like without having the pooling layer.
- the feature map FM output from DCNN411 is input to RPN412.
- the RPN412 takes the feature map FM output from the DCNN411 as an input, and predicts the candidate region RP that seems to be an object from the feature map FM.
- the RPN412 is configured to include a convolution layer, and generates a bounding box (Bbox) containing what seems to be an object from the image.
- Bbox bounding box
- the list of candidate region RPs predicted by RPN412 is sent to the second neural network 42. That is, the RPN412 lists a plurality of candidate region RPs from the image and passes them to the R-CNN423.
- the second neural network 42 is composed of R-CNN (Region-Based Convolutional Neural Network) 423.
- the R-CNN423 classifies each of the candidate region RPs obtained as the output of the RPN412.
- the R-CNN423 may output a bounding box representing a rectangle surrounding the object.
- the term rectangle is not limited to a rectangle having a long side and a short side, but also includes a square.
- the R-CNN423 is connected to the DCNN411, and the feature map FM output from the DCNN411 is input to the R-CNN423. Further, the data of the candidate region RP predicted by RPN412 is input to R-CNN423.
- the R-CNN423 projects the candidate region RP generated by RPN412 onto the feature map FM, cuts out the region of interest (ROI) to be calculated, classifies the objects for each ROI, and determines the label. To do.
- the R-CNN423 classifies each of the candidate region RPs obtained as the output of the RPN412.
- the R-CNN412 may output a bounding box surrounding the detected object.
- the R-CNN423 outputs an object label and a bounding box representing an circumscribing rectangle of the object. I'm getting the output.
- the output of the bounding box may be omitted.
- it may be configured to output a bounding box including a region range including a point on the center line and a blood vessel thickness around the center line.
- FIG. 5 is an explanatory diagram schematically showing the content of processing in the linear structure extraction device 50 according to the embodiment of the present invention.
- the linear structure extraction device 50 can be realized by a computing system (computing system) configured by using one or a plurality of computers.
- the linear structure extraction device 50 includes DCNN411 as a first processing module, RPN412 as a second processing module, and R-CNN423 as a third processing module.
- module includes the concept of program modules.
- DCNN411 accepts the input image IMipt, performs convolution processing by the plurality of convolution layers 414, and generates a feature map FM.
- the first input layer of DCNN411 has a role as an image receiving unit for receiving the input image IMipt.
- the 6 ⁇ 6 grid shown in FIG. 5 represents a part of the feature map FM, and one section of the grid squares corresponds to the pixels pxfm of the feature map FM.
- One pixel pxfm of the feature map FM has information on the feature amount calculated from a wider range of image areas in the input image IMipt.
- one pixel pxfm of the feature map FM is a feature amount calculated from a pixel area of the size of S ⁇ S pixels in the grid arrangement of the pixels px of the input image IMipt.
- DCNN411 is configured to have.
- S is a value corresponding to the reduction ratio of the image by DCNN411. That is, it is understood that each pixel pxfm of the feature map FM corresponds to a pixel region of S ⁇ S size of the corresponding position in the input image IMipt.
- each area of S ⁇ S size when the input image IMipt is divided into a plurality of areas of S ⁇ S size in a grid pattern corresponds to the pixel pxfm of the feature map FM.
- the position of each pixel pxfm of the feature map FM can be described by projecting it onto a coordinate system representing the image position in the input image IMipt.
- RPN412 accepts the feature map FM output from DCNN411, and predicts the nearest centerline top point from the center point of the pixel pxfm for each pixel pxfm of the feature map FM.
- the point on the center line closest to the center point of the pixel pxfm is called the "recent point”.
- Each pixel pxfm of the feature map FM is a unit of a region for predicting the amount of shift to the latest point, and is called a "unit”. That is, the feature map FM is divided into a plurality of units (pixels pxfm) having a predetermined size area in a grid shape, and the RPN412 sets the latest points that are candidates for the element points of the center line for each unit of the feature map FM. Predict.
- RPN412 applies a plurality of types of reference rectangles having different aspect ratios and / or sizes to each unit of the feature map FM in order to predict the latest point for each unit of the feature map FM.
- This reference rectangle is called an "anchor".
- FIG. 5 shows an example in which three types of anchors having different sizes, anchor A1, anchor A2, and anchor A3, are used.
- the aspect ratios of all three types of anchors are 1: 1.
- a plurality of anchors having the same size and different aspect ratios may be used.
- the plurality of anchors A1, anchors A2, and anchors A3 are arranged so that their respective center points coincide with the center points of the unit (pixel pxfm).
- the RPN412 has a convolution layer 416 that calculates how much each anchor should be moved (shifted) and / or deformed to approach the correct rectangle, and whether or not there is an object inside the anchor.
- the correct rectangle here is a rectangle having a point on the center line of the correct answer at the center position and having a region size corresponding to the blood vessel thickness.
- the RPN412 has a convolutional layer different from the DCNN411. For example, the RPN 412 may have a configuration having a smaller number of convolution layers than the DCNN 411.
- the RPN412 performs a convolution process for each unit using the feature amount of the unit position.
- the RPN412 is a two-class classification that indicates the output of the shift amount of the anchor center point and the deformation amount of the anchor to bring the anchor closer to the correct rectangle after convolution by the convolution layer 416, and whether or not there is an object in the anchor. Outputs a score that represents certainty, and performs. That is, RPN412 describes for each anchor "a regression problem of how to move and / or deform the anchor to match the ground truth" and "a discrimination problem of whether or not there is an object inside the anchor". To solve.
- the deformation amount of the anchor may be, for example, the deformation magnification in each of the x-direction and the y-direction. When performing similar deformation that corrects only the size without changing the aspect ratio of the anchor, the deformation amount of the anchor may be a deformation magnification common to the x direction and the y direction.
- the score of the two-class classification indicating whether or not there is an object in the anchor is called the "objectness score”.
- the regression result data showing the amount of shift and the amount of deformation of the anchor to bring the anchor closer to the correct rectangle is collectively called "Bbox offset”.
- the RPN412 may calculate an objectness score indicating whether or not there is an object in the anchor shifted by the calculated shift amount, or the object is in the non-shifted anchor (inside the anchor placed at the unit position). An objectness score indicating whether or not it may be calculated, or both of these objectness scores may be calculated.
- the R-CNN423 generates a local image obtained by cutting out a portion corresponding to the candidate area from the feature map FM based on the candidate area of the prediction result output from the RPN412, and based on the ROI image which is the cut out local image.
- Fully connected layers 426, 427 calculate the classification score of the objects included in the ROI image, and assign a class label based on the score.
- the size of the local image cut out from the feature map FM may be different from the size of the candidate area.
- RPN412 and R-CNN423 will be described in more detail.
- RPN412 which is used to extract blood vessels in the liver, is trained to present candidate points on the centerline of blood vessels, regardless of portal vein or vein.
- Each pixel of the feature map obtained from the final layer of RPN412 is a unit that predicts a candidate point on the center line.
- Each unit corresponds to the pixel pxfm of the feature map FM described in FIG.
- Each unit predicts the amount of deviation from the position of the nearest point of the center line with respect to the center position of the unit.
- the deviation amount predicted by RPN412 is two real values ⁇ x and ⁇ y indicating the deviation amount in each of the x direction and the y direction.
- the deviation amount predicted by RPN412 is three real values ⁇ x, ⁇ y, and ⁇ z indicating the deviation amount in each of the x-direction, y-direction, and z-direction.
- the RPN412 simultaneously determines whether or not there is a target object in the anchor shifted according to the predicted deviation amount and / or in the anchor not shifted. That is, the RPN412 classifies two classes as to whether or not there is a target object.
- FIG. 6 is a diagram schematically showing an example of the positional relationship between each pixel of the feature map processed by RPN412 and the blood vessel center line.
- the 8x8 grid shown in FIG. 6 represents a portion of the feature map FM from DCNN411.
- the position of each unit u is expressed as "u (column number, row number)" using column numbers 0 to 7 and row numbers 0 to 7 of the grid, the upper left unit is u (0). , 0), the lower right unit is written as u (7,7).
- the unit u (3, 4) predicts the amount of deviation ( ⁇ x, ⁇ y) between the center coordinate CP34 of the unit center position and the position of the nearest point NP34 of the center line CLbv closest to the center coordinate CP34.
- the space that defines the coordinates may be an xy coordinate system that specifies the position in the input image IMipt. That is, the center coordinates and the nearest point coordinates of each unit are represented by the numerical values (x, y) of the xy coordinate system that specify the position in the image of the input image IMipt.
- the amount of deviation ( ⁇ x, ⁇ y) from the position of the latest point of the center line CLbv is predicted with reference to the center coordinates of each unit.
- the center coordinates of the unit u are an example of the "unit center point” in the present disclosure.
- the predicted “deviation amount” is an example of the "shift amount” from the unit center point to the latest point in the present disclosure.
- FIG. 7 is an enlarged view of the unit of the center line CLbv. Here, four units u are shown. The squares of the fine grid displayed in the unit u schematically represent the size of the pixels of the input image IMipt. As shown in FIG. 7, the latest point NP of the center line CLbv is predicted from the center coordinate CP of each unit u.
- FIG. 8 is an explanatory diagram of the anchor.
- FIG. 8 represents a part of the feature map FM as in FIG. 6, and the grid squares represent the pixels of the feature map FM, that is, the units. Each unit virtually has a plurality of predefined anchors.
- FIG. 7 shows the first anchor 71 and the second anchor 72 arranged in the unit u (4, 4) filled with gray.
- the first anchor 71 is an anchor having a pixel size of 3 ⁇ 3.
- the second anchor 72 is an anchor having a pixel size of 7 ⁇ 7.
- the thickness of the blood vessel is defined according to the position on the center line CLbv of the blood vessel.
- the anchor of the size closest to the target thickness predicts the position of the point on the center line.
- the target thickness range For example, when targeting a coronary artery, prepare three-sized square anchors having sides of 3 pixels, 5 pixels, and 9 pixels.
- the detection targets are in various directions. Since it is a tubular structure having an extending linear structure and there is no particular tendency for the directionality such as portrait or landscape, the aspect ratio of the anchor may be only 1: 1.
- the vicinity of the lower left of the center line CLbv for example, the vicinity of the unit u (1, 5) has a blood vessel thickness of approximately 1 pixel in radius.
- the vicinity of the unit u (4, 3) located near the upper right of the center line CLbv has a blood vessel thickness of approximately 2 pixels in radius. Therefore, in the unit arranged in the lower left part of FIG. 8, among the plurality of anchors, the anchor having a pixel size of 3 ⁇ 3 is used for predicting the position of the point on the center line, and is arranged in the upper right part of FIG. Anchors with a pixel size of 7x7 are used to predict the position of the centerline point in the unit.
- FIG. 9 shows an example of using three types of anchors having different sizes, and shows that the anchor used for predicting the point on the center line is determined according to the blood vessel thickness.
- an anchor 81 having a side of 3 pixels, an anchor 82 having a side of 5 pixels, and an anchor 83 having a side of 7 pixels are prepared, and the size of the anchor to be applied changes according to the blood vessel thickness. Will be done. It is not necessary to limit the number of anchors used for prediction to one unit to one, and depending on the blood vessel thickness, a plurality of anchors may be applied to one unit to predict the point on the center line.
- the position information of the center line that is the correct answer is given to the training image, and the point on each center line of the correct answer represents the region of what size (here, the blood vessel thickness). Information is given as to whether or not. That is, the training data is also given information (score) indicating which size anchor should be used to extract each of the points on the center line of the correct answer, that is, which thickness should be extracted as a representative point. Be done. As a result, it is possible to learn to change the anchor size according to the blood vessel thickness of the target area.
- FIG. 10 is a conceptual diagram showing an output example of RPN412.
- FIG. 10 shows the candidate region RPs obtained by shifting the center point coordinates to the predicted near-point NP and correcting the rectangular size with the predicted deformation magnification for each anchor shown in FIG. An example is shown.
- Step 1 In RPN412, a plurality of predefined anchors are arranged in each unit (pixel) of the feature map FM output from DCNN411 by inputting the training image.
- RPN412 searches for an anchor having a large overlap with the correct rectangle among a plurality of anchors.
- Step 3 Calculate the difference between the selected anchor selected in step 2 and the correct rectangle. Specifically, this difference may be the shift amounts ⁇ x and ⁇ y of the anchor center coordinates and the deformation magnification for changing the size of the anchor.
- Step 4 The network is learned so that the objectness score of the selected anchor is "1" and the correction amount of the bounding box (Bbox offset) is the difference calculated in step 3.
- the trained RPN412 arranges a plurality of predefined anchors in each unit of the feature map FM output from the DCNN411 by inputting an unknown image to be inferred.
- RPN412 calculates the Bbox offset of each anchor and the objectness score.
- Step 103 For an anchor with a high objectness score, the anchor is moved and deformed based on the Bbox offset of the anchor.
- Non-Maximum Suppression (NMS) processing The point cloud of the points on the center line predicted by each unit may be excessive.
- NMS Non-Maximum Suppression
- the NMS process is a process of suppressing output from the other rectangles by leaving one rectangle out of a plurality of rectangles showing the same object.
- the IOU (Intersection over Union) value is calculated between the candidate regions generated by RPN, and if the IOU value is larger than a predetermined threshold value, it is considered that the regions overlap each other. In the meantime, one area is deleted (suppressed). On the contrary, if the IoT value is small, the overlap between the regions is small, so both candidate regions are left as they are. A mechanism for reducing the number of excessively overlapping candidate regions has been proposed by such an algorithm.
- the candidate regions are thinned out at intervals of about half the thickness of the blood vessel without calculating the above-mentioned IoU value. If the information on the thickness of the blood vessel is not given in advance as the teacher data at the time of learning, sampling may be performed at about the pixel interval of the unit.
- FIG. 11 shows an example of a candidate point predicted by RPN412, and is an explanatory diagram when an isolated point is included in the candidate point. Since a line structure such as the center line of a blood vessel is represented by an array of continuous points (a sequence of points), as shown in FIG. 11, the points on the center line predicted from each unit are far apart from other point sequences. If it exists in isolation, the isolated point ISP is likely to be an erroneously predicted result (false positive). Therefore, in the ISP412, when the predicted candidate points on the center line are isolated, a predetermined threshold value that can be judged as a false detection is set, and there is no other candidate point within the distance within this threshold value. Deletes (eliminates) the isolated point ISP from the prediction result.
- the R-CNN423 performs class discrimination by inputting an image that standardizes the feature map in the anchor predicted by RPN412.
- the object of detection is a tree structure of graph theory as in the blood vessel structure handled in the present embodiment
- the R-CNN423 has "roots”, “points on branches”, and “branches” as components of the tree structure. It is classified into one of the four labels of "point” or "peripheral point (terminal)".
- FIG. 12 shows an example of a point cloud labeled with a component of a tree structure. If the characteristics (classification) of each point are known in advance in this way, it is convenient to connect the points to each other in the later stage to reconstruct the graph structure. For example, the search for a route can be started from the position of the root, the number of branches can be increased at a branch point, and the connection of the route can be terminated at a peripheral point.
- the vascular system of the liver includes arteries, portal veins, and veins. Each vascular system is in contact and intersects, and it is important to separate the subjects in order to understand the anatomy. Therefore, the R-CNN423 may be configured to classify the types of blood vessels. In this case, an anatomical name may be given as an item of the class to be classified, and the data of the label that is the correct answer may be added to the learning data.
- the class determined by R-CNN423 for the candidate points (predicted centerline points) detected by RPN412 is classified according to the blood vessel type ⁇ portal vein, vein, artery, etc. ⁇ There are 4 classes.
- the liver is further anatomically divided into 8 areas.
- the eight areas are caudate lobe, dorsal lateral area, caudal lateral area, medial area, caudal anterior area, caudal anterior area, caudal posterior area, and caudal posterior area. Since these areas are defined by the running of vascular branches, eight types of vascular branches can be classified.
- liver In addition to the liver, there are tree structures such as cerebral blood vessels, pulmonary blood vessels, bronchi, and digestive tract (when there are loops, they are broadly called "graphs") in the human body.
- the method of the present disclosure can be applied to the recognition of various anatomical structures.
- pulmonary veins and pulmonary arteries can be classified.
- multiple classifications can be made by anatomical bronchial name and / or area name.
- the lungs are classified into multiple areas by bronchial branches.
- trachea main bronchus of the right lung, upper lobe, lung protrusion (B1), posterior superior lobe (B2), anterior superior lobe (B3), middle trunk, middle lobe, lateral middle lobe (B4), medial middle Leaf branch (B5), lower lobe branch, upper and lower lobe branch (B6), medial lung floor branch (B7), anterior lung floor branch (B8), lateral lung floor branch (B9), posterior lung floor branch (B10), bottom trunk branch, Main bronchus of the left lung, upper lobe, upper ward, posterior branch of the lung (B1 + 2), anterior upper lobe (B3), tongue, upper tongue (B4), lower tongue (B5), lower lobe, It can be divided into upper and lower lobe branches (B6), medial anterior lung floor branch (B7 + 8), lateral lung floor branch (B9), posterior lung floor branch (B10), and floor trunk branch.
- FIG. 13 is an explanatory diagram schematically showing the network structure and the processing flow of the learning model 52 mounted on the line structure extraction device 50.
- the learning model 52 includes DCNN411, RPN412, and R-CNN423.
- the convolution layer 416 of the RPN 412 has a number of filters corresponding to the number of channels of the feature map FM output by the DCNN 411.
- the filter size of the convolution layer 416 may be, for example, 3 ⁇ 3.
- the RPN 412 has two types of 1 ⁇ 1 convolution layers 417 and 418 after the convolution layer 416.
- the output of the convolution layer 416 is input to each of the 1 ⁇ 1 convolution layers 417 and 418.
- the 1 ⁇ 1 convolution layer 417 includes a softmax layer that uses a softmax function as an activation function, and has an objectness score indicating the probability of being an object (point on the center line) at each anchor position.
- the other 1 ⁇ 1 convolution layer 418 is a regression layer that performs numerical regression for each of the plurality of anchors in order to bring the anchors closer to the correct rectangle.
- the RPN412 is trained so that the overlap with the correct rectangle of the training data is large.
- R-CNN423 includes a ROI pooling layer 424, a fully connected layer 426, 427, and a softmax layer 428.
- the ROI pooling layer 424 pools the feature map in the region corresponding to each candidate region RP cut out from the feature map FM obtained from DCNN411 and transforms it into a standardized image of a fixed size.
- a partial image of the feature map transformed into a fixed size is input to the fully connected layer 426.
- a softmax layer 428 is provided after the final fully connected layer 427.
- the number of units in the output layer is determined according to the number of classes to be classified, the object score indicating the probability of each class is calculated, and finally the object label is specified.
- a configuration including a convolution layer may be adopted in place of or in addition to a part or all of the fully connected layers 426 and 427.
- the ROI pooling layer 424 shown in FIG. 13 is an example of the “region of interest pooling layer” in the present disclosure.
- the learning model 52 is an example of the "trained model” in the present disclosure.
- FIG. 14 is a flowchart showing an example of processing contents by the line structure extraction device 50.
- the process shown in FIG. 14 is executed by a calculation system that functions as the line structure extraction device 50.
- the computing system executes the processing of each step according to the program stored in the computer-readable medium.
- step S50 the calculation system accepts the image to be processed.
- step S52 the calculation system generates a convolution feature map by DCNN411 from the input image.
- step S54 the calculation system inputs the convolution feature map output from DCNN411 into RPN412 and generates a candidate area that seems to be a point on the center line by RPN412.
- step S56 the calculation system inputs the information of each candidate area generated by RPN412 and the convolution feature map generated by DCNN411 into R-CNN423, cuts out each candidate area by R-CNN423, and sets each candidate area. Generate a classification label for an object.
- step S58 the calculation system obtains the data of the prediction result in which the position of each point on the center line predicted by RPN412, the blood vessel thickness of each point, and the label of each point predicted by R-CNN423 are linked.
- step S58 the calculation system ends the flowchart of FIG.
- FIG. 15 is a flowchart showing an example of the processing content applied to step S54 of FIG.
- the computational system generates a plurality of anchors for each unit of the convolution feature map.
- step S62 the calculation system predicts the coordinates of the point (recent point) on the center line of the blood vessel closest to the anchor center for each anchor.
- step S63 the calculation system calculates the objectness score for two-class classification as to whether or not the centerline point is included in each anchor.
- step S64 the calculation system predicts the anchor magnification corresponding to the blood vessel thickness at the predicted position of the latest point for the anchor having a high objectness score.
- step S65 the calculation system suppresses an excessive candidate region from a large number of candidate regions generated by RPN412 in consideration of the blood vessel thickness. For example, among the point cloud of a plurality of candidate points predicted by RPN412, a part of excess candidate points that are closer than the interval (first interval) about half the diameter (radius) of the blood vessel. Is deleted, and sampling is performed so that candidate points are selected and left at intervals of about the radius of the blood vessel. By sampling such thinning out, the thicker the blood vessel, the larger the interval of candidate points remains, and the thinner the blood vessel, the smaller the interval of candidate points.
- step S66 the calculation system determines an isolated point from the candidate points predicted by RPN412, and deletes the candidate area of the isolated point.
- step S67 the calculation system generates prediction result data in which the predicted position of each point on the center line and the blood vessel thickness at each point are linked, that is, a list of Bboxes in the candidate region.
- step S67 the calculation system ends the flowchart of FIG. 15 and returns to the flowchart of FIG.
- training data used for learning As training data used for learning, the training image, the position information of each point on the center line of the blood vessel included in the training image, the blood vessel thickness information at each point on the center line, and the correct label of the classification for each point. Use multiple sets of and.
- the "learning data” is training data used for machine learning, and is synonymous with “learning data” or "training data”.
- the training image may be, for example, a CT image taken by a CT device.
- the position information and blood vessel thickness information of each point on the center line of the blood vessel given as the correct answer for example, the coordinates of the points on the center line of the CPR image generated from the CT image and the numerical values of the blood vessel radius can be used.
- the blood vessel thickness (radius) of each point for example, it is possible to automatically determine the correct rectangle of a square centered on that point and having a length twice the radius as one side.
- the anchor size suitable for predicting the point can be determined from the blood vessel thickness of each given point.
- the correct label for the classification of each point can be determined based on anatomical findings. For one training image, for each anchor type (size), the correct answer data of the position that the anchor of each size wants to extract is given. Depending on the thickness of the blood vessel, correct answer data may be given so as to make duplicate predictions using a plurality of anchors having different sizes.
- FIG. 16 is a conceptual diagram of the learning data LD (i).
- the training image, the coordinates of each point of the correct center line, the correct thickness of each point, and the correct label of each point are given as the learning data LD (i).
- i is an index number that identifies the training data.
- the coordinates of each point of the correct center line may be given as a numerical value in sub-pixel units, which is finer than in pixel units of the training image.
- the correct answer rectangle can be automatically generated from the correct answer thickness information.
- the anchor size may be automatically generated from the correct answer thickness information, or may be specified by the operator.
- FIG. 17 is a functional block diagram showing a configuration example of the learning device 100 that performs machine learning.
- the learning device 100 can be realized by a calculation system configured by using one or a plurality of computers.
- the calculation system constituting the learning device 100 may be the same system as the calculation system constituting the line structure extraction device 50, may be a different system, or is a system that shares some elements. May be good.
- the learning device 100 is connected to the learning data storage unit 150.
- the learning data storage unit 150 is configured to include a storage for storing the learning data LD (i) necessary for the learning device 100 to perform machine learning.
- a storage for storing the learning data LD (i) necessary for the learning device 100 to perform machine learning i
- an example in which the learning data storage unit 150 and the learning device 100 are configured as separate devices will be described, but these functions may be realized by one computer, or two or more devices may be realized.
- the processing functions may be shared and realized by the computer.
- the learning data storage unit 150 and the learning device 100 may be connected to each other via a telecommunication line (not shown).
- connection is not limited to wired connection, but also includes the concept of wireless connection.
- the telecommunication line may be a local area network or a wide area network.
- the learning data generation process and the learning model learning process can be performed without being physically and temporally constrained to each other.
- the learning device 100 reads the learning data LD (i) from the learning data storage unit 150 and executes machine learning.
- the learning device 100 can read the learning data LD (i) and update the parameters in units of mini-batch in which a plurality of learning data LDs (i) are put together.
- the learning device 100 includes a data acquisition unit 102, a learning model 52, a first error calculation unit 110, a second error calculation unit 112, and an optimizer 114.
- the data acquisition unit 102 is an interface for capturing the learning data LD (i).
- the data acquisition unit 102 may be configured by a data input terminal that captures the learning data LD (i) from an external or other signal processing unit in the device. Further, the data acquisition unit 102 may employ a wired or wireless communication interface unit, a media interface unit that reads / writes a portable external storage medium such as a memory card, or may be used. Any combination of these embodiments may be used.
- the learning model 52 includes DCNN411, RPN412, and R-CNN423, as described above.
- the first error calculation unit 110 calculates the error between the prediction result output from RPN412 and the correct answer data for each anchor.
- the first error calculation unit 110 evaluates the error using the loss function.
- the first error calculated by the first error calculation unit 110 is sent to the optimizer 114.
- the second error calculation unit 112 calculates the error between the prediction result output from R-CNN423 and the correct label.
- the second error calculation unit 112 evaluates the error using the loss function.
- the second error calculated by the second error calculation unit 112 is sent to the optimizer 114.
- the optimizer 114 performs a process of updating the parameters of the learning model 52 from the calculation results of the first error calculation unit 110 and the second error calculation unit 112.
- the optimizer 114 updates the parameters based on an algorithm such as the error back propagation method.
- the network parameters include the filter coefficient (weight of the connection between nodes) of the filter used for processing each layer, the bias of the nodes, and the like.
- the optimizer 114 uses the calculation result of the first error calculation unit 110 to calculate the update amount of the parameter of the first subnetwork 410 in which the DCNN411 and the RPN412 are combined, and according to the calculated parameter update amount, the DCNN411 And RPN412, the parameter update process for updating at least the network parameter of RPN412 is performed.
- the parameters of the respective networks of DCNN411 and RPN412 are updated.
- the optimizer 114 calculates the update amount of the parameter of the second sub-network 420 formed by combining DCNN411 and R-CNN423 using the calculation result of the second error calculation unit 112, and updates the calculated parameter.
- the parameters of each network of DCNN411 and R-CNN423 are updated according to the amount.
- the learning device 100 further learns the model of the first sub-network 410 in a state where the parameters of the DCNN 411 finely tuned by the training of the second sub-network 420 are fixed, and updates the parameters of the RPN 412.
- the parameters of the learning model 52 can be optimized. In this way, the trained learning model 52 can be obtained.
- FIG. 18 is a flowchart showing an example of a learning method of the learning model 52 in the line structure extraction device 50 according to the present embodiment.
- the process shown in FIG. 18 is executed by a calculation system configured by using one or a plurality of computers functioning as the learning device 100.
- the computing system executes the processing of each step according to the program stored in the computer-readable medium.
- the calculation system used for machine learning may be the same system as the calculation system constituting the line structure extraction device 50, may be a different system, or may be a system that shares some elements. Good.
- step S202 of FIG. 18 the learning device 100 performs the initial setting of the learning model 52.
- the initial setting of the learning model 52 having the network structure shown in FIG. 13 is performed.
- the parameters of each network of DCNN411, RPN412, and R-CNN423 are set to the initial values. Some of the parameters may be learned parameters obtained by prior learning.
- step S204 of FIG. 18 the learning device 100 trains a model of the first subnet network 410 in which DCNN411 and RPN412 are coupled.
- step S204 the network parameters of DCNN411 and RPN412 are updated.
- the learning device 100 can acquire learning data in units of mini-batch including a plurality of learning data LDs (i), and the optimizer 114 can update parameters in units of mini-batch.
- step S206 the learning device 100 generates a candidate region from the training image using the trained first subnet network 410.
- step S208 the learning device 100 inputs the candidate region generated by the trained first subnet train 410 into the R-CNN423 and trains a model of the second subnet 420 in which the DCNN411 and the R-CNN423 are coupled. .. In step S208, the network parameters of DCNN411 and R-CNN423 are updated.
- step S210 the learning device 100 retrains the RPN 412 of the first sub-network 410 using the DCNN 411 of the trained second sub-network 420.
- the learning device 100 may return to step S206 to repeat the training, or may end the flowchart of FIG. 18 based on a predetermined learning end condition.
- the learning end condition may be determined based on the error value or may be determined based on the number of parameter updates. As a method based on the error value, for example, the learning end condition may be that the error has converged within a specified range. As a method based on the number of updates, for example, the learning end condition may be that the number of updates reaches the specified number of times.
- the anchor can be understood as a reference shape region having a predetermined shape and size, and in the case of a three-dimensional image, a rectangular parallelepiped having a three-dimensional shape is used. That is, the reference shape region of the anchor for the two-dimensional image is a rectangular region, whereas the reference shape region of the anchor for the three-dimensional image is a rectangular parallelepiped region.
- FIG. 19 is a block diagram showing an example of a computer hardware configuration.
- the computer 800 may be a personal computer, a workstation, or a server computer.
- the computer 800 can be used as a device having a part or all of the linear structure extraction device 50, the learning device 100, and the learning data storage unit 150, or a plurality of these functions, which have already been described.
- the computer 800 includes a CPU (Central Processing Unit) 802, a RAM (Random Access Memory) 804, a ROM (Read Only Memory) 806, a GPU (Graphics Processing Unit) 808, a storage 810, a communication unit 812, an input device 814, and a display device 816. And a bus 818.
- the GPU (Graphics Processing Unit) 808 may be provided as needed.
- the CPU 802 reads various programs stored in the ROM 806, the storage 810, or the like, and executes various processes.
- the RAM 804 is used as a work area of the CPU 802. Further, the RAM 804 is used as a storage unit for temporarily storing the read program and various data.
- the storage 810 includes, for example, a hard disk device, an optical disk, a magneto-optical disk, or a semiconductor memory, or a storage device configured by using an appropriate combination thereof.
- the storage 810 stores various programs, data, and the like necessary for the line structure extraction process and / or the learning process.
- the program stored in the storage 810 is loaded into the RAM 804, and the CPU 802 executes the program, so that the computer 800 functions as a means for performing various processes specified by the program.
- the communication unit 812 is an interface that performs communication processing with an external device by wire or wirelessly and exchanges information with the external device.
- the communication unit 812 can play the role of an image reception unit that receives an image input.
- the input device 814 is an input interface that accepts various operation inputs to the computer 800.
- the input device 814 may be, for example, a keyboard, mouse, touch panel, or other pointing device, or voice input device, or any combination thereof.
- the display device 816 is an output interface that displays various types of information.
- the display device 816 may be, for example, a liquid crystal display, an organic electro-luminescence (OEL) display, a projector, or an appropriate combination thereof.
- OEL organic electro-luminescence
- a non-temporary program such as an optical disk, a magnetic disk, a semiconductor memory, or the like, which realizes a part or all of the processing functions of at least one of the line structure extraction function and the learning function described in the above-described embodiment on a computer. It is possible to record on a computer-readable medium, which is a typical information storage medium, and provide a program through this information storage medium.
- the program signal is also possible to provide the program signal as a download service using a telecommunication line such as the Internet, instead of the mode in which the program is stored and provided in such a tangible non-temporary information storage medium.
- each processing unit >> 1st neural network 41, DCNN411, RPN412, 2nd neural network 42, R-CNN423 of FIG. 4, data acquisition unit 102 of FIG. 17, learning model 52, 1st error calculation unit 110, 2nd error calculation unit 112.
- the hardware structure of the processing unit that executes various processes is, for example, various processors as shown below.
- Various processors include a CPU, which is a general-purpose processor that executes programs and functions as various processing units, a GPU, which is a processor specialized in image processing, and an FPGA (Field Programmable Gate Array) circuit configuration after manufacturing.
- a dedicated electric circuit that is a processor with a circuit configuration specially designed to execute a specific process such as a programmable logic device (PLD) or ASIC (Application Specific Integrated Circuit), which is a processor that can change the CPU. Etc. are included.
- One processing unit may be composed of one of these various processors, or may be composed of two or more processors of the same type or different types.
- one processing unit may be composed of a plurality of FPGAs, a combination of a CPU and an FPGA, or a combination of a CPU and a GPU.
- a plurality of processing units may be configured by one processor.
- one processor is configured by a combination of one or more CPUs and software, as represented by a computer such as a client or a server.
- a processor functions as a plurality of processing units.
- SoC System On Chip
- IC Integrated Circuit
- circuitry that combines circuit elements such as semiconductor elements.
- the line structure can be extracted from the image.
- the technique of line structure extraction processing according to the present disclosure can be applied not only to CT images but also to various three-dimensional tomographic images.
- an MR image acquired by an MRI (Magnetic Resonance Imaging) apparatus a PET image acquired by a PET (Positron Emission Tomography) apparatus, an OCT image acquired by an OCT (Optical Coherence Tomography) apparatus, and a three-dimensional ultrasonic imaging apparatus. It may be a three-dimensional ultrasonic image or the like acquired by.
- the technique of line structure extraction processing according to the present disclosure can be applied not only to three-dimensional tomographic images but also to various two-dimensional images.
- the image to be processed may be a two-dimensional X-ray image.
- the technique of line structure extraction processing according to the present disclosure is not limited to medical images, and can be applied to various images such as ordinary camera images.
- the technique of the present disclosure can be applied when cracks are detected from an image of a building or the like as dealt with in Non-Patent Document 2.
Landscapes
- Engineering & Computer Science (AREA)
- Physics & Mathematics (AREA)
- Theoretical Computer Science (AREA)
- Health & Medical Sciences (AREA)
- General Physics & Mathematics (AREA)
- Life Sciences & Earth Sciences (AREA)
- Computer Vision & Pattern Recognition (AREA)
- Evolutionary Computation (AREA)
- Medical Informatics (AREA)
- Data Mining & Analysis (AREA)
- Artificial Intelligence (AREA)
- General Health & Medical Sciences (AREA)
- Multimedia (AREA)
- Nuclear Medicine, Radiotherapy & Molecular Imaging (AREA)
- Molecular Biology (AREA)
- Biomedical Technology (AREA)
- Radiology & Medical Imaging (AREA)
- Bioinformatics & Computational Biology (AREA)
- General Engineering & Computer Science (AREA)
- Evolutionary Biology (AREA)
- Bioinformatics & Cheminformatics (AREA)
- High Energy & Nuclear Physics (AREA)
- Animal Behavior & Ethology (AREA)
- Public Health (AREA)
- Optics & Photonics (AREA)
- Veterinary Medicine (AREA)
- Biophysics (AREA)
- Pathology (AREA)
- Heart & Thoracic Surgery (AREA)
- Surgery (AREA)
- Software Systems (AREA)
- Vascular Medicine (AREA)
- Dentistry (AREA)
- Oral & Maxillofacial Surgery (AREA)
- Quality & Reliability (AREA)
- Computing Systems (AREA)
- Biodiversity & Conservation Biology (AREA)
- Databases & Information Systems (AREA)
- Spectroscopy & Molecular Physics (AREA)
- Image Analysis (AREA)
Abstract
The purpose of this invention is to provide a line structure extraction device, method and program with which it is possible to detect a line structure in an image and a learned model. A line structure extraction device according to one embodiment of this disclosure is provided with a learning model which has performed learning to output, as prediction results, one or more component points which constitute a line structure from an image in response to the reception of image input, wherein the learning model contains: a first processing module which receives an image and generates a feature map indicating feature amounts of the image by performing convolution; and a second processing module which calculates, for each unit obtained by dividing the feature map into a plurality of units having regions of a predetermined size in a grid shape, the shift distance from the unit center point to the component point of the line structure closest to the unit center point.
Description
本発明は、線構造抽出装置及び方法、プログラム並びに学習済みモデルに係り、特に画像内から線状の対象物を検出するための画像処理技術及び機械学習技術に関する。
The present invention relates to a linear structure extraction device and method, a program, and a trained model, and particularly relates to an image processing technique and a machine learning technique for detecting a linear object from an image.
深層学習を利用した物体検出のアルゴリズムとして、特許文献1及び非特許文献1には、Faster R-CNN(Region-Based Convolutional Neural Networks)と呼ばれる手法が提案されている。非特許文献2には、Faster R-CNNを利用して橋梁及び建物の画像から鉄の錆、剥離、ボルトの腐食、及びコンクリートのクラックといった構造物の劣化部分を自動的に検出する方法が提案されている。
As an object detection algorithm using deep learning, a method called Faster R-CNN (Region-Based Convolutional Neural Networks) is proposed in Patent Document 1 and Non-Patent Document 1. Non-Patent Document 2 proposes a method of automatically detecting deteriorated parts of a structure such as iron rust, peeling, bolt corrosion, and concrete cracks from images of bridges and buildings using Faster R-CNN. Has been done.
コンクリートのクラックは、線構造を有するオブジェクトの一形態である。線構造を持つオブジェクトの他の例として、医療画像における血管あるいは気管支などの管状構造物がある。特許文献1及び非特許文献1には、画像から線構造を検出するための応用方法について記載されていない。線構造を検出するために、画像セグメンテーションの手法により画像から線状のオブジェクトを検出することが考えられる。しかし、画像セグメンテーションのタスクを実現するための機械学習には、画素単位で正解のラベルを付した画像が大量に必要であり、このような正解画像の作成が困難である。
Concrete cracks are a form of objects that have a linear structure. Another example of an object with a linear structure is a tubular structure such as a blood vessel or bronchus in a medical image. Patent Document 1 and Non-Patent Document 1 do not describe an application method for detecting a line structure from an image. In order to detect the line structure, it is conceivable to detect a linear object from the image by an image segmentation method. However, machine learning for realizing the task of image segmentation requires a large number of images with correct answer labels on a pixel-by-pixel basis, and it is difficult to create such correct answer images.
非特許文献2ではコンクリートのクラックを対象に、Faster R-CNNのアルゴリズムをそのまま適用したものであり、画像中からクラックを含むバウンディングボックスを連続的に検出する。この場合、検出結果はバウンディングボックスが示す矩形領域であり、このような矩形領域群として出力される検出結果から線状のオブジェクトの領域を代表する中心線などを特定するような再構成処理が難しい。
In Non-Patent Document 2, the Faster R-CNN algorithm is applied as it is to cracks in concrete, and bounding boxes containing cracks are continuously detected in the image. In this case, the detection result is a rectangular area indicated by the bounding box, and it is difficult to perform a reconstruction process for identifying a center line or the like representing a linear object area from the detection result output as such a rectangular area group. ..
本発明はこのような事情に鑑みてなされたもので、画像中の線構造を検出することができる線構造抽出装置及び方法、プログラム並びに学習済みモデルを提供することを目的とする。
The present invention has been made in view of such circumstances, and an object of the present invention is to provide a line structure extraction device and method, a program, and a trained model capable of detecting a line structure in an image.
本開示の一態様に係る線構造抽出装置は、画像から線構造を構成する要素点を抽出する線構造抽出装置であって、画像の入力を受けて画像から線構造を構成する1つ以上の要素点を予測結果として出力するよう学習された学習モデルを備え、学習モデルは、画像を受け入れて畳み込みの処理により画像の特徴量を示す特徴マップを生成する第1の処理モジュールと、特徴マップをグリッド状に既定サイズの領域を持つ複数のユニットに分割して得られるユニットごとに、ユニット中心点から最も近くにある線構造の要素点へのユニット中心点からのシフト量を計算する第2の処理モジュールと、を含む線構造抽出装置である。
The line structure extraction device according to one aspect of the present disclosure is a line structure extraction device that extracts element points constituting a line structure from an image, and is one or more line structure extraction devices that form a line structure from an image in response to an image input. A learning model is provided that is trained to output element points as prediction results, and the training model includes a first processing module that accepts an image and generates a feature map showing the feature amount of the image by convolution processing, and a feature map. A second calculation of the amount of shift from the unit center point to the element point of the line structure closest to the unit center point for each unit obtained by dividing into multiple units having a predetermined size area in a grid pattern. It is a line structure extraction device including a processing module.
本開示の他の態様に係る線構造抽出装置において、第2の処理モジュールは、ユニットの各々に対して、予め定められた形状及びサイズを持つ1つ以上の基準形状領域であるアンカーを配置し、ユニットごとにユニットの位置の特徴量を用いて畳み込みの処理を行うことにより、アンカーのアンカー中心点から最も近くにある線構造の要素点である最近点にアンカー中心点を移動させるためのシフト量と、アンカー内に線構造が存在するか否かを判別するためのスコアと、を計算する構成とすることができる。
In the linear structure extraction apparatus according to another aspect of the present disclosure, the second processing module arranges anchors, which are one or more reference shape regions having a predetermined shape and size, for each of the units. , Shift to move the anchor center point from the anchor center point of the anchor to the nearest point of the line structure element point by performing the convolution process using the feature amount of the unit position for each unit. It can be configured to calculate the quantity and the score for determining whether or not the line structure exists in the anchor.
本開示のさらに他の態様に係る線構造抽出装置において、基準形状領域は、画像が2次元画像である場合は矩形領域であり、画像が3次元画像である場合は直方体領域である構成とすることができる。
In the line structure extraction device according to still another aspect of the present disclosure, the reference shape region is a rectangular region when the image is a two-dimensional image and a rectangular parallelepiped region when the image is a three-dimensional image. be able to.
本開示のさらに他の態様に係る線構造抽出装置において、線構造は、画像内において太さを持つ領域の代表線であり、太さを持つ領域の太さに対応させて、サイズが異なる複数のアンカーが用いられる構成とすることができる。
In the line structure extraction device according to still another aspect of the present disclosure, the line structure is a representative line of a region having a thickness in an image, and a plurality of different sizes correspond to the thickness of the region having a thickness. Anchor can be used.
本開示のさらに他の態様に係る線構造抽出装置において、線構造は、画像内において太さを持つ領域の代表線であり、第2の処理モジュールは、対象とする太さを持つ領域の太さに応じてアンカーのサイズを変更するように学習されたものである構成とすることができる。
In the line structure extraction device according to still another aspect of the present disclosure, the line structure is a representative line of a region having a thickness in the image, and the second processing module is the thickness of the region having a target thickness. It can be configured to be trained to change the size of the anchor accordingly.
本開示のさらに他の態様に係る線構造抽出装置において、線構造は、画像内において太さを持つ領域の代表線であり、第2の処理モジュールは、アンカーごとに、太さを持つ領域の最近点の周囲の太さに合わせてアンカーの少なくとも1つの辺の方向についてのアンカーの変形倍率を計算するように学習されたものである構成とすることができる。
In the line structure extraction device according to still another aspect of the present disclosure, the line structure is a representative line of a region having a thickness in the image, and the second processing module is a region having a thickness for each anchor. It can be configured to be learned to calculate the deformation factor of the anchor in the direction of at least one side of the anchor according to the thickness around the nearest point.
本開示のさらに他の態様に係る線構造抽出装置において、太さを持つ領域は管状構造物であり、代表線は、管状構造物の経路に沿った中心線である構成とすることができる。
In the line structure extraction device according to still another aspect of the present disclosure, the region having a thickness may be a tubular structure, and the representative line may be a center line along the path of the tubular structure.
本開示のさらに他の態様に係る線構造抽出装置において、第1の処理モジュール及び第2の処理モジュールの各々はニューラルネットワークによって構成されており、第1の処理モジュールは、複数の畳み込み層を備える畳み込みニューラルネットワークによって構成され、第2の処理モジュールは、第1の処理モジュールとは異なる畳み込み層を備え、特徴マップから線構造が含まれる候補領域を予測する領域提案ネットワークによって構成される構成とすることができる。
In the line structure extraction device according to still another aspect of the present disclosure, each of the first processing module and the second processing module is configured by a neural network, and the first processing module includes a plurality of convolutional layers. It is configured by a convolutional neural network, and the second processing module has a convolutional layer different from that of the first processing module, and is configured by a region proposal network that predicts a candidate region including a line structure from a feature map. be able to.
本開示のさらに他の態様に係る線構造抽出装置において、第2の処理モジュールによって予測された線構造の要素点に対し、各点をクラス分類するよう学習された第3の処理モジュールをさらに備える構成とすることができる。
The line structure extraction device according to still another aspect of the present disclosure further includes a third processing module learned to classify each point with respect to the element points of the line structure predicted by the second processing module. It can be configured.
本開示のさらに他の態様に係る線構造抽出装置において、第3の処理モジュールにより分類されるクラスは、グラフ理論の木構造における根、分岐、末端、及び枝上の点のうち少なくとも1つを含む構成とすることができる。
In the linear structure extractor according to still another aspect of the present disclosure, the class classified by the third processing module includes at least one of the roots, branches, ends, and points on the branches in the tree structure of graph theory. It can be configured to include.
本開示のさらに他の態様に係る線構造抽出装置において、線構造は、血管の経路に沿った中心線であり、第3の処理モジュールにより分類されるクラスは、血管構造における特定の解剖学的名称を含む構成とすることができる。
In the linear structure extractor according to still another aspect of the present disclosure, the linear structure is a centerline along the path of the blood vessel, and the class classified by the third processing module is a particular anatomy in the vascular structure. It can be configured to include a name.
本開示のさらに他の態様に係る線構造抽出装置において、線構造は、気管の経路に沿った中心線であり、第3の処理モジュールにより分類されるクラスは、気管構造における特定の解剖学的名称を含む構成とすることができる。
In the linear structure extractor according to still another aspect of the present disclosure, the linear structure is a centerline along the path of the trachea, and the class classified by the third processing module is a particular anatomy in the tracheal structure. It can be configured to include a name.
本開示のさらに他の態様に係る線構造抽出装置において、第3の処理モジュールは、ニューラルネットワークによって構成されており、第3の処理モジュールは、特徴マップから、第2の処理モジュールによって予測された要素点を含むアンカーの局所画像を切り出して局所画像を固定サイズに変形する関心領域プーリング層と、固定サイズに変形された局所画像が入力される畳み込み層及び全結合層のうち少なくとも一方と、を含む構成とすることができる。
In the line structure extraction device according to still another aspect of the present disclosure, the third processing module is configured by a neural network, and the third processing module is predicted by the second processing module from the feature map. A region of interest pooling layer that cuts out the local image of the anchor including the element points and transforms the local image to a fixed size, and at least one of the convolution layer and the fully connected layer into which the local image transformed to the fixed size is input. It can be configured to include.
本開示のさらに他の態様に係る線構造抽出方法は、画像から線構造を構成する要素点を抽出する線構造抽出方法であって、画像の入力を受けて画像から線構造を構成する1つ以上の要素点を予測結果として出力するよう学習された学習モデルを用い、学習モデルへの画像の入力を受け付けることと、入力された画像について第1の処理モジュールにより畳み込みの処理を行い、画像の特徴量を示す特徴マップを生成することと、特徴マップをグリッド状に既定サイズの領域を持つ複数のユニットに分割し、第2の処理モジュールを用いて、ユニットごとにユニット中心点から最も近くにある線構造の要素点へのユニット中心点からのシフト量を計算することと、を含む線構造抽出方法である。
The line structure extraction method according to still another aspect of the present disclosure is a line structure extraction method for extracting element points constituting a line structure from an image, and is one that constructs a line structure from an image in response to an image input. Using the learning model trained to output the above element points as the prediction result, the input of the image to the training model is accepted, and the input image is convoluted by the first processing module to perform the convolution process of the image. Generate a feature map showing the feature quantity, divide the feature map into multiple units with a predetermined size area in a grid pattern, and use the second processing module to make each unit closest to the unit center point. It is a line structure extraction method including calculating the amount of shift from the unit center point to an element point of a certain line structure.
本開示のさらに他の態様に係る線構造抽出方法において、複数のユニットによって予測された複数の要素点の点群のうち、ユニットのサイズの半分を目安とする第1の間隔よりも近接している過剰な要素点の一部を削除して、第1の間隔の程度で要素点を選択して残すこと、をさらに含む構成とすることができる。
In the line structure extraction method according to still another aspect of the present disclosure, among the point cloud of the plurality of element points predicted by the plurality of units, the point cloud is closer than the first interval with half the size of the unit as a guide. It is possible to further include deleting a part of the excess element points and selecting and leaving the element points at the degree of the first interval.
本開示のさらに他の態様に係る線構造抽出方法において、線構造は、画像内において太さを持つ領域の代表線であり、複数のユニットによって予測された複数の要素点の点群のうち、太さの半分を目安とする第2の間隔よりも近接している過剰な要素点の一部を削除して、第2の間隔の程度で要素点を選択して残すこと、をさらに含む構成とすることができる。
In the line structure extraction method according to still another aspect of the present disclosure, the line structure is a representative line of a region having a thickness in an image, and is a point cloud of a plurality of element points predicted by a plurality of units. A configuration that further includes deleting a part of excess element points that are closer than the second interval with half the thickness as a guide, and selecting and leaving element points according to the degree of the second interval. Can be.
本開示のさらに他の態様に係る線構造抽出方法において、複数のユニットによって予測された複数の要素点の点群のうち、予め定めた閾値以内の距離に他の点が存在しない孤立点を削除すること、をさらに含む構成とすることができる。
In the line structure extraction method according to still another aspect of the present disclosure, an isolated point in which no other point exists within a predetermined threshold value is deleted from the point cloud of a plurality of element points predicted by a plurality of units. It can be configured to further include.
本開示のさらに他の態様に係るプログラムは、画像から線構造を構成する要素点を抽出する機能をコンピュータに実現させるためのプログラムであって、画像の入力を受け付ける機能と、入力された画像について第1の処理モジュールを用いて畳み込みの処理を行い、画像の特徴量を示す特徴マップを生成する機能と、特徴マップをグリッド状に既定サイズの領域を持つ複数のユニットに分割し、第2の処理モジュールを用いて、ユニットごとにユニットの中心点から最も近くにある線構造の要素点へのシフト量を予測する機能と、をコンピュータに実現させるプログラムである。
The program according to still another aspect of the present disclosure is a program for realizing a function of extracting element points constituting a line structure from an image in a computer, and the function of accepting an image input and the input image The function of performing convolution processing using the first processing module to generate a feature map showing the feature amount of the image, and the feature map is divided into a plurality of units having a predetermined size area in a grid shape, and the second It is a program that uses a processing module to make a computer realize a function of predicting the amount of shift from the center point of a unit to the element point of the line structure closest to each unit.
本開示のさらに他の態様に係る学習済みモデルは、入力された画像から線構造を構成する1つ以上の要素点を予測結果として出力するよう学習された学習済みモデルであって、画像を受け入れて畳み込みの処理により画像の特徴量を示す特徴マップを生成する第1の処理モジュールと、特徴マップをグリッド状に既定サイズの領域を持つ複数のユニットに分割して得られるユニットごとに、ユニット中心点から最も近くにある線構造の要素点へのユニット中心点からのシフト量を計算する第2の処理モジュールと、を含む学習済みモデルである。
The trained model according to still another aspect of the present disclosure is a trained model trained to output one or more element points constituting a line structure from an input image as a prediction result, and accepts the image. The unit center for each unit obtained by dividing the feature map into a plurality of units having a predetermined size area in a grid pattern and the first processing module that generates a feature map showing the feature amount of the image by the folding process. A trained model that includes a second processing module that calculates the amount of shift from the unit center point from a point to the nearest element point of the line structure.
本開示のさらに他の態様に係る学習済みモデルにおいて、第1の処理モジュール及び第2の処理モジュールを構成しているネットワークのパラメータは、訓練画像と、訓練画像に含まれている線構造の位置情報と、を組み合わせた複数の学習データを用いた機械学習を実行することによって決定されている構成とすることができる。
In the trained model according to still another aspect of the present disclosure, the parameters of the network constituting the first processing module and the second processing module are the training image and the position of the line structure included in the training image. The configuration can be determined by executing machine learning using a plurality of learning data in which information is combined.
本開示のさらに他の態様に係る学習済みモデルにおいて、線構造は、画像内において太さを持つ領域の代表線であり、学習データは、訓練画像に含まれている太さを持つ領域の太さ情報をさらに含む構成とすることができる。
In the trained model according to still another aspect of the present disclosure, the line structure is a representative line of a region having a thickness in the image, and the training data is the thickness of the region having a thickness included in the training image. The configuration can include further information.
本開示のさらに他の態様に係る線構造抽出装置は、プロセッサと、画像から線構造を構成する要素点を抽出する処理をプロセッサに実行させるための命令が記憶された非一時的なコンピュータ可読媒体と、を備え、プロセッサは、命令を実行することにより、画像の入力を受け付けることと、入力された画像について第1の処理モジュールにより畳み込みの処理を行い、画像の特徴量を示す特徴マップを生成することと、特徴マップをグリッド状に既定サイズの領域を持つ複数のユニットに分割し、第2の処理モジュールを用いて、ユニットごとにユニット中心点から最も近くにある線構造の要素点へのユニット中心点からのシフト量を計算することと、を含む処理を行う。
The line structure extraction device according to still another aspect of the present disclosure is a non-temporary computer-readable medium in which a processor and an instruction for causing the processor to execute a process of extracting element points constituting the line structure from an image are stored. By executing an instruction, the processor accepts the input of the image and performs the convolution process of the input image by the first processing module to generate a feature map showing the feature amount of the image. And divide the feature map into multiple units with a default size area in a grid, and use the second processing module to move each unit from the unit center point to the nearest element point of the line structure. Calculate the amount of shift from the center point of the unit, and perform processing including.
本発明によれば、学習モデルを用いて画像中に含まれる線構造の要素点を予測することができ、要素点の点群によって線構造を検出することができる。本発明によれば、予測された要素点の点群から線構造を容易に再構成することができる。学習モデルの学習には、訓練画像に対する正解の線構造の線上点座標を用いればよく、このような正解データの作成は比較的容易である。
According to the present invention, the element points of the line structure included in the image can be predicted by using the learning model, and the line structure can be detected by the point cloud of the element points. According to the present invention, the line structure can be easily reconstructed from the point cloud of the predicted element points. For learning the training model, the line point coordinates of the correct line structure for the training image may be used, and it is relatively easy to create such correct answer data.
以下、添付図面に従って本発明の好ましい実施の形態について詳説する。
Hereinafter, preferred embodiments of the present invention will be described in detail with reference to the accompanying drawings.
《医療画像中の管状構造を検出する例》
本発明の一実施形態として医療画像から管状構造を検出する場合の例を説明する。近年、マルチスライスCT(Computed Tomography)装置等の医療機器の進歩により、質の高い3次元画像が画像診断に用いられるようになってきている。しかしながら、3次元画像は多数のスライス画像から構成され、情報量が多いため、医師が所望の観察部位を見つけ診断することに時間を要する場合がある。 << Example of detecting a tubular structure in a medical image >>
An example of detecting a tubular structure from a medical image will be described as an embodiment of the present invention. In recent years, advances in medical devices such as multi-slice CT (Computed Tomography) devices have led to the use of high-quality three-dimensional images for diagnostic imaging. However, since the three-dimensional image is composed of a large number of slice images and has a large amount of information, it may take time for a doctor to find and diagnose a desired observation site.
そこで、3次元画像から注目する臓器を抽出し、MIP(Maximum Intensity Projection)、VR(Volume Rendering)、又はCPR(Curved Planer Reconstruction)等の表示を行うことにより、臓器全体及び/又は病変の視認性を高め診断の効率化を図ることが行われている。例えば、心臓CT画像に対する解析、特に冠動脈解析あるいは脳血管の解析を行う際に、画像中から血管経路を抽出することが求められる。
Therefore, by extracting the organ of interest from the three-dimensional image and displaying MIP (Maximum Intensity Projection), VR (Volume Rendering), CPR (Curved Planer Reconstruction), etc., the visibility of the entire organ and / or the lesion is visible. It is being carried out to improve the efficiency of diagnosis. For example, when analyzing a cardiac CT image, particularly coronary artery analysis or cerebrovascular analysis, it is required to extract a vascular route from the image.
図1は、心臓CT検査によって得られるVR画像の例である。図1の左図に示す画像HVR1は心臓VR画像の例であり、右図に示す画像HVR2は冠動脈経路Carを重畳表示した心臓VR画像の例である。
FIG. 1 is an example of a VR image obtained by a cardiac CT examination. The image HVR1 shown on the left side of FIG. 1 is an example of a heart VR image, and the image HVR2 shown on the right side is an example of a heart VR image in which the coronary artery path Car is superimposed and displayed.
図2は、血管経路の模式図である。血管の経路は、血管の中心線CLbvを連続的に追跡した座標点(ノードNd)の点群と、ノードNd間の隣接関係を表すエッジEgと、を用いて表現することができる。3次元画像から血管の中心線CLbvが検出されると、その経路に沿って展開したCPR画像を生成することにより、血管に体積したプラークを可視化したり、狭窄率を計測したりすることができ、診断に有効な情報を得ることができる。
FIG. 2 is a schematic diagram of the vascular route. The path of the blood vessel can be expressed by using a point cloud of coordinate points (node Nd) that continuously trace the center line CLbv of the blood vessel and an edge Eg representing an adjacency relationship between the nodes Nd. When the center line CLbv of the blood vessel is detected from the three-dimensional image, the plaque volume in the blood vessel can be visualized and the stenosis rate can be measured by generating a CPR image developed along the path. , Information useful for diagnosis can be obtained.
図3は、冠動脈のCPR画像の例である。図3の下段にはストレートビューモードによるCPR画像の例が示され、図3の上段には血管BVの経路に沿った位置ごとの平均径のグラフが表示されている。図3に示すCPR画像において血管BVの一部が白く膨らんだ部分はプラークPLQである。
FIG. 3 is an example of a CPR image of a coronary artery. An example of a CPR image in the straight view mode is shown in the lower part of FIG. 3, and a graph of the average diameter for each position along the path of the blood vessel BV is displayed in the upper part of FIG. In the CPR image shown in FIG. 3, a portion of the blood vessel BV that bulges white is a plaque PLQ.
《線構造抽出装置の概要》
本発明の実施形態に係る線構造抽出装置は、図1から図3で説明したような画像診断の支援に適用される管状構造物の中心線(センターライン)を抽出する処理に適用される。ここでは、具体的な適用例として、腹部3次元CT画像から肝臓の門脈及び静脈の構造を検出する場合を想定する。血管は本開示における「管状構造物」の一例であり、血管の中心線は本開示における「線構造」の一例である。本実施形態に係る線構造抽出装置は、入力画像から血管の中心線を構成する点の集まり、つまり中心線上の複数の点を予測し、かつ、各点のクラス分類のラベル付けを行う。中心線上の点群は「点列」と言い換えてもよい。 << Overview of line structure extractor >>
The linear structure extraction device according to the embodiment of the present invention is applied to a process of extracting a center line (center line) of a tubular structure applied to support diagnostic imaging as described with reference to FIGS. 1 to 3. Here, as a specific application example, it is assumed that the structure of the portal vein and vein of the liver is detected from the abdominal three-dimensional CT image. A blood vessel is an example of a "tubular structure" in the present disclosure, and a centerline of a blood vessel is an example of a "line structure" in the present disclosure. The line structure extraction device according to the present embodiment predicts a collection of points constituting the center line of a blood vessel from an input image, that is, a plurality of points on the center line, and labels the classification of each point. The point cloud on the center line may be paraphrased as a "point sequence".
本実施形態に係る線構造抽出装置は、物体検出のアルゴリズムであるFaster R-CNNのフレームワークを改良して、画像中から線構造を構成する線上の点を予測する処理を行う。すなわち、本実施形態において検出対象とする物体は、血管の中心線であり、予測結果としての出力は中心線を構成する要素となる点、つまり、中心線上の点の位置情報である。線構造を構成する要素となる点を「線構造の要素点」という。以下、中心線の要素点を「中心線上点」という。
The line structure extraction device according to the present embodiment improves the framework of Faster R-CNN, which is an object detection algorithm, and performs a process of predicting points on the line constituting the line structure from the image. That is, the object to be detected in the present embodiment is the center line of the blood vessel, and the output as the prediction result is the position information of the points that are the elements constituting the center line, that is, the points on the center line. The points that are the elements that make up the line structure are called "element points of the line structure". Hereinafter, the element points of the center line are referred to as "center line upper points".
本明細書において「物体」あるいは「オブジェクト」という用語は、物理的に実在する「実体物」に限定されず、例えば、クラックあるいは隙間のような領域、あるいは大きさを持つ領域の代表線、線構造及び線構造の要素点の概念を含む。血管の中心線は、太さを持つ管状構造物の代表線の一例である。3次元画像を用いた処理の説明は複雑になるため、以下、理解を容易にするために、入力画像が2次元画像である場合に置き換えて説明する。
In the present specification, the term "object" or "object" is not limited to a physically existing "substance", and is, for example, a representative line or line of a region such as a crack or a gap, or a region having a size. Includes the concept of structural and linear elemental points. The centerline of a blood vessel is an example of a representative line of a tubular structure having a thickness. Since the explanation of the process using the three-dimensional image becomes complicated, the case where the input image is a two-dimensional image will be replaced and described below in order to facilitate understanding.
〔Faster R-CNNの概要〕
図4は、本発明の実施形態に適用されるFaster R-CNNの概要を示す構成図である。Faster R-CNN40は、入力画像IMiptの画像中から物体が存在しそうな領域を見つけ出す第1のニューラルネットワーク41と、第1のニューラルネットワーク41の出力として得られた候補領域RPの各々について、候補領域RP内の物体が何であるかを特定するクラス分類の処理を行う第2のニューラルネットワーク42と、を含んで構成される。 [Overview of Faster R-CNN]
FIG. 4 is a block diagram showing an outline of the Faster R-CNN applied to the embodiment of the present invention. The Faster R-CNN40 is a candidate region for each of the firstneural network 41 that finds a region in which an object is likely to exist in the image of the input image IMipt and the candidate region RP obtained as the output of the first neural network 41. It is configured to include a second neural network 42 that performs a classification process that identifies what the object in the RP is.
図4は、本発明の実施形態に適用されるFaster R-CNNの概要を示す構成図である。Faster R-CNN40は、入力画像IMiptの画像中から物体が存在しそうな領域を見つけ出す第1のニューラルネットワーク41と、第1のニューラルネットワーク41の出力として得られた候補領域RPの各々について、候補領域RP内の物体が何であるかを特定するクラス分類の処理を行う第2のニューラルネットワーク42と、を含んで構成される。 [Overview of Faster R-CNN]
FIG. 4 is a block diagram showing an outline of the Faster R-CNN applied to the embodiment of the present invention. The Faster R-CNN40 is a candidate region for each of the first
第1のニューラルネットワーク41は、深層畳み込みニューラルネットワーク(Deep Convolutional Neural Network:DCNN)411と、領域提案ネットワーク(Region Proposal Network:RPN)412と、を含んで構成される。DCNN441は、入力画像IMiptの特徴量を抽出するニューラルネットワークである。DCNN441の畳み込みに使用するフィルタのサイズ及びチャンネル数は適宜設計可能である。例えば、フィルタは、3×3のフィルタであってよく、隠れ層のチャンネル数は256あるいは512などであってよい。
The first neural network 41 is configured to include a deep convolutional neural network (DCNN) 411 and a region proposal network (RPN) 412. DCNN441 is a neural network that extracts the features of the input image IMipt. The size and number of channels of the filter used for convolution of DCNN441 can be appropriately designed. For example, the filter may be a 3 × 3 filter, and the number of channels in the hidden layer may be 256, 512, or the like.
DCNN411に入力画像IMiptが入力されると、DCNN411から特徴マップFMが出力される。特徴マップFMは、多層の畳み込み演算によって得られる畳み込み特徴マップである。DCNN411は、プーリング層を含んでもよいし、プーリング層を持たずに畳み込みのフィルタのストライドを2などに設定して特徴マップFMのサイズを縮小してもよい。DCNN411から出力される特徴マップFMは、RPN412に入力される。
When the input image IMipt is input to DCNN411, the feature map FM is output from DCNN411. The feature map FM is a convolution feature map obtained by a multi-layer convolution operation. The DCNN 411 may include a pooling layer, or may reduce the size of the feature map FM by setting the stride of the convolution filter to 2 or the like without having the pooling layer. The feature map FM output from DCNN411 is input to RPN412.
RPN412は、DCNN411から出力される特徴マップFMを入力とし、特徴マップFMから物体らしい候補領域RPを予測する。RPN412は、畳み込み層を含んで構成され、画像中から物体らしきものを含むバウンディングボックス(Bounding box:Bbox)を生成する。RPN412によって予測した候補領域RPのリストは第2のニューラルネットワーク42に送られる。すなわち、RPN412は、画像中から複数の候補領域RPをリストアップして、R-CNN423に渡す。
The RPN412 takes the feature map FM output from the DCNN411 as an input, and predicts the candidate region RP that seems to be an object from the feature map FM. The RPN412 is configured to include a convolution layer, and generates a bounding box (Bbox) containing what seems to be an object from the image. The list of candidate region RPs predicted by RPN412 is sent to the second neural network 42. That is, the RPN412 lists a plurality of candidate region RPs from the image and passes them to the R-CNN423.
第2のニューラルネットワーク42は、R-CNN(Region-Based Convolutional Neural Network)423によって構成される。R-CNN423は、RPN412の出力として得られた候補領域RPの1つ1つについてクラス分類を行う。R-CNN423は、クラス分類のタスクに加え、物体を囲む矩形を表すバウンディングボックスを出力してもよい。なお、矩形という用語は、長辺と短辺とを持つ長方形に限らず、正方形も含む。
The second neural network 42 is composed of R-CNN (Region-Based Convolutional Neural Network) 423. The R-CNN423 classifies each of the candidate region RPs obtained as the output of the RPN412. In addition to the task of classifying, the R-CNN423 may output a bounding box representing a rectangle surrounding the object. The term rectangle is not limited to a rectangle having a long side and a short side, but also includes a square.
R-CNN423はDCNN411と接続されており、R-CNN423には、DCNN411から出力される特徴マップFMが入力される。また、R-CNN423には、RPN412によって予測された候補領域RPのデータが入力される。R-CNN423は、RPN412が生成した候補領域RPを特徴マップFMに投影して、演算対象とする関心領域(Region of Interest:ROI)を切り出し、ROIごとにオブジェクトのクラス分類を行い、ラベルを決定する。R-CNN423は、RPN412の出力として得られた候補領域RPの1つ1つについてクラス分類を行う。
The R-CNN423 is connected to the DCNN411, and the feature map FM output from the DCNN411 is input to the R-CNN423. Further, the data of the candidate region RP predicted by RPN412 is input to R-CNN423. The R-CNN423 projects the candidate region RP generated by RPN412 onto the feature map FM, cuts out the region of interest (ROI) to be calculated, classifies the objects for each ROI, and determines the label. To do. The R-CNN423 classifies each of the candidate region RPs obtained as the output of the RPN412.
さらに、R-CNN412は、検出したオブジェクトを囲むバウンディングボックスを出力してもよい。特許文献1及び非特許文献1に記載の一般的な写真画像に写る被写体物を対象とする物体検出のタスクでは、R-CNN423から、オブジェクトラベルの出力と、物体の外接矩形を表すバウンディングボックスの出力と、を得ている。
Further, the R-CNN412 may output a bounding box surrounding the detected object. In the task of detecting an object in a general photographic image described in Patent Document 1 and Non-Patent Document 1, the R-CNN423 outputs an object label and a bounding box representing an circumscribing rectangle of the object. I'm getting the output.
本実施形態の場合、線構造の要素点である「中心線上点」を囲む矩形を出力しても実用性に乏しいと考えられるため、バウンディングボックスの出力を省略してよい。あるいは、必要に応じて、中心線上点及びその周囲の血管太さ程度の領域範囲を含むバウンディングボックスを出力するよう構成されてもよい。
In the case of this embodiment, it is considered that it is not practical to output the rectangle surrounding the "center line upper point" which is the element point of the line structure, so the output of the bounding box may be omitted. Alternatively, if necessary, it may be configured to output a bounding box including a region range including a point on the center line and a blood vessel thickness around the center line.
〔線構造抽出装置における処理の内容〕
図5は、本発明の実施形態に係る線構造抽出装置50における処理の内容を概略的に示す説明図である。図5において、図4と共通する要素には同一の符号を付す。線構造抽出装置50は、1台又は複数台のコンピュータを用いて構成される計算システム(コンピューティングシステム)によって実現することができる。線構造抽出装置50は、第1の処理モジュールとしてのDCNN411と、第2の処理モジュールとしてのRPN412と、第3の処理モジュールとしてのR-CNN423と、を備える。「モジュール」という用語はプログラムモジュールの概念を含む。 [Details of processing in the line structure extractor]
FIG. 5 is an explanatory diagram schematically showing the content of processing in the linear structure extraction device 50 according to the embodiment of the present invention. In FIG. 5, the same reference numerals are given to the elements common to those in FIG. The linear structure extraction device 50 can be realized by a computing system (computing system) configured by using one or a plurality of computers. The linear structure extraction device 50 includes DCNN411 as a first processing module, RPN412 as a second processing module, and R-CNN423 as a third processing module. The term "module" includes the concept of program modules.
DCNN411は、入力画像IMiptを受け入れ、複数の畳み込み層414による畳み込み処理を行い、特徴マップFMを生成する。DCNN411の先頭の入力層は、入力画像IMiptを受け付ける画像受付部としての役割を持つ。図5に示す6×6のグリッドは特徴マップFMの一部を表しており、グリッドのマス目の1区画は特徴マップFMの画素pxfmに対応している。特徴マップFMの1つの画素pxfmは、入力画像IMiptにおけるより広い範囲の画像領域から計算された特徴量の情報を持つ。
DCNN411 accepts the input image IMipt, performs convolution processing by the plurality of convolution layers 414, and generates a feature map FM. The first input layer of DCNN411 has a role as an image receiving unit for receiving the input image IMipt. The 6 × 6 grid shown in FIG. 5 represents a part of the feature map FM, and one section of the grid squares corresponds to the pixels pxfm of the feature map FM. One pixel pxfm of the feature map FM has information on the feature amount calculated from a wider range of image areas in the input image IMipt.
入力画像IMiptの画素を画素pxと表記すると、例えば、特徴マップFMの1つの画素pxfmは、入力画像IMiptの画素pxのグリッド配列におけるS×Sピクセルのサイズの画素領域から計算された特徴量を持つようにDCNN411が構成される。Sは、DCNN411による画像の縮小率に応じた値である。つまり、特徴マップFMの各画素pxfmは、入力画像IMiptにおける対応する位置のS×Sサイズの画素領域に相当するものと理解される。
When the pixels of the input image IMipt are expressed as pixels px, for example, one pixel pxfm of the feature map FM is a feature amount calculated from a pixel area of the size of S × S pixels in the grid arrangement of the pixels px of the input image IMipt. DCNN411 is configured to have. S is a value corresponding to the reduction ratio of the image by DCNN411. That is, it is understood that each pixel pxfm of the feature map FM corresponds to a pixel region of S × S size of the corresponding position in the input image IMipt.
言い換えると、入力画像IMiptをグリッド状にS×Sサイズの複数の領域に分割した場合のS×Sサイズの各領域が特徴マップFMの画素pxfmに対応している。特徴マップFMの各画素pxfmの位置は、入力画像IMiptにおける画像位置を表す座標系に投影して記述することができる。
In other words, each area of S × S size when the input image IMipt is divided into a plurality of areas of S × S size in a grid pattern corresponds to the pixel pxfm of the feature map FM. The position of each pixel pxfm of the feature map FM can be described by projecting it onto a coordinate system representing the image position in the input image IMipt.
RPN412はDCNN411から出力された特徴マップFMを受け入れ、特徴マップFMの画素pxfmごとに、画素pxfmの中心点から最も近い中心線上点を予測する。画素pxfmの中心点から最も近い中心線上点を「最近点」という。特徴マップFMの各画素pxfmは、最近点へのシフト量を予測する領域の単位であり、「ユニット」と呼ばれる。すなわち、特徴マップFMは、グリッド状に既定サイズの領域を持つ複数のユニット(画素pxfm)に分割され、RPN412は、特徴マップFMのユニットごとに、中心線の要素点の候補となる最近点を予測する。
RPN412 accepts the feature map FM output from DCNN411, and predicts the nearest centerline top point from the center point of the pixel pxfm for each pixel pxfm of the feature map FM. The point on the center line closest to the center point of the pixel pxfm is called the "recent point". Each pixel pxfm of the feature map FM is a unit of a region for predicting the amount of shift to the latest point, and is called a "unit". That is, the feature map FM is divided into a plurality of units (pixels pxfm) having a predetermined size area in a grid shape, and the RPN412 sets the latest points that are candidates for the element points of the center line for each unit of the feature map FM. Predict.
RPN412は、特徴マップFMのユニットごとに最近点を予測するために、特徴マップFMの各ユニットに対して、アスペクト比及び/又はサイズの異なる複数種の基準矩形を適用する。この基準矩形は「アンカー」と呼ばれる。図5には、それぞれサイズの異なるアンカーA1、アンカーA2、及びアンカーA3の3種のアンカーを用いる例を示す。ここでは3種のアンカーのアスペクト比はどれも1:1である。なお、同サイズで異なるアスペクト比を持つ複数のアンカーを用いてもよい。複数のアンカーA1、アンカーA2、及びアンカーA3は、それぞれの中心点をユニット(画素pxfm)の中心点と一致させて配置される。
RPN412 applies a plurality of types of reference rectangles having different aspect ratios and / or sizes to each unit of the feature map FM in order to predict the latest point for each unit of the feature map FM. This reference rectangle is called an "anchor". FIG. 5 shows an example in which three types of anchors having different sizes, anchor A1, anchor A2, and anchor A3, are used. Here, the aspect ratios of all three types of anchors are 1: 1. A plurality of anchors having the same size and different aspect ratios may be used. The plurality of anchors A1, anchors A2, and anchors A3 are arranged so that their respective center points coincide with the center points of the unit (pixel pxfm).
RPN412は、各アンカーをどれだけ移動(シフト)及び/又は変形させると正解の矩形に近づくかを計算し、かつ、アンカー内に物体があるか否かを計算する畳み込み層416を有する。ここでいう正解の矩形とは、正解の中心線上点を中心位置に持つ矩形であり、かつ血管太さに対応した領域サイズを有する矩形である。RPN412は、DCNN411とは異なる畳み込み層を備える。例えば、RPN412は、DCNN411よりも少ない層数の畳み込み層を持つ構成であってよい。RPN412は、ユニットごとにユニットの位置の特徴量を用いて畳み込みの処理を行う。
The RPN412 has a convolution layer 416 that calculates how much each anchor should be moved (shifted) and / or deformed to approach the correct rectangle, and whether or not there is an object inside the anchor. The correct rectangle here is a rectangle having a point on the center line of the correct answer at the center position and having a region size corresponding to the blood vessel thickness. The RPN412 has a convolutional layer different from the DCNN411. For example, the RPN 412 may have a configuration having a smaller number of convolution layers than the DCNN 411. The RPN412 performs a convolution process for each unit using the feature amount of the unit position.
RPN412は、畳み込み層416による畳み込みを経て、アンカーを正解の矩形に近づけるためのアンカー中心点のシフト量及びアンカーの変形量の出力と、アンカー内に物体があるか否かを示す2クラス分類の確からしさを表すスコアの出力と、を行う。つまり、RPN412は各アンカーについて「アンカーをどのように移動及び/又は変形したらグラウンドトゥルース(ground truth)と一致するかという回帰問題」と「アンカー内に物体があるか否かという識別問題」と、を解く。なお、アンカーの変形量とは、例えば、x方向及びy方向のそれぞれの方向の変形倍率であってよい。アンカーのアスペクト比を変えずにサイズのみを修正する相似変形を行う場合、アンカーの変形量はx方向及びy方向に共通の変形倍率であってよい。
The RPN412 is a two-class classification that indicates the output of the shift amount of the anchor center point and the deformation amount of the anchor to bring the anchor closer to the correct rectangle after convolution by the convolution layer 416, and whether or not there is an object in the anchor. Outputs a score that represents certainty, and performs. That is, RPN412 describes for each anchor "a regression problem of how to move and / or deform the anchor to match the ground truth" and "a discrimination problem of whether or not there is an object inside the anchor". To solve. The deformation amount of the anchor may be, for example, the deformation magnification in each of the x-direction and the y-direction. When performing similar deformation that corrects only the size without changing the aspect ratio of the anchor, the deformation amount of the anchor may be a deformation magnification common to the x direction and the y direction.
アンカー内に物体があるか否かを示す2クラス分類のスコアを「オブジェクトネススコア」という。一方、アンカーを正解の矩形に近づけるためのアンカーのシフト量及び変形量を示す回帰結果のデータをまとめて「Bboxオフセット」という。RPN412は、計算されたシフト量でシフトしたアンカー内に物体があるか否かを示すオブジェクトネススコアを計算してもよいし、シフトしないアンカー内(ユニット位置に配置したアンカー内)に物体があるか否かを示すオブジェクトネススコアを計算してもよいし、又は、これらの両方のオブジェクトネススコアを計算してもよい。
The score of the two-class classification indicating whether or not there is an object in the anchor is called the "objectness score". On the other hand, the regression result data showing the amount of shift and the amount of deformation of the anchor to bring the anchor closer to the correct rectangle is collectively called "Bbox offset". The RPN412 may calculate an objectness score indicating whether or not there is an object in the anchor shifted by the calculated shift amount, or the object is in the non-shifted anchor (inside the anchor placed at the unit position). An objectness score indicating whether or not it may be calculated, or both of these objectness scores may be calculated.
R-CNN423は、RPN412から出力された予測結果の候補領域に基づき、特徴マップFMから候補領域に対応する部分を切り出した局所画像を生成し、この切り取られた局所画像であるROI画像を基に、全結合層426、427によって、ROI画像内に含まれる物体のクラス分類のスコアを計算し、スコアを基にクラスラベルを付与する。なお、特徴マップFMから切り出す局所画像のサイズは候補領域のサイズと異なるサイズであってもよい。
The R-CNN423 generates a local image obtained by cutting out a portion corresponding to the candidate area from the feature map FM based on the candidate area of the prediction result output from the RPN412, and based on the ROI image which is the cut out local image. , Fully connected layers 426, 427 calculate the classification score of the objects included in the ROI image, and assign a class label based on the score. The size of the local image cut out from the feature map FM may be different from the size of the candidate area.
以下、RPN412とR-CNN423とについてさらに詳細に説明する。
Hereinafter, RPN412 and R-CNN423 will be described in more detail.
〔RPN412の説明〕
例えば、肝臓の血管の抽出に用いられるRPN412は、門脈と静脈の区別なく、血管の中心線上の候補点を提示するように訓練される。RPN412の最終層から得られる特徴マップの各画素が、中心線上の候補点を予測するユニットである。それぞれのユニットは、図5で説明した特徴マップFMの画素pxfmに対応している。それぞれのユニットは、ユニットの中心位置を基準とした、中心線の最近点の位置とのずれ量を予測する。 [Explanation of RPN412]
For example, RPN412, which is used to extract blood vessels in the liver, is trained to present candidate points on the centerline of blood vessels, regardless of portal vein or vein. Each pixel of the feature map obtained from the final layer of RPN412 is a unit that predicts a candidate point on the center line. Each unit corresponds to the pixel pxfm of the feature map FM described in FIG. Each unit predicts the amount of deviation from the position of the nearest point of the center line with respect to the center position of the unit.
2次元画像の場合、RPN412が予測するずれ量はx方向及びy方向の各方向のずれ量を示す2つの実数値Δx,Δyである。3次元画像の場合、RPN412が予測するずれ量は、x方向、y方向及びz方向の各方向のずれ量を示す3つの実数値Δx,Δy,Δzである。さらに、RPN412は、予測したずれ量に従ってシフトさせたアンカー内に、及び/又はシフトさせないアンカー内に対象物体があるか無いかも同時に判別する。つまり、RPN412は、対象物体があるか無いかの2クラス分類を行う。
In the case of a two-dimensional image, the deviation amount predicted by RPN412 is two real values Δx and Δy indicating the deviation amount in each of the x direction and the y direction. In the case of a three-dimensional image, the deviation amount predicted by RPN412 is three real values Δx, Δy, and Δz indicating the deviation amount in each of the x-direction, y-direction, and z-direction. Further, the RPN412 simultaneously determines whether or not there is a target object in the anchor shifted according to the predicted deviation amount and / or in the anchor not shifted. That is, the RPN412 classifies two classes as to whether or not there is a target object.
図6は、RPN412によって処理される特徴マップの各画素と、血管中心線との位置関係の例を模式的に示す図である。図6に示す8×8のグリッドは、DCNN411からの特徴マップFMの一部を表している。例えば、図6において各ユニットuの位置をグリッドの列番号0~7と行番号0~7を用いて「u(列番号,行番号)」のように表記すると、左上のユニットはu(0,0)、右下のユニットはu(7,7)と表記される。例えば、ユニットu(3,4)は、ユニット中心位置の中心座標CP34と、この中心座標CP34から最も近い中心線CLbvの最近点NP34の位置とのずれ量(Δx,Δy)を予測する。
FIG. 6 is a diagram schematically showing an example of the positional relationship between each pixel of the feature map processed by RPN412 and the blood vessel center line. The 8x8 grid shown in FIG. 6 represents a portion of the feature map FM from DCNN411. For example, in FIG. 6, when the position of each unit u is expressed as "u (column number, row number)" using column numbers 0 to 7 and row numbers 0 to 7 of the grid, the upper left unit is u (0). , 0), the lower right unit is written as u (7,7). For example, the unit u (3, 4) predicts the amount of deviation (Δx, Δy) between the center coordinate CP34 of the unit center position and the position of the nearest point NP34 of the center line CLbv closest to the center coordinate CP34.
なお、座標を定義する空間は入力画像IMiptにおける位置を特定するxy座標系であってよい。すなわち、各ユニットの中心座標及び最近点座標は入力画像IMiptの画像内の位置を特定するxy座標系の数値(x,y)によって表される。他のユニットについても同様に、各ユニットの中心座標を基準として中心線CLbvの最近点の位置とのずれ量(Δx,Δy)を予測する。ユニットuの中心座標は本開示における「ユニット中心点」の一例である。予測される「ずれ量」は本開示におけるユニット中心点から最近点への「シフト量」の一例である。
Note that the space that defines the coordinates may be an xy coordinate system that specifies the position in the input image IMipt. That is, the center coordinates and the nearest point coordinates of each unit are represented by the numerical values (x, y) of the xy coordinate system that specify the position in the image of the input image IMipt. Similarly for the other units, the amount of deviation (Δx, Δy) from the position of the latest point of the center line CLbv is predicted with reference to the center coordinates of each unit. The center coordinates of the unit u are an example of the "unit center point" in the present disclosure. The predicted "deviation amount" is an example of the "shift amount" from the unit center point to the latest point in the present disclosure.
図7は、中心線CLbvのユニットの拡大図である。ここでは、4つのユニットuが示されている。ユニットu内に表示された細かいグリッドのマス目は入力画像IMiptの画素のサイズを模式的に表している。図7のように、各ユニットuの中心座標CPから中心線CLbvの最近点NPが予測される。
FIG. 7 is an enlarged view of the unit of the center line CLbv. Here, four units u are shown. The squares of the fine grid displayed in the unit u schematically represent the size of the pixels of the input image IMipt. As shown in FIG. 7, the latest point NP of the center line CLbv is predicted from the center coordinate CP of each unit u.
〈アンカーの説明〉
図8は、アンカーの説明図である。図8は、図6と同様に、特徴マップFMの一部を表しており、グリッドのマス目は特徴マップFMの画素、すなわちユニットを表す。それぞれのユニットは、あらかじめ定義された複数のアンカーを仮想的に有している。図7では、説明を簡単にするために、2種類のアンカーを示す。図7は、グレーで塗りつぶしたユニットu(4,4)に配置される第1のアンカー71及び第2のアンカー72を示す。第1のアンカー71は、3×3のピクセルサイズを持つアンカーである。第2のアンカー72は、7×7のピクセルサイズを持つアンカーである。 <Explanation of anchor>
FIG. 8 is an explanatory diagram of the anchor. FIG. 8 represents a part of the feature map FM as in FIG. 6, and the grid squares represent the pixels of the feature map FM, that is, the units. Each unit virtually has a plurality of predefined anchors. In FIG. 7, two types of anchors are shown for the sake of simplicity. FIG. 7 shows thefirst anchor 71 and the second anchor 72 arranged in the unit u (4, 4) filled with gray. The first anchor 71 is an anchor having a pixel size of 3 × 3. The second anchor 72 is an anchor having a pixel size of 7 × 7.
図8は、アンカーの説明図である。図8は、図6と同様に、特徴マップFMの一部を表しており、グリッドのマス目は特徴マップFMの画素、すなわちユニットを表す。それぞれのユニットは、あらかじめ定義された複数のアンカーを仮想的に有している。図7では、説明を簡単にするために、2種類のアンカーを示す。図7は、グレーで塗りつぶしたユニットu(4,4)に配置される第1のアンカー71及び第2のアンカー72を示す。第1のアンカー71は、3×3のピクセルサイズを持つアンカーである。第2のアンカー72は、7×7のピクセルサイズを持つアンカーである。 <Explanation of anchor>
FIG. 8 is an explanatory diagram of the anchor. FIG. 8 represents a part of the feature map FM as in FIG. 6, and the grid squares represent the pixels of the feature map FM, that is, the units. Each unit virtually has a plurality of predefined anchors. In FIG. 7, two types of anchors are shown for the sake of simplicity. FIG. 7 shows the
血管の中心線CLbvはその線上の位置に応じて血管の太さが定義されているものとする。各ユニットに置かれる複数のアンカーのうち、対象の太さと最も近いサイズのアンカーのみが中心線上点の位置を予測する。
It is assumed that the thickness of the blood vessel is defined according to the position on the center line CLbv of the blood vessel. Of the multiple anchors placed in each unit, only the anchor of the size closest to the target thickness predicts the position of the point on the center line.
アンカーは、対象の太さの範囲をカバーするように複数種類用意しておく。例えば、冠動脈を対象とする場合、一辺が3ピクセル、5ピクセル、及び9ピクセルの3サイズの正方形のアンカーを用意する。なお、非特許文献1に記載の一般的な物体を対象として物体検出を行う場合には、アスペクト比の異なる複数のアンカーを用意するが、本実施形態の場合、検出の対象は様々な方向に伸びる線構造を有する管状構造物であり、縦長又は横長といった方向性について特段に顕著な傾向もないため、アンカーのアスペクト比は1:1のものだけであってよい。
Prepare multiple types of anchors so as to cover the target thickness range. For example, when targeting a coronary artery, prepare three-sized square anchors having sides of 3 pixels, 5 pixels, and 9 pixels. When performing object detection on a general object described in Non-Patent Document 1, a plurality of anchors having different aspect ratios are prepared, but in the case of the present embodiment, the detection targets are in various directions. Since it is a tubular structure having an extending linear structure and there is no particular tendency for the directionality such as portrait or landscape, the aspect ratio of the anchor may be only 1: 1.
図8の場合、中心線CLbvの左下の付近、例えば、ユニットu(1,5)の付近は、概ね半径1ピクセルの血管太さを持つ。これに対し、中心線CLbvの右上寄りに位置するユニットu(4,3)付近は、概ね半径2ピクセルの血管太さを持つ。したがって、図8の左下の部分に配置されるユニットでは、複数のアンカーのうち、3×3のピクセルサイズを持つアンカーが中心線上点の位置の予測に用いられ、図8の右上の部分に配置されるユニットでは、7×7のピクセルサイズを持つアンカーが中心線上点の位置の予測に用いられる。
In the case of FIG. 8, the vicinity of the lower left of the center line CLbv, for example, the vicinity of the unit u (1, 5) has a blood vessel thickness of approximately 1 pixel in radius. On the other hand, the vicinity of the unit u (4, 3) located near the upper right of the center line CLbv has a blood vessel thickness of approximately 2 pixels in radius. Therefore, in the unit arranged in the lower left part of FIG. 8, among the plurality of anchors, the anchor having a pixel size of 3 × 3 is used for predicting the position of the point on the center line, and is arranged in the upper right part of FIG. Anchors with a pixel size of 7x7 are used to predict the position of the centerline point in the unit.
図9は、サイズが異なる3種類のアンカーを用いる例を示しており、中心線上点の予測に用いるアンカーが血管太さに応じて決定されることを表している。この例では、一辺が3ピクセルのアンカー81と、一辺が5ピクセルのアンカー82と、1辺が7ピクセルのアンカー83とが用意されており、血管太さに応じて適用するアンカーのサイズが変更される。なお、1つのユニットに対して予測に用いるアンカーは1つに限定する必要はなく、血管太さによっては1つのユニットに複数のアンカーをそれぞれ適用して中心線上点を予測してもよい。
FIG. 9 shows an example of using three types of anchors having different sizes, and shows that the anchor used for predicting the point on the center line is determined according to the blood vessel thickness. In this example, an anchor 81 having a side of 3 pixels, an anchor 82 having a side of 5 pixels, and an anchor 83 having a side of 7 pixels are prepared, and the size of the anchor to be applied changes according to the blood vessel thickness. Will be done. It is not necessary to limit the number of anchors used for prediction to one unit to one, and depending on the blood vessel thickness, a plurality of anchors may be applied to one unit to predict the point on the center line.
学習に用いる学習データとして、訓練画像に対し正解となる中心線の位置情報が与えられ、かつ、正解の各中心線上点がどのような大きさの領域(ここでは血管太さ)を代表する点であるかの情報が与えられる。すなわち、学習データには、正解の中心線上点の各々が、どのサイズのアンカーによって抽出されるべきか、つまり、どの太さの代表点として抽出されるべきか、を示す情報(スコア)も与えられる。これにより、対象となる領域の血管太さに応じてアンカーサイズを変更するように学習させることができる。
As the learning data used for learning, the position information of the center line that is the correct answer is given to the training image, and the point on each center line of the correct answer represents the region of what size (here, the blood vessel thickness). Information is given as to whether or not. That is, the training data is also given information (score) indicating which size anchor should be used to extract each of the points on the center line of the correct answer, that is, which thickness should be extracted as a representative point. Be done. As a result, it is possible to learn to change the anchor size according to the blood vessel thickness of the target area.
図10は、RPN412の出力例を示す概念図である。図10は、図9に示した各アンカーについて、予測された最近点NPへの中心点座標のシフトと、予測された変形倍率による矩形サイズ修正とを実施して得られるそれぞれの候補領域RPの例を示す。
FIG. 10 is a conceptual diagram showing an output example of RPN412. FIG. 10 shows the candidate region RPs obtained by shifting the center point coordinates to the predicted near-point NP and correcting the rectangular size with the predicted deformation magnification for each anchor shown in FIG. An example is shown.
〈アンカーを使った学習方法の概要〉
アンカーを使った学習方法の手順の例を以下に示す。 <Outline of learning method using anchors>
An example of the procedure of the learning method using the anchor is shown below.
アンカーを使った学習方法の手順の例を以下に示す。 <Outline of learning method using anchors>
An example of the procedure of the learning method using the anchor is shown below.
[ステップ1]RPN412は、訓練画像の入力によってDCNN411から出力される特徴マップFMの各ユニット(画素)に予め定義した複数のアンカーを配置する。
[Step 1] In RPN412, a plurality of predefined anchors are arranged in each unit (pixel) of the feature map FM output from DCNN411 by inputting the training image.
[ステップ2]RPN412は、複数のアンカーのうち正解矩形とのオーバーラップの大きいアンカーを探す。
[Step 2] RPN412 searches for an anchor having a large overlap with the correct rectangle among a plurality of anchors.
[ステップ3]ステップ2にて選定した選定アンカーと正解矩形との差分を計算する。この差分とは、具体的には、アンカー中心座標のシフト量Δx、Δyと、アンカーの大きさを変更するための変形倍率と、であってよい。
[Step 3] Calculate the difference between the selected anchor selected in step 2 and the correct rectangle. Specifically, this difference may be the shift amounts Δx and Δy of the anchor center coordinates and the deformation magnification for changing the size of the anchor.
[ステップ4]選定アンカーの物体らしさのスコア(objectness score)が「1」、バウンディングボックスの修正量(Bboxオフセット)がステップ3で計算した差分となるように、ネットワークを学習する。
[Step 4] The network is learned so that the objectness score of the selected anchor is "1" and the correction amount of the bounding box (Bbox offset) is the difference calculated in step 3.
〈アンカーを使った推論方法の概要〉
アンカーを使った推論(予測)方法の例を以下に示す。 <Overview of inference method using anchors>
An example of an inference (prediction) method using an anchor is shown below.
アンカーを使った推論(予測)方法の例を以下に示す。 <Overview of inference method using anchors>
An example of an inference (prediction) method using an anchor is shown below.
[ステップ101]学習済みのRPN412は、推論対象とする未知画像の入力によってDCNN411から出力される特徴マップFMの各ユニットに予め定義した複数のアンカーを配置する。
[Step 101] The trained RPN412 arranges a plurality of predefined anchors in each unit of the feature map FM output from the DCNN411 by inputting an unknown image to be inferred.
[ステップ102]RPN412は、各アンカーのBboxオフセットと、オブジェクトネススコアと、を計算する。
[Step 102] RPN412 calculates the Bbox offset of each anchor and the objectness score.
[ステップ103]オブジェクトネススコアが高いアンカーについて、そのアンカーのBboxオフセットを基に、アンカーを移動及び変形する。
[Step 103] For an anchor with a high objectness score, the anchor is moved and deformed based on the Bbox offset of the anchor.
〈重複する候補領域の抑制:Non-Maximum Suppression(NMS)処理〉
各ユニットが予測した中心線上点の点群は、過剰に多い場合がある。特許文献1及び非特許文献1に記載のように、Faster R-CNNでは、RPNとR-CNNとの間に重要な候補のみを選択して残すNMS処理が挿入されている。NMS処理は、同じ物体を示している複数の矩形のうちから1つの矩形を残して、他の矩形からの出力を抑制する処理である。 <Suppression of overlapping candidate areas: Non-Maximum Suppression (NMS) processing>
The point cloud of the points on the center line predicted by each unit may be excessive. As described inPatent Document 1 and Non-Patent Document 1, in Faster R-CNN, an NMS process for selecting and leaving only important candidates is inserted between RPN and R-CNN. The NMS process is a process of suppressing output from the other rectangles by leaving one rectangle out of a plurality of rectangles showing the same object.
各ユニットが予測した中心線上点の点群は、過剰に多い場合がある。特許文献1及び非特許文献1に記載のように、Faster R-CNNでは、RPNとR-CNNとの間に重要な候補のみを選択して残すNMS処理が挿入されている。NMS処理は、同じ物体を示している複数の矩形のうちから1つの矩形を残して、他の矩形からの出力を抑制する処理である。 <Suppression of overlapping candidate areas: Non-Maximum Suppression (NMS) processing>
The point cloud of the points on the center line predicted by each unit may be excessive. As described in
特許文献1及び非特許文献1の場合、RPNが生成する候補領域間でIoU(Intersection over Union)値を計算し、IoU値が所定の閾値よりも大きい場合は、領域どうしの重なりが大きいと見做して、一方の領域を削除(抑制)する。逆に、IoU値が小さければ、領域どうしの重なりが小さいため、両方の候補領域をそのまま残す。このようなアルゴリズムによって、過剰に重複する候補領域の数を減らす仕組みが提案されている。
In the case of Patent Document 1 and Non-Patent Document 1, the IOU (Intersection over Union) value is calculated between the candidate regions generated by RPN, and if the IOU value is larger than a predetermined threshold value, it is considered that the regions overlap each other. In the meantime, one area is deleted (suppressed). On the contrary, if the IoT value is small, the overlap between the regions is small, so both candidate regions are left as they are. A mechanism for reducing the number of excessively overlapping candidate regions has been proposed by such an algorithm.
本実施形態が対象とする中心線上の点群を検出する問題の場合、血管の太さの半分程度の間隔で「中心線上点」が検出されれば十分である。したがって、本実施形態では、上述のNMS処理に加え、又は、NMS処理に代えて、上述のIoU値を計算せずに、血管の太さの半分程度の間隔で候補領域を間引く処理を行う。なお、学習の際に、教師データとして予め血管の太さの情報が与えられていない場合は、ユニットのピクセル間隔程度でサンプリングすればよい。
In the case of the problem of detecting the point cloud on the center line targeted by the present embodiment, it is sufficient if the "points on the center line" are detected at intervals of about half the thickness of the blood vessel. Therefore, in the present embodiment, in addition to the above-mentioned NMS treatment, or instead of the above-mentioned NMS treatment, the candidate regions are thinned out at intervals of about half the thickness of the blood vessel without calculating the above-mentioned IoU value. If the information on the thickness of the blood vessel is not given in advance as the teacher data at the time of learning, sampling may be performed at about the pixel interval of the unit.
〈孤立点除去〉
図11は、RPN412によって予測された候補点の例を示しており、候補点の中に孤立点が含まれている場合の説明図である。血管の中心線のような線構造は、連続する点の配列(点列)によって表現されるため、図11に示すように、各ユニットから予測された中心線上点が他の点列から大きく離れて孤立して存在するような場合は、その孤立点ISPは誤って予測された結果(誤検出)である可能性が高い。したがって、RPN412において、予測された中心線上の候補点が孤立してある場合は誤検出と判断できる所定の閾値を設定しておき、この閾値以内の距離に他の候補点が一つも存在しない点は、その孤立点ISPを予測結果から削除(消去)する。 <Removal of isolated points>
FIG. 11 shows an example of a candidate point predicted by RPN412, and is an explanatory diagram when an isolated point is included in the candidate point. Since a line structure such as the center line of a blood vessel is represented by an array of continuous points (a sequence of points), as shown in FIG. 11, the points on the center line predicted from each unit are far apart from other point sequences. If it exists in isolation, the isolated point ISP is likely to be an erroneously predicted result (false positive). Therefore, in the ISP412, when the predicted candidate points on the center line are isolated, a predetermined threshold value that can be judged as a false detection is set, and there is no other candidate point within the distance within this threshold value. Deletes (eliminates) the isolated point ISP from the prediction result.
〔R-CNN423の説明〕
R-CNN423は、RPN412が予測したアンカー内の特徴マップを規格化した画像を入力として、クラス判別を行う。本実施形態が扱う血管構造のように、検出の対象がグラフ理論の木構造である場合に、R-CNN423は、木構造の構成要素としての「根」、「枝上の点」、「分岐点」、又は「末梢の点(末端)」の4ラベルのいずれかに分類する。 [Explanation of R-CNN423]
The R-CNN423 performs class discrimination by inputting an image that standardizes the feature map in the anchor predicted by RPN412. When the object of detection is a tree structure of graph theory as in the blood vessel structure handled in the present embodiment, the R-CNN423 has "roots", "points on branches", and "branches" as components of the tree structure. It is classified into one of the four labels of "point" or "peripheral point (terminal)".
図12は、木構造の構成要素のラベルが付された点群の例を示す。このように点ごとの特性(分類)が予めわかっていると、さらに後段で点同士を接続してグラフ構造を再構成させる際に都合がよい。例えば、根の位置から経路の探索をはじめたり、分岐点で枝の数を増やしたり、末梢の点で経路の接続を終了させることができる。
FIG. 12 shows an example of a point cloud labeled with a component of a tree structure. If the characteristics (classification) of each point are known in advance in this way, it is convenient to connect the points to each other in the later stage to reconstruct the graph structure. For example, the search for a route can be started from the position of the root, the number of branches can be increased at a branch point, and the connection of the route can be terminated at a peripheral point.
経路の接続には既存のアルゴリズム、例えば最少全域木アルゴリズム、又は最短経路(ダイクストラ)アルゴリズムを用いることができる。
Existing algorithms, such as the minimum spanning tree algorithm or the shortest path (Dijkstra) algorithm, can be used to connect the routes.
〈クラス分類の他の例〉
人体中には様々な血管系があり、例えば肝臓や肺がある。肝臓の血管系であれば動脈、門脈、及び静脈がある。それぞれの血管系は接触したり、交差したりしており、解剖を把握するために、対象を分離することが重要である。そこでR-CNN423に血管の種類を分類させる構成としてもよい。この場合、分類するクラスの項目として解剖学的名称を与え、学習データに正解となるラベルのデータを加えればよい。 <Other examples of classification>
There are various vascular systems in the human body, such as the liver and lungs. The vascular system of the liver includes arteries, portal veins, and veins. Each vascular system is in contact and intersects, and it is important to separate the subjects in order to understand the anatomy. Therefore, the R-CNN423 may be configured to classify the types of blood vessels. In this case, an anatomical name may be given as an item of the class to be classified, and the data of the label that is the correct answer may be added to the learning data.
[肝臓の場合]
肝臓の血管を分類する目的の場合には、RPN412が検出した候補点(予測した中心線上点)に対し、R-CNN423が判別するクラスを血管タイプによって、{門脈,静脈,動脈,その他}の4クラスとする。 [For liver]
For the purpose of classifying blood vessels in the liver, the class determined by R-CNN423 for the candidate points (predicted centerline points) detected by RPN412 is classified according to the blood vessel type {portal vein, vein, artery, etc.} There are 4 classes.
さらに肝臓は、解剖学的に8区域に分けられる。8区域は、尾状葉、外側区域背側、外側区域尾側、内側区域、前区域頭側、前区域尾側、後区域後頭側、及び後区域尾側である。これらの区域は血管枝の走行によって定義されるため、8種類の血管枝のクラス分けをすることができる。
The liver is further anatomically divided into 8 areas. The eight areas are caudate lobe, dorsal lateral area, caudal lateral area, medial area, caudal anterior area, caudal anterior area, caudal posterior area, and caudal posterior area. Since these areas are defined by the running of vascular branches, eight types of vascular branches can be classified.
正解として与えられる中心線について、その枝ごとに解剖名が付与される。予測した中心線上の候補点のラベルをR-CNN423が学習する正解のラベルとする。
For the center line given as the correct answer, an anatomical name is given to each branch. The label of the predicted candidate point on the center line is used as the label of the correct answer learned by R-CNN423.
人体中には、肝臓の他にも脳血管、肺血管や気管支、あるいは消化管のような木構造(ループがある場合は広義に「グラフ」と呼ぶ)が存在する。本開示の手法は、様々な解剖構造の認識に応用することができる。
In addition to the liver, there are tree structures such as cerebral blood vessels, pulmonary blood vessels, bronchi, and digestive tract (when there are loops, they are broadly called "graphs") in the human body. The method of the present disclosure can be applied to the recognition of various anatomical structures.
[肺の場合]
肺の血管構造の場合、例えば、肺静脈と肺動脈のクラス分けをすることができる。あるいはまた、気管及び気管支の木構造を持つ気管構造に関して、解剖学的な気管支名及び/又は区域名によって複数のクラス分けを行うことができる。肺は、気管支枝によって複数の区域に分類される。例えば、気管、右肺の主気管支、上葉支、肺突枝(B1)、後上葉枝(B2)、前上葉枝(B3)、中間幹、中葉支、外側中葉枝(B4)、内側中葉枝(B5)、下葉支、上下葉枝(B6)、内側肺底枝(B7)、前肺底枝(B8)、外側肺底枝(B9)、後肺底枝(B10)、底幹支、左肺の主気管支、上葉支、上区支、肺突後枝(B1+2)、前上葉枝(B3)、舌支、上舌枝(B4)、下舌枝(B5)、下葉支、上下葉枝(B6)、内側前肺底枝(B7+8)、外側肺底枝(B9)、後肺底枝(B10)、及び底幹支などの各クラスに分けることができる。 [For lungs]
In the case of vascular structure of the lung, for example, pulmonary veins and pulmonary arteries can be classified. Alternatively, for tracheal structures with tracheal and bronchial tree structures, multiple classifications can be made by anatomical bronchial name and / or area name. The lungs are classified into multiple areas by bronchial branches. For example, trachea, main bronchus of the right lung, upper lobe, lung protrusion (B1), posterior superior lobe (B2), anterior superior lobe (B3), middle trunk, middle lobe, lateral middle lobe (B4), medial middle Leaf branch (B5), lower lobe branch, upper and lower lobe branch (B6), medial lung floor branch (B7), anterior lung floor branch (B8), lateral lung floor branch (B9), posterior lung floor branch (B10), bottom trunk branch, Main bronchus of the left lung, upper lobe, upper ward, posterior branch of the lung (B1 + 2), anterior upper lobe (B3), tongue, upper tongue (B4), lower tongue (B5), lower lobe, It can be divided into upper and lower lobe branches (B6), medial anterior lung floor branch (B7 + 8), lateral lung floor branch (B9), posterior lung floor branch (B10), and floor trunk branch.
《線構造抽出装置に用いられる学習モデルの例》
図13は、線構造抽出装置50に実装される学習モデル52のネットワーク構造と処理の流れを概略的に示す説明図である。図13において、図4及び図5で説明した要素と対応する要素には同一の符号を付し、その説明は省略する。学習モデル52は、DCNN411と、RPN412と、R-CNN423と、を含む。 << Example of learning model used for line structure extractor >>
FIG. 13 is an explanatory diagram schematically showing the network structure and the processing flow of thelearning model 52 mounted on the line structure extraction device 50. In FIG. 13, the elements corresponding to the elements described in FIGS. 4 and 5 are designated by the same reference numerals, and the description thereof will be omitted. The learning model 52 includes DCNN411, RPN412, and R-CNN423.
図13は、線構造抽出装置50に実装される学習モデル52のネットワーク構造と処理の流れを概略的に示す説明図である。図13において、図4及び図5で説明した要素と対応する要素には同一の符号を付し、その説明は省略する。学習モデル52は、DCNN411と、RPN412と、R-CNN423と、を含む。 << Example of learning model used for line structure extractor >>
FIG. 13 is an explanatory diagram schematically showing the network structure and the processing flow of the
RPN412の畳み込み層416は、DCNN411が出力する特徴マップFMのチャンネル数に対応するフィルタ数を持つ。畳み込み層416のフィルタサイズは例えば3×3であってよい。
The convolution layer 416 of the RPN 412 has a number of filters corresponding to the number of channels of the feature map FM output by the DCNN 411. The filter size of the convolution layer 416 may be, for example, 3 × 3.
RPN412は、畳み込み層416の後段に2種類の1×1の畳み込み層417、418を有する。畳み込み層416の出力は、1×1の畳み込み層417、418の各々に入力される。一方の1×1の畳み込み層417は、活性化関数としてソフトマックス関数を用いるソフトマックス層を含み、各アンカーの位置において物体(中心線上点)であるか否かの確率を示すオブジェクトネススコアを出力する。他方の1×1の畳み込み層418は、複数のアンカーの各々についてアンカーを正解の矩形に近づけるための数値回帰を行う回帰層である。RPN412は、訓練データの正解矩形との重なりが大きくなるように訓練される。
The RPN 412 has two types of 1 × 1 convolution layers 417 and 418 after the convolution layer 416. The output of the convolution layer 416 is input to each of the 1 × 1 convolution layers 417 and 418. On the other hand, the 1 × 1 convolution layer 417 includes a softmax layer that uses a softmax function as an activation function, and has an objectness score indicating the probability of being an object (point on the center line) at each anchor position. Output. The other 1 × 1 convolution layer 418 is a regression layer that performs numerical regression for each of the plurality of anchors in order to bring the anchors closer to the correct rectangle. The RPN412 is trained so that the overlap with the correct rectangle of the training data is large.
R-CNN423は、ROIプーリング層424と、全結合層426、427と、ソフトマックス層428と、を含む。ROIプーリング層424は、DCNN411から得られる特徴マップFMの中から切り出される各候補領域RPに対応する領域内の特徴マップをプーリングして、固定サイズの規格化した画像に変形する。固定サイズに変形された特徴マップの部分画像は全結合層426に入力される。最終の全結合層427の後段にソフトマックス層428が設けられる。分類するクラスの数に対応して出力層のユニットの数が決定され、各クラスである確率を示すオブジェクトスコアが計算され、最終的にオブジェクトラベルが特定される。なお、全結合層426、427の一部もしくは全部に代えて、又はこれに加えて、畳み込み層を備える構成を採用してもよい。
R-CNN423 includes a ROI pooling layer 424, a fully connected layer 426, 427, and a softmax layer 428. The ROI pooling layer 424 pools the feature map in the region corresponding to each candidate region RP cut out from the feature map FM obtained from DCNN411 and transforms it into a standardized image of a fixed size. A partial image of the feature map transformed into a fixed size is input to the fully connected layer 426. A softmax layer 428 is provided after the final fully connected layer 427. The number of units in the output layer is determined according to the number of classes to be classified, the object score indicating the probability of each class is calculated, and finally the object label is specified. In addition, a configuration including a convolution layer may be adopted in place of or in addition to a part or all of the fully connected layers 426 and 427.
図13に示すROIプーリング層424は本開示における「関心領域プーリング層」の一例である。学習モデル52は本開示における「学習済みモデル」の一例である。
The ROI pooling layer 424 shown in FIG. 13 is an example of the “region of interest pooling layer” in the present disclosure. The learning model 52 is an example of the "trained model" in the present disclosure.
〈本実施形態による線構造抽出方法〉
図14は、線構造抽出装置50による処理内容の例を示すフローチャートである。図14に示す処理は、線構造抽出装置50として機能する計算システムによって実行される。計算システムは、コンピュータ可読媒体に記憶されたプログラムに従って各ステップの処理を実行する。 <Line structure extraction method according to this embodiment>
FIG. 14 is a flowchart showing an example of processing contents by the line structure extraction device 50. The process shown in FIG. 14 is executed by a calculation system that functions as the line structure extraction device 50. The computing system executes the processing of each step according to the program stored in the computer-readable medium.
ステップS50において、計算システムは処理の対象となる画像を受け入れる。
In step S50, the calculation system accepts the image to be processed.
ステップS52において、計算システムは入力された画像からDCNN411によって畳み込み特徴マップを生成する。
In step S52, the calculation system generates a convolution feature map by DCNN411 from the input image.
ステップS54において、計算システムはDCNN411から出力された畳み込み特徴マップをRPN412に入力してRPN412により中心線上点らしき候補領域を生成する。
In step S54, the calculation system inputs the convolution feature map output from DCNN411 into RPN412 and generates a candidate area that seems to be a point on the center line by RPN412.
ステップS56において、計算システムはRPN412によって生成された各候補領域の情報とDCNN411によって生成された畳み込み特徴マップとをR-CNN423に入力して、R-CNN423により各候補領域を切り出し、各候補領域のオブジェクトの分類ラベルを生成する。
In step S56, the calculation system inputs the information of each candidate area generated by RPN412 and the convolution feature map generated by DCNN411 into R-CNN423, cuts out each candidate area by R-CNN423, and sets each candidate area. Generate a classification label for an object.
ステップS58において、計算システムはRPN412によって予測された中心線上各点の位置と、各点の血管太さと、R-CNN423によって予測された各点のラベルと、が紐付けされた予測結果のデータを記憶する。
In step S58, the calculation system obtains the data of the prediction result in which the position of each point on the center line predicted by RPN412, the blood vessel thickness of each point, and the label of each point predicted by R-CNN423 are linked. Remember.
ステップS58の後、計算システムは図14のフローチャートを終了する。
After step S58, the calculation system ends the flowchart of FIG.
図15は、図14のステップS54に適用される処理内容の例を示すフローチャートである。図15のステップS61において、計算システムは畳み込み特徴マップのユニットごとに複数のアンカーを生成する。
FIG. 15 is a flowchart showing an example of the processing content applied to step S54 of FIG. In step S61 of FIG. 15, the computational system generates a plurality of anchors for each unit of the convolution feature map.
ステップS62において、計算システムは各アンカーについてアンカー中心から最も近い血管の中心線上の点(最近点)の座標を予測する。
In step S62, the calculation system predicts the coordinates of the point (recent point) on the center line of the blood vessel closest to the anchor center for each anchor.
ステップS63において、計算システムは各アンカー内に中心線の点が含まれているか否かの2クラス分類のためのオブジェクトネススコアを計算する。
In step S63, the calculation system calculates the objectness score for two-class classification as to whether or not the centerline point is included in each anchor.
ステップS64において、計算システムはオブジェクトネススコアが高いアンカーについて、予測した最近点の位置における血管太さに相当するアンカー倍率を予測する。
In step S64, the calculation system predicts the anchor magnification corresponding to the blood vessel thickness at the predicted position of the latest point for the anchor having a high objectness score.
ステップS65において、計算システムはRPN412が生成する多数の候補領域から血管太さを考慮して過剰な候補領域を抑制する。例えば、RPN412によって予測された複数の候補点の点群のうち、血管の直径の半分(半径)程度を目安とする間隔(第1の間隔)よりも近接している過剰な候補点の一部を削除して、血管の半径程度の間隔で候補点を選択して残すようにサンプリングを行う。このような間引きのサンプリングにより、血管の太さが太い部分ほど大きな間隔で候補点の点列が残り、細い部分では小さな間隔で候補点が残る。
In step S65, the calculation system suppresses an excessive candidate region from a large number of candidate regions generated by RPN412 in consideration of the blood vessel thickness. For example, among the point cloud of a plurality of candidate points predicted by RPN412, a part of excess candidate points that are closer than the interval (first interval) about half the diameter (radius) of the blood vessel. Is deleted, and sampling is performed so that candidate points are selected and left at intervals of about the radius of the blood vessel. By sampling such thinning out, the thicker the blood vessel, the larger the interval of candidate points remains, and the thinner the blood vessel, the smaller the interval of candidate points.
なお、予め検出対象物の太さの情報が与えられていない場合には、RPN412によって予測された複数の候補点の点群のうち、ユニットuのサイズの半分を目安とする間隔(第2の間隔)よりも近接している過剰な候補点の一部を削除して、ユニットuの1/2サイズ程度の間隔で候補点を選択して残すようにサンプリングを行う。
If information on the thickness of the object to be detected is not given in advance, an interval (second) with half the size of the unit u as a guide among the point clouds of the plurality of candidate points predicted by RPN412. Sampling is performed so that a part of the excess candidate points that are closer than the interval) is deleted, and the candidate points are selected and left at an interval of about 1/2 size of the unit u.
ステップS66において、計算システムはRPN412によって予測された候補点から孤立点を判別し、孤立点の候補領域を削除する。
In step S66, the calculation system determines an isolated point from the candidate points predicted by RPN412, and deletes the candidate area of the isolated point.
ステップS67において、計算システムは予測した中心線上の各点の位置と、各点における血管太さとが紐付けされた予測結果のデータ、すなわち候補領域のBboxのリストを生成する。
In step S67, the calculation system generates prediction result data in which the predicted position of each point on the center line and the blood vessel thickness at each point are linked, that is, a list of Bboxes in the candidate region.
ステップS67の後、計算システムは図15のフローチャートを終了して、図14のフローチャートに復帰する。
After step S67, the calculation system ends the flowchart of FIG. 15 and returns to the flowchart of FIG.
《学習方法の例》
次に、本実施形態に係る線構造抽出装置50における学習モデルの学習方法の例について説明する。 << Example of learning method >>
Next, an example of a learning method of the learning model in the line structure extraction device 50 according to the present embodiment will be described.
次に、本実施形態に係る線構造抽出装置50における学習モデルの学習方法の例について説明する。 << Example of learning method >>
Next, an example of a learning method of the learning model in the line structure extraction device 50 according to the present embodiment will be described.
〔学習データの例〕
学習に用いる学習データとして、訓練画像と、その訓練画像に含まれる血管の中心線上の各点の位置情報と、中心線上の各点における血管太さ情報と、各点についてのクラス分類の正解ラベルと、の組み合わせを複数セット用いる。「学習データ」とは、機械学習に用いる訓練用のデータであり、「学習用データ」或いは「訓練データ」と同義である。 [Example of learning data]
As training data used for learning, the training image, the position information of each point on the center line of the blood vessel included in the training image, the blood vessel thickness information at each point on the center line, and the correct label of the classification for each point. Use multiple sets of and. The "learning data" is training data used for machine learning, and is synonymous with "learning data" or "training data".
訓練画像は、例えば、CT装置によって撮影されたCT画像であってよい。正解として与える血管の中心線上の各点の位置情報及び血管太さ情報は、例えば、CT画像から生成したCPR画像の中心線上の点の座標及び血管半径の数値を用いることができる。
The training image may be, for example, a CT image taken by a CT device. For the position information and blood vessel thickness information of each point on the center line of the blood vessel given as the correct answer, for example, the coordinates of the points on the center line of the CPR image generated from the CT image and the numerical values of the blood vessel radius can be used.
各点の血管太さ(半径)が特定されることにより、例えば、その点を中心として半径の2倍の長さを1辺とする正方形の正解矩形を自動的に定めることができる。また、与えられた各点の血管太さから、その点の予測に適したアンカーサイズを定めることができる。各点のクラス分類の正解ラベルは、解剖学的な知見に基づき定めることができる。1つの訓練画像について、アンカーの種類(サイズ)ごとに、各サイズのアンカーが抽出してほしいい位置の正解データを与える。なお、血管太さによっては異なるサイズの複数のアンカーを用いて重複して予測を行うように正解データを与えてよい。
By specifying the blood vessel thickness (radius) of each point, for example, it is possible to automatically determine the correct rectangle of a square centered on that point and having a length twice the radius as one side. In addition, the anchor size suitable for predicting the point can be determined from the blood vessel thickness of each given point. The correct label for the classification of each point can be determined based on anatomical findings. For one training image, for each anchor type (size), the correct answer data of the position that the anchor of each size wants to extract is given. Depending on the thickness of the blood vessel, correct answer data may be given so as to make duplicate predictions using a plurality of anchors having different sizes.
図16は、学習データLD(i)の概念図である。本実施形態の機械学習においては、学習データLD(i)として、訓練画像と、正解中心線の各点の座標と、各点の正解太さと、各点の正解ラベルと、を与える。iは学習データを識別するインデックス番号である。なお、正解中心線の各点の座標は、訓練画像のピクセル単位よりも細かなサブピクセル単位の数値で与えてよい。正解矩形は、正解太さの情報から自動生成することができる。アンカーサイズは、正解太さの情報から自動生成してもよいし、オペレータが指定してもよい。
FIG. 16 is a conceptual diagram of the learning data LD (i). In the machine learning of the present embodiment, the training image, the coordinates of each point of the correct center line, the correct thickness of each point, and the correct label of each point are given as the learning data LD (i). i is an index number that identifies the training data. The coordinates of each point of the correct center line may be given as a numerical value in sub-pixel units, which is finer than in pixel units of the training image. The correct answer rectangle can be automatically generated from the correct answer thickness information. The anchor size may be automatically generated from the correct answer thickness information, or may be specified by the operator.
〔学習装置の構成例〕
図17は、機械学習を行う学習装置100の構成例を示す機能ブロック図である。学習装置100は、1台又は複数台のコンピュータを用いて構成される計算システムによって実現することができる。学習装置100を構成する計算システムは、線構造抽出装置50を構成する計算システムと同じシステムであってもよいし、異なるシステムであってもよく、また一部の要素を共有するシステムであってもよい。 [Configuration example of learning device]
FIG. 17 is a functional block diagram showing a configuration example of thelearning device 100 that performs machine learning. The learning device 100 can be realized by a calculation system configured by using one or a plurality of computers. The calculation system constituting the learning device 100 may be the same system as the calculation system constituting the line structure extraction device 50, may be a different system, or is a system that shares some elements. May be good.
図17は、機械学習を行う学習装置100の構成例を示す機能ブロック図である。学習装置100は、1台又は複数台のコンピュータを用いて構成される計算システムによって実現することができる。学習装置100を構成する計算システムは、線構造抽出装置50を構成する計算システムと同じシステムであってもよいし、異なるシステムであってもよく、また一部の要素を共有するシステムであってもよい。 [Configuration example of learning device]
FIG. 17 is a functional block diagram showing a configuration example of the
学習装置100は、学習データ保管部150と接続される。学習データ保管部150は、学習装置100が機械学習を行うために必要な学習データLD(i)を保管しておくストレージを含んで構成される。ここでは、学習データ保管部150と学習装置100とがそれぞれ別々の装置として構成される例を説明するが、これらの機能は1台のコンピュータで実現してもよいし、2以上の複数台のコンピュータで処理の機能を分担して実現してもよい。
The learning device 100 is connected to the learning data storage unit 150. The learning data storage unit 150 is configured to include a storage for storing the learning data LD (i) necessary for the learning device 100 to perform machine learning. Here, an example in which the learning data storage unit 150 and the learning device 100 are configured as separate devices will be described, but these functions may be realized by one computer, or two or more devices may be realized. The processing functions may be shared and realized by the computer.
例えば、学習データ保管部150と学習装置100とは、図示しない電気通信回線を介して互いに接続されていてもよい。「接続」という用語は、有線接続に限らず、無線接続の概念も含む。電気通信回線は、ローカルエリアネットワークであってもよいし、ワイドエリアネットワークであってもよい。
For example, the learning data storage unit 150 and the learning device 100 may be connected to each other via a telecommunication line (not shown). The term "connection" is not limited to wired connection, but also includes the concept of wireless connection. The telecommunication line may be a local area network or a wide area network.
このように構成することで、学習データの生成処理と学習モデルの学習処理とを物理的にも時間的にも互いに束縛されることなく実施することができる。
With this configuration, the learning data generation process and the learning model learning process can be performed without being physically and temporally constrained to each other.
学習装置100は、学習データ保管部150から学習データLD(i)を読み込み、機械学習を実行する。学習装置100は、複数の学習データLD(i)をまとめたミニバッチの単位で学習データLD(i)の読み込みとパラメータの更新を行うことができる。
The learning device 100 reads the learning data LD (i) from the learning data storage unit 150 and executes machine learning. The learning device 100 can read the learning data LD (i) and update the parameters in units of mini-batch in which a plurality of learning data LDs (i) are put together.
学習装置100は、データ取得部102と、学習モデル52と、第1誤差計算部110と、第2誤差計算部112と、オプティマイザ114と、を含む。
The learning device 100 includes a data acquisition unit 102, a learning model 52, a first error calculation unit 110, a second error calculation unit 112, and an optimizer 114.
データ取得部102は、学習データLD(i)を取り込むためのインターフェースである。データ取得部102は、外部又は装置内の他の信号処理部から学習データLD(i)を取り込むデータ入力端子で構成されてよい。また、データ取得部102には、有線又は無線の通信インターフェース部を採用してもよいし、メモリカードなどの可搬型の外部記憶媒体の読み書きを行うメディアインターフェース部を採用してもよく、若しくは、これら態様の適宜の組み合わせであってもよい。
The data acquisition unit 102 is an interface for capturing the learning data LD (i). The data acquisition unit 102 may be configured by a data input terminal that captures the learning data LD (i) from an external or other signal processing unit in the device. Further, the data acquisition unit 102 may employ a wired or wireless communication interface unit, a media interface unit that reads / writes a portable external storage medium such as a memory card, or may be used. Any combination of these embodiments may be used.
学習モデル52は、既に説明したとおり、DCNN411と、RPN412と、R-CNN423と、を含む。
The learning model 52 includes DCNN411, RPN412, and R-CNN423, as described above.
第1誤差計算部110は、アンカーごとに、RPN412から出力された予測結果と、正解データとの誤差を計算する。第1誤差計算部110は、損失関数を用いて誤差を評価する。第1誤差計算部110によって計算された第1誤差はオプティマイザ114に送られる。
The first error calculation unit 110 calculates the error between the prediction result output from RPN412 and the correct answer data for each anchor. The first error calculation unit 110 evaluates the error using the loss function. The first error calculated by the first error calculation unit 110 is sent to the optimizer 114.
第2誤差計算部112は、R-CNN423から出力された予測結果と、正解ラベルとの誤差を計算する。第2誤差計算部112は、損失関数を用いて誤差を評価する。第2誤差計算部112によって計算された第2誤差はオプティマイザ114に送られる。
The second error calculation unit 112 calculates the error between the prediction result output from R-CNN423 and the correct label. The second error calculation unit 112 evaluates the error using the loss function. The second error calculated by the second error calculation unit 112 is sent to the optimizer 114.
オプティマイザ114は、第1誤差計算部110及び第2誤差計算部112の各々の計算結果から学習モデル52のパラメータを更新する処理を行う。オプティマイザ114は、誤差逆伝播法などのアルゴリズムに基づきパラメータの更新を行う。ネットワークのパラメータは、各層の処理に用いるフィルタのフィルタ係数(ノード間の結合の重み)及びノードのバイアスなどを含む。
The optimizer 114 performs a process of updating the parameters of the learning model 52 from the calculation results of the first error calculation unit 110 and the second error calculation unit 112. The optimizer 114 updates the parameters based on an algorithm such as the error back propagation method. The network parameters include the filter coefficient (weight of the connection between nodes) of the filter used for processing each layer, the bias of the nodes, and the like.
オプティマイザ114は、第1誤差計算部110の計算結果を用いて、DCNN411とRPN412とが結合されてなる第1サブネットワーク410のパラメータの更新量を計算し、計算されたパラメータの更新量に従い、DCNN411及びRPN412のうち少なくともRPN412のネットワークのパラメータを更新するパラメータ更新処理を行う。好ましくは、DCNN411とRPN412のそれぞれのネットワークのパラメータを更新する。
The optimizer 114 uses the calculation result of the first error calculation unit 110 to calculate the update amount of the parameter of the first subnetwork 410 in which the DCNN411 and the RPN412 are combined, and according to the calculated parameter update amount, the DCNN411 And RPN412, the parameter update process for updating at least the network parameter of RPN412 is performed. Preferably, the parameters of the respective networks of DCNN411 and RPN412 are updated.
また、オプティマイザ114は、第2誤差計算部112の計算結果を用いて、DCNN411とR-CNN423とが結合されてなる第2サブネットワーク420のパラメータの更新量を計算し、計算されたパラメータの更新量に従い、DCNN411及びR-CNN423の各ネットワークのパラメータを更新する。
Further, the optimizer 114 calculates the update amount of the parameter of the second sub-network 420 formed by combining DCNN411 and R-CNN423 using the calculation result of the second error calculation unit 112, and updates the calculated parameter. The parameters of each network of DCNN411 and R-CNN423 are updated according to the amount.
また、学習装置100は、第2サブネットワーク420の訓練によってファインチューンされたDCNN411のパラメータを固定した状態で、第1サブネットワーク410のモデルについてさらなる学習を行い、RPN412のパラメータを更新する。このような学習プロセスを繰り返し実行することにより、学習モデル52のパラメータを最適化することができる。こうして、学習済みの学習モデル52を得ることができる。
Further, the learning device 100 further learns the model of the first sub-network 410 in a state where the parameters of the DCNN 411 finely tuned by the training of the second sub-network 420 are fixed, and updates the parameters of the RPN 412. By repeatedly executing such a learning process, the parameters of the learning model 52 can be optimized. In this way, the trained learning model 52 can be obtained.
〔学習装置100を用いた学習方法の例〕
図18は、本実施形態に係る線構造抽出装置50における学習モデル52の学習方法の例を示すフローチャートである。図18に示す処理は、学習装置100として機能する1台又は複数台のコンピュータを用いて構成される計算システムによって実行される。計算システムは、コンピュータ可読媒体に記憶されたプログラムに従って各ステップの処理を実行する。機械学習に使用する計算システムは、線構造抽出装置50を構成する計算システムと同じシステムであってもよいし、異なるシステムであってもよく、また一部の要素を共有するシステムであってもよい。 [Example of learning method using learning device 100]
FIG. 18 is a flowchart showing an example of a learning method of thelearning model 52 in the line structure extraction device 50 according to the present embodiment. The process shown in FIG. 18 is executed by a calculation system configured by using one or a plurality of computers functioning as the learning device 100. The computing system executes the processing of each step according to the program stored in the computer-readable medium. The calculation system used for machine learning may be the same system as the calculation system constituting the line structure extraction device 50, may be a different system, or may be a system that shares some elements. Good.
図18は、本実施形態に係る線構造抽出装置50における学習モデル52の学習方法の例を示すフローチャートである。図18に示す処理は、学習装置100として機能する1台又は複数台のコンピュータを用いて構成される計算システムによって実行される。計算システムは、コンピュータ可読媒体に記憶されたプログラムに従って各ステップの処理を実行する。機械学習に使用する計算システムは、線構造抽出装置50を構成する計算システムと同じシステムであってもよいし、異なるシステムであってもよく、また一部の要素を共有するシステムであってもよい。 [Example of learning method using learning device 100]
FIG. 18 is a flowchart showing an example of a learning method of the
図18のステップS202において、学習装置100は学習モデル52の初期設定を行う。ここでは、図13に示したネットワーク構造を持つ学習モデル52の初期設定を行う。DCNN411、RPN412、及びR-CNN423の各ネットワークのパラメータが初期の値に設定される。パラメータの一部は、事前の学習によって得られている学習済みのパラメータであってもよい。
In step S202 of FIG. 18, the learning device 100 performs the initial setting of the learning model 52. Here, the initial setting of the learning model 52 having the network structure shown in FIG. 13 is performed. The parameters of each network of DCNN411, RPN412, and R-CNN423 are set to the initial values. Some of the parameters may be learned parameters obtained by prior learning.
図18のステップS204において、学習装置100はDCNN411とRPN412とが結合されてなる第1サブネットワーク410のモデルを訓練する。ステップS204により、DCNN411及びRPN412のネットワークのパラメータが更新される。なお、学習装置100は複数の学習データLD(i)を含むミニバッチの単位で学習データを取得することができ、オプティマイザ114はミニバッチの単位でパラメータの更新処理を行うことができる。
In step S204 of FIG. 18, the learning device 100 trains a model of the first subnet network 410 in which DCNN411 and RPN412 are coupled. In step S204, the network parameters of DCNN411 and RPN412 are updated. The learning device 100 can acquire learning data in units of mini-batch including a plurality of learning data LDs (i), and the optimizer 114 can update parameters in units of mini-batch.
その後、ステップS206において、学習装置100は訓練した第1サブネットワーク410を用いて訓練画像から候補領域を生成する。
After that, in step S206, the learning device 100 generates a candidate region from the training image using the trained first subnet network 410.
ステップS208において、学習装置100は訓練した第1サブネットワーク410により生成された候補領域をR-CNN423に入力し、DCNN411とR-CNN423とが結合されてなる第2サブネットワーク420のモデルを訓練する。ステップS208により、DCNN411及びR-CNN423のネットワークのパラメータが更新される。
In step S208, the learning device 100 inputs the candidate region generated by the trained first subnet train 410 into the R-CNN423 and trains a model of the second subnet 420 in which the DCNN411 and the R-CNN423 are coupled. .. In step S208, the network parameters of DCNN411 and R-CNN423 are updated.
ステップS210において、学習装置100は訓練した第2サブネットワーク420のDCNN411を用いて第1サブネットワーク410のRPN412を再度訓練する。
In step S210, the learning device 100 retrains the RPN 412 of the first sub-network 410 using the DCNN 411 of the trained second sub-network 420.
ステップS210の後、学習装置100はステップS206に戻って訓練を繰り返してもよいし、所定の学習終了条件に基づき、図18のフローチャートを終了してもよい。
After step S210, the learning device 100 may return to step S206 to repeat the training, or may end the flowchart of FIG. 18 based on a predetermined learning end condition.
学習終了条件は、誤差の値に基づいて定められていてもよいし、パラメータの更新回数に基づいて定められていてもよい。誤差の値に基づく方法としては、例えば、誤差が規定の範囲内に収束していることを学習終了条件としてよい。更新回数に基づく方法としては、例えば、更新回数が規定回数に到達したことを学習終了条件としてよい。
The learning end condition may be determined based on the error value or may be determined based on the number of parameter updates. As a method based on the error value, for example, the learning end condition may be that the error has converged within a specified range. As a method based on the number of updates, for example, the learning end condition may be that the number of updates reaches the specified number of times.
《3次元画像への適用》
これまで2次元画像を例に説明したが、2次元画像について説明した事項は、3次元画像の処理に拡張して適用することができる。2次元から3次元への拡張に際しての読み替えは、例えば、次のとおりである。 << Application to 3D images >>
Although the two-dimensional image has been described as an example so far, the matters described about the two-dimensional image can be extended and applied to the processing of the three-dimensional image. The replacement of the reading when expanding from two dimensions to three dimensions is as follows, for example.
「画素」は「ボクセル」に読み替えることができる。「矩形」は「直方体」に読み替えることができる。「立方体」は「直方体」の一種として理解することができる。2次元のxy座標は3次元のxyz座標に読み替えることができる。矩形の「アスペクト比」については、直方体の「三辺の比」に読み替えることができる。アンカーは、予め定められた形状及びサイズを持つ基準形状領域と理解でき、3次元画像の場合は、3次元形状の直方体が用いられる。すなわち、2次元画像に対するアンカーの基準形状領域が矩形領域であるのに対し、3次元画像に対するアンカーの基準形状領域は直方体領域である。
"Pixel" can be read as "voxel". "Rectangle" can be read as "square wave". A "cube" can be understood as a kind of "cuboid". The two-dimensional xy coordinates can be read as the three-dimensional xy coordinates. The "aspect ratio" of a rectangle can be read as the "ratio of three sides" of a rectangular parallelepiped. The anchor can be understood as a reference shape region having a predetermined shape and size, and in the case of a three-dimensional image, a rectangular parallelepiped having a three-dimensional shape is used. That is, the reference shape region of the anchor for the two-dimensional image is a rectangular region, whereas the reference shape region of the anchor for the three-dimensional image is a rectangular parallelepiped region.
《コンピュータのハードウェア構成の例》
図19は、コンピュータのハードウェア構成の例を示すブロック図である。コンピュータ800は、パーソナルコンピュータであってもよいし、ワークステーションであってもよく、また、サーバコンピュータであってもよい。コンピュータ800は、既に説明した線構造抽出装置50、学習装置100、及び学習データ保管部150のいずれかの一部又は全部又はこれらの複数の機能を備えた装置として用いることができる。 << Example of computer hardware configuration >>
FIG. 19 is a block diagram showing an example of a computer hardware configuration. Thecomputer 800 may be a personal computer, a workstation, or a server computer. The computer 800 can be used as a device having a part or all of the linear structure extraction device 50, the learning device 100, and the learning data storage unit 150, or a plurality of these functions, which have already been described.
図19は、コンピュータのハードウェア構成の例を示すブロック図である。コンピュータ800は、パーソナルコンピュータであってもよいし、ワークステーションであってもよく、また、サーバコンピュータであってもよい。コンピュータ800は、既に説明した線構造抽出装置50、学習装置100、及び学習データ保管部150のいずれかの一部又は全部又はこれらの複数の機能を備えた装置として用いることができる。 << Example of computer hardware configuration >>
FIG. 19 is a block diagram showing an example of a computer hardware configuration. The
コンピュータ800は、CPU(Central Processing Unit)802、RAM(Random Access Memory)804、ROM(Read Only Memory)806、GPU(Graphics Processing Unit)808、ストレージ810、通信部812、入力装置814、表示装置816及びバス818を備える。なお、GPU(Graphics Processing Unit)808は、必要に応じて設ければよい。
The computer 800 includes a CPU (Central Processing Unit) 802, a RAM (Random Access Memory) 804, a ROM (Read Only Memory) 806, a GPU (Graphics Processing Unit) 808, a storage 810, a communication unit 812, an input device 814, and a display device 816. And a bus 818. The GPU (Graphics Processing Unit) 808 may be provided as needed.
CPU802は、ROM806又はストレージ810等に記憶された各種のプログラムを読み出し、各種の処理を実行する。RAM804は、CPU802の作業領域として使用される。また、RAM804は、読み出されたプログラム及び各種のデータを一時的に記憶する記憶部として用いられる。
The CPU 802 reads various programs stored in the ROM 806, the storage 810, or the like, and executes various processes. The RAM 804 is used as a work area of the CPU 802. Further, the RAM 804 is used as a storage unit for temporarily storing the read program and various data.
ストレージ810は、例えば、ハードディスク装置、光ディスク、光磁気ディスク、若しくは半導体メモリ、又はこれらの適宜の組み合わせを用いて構成される記憶装置を含んで構成される。ストレージ810には、線構造抽出処理及び/又は学習処理等に必要な各種プログラムやデータ等が記憶される。ストレージ810に記憶されているプログラムがRAM804にロードされ、これをCPU802が実行することにより、コンピュータ800は、プログラムで規定される各種の処理を行う手段として機能する。
The storage 810 includes, for example, a hard disk device, an optical disk, a magneto-optical disk, or a semiconductor memory, or a storage device configured by using an appropriate combination thereof. The storage 810 stores various programs, data, and the like necessary for the line structure extraction process and / or the learning process. The program stored in the storage 810 is loaded into the RAM 804, and the CPU 802 executes the program, so that the computer 800 functions as a means for performing various processes specified by the program.
通信部812は、有線又は無線により外部装置との通信処理を行い、外部装置との間で情報のやり取りを行うインターフェースである。通信部812は、画像の入力を受け付ける画像受付部の役割を担うことができる。
The communication unit 812 is an interface that performs communication processing with an external device by wire or wirelessly and exchanges information with the external device. The communication unit 812 can play the role of an image reception unit that receives an image input.
入力装置814は、コンピュータ800に対する各種の操作入力を受け付ける入力インターフェースである。入力装置814は、例えば、キーボード、マウス、タッチパネル、若しくはその他のポインティングデバイス、若しくは、音声入力装置、又はこれらの適宜の組み合わせであってよい。
The input device 814 is an input interface that accepts various operation inputs to the computer 800. The input device 814 may be, for example, a keyboard, mouse, touch panel, or other pointing device, or voice input device, or any combination thereof.
表示装置816は、各種の情報が表示される出力インターフェースである。表示装置816は、例えば、液晶ディスプレイ、有機EL(organic electro-luminescence:OEL)ディスプレイ、若しくは、プロジェクタ、又はこれらの適宜の組み合わせであってよい。
The display device 816 is an output interface that displays various types of information. The display device 816 may be, for example, a liquid crystal display, an organic electro-luminescence (OEL) display, a projector, or an appropriate combination thereof.
《コンピュータを動作させるプログラムについて》
上述の実施形態で説明した線構造抽出機能、及び学習機能のうち少なくとも1つの処理機能の一部又は全部をコンピュータに実現させるプログラムを、光ディスク、磁気ディスク、若しくは、半導体メモリその他の有体物たる非一時的な情報記憶媒体であるコンピュータ可読媒体に記録し、この情報記憶媒体を通じてプログラムを提供することが可能である。 << About the program that operates the computer >>
A non-temporary program such as an optical disk, a magnetic disk, a semiconductor memory, or the like, which realizes a part or all of the processing functions of at least one of the line structure extraction function and the learning function described in the above-described embodiment on a computer. It is possible to record on a computer-readable medium, which is a typical information storage medium, and provide a program through this information storage medium.
またこのような有体物たる非一時的な情報記憶媒体にプログラムを記憶させて提供する態様に代えて、インターネットなどの電気通信回線を利用してプログラム信号をダウンロードサービスとして提供することも可能である。
It is also possible to provide the program signal as a download service using a telecommunication line such as the Internet, instead of the mode in which the program is stored and provided in such a tangible non-temporary information storage medium.
また、上述の各実施形態で説明した線構造抽出機能、及び学習機能のうち少なくとも1つの処理機能の一部又は全部をアプリケーションサーバとして提供し、電気通信回線を通じて処理機能を提供するサービスを行うことも可能である。
In addition, a service that provides a part or all of the line structure extraction function and the learning function described in each of the above-described embodiments as an application server and provides the processing function through a telecommunication line is provided. Is also possible.
《各処理部のハードウェア構成について》
図4の第1のニューラルネットワーク41、DCNN411、RPN412、第2のニューラルネットワーク42、R-CNN423、図17のデータ取得部102、学習モデル52、第1誤差計算部110、第2誤差計算部112、及びオプティマイザ114などの各種の処理を実行する処理部(processing unit)のハードウェア的な構造は、例えば、次に示すような各種のプロセッサ(processor)である。 << About the hardware configuration of each processing unit >>
1stneural network 41, DCNN411, RPN412, 2nd neural network 42, R-CNN423 of FIG. 4, data acquisition unit 102 of FIG. 17, learning model 52, 1st error calculation unit 110, 2nd error calculation unit 112. , And the hardware structure of the processing unit that executes various processes such as the optimizer 114 is, for example, various processors as shown below.
図4の第1のニューラルネットワーク41、DCNN411、RPN412、第2のニューラルネットワーク42、R-CNN423、図17のデータ取得部102、学習モデル52、第1誤差計算部110、第2誤差計算部112、及びオプティマイザ114などの各種の処理を実行する処理部(processing unit)のハードウェア的な構造は、例えば、次に示すような各種のプロセッサ(processor)である。 << About the hardware configuration of each processing unit >>
1st
各種のプロセッサには、プログラムを実行して各種の処理部として機能する汎用的なプロセッサであるCPU、画像処理に特化したプロセッサであるGPU、FPGA(Field Programmable Gate Array)などの製造後に回路構成を変更可能なプロセッサであるプログラマブルロジックデバイス(Programmable Logic Device:PLD)、ASIC(Application Specific Integrated Circuit)などの特定の処理を実行させるために専用に設計された回路構成を有するプロセッサである専用電気回路などが含まれる。
Various processors include a CPU, which is a general-purpose processor that executes programs and functions as various processing units, a GPU, which is a processor specialized in image processing, and an FPGA (Field Programmable Gate Array) circuit configuration after manufacturing. A dedicated electric circuit that is a processor with a circuit configuration specially designed to execute a specific process such as a programmable logic device (PLD) or ASIC (Application Specific Integrated Circuit), which is a processor that can change the CPU. Etc. are included.
1つの処理部は、これら各種のプロセッサのうちの1つで構成されていてもよいし、同種又は異種の2つ以上のプロセッサで構成されてもよい。例えば、1つの処理部は、複数のFPGA、或いは、CPUとFPGAの組み合わせ、又はCPUとGPUの組み合わせによって構成されてもよい。また、複数の処理部を1つのプロセッサで構成してもよい。複数の処理部を1つのプロセッサで構成する例としては、第一に、クライアントやサーバなどのコンピュータに代表されるように、1つ以上のCPUとソフトウェアの組み合わせで1つのプロセッサを構成し、このプロセッサが複数の処理部として機能する形態がある。第二に、システムオンチップ(System On Chip:SoC)などに代表されるように、複数の処理部を含むシステム全体の機能を1つのIC(Integrated Circuit)チップで実現するプロセッサを使用する形態がある。このように、各種の処理部は、ハードウェア的な構造として、上記各種のプロセッサを1つ以上用いて構成される。
One processing unit may be composed of one of these various processors, or may be composed of two or more processors of the same type or different types. For example, one processing unit may be composed of a plurality of FPGAs, a combination of a CPU and an FPGA, or a combination of a CPU and a GPU. Further, a plurality of processing units may be configured by one processor. As an example of configuring a plurality of processing units with one processor, first, one processor is configured by a combination of one or more CPUs and software, as represented by a computer such as a client or a server. There is a form in which a processor functions as a plurality of processing units. Secondly, as typified by System On Chip (SoC), there is a form that uses a processor that realizes the functions of the entire system including multiple processing units with one IC (Integrated Circuit) chip. is there. As described above, the various processing units are configured by using one or more of the above-mentioned various processors as a hardware-like structure.
さらに、これらの各種のプロセッサのハードウェア的な構造は、より具体的には、半導体素子などの回路素子を組み合わせた電気回路(circuitry)である。
Furthermore, the hardware structure of these various processors is, more specifically, an electric circuit (circuitry) that combines circuit elements such as semiconductor elements.
《実施形態による効果》
(1)本実施形態によれば、画像中から線構造を抽出することができる。 << Effect of the embodiment >>
(1) According to the present embodiment, the line structure can be extracted from the image.
(1)本実施形態によれば、画像中から線構造を抽出することができる。 << Effect of the embodiment >>
(1) According to the present embodiment, the line structure can be extracted from the image.
(2)本実施形態によれば、線構造の要素点を直接検出するため、グラフ構造の再構成が容易である。
(2) According to the present embodiment, since the element points of the line structure are directly detected, the graph structure can be easily reconstructed.
(3)本実施形態によれば、各訓練画像に対する正解が中心線の位置情報を示すデータによって定義されるため、学習データの作成が容易である。
(3) According to the present embodiment, since the correct answer for each training image is defined by the data indicating the position information of the center line, it is easy to create the learning data.
《他の応用例》
本開示による線構造抽出処理の技術は、CT画像に限らず、各種の3次元断層画像に適用することができる。例えば、MRI(Magnetic Resonance Imaging)装置により取得されるMR画像、PET(Positron Emission Tomography)装置により取得されるPET画像、OCT(Optical Coherence Tomography)装置により取得されるOCT画像、3次元超音波撮影装置により取得される3次元超音波画像等であってもよい。 << Other application examples >>
The technique of line structure extraction processing according to the present disclosure can be applied not only to CT images but also to various three-dimensional tomographic images. For example, an MR image acquired by an MRI (Magnetic Resonance Imaging) apparatus, a PET image acquired by a PET (Positron Emission Tomography) apparatus, an OCT image acquired by an OCT (Optical Coherence Tomography) apparatus, and a three-dimensional ultrasonic imaging apparatus. It may be a three-dimensional ultrasonic image or the like acquired by.
また、本開示による線構造抽出処理の技術は、3次元断層画像に限らず、各種の2次元画像に適用することができる。例えば、処理の対象とする画像は、2次元のX線画像であってもよい。また、本開示による線構造抽出処理の技術は、医療画像に限定されず、通常のカメラ画像など、様々な画像について適用することができる。例えば、非特許文献2で扱っているような建造物等の画像からクラックを検出する場合に、本開示の技術を適用することができる。
Further, the technique of line structure extraction processing according to the present disclosure can be applied not only to three-dimensional tomographic images but also to various two-dimensional images. For example, the image to be processed may be a two-dimensional X-ray image. Further, the technique of line structure extraction processing according to the present disclosure is not limited to medical images, and can be applied to various images such as ordinary camera images. For example, the technique of the present disclosure can be applied when cracks are detected from an image of a building or the like as dealt with in Non-Patent Document 2.
《変形例》
[1]検出しようとする対象物の形及び/又は大きさによっては、アンカーの種類は1種類であってもよい。 << Modification example >>
[1] There may be one type of anchor depending on the shape and / or size of the object to be detected.
[1]検出しようとする対象物の形及び/又は大きさによっては、アンカーの種類は1種類であってもよい。 << Modification example >>
[1] There may be one type of anchor depending on the shape and / or size of the object to be detected.
[2]対象物の大きさを問題にしない場合など、RPN412においてアンカーの変形倍率の計算を実施しない形態も可能である。
[2] It is also possible to use RPN412 without calculating the deformation magnification of the anchor, such as when the size of the object does not matter.
《その他》
上述の実施形態で説明した構成や変形例で説明した事項は、適宜組み合わせて用いることができ、また、一部の事項を置き換えることもできる。本発明は上述した実施形態に限定されず、本発明の精神を逸脱しない範囲で種々の変形が可能であることは言うまでもない。 << Other >>
The items described in the configuration and the modification described in the above-described embodiment can be used in combination as appropriate, and some items can be replaced. It goes without saying that the present invention is not limited to the above-described embodiment, and various modifications can be made without departing from the spirit of the present invention.
40 Faster R-CNN
41 第1のニューラルネットワーク
42 第2のニューラルネットワーク
50 線構造抽出装置
52 学習モデル
71 第1のアンカー
72 第2のアンカー
81、82、83 アンカー
100 学習装置
102 データ取得部
110 第1誤差計算部
112 第2誤差計算部
114 オプティマイザ
150 学習データ保管部
410 第1サブネットワーク
411 DCNN
412 RPN
414、416、417、418 畳み込み層
420 第2サブネットワーク
423 R-CNN
424 ROIプーリング層
426、427 全結合層
428 ソフトマックス層
800 コンピュータ
810 ストレージ
812 通信部
814 入力装置
816 表示装置
818 バス
A1、A2、A3 アンカー
BV 血管
Car 冠動脈経路
CLbv 中心線
CP、CP34 中心座標
NP、NP34 最近点
Nd ノード
Eg エッジ
HVR1 画像
HVR2 画像
IMipt 入力画像
FM 特徴マップ
RP 候補領域
LD(i) 学習データ
PLQ プラーク
px 画素
pxfm 画素
u ユニット
S50~S58 線構造抽出処理のステップ
S61~S67 候補領域生成処理のステップ
S202~S210 学習処理のステップ 40 Faster R-CNN
41 Firstneural network 42 Second neural network 50 Line structure extraction device 52 Learning model 71 First anchor 72 Second anchor 81, 82, 83 Anchor 100 Learning device 102 Data acquisition unit 110 First error calculation unit 112 2nd error calculation unit 114 Optimizer 150 Learning data storage unit 410 1st subnetwork 411 DCNN
412 RPN
414, 416, 417, 418Convolutional layer 420 Second subnetwork 423 R-CNN
424 ROI pooling layer 426, 427 fully connected layer 428 softmax layer 800 computer 810 storage 812 communication unit 814 input device 816 display device 818 bus A1, A2, A3 anchor BV vascular Car coronary artery route CLbv center line CP, CP34 center coordinates NP, NP34 Recent point Nd Node Eg Edge HVR1 Image HVR2 Image IMipt Input image FM Feature map RP Candidate area LD (i) Learning data PLQ plaque px pixel pxfm pixel u unit S50 to S58 Line structure extraction process steps S61 to S67 Candidate area generation process Steps S202 to S210 Learning processing steps
41 第1のニューラルネットワーク
42 第2のニューラルネットワーク
50 線構造抽出装置
52 学習モデル
71 第1のアンカー
72 第2のアンカー
81、82、83 アンカー
100 学習装置
102 データ取得部
110 第1誤差計算部
112 第2誤差計算部
114 オプティマイザ
150 学習データ保管部
410 第1サブネットワーク
411 DCNN
412 RPN
414、416、417、418 畳み込み層
420 第2サブネットワーク
423 R-CNN
424 ROIプーリング層
426、427 全結合層
428 ソフトマックス層
800 コンピュータ
810 ストレージ
812 通信部
814 入力装置
816 表示装置
818 バス
A1、A2、A3 アンカー
BV 血管
Car 冠動脈経路
CLbv 中心線
CP、CP34 中心座標
NP、NP34 最近点
Nd ノード
Eg エッジ
HVR1 画像
HVR2 画像
IMipt 入力画像
FM 特徴マップ
RP 候補領域
LD(i) 学習データ
PLQ プラーク
px 画素
pxfm 画素
u ユニット
S50~S58 線構造抽出処理のステップ
S61~S67 候補領域生成処理のステップ
S202~S210 学習処理のステップ 40 Faster R-CNN
41 First
412 RPN
414, 416, 417, 418
424
Claims (22)
- 画像から線構造を構成する要素点を抽出する線構造抽出装置であって、
前記画像の入力を受けて前記画像から線構造を構成する1つ以上の要素点を予測結果として出力するよう学習された学習モデルを備え、
前記学習モデルは、
前記画像を受け入れて畳み込みの処理により前記画像の特徴量を示す特徴マップを生成する第1の処理モジュールと、
前記特徴マップをグリッド状に既定サイズの領域を持つ複数のユニットに分割して得られる前記ユニットごとに、ユニット中心点から最も近くにある前記線構造の前記要素点への前記ユニット中心点からのシフト量を計算する第2の処理モジュールと、
を含む線構造抽出装置。 A line structure extractor that extracts element points that make up a line structure from an image.
It is provided with a learning model trained to receive input of the image and output one or more element points constituting a line structure from the image as a prediction result.
The learning model is
A first processing module that accepts the image and generates a feature map showing the feature amount of the image by the convolution process.
From the unit center point to the element point of the line structure closest to the unit center point for each of the units obtained by dividing the feature map into a plurality of units having a predetermined size area in a grid pattern. A second processing module that calculates the shift amount,
Line structure extractor including. - 前記第2の処理モジュールは、
前記ユニットの各々に対して、予め定められた形状及びサイズを持つ1つ以上の基準形状領域であるアンカーを配置し、
前記ユニットごとに前記ユニットの位置の前記特徴量を用いて畳み込みの処理を行うことにより、前記アンカーのアンカー中心点から最も近くにある前記線構造の前記要素点である最近点に前記アンカー中心点を移動させるための前記シフト量と、前記アンカー内に前記線構造が存在するか否かを判別するためのスコアと、を計算する、
請求項1に記載の線構造抽出装置。 The second processing module is
For each of the units, an anchor, which is one or more reference shape regions having a predetermined shape and size, is placed.
By performing the convolution process for each unit using the feature amount at the position of the unit, the anchor center point becomes the nearest point which is the element point of the line structure closest to the anchor center point of the anchor. The shift amount for moving and the score for determining whether or not the line structure exists in the anchor are calculated.
The linear structure extraction device according to claim 1. - 前記基準形状領域は、前記画像が2次元画像である場合は矩形領域であり、前記画像が3次元画像である場合は直方体領域である、
請求項2に記載の線構造抽出装置。 The reference shape region is a rectangular region when the image is a two-dimensional image, and a rectangular parallelepiped region when the image is a three-dimensional image.
The linear structure extraction device according to claim 2. - 前記線構造は、前記画像内において太さを持つ領域の代表線であり、
前記太さを持つ領域の太さに対応させて、サイズが異なる複数のアンカーが用いられる、請求項2又は3に記載の線構造抽出装置。 The line structure is a representative line of a region having a thickness in the image.
The linear structure extraction device according to claim 2 or 3, wherein a plurality of anchors having different sizes are used according to the thickness of the region having the thickness. - 前記線構造は、前記画像内において太さを持つ領域の代表線であり、
前記第2の処理モジュールは、対象とする前記太さを持つ領域の太さに応じて前記アンカーのサイズを変更するように学習されたものである、
請求項2から4のいずれか一項に記載の線構造抽出装置。 The line structure is a representative line of a region having a thickness in the image.
The second processing module has been learned to change the size of the anchor according to the thickness of the region having the thickness of interest.
The linear structure extraction device according to any one of claims 2 to 4. - 前記線構造は、前記画像内において太さを持つ領域の代表線であり、
前記第2の処理モジュールは、前記アンカーごとに、前記太さを持つ領域の前記最近点の周囲の太さに合わせて前記アンカーの少なくとも1つの辺の方向についての前記アンカーの変形倍率を計算するように学習されたものである、
請求項2から5のいずれか一項に記載の線構造抽出装置。 The line structure is a representative line of a region having a thickness in the image.
The second processing module calculates, for each anchor, the deformation magnification of the anchor in the direction of at least one side of the anchor according to the thickness around the nearest point of the region having the thickness. Was learned as
The linear structure extraction device according to any one of claims 2 to 5. - 前記太さを持つ領域は管状構造物であり、
前記代表線は、前記管状構造物の経路に沿った中心線である、
請求項4から6のいずれか一項に記載の線構造抽出装置。 The region having the thickness is a tubular structure and
The representative line is a center line along the path of the tubular structure.
The linear structure extraction device according to any one of claims 4 to 6. - 前記第1の処理モジュール及び前記第2の処理モジュールの各々はニューラルネットワークによって構成されており、
前記第1の処理モジュールは、複数の畳み込み層を備える畳み込みニューラルネットワークによって構成され、
前記第2の処理モジュールは、前記第1の処理モジュールとは異なる畳み込み層を備え、
前記特徴マップから前記線構造が含まれる候補領域を予測する領域提案ネットワークによって構成される、請求項1から7のいずれか一項に記載の線構造抽出装置。 Each of the first processing module and the second processing module is composed of a neural network.
The first processing module is composed of a convolutional neural network including a plurality of convolutional layers.
The second processing module includes a convolution layer different from that of the first processing module.
The line structure extraction device according to any one of claims 1 to 7, which is configured by an area proposal network that predicts a candidate area including the line structure from the feature map. - 前記第2の処理モジュールによって予測された前記線構造の前記要素点に対し、各点をクラス分類するよう学習された第3の処理モジュールをさらに備える、請求項1から8のいずれか一項に記載の線構造抽出装置。 The item according to any one of claims 1 to 8, further comprising a third processing module learned to classify each point with respect to the element point of the line structure predicted by the second processing module. The line structure extractor described.
- 前記第3の処理モジュールにより分類されるクラスは、グラフ理論の木構造における根、分岐、末端、及び枝上の点のうち少なくとも1つを含む、
請求項9に記載の線構造抽出装置。 The class classified by the third processing module comprises at least one of the roots, branches, ends, and points on the branches in the tree structure of graph theory.
The linear structure extraction device according to claim 9. - 前記線構造は、血管の経路に沿った中心線であり、
前記第3の処理モジュールにより分類されるクラスは、血管構造における特定の解剖学的名称を含む、
請求項9に記載の線構造抽出装置。 The line structure is a center line along the path of blood vessels.
The classes classified by the third processing module include specific anatomical names in the vascular structure.
The linear structure extraction device according to claim 9. - 前記線構造は、気管の経路に沿った中心線であり、
前記第3の処理モジュールにより分類されるクラスは、気管構造における特定の解剖学的名称を含む、
請求項9に記載の線構造抽出装置。 The line structure is a center line along the path of the trachea.
The classes classified by the third processing module include specific anatomical names in the tracheal structure.
The linear structure extraction device according to claim 9. - 前記第3の処理モジュールは、ニューラルネットワークによって構成されており、
前記第3の処理モジュールは、
前記特徴マップから、前記第2の処理モジュールによって予測された前記要素点を含む前記アンカーの局所画像を切り出して前記局所画像を固定サイズに変形する関心領域プーリング層と、
前記固定サイズに変形された前記局所画像が入力される畳み込み層及び全結合層のうち少なくとも一方と、
を含む、請求項9から12のいずれか一項に記載の線構造抽出装置。 The third processing module is composed of a neural network.
The third processing module is
A region of interest pooling layer that cuts out a local image of the anchor including the element points predicted by the second processing module from the feature map and transforms the local image to a fixed size.
At least one of the convolution layer and the fully connected layer into which the local image transformed into the fixed size is input,
The linear structure extraction apparatus according to any one of claims 9 to 12, comprising the above. - 画像から線構造を構成する要素点を抽出する線構造抽出方法であって、
前記画像の入力を受けて前記画像から線構造を構成する1つ以上の要素点を予測結果として出力するよう学習された学習モデルを用い、
前記学習モデルへの前記画像の入力を受け付けることと、
入力された前記画像について第1の処理モジュールにより畳み込みの処理を行い、前記画像の特徴量を示す特徴マップを生成することと、
前記特徴マップをグリッド状に既定サイズの領域を持つ複数のユニットに分割し、第2の処理モジュールを用いて、前記ユニットごとにユニット中心点から最も近くにある前記線構造の前記要素点への前記ユニット中心点からのシフト量を計算することと、
を含む線構造抽出方法。 A line structure extraction method that extracts element points that make up a line structure from an image.
Using a learning model trained to receive the input of the image and output one or more element points constituting the line structure from the image as a prediction result,
Accepting the input of the image into the learning model
Convolution processing is performed on the input image by the first processing module to generate a feature map showing the feature amount of the image.
The feature map is divided into a plurality of units having a predetermined size area in a grid shape, and a second processing module is used for each unit to the element point of the line structure closest to the unit center point. To calculate the shift amount from the unit center point and
Line structure extraction method including. - 前記複数のユニットによって予測された複数の前記要素点の点群のうち、前記ユニットのサイズの半分を目安とする第1の間隔よりも近接している過剰な前記要素点の一部を削除して、前記第1の間隔の程度で前記要素点を選択して残すこと、をさらに含む、
請求項14に記載の線構造抽出方法。 Of the point cloud of the plurality of element points predicted by the plurality of units, a part of the excess element points closer than the first interval with half the size of the unit as a guide is deleted. Further including selecting and leaving the element points at the degree of the first interval.
The line structure extraction method according to claim 14. - 前記線構造は、前記画像内において太さを持つ領域の代表線であり、
前記複数のユニットによって予測された複数の前記要素点の点群のうち、前記太さの半分を目安とする第2の間隔よりも近接している過剰な前記要素点の一部を削除して、前記第2の間隔の程度で前記要素点を選択して残すこと、をさらに含む、
請求項14に記載の線構造抽出方法。 The line structure is a representative line of a region having a thickness in the image.
Of the point cloud of the plurality of element points predicted by the plurality of units, a part of the excess element points closer than the second interval with half the thickness as a guide is deleted. Further includes selecting and leaving the element points at the degree of the second interval.
The line structure extraction method according to claim 14. - 前記複数のユニットによって予測された複数の前記要素点の点群のうち、予め定めた閾値以内の距離に他の点が存在しない孤立点を削除すること、をさらに含む、
請求項14から16のいずれか一項に記載の線構造抽出方法。 Further including deleting an isolated point in which no other point exists within a distance within a predetermined threshold value from the point cloud of the plurality of element points predicted by the plurality of units.
The line structure extraction method according to any one of claims 14 to 16. - 画像から線構造を構成する要素点を抽出する機能をコンピュータに実現させるためのプログラムであって、
前記画像の入力を受け付ける機能と、
入力された前記画像について第1の処理モジュールを用いて畳み込みの処理を行い、前記画像の特徴量を示す特徴マップを生成する機能と、
前記特徴マップをグリッド状に既定サイズの領域を持つ複数のユニットに分割し、第2の処理モジュールを用いて、前記ユニットごとに前記ユニットの中心点から最も近くにある前記線構造の前記要素点へのシフト量を予測する機能と、
をコンピュータに実現させるプログラム。 It is a program for realizing a computer with a function of extracting element points constituting a line structure from an image.
The function to accept the input of the image and
A function of performing convolution processing on the input image using the first processing module and generating a feature map showing the feature amount of the image, and
The feature map is divided into a plurality of units having a predetermined size area in a grid shape, and the element points of the line structure closest to the center point of the units for each unit are used by using a second processing module. A function to predict the amount of shift to
A program that makes a computer realize. - 非一時的かつコンピュータ読取可能な記録媒体であって、前記記録媒体に格納された指令がコンピュータによって読み取られた場合に請求項18に記載のプログラムをコンピュータに実行させる記録媒体。 A recording medium that is non-temporary and computer-readable, and causes the computer to execute the program according to claim 18 when a command stored in the recording medium is read by the computer.
- 入力された画像から線構造を構成する1つ以上の要素点を予測結果として出力するよう学習された学習済みモデルであって、
前記画像を受け入れて畳み込みの処理により前記画像の特徴量を示す特徴マップを生成する第1の処理モジュールと、
前記特徴マップをグリッド状に既定サイズの領域を持つ複数のユニットに分割して得られる前記ユニットごとに、ユニット中心点から最も近くにある前記線構造の前記要素点への前記ユニット中心点からのシフト量を計算する第2の処理モジュールと、
を含む学習済みモデル。 A trained model trained to output one or more element points that make up a line structure from an input image as prediction results.
A first processing module that accepts the image and generates a feature map showing the feature amount of the image by the convolution process.
From the unit center point to the element point of the line structure closest to the unit center point for each of the units obtained by dividing the feature map into a plurality of units having a predetermined size area in a grid pattern. A second processing module that calculates the shift amount,
Trained model including. - 前記第1の処理モジュール及び前記第2の処理モジュールを構成しているネットワークのパラメータは、訓練画像と、前記訓練画像に含まれている線構造の位置情報と、を組み合わせた複数の学習データを用いた機械学習を実行することによって決定されている、請求項20に記載の学習済みモデル。 The parameters of the network constituting the first processing module and the second processing module include a plurality of learning data in which the training image and the position information of the line structure included in the training image are combined. The trained model of claim 20, which is determined by performing machine learning using.
- 前記線構造は、前記画像内において太さを持つ領域の代表線であり、
前記学習データは、前記訓練画像に含まれている前記太さを持つ領域の太さ情報をさらに含む、請求項21に記載の学習済みモデル。 The line structure is a representative line of a region having a thickness in the image.
The trained model according to claim 21, wherein the training data further includes thickness information of a region having the thickness included in the training image.
Priority Applications (3)
| Application Number | Priority Date | Filing Date | Title |
|---|---|---|---|
| JP2021511869A JP7187680B2 (en) | 2019-03-29 | 2020-03-25 | LINE STRUCTURE EXTRACTION APPARATUS AND METHOD, PROGRAM AND TRAINED MODEL |
| EP20784538.9A EP3951433A4 (en) | 2019-03-29 | 2020-03-25 | Line structure extraction device, method and program, and learned model |
| US17/477,547 US11961276B2 (en) | 2019-03-29 | 2021-09-17 | Linear structure extraction device, method, program, and learned model |
Applications Claiming Priority (2)
| Application Number | Priority Date | Filing Date | Title |
|---|---|---|---|
| JP2019-066982 | 2019-03-29 | ||
| JP2019066982 | 2019-03-29 |
Related Child Applications (1)
| Application Number | Title | Priority Date | Filing Date |
|---|---|---|---|
| US17/477,547 Continuation US11961276B2 (en) | 2019-03-29 | 2021-09-17 | Linear structure extraction device, method, program, and learned model |
Publications (1)
| Publication Number | Publication Date |
|---|---|
| WO2020203552A1 true WO2020203552A1 (en) | 2020-10-08 |
Family
ID=72668274
Family Applications (1)
| Application Number | Title | Priority Date | Filing Date |
|---|---|---|---|
| PCT/JP2020/013334 WO2020203552A1 (en) | 2019-03-29 | 2020-03-25 | Line structure extraction device, method and program, and learned model |
Country Status (4)
| Country | Link |
|---|---|
| US (1) | US11961276B2 (en) |
| EP (1) | EP3951433A4 (en) |
| JP (1) | JP7187680B2 (en) |
| WO (1) | WO2020203552A1 (en) |
Cited By (1)
| Publication number | Priority date | Publication date | Assignee | Title |
|---|---|---|---|---|
| WO2023032480A1 (en) * | 2021-08-31 | 2023-03-09 | 富士フイルム株式会社 | Medical image processing device, liver segment division method and program |
Families Citing this family (1)
| Publication number | Priority date | Publication date | Assignee | Title |
|---|---|---|---|---|
| CN114926753B (en) * | 2022-06-16 | 2023-10-13 | 无锡慧眼人工智能科技有限公司 | Rapid target scene information extraction method under condition of massive images |
Citations (4)
| Publication number | Priority date | Publication date | Assignee | Title |
|---|---|---|---|---|
| US9858496B2 (en) | 2016-01-20 | 2018-01-02 | Microsoft Technology Licensing, Llc | Object detection and classification in images |
| JP2018534694A (en) * | 2015-11-04 | 2018-11-22 | エヌイーシー ラボラトリーズ アメリカ インクNEC Laboratories America, Inc. | Convolutional neural network with subcategory recognition for object detection |
| JP2019500110A (en) * | 2015-12-18 | 2019-01-10 | ザ リージェンツ オブ ザ ユニバーシティ オブ カリフォルニア | Interpretation and quantification of urgency features in head computed tomography |
| US10198671B1 (en) * | 2016-11-10 | 2019-02-05 | Snap Inc. | Dense captioning with joint interference and visual context |
Family Cites Families (3)
| Publication number | Priority date | Publication date | Assignee | Title |
|---|---|---|---|---|
| US10206646B2 (en) * | 2016-03-10 | 2019-02-19 | Siemens Healthcare Gmbh | Method and system for extracting centerline representation of vascular structures in medical images via optimal paths in computational flow fields |
| CA3056498A1 (en) * | 2017-03-14 | 2018-09-20 | University Of Manitoba | Structure defect detection using machine learning algorithms |
| US10685438B2 (en) * | 2017-07-17 | 2020-06-16 | Siemens Healthcare Gmbh | Automated measurement based on deep learning |
-
2020
- 2020-03-25 EP EP20784538.9A patent/EP3951433A4/en active Pending
- 2020-03-25 JP JP2021511869A patent/JP7187680B2/en active Active
- 2020-03-25 WO PCT/JP2020/013334 patent/WO2020203552A1/en unknown
-
2021
- 2021-09-17 US US17/477,547 patent/US11961276B2/en active Active
Patent Citations (4)
| Publication number | Priority date | Publication date | Assignee | Title |
|---|---|---|---|---|
| JP2018534694A (en) * | 2015-11-04 | 2018-11-22 | エヌイーシー ラボラトリーズ アメリカ インクNEC Laboratories America, Inc. | Convolutional neural network with subcategory recognition for object detection |
| JP2019500110A (en) * | 2015-12-18 | 2019-01-10 | ザ リージェンツ オブ ザ ユニバーシティ オブ カリフォルニア | Interpretation and quantification of urgency features in head computed tomography |
| US9858496B2 (en) | 2016-01-20 | 2018-01-02 | Microsoft Technology Licensing, Llc | Object detection and classification in images |
| US10198671B1 (en) * | 2016-11-10 | 2019-02-05 | Snap Inc. | Dense captioning with joint interference and visual context |
Non-Patent Citations (2)
| Title |
|---|
| REN, SHAOQING ET AL.: "Faster R-CNN: Towards real-time object detection with region proposal networks", ADVANCES IN NEURAL INFORMATION PROCESSING SYSTEMS, 2015 |
| See also references of EP3951433A4 |
Cited By (1)
| Publication number | Priority date | Publication date | Assignee | Title |
|---|---|---|---|---|
| WO2023032480A1 (en) * | 2021-08-31 | 2023-03-09 | 富士フイルム株式会社 | Medical image processing device, liver segment division method and program |
Also Published As
| Publication number | Publication date |
|---|---|
| JP7187680B2 (en) | 2022-12-12 |
| EP3951433A4 (en) | 2022-05-25 |
| EP3951433A1 (en) | 2022-02-09 |
| US20220004797A1 (en) | 2022-01-06 |
| JPWO2020203552A1 (en) | 2020-10-08 |
| US11961276B2 (en) | 2024-04-16 |
Similar Documents
| Publication | Publication Date | Title |
|---|---|---|
| US11816837B2 (en) | Vascular characteristic determination with correspondence modeling of a vascular tree | |
| EP2194505B1 (en) | Method and apparatus for segmenting spine and aorta in a medical image according to a skeletal atlas | |
| Chen et al. | Curve-like structure extraction using minimal path propagation with backtracking | |
| Li et al. | Optimal surface segmentation in volumetric images-a graph-theoretic approach | |
| JP5701138B2 (en) | Medical image processing apparatus and method, and program | |
| US7379062B2 (en) | Method for determining a path along a biological object with a lumen | |
| US8953856B2 (en) | Method and system for registering a medical image | |
| JP5643304B2 (en) | Computer-aided lung nodule detection system and method and chest image segmentation system and method in chest tomosynthesis imaging | |
| US20070109299A1 (en) | Surface-based characteristic path generation | |
| JP2007289704A (en) | System and method for semi-automatic aortic aneurysm analysis | |
| US11961276B2 (en) | Linear structure extraction device, method, program, and learned model | |
| CN112862833A (en) | Blood vessel segmentation method, electronic device and storage medium | |
| JP2009045286A (en) | Medical image processor, medical image diagnostic apparatus, and program | |
| JP7456928B2 (en) | Abnormal display control method of chest X-ray image, abnormal display control program, abnormal display control device, and server device | |
| WO2022163513A1 (en) | Learned model generation method, machine learning system, program, and medical image processing device | |
| Jia et al. | Stacom-slawt challenge: left atrial wall segmentation and thickness measurement using region growing and marker-controlled geodesic active contour | |
| CN113744215A (en) | Method and device for extracting center line of tree-shaped lumen structure in three-dimensional tomography image | |
| JP5992853B2 (en) | Surgery support apparatus, method and program | |
| Gómez Betancur et al. | Airway segmentation, skeletonization, and tree matching to improve registration of 3D CT images with large opacities in the lungs | |
| JP2004174219A (en) | Apparatus and method for processing image and recording medium for storing program used for causing computer to execute the method | |
| Zhu et al. | Monte Carlo tree search for 3D/2D registration of vessel graphs | |
| JP2020018851A (en) | Ultrasonic diagnostic apparatus, image processing apparatus and image processing method | |
| Sabrowsky-Hirsch et al. | A content-driven architecture for medical image segmentation | |
| WO2023032480A1 (en) | Medical image processing device, liver segment division method and program | |
| JP6970783B2 (en) | Systems and methods for characterizing the central axis of bone from 3D anatomical images |
Legal Events
| Date | Code | Title | Description |
|---|---|---|---|
| 121 | Ep: the epo has been informed by wipo that ep was designated in this application |
Ref document number: 20784538 Country of ref document: EP Kind code of ref document: A1 |
|
| ENP | Entry into the national phase |
Ref document number: 2021511869 Country of ref document: JP Kind code of ref document: A |
|
| NENP | Non-entry into the national phase |
Ref country code: DE |
|
| ENP | Entry into the national phase |
Ref document number: 2020784538 Country of ref document: EP Effective date: 20211029 |