WO2020189660A1 - 測色方法、測色システム、測色プログラム、及び、測色用色票 - Google Patents
測色方法、測色システム、測色プログラム、及び、測色用色票 Download PDFInfo
- Publication number
- WO2020189660A1 WO2020189660A1 PCT/JP2020/011626 JP2020011626W WO2020189660A1 WO 2020189660 A1 WO2020189660 A1 WO 2020189660A1 JP 2020011626 W JP2020011626 W JP 2020011626W WO 2020189660 A1 WO2020189660 A1 WO 2020189660A1
- Authority
- WO
- WIPO (PCT)
- Prior art keywords
- color
- value
- measurement
- measurement target
- sample
- Prior art date
- Legal status (The legal status is an assumption and is not a legal conclusion. Google has not performed a legal analysis and makes no representation as to the accuracy of the status listed.)
- Ceased
Links
Images


Classifications
-
- G—PHYSICS
- G01—MEASURING; TESTING
- G01J—MEASUREMENT OF INTENSITY, VELOCITY, SPECTRAL CONTENT, POLARISATION, PHASE OR PULSE CHARACTERISTICS OF INFRARED, VISIBLE OR ULTRAVIOLET LIGHT; COLORIMETRY; RADIATION PYROMETRY
- G01J3/00—Spectrometry; Spectrophotometry; Monochromators; Measuring colours
- G01J3/46—Measurement of colour; Colour measuring devices, e.g. colorimeters
- G01J3/52—Measurement of colour; Colour measuring devices, e.g. colorimeters using colour charts
-
- G—PHYSICS
- G06—COMPUTING OR CALCULATING; COUNTING
- G06T—IMAGE DATA PROCESSING OR GENERATION, IN GENERAL
- G06T7/00—Image analysis
- G06T7/90—Determination of colour characteristics
-
- H—ELECTRICITY
- H04—ELECTRIC COMMUNICATION TECHNIQUE
- H04N—PICTORIAL COMMUNICATION, e.g. TELEVISION
- H04N17/00—Diagnosis, testing or measuring for television systems or their details
- H04N17/02—Diagnosis, testing or measuring for television systems or their details for colour television signals
Definitions
- the present invention relates to a color measurement method for measuring a color to be measured, a color measurement system, a color measurement program, and a color chart for color measurement.
- Color measurement is performed for various purposes in many fields such as color management of building materials, chemical products, paper products, textiles, etc., inspection of paints and inks, calibration of printing machines, food inspection, skin analysis, etc. ..
- a color measuring method a method using a dedicated color measuring device such as a spectrophotometer or a color difference meter for measuring the intensity of the spectral spectrum of the measurement target, or a method of visually checking the measurement target and a color sample (color patch). A method of comparison is known.
- the dedicated color measuring device When a dedicated color measuring device is used, it is possible to measure color measurement values in various color spaces such as XYZ and L * a * b * with high accuracy under predetermined light source conditions.
- the dedicated color measuring device has problems that it is expensive, inconvenient to carry, and difficult to measure in a non-contact manner.
- RGB data is acquired by measuring a reference color tag in advance and simultaneously or separately photographing a subject including the reference color tag and the color subject to be measured, and among the acquired RGB data.
- the RGB data of the reference color sheet and the RGB data of the object to be measured are extracted from, and the difference between the RGB data of the extracted standard color sheet and the RGB data of the reference color sheet obtained by measuring the color in advance is obtained.
- a color measurement method for correcting RGB data of a color to be measured using a difference is disclosed.
- Patent Document 2 the values of each of the plurality of sample colors arranged on the color chart are measured by the color measuring device, the color chart and the measurement target are imaged at once by the imaging device, and the measurement is performed by the color measuring device. Based on the respective values of the plurality of sample colors and the respective values of the plurality of sample colors included in the image data representing the image captured by the imaging device, the value of the color to be measured indicated by the image data is determined. , A color identification method for converting into an estimated value of a color value of a measurement target to be identified when measured by a color measuring device is disclosed.
- the original color of the measurement target that is, spectrophotometry
- the original color of the measurement target depends on the type of illumination, brightness, imaging environment such as sun and shade, and the characteristics of the camera.
- the measurement target and the color sample whose absolute color measurement value (true value) is known are imaged under the same conditions, and the color measurement value (true value) of the color sample is taken.
- the color of the measurement target is estimated by correcting the value of the color of the measurement target in the image by using the correlation between the value) and the color value of the color sample in the image.
- the present invention has been made in view of the above, and is a robust color measurement method in which the color estimation accuracy is less likely to fluctuate in a color measurement method based on image data obtained by imaging a measurement target with a camera. It is an object of the present invention to provide a color measurement system, a color measurement program, and a color measurement slip used in the color measurement method.
- the color measurement method is a color measurement method for measuring the color of a measurement target, and a color sample reference value which is a value representing the color is known.
- a color sample actual measurement value which is a value representing a color in the image of the two or more color samples based on image data of two or more color samples having different color sample reference values and an image of the measurement target.
- a measurement value acquisition step for acquiring a measurement target actual measurement value which is a value representing a color in the image of the measurement target, and a reference value acquisition step for acquiring a color sample reference value of the two or more color samples.
- the correlation acquisition step of acquiring the correlation between the measured color sample values of the two or more color samples and the color sample reference value according to the color range to which the color to be measured belongs, and the above-mentioned It includes a correction step of calculating a measurement target estimated value which is an estimated value of the color of the measurement target by correcting the measurement target actual measurement value using the correlation acquired in the correlation acquisition step.
- the two or more color samples are preset according to the color gamut of the measurement target, and the correlation acquisition step is selected in advance according to the color gamut of the measurement target.
- the correlation may be acquired in the color space, and the correction step may correct the measured value of the measurement target in the color space selected in advance according to the color gamut of the measurement target.
- the correlation acquisition step selects one color space from a plurality of color spaces according to the color gamut to which the color to be measured belongs, and the correlation in the selected color space.
- the correction step may correct the measured value of the measurement target in the selected color space.
- the actual measurement value acquisition step acquires the color sample actual measurement value and the measurement target actual measurement value as values in the RGB color space
- the reference value acquisition step acquires the color sample reference value by L * a. * b * Acquired as a value in the color space
- the correlation acquisition step is the measured color sample value acquired as a value in the RGB color space when the selected color space is a color space other than the RGB color space.
- the plurality of color spaces may include an RGB color space, an L * a * b * color space, and an HLS color space.
- the correlation acquisition step selects one regression analysis method from a plurality of types of regression analysis methods according to the color gamut to which the color to be measured belongs, and the selected regression analysis method. May be used to obtain the correlation.
- the actual measurement value acquisition step acquires the color sample actual measurement value and the measurement target actual measurement value as values in the RGB color space
- the reference value acquisition step acquires the color sample reference value by L * a.
- one regression analysis method is selected from a plurality of types of regression analysis methods according to the color range to which the color to be measured belongs, and RGB.
- the color sample actual measurement value and the measurement target actual measurement value acquired as values in the color space are converted into values in the L * a * b * color space, and the converted color sample actual measurement value and the color sample reference value are used.
- the actual measurement value acquisition step acquires the color sample actual measurement value and the measurement target actual measurement value as values in the RGB color space
- the reference value acquisition step acquires the color sample reference value by L * a. * b * Acquired as a value in the color space
- one regression analysis method is selected from a plurality of types of regression analysis methods according to the color range to which the color to be measured belongs, and L * a * b *
- the color sample reference value acquired as a value in the color space is converted into a value in the RGB color space, and the correlation between the converted color sample reference value and the color sample measured value is determined. Obtained using the selected regression analysis method in the RGB color space, the correction step may correct the measured value of the measurement target in the RGB color space.
- the actual measurement value acquisition step acquires the color sample actual measurement value and the measurement target actual measurement value as values in the RGB color space
- the reference value acquisition step acquires the color sample reference value by L * a. * b * Acquired as a value in the color space
- one regression analysis method is selected from a plurality of types of regression analysis methods according to the color range to which the color to be measured belongs, and RGB colors are obtained.
- the color sample actual measurement value acquired as a value in space and the measurement target actual measurement value are converted into a value in the HLS color space, and the color sample reference value acquired as a value in the L * a * b * color space is converted into the HLS.
- the correlation between the converted measured color sample value and the color sample reference value is acquired in the HLS color space using the selected regression analysis method, and the correction step is performed.
- the measured value of the measurement target may be corrected in the HLS color space.
- the color measurement method may further include a step of selecting a color gamut to which the color to be measured belongs.
- the actual measurement value acquisition step further includes the selection step of selecting the above, the actual measurement value acquisition step acquires the color sample actual measurement values of the two or more color samples selected in the selection step, and the reference value acquisition step is the selection step.
- the selected two or more color sample reference values are acquired, and the correlation acquisition unit correlates the color sample actual measurement value of the two or more color samples selected in the selection step with the color sample reference value. You may get a relationship.
- the selection step uses the two or more colors of a color sample close to the colors at both ends of the range in which the color of the measurement target can be changed and a color sample close to the color in the center of the range. You may select it as a sample.
- the selection step when there are a plurality of measurement targets, two or more color samples may be selected for each measurement target.
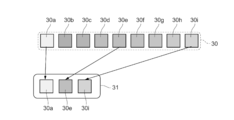
- the plurality of color swatches are classified into a plurality of color swatch groups each including at least two color swatches, and the selection step is performed on the measurement target from the plurality of color swatch groups.
- a color sample group may be selected according to the color gamut to which the color belongs.
- the plurality of color swatches may be classified based on a plurality of regions defined by dividing the L * a * b * color space.
- the plurality of regions include a first region in which the a * component and the b * component are near zero, and a region obtained by excluding the first region from the L * a * b * color space. It may include a second to ninth regions defined by dividing each of the L * axis, the a * axis, and the b * axis into two.
- the selection step includes an imaging step of generating image data of an image in which the plurality of color sample groups and the measurement target are captured by imaging the plurality of color sample groups and the measurement target.
- a color difference calculation step of calculating a color difference between each of at least two color samples included in each of the plurality of color sample groups and the measurement target based on the image data generated in the imaging step is included.
- the plurality of color swatch groups at least two color swatches included in the color swatch group including the color swatch having the smallest color difference may be selected.
- the color sample reference value of the at least two color samples is a value in the L * a * b * color space
- the color difference calculation step is based on the image data, and the plurality of color samples.
- the actual color sample measurement values of at least two color samples included in each of the groups and the measurement target actual measurement values are acquired as values in the RGB color space, and further converted into values in the L * a * b * color space.
- the color difference may be calculated.
- the color gamut to be measured is an achromatic color, a high brightness color gamut, a low brightness color gamut, or a low saturation or medium saturation red region
- the correlation acquisition step is RGB.
- the correlation may be acquired in the color space, and the correction step may correct the measured value of the measurement target in the RGB color space.
- the color gamut to be measured is a color gamut other than an achromatic color, a high-intensity color gamut, a low-intensity color gamut, and a low-saturation red area, and the correlation acquisition step is L.
- the correlation in the * a * b * color gamut may be acquired, and the correction step may correct the measured value of the measurement target in the L * a * b * color gamut.
- a color measurement method is a color measurement method for measuring the color of a measurement target, which is two or more color samples determined according to the measurement target and represents a color. Based on the image data of an image in which two or more color samples whose color sample reference values are known and the color sample reference values are different from each other and the measurement target are captured, the two or more color samples A color sample actual measurement value which is a value representing a color in the image and a measurement target actual measurement value which is a value representing a color in the image of the measurement target, and an actual measurement value acquisition step for acquiring the two or more colors.
- a reference value acquisition step for acquiring a color sample reference value of a sample includes a correction step of calculating the measurement target estimated value, which is the estimated value of the color of the measurement target, by correcting the measurement target actual measurement value using the correlation acquired in.
- the two or more color samples may be determined in advance according to the measurement target.
- the color measurement method may further include a step of selecting the two or more color samples from a plurality of color samples according to the measurement target.
- the actual measurement value acquisition step acquires the color sample actual measurement value and the measurement target actual measurement value as values in the RGB color space
- the reference value acquisition step acquires the color sample reference value by L * a. * b * Acquired as a value in the color space
- the correlation acquisition step converts the measured color sample and the measured value to be measured acquired as a value in the RGB color space into a value in the L * a * b * color space.
- the conversion is performed, and the correlation between the converted color sample measured value and the color sample reference value is acquired in the L * a * b * color space, and the correction step is performed in the L * a * b * color space.
- the measured value of the measurement target may be corrected.
- the actual measurement value acquisition step acquires the color sample actual measurement value and the measurement target actual measurement value as values in the RGB color space
- the reference value acquisition step acquires the color sample reference value by L * a. * b * Acquired as a value in the color space
- the correlation acquisition step converts the color sample reference value acquired as a value in the L * a * b * color space into a value in the RGB color space, and the conversion is performed.
- the correlation between the color sample reference value and the color sample actual measurement value may be acquired in the RGB color space, and the correction step may correct the measurement target actual measurement value in the RGB color space.
- the actual measurement value acquisition step acquires the color sample actual measurement value and the measurement target actual measurement value as values in the RGB color space
- the reference value acquisition step acquires the color sample reference value by L * a. * b * Acquired as a value in the color space
- the correlation acquisition step converts the measured color sample value and the measured value to be measured acquired as a value in the RGB color space into a value in the HLS color space
- the color sample reference value acquired as a value in the color space is converted into a value in the HLS color space, and the correlation between the converted color sample measured value and the color sample reference value is calculated by HLS.
- the correction step may correct the measured value of the measurement target in the HLS color space.
- the measurement target is a solution containing a test paper or a reagent for measuring the concentration, content, or characteristics of a specific substance contained in a liquid, or the concentration and content of a specific substance contained in a gas. It may be a test paper for measuring the quantity or characteristics.
- the color measurement system is a color measurement system that measures the color of the object to be measured, and the color sample reference value which is a value representing the color is known and the color sample reference values are different from each other. Based on the image data of two or more color samples and an image of the measurement target, a color sample actual measurement value which is a value representing a color in the image of the two or more color samples and the image of the measurement target.
- the actual measurement value acquisition unit that acquires the actual measurement value of the measurement target, which is the value representing the color in the above
- the reference value acquisition unit that acquires the color sample reference value of the two or more color samples, and the two or more color samples.
- a color measurement system is a color measurement system that measures the color of a measurement target, and is two or more color samples determined according to the measurement target, and is a value representing a color. Based on the image data of an image in which two or more color samples whose color sample reference values are known and the color sample reference values are different from each other and the measurement target are captured, the two or more color samples A color sample actual measurement value which is a value representing a color in the image and a measurement target actual measurement value which is a value representing a color in the image of the measurement target, and an actual measurement value acquisition unit for acquiring the two or more colors.
- a reference value acquisition unit that acquires a color sample reference value of a sample, a correlation acquisition unit that acquires a correlation between an actually measured color sample value of two or more color samples and a color sample reference value, and the correlation acquisition unit. It is provided with a correction unit for calculating the measurement target estimated value, which is the estimated value of the color of the measurement target, by correcting the measurement target actual measurement value using the correlation acquired in.
- the color measurement system may further include an imaging unit that generates image data of the image by imaging the two or more color samples and the measurement target.
- a color measurement program is a color measurement program executed by a computer in a color measurement system that measures a color to be measured, and a color sample reference value which is a value representing a color is known.
- a color sample actual measurement value which is a value representing a color in the image of the two or more color samples based on image data of two or more color samples having different color sample reference values and an image of the measurement target.
- a measurement value acquisition step for acquiring a measurement target actual measurement value which is a value representing a color in the image of the measurement target, and a reference value acquisition step for acquiring a color sample reference value of the two or more color samples.
- the computer is made to execute the correction step of calculating the estimated value of the measurement target which is the estimated value of the color of the measurement target. It is a thing.
- a color measurement program is a color measurement program executed by a computer in a color measurement system that measures the color of a measurement target, and is two or more color samples determined according to the measurement target. Based on the image data of an image in which two or more color samples whose color sample reference values, which are values representing colors, are known and whose color sample reference values are different from each other, and the measurement target are captured. , An actual measurement value acquisition step for acquiring a color sample actual measurement value which is a value representing a color in the image of the two or more color samples and a measurement target actual measurement value which is a value representing a color in the image of the measurement target.
- the reference value acquisition step of acquiring the color sample reference value of the two or more color samples and the correlation acquisition of acquiring the correlation between the color sample actual measurement value of the two or more color samples and the color sample reference value.
- a color strip for color measurement which is another aspect of the present invention, is a color slip for color measurement used in a color measurement method for measuring a color to be measured, and is a base material and a plurality of color samples.
- a plurality of color swatches each classified into a plurality of color swatch groups each containing at least two color swatches, and arranged on the substrate, the plurality of color swatches having an L * a * b * color space. It is classified according to a plurality of regions defined by dividing.
- the relative relationship between the measured color sample value and the color sample reference value for two or more color samples is acquired according to the color range to which the color to be measured belongs. Therefore, such a relative relationship is used.
- the color of the measurement target can be estimated with high accuracy, and the estimation accuracy is less affected by the color of the measurement target, the imaging environment, and the like. Therefore, it is possible to realize robust color measurement in which the color estimation accuracy is less likely to fluctuate.
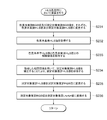
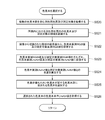
- FIG. 1 is a flowchart showing an outline of a color measuring method according to the first to fourth embodiments of the present invention.
- the color measurement method according to the first to fourth embodiments of the present invention is based on an image generated by capturing a color of an arbitrary measurement target with a camera of the measurement target and two or more color samples. It is a method of measuring.
- the color sample is a color sample for which a value representing a color (hereinafter, also referred to as a color sample reference value) is known, and is also called a color patch.
- the color sample reference value is a value measured by a dedicated color measuring device such as a spectrophotometer or a color difference meter under a predetermined lighting condition (for example, CIE standard light source D65).
- the color value is usually CIEL * a * b * (hereinafter, simply referred to as L * a * b * ) color space, L * C * h. It is output as a value in a color system such as a color space, a Hunter Lab color space, a Yxy color space, an XYZ color space, or a Mansell hCV color space.
- step S10 two or more color samples set according to the color gamut to which the color to be measured belongs or the color gamut to which the color to be measured belongs are selected.
- the method of selecting the color gamut is not particularly limited, and the user may visually select the color gamut, or the color measurement system 10 may automatically select the color gamut, as will be described later.
- a specific color gamut may be set in advance for each measurement target. For example, when a test paper or a solution containing a reagent used in a biochemical experiment or a biological test is used as a measurement target, the color gamut is limited to some extent depending on the experiment or test content.
- a color sample may be set in advance according to the color gamut to be measured. Further, as the two or more color samples, color samples having different color sample reference values are selected. The color sample may be selected according to the selected color gamut, or may be directly selected according to the measurement target in the case of a measurement target having a certain color gamut.
- a value representing each color sample and the color of the measurement target in the image in which two or more color samples and the measurement target are captured is acquired.
- the value representing the color of the color sample in the image is also referred to as the measured color sample value
- the value representing the color of the measurement target in the image is also referred to as the measured target measurement value.
- the color sample reference values of the two or more color samples are acquired.
- step S13 the correlation between the measured color sample value and the color sample reference value, and the correlation according to the color gamut selected in step S10 is acquired.
- the color space of the acquired color sample actual measurement value and the color space of the color sample reference value are different from each other, the color space of at least one of the values is converted in advance. Set the actual color sample value and the color sample reference value in a common color space.
- the RGB value is converted into a tristimulus value (XYZ value) by the following equation (2).
- the XYZ value is converted into an L * a * b * value by the following equation (3).
- equations (4) to (6) are used for the conversion from the L * a * b * value to the RGB value.
- This XYZ value is converted into a linearized RGB value by the following equation (5).
- RGB value is non-linearized by the following equation (6).
- each component is R', G', B'
- the range of RGB values of 0 to 255 gradations is converted to 0 to 1.0 and used, and the converted RGB values are used.
- R, G, B R'(range: 0 to 255) / 255
- G (range: 0 to 1.0) G'(range: 0 to 255) / 255
- B (range: 0 to 1.0) B'(range: 0 to 255) / 255 Is.
- the range of the L component obtained by the formula (7) and the S component obtained by the formula (8) is 0 to 1.0, the range is converted to 0 to 100% by the following formula. be able to.
- L'(range: 0 to 100) L (range: 0 to 1.0) ⁇ 100
- S'(range: 0 to 100) S (range: 0 to 1.0) ⁇ 100
- the range of the H component obtained by the equation (10) is 0 to 2 ⁇
- the range can be converted to 0 to 360 ° by the following equation.
- H'(range: 0 to 360) H (range: 0 to 2 ⁇ ) / ⁇ ⁇ 180
- step S14 the measured value of the measurement target is corrected by using the correlation acquired in step S13.
- an estimated value representing the color of the measurement target (hereinafter, also referred to as an estimated value to be measured) can be obtained.
- step S15 the estimated value to be measured is stored. This completes the color measurement method.
- FIG. 2 is a block diagram showing a schematic configuration of a color measurement system according to the first embodiment of the present invention.
- the color measurement system 10 shown in FIG. 2 is provided by a terminal device having a calculation function such as an imaging function and an image processing, such as a smartphone, a tablet terminal, a personal digital assistant (PDA), a personal computer (PC), and a notebook PC. It is composed.
- the specific device that realizes the color measurement system 10 is not particularly limited, but for example, when considering convenience such as portability, it is preferable to use a portable terminal device such as a smartphone or a tablet terminal.
- the color measurement system 10 includes a communication interface 11, an imaging unit 12, an operation input unit 13, a display unit 14, a storage unit 15, and a calculation unit 16.
- the communication interface 11 is an interface that connects the color measurement system 10 to a communication network and communicates with other devices connected to the communication network.
- the communication interface 11 is configured by using, for example, a soft modem, a cable modem, a wireless modem, an ADSL modem, or the like.
- examples of the communication network include an Internet line, a telephone line, a LAN, a dedicated line, a mobile communication network, a communication line such as WiFi (Wireless Fidelity) and Bluetooth (registered trademark), or a combination thereof.
- the communication network may be wired, wireless, or a combination thereof. However, in the present embodiment, it is not always necessary to provide the communication interface 11.
- the imaging unit 12 is, for example, a camera built in a smartphone.
- the image pickup unit 12 includes an image pickup element such as a CCD image sensor or a CMOS image sensor, generates image data of a color image, and inputs the image data to the calculation unit 16.
- the operation input unit 13 is an input device such as an operation button or a touch panel provided on the display unit 14, and inputs a signal corresponding to an operation performed from the outside to the calculation unit 16.
- the display unit 14 is, for example, a liquid crystal display or an organic EL display, and under the control of the calculation unit 16, an image based on image data input from the image pickup unit 12, an icon for a user to perform an input operation, or a text. Display messages etc.
- the storage unit 15 is a computer-readable storage medium such as a semiconductor memory such as ROM or RAM or a hard disk, and includes a program storage unit 151, a color sample reference value storage unit 152, an image data storage unit 153, and actual measurement value storage. A unit 154, a correlation function storage unit 155, and an estimated value storage unit 156 are included.
- the program storage unit 151 stores, in addition to the operating system program and the driver program, application programs that execute various functions, various parameters used during the execution of these programs, and the like. Specifically, the program storage unit 151 estimates the color of the measurement target 1 based on the image data input from the imaging unit 12 and the color sample reference value stored in the color sample reference value storage unit 152. I remember the color measurement program for.
- the color sample reference value storage unit 152 stores the color sample reference values of a plurality of color samples.
- the color sample reference value is a value measured in advance by a dedicated color measuring device such as a spectrophotometer or a color difference meter.
- the nominal value by the manufacturer of the color swatch may be stored as the color swatch reference value.
- the color space of the color sample reference value stored in the color sample reference value storage unit 152 is not particularly limited, but in the present embodiment, at least the value in the L * a * b * color space is stored. Therefore, when the measured value or the nominal value by the dedicated color measuring device is represented by the value in the color space other than the L * a * b * color space, for example, the equations (1) to (3), (11).
- L * a * b * may store only the color swatch reference value
- L * a * b * color space other than a color space eg, RGB color space , HLS color space
- the color sample reference value in the L * a * b * color space is referred to as the color sample reference L * a * b * value
- the color sample reference value in the RGB color space is referred to as the color sample reference RGB value.
- the color sample reference value in the HLS color space is called the color sample reference HLS value.
- the image data storage unit 153 stores image data input from the image pickup unit 12 and subjected to image processing by the image data acquisition unit 161 described later.
- the format of the image data stored in the image data storage unit 153 is not particularly limited, and RGB, YUV, YCbCr, YMCK, RAW, JPEG, TIFF, Exif, and others, BT. It is stored in a format that is output in accordance with the 601 system.
- the term RGB is simply referred to as linear RGB, sRGB, or adobe RGB.
- the actual measurement value storage unit 154 stores the color sample actual measurement value and the measurement target actual measurement value of each color sample in the image in which a plurality of color samples and measurement targets are captured, based on the image data stored in the image data storage unit 153.
- the color space of the color sample actual measurement value and the measurement target actual measurement value is not particularly limited, but in the present embodiment, the color sample actual measurement value and the measurement target actual measurement value in the RGB color space are stored in the actual measurement value storage unit 154. Therefore, when the image data is stored in the image data storage unit 153 in a format other than RGB, the color sample actual measurement value and the measurement target actual measurement value acquired based on the image data are, for example, equations (4) to (6).
- the color sample actual measurement value and the measurement target actual measurement value in the RGB color space are referred to as a color sample actual measurement RGB value and a measurement target actual measurement RGB value, respectively.
- the correlation function storage unit 155 stores the correlation function used in the regression analysis performed when acquiring the correlation between the color sample reference value of a plurality of color samples shown in the image and the measured color sample value. ..
- the type of the correlation function is not particularly limited, and may be a linear function, a quadratic function, or a Fuzzy regression equation used in the Fuzzy regression analysis.
- the estimated value storage unit 156 stores the measured target estimated value calculated by the calculation unit 16.
- the arithmetic unit 16 is configured by using, for example, a CPU (Central Processing Unit), a GPU (Graphics Processing Unit), or an FPGA (field-programmable gate array), and is measured by reading various programs stored in the program storage unit 151. While comprehensively controlling each part of the color system 10, various arithmetic processes for measuring the color of the measurement target are executed.
- the functional units realized by the calculation unit 16 include an image data acquisition unit 161, a display control unit 162, a color gamut selection unit 163, an actual measurement value acquisition unit 164, and a reference value acquisition unit 165.
- a correlation acquisition unit 166 and a correction unit 167 are included. Each of these parts may be composed of one or more processors, computer programs, or a combination thereof.
- the image data acquisition unit 161 acquires the image data (RAW data) generated by the imaging unit 12 and displays the image data by performing image processing such as demosaiking, white balance processing, and gamma correction.
- Image data RGB data, etc.
- the display control unit 162 controls the display operation on the display unit 14. For example, the display control unit 162 causes the display unit 14 to display an image based on the image data processed by the image data acquisition unit 161, a measurement result of the color to be measured, and the like in a predetermined mode.
- the color gamut selection unit 163 selects the color gamut to which the color to be measured belongs. The details of the color gamut selection process will be described later.
- the actual measurement value acquisition unit 164 recognizes an image area in which each color sample is captured and an image region in which the measurement target is captured from images in which a plurality of color samples and measurement targets are captured, and a plurality of image regions based on the pixel values of each image region. Obtain the actual measurement value of the color sample and the actual measurement value of the measurement target. Further, the actual measurement value acquisition unit 164 converts the color space of the acquired color sample actual measurement value and the measurement target actual measurement value as necessary.
- the reference value acquisition unit 165 acquires the color sample reference value of the color sample imaged by the image pickup unit 12 from the color sample reference value storage unit 152, and converts the color space as necessary.
- the correlation acquisition unit 166 acquires the correlation between the color sample actual measurement value acquired by the actual measurement value acquisition unit 164 and the color sample reference value acquired by the reference value acquisition unit 165.
- the correction unit 167 calculates the measurement target estimated value by correcting the measurement target actual measurement value acquired by the actual measurement value acquisition unit 164 using the correlation acquired by the correlation acquisition unit 166.
- the color measuring system 10 illustrated in FIG. 2 may be configured by one device, but may be configured by a plurality of devices connected via a communication network.
- the color measurement system 10 may be configured by a general digital camera as an imaging unit 12 and a personal computer (PC) or a notebook PC having a storage unit 15 and a calculation unit 16.
- the image data generated by the digital camera is transferred to a PC or notebook PC via a communication cable or wireless communication, and the color of the measurement target is measured by processing the image data on the PC or notebook PC.
- a calculation unit 16 may be provided in a terminal device having a communication function such as a PC, a notebook PC, a smartphone, or a tablet terminal, and a color sample reference value storage unit 152 may be provided in a server connected to a communication network.
- the calculation unit 16 may acquire a color sample reference value from the server via the communication network and perform a calculation for measuring the color of the measurement target.
- the calculation unit 16 and the color sample reference value storage unit 152 may be provided on the server connected to the communication network.
- a terminal device having a communication function and a display function such as a PC, a notebook PC, a smartphone, and a tablet terminal transmits image data of a color sample and an image of a measurement target to a server, and the color of the measurement target is transmitted on the server.
- the measurement result may be transmitted from the server to the terminal device via the communication network, and the measurement result may be displayed on the terminal device.
- FIG. 3 is a flowchart showing a color measuring method according to the first embodiment of the present invention.
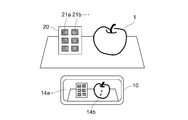
- FIG. 4 is a schematic diagram illustrating a state in which a plurality of color samples and measurement targets are imaged.
- FIG. 5 is a schematic diagram illustrating an image showing a plurality of color samples and measurement targets.
- step S20 the imaging unit 12 images the color sample and the measurement target.
- the image pickup unit 12 takes an image of the color measurement color chart 20 and the measurement target 1 in which a plurality of color samples 21a, 21b, ... Are arranged according to an instruction input from the operation input unit 13 in response to a user operation.
- the image data is generated and input to the calculation unit 16.
- the image 2 shown in FIG. 5 includes an image region 2a of the color measurement slip 20 and an image region 2c of the measurement target 1.
- the image area 2a includes the image area 2b corresponding to each of the color samples 21a, 21b, ....
- the calculation unit 16 recognizes the color sample and the area to be measured in the image. Specifically, the actually measured value acquisition unit 164 recognizes the image area 2b of each color sample 21a, 21b, ... And the image area 2c of the measurement target 1 reflected in the image 2 based on the image data input in step S20. ..
- the image area 2b of the color sample can be recognized by pattern matching by inputting the shapes of the color measurement color chart 20 and the color samples 21a, 21b, ... In advance into the color measurement system 10 as an example.
- a predetermined region in the image 2 may be recognized as an image region 2b of each color sample 21a, 21b, ....
- the user looks at the screen 14a of the display unit 14 and performs the imaging operation while adjusting so that the color samples 21a, 21b, ... Are arranged in a predetermined area in the field of view of the imaging unit 12. ..
- the actually measured value acquisition unit 164 recognizes the area selected by the user as the image area 2b of each color sample 21a, 21b, ... According to the signal input from the operation input unit 13.
- a predetermined area in the image 2 may be recognized as the image area 2c.
- the user looks at the screen 14a of the display unit 14 and performs the imaging operation while adjusting so that the measurement target 1 is arranged in a predetermined region in the field of view of the imaging unit 12.
- the position of the measurement target 1 may be guided by displaying the mark 14b at a predetermined position on the screen 14a.
- the image region 2c of the measurement target 1 may be selected by the user performing a predetermined operation (for example, a tap operation) on the screen 14a.
- the measured value acquisition unit 164 recognizes the area selected by the user as the image area 2c of the measurement target 1 according to the signal input from the operation input unit 13.
- the calculation unit 16 acquires the color sample actual measurement RGB value and the measurement target actual measurement RGB value from the pixel value of the region recognized from the image in step S21.
- the actually measured value acquisition unit 164 acquires the pixel values (R component, G component, B component) in the image region 2b of the color samples 21a, 21b, ... As the color sample actually measured RGB values, and the image of the measurement target 1.
- the pixel value (same as above) in the area 2c is acquired as the measured RGB value in the measurement area.
- the pixel value of the image area 2b acquired as the color sample actual measurement RGB value may be a statistical value such as an average value or a median value of the pixel values of the pixels of the entire image area 2b, or may be within the image area 2b. It may be the pixel value of the pixel at the representative point (for example, the center of gravity point), or the average value of the pixel values of the pixels at a predetermined plurality of points (for example, a plurality of points within a predetermined range from the center of gravity) in the image area 2b. Or a statistical value such as a median value. The same applies to the pixel value of the image area 2c acquired as the RGB value to be measured.
- the calculation unit 16 selects the color gamut to which the color to be measured belongs.
- the color gamut selection unit 163 roughly selects a color gamut based on the measured RGB values of the measurement target acquired in step S22.
- the red region is used
- the G component is higher than the other components
- the green area is used
- the red region is used.
- the blue region and RGB components are the same, the color region to which the color to be measured belongs can be classified as an achromatic color (white, black, gray) or the like.
- the color gamut to which the color to be measured belongs may be classified according to the brightness and saturation.
- the high-luminance color gamut is a color gamut in which the L * component (range: 0 to 100) in the L * a * b * color space is close to 100 (95 or more as an example). is there.
- the low-luminance color gamut is a color gamut in which the L * component in the L * a * b * color space is in the vicinity of 0 (for example, 5 or less).
- saturation is classified as follows.
- the saturation C * of the color represented by the lightness L * and the chromaticity a * , b * is expressed by the following equation.
- C * ⁇ (a * 2 + b * 2 )
- the maximum chromaticity values a * max and b * max are 60, respectively, and when the lightness L * is 0 or 100, the maximum chromaticity values a * max and b * max are used. Are 0 respectively.
- step S23 when the luminance or saturation is used when selecting the color gamut to which the color to be measured belongs in step S23, it is not always necessary to strictly classify the luminance or saturation according to the above definition. For example, each region of high brightness, low brightness, low saturation, medium saturation, and high saturation classified in the L * a * b * color space based on the above definition is converted into a region in the RGB color space in advance. Based on the value of the converted region, it may be determined which region the measured RGB value of the measurement target acquired in step S22 belongs to. To the last, in step S23, the color gamut to which the color of the measurement target recognized from the image belongs may be roughly selected.
- the calculation unit 16 determines the color space in which the calculation is performed according to the color gamut to which the color to be measured belongs.
- the color space corresponding to the color gamut selected in step S23 is determined from the RGB color space, the L * a * b * color space, and the HLS color space.
- the color gamut to be measured is an achromatic color or a color gamut close to it, a high-brightness color gamut with high brightness, a low-brightness color gamut with low brightness, or a low-saturation or medium-saturation red range.
- the color gamut to be measured is an achromatic color or a color gamut close to it, a high-brightness color gamut with high brightness, a low-brightness color gamut with low brightness, and low color gamut.
- the color gamut for performing the calculation may be determined to be the L * a * b * color gamut or the HLS color gamut.
- FIG. 6 is a flowchart showing a process of performing an operation in an RGB color space.
- the reference value acquisition unit 165 uses the color sample reference of the color sample imaged in step S20. Acquires RGB values. Specifically, when the color sample reference value storage unit 152 stores only the color sample reference L * a * b * values, the reference value acquisition unit 165 reads the color sample reference L read from the color sample reference value storage unit 152. The * a * b * values are converted into color sample reference RGB values using, for example, equations (4) to (6).
- the reference value acquisition unit 165 reads the color sample reference value RGB value as it is from the color sample reference value storage unit 152.
- the correlation acquisition unit 166 acquires the correlation between the color sample reference RGB value and the color sample actual measurement RGB value. Specifically, the correlation acquisition unit 166 performs regression analysis for each component (R component, G component, B component) with the color sample reference RGB values and the color sample actual measurement RGB values of the color samples 21a, 21b, ... As variables. By doing so, the coefficient of the regression equation is obtained for each component.
- the correction unit 167 acquires the measurement target estimated RGB value by correcting the measurement target actually measured RGB value using the correlation acquired in step S212.
- the measurement target estimated RGB value is a measurement target estimated value in the RGB color space.
- the correction unit 167 creates a correlation function using the coefficient obtained in step S212, and calculates the measurement target estimated RGB value by substituting the measurement target actual measurement RGB value into this correlation function.
- the correction unit 167 converts the measurement target estimated RGB value into the measurement target estimation L * a * b * value by using, for example, equations (1) to (3).
- the measurement target estimated L * a * b * value is a measurement target estimated value in the L * a * b * color space.
- step S215 the correction unit 167 converts the measurement target estimated RGB value into the measurement target estimated HLS value by using, for example, equations (7) to (10).
- the measurement target estimated HLS value is a measurement target estimated value in the HLS color space.
- FIG. 7 is a flowchart showing a process of performing an operation in the L * a * b * color space.
- the measured value acquisition unit 164 is, for example, an equation.
- the color sample actual measurement RGB value and the measurement target actual measurement RGB value are converted into the color sample actual measurement L * a * b * value and the measurement target actual measurement L * a * b * value, respectively. ..
- the reference value acquisition unit 165 acquires the color sample reference L * a * b * value of the color sample imaged in step S20. That is, the reference value acquisition unit 165 reads the color sample reference L * a * b * value as it is from the color sample reference value storage unit 152.
- the correlation acquisition unit 166 acquires the correlation between the color sample reference L * a * b * value and the color sample actual measurement L * a * b * value. Specifically, the correlation acquisition unit 166 uses the color sample reference L * a * b * value and the color sample actual measurement L * a * b * value of each color sample 21a, 21b, ... As variables, and the component (L * component, By performing regression analysis for each a * component and b * component), the coefficient of the regression equation is obtained for each component.
- the correction unit 167 acquires the measurement target estimated L * a * b * value by correcting the measurement target actual measurement L * a * b * value using the correlation acquired in step S223. .. Specifically, the correction unit 167 creates a correlation function using the coefficient obtained in step S223, and substitutes the measured target actual measurement L * a * b * value into this correlation function to measure the measurement target estimation L *. Calculate the a * b * values.
- the correction unit 167 converts the measurement target estimation L * a * b * value into the measurement target estimation RGB value by using, for example, equations (4) to (6).
- step S226 the correction unit 167 further converts the measurement target estimated RGB value into the measurement target estimated HLS value by using, for example, equations (7) to (10). After that, the process returns to the main routine. It should be noted that steps S225 and S226 are optional and may be appropriately executed as necessary.
- FIG. 8 is a flowchart showing a process of performing an operation in the HLS color space.
- the measured value acquisition unit 164 uses, for example, equations (7) to (10).
- the color sample actual measurement RGB value and the measurement target actual measurement RGB value are converted into the color sample actual measurement HLS value and the measurement target actual measurement HLS value, respectively.
- the reference value acquisition unit 165 acquires the color sample reference HLS value of the color sample imaged in step S20. Specifically, when the color sample reference value storage unit 152 stores only the color sample reference L * a * b * values, the reference value acquisition unit 165 reads the color sample reference L read from the color sample reference value storage unit 152. The * a * b * values are converted into color sample reference RGB values using, for example, equations (4) to (6), and further, the color sample reference RGB values are converted into colors using, for example, equations (7) to (10). Convert to sample reference HLS value. When the color sample reference value storage unit 152 also stores the color sample reference HLS value, the reference value acquisition unit 165 reads the color sample reference value HLS value from the color sample reference value storage unit 152 as it is.
- the correlation acquisition unit 166 acquires the correlation between the color sample reference HLS value and the color sample actual measurement HLS value. Specifically, the correlation acquisition unit 166 performs regression analysis for each component (H component, L component, S component) with the color sample reference HLS value and the color sample actual measurement HLS value of each color sample 21a, 21b, ... As variables. By doing so, the coefficient of the regression equation is obtained for each component.
- the correction unit 167 acquires the measurement target estimated HLS value by correcting the measurement target actual measurement HLS value using the correlation acquired in step S233. Specifically, the correction unit 167 creates a correlation function using the coefficient obtained in step S232, and calculates the measurement target estimated HLS value by substituting the measurement target actual measurement HLS value into this correlation function.
- the correction unit 167 converts the measurement target estimated HLS value into the measurement target estimated RGB value by using, for example, equations (11) to (14).
- step S236 the correction unit 167 further converts the measurement target estimated RGB value into the measurement target estimation L * a * b * value by using, for example, equations (1) to (3). After that, the process returns to the main routine. It should be noted that steps S235 and S236 are optional and may be appropriately executed according to the purpose of use of the estimated value to be measured.
- step S29 the calculation unit 16 stores the measurement target estimated value calculated in steps S26, S27, or S28 in the estimated value storage unit 156. After that, the color measuring method according to the present embodiment ends.
- the color space for acquiring the correlation between the color sample measured value and the color sample reference value and performing the calculation for correcting the measured value of the measurement target is set according to the color gamut to which the color of the measurement target belongs.
- the inventors of the present application obtain the actual measurement value of the color sample by imaging the color sample under various imaging environments, and the same.
- Experiment 1 was conducted in which the correlation with the color sample reference value of the color sample was acquired in a plurality of color spaces.
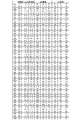
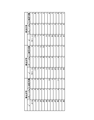
- Experiment 1 The equipment used in Experiment 1 is as follows. (1) Color sample: 37 color patches and 5 gray patches extracted from the color sample book "Color Finder” manufactured by Shikisha Co., Ltd. (see Fig. 9). (2) Colorimeter: Portable imaging spectrocolorimeter “x-Rite RM200QC” manufactured by Videojet X-Rite Co., Ltd. (3) Imager: Samsung's smartphone "Galaxy S8"
- FIG. 9 is a table showing the color measurement values of the color swatches used in Experiment 1. “No.” shown in FIG. 9 is a number assigned for convenience in the present specification in order to identify the color sample.
- Each value in the "nominal value” column shown in FIG. 9 is an sRGB value published on the homepage ⁇ URL: https://www.toyoink1050plus.com/color/color-finder/> of Toyo Ink Co., Ltd.
- Each value in the "measured value by colorimeter” column shown in FIG. 9 is an L * a * b * value obtained by measuring each color sample with the above colorimeter.
- Each value in the "calculated value” column shown in FIG. 9 is an RGB value obtained by converting the measured value by the colorimeter using the equations (4) to (6).
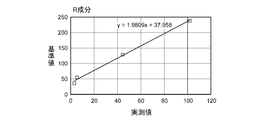
- the experimental method is as follows. That is, under conditions 1 to 10 described later, an image was generated by imaging a color sample (color patch or gray patch), and a pixel value (RGB value) of an image region of the color sample in the image was acquired. Further, this pixel value was converted into an L * a * b * value. Then, the color value of the color sample acquired based on the image is used as the measured value, and the color value of the color sample measured by the colorimeter (see FIG. 9) is used as the reference value, and the measured value and the reference value are used. The correlation by linear approximation between the two was obtained for each component of each color space, and the correlation coefficient was calculated.
- FIG. 10 is a table showing the imaging conditions and results in Experiment 1.
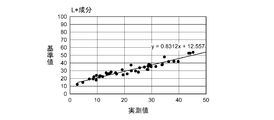
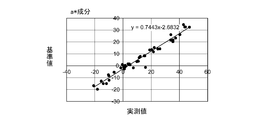
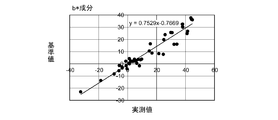
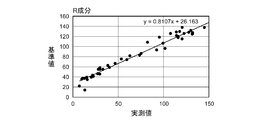
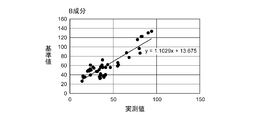
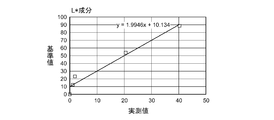
- 11A to 16C are graphs showing the correlation between the measured value of the color sample in Experiment 1 and the reference value.
- the environment indoor / outdoor and lighting conditions such as sun / shade / shade / fluorescent lamp / window), weather, illuminance (lux), and camera orientation were set. ..
- the camera was held with the sun behind and the image was taken in a state where the direct sunlight was illuminating the front of the color sample.
- condition 2 the camera was held facing the sun, and the image was taken in a state where the direct sunlight was shining behind the color sample.
- condition 3 the camera was held on the back side of the building, and the image was taken with the color sample in the shadow of the building.
- condition 4 the camera was held facing the building, and the image was taken with the color sample placed between the building and the camera.
- condition 5 the camera was held facing the tree, and the image was taken with the color sample placed between the building and the camera.
- a desk was placed indoors, a camera was placed parallel to the desk, and an image was taken with a color sample standing upright.
- condition 7 the desk was placed indoors, the camera was held so as to face the desk, and the color sample was laid down on the desk for imaging.
- condition 8 and 10 the camera was held parallel to the window, and the image was taken in a state where the outdoor light was inserted laterally through the window.
- condition 9 the camera was held facing the window, and the image was taken in a state where the outdoor light illuminates the back of the color sample through the window.
- FIGS. 11A to 12C are graphs showing the correlation between the measured value and the reference value when the color patch is imaged under condition 1.
- the actually measured values in FIGS. 11A to 11C are values obtained by converting the pixel values (RGB values) of the color swatches acquired from the images into L * a * b * values, and the reference values are shown in FIG. It is a value measured by a colorimeter.
- the actually measured values in FIGS. 12A to 12C are the pixel values (RGB values) of the color sample acquired from the image, and the reference values are the calculated values shown in FIG.
- FIGS. 13A to 14C are graphs showing the correlation between the measured value and the reference value when the color patch is imaged under the condition 2.
- the actually measured values in FIGS. 13A to 13C are values obtained by converting the pixel values (RGB values) of the color sample acquired from the image into L * a * b * values, and the reference values are shown in FIG. It is a value measured by a colorimeter.
- the actually measured values in FIGS. 14A to 14C are pixel values (RGB values) acquired from the image, and the reference values are the calculated values shown in FIG.
- the actually measured values in FIGS. 15A to 15C are values obtained by converting the pixel values (RGB values) of the color swatches acquired from the images into L * a * b * values, and the reference values are shown in FIG. It is a value measured by a colorimeter.
- the actually measured values in FIGS. 16A to 16C are the pixel values (RGB values) of the color sample acquired from the image, and the reference values are the calculated values shown in FIG.
- the correlation state between the measured value and the reference value is significantly different between the L * a * b * color space and the RGB color space. That is, as shown in FIG. 15A, a high correlation is observed between the measured value and the reference value for the L * component, but almost no correlation is observed for the a * component and the b * component.
- FIGS. 16A to 16C in the RGB color space, a high correlation is observed between the measured value and the reference value in each color component.
- the inventors of the present application consider that the correlation coefficient is a robust color component that is not easily affected by the imaging conditions when acquiring the correlation between the measured value of the color sample and the reference value. We obtained the finding that there is a color component. Therefore, in the present embodiment, the color space in which the correlation between the measured value of the color sample and the reference value is acquired and the calculation for correcting the measured value of the measurement target is performed is determined according to the color gamut to which the color of the measurement target belongs. It was decided to.
- the measurement target is an achromatic color gamut or a color gamut close to it, a high-brightness color gamut with high brightness, a low-brightness color gamut with low brightness, or a low-saturation or medium-saturation red range.
- the RGB color space is selected, and the measurement target is an achromatic color or a color gamut close to it, a high-brightness color gamut with high brightness, a low-brightness color gamut with low brightness, and a color gamut other than the low-saturation red range.
- the L * a * b * color gamut may be selected.
- the correlation between the measured color sample value and the color sample reference value is acquired in the color space corresponding to the color range to which the color to be measured belongs, and this Since the measured value of the measurement target is corrected using the correlation, the color of the measurement target can be estimated accurately regardless of the color range, and the estimation accuracy does not easily change due to changes in the imaging environment. It will be possible to realize.
- the color to be measured can be measured accurately, inexpensively and easily. Is possible.
- any environment in which such a terminal device can be used can be used. Even in such a place, the color of the measurement target can be measured. Therefore, it is possible to easily and accurately measure the color of the wall of a building, the color of a vehicle such as an automobile or a ship, the color of agricultural products (leaves and fruits), and the like at an outdoor site.
- the colors of test strips, solutions containing reagents, and the like can be measured with high accuracy, and analysis results can be obtained on the spot.
- the color gamut to which the color of the measurement target belongs is determined by the color measurement system 10 based on the measured RGB value of the measurement target (see step S23), but the user determines it. Is also good. In this case, the user visually confirms the color of the measurement target, and inputs the color gamut to which this color belongs to the color measurement system 10 using the operation input unit 13. In response to this, the color gamut selection unit 163 selects the color gamut of the measurement target 1 according to the signal input from the operation input unit 13.
- Modification 1-2 When the color gamut is determined to some extent by the measurement target, such as when the measurement target is a test paper or solution containing reagents used in biochemical experiments or biological tests, set the color gamut in advance for each measurement target. You can leave it. For example, for measuring characteristics such as concentration, content, or pH of a specific substance contained in a liquid such as environmental natural water, purified water, sewage, industrial processed water, chemical (chemical solution), food water, chemical water, etc.
- a liquid such as environmental natural water, purified water, sewage, industrial processed water, chemical (chemical solution), food water, chemical water, etc.
- Test paper or solution containing reagents test paper for measuring characteristics such as concentration, content, or pH of specific substances contained in biological fluids such as blood, urine, and bone marrow, and extracts from solids (food extraction) Solution, solution containing test paper or reagent for measuring characteristics such as concentration, content, or pH of specific substance contained in liquid, soil extract, concentration, content of specific substance (chemical gas, etc.) contained in gas
- a specific color region such as a red region, a blue region, and a green region can be set in advance.
- step S23 of FIG. 3 the analysis target by color measurement and the measurement target (test paper or reagent used for analysis) are input to the color measurement system 10 by using the operation input unit 13.
- the color gamut may be set automatically.
- the color space according to the color gamut may be automatically set by inputting the analysis target or the measurement target.
- a program in which a color gamut is set in advance may be prepared for each analysis target by color measurement or a measurement target such as a test paper or a reagent used for analysis.
- the color space according to the color gamut is also determined in advance, the color space for acquiring the correlation may be set and programmed in advance according to the analysis target and the measurement target. Therefore, in this case, steps S23 to S25 in FIG. 3 are omitted, and any of steps S26 to S28 is determined in advance according to the analysis target and the measurement target.
- the color sample and the measurement target are imaged to measure the color sample RGB.
- the value and the measured RGB value of the measurement target are acquired (steps S20 to S22), and then the color sample actual measurement RGB value and the measurement target actual measurement RGB value are obtained as the color sample actual measurement L * a * b * value and the measurement target actual measurement L * a * b.
- * Converted to each value step S221 in FIG. 7
- acquired the correlation between the measured color sample L * a * b * value and the color sample L * a * b * reference value steps S222 and S223).
- the estimated L * a * b * value to be measured is obtained using the obtained correlation (step S224), and the estimated L * a * b * value to be measured is converted into an RGB value or an HLS value as necessary before measurement.
- a series of processes of storing the target estimated value (step S29) is executed.
- FIG. 17 is a flowchart showing a color measuring method according to a second embodiment of the present invention.
- the schematic configuration of the color measurement system that executes the color measurement method according to the present embodiment is the same as that of the first embodiment (see FIG. 2), and details of the processing executed by each unit included in the calculation unit 16. However, it is different from the first embodiment.
- steps S30 to S32 shown in FIG. 17 are the same as those in the first embodiment (see steps S20 to S22 in FIG. 3).
- step S33 the actual measurement value acquisition unit 164 uses the color sample actual measurement RGB value and the measurement target actual measurement RGB value acquired in step S32 as the color sample actual measurement L * a * b * value and the measurement target actual measurement, respectively. Convert to L * a * b * values.
- the reference value acquisition unit 165 acquires the color sample reference L * a * b * value of the color sample imaged in step S30 from the color sample reference value storage unit 152.
- step S35 the color gamut selection unit 163 selects the color gamut to which the color to be measured belongs.
- the method of selecting the color gamut is the same as in step S23 of FIG.
- the correlation acquisition unit 166 selects the regression analysis method according to the color gamut selected in step S35.
- the method of selecting the method of regression analysis it is determined whether or not the color gamut selected in step S35 is a color gamut in which the estimation accuracy tends to decrease, and the method of regression analysis is selected according to the determination result. There is a way to do it.
- a color gamut (red area) in which the R component is relatively high can be determined as a color gamut in which the estimation accuracy tends to decrease.
- regression analysis using a linear function regression analysis using a quadratic function, fuzzy regression analysis and the like can be mentioned.
- step S37 the correlation acquisition unit 166 performs regression analysis using the method selected in step S35 to obtain the color sample reference L * a * b * value and the color sample actual measurement L * a * b * value. Get the correlation of.
- the correction unit 167 acquires the measurement target estimated L * a * b * value by correcting the measurement target actual measurement L * a * b * value using the correlation acquired in step S37. ..
- the calculation unit 16 stores the measurement target estimated L * a * b * value in the estimated value storage unit 156.
- the measurement target estimated L * a * b * value may be converted into a measurement target estimated RGB value or a measurement target estimated HLS value and stored in the estimated value storage unit 156.
- step S36 the "easiness of deterioration of estimation accuracy" determined in step S36 will be described.
- the inventors of the present application conducted Experiment 2 for verifying the variation of the correction accuracy according to the color gamut.
- Experiment 2 The equipment used in Experiment 2 is as follows. (1) Color sample: A 10-color color patch extracted from the color sample book “Color Finder” manufactured by Toyo Ink Co., Ltd. (see FIG. 18A). (2) Measurement target: 50 color patches extracted from the color sample book “Color Finder” manufactured by Toyo Ink Co., Ltd. (see Fig. 18B). (3) Colorimeter: Spectrophotometer “ColorMunki Photo” manufactured by Videojet X-Rite Co., Ltd. (model number: cmunph) (4) Imager: Samsung smartphone "Galaxy S8"
- the "code” shown in FIG. 18A is a code given for convenience in the present specification in order to identify the color sample.
- Each value in the "nominal value” column shown in FIG. 18A is an sRGB value published on the homepage ⁇ URL: https://www.toyoink1050plus.com/color/color-finder/> of Toyo Ink Co., Ltd.
- "No.” shown in FIG. 18B is a number given for convenience in the present specification in order to identify the color sample.
- Each value in the "nominal value” column shown in FIG. 18B is an sRGB value published on the homepage of Toyo Ink Co., Ltd.
- the imaging environment is as follows. That is, a desk was installed in the blackout room, a color sample was placed horizontally on the desk, and a D65 light source was set directly above the desk. At this time, the illuminance near the color sample was about 1500 lpx. In addition, the smartphone was erected sideways and fixed at a position about 10 cm away from the color sample.
- the experimental method is as follows. First, the color sample measured RGB values (sRGB values) were acquired by imaging the color samples of 10 colors, and these color sample measured RGB values were converted into the color sample measured L * a * b * values. Further, the same 10 color swatches were measured using the above colorimeter to obtain a color swatch reference L * a * b * value. Then, the correlation between the color sample reference L * a * b * value and the color sample actual measurement L * a * b * value was obtained by a linear approximation formula and a quadratic curve approximation formula.
- the measurement target actual measurement RGB values (sRGB values) were acquired, and these measurement target actual measurement RGB values were converted into the measurement target actual measurement L * a * b * values. Then, the measured actual L * a * b * value, by substituting in the linear approximation and the quadratic curve approximation equation to get the measurement object estimation L * a * b * values. The error and color difference ⁇ E of each component between the estimated L * a * b * value to be measured and the value measured by the colorimeter were calculated.
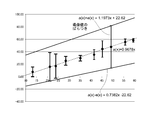
- FIG. 19 is a table showing the results of Experiments 2 and 3 (Experiment 3 will be described later).
- the maximum value of the color difference ⁇ E is smaller than that when the correlation by the linear approximation is used, and the estimation accuracy is improved. I can say.
- the estimation accuracy may be lower in the quadratic curve approximation.
- the inventors of the present application often performed quadratic curve approximation rather than straight line approximation when acquiring the correlation between the color sample reference value and the color space actual measurement value. It was found that the method can improve the estimation accuracy of the color to be measured. Therefore, basically, the estimation accuracy is obtained by obtaining the correlation between the color sample reference value and the color space actual measurement value by linear approximation, and by obtaining the correlation by quadratic curve approximation for the color gamut where the estimation accuracy tends to decrease. It is possible to prevent a decrease in estimation accuracy for a color gamut that tends to decrease, and to obtain an effect that the calculation cost can be suppressed for other color gamuts.
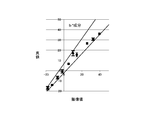
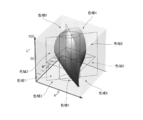
- 20 to 22 are graphs for explaining the Fuzzy regression analysis used in the present embodiment.
- the FUZZY regression analysis is a problem of obtaining the FUZZY coefficient, which is the FUZZY number, on the assumption that the output value estimated by this regression model is also the FUzzy number as a result of the regression coefficient being the FUZZY number in the linear regression model.
- the Fuzzy coefficient a symmetric triangle Fuzzy number or various other Fuzzy numbers are used, and may be used as an interval coefficient.
- the output value of the linear regression model is also an interval.
- the Fuzzy coefficient can be obtained by a method based on a linear programming method, a least squares method, or the like.
- the imaging value (actually measured L * a * b * value obtained by converting the actually measured RGB value) in the acquired image including the disturbance due to the imaging environment and the ambiguity caused by the exposure compensation of the camera is the Fuzzy number.
- the Fuzzy regression equation is calculated by performing the Fuzzy regression analysis using the interval linear model.
- a (X p ) shown in the equation (16-2) is a straight line passing through the center of the objective variable Y (X p ) which is a Fuzzy number, and represents an average value in consideration of the variation in the imaging value.
- e (X p ) shown in the equation (16-3) corresponds to twice the standard deviation of the imaged value. That is, as shown in FIG. 20, regression analysis including ambiguity (variation in imaging values) is performed by giving a width to the regression equation using e (X p ) centered on a (X p ). Can be done. Note that FIG. 20 shows a graph when the MIN problem is used to calculate the coefficient that minimizes the width by including all the input data (imaging values) in the given section.
- the Fuzzzy output section is created by using the Fuzzzy inference method. That is, as shown in FIG. 21, the Fuzzy regression line is sliced at an arbitrary value (y1, y2, y3, y4, ). Next, an estimated fuzzy output set (that is, a candidate group of estimated values) corresponding to each slice level is acquired. Next, as shown in FIG. 22, the degree of attribution, which is an index of how much each estimated value candidate belongs to each slice level, is calculated. Furthermore, the estimated value is calculated based on the degree of belonging.
- Example 3 The inventors of the present application conducted Experiment 3 to verify the effectiveness of the correction by the above-mentioned Fuzzy regression analysis, and measured the estimated L * a * b * values (L * 1 , a * 1 , b * 1). ) And the values measured by the colorimeter (L * 2 , a * 2 , b * 2 ), the error of each component and the color difference ⁇ E were calculated.
- the equipment used in Experiment 3 and the method of acquiring various measured values are the same as in Experiment 2 above. As various measured values, the color sample measured RGB values of 10 color samples, the converted color sample measured L * a * b * values, and the measured RGB values of 50 colors to be measured and converted thereof.
- FIG. 23A to 23C show the correlation between the actual color sample L * a * b * value (imaging value) of the 10 color samples and the color sample reference L * a * b * value (true value) by the Fuzzy regression analysis. It is a graph which shows. Of these, FIG. 23A shows the correlation of the L * component, FIG. 23B shows the correlation of the a * component, and FIG. 23C shows the correlation of the b * component.
- the larger the coefficients e 0 and e 1 representing the width the more ambiguity is included in the graph. Therefore, as shown in FIG. 23A, it is considered that better correction can be performed when the upper and lower graphs showing the upper limit and the lower limit are separated.
- the statistical value of the color difference ⁇ E between the correction value and the true value (the color measurement value by the colorimeter shown in FIG. 18B) when the measurement target L * a * b * value is corrected by using the correlation by the Fuzzy regression analysis is shown in FIG. It is shown in 19.
- the correlation by Fuzzy regression analysis is used, the maximum value of the color difference ⁇ E is smaller than that when the correlation by linear approximation is used, and it can be said that the estimation accuracy is improved.
- the color difference ⁇ E (hereinafter referred to as ⁇ E 1 ) calculated based on the Fuzzy regression analysis is more than the color difference ⁇ E (hereinafter referred to as ⁇ E 1 ) calculated based on the linear approximation from the measurement targets shown in FIG. 18B.
- ⁇ E F is smaller than the measurement target.
- a frequency distribution was created for each component of the L * a * b * values for all the measurement targets and the measurement targets for which ⁇ E 1 > ⁇ E F , respectively.
- the distribution of the measurement targets having a color difference of ⁇ E 1 > ⁇ E F is shifted to the larger value as compared with the distribution of all the measurement targets. This suggests that when the color to be measured is bright, the accuracy of color estimation is improved by using the Fuzzy regression analysis.
- the regression analysis method for obtaining the correlation between the measured color sample value and the color sample reference value is selected according to the color gamut of the measurement target. It is possible to prevent deterioration of estimation accuracy and suppress calculation cost at the same time.
- the color gamut to which the color of the measurement target belongs is determined by the color measurement system 10 based on the measured RGB values of the measurement target (step S35 in FIG. 17), but the user determines. It may be a thing. In this case, the user visually confirms the color of the measurement target, and inputs the color gamut to which this color belongs to the color measurement system 10 using the operation input unit 13. In response to this, the color gamut selection unit 163 selects the color gamut of the measurement target 1 according to the signal input from the operation input unit 13.
- the color gamut is determined to some extent by the measurement target, such as when the measurement target is a test paper or solution containing reagents used in biochemical experiments or biological tests, set the color gamut in advance for each measurement target. You can leave it.
- the analysis target by color measurement and the measurement target (test paper or reagent used for analysis) are input to the color measurement system 10 by using the operation input unit 13.
- the color gamut may be set automatically.
- the regression analysis method may be automatically set according to the color gamut by inputting the analysis target or the measurement target.
- a program in which a color gamut is set in advance may be prepared for each analysis target by color measurement or a measurement target such as a test paper or a reagent used for analysis.
- the regression analysis method (step S36) selected according to the color gamut is also determined in advance, the regression analysis method may be set and programmed in advance according to the analysis target and the measurement target. .. Therefore, in this case, steps S35 and S36 of FIG. 17 can be omitted. That is, in this case, assuming that it is set to acquire the correlation using, for example, a linear function based on the analysis target and the measurement target, the color sample and the measurement target are imaged to obtain the actual RGB value of the color sample.
- the measured RGB value of the measurement target is acquired (steps S30 to S32), and then the color sample measured RGB value and the measurement target measured RGB value are obtained as the color sample measured L * a * b * value and the measurement target measured L * a * b *. Convert each to a value (step S33), and obtain the correlation between the measured color sample L * a * b * value and the color sample L * a * b * reference value using a linear function (steps S34 and S37). , The measurement target estimation L * a * b * value is acquired using the acquired correlation (step S38), and the measurement target estimation L * a * b * value is converted into an RGB value or an HLS value as necessary. A series of processes of storing the measurement target estimated value (step S39) is executed.
- the color sample reference L * a * b * value is converted into the color sample reference RGB value, further converted into the color sample reference HLS value, and the color sample measured RGB value.
- the measured RGB value of the measurement target is converted into the color sample actual measurement HLS value and the measurement target actual measurement HLS value, respectively, and the correlation between the color sample reference HLS value and the color sample actual measurement HLS value is obtained, and the measurement target actual measurement is performed using this correlation.
- the HLS value may be corrected.
- FIG. 25 is a flowchart showing the arithmetic processing in the modified example 2-4 of the second embodiment.
- step S25 L * a * b * color space is determined as the color space to be calculated in step S25 of FIG. 3 (step S25: L * a * b * )
- the actual measurement value acquisition unit in step S241 of FIG. 164 converts the color sample actual measurement RGB value and the measurement target actual measurement RGB value into the color sample actual measurement L * a * b * value and the measurement target actual measurement L * a * b * value, respectively.
- the reference value acquisition unit 165 acquires the color sample reference L * a * b * value of the color sample imaged in step S20.
- step S243 the correlation acquisition unit 166 selects a regression analysis method according to the color gamut selected in step S23 of FIG.
- the method of selecting the method and the method to be selected are the same as in step S36 of FIG.
- one of the methods such as regression analysis using a linear function, regression analysis using a quadratic function, and Fuzzy regression analysis, depending on the ease with which the estimation accuracy of the selected color gamut decreases. The method is selected.
- step S244 the correlation acquisition unit 166 performs regression analysis using the method selected in step S243 to obtain the color sample reference L * a * b * value and the color sample actual measurement L * a * b * value. Get the correlation of.
- steps S245 to S247 are the same as steps S224 to S226 of FIG.
- the color space for performing the calculation for acquiring the correlation between the measured value of the color sample and the reference value and the correlation are obtained according to the color gamut to which the color to be measured belongs. Since the regression analysis method is selected, it is possible to improve the estimation accuracy of the color to be measured and to suppress the calculation cost.
- Modification 2-5) In the above-described modification 2-4 as well, a program in which the color gamut is set in advance may be prepared for each analysis target and measurement target, as in the above-mentioned modification 2-2.
- the color space for performing the calculation and the regression analysis method may be preset and programmed according to the color gamut. That is, in this case, assuming that it is set to acquire the correlation using a linear function in the L * a * b * color space based on the analysis target and the measurement target, the color sample and the measurement target are imaged.
- the color sample actual measurement RGB value and the measurement target actual measurement RGB value are acquired, and then the color sample actual measurement RGB value and the measurement target actual measurement RGB value are obtained as the color sample actual measurement L * a * b * value and the measurement target actual measurement L * a.
- * b * Convert each to a value, use a linear function to acquire the correlation between the measured color sample L * a * b * value and the color sample L * a * b * reference value, and use the acquired correlation.
- the measurement target estimation L * a * b * value is acquired, and the measurement target estimation L * a * b * value is converted into an RGB value or an HLS value as needed, and then the measurement target estimation value is stored. The process is executed.
- FIG. 26 is a flowchart showing a color measuring method according to a third embodiment of the present invention.
- the schematic configuration of the color measurement system that executes the color measurement method according to the present embodiment is the same as that of the first embodiment (see FIG. 2), and details of the processing executed by each unit included in the calculation unit 16. However, it is different from the first embodiment.
- step S50 the user selects a color sample according to the measurement target.
- 27 and 28 are schematic views for explaining a method of selecting a color sample.
- the color difference ⁇ E is relatively small for each of the two or more representative colors included in the specific color range. It is preferable to select a color from a color sample (for example, a sample book) having a color gamut corresponding to the specific color range.
- a color sample for example, a sample book
- a solution containing a test strip or reagent used in a biochemical experiment, a biological test, or the like continuously changes in a specific color range. Therefore, when such a test paper or the like is to be measured, the above-mentioned color sample selection method can be used.
- the above-mentioned color sample selection method can also be used when measuring changes over time such as the color of the wall and the growing plant.
- the colors at both ends of the range in which the color to be measured can change (or exist) can be selected.
- a close color sample 30a, 30i and a color sample 30e close to the center color of this range are selected, and a color measurement color slip 31 including these color samples 30a, 30e, 30i is created.
- a ready-made color chart for color measurement including these color samples 30a, 30e, 30i it may be used.
- the color of the measurement target can change over a plurality of color ranges (for example, when the color changes from a red region to a blue region like a Lithomas test paper), or when there are a plurality of measurement targets (for example, a plurality of objects).
- the color to be measured is close to the representative color in the range where the color can change (can exist) (
- a color having a small color difference ⁇ E) may be selected from the color samples of each color range.
- it is preferable to select the color sample if there is a color sample that can be shared among the color samples in each color range, it is preferable to select the color sample. This is because the total number of color samples can be reduced.
- the range in which the color to be measured can change (or exist) in the color gamut.
- the color swatches 33a and 33i near both ends of the range and the color swatches 33e close to the center color of this range are selected.
- the colors at both ends and the center of the range in which the color to be measured can change (or exist) in the color gamut.
- a color swatch that is close to the color is selected.
- the color swatch 33a included in the color swatch group 33 and the color swatch 34b included in the color swatch group 34 have the same or neighboring colors, it is preferable that the color swatch from the color swatch group 34 has this color swatch.
- 34b a color sample 34e near the center, and a color sample 34i near the other end are selected.
- five color samples 33a (34b), 33e, 33i, 34e, and 34i are extracted from the two color sample groups 33 and 34, and a color measurement color chart 35 including these color samples is created.
- 33e, 33i, 34e, 34i it may be used.
- step S51 following step S50 the color measurement system 10 acquires a color sample and an actually measured value of the color to be measured.
- the imaging unit 12 images the color sample and the measurement target selected in step S50 in the same manner as in step S20 of FIG.
- image data of the selected color sample and the image of the measurement target is generated and input to the calculation unit 16.
- the calculation unit 16 recognizes the color sample and the area to be measured in the image based on the input image data in the same manner as in step S21 of FIG.
- the calculation unit 16 acquires the color sample actual measurement value and the measurement target actual measurement value from the pixel values of the region recognized from the image in the same manner as in step S22 of FIG.
- the calculation unit 16 acquires the color sample reference value of the selected color sample.
- the method in which the calculation unit 16 specifies the selected color sample is not particularly limited.
- the user inputs information for identifying a color sample (for example, a color code) using the operation input unit 13, and the calculation unit 16 specifies the color sample based on the signal input from the operation input unit 13. May be.
- information for identifying the color sample for example, a barcode
- the calculation unit 16 may automatically read the information from the image to specify the color sample.
- the position information of the color sample in the color chart for color measurement is stored in the color measurement system 10 in advance, and the calculation unit 16 analyzes the position information from the image in which the color sample is captured to specify the color sample. Is also good.
- the calculation unit 16 reads the color sample reference value of the specified color sample from the color sample reference value storage unit 152.
- the calculation unit 16 acquires the correlation between the color sample actual measurement value and the color sample reference value. That is, the coefficient of the regression equation is obtained for each component by performing regression analysis for each component using the measured color sample value and the color sample reference value as variables.
- the color space for performing this calculation may be fixed to a specific color space (for example, L * a * b * color space), or may be measured from a plurality of color spaces as in the first embodiment.
- the color space may be selected according to the color gamut to which the target color belongs (that is, according to the selected color swatch).
- the regression analysis method may be fixed to regression analysis using a specific function (for example, a linear function), or may be measured from among a plurality of types of regression analysis methods as in the second embodiment.
- the method may be selected according to the color gamut to which the color of interest belongs (ie, according to the selected color swatch).
- step S54 the calculation unit 16 acquires the measured target estimated value by correcting the measured target measured value using the correlation acquired in step S53. After acquiring the measurement target estimation value, the measurement target estimation value may be converted into a value in another color space, if necessary.
- step S55 the calculation unit 16 stores the measurement target estimated value acquired in step S54 in the estimated value storage unit 156.
- the color sample is selected according to the measurement target, it is possible to obtain a correlation that more closely fits the color of the measurement target. Therefore, the accuracy of estimating the color of the measurement target can be improved, and the color of the measurement target can be estimated with stable accuracy.
- the color space for acquiring the correlation between the reference value of the color sample and the measured value and performing the calculation for correcting the measured value to be measured is set to the selected color sample.
- the color samples are selected according to the color measurement target, but the color samples may be determined in advance according to the specific color measurement target.
- the color gamut of the measurement target and the range in which the color of the measurement target changes are known in advance. is there.
- Specific examples of such measurement targets include the concentration and content of specific substances contained in liquids such as environmental natural water, purified water, sewage, industrial processed water, chemicals (chemical solutions), food waters, and chemical waters.
- a test paper for measuring characteristics such as pH or a test for measuring characteristics such as concentration, content, or pH of a specific substance contained in a solution containing a reagent, blood, urine, bone marrow, or other biological fluid.
- Specific substances contained in paper, solid extract (food extract, soil extract), solution containing test paper or reagent for measuring characteristics such as concentration, content, or pH of specific substances examples thereof include test papers for measuring characteristics such as concentration, content, and pH of a substance (chemical gas, etc.).
- three colors in the vicinity of both ends and the vicinity of the intermediate color in the reaction color range of the test paper or the test solution may be determined as color samples.
- the neutral color it is preferable to determine a color corresponding to an inflection point in which the color change is large.
- the colors near both ends and the intermediate colors of the reaction color range in each color gamut may be used as a color sample as in the third embodiment.
- a color space (for example, L * a * b * color space, RGB color space, HLS color space) that acquires the correlation between the color sample measured value and the color sample reference value and corrects the measured value to be measured.
- a regression analysis method for acquiring a correlation (for example, a regression analysis using a linear function or a quadratic function, a Fuzzy regression analysis; see the second embodiment) are also measurement targets or. It may be determined in advance according to the color range of two or more color samples. That is, it is possible to prepare a program preset so that various processes are suitable for a measurement target such as a specific test paper and two or more color samples used. In this case, step S50 of FIG.
- the color sample actual measurement RGB value and the measurement target actual measurement are performed.
- the RGB value is acquired (step S51), the color sample L * a * b * reference value of the above two or more color samples is read out from the color sample reference value storage unit 152 (step S52), and then the color sample actually measured RGB value.
- step S53 After converting the measured RGB value of the measurement target into the color sample actual measurement L * a * b * value and the measurement target actual measurement L * a * b * value, respectively, the color sample actual measurement L * a * b * value and the color sample L * Acquire the correlation with the a * b * reference value (step S53), acquire the measurement target estimation L * a * b * value using the acquired correlation (step S54), and estimate the measurement target as necessary.
- step S55 A series of processes of converting the L * a * b * value into an RGB value or an HLS value and then storing the measurement target estimated value is executed.
- the correlation between the measured color sample value and the color sample reference value is high by using two or more color samples that are determined in advance according to the analysis target by color measurement and the measurement target. can do. Therefore, it is possible to estimate the color of the measurement target with high accuracy by correcting the measured value of the measurement target using such a correlation between the two.
- the color space for acquiring the correlation and the regression analysis method used for acquiring the correlation are appropriately determined in advance according to the measurement target or the color gamut of two or more color samples. Can be kept. Therefore, the measurement target is imaged together with the analysis target by the color measurement and two or more color samples determined in advance according to the measurement target, and the regression analysis is performed in the predetermined color space by using the predetermined method. As a result, the correlation between the measured color sample value and the color sample reference value can be accurately obtained. Therefore, by correcting the measured value of the measurement target using such a correlation, it is possible to estimate the color of the measurement target with high accuracy.
- the color measuring method according to the fourth embodiment of the present invention measures the process (step S50) of selecting a color sample according to the color gamut in the color measuring method according to the third embodiment (see FIG. 26).
- the color system 10 executes it.
- the schematic configuration of the color measurement system that executes the color measurement method according to the present embodiment is the same as that of the first embodiment (see FIG. 2), and details of the processing executed by each unit included in the calculation unit 16. However, it is different from the first embodiment.
- FIG. 29 is a flowchart showing a process of selecting a color sample according to the color gamut in the present embodiment.
- FIG. 30 is a schematic diagram showing a color measurement color chart used in the method for selecting a color sample in the present embodiment.
- the color measurement color chart 40 shown in FIG. 30 includes a base material 40a and a plurality of color samples classified and arranged for each color gamut on the base material 40a.
- the color swatches are classified into a plurality of color swatch groups 41 to 49.
- the color sample reference value storage unit 152 shown in FIG. 2 stores color sample reference values of a plurality of color samples (36 colors in FIG. 30) included in these color sample groups 41 to 49.
- FIG. 31 is a schematic diagram showing an L * a * b * color space.
- the plurality of color swatches shown in FIG. 30 are classified according to a plurality of regions defined by dividing the L * a * b * color space.
- the L * a * b * color space is defined as the first region in which the a * component and the b * component are near zero, and the region obtained by excluding the first region from the L * a * b * color space.
- the achromatic color region, the blue region with high brightness, the blue region with low brightness, and the brightness are reduced. High yellow areas, low lightness yellow areas, high lightness green areas, low lightness green areas, high lightness red areas, and low lightness red areas are defined.
- step S520 the imaging unit 12 images a color chart for color measurement including a plurality of color sample groups and a measurement target. That is, the color measurement slip 40 shown in FIG. 30 is imaged together with the measurement target. As a result, the image data of the color measurement slip 40 and the image of the measurement target are input to the calculation unit 16.
- the calculation unit 16 recognizes the color sample and the area to be measured in the color measurement color chart in the image. Specifically, the actually measured value acquisition unit 164 obtains the image areas of the plurality of color samples and the image areas to be measured included in the color sample groups 41 to 49 captured in the image based on the image data input in step S520. recognize. The method of recognizing these image regions is the same as in step S21 of FIG.
- the calculation unit 16 acquires the color sample actual measurement RGB value and the measurement target actual measurement RGB value from the pixel value of the region recognized from the image.
- the measured RGB values of the color swatches are acquired for each of the plurality of color swatches included in the color swatch groups 41 to 49.
- the calculation unit 16 converts the color sample actual measurement RGB value and the measurement target actual measurement RGB value into the color sample actual measurement L * a * b * value and the measurement target actual measurement L * a * b * value, respectively.
- the calculation unit 16 determines the color difference ⁇ E (see equation (16)) between the color sample actual measurement L * a * b * value and the measurement target actual measurement L * a * b * value. calculate.
- the color gamut selection unit 163 selects a color sample included in the color sample group to which the color sample having the smallest color difference ⁇ E belongs. For example, when the color difference ⁇ E of the color sample 43a included in the color sample group 43 is the smallest among the 36 color samples included in the color sample groups 41 to 49, the four color samples 43a to included in the color sample group 43 43d is selected.
- the calculation unit 16 acquires the color sample reference L * a * b * value of the selected color sample. For example, when four color samples 43a to 43d are selected, the calculation unit 16 reads the color sample reference values of these color samples 43a to 43d from the color sample reference value storage unit 152. After that, the process returns to the main routine.
- step S51 the selected color sample and the measured value of the measurement target are acquired based on the image data generated in step S50. Specifically, the color sample actual measurement RGB value and the measurement target actual measurement RGB value acquired in step S522, or the color sample actual measurement L * a * b * value and the measurement target actual measurement L * a * b * converted in step S523 . The value is used as is.
- a color sample corresponding to the color gamut of the measurement target can be appropriately and automatically selected from a plurality of color samples. Therefore, a correlation that fits the color of the measurement target can be easily obtained, and by using such a correlation, the estimation accuracy of the color of the measurement target can be improved and the accuracy is stable. It is possible to estimate the color of the measurement target with.
- the color space for acquiring the correlation between the measured value of the color sample and the reference value and performing the calculation (see steps S53 and S54 in FIG. 26) for correcting the measured value to be measured is selected. It may be determined according to the color sample (color sample group). In this case, it is advisable to set in advance the color space for performing the above calculation for each color sample group (that is, for each color gamut corresponding to the region obtained by dividing the L * a * b * color space shown in FIG. 31). .. As a specific example, among the color measurement tags 40 shown in FIG.
- the color sample group 41 in the achromatic color region, the color sample group 43 in the blue region with low lightness, the color sample group 45 in the yellow region with low lightness, and the lightness are
- the RGB color space may be set to be determined.
- a color sample group 42 in a blue region with high lightness, a color sample group 44 in a yellow region with high lightness, a color sample group 46 in a green region with high lightness, or a color sample group 48 in a red region with high brightness are selected.
- the L * a * b * color space may be set so as to be determined.
- the color of the measurement target can be more accurately and stably measured. It becomes possible to estimate.
- the color sample (color sample group) selected in step S525 is used.
- the area to be measured may be divided into a plurality of sections, and the color gamut may be determined for each section.
- the measurement target estimated value is applied to all sections. It may be converted to a value in a common color space.
- Image data storage Unit 154 ... Measured value storage unit, 155 ... Correlation function storage unit, 156 ... Estimated value storage unit, 161 ... Image data acquisition unit, 162 ... Display control unit, 163 ... Color range selection unit, 164 ... Measured value acquisition unit, 165 ... Reference value acquisition unit, 166 ... Correlation acquisition unit, 167 ... Correction unit
Landscapes
- Engineering & Computer Science (AREA)
- Physics & Mathematics (AREA)
- Spectroscopy & Molecular Physics (AREA)
- General Physics & Mathematics (AREA)
- Health & Medical Sciences (AREA)
- Theoretical Computer Science (AREA)
- Computer Vision & Pattern Recognition (AREA)
- Biomedical Technology (AREA)
- General Health & Medical Sciences (AREA)
- Multimedia (AREA)
- Signal Processing (AREA)
- Spectrometry And Color Measurement (AREA)
- Image Analysis (AREA)
- Facsimile Image Signal Circuits (AREA)
- Color Image Communication Systems (AREA)
Priority Applications (1)
| Application Number | Priority Date | Filing Date | Title |
|---|---|---|---|
| JP2021507357A JP7248227B2 (ja) | 2019-03-18 | 2020-03-17 | 測色方法、測色システム、測色プログラム、及び、測色用色票 |
Applications Claiming Priority (2)
| Application Number | Priority Date | Filing Date | Title |
|---|---|---|---|
| JP2019050531 | 2019-03-18 | ||
| JP2019-050531 | 2019-03-18 |
Publications (1)
| Publication Number | Publication Date |
|---|---|
| WO2020189660A1 true WO2020189660A1 (ja) | 2020-09-24 |
Family
ID=72520881
Family Applications (1)
| Application Number | Title | Priority Date | Filing Date |
|---|---|---|---|
| PCT/JP2020/011626 Ceased WO2020189660A1 (ja) | 2019-03-18 | 2020-03-17 | 測色方法、測色システム、測色プログラム、及び、測色用色票 |
Country Status (2)
| Country | Link |
|---|---|
| JP (1) | JP7248227B2 (https=) |
| WO (1) | WO2020189660A1 (https=) |
Cited By (6)
| Publication number | Priority date | Publication date | Assignee | Title |
|---|---|---|---|---|
| CN114676999A (zh) * | 2022-03-18 | 2022-06-28 | 成都飞机工业(集团)有限责任公司 | 一种飞机外观漆料涂层颜色质量控制及评价方法 |
| US20220268630A1 (en) * | 2021-02-22 | 2022-08-25 | Seiko Epson Corporation | Color measuring system and program |
| CN115508276A (zh) * | 2021-06-23 | 2022-12-23 | 中国石油化工股份有限公司 | 水质检测方法、检测装置及检测系统 |
| JP2023128616A (ja) * | 2022-03-04 | 2023-09-14 | トヨタ自動車株式会社 | コンピュータプログラム、水質判定装置、水質判定システム、および、水質判定方法 |
| JP2024011601A (ja) * | 2022-07-15 | 2024-01-25 | 国立大学法人秋田大学 | 色推定方法、色推定装置、及び、色推定プログラム |
| JP2024013721A (ja) * | 2022-07-21 | 2024-02-01 | 浩太郎 久保 | 色補正カラーチャート付識別治具及びそのラベル |
Citations (6)
| Publication number | Priority date | Publication date | Assignee | Title |
|---|---|---|---|---|
| JPH05223642A (ja) * | 1992-02-14 | 1993-08-31 | Pola Chem Ind Inc | 測色方法及びその装置 |
| JPH05322657A (ja) * | 1992-05-15 | 1993-12-07 | Toyota Central Res & Dev Lab Inc | スキャナ分光測色装置 |
| US20070071314A1 (en) * | 2005-09-09 | 2007-03-29 | Nina Bhatti | Capture and systematic use of expert color analysis |
| JP2014041115A (ja) * | 2012-07-27 | 2014-03-06 | Pola Chem Ind Inc | 測色装置、並びに該測色装置により得られた色情報を有する肌色マップ |
| JP2017125840A (ja) * | 2016-01-13 | 2017-07-20 | 凸版印刷株式会社 | 呈色反応検出システム、呈色反応検出方法及びプログラム |
| US20180177434A1 (en) * | 2016-12-28 | 2018-06-28 | Ajou University Industry-Academic Cooperation Foundation | Image based jaundice diagnosing method and apparatus and image based jaundice diagnosis assisting apparatus |
Family Cites Families (1)
| Publication number | Priority date | Publication date | Assignee | Title |
|---|---|---|---|---|
| CN109417586B (zh) | 2016-06-30 | 2021-10-12 | 株式会社隆创 | 颜色变换系统、颜色变换装置以及颜色变换方法 |
-
2020
- 2020-03-17 WO PCT/JP2020/011626 patent/WO2020189660A1/ja not_active Ceased
- 2020-03-17 JP JP2021507357A patent/JP7248227B2/ja active Active
Patent Citations (6)
| Publication number | Priority date | Publication date | Assignee | Title |
|---|---|---|---|---|
| JPH05223642A (ja) * | 1992-02-14 | 1993-08-31 | Pola Chem Ind Inc | 測色方法及びその装置 |
| JPH05322657A (ja) * | 1992-05-15 | 1993-12-07 | Toyota Central Res & Dev Lab Inc | スキャナ分光測色装置 |
| US20070071314A1 (en) * | 2005-09-09 | 2007-03-29 | Nina Bhatti | Capture and systematic use of expert color analysis |
| JP2014041115A (ja) * | 2012-07-27 | 2014-03-06 | Pola Chem Ind Inc | 測色装置、並びに該測色装置により得られた色情報を有する肌色マップ |
| JP2017125840A (ja) * | 2016-01-13 | 2017-07-20 | 凸版印刷株式会社 | 呈色反応検出システム、呈色反応検出方法及びプログラム |
| US20180177434A1 (en) * | 2016-12-28 | 2018-06-28 | Ajou University Industry-Academic Cooperation Foundation | Image based jaundice diagnosing method and apparatus and image based jaundice diagnosis assisting apparatus |
Cited By (9)
| Publication number | Priority date | Publication date | Assignee | Title |
|---|---|---|---|---|
| US20220268630A1 (en) * | 2021-02-22 | 2022-08-25 | Seiko Epson Corporation | Color measuring system and program |
| US11940327B2 (en) * | 2021-02-22 | 2024-03-26 | Seiko Epson Corporation | Color measuring system and program |
| CN115508276A (zh) * | 2021-06-23 | 2022-12-23 | 中国石油化工股份有限公司 | 水质检测方法、检测装置及检测系统 |
| JP2023128616A (ja) * | 2022-03-04 | 2023-09-14 | トヨタ自動車株式会社 | コンピュータプログラム、水質判定装置、水質判定システム、および、水質判定方法 |
| JP7677188B2 (ja) | 2022-03-04 | 2025-05-15 | トヨタ自動車株式会社 | コンピュータプログラム、水質判定装置、水質判定システム、および、水質判定方法 |
| CN114676999A (zh) * | 2022-03-18 | 2022-06-28 | 成都飞机工业(集团)有限责任公司 | 一种飞机外观漆料涂层颜色质量控制及评价方法 |
| CN114676999B (zh) * | 2022-03-18 | 2024-05-14 | 成都飞机工业(集团)有限责任公司 | 一种飞机外观漆料涂层颜色质量控制及评价方法 |
| JP2024011601A (ja) * | 2022-07-15 | 2024-01-25 | 国立大学法人秋田大学 | 色推定方法、色推定装置、及び、色推定プログラム |
| JP2024013721A (ja) * | 2022-07-21 | 2024-02-01 | 浩太郎 久保 | 色補正カラーチャート付識別治具及びそのラベル |
Also Published As
| Publication number | Publication date |
|---|---|
| JPWO2020189660A1 (https=) | 2020-09-24 |
| JP7248227B2 (ja) | 2023-03-29 |
Similar Documents
| Publication | Publication Date | Title |
|---|---|---|
| JP7248227B2 (ja) | 測色方法、測色システム、測色プログラム、及び、測色用色票 | |
| Fan et al. | Digital image colorimetry on smartphone for chemical analysis: A review | |
| Mendoza et al. | Calibrated color measurements of agricultural foods using image analysis | |
| Stiglitz et al. | Evaluation of an inexpensive sensor to measure soil color | |
| US10169881B2 (en) | Analysis device, system and program | |
| Horta-Velazquez et al. | The optimal color space enables advantageous smartphone-based colorimetric sensing | |
| US7024034B2 (en) | Color temperature conversion system and method using the same | |
| Jacobson et al. | Design goals and solutions for display of hyperspectral images | |
| US9506855B2 (en) | Method and system for analyzing a colorimetric assay | |
| US10200582B2 (en) | Measuring device, system and program | |
| CN103503027B (zh) | 摄像装置所用的颜色校准方法 | |
| Fyfe et al. | RGB color correction and gamut limitations in smartphone-based kinetic analysis of chemical reactions: C. Fyfe et al. | |
| Sirisathitkul et al. | Accuracy and precision of smartphone colorimetry: A comparative analysis in RGB, HSV, and CIELAB color spaces for archaeological research | |
| Simone et al. | Complex process of image color correction: a test of a target-based framework | |
| Menon et al. | Development of a smartphone enabled, paper-based quantitative diagnostic assay using the HueDx color correction system | |
| Naeimi et al. | Optimizing image-based soil organic matter prediction: Effects of illumination type and intensity | |
| JP2010157988A (ja) | 色評価方法及び色評価システム | |
| Nikkanen | Color constancy by characterization of illumination chromaticity | |
| Czech et al. | Estimation of daylight spectral power distribution from uncalibrated hyperspectral radiance images | |
| Manfredi et al. | A Novel Digital-Camera Characterization Method for Pigment Identification in Cultural Heritage | |
| Van Nhat et al. | Application of Artificial Intelligence in Enhancing the Accuracy of Colorimetry Using Optical Methods | |
| Williams et al. | Targeting for important color content: near neutrals and pastels | |
| Olejnik‐Krugly et al. | Precise color capture using custom color targets | |
| JP2021103835A (ja) | 対象物の色を数値化する方法、信号処理装置、および撮像システム | |
| Sumriddetchkajorn | Mobile-based Colorimeter with a Hybrid Machine Learning Approach for Enhanced Accuracy |
Legal Events
| Date | Code | Title | Description |
|---|---|---|---|
| 121 | Ep: the epo has been informed by wipo that ep was designated in this application |
Ref document number: 20772718 Country of ref document: EP Kind code of ref document: A1 |
|
| ENP | Entry into the national phase |
Ref document number: 2021507357 Country of ref document: JP Kind code of ref document: A |
|
| NENP | Non-entry into the national phase |
Ref country code: DE |
|
| 122 | Ep: pct application non-entry in european phase |
Ref document number: 20772718 Country of ref document: EP Kind code of ref document: A1 |