WO2020183781A1 - Abnormality diagnosis device - Google Patents
Abnormality diagnosis device Download PDFInfo
- Publication number
- WO2020183781A1 WO2020183781A1 PCT/JP2019/043475 JP2019043475W WO2020183781A1 WO 2020183781 A1 WO2020183781 A1 WO 2020183781A1 JP 2019043475 W JP2019043475 W JP 2019043475W WO 2020183781 A1 WO2020183781 A1 WO 2020183781A1
- Authority
- WO
- WIPO (PCT)
- Prior art keywords
- data
- abnormality
- degree
- operation data
- category
- Prior art date
Links
Images


Classifications
-
- G—PHYSICS
- G05—CONTROLLING; REGULATING
- G05B—CONTROL OR REGULATING SYSTEMS IN GENERAL; FUNCTIONAL ELEMENTS OF SUCH SYSTEMS; MONITORING OR TESTING ARRANGEMENTS FOR SUCH SYSTEMS OR ELEMENTS
- G05B23/00—Testing or monitoring of control systems or parts thereof
- G05B23/02—Electric testing or monitoring
Definitions
- the present invention relates to a plant or device abnormality diagnostic device.
- thermometers Many sensors such as thermometers, pressure gauges and flow meters are installed in power plants and related equipment for the purpose of monitoring and control.
- sensors such as acceleration sensors have been installed in infrastructure equipment such as bridges and roads to monitor the condition of the equipment.
- the feature of such sensor data is that there are multiple related sensor data and it is multidimensional time series data measured in a certain time cycle.
- Various methods have been proposed as condition monitoring methods that utilize such multidimensional time series data.
- Patent Document 1 As a technique using adaptive resonance theory, "it belongs to a category in which a plurality of measurement data from various sensors installed in a plant to be diagnosed are discriminated from normal data by adaptive resonance theory.
- a plant abnormality diagnosis device characterized by comprising an abnormality degree calculation unit for obtaining an abnormality degree of the entire plant to be diagnosed based on a difference in spatial distance between the data and the plurality of measurement data is disclosed. ..
- ART Adaptive Resonance Theory
- ART Adaptive Resonance Theory
- Patent Document 1 as shown in FIG. 1, an abnormality in equipment is detected based on operation data (diagnosis data) in which normal operation data (learning data) deviates from the classified category (normal category).
- diagnosis data normal operation data
- learning data learning data
- the degree of abnormality and the degree of abnormality contribution are calculated based on the difference between the normal data and the current measurement data.
- the degree of abnormality indicates the degree of abnormality in the data.
- the anomaly degree vector decomposed into the components of each measured value is defined as the anomaly contribution degree.
- the anomalous contribution indicates which signal has a large deviation from normal.
- FIG. 4 shows a situation in which new data m is measured in the vicinity in addition to the state in which the data k shown in FIGS. 2 and 3 is abnormal.
- the normal category closest to the data k is category 3, but the normal category closest to the data m is category 1.
- the values of the degree of anomaly of both data do not change significantly, but the degree of anomaly contribution changes significantly. That is, in the data k, the abnormal contribution of x2 was large, whereas in the data m, the abnormal contribution of the data x1 was large.
- the abnormality diagnosis device has "a category calculation unit that classifies the operation data output from a plurality of sensors provided in the diagnosis target into a plurality of categories, and a reference of the plurality of categories. It is provided with a data classification unit having a reference point calculation unit for calculating points, an abnormality degree calculation unit for comparing the reference point with the current operation data, and calculating the abnormality degree of the current operation data, and the reference point is , It is a weighted average of two or more categories out of a plurality of categories.
- the present invention has the above configuration, the anomaly contribution degree does not change significantly in the measurement data in the vicinity, and the accuracy of estimating the cause of the anomaly can be improved.
- the figure which shows the method of classifying the conventional data The figure which shows the example which calculated the degree of abnormality by the conventional method.
- the figure which shows the problem when the anomalous contribution degree is calculated by the conventional method.
- the figure which shows the structure of the Example of this invention The figure which shows the example of the operation data stored in the operation data database.
- the figure which shows the calculation method of the degree of abnormality of this invention The figure which shows an example of the trend graph of the classified category.
- the figure which shows the example which calculated the degree of abnormality by the conventional method using the test data The figure which shows the example which calculated the anomaly contribution degree by a conventional method using test data.
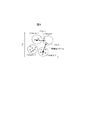
- FIG. 5 shows a configuration according to an embodiment of the present invention.
- This embodiment is an example in which the diagnostic apparatus of the present invention is used for abnormal diagnosis of a plant, and includes a plant 10, an operation data database 20, a data classification unit 30, a classification result database 40, and a display / operation unit 50.
- the outline of each component is described below.
- the target of abnormality diagnosis is not limited to plants, but can be applied to other devices and the like.
- Plant 10 is equipped with a sensor and is used for plant control and monitoring.
- sensors include, but are not limited to, flow meters, thermometers, pressure gauges, and the like.
- the operation data of the plant measured by the sensor of the plant 10 is stored as time-series data every minute, for example.
- the operation data designated as normal data by the display / operation unit 50 is cut out as learning data and sent to the data classification unit 30.
- the operation data database 20 also temporarily stores the data measured in real time by the plant 10, and then sends it to the data classification unit 30 as diagnostic data at regular intervals.
- the data classification unit 30 classifies multidimensional operation data into a plurality of categories by using an ART-based clustering algorithm (hereinafter referred to as improved ART).
- improved ART an ART-based clustering algorithm
- the input data is classified into multiple categories (clusters), and the classified category numbers are assigned to each input data.
- a category represents a group of data having similarities, and input data to which the same category number is assigned has a high degree of similarity.
- the operation data (learning data) in the normal state of the equipment is input to ART. Since ART classifies driving data (learning data) into multiple categories according to the similarity of data, it defines the category (normal category) to be generated when the driving data is normal.
- the driving data (diagnosis data) to be diagnosed is input to the ART that has learned the normal data.
- the data having a high degree of similarity to the learning data is classified into the same category as the learning phase.
- the tendency of the data changes, such as when some abnormality occurs in the equipment, it is classified into a category (new category) different from the training data.
- the data classification device 30 using the improved ART according to this embodiment outputs, as the data classification result, the category number in which the input multidimensional data is classified, the degree of abnormality, and the degree of abnormality contribution of each measurement data.
- the classification result database 40 manages the category number, the degree of anomaly, and the degree of anomaly contribution output from the data classification unit 30. In addition, the weighting coefficient that is the basis for selecting each category and the centroid data of the data classified into each category are saved.
- the display / operation unit 50 sets the conditions for learning data and diagnostic data.
- the operation data measured by the sensor of the plant 10 is determined to be learning data or diagnostic data based on this condition.
- the display / operation unit 50 displays a trend graph of the category number, the degree of abnormality, and the degree of abnormality contribution.
- the display / operation unit 50 may be configured such that the display unit and the operation unit are separated from each other.
- Plant 10 is composed of equipment and pipes, valves, etc. that connect it. Sensors such as flowmeters, thermometers, and pressure gauges are installed in the equipment and piping to monitor and control the condition of the plant. For example, in the case of a thermometer, these sensors are tagged with "TIC001". This tag becomes the ID of each sensor, and each sensor is identified by the ID.
- the operation data database 20 records the data measured by the sensor of the plant 10 as time series data.
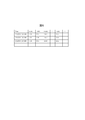
- An example of operation data is shown in FIG. As shown in FIG. 6, as the operation data for each hour measured by the sensor installed in the plant 10, the time when the operation data was measured is in the "Time” column, and "FIC001" and "PIC001" are in the other columns.
- the value measured by the sensor specified by the ID such as is recorded. This time interval can be arbitrarily specified, but in this embodiment, it is set to 1 minute.
- the data classification unit 30 classifies the operation data using the improved ART.
- the detailed configuration of the data classification unit 30 is shown in FIG.
- the data classification unit 30 includes a category calculation unit 31, a reference value calculation unit 32, an abnormality degree calculation unit 33, and an abnormality contribution calculation unit 34.
- the category calculation unit 31 classifies the driving data into categories according to the similarity of the driving data.
- the category in which driving data (learning data) is classified in the learning phase is regarded as a normal category. Since detailed algorithms for classifying into categories are described in Non-Patent Document 1 and Patent Document 1, description thereof will be omitted here.
- the reference point calculation unit 32 calculates a reference point for calculating the degree of abnormality.
- the degree of abnormality is calculated based on the deviation information between the reference point and the current operation data (diagnostic data).
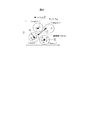
- a method of calculating the degree of abnormality according to the present invention will be described with reference to FIG. In the present embodiment, it is calculated by equation (1) the weighted average g a of the center of gravity of the normal range as a reference point.
- g i is the normal categories j of the centroid vector (coordinates)
- d i (k) is the distance from g i to the current measurement data k
- f (x) is a monotonous decrease function of x, and in this embodiment, the sigmoid function of Eq. (2) was used as an example.
- Equation (2) the distance in accordance with the d i (k) is increased, f (d i (k)) becomes smaller. That is, the coefficient of the weighted average ga a becomes large in the normal category close to the measurement data m, and becomes small in the category far away.
- the sigmoid function used in Eq. (2) is a function whose value gradually approaches zero as x increases, the coefficient of the category with a large distance d i (k) approaches zero, which affects the calculation of the reference point. Do not give.
- the reference point obtained by the equation (1) is the average value of the center of gravity of the category close to the measurement data among the coordinates of the center of gravity of each category.
- the abnormality degree calculation unit 33 obtains the abnormality degree of the current measurement data k from the coordinates of the reference point obtained by the reference point calculation unit 32 and the coordinates of the current measurement data k.
- the degree of anomaly is defined by the distance between the two, and the magnitude of the degree of anomaly vector d a (k) in Eq. (3) is the degree of anomaly.
- the anomaly contribution calculation unit 34 obtains the anomaly contribution R i of the parameter i by the following equation (4), where each component of the anomaly vector d a (k) obtained by the anomaly calculation unit 33 is x i .
- the classification result database 40 stores the category number, abnormality degree, and abnormality contribution degree of each data obtained by the data classification unit 30.
- the display / operation unit 50 displays the data stored in the classification result database 40 and the operation data stored in the operation data database 20.
- the trend graph of the category classified in FIG. 9 is shown. It can be seen that the category changes with time and the state of the plant changes.
- categories 1 to 3 are normal categories, and category 4 is a new category.
- FIG. 10 shows a display example of the degree of abnormality and the degree of contribution to abnormality at the same time as in FIG. What is shown by the black line is the degree of abnormality. Since the anomalous contribution is calculated by the equation (4), the sum of the anomalous contributions of each parameter is the anomaly.
- the parameter is two examples, an abnormal contribution R 1 and parameter x 2 abnormality contribution R 2 a total error probability parameters x 1. Comparing FIGS. 9 and 10, it can be seen that the degree of abnormality increases from the time when the category becomes category 4, which is a new category.
- FIG. 11 shows two-dimensional test data. There were 50 training data, and as a result of classification by ART, they were classified into 9 categories. The points shown in ⁇ indicate the center of gravity of each category. There are 31 points of diagnostic data, and at the time of diagnosis, the data were input in order from left to right.
- the results of determining the degree of anomaly and the degree of anomaly contribution by the conventional algorithm are shown in FIGS. 12 and 13.
- the anomaly degree shown in FIG. 12 does not change smoothly at the time of 7 minutes and 21 minutes, but there is no discontinuity, and there is no big problem in calculating the anomaly degree even with the conventional algorithm. You can see that.
- the anomalous contribution shown in FIG. 13 the anomalous contribution of the center of gravity of the closest normal category changes discontinuously at 7 minutes. If the anomalous contribution changes discontinuously due to changes in the closest normal category, it may be misjudged to estimate the cause of the anomaly using this data.
- FIGS. 14 and 15 show the results of determining the degree of anomaly and the degree of anomaly contribution by the algorithm of the present invention. Compared with the case of using the conventional algorithm, the tendency of the degree of anomaly does not change much, but it can be seen that there is no discontinuous change in the graph of the degree of anomaly contribution.
- the abnormality diagnosis device of the present invention by using the abnormality diagnosis device of the present invention, the phenomenon that the abnormality contribution degree changes significantly even though the measurement data are close to each other is solved. That is, the accuracy when estimating the cause of an abnormality using the degree of anomaly contribution is improved.
- ART is used as the data clustering technique, but other clustering techniques may be used.
- sigmoid function was used as f (x), another function such as 1 / x may be used.
Abstract
In the case of prior art abnormality diagnosis devices, abnormality contribution rates for identifying causes of abnormalities sometimes varied significantly even if data did not significantly vary. An abnormality diagnosis device characterized by being provided with a data classification unit which comprises: a category calculation unit that classifies operation data output from a plurality of sensors provided to an object to be diagnosed, into a plurality of categories; a reference point calculation unit that calculates a reference point for the plurality of categories; and an abnormality degree calculation unit that compares the reference point with current operation data and calculates the degree of abnormality of the current operation data. The abnormality diagnosis device is also characterized in that the reference point is a weighted average of two or more categories of the plurality of categories.
Description
本発明は、プラントまたは装置の異常診断装置に関する。
The present invention relates to a plant or device abnormality diagnostic device.
発電プラントや関連する装置には、監視及び制御を目的として、温度計、圧力計及び流量計などの多くのセンサーが設置されている。近年では、橋梁や道路などのインフラ設備にも加速度センサー等のセンサーを設置し、設備の状態監視を監視することも実施されている。
Many sensors such as thermometers, pressure gauges and flow meters are installed in power plants and related equipment for the purpose of monitoring and control. In recent years, sensors such as acceleration sensors have been installed in infrastructure equipment such as bridges and roads to monitor the condition of the equipment.
このようなセンサーデータの特徴は、複数の関連するセンサーデータがあり、ある時間周期で計測された多次元の時系列データであるということである。このような多次元の時系列データを活用した状態監視方法には様々な方法が提案されている。
The feature of such sensor data is that there are multiple related sensor data and it is multidimensional time series data measured in a certain time cycle. Various methods have been proposed as condition monitoring methods that utilize such multidimensional time series data.
例えば、特許文献1には、適応共鳴理論を用いた技術として「診断対象のプラントに設置される各種センサーからの複数の計測データに対し、適応共鳴理論により正常時のデータで判別したカテゴリーに属するデータと前記複数の計測データとの空間上の距離の差分に基づき、前記診断対象のプラント全体の異常度を求める異常度算出部を備えることを特徴とするプラント異常診断装置」が開示されている。
For example, in Patent Document 1, as a technique using adaptive resonance theory, "it belongs to a category in which a plurality of measurement data from various sensors installed in a plant to be diagnosed are discriminated from normal data by adaptive resonance theory. A plant abnormality diagnosis device characterized by comprising an abnormality degree calculation unit for obtaining an abnormality degree of the entire plant to be diagnosed based on a difference in spatial distance between the data and the plurality of measurement data is disclosed. ..
ここで、適応共鳴理論(ART: Adaptive Resonance Theory、以下ARTと称す)とは、多次元データを類似度に応じて複数のカテゴリーに分類する手法であり、例えば非特許文献1に記載されている。ARTを用いることで、多次元のデータをクラスタリングしてカテゴリーに分割することで、異常を検知することができる。
Here, the adaptive resonance theory (ART: Adaptive Resonance Theory, hereinafter referred to as ART) is a method of classifying multidimensional data into a plurality of categories according to the degree of similarity, and is described in, for example, Non-Patent Document 1. .. By using ART, it is possible to detect anomalies by clustering multidimensional data and dividing it into categories.
特許文献1では、図1に示すように、正常時の運転データ(学習データ)が分類されたカテゴリー(正常カテゴリー)から逸脱した運転データ(診断データ)を基に設備の異常を検出する。異常の程度とどの信号の逸脱が大きいかを判断するために、正常時のデータと現状の計測データとの差分に基づき異常度、異常寄与度を算出している。
In Patent Document 1, as shown in FIG. 1, an abnormality in equipment is detected based on operation data (diagnosis data) in which normal operation data (learning data) deviates from the classified category (normal category). In order to determine the degree of abnormality and which signal deviation is large, the degree of abnormality and the degree of abnormality contribution are calculated based on the difference between the normal data and the current measurement data.
ここで、特許文献1における異常度、異常寄与度を図を用いて説明する。
Here, the degree of abnormality and the degree of contribution to abnormality in Patent Document 1 will be described with reference to figures.
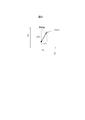
図2に示すように、異常を検知した際に、現在のデータkから最も近接する正常カテゴリー(図2の例ではカテゴリー3)の重心までの距離を異常度と定義している。異常度は、データの異常の程度を示す。
As shown in FIG. 2, when an abnormality is detected, the distance from the current data k to the center of gravity of the closest normal category (category 3 in the example of FIG. 2) is defined as the degree of abnormality. The degree of anomaly indicates the degree of abnormality in the data.
また、図3に示すように、異常度ベクトルを各計測値の成分(図3の例ではx1、x2)に分解したものを異常寄与度と定義している。異常寄与度は、どの信号が正常からの逸脱が大きいかを示す。
Further, as shown in FIG. 3, the anomaly degree vector decomposed into the components of each measured value (x1 and x2 in the example of FIG. 3) is defined as the anomaly contribution degree. The anomalous contribution indicates which signal has a large deviation from normal.
しかしながら、特許文献1に記載された異常度及び異常寄与度を用いた場合、異常時の計測データが大きく変化しないにも関わらず、異常寄与度が大きく変化するケースがあった。その例を図4を用いて説明する。
However, when the degree of abnormality and the degree of anomaly contribution described in Patent Document 1 are used, there is a case where the degree of anomaly contribution changes significantly even though the measurement data at the time of abnormality does not change significantly. An example thereof will be described with reference to FIG.
図4は、図2、図3に示したデータkが異常となった状態に加え、近傍に新しいデータmが計測された状況を示している。データkの最近傍の正常カテゴリーは、カテゴリー3であるが、データmの最近傍の正常カテゴリーはカテゴリー1となる。その結果、両データの異常度の値は大きく変化しないが、異常寄与度が大きく変化する。すなわち、データkでは、x2の異常寄与度が大きかったのに対し、データmでは、データx1の異常寄与度が大きくなる。
FIG. 4 shows a situation in which new data m is measured in the vicinity in addition to the state in which the data k shown in FIGS. 2 and 3 is abnormal. The normal category closest to the data k is category 3, but the normal category closest to the data m is category 1. As a result, the values of the degree of anomaly of both data do not change significantly, but the degree of anomaly contribution changes significantly. That is, in the data k, the abnormal contribution of x2 was large, whereas in the data m, the abnormal contribution of the data x1 was large.
このように、特許文献1に記載の方法では、計測データ自体は大きく変化していないにも関わらず、異常寄与度が大きく変化し、異常寄与度に基づいた異常原因の推定ができない場合があった。
As described above, in the method described in Patent Document 1, although the measurement data itself has not changed significantly, the anomalous contribution may change significantly and the cause of the anomaly cannot be estimated based on the anomaly contribution. It was.
上記課題を解決するために、本発明に係る異常診断装置は、「診断対象に備えられた複数のセンサーから出力された運転データを複数のカテゴリーに分類するカテゴリー計算部と、複数のカテゴリーの基準点を計算する基準点計算部と、基準点と現在の運転データとを比較して、現在の運転データの異常度を計算する異常度計算部と、を有するデータ分類部を備え、基準点は、複数のカテゴリーのうち、2以上のカテゴリーの加重平均である」ことを特徴とする。
In order to solve the above problems, the abnormality diagnosis device according to the present invention has "a category calculation unit that classifies the operation data output from a plurality of sensors provided in the diagnosis target into a plurality of categories, and a reference of the plurality of categories. It is provided with a data classification unit having a reference point calculation unit for calculating points, an abnormality degree calculation unit for comparing the reference point with the current operation data, and calculating the abnormality degree of the current operation data, and the reference point is , It is a weighted average of two or more categories out of a plurality of categories. "
本発明は以上の構成を備えるため、近傍の計測データで異常寄与度が大きく変化することがなく、異常原因の推定の精度を向上することができる。
Since the present invention has the above configuration, the anomaly contribution degree does not change significantly in the measurement data in the vicinity, and the accuracy of estimating the cause of the anomaly can be improved.
以下、本発明の実施形態について図面を参照しながら説明する。尚、下記はあくまでも実施の例に過ぎず、下記具体的内容に発明自体が限定されることを意図するものではない。
Hereinafter, embodiments of the present invention will be described with reference to the drawings. It should be noted that the following is merely an example of implementation, and the invention itself is not intended to be limited to the following specific contents.
図5は本発明の一実施形態にかかる構成を示す。本実施例は、本発明の診断装置をプラントの異常診断に利用した例であり、プラント10、運転データデータベース20、データ分類部30、分類結果データベース40、および表示・操作部50を備える。以下に各構成要素の概要を述べる。なお、異常診断の対象はプラントに限られず、その他の装置等にも適用することができる。
FIG. 5 shows a configuration according to an embodiment of the present invention. This embodiment is an example in which the diagnostic apparatus of the present invention is used for abnormal diagnosis of a plant, and includes a plant 10, an operation data database 20, a data classification unit 30, a classification result database 40, and a display / operation unit 50. The outline of each component is described below. The target of abnormality diagnosis is not limited to plants, but can be applied to other devices and the like.
プラント10は、センサーを備え、プラントの制御及び監視のために利用される。センサーの例としては流量計、温度計、圧力計などがあるが、これに限られない。
Plant 10 is equipped with a sensor and is used for plant control and monitoring. Examples of sensors include, but are not limited to, flow meters, thermometers, pressure gauges, and the like.
運転データデータベース20には、プラント10のセンサーで計測されたプラントの運転データが、例えば1分毎の時系列データとして保存される。保存された運転データのうち、表示・操作部50で正常データとして指定された運転データが学習データとして切り出され、データ分類部30に送られる。また、運転データデータベース20には、プラント10でリアルタイムに計測されたデータも一時的に格納されたのち、診断データとして一定の周期でデータ分類部30に送られる。
In the operation data database 20, the operation data of the plant measured by the sensor of the plant 10 is stored as time-series data every minute, for example. Of the stored operation data, the operation data designated as normal data by the display / operation unit 50 is cut out as learning data and sent to the data classification unit 30. In addition, the operation data database 20 also temporarily stores the data measured in real time by the plant 10, and then sends it to the data classification unit 30 as diagnostic data at regular intervals.
データ分類部30は、ARTをベースとしたクラスタリングアルゴリズム(以下、改良ARTと称す)を用いて、多次元の運転データを複数のカテゴリーに分類する。
The data classification unit 30 classifies multidimensional operation data into a plurality of categories by using an ART-based clustering algorithm (hereinafter referred to as improved ART).
ここで、ARTについて説明する。ARTでは、入力されたデータを複数のカテゴリー(クラスタ)に分類し、それぞれの入力データに対して分類されたカテゴリー番号を割り当てる。カテゴリーとは、類似性を持つデータのまとまりを表し、同じカテゴリー番号が割り当てられた入力データは類似度が高いことを示す。
Here, ART will be explained. In ART, the input data is classified into multiple categories (clusters), and the classified category numbers are assigned to each input data. A category represents a group of data having similarities, and input data to which the same category number is assigned has a high degree of similarity.
学習フェーズでは、設備が正常な状態の運転データ(学習データ)をARTに入力する。ARTはデータの類似度に応じて、運転データ(学習データ)を複数のカテゴリーに分類するため、運転データが正常な場合に生成するカテゴリー(正常カテゴリー)を規定する。
In the learning phase, the operation data (learning data) in the normal state of the equipment is input to ART. Since ART classifies driving data (learning data) into multiple categories according to the similarity of data, it defines the category (normal category) to be generated when the driving data is normal.
診断フェーズでは、正常データを学習したARTに診断したい運転データ(診断データ)を入力する。その結果、学習データとの類似度が高いデータは、学習フェーズと同じカテゴリーに分類される。しかし、設備になんらかの異常が生じた場合など、データの傾向が変わった場合には、学習データとは異なるカテゴリー(新規カテゴリー)に分類される。
In the diagnosis phase, the driving data (diagnosis data) to be diagnosed is input to the ART that has learned the normal data. As a result, the data having a high degree of similarity to the learning data is classified into the same category as the learning phase. However, when the tendency of the data changes, such as when some abnormality occurs in the equipment, it is classified into a category (new category) different from the training data.
本実施例に係る改良ARTを用いたデータ分類装置30は、データの分類結果として、入力された多次元のデータが分類されるカテゴリー番号、異常度、各計測データの異常寄与度を出力する。
The data classification device 30 using the improved ART according to this embodiment outputs, as the data classification result, the category number in which the input multidimensional data is classified, the degree of abnormality, and the degree of abnormality contribution of each measurement data.
分類結果データベース40は、データ分類部30から出力されたカテゴリー番号、異常度、異常寄与度を管理する。また、各カテゴリー選択の基準となる重み係数及び各カテゴリーに分類されたデータの重心データを保存する。
The classification result database 40 manages the category number, the degree of anomaly, and the degree of anomaly contribution output from the data classification unit 30. In addition, the weighting coefficient that is the basis for selecting each category and the centroid data of the data classified into each category are saved.
表示・操作部50は、学習データ、診断データの条件を設定をする。プラント10のセンサーで計測された運転データは、この条件に基づいて学習データであるか診断データであるかが判断される。また、表示・操作部50は、カテゴリー番号、異常度、及び異常寄与度のトレンドグラフを表示する。なお、表示・操作部50は、表示部と操作部がそれぞれ分離して構成されるようにしても良い。
The display / operation unit 50 sets the conditions for learning data and diagnostic data. The operation data measured by the sensor of the plant 10 is determined to be learning data or diagnostic data based on this condition. In addition, the display / operation unit 50 displays a trend graph of the category number, the degree of abnormality, and the degree of abnormality contribution. The display / operation unit 50 may be configured such that the display unit and the operation unit are separated from each other.
次に、本実施例に係る異常診断の方法について、図6乃至図10を用いて詳細に説明する。
Next, the method of abnormal diagnosis according to this embodiment will be described in detail with reference to FIGS. 6 to 10.
プラント10は、機器とそれをつなぐ配管、バルブ等から構成される。機器と配管には、プラントの状態の監視および制御のために、流量計、温度計、圧力計などのセンサーが設置されている。これらのセンサーには、例えば、温度計であれば、「TIC001」のようなタグがついている。このタグが各センサーのIDとなり、IDにより各センサーを識別する。
Plant 10 is composed of equipment and pipes, valves, etc. that connect it. Sensors such as flowmeters, thermometers, and pressure gauges are installed in the equipment and piping to monitor and control the condition of the plant. For example, in the case of a thermometer, these sensors are tagged with "TIC001". This tag becomes the ID of each sensor, and each sensor is identified by the ID.
運転データデータベース20は、プラント10のセンサーで計測されたデータを時系列データとして記録する。運転データの一例を図6に示す。図6に示すように、プラント10に設置されたセンサーで測定された時間毎の運転データとして、「Time」の列には運転データを計測した時刻、他の列には「FIC001」「PIC001」等のIDで特定されるセンサーで測定した値が記録されている。この時間間隔は任意に指定することが可能であるが、本実施例では1分としている。
The operation data database 20 records the data measured by the sensor of the plant 10 as time series data. An example of operation data is shown in FIG. As shown in FIG. 6, as the operation data for each hour measured by the sensor installed in the plant 10, the time when the operation data was measured is in the "Time" column, and "FIC001" and "PIC001" are in the other columns. The value measured by the sensor specified by the ID such as is recorded. This time interval can be arbitrarily specified, but in this embodiment, it is set to 1 minute.
データ分類部30は、改良ARTを用いて運転データを分類する。データ分類部30の詳細な構成を図7に示す。データ分類部30は、カテゴリー計算部31、基準値計算部32、異常度計算部33、及び異常寄与度計算部34からなる。
The data classification unit 30 classifies the operation data using the improved ART. The detailed configuration of the data classification unit 30 is shown in FIG. The data classification unit 30 includes a category calculation unit 31, a reference value calculation unit 32, an abnormality degree calculation unit 33, and an abnormality contribution calculation unit 34.
カテゴリー計算部31では、運転データの類似度に応じて、運転データをカテゴリーに分類する。学習フェーズで運転データ(学習データ)が分類されたカテゴリーは正常カテゴリーとする。カテゴリーに分類する詳細なアルゴリズムは、非特許文献1及び特許文献1に記載されているため、ここでは、説明を割愛する。
The category calculation unit 31 classifies the driving data into categories according to the similarity of the driving data. The category in which driving data (learning data) is classified in the learning phase is regarded as a normal category. Since detailed algorithms for classifying into categories are described in Non-Patent Document 1 and Patent Document 1, description thereof will be omitted here.
基準点計算部32では、異常度を計算するための基準点を計算する。異常度は、基準点と現在の運転データ(診断データ)との偏差情報に基づいて計算される。
The reference point calculation unit 32 calculates a reference point for calculating the degree of abnormality. The degree of abnormality is calculated based on the deviation information between the reference point and the current operation data (diagnostic data).
図8を用いて、本発明に係る異常度を計算する方法を説明する。本実施例においては、基準点として正常カテゴリーの重心の加重平均gaを式(1)で計算する。

A method of calculating the degree of abnormality according to the present invention will be described with reference to FIG. In the present embodiment, it is calculated by equation (1) the weighted average g a of the center of gravity of the normal range as a reference point.
ここで、giは、正常カテゴリーjの重心ベクトル(座標)、di
(k)は、giから現在の計測データkまでの距離である。f(x)はxの単調減少関数であり、本実施例では、例として式(2)のシグモイド関数を用いた。

Here, g i is the normal categories j of the centroid vector (coordinates), d i (k) is the distance from g i to the current measurement data k. f (x) is a monotonous decrease function of x, and in this embodiment, the sigmoid function of Eq. (2) was used as an example.
式(2)によれば、距離がdi
(k)が大きくなるに従い、f(di
(k))は小さくなる。すなわち、加重平均gaの係数は、計測データmに近い正常カテゴリーでは大きくなり、遠いカテゴリーは小さくなる。特に、(2)式で用いたシグモイド関数はxが大きくなると値がゼロに漸近する関数であるため、距離di
(k)が大きいカテゴリーの係数はゼロに近くなり、基準点の計算に影響を与えない。
According to equation (2), the distance in accordance with the d i (k) is increased, f (d i (k)) becomes smaller. That is, the coefficient of the weighted average ga a becomes large in the normal category close to the measurement data m, and becomes small in the category far away. In particular, since the sigmoid function used in Eq. (2) is a function whose value gradually approaches zero as x increases, the coefficient of the category with a large distance d i (k) approaches zero, which affects the calculation of the reference point. Do not give.
すなわち、式(1)で求めた基準点は、各カテゴリーの重心座標のうち、計測データに近いカテゴリーの重心の平均値となる。
That is, the reference point obtained by the equation (1) is the average value of the center of gravity of the category close to the measurement data among the coordinates of the center of gravity of each category.
異常度計算部33は、基準点計算部32で求めた基準点の座標と現在の計測データkの座標から、現在の計測データkの異常度を求める。異常度は両者の距離で定義され、式(3)の異常度ベクトルda
(k)の大きさが異常度である。

The abnormality degree calculation unit 33 obtains the abnormality degree of the current measurement data k from the coordinates of the reference point obtained by the reference point calculation unit 32 and the coordinates of the current measurement data k. The degree of anomaly is defined by the distance between the two, and the magnitude of the degree of anomaly vector d a (k) in Eq. (3) is the degree of anomaly.
異常寄与度計算部34は、異常度計算部33で求めた異常度ベクトルda
(k)の各成分をxiとして、パラメータiの異常寄与度 Riを以下の式(4)で求める。

The anomaly contribution calculation unit 34 obtains the anomaly contribution R i of the parameter i by the following equation (4), where each component of the anomaly vector d a (k) obtained by the anomaly calculation unit 33 is x i .
分類結果データベース40は、データ分類部30で求めた各データのカテゴリー番号、異常度、異常寄与度を格納する。
The classification result database 40 stores the category number, abnormality degree, and abnormality contribution degree of each data obtained by the data classification unit 30.
表示・操作部50は、分類結果データベース40に格納されたデータ及び運転データデータベース20に格納された運転データを表示する。図9に分類されたカテゴリーのトレンドグラフを示す。時間の変化に伴ってカテゴリーが変化し、プラントの状態が変化していることがわかる。図9の例では、カテゴリー1から3までは正常カテゴリー、カテゴリー4は新規カテゴリーである。
The display / operation unit 50 displays the data stored in the classification result database 40 and the operation data stored in the operation data database 20. The trend graph of the category classified in FIG. 9 is shown. It can be seen that the category changes with time and the state of the plant changes. In the example of FIG. 9, categories 1 to 3 are normal categories, and category 4 is a new category.
図10に、図9と同じ時間の異常度及び異常寄与度の表示例を示す。黒線で示したものが異常度である。異常寄与度は、式(4)で求めるため、各パラメータの異常寄与度の合計が異常度となる。本図に示した例は、パラメータが2つの例であり、パラメータx1の異常寄与度R1とパラメータx2の異常寄与度R2を合計が異常度である。図9と図10を比較すると、カテゴリーが新規カテゴリーであるカテゴリー4となった時間から異常度が大きくなっていることがわかる。
FIG. 10 shows a display example of the degree of abnormality and the degree of contribution to abnormality at the same time as in FIG. What is shown by the black line is the degree of abnormality. Since the anomalous contribution is calculated by the equation (4), the sum of the anomalous contributions of each parameter is the anomaly. The example shown in the figure, the parameter is two examples, an abnormal contribution R 1 and parameter x 2 abnormality contribution R 2 a total error probability parameters x 1. Comparing FIGS. 9 and 10, it can be seen that the degree of abnormality increases from the time when the category becomes category 4, which is a new category.
次に、テストデータを用いて、従来のアルゴリズムと本実施例で示したアルゴリズムを比較した結果を図11乃至図15用いて説明する。
Next, the results of comparing the conventional algorithm and the algorithm shown in this embodiment using test data will be described with reference to FIGS. 11 to 15.
図11に二次元のテストデータを示す。学習データは、50点あり、ARTで分類した結果、9つのカテゴリーに分類された。◆で図示した点は、各カテゴリーの重心を示す。診断データは、31点あり、診断時には、左から右の順にデータを入力した。
FIG. 11 shows two-dimensional test data. There were 50 training data, and as a result of classification by ART, they were classified into 9 categories. The points shown in ◆ indicate the center of gravity of each category. There are 31 points of diagnostic data, and at the time of diagnosis, the data were input in order from left to right.
従来のアルゴリズムで異常度及び異常寄与度を求めた結果を図12及び図13に示す。図12に示した異常度は、なめらかに変化しない点が、時間が7分及び21分のところにあるが、不連続性はなく、従来アルゴリズムであっても異常度の計算に大きな問題はないことがわかる。一方、図13に示した異常寄与度では、時間が7分のところで最も近接する正常カテゴリーの重心が異常寄与度が不連続に変化している。最も近接する正常カテゴリーが変化することで、異常寄与度がこのように不連続に変化する場合、このデータを用いて異常原因を推定すると判断を誤る可能性がある。
The results of determining the degree of anomaly and the degree of anomaly contribution by the conventional algorithm are shown in FIGS. 12 and 13. The anomaly degree shown in FIG. 12 does not change smoothly at the time of 7 minutes and 21 minutes, but there is no discontinuity, and there is no big problem in calculating the anomaly degree even with the conventional algorithm. You can see that. On the other hand, in the anomalous contribution shown in FIG. 13, the anomalous contribution of the center of gravity of the closest normal category changes discontinuously at 7 minutes. If the anomalous contribution changes discontinuously due to changes in the closest normal category, it may be misjudged to estimate the cause of the anomaly using this data.
次に、本発明のアルゴリズムで異常度及び異常寄与度を求めた結果を図14及び図15に示す。従来のアルゴリズムを用いた場合と比較して、異常度の傾向はあまり変わらないが、異常寄与度のグラフには、不連続な変化がないことがわかる。
Next, FIGS. 14 and 15 show the results of determining the degree of anomaly and the degree of anomaly contribution by the algorithm of the present invention. Compared with the case of using the conventional algorithm, the tendency of the degree of anomaly does not change much, but it can be seen that there is no discontinuous change in the graph of the degree of anomaly contribution.
以上のように、本発明の異常診断装置を用いることで、計測データが近いにも関わらず、異常寄与度が大きく変化する事象が解消される。すなわち、異常寄与度を用いて異常原因を推定する場合の精度が向上する。
As described above, by using the abnormality diagnosis device of the present invention, the phenomenon that the abnormality contribution degree changes significantly even though the measurement data are close to each other is solved. That is, the accuracy when estimating the cause of an abnormality using the degree of anomaly contribution is improved.
なお、本実施例では、データクラスタリング技術としてARTを用いた例を示したが、その他のクラスタリング技術を用いても良い。また、f(x)としてシグモイド関数を用いたが、1/xなど別の関数を用いても良い。
In this example, ART is used as the data clustering technique, but other clustering techniques may be used. Moreover, although the sigmoid function was used as f (x), another function such as 1 / x may be used.
10:プラント
20:運転データデータベース
30:データ分類部
31:カテゴリー計算部
32:基準値計算部
33:異常度計算部
34:及び異常寄与度計算部
40:分類結果データベース
50:表示部 10: Plant 20: Operation data database 30: Data classification unit 31: Category calculation unit 32: Reference value calculation unit 33: Abnormality calculation unit 34: And abnormality contribution calculation unit 40: Classification result database 50: Display unit
Claims (10)
- 診断対象に備えられた複数のセンサーから出力された運転データを複数のカテゴリーに分類するカテゴリー計算部と、
前記複数のカテゴリーの基準点を計算する基準点計算部と、
前記基準点と現在の運転データとを比較して、前記現在の運転データの異常度を計算する異常度計算部と、
を有するデータ分類部を備え、
前記基準点は、前記複数のカテゴリーのうち、2以上のカテゴリーの加重平均であることを特徴とする異常診断装置。 A category calculation unit that classifies driving data output from multiple sensors provided for diagnosis into multiple categories, and
The reference point calculation unit that calculates the reference points of the plurality of categories, and
An abnormality degree calculation unit that compares the reference point with the current operation data and calculates the abnormality degree of the current operation data.
Equipped with a data classification unit
The abnormality diagnostic apparatus, wherein the reference point is a weighted average of two or more categories among the plurality of categories. - 前記異常度計算部は、前記基準点と現在の運転データとの偏差情報に基づき、前記現在の運転データの異常度を計算することを特徴とする請求項1に記載の異常診断装置。 The abnormality diagnosis device according to claim 1, wherein the abnormality degree calculation unit calculates an abnormality degree of the current operation data based on deviation information between the reference point and the current operation data.
- 前記異常度計算部は、前記基準点と現在の運転データとの距離の差分に基づき、前記現在の運転データの異常度を計算することを特徴とする請求項1または2に記載の異常診断装置。 The abnormality diagnosis device according to claim 1 or 2, wherein the abnormality degree calculation unit calculates the abnormality degree of the current operation data based on the difference in the distance between the reference point and the current operation data. ..
- 前記運転データは、前記複数のセンサーからそれぞれ出力された計測データからなる多次元データであることを特徴とする請求項1乃至3のいずれか一項に記載の異常診断装置。 The abnormality diagnosis device according to any one of claims 1 to 3, wherein the operation data is multidimensional data composed of measurement data output from each of the plurality of sensors.
- 前記複数の計測データ毎の軸方向における前記異常度の成分を異常寄与度として計算する異常寄与度計算部を備える請求項4に記載の異常診断装置。 The abnormality diagnosis device according to claim 4, further comprising an abnormality contribution calculation unit that calculates a component of the abnormality degree in the axial direction for each of the plurality of measurement data as an abnormality contribution degree.
- 入力された前記運転データのうち、前記診断対象が正常であるときの運転データを学習データとして前記データ分類部に出力する運転データデータベースを備え、
前記カテゴリー計算部は、前記学習データが分類されたカテゴリーを正常カテゴリーとして分類し、
前記基準点は、2以上の前記正常カテゴリーの加重平均であることを特徴とする請求項1乃至5のいずれか一項に記載の異常診断装置。 It is provided with an operation data database that outputs the operation data when the diagnosis target is normal among the input operation data to the data classification unit as learning data.
The category calculation unit classifies the category in which the learning data is classified as a normal category.
The abnormality diagnostic apparatus according to any one of claims 1 to 5, wherein the reference point is a weighted average of two or more of the normal categories. - 前記現在の運転データから前記基準点までの距離に基づいて加重平均の係数が規定されることを特徴とする請求項1乃至6のいずれか一項に記載の異常診断装置。 The abnormality diagnosis device according to any one of claims 1 to 6, wherein a weighted average coefficient is defined based on the distance from the current operation data to the reference point.
- 前記現在の運転データから前記基準点までの距離が大きくなるほど、加重平均の係数が小さくなることを特徴とする請求項7に記載の異常診断装置。 The abnormality diagnosis device according to claim 7, wherein the coefficient of the weighted average becomes smaller as the distance from the current operation data to the reference point becomes larger.
- 前記データ分類部から出力された分類結果を表示する表示・操作部を備えることを特徴とする請求項1乃至8のいずれか一項に記載の異常診断装置。 The abnormality diagnosis device according to any one of claims 1 to 8, further comprising a display / operation unit for displaying the classification result output from the data classification unit.
- 前記分類結果は、前記カテゴリー計算部が分類したカテゴリーの番号と、前記異常度を含むことを特徴とする請求項9に記載の異常診断装置。 The abnormality diagnosis device according to claim 9, wherein the classification result includes a category number classified by the category calculation unit and the degree of abnormality.
Priority Applications (1)
| Application Number | Priority Date | Filing Date | Title |
|---|---|---|---|
| CN201980067454.1A CN112912807A (en) | 2019-03-13 | 2019-11-06 | Abnormality diagnosis device |
Applications Claiming Priority (2)
| Application Number | Priority Date | Filing Date | Title |
|---|---|---|---|
| JP2019-045371 | 2019-03-13 | ||
| JP2019045371A JP7233258B2 (en) | 2019-03-13 | 2019-03-13 | Abnormal diagnosis device |
Publications (1)
| Publication Number | Publication Date |
|---|---|
| WO2020183781A1 true WO2020183781A1 (en) | 2020-09-17 |
Family
ID=72427429
Family Applications (1)
| Application Number | Title | Priority Date | Filing Date |
|---|---|---|---|
| PCT/JP2019/043475 WO2020183781A1 (en) | 2019-03-13 | 2019-11-06 | Abnormality diagnosis device |
Country Status (3)
| Country | Link |
|---|---|
| JP (1) | JP7233258B2 (en) |
| CN (1) | CN112912807A (en) |
| WO (1) | WO2020183781A1 (en) |
Cited By (1)
| Publication number | Priority date | Publication date | Assignee | Title |
|---|---|---|---|---|
| TWI768606B (en) * | 2020-12-18 | 2022-06-21 | 日月光半導體製造股份有限公司 | System and method for monitoring sensor |
Citations (3)
| Publication number | Priority date | Publication date | Assignee | Title |
|---|---|---|---|---|
| JPH05322642A (en) * | 1992-05-22 | 1993-12-07 | Hitachi Ltd | Abnormality diagnosis system for rotating machine |
| WO2018051568A1 (en) * | 2016-09-15 | 2018-03-22 | 株式会社日立製作所 | Plant abnormality diagnosis device and plant abnormality diagnosis system |
| JP2018159981A (en) * | 2017-03-22 | 2018-10-11 | オムロン株式会社 | Control system, control apparatus, control program, and control method |
Family Cites Families (4)
| Publication number | Priority date | Publication date | Assignee | Title |
|---|---|---|---|---|
| US7933828B2 (en) * | 2005-07-26 | 2011-04-26 | Cfph, Llc | System and method for displaying and/or analyzing a limit order book |
| JP4832609B1 (en) * | 2011-06-22 | 2011-12-07 | 株式会社日立エンジニアリング・アンド・サービス | Abnormal sign diagnosis device and abnormality sign diagnosis method |
| JP6830414B2 (en) * | 2017-06-28 | 2021-02-17 | 株式会社日立製作所 | Diagnostic device and diagnostic method |
| CN107506463B (en) * | 2017-08-30 | 2020-08-18 | 宁波城市职业技术学院 | Data classification and processing method and equipment |
-
2019
- 2019-03-13 JP JP2019045371A patent/JP7233258B2/en active Active
- 2019-11-06 WO PCT/JP2019/043475 patent/WO2020183781A1/en active Application Filing
- 2019-11-06 CN CN201980067454.1A patent/CN112912807A/en active Pending
Patent Citations (3)
| Publication number | Priority date | Publication date | Assignee | Title |
|---|---|---|---|---|
| JPH05322642A (en) * | 1992-05-22 | 1993-12-07 | Hitachi Ltd | Abnormality diagnosis system for rotating machine |
| WO2018051568A1 (en) * | 2016-09-15 | 2018-03-22 | 株式会社日立製作所 | Plant abnormality diagnosis device and plant abnormality diagnosis system |
| JP2018159981A (en) * | 2017-03-22 | 2018-10-11 | オムロン株式会社 | Control system, control apparatus, control program, and control method |
Cited By (1)
| Publication number | Priority date | Publication date | Assignee | Title |
|---|---|---|---|---|
| TWI768606B (en) * | 2020-12-18 | 2022-06-21 | 日月光半導體製造股份有限公司 | System and method for monitoring sensor |
Also Published As
| Publication number | Publication date |
|---|---|
| CN112912807A (en) | 2021-06-04 |
| JP2020149259A (en) | 2020-09-17 |
| JP7233258B2 (en) | 2023-03-06 |
Similar Documents
| Publication | Publication Date | Title |
|---|---|---|
| CA2433941C (en) | Adaptive modeling of changed states in predictive condition monitoring | |
| US6859739B2 (en) | Global state change indicator for empirical modeling in condition based monitoring | |
| CN105320727B (en) | Method for detecting anomalies in real-time sequences | |
| US9122273B2 (en) | Failure cause diagnosis system and method | |
| Lei et al. | Mutual information based anomaly detection of monitoring data with attention mechanism and residual learning | |
| US7925470B2 (en) | Novelty detection | |
| JP2021528745A (en) | Anomaly detection using deep learning on time series data related to application information | |
| Sun et al. | An improved k-nearest neighbours method for traffic time series imputation | |
| US11669080B2 (en) | Abnormality detection device, abnormality detection method, and program | |
| EP1279104A1 (en) | Generalized lensing angular similarity operator | |
| Siegel et al. | An auto-associative residual processing and K-means clustering approach for anemometer health assessment | |
| US20190072947A1 (en) | Method of predicting plant data and apparatus using the same | |
| EP3866132A1 (en) | Power plant early warning device and method employing multiple prediction model | |
| Tang et al. | Autoregressive model-based structural damage identification and localization using convolutional neural networks | |
| CN113287104A (en) | Data sorting device | |
| WO2016114736A1 (en) | A real-time data verification and data reconciliation system for petroleum refineries | |
| JP6674033B2 (en) | Plant abnormality diagnosis device and plant abnormality diagnosis system | |
| CN105894014B (en) | Abnormal behavior sequential detection method based on multi-factor inconsistency measurement | |
| WO2020183781A1 (en) | Abnormality diagnosis device | |
| KR101997580B1 (en) | Data classification method based on correlation, and a computer-readable storege medium having program to perform the same | |
| CN112949735A (en) | Liquid hazardous chemical substance volatile concentration abnormity discovery method based on outlier data mining | |
| Li et al. | Structural health monitoring data anomaly detection by transformer enhanced densely connected neural networks | |
| US11320813B2 (en) | Industrial asset temporal anomaly detection with fault variable ranking | |
| CN107480647B (en) | Method for detecting abnormal behaviors in real time based on inductive consistency abnormality detection | |
| JP6951202B2 (en) | Data classification device |
Legal Events
| Date | Code | Title | Description |
|---|---|---|---|
| 121 | Ep: the epo has been informed by wipo that ep was designated in this application |
Ref document number: 19919170 Country of ref document: EP Kind code of ref document: A1 |
|
| NENP | Non-entry into the national phase |
Ref country code: DE |
|
| 122 | Ep: pct application non-entry in european phase |
Ref document number: 19919170 Country of ref document: EP Kind code of ref document: A1 |