WO2020170867A1 - 推定装置、推定方法、及びプログラム - Google Patents
推定装置、推定方法、及びプログラム Download PDFInfo
- Publication number
- WO2020170867A1 WO2020170867A1 PCT/JP2020/004909 JP2020004909W WO2020170867A1 WO 2020170867 A1 WO2020170867 A1 WO 2020170867A1 JP 2020004909 W JP2020004909 W JP 2020004909W WO 2020170867 A1 WO2020170867 A1 WO 2020170867A1
- Authority
- WO
- WIPO (PCT)
- Prior art keywords
- data
- observed
- sample
- probability distribution
- model
- Prior art date
- Legal status (The legal status is an assumption and is not a legal conclusion. Google has not performed a legal analysis and makes no representation as to the accuracy of the status listed.)
- Ceased
Links
Images



Classifications
-
- G—PHYSICS
- G06—COMPUTING OR CALCULATING; COUNTING
- G06F—ELECTRIC DIGITAL DATA PROCESSING
- G06F30/00—Computer-aided design [CAD]
- G06F30/20—Design optimisation, verification or simulation
-
- G—PHYSICS
- G06—COMPUTING OR CALCULATING; COUNTING
- G06F—ELECTRIC DIGITAL DATA PROCESSING
- G06F17/00—Digital computing or data processing equipment or methods, specially adapted for specific functions
- G06F17/10—Complex mathematical operations
- G06F17/11—Complex mathematical operations for solving equations, e.g. nonlinear equations, general mathematical optimization problems
-
- G—PHYSICS
- G06—COMPUTING OR CALCULATING; COUNTING
- G06F—ELECTRIC DIGITAL DATA PROCESSING
- G06F17/00—Digital computing or data processing equipment or methods, specially adapted for specific functions
- G06F17/10—Complex mathematical operations
- G06F17/18—Complex mathematical operations for evaluating statistical data, e.g. average values, frequency distributions, probability functions, regression analysis
-
- G—PHYSICS
- G06—COMPUTING OR CALCULATING; COUNTING
- G06N—COMPUTING ARRANGEMENTS BASED ON SPECIFIC COMPUTATIONAL MODELS
- G06N20/00—Machine learning
-
- G—PHYSICS
- G06—COMPUTING OR CALCULATING; COUNTING
- G06N—COMPUTING ARRANGEMENTS BASED ON SPECIFIC COMPUTATIONAL MODELS
- G06N99/00—Subject matter not provided for in other groups of this subclass
-
- G—PHYSICS
- G06—COMPUTING OR CALCULATING; COUNTING
- G06F—ELECTRIC DIGITAL DATA PROCESSING
- G06F2111/00—Details relating to CAD techniques
- G06F2111/10—Numerical modelling
Definitions
- the present invention relates to an estimation device, an estimation method, and a program, and more particularly to an estimation device, an estimation method, and a program for estimating parameters of a mixed model from censored data.
- -Censored data refers to data for which the value of a sample whose observed value is greater than or equal to a certain threshold value (or less than a certain threshold value) is not observed and only the information above the threshold value is obtained.
- a lot of data such as clinical data describing the onset of illness and death of people, contract history data of Internet line users, service usage history data of e-commerce sites, etc. are expressed as censored data.
- a typical example of a problem using censored data is a survival time analysis that estimates a distribution of time required for a certain device to fail, for example.
- the survival time distribution is often multimodal due to the presence of early failures and deterioration failures, so distribution estimation using a mixed model is widely used.
- the first is the existence of local optimal solutions. That is, although the EMCM guarantees a monotonic decrease of the objective function, the convergence destination changes depending on the initial value, so that there is a problem that repeated execution from different initial values is required.
- the second is the need to calculate the statistics of the truncated distribution of the probability distribution used in the model (the distribution that has been modified so that it takes values only within a certain range). That is, except for exceptional one-dimensional cut normal distribution which is a cut distribution of one-dimensional normal distribution, this statistic cannot be calculated analytically, and numerical calculation such as Monte Carlo method can be used. There was a problem that it was necessary. Since EMCM is an algorithm that repeats parameter updating and statistic calculation many times, it is considered desirable to avoid repeating numerical calculation at each iteration.
- the present invention has been made in view of the above points, and provides an estimation device, an estimation method, and a program capable of accurately estimating a parameter of a model representing a probability distribution of censored data while suppressing a calculation time.
- the purpose is to
- the estimation device includes observation data of a sample in which an observation value is observed, observation data of a sample in which an observation value is not observed, and a variable indicating whether or not the observation value is observed in each sample.
- An estimation device that estimates a parameter of a model that represents a probability distribution of censored data, and an input unit that receives an input of the censored data, and a distribution of observed values corresponding to each sample of the censored data that the input unit has received.
- the estimation method for estimating a parameter of a model representing a probability distribution of censored data, wherein an input unit receives an input of the censored data, and a parameter estimation unit, each sample of the censored data received by the input unit.
- a model representing the probability distribution of the censored data and the input unit accepts
- the parameters of the model are estimated by optimizing the objective function, which is the divergence with the probability distribution of the censored data, obtained from the censored data.
- the program according to the present invention stores the observation data of the sample in which the observation value is observed, the observation data of the sample in which the observation value is not observed, and the variable representing whether or not the observation value is observed in each sample.
- each sample of data represented by a mixed model of each component representing the distribution of observed values, represented using a probability density function of the observed data, a model representing the probability distribution of the censored data, and
- a program that causes a computer to execute a process including estimating parameters of the model by optimizing an objective function that is obtained from the censored data received by the input unit and is a divergence with the probability distribution of the censored data. is there.
- the input unit has the observation data of the sample in which the observation value is observed, the observation data of the sample in which the observation value is not observed, and the observation value for each sample.
- Input of censored data including a variable indicating whether or not observed is accepted.
- the parameter estimation unit which corresponds to each sample of the censored data accepted by the input unit, is represented by a mixed model of each component that represents the distribution of observed values, and is represented using a probability density function of observed data,
- the parameters of the model are estimated by optimizing the objective function which is the divergence between the model representing the probability distribution of the censored data and the probability distribution of the censored data obtained from the censored data received by the input unit.
- each of the censored data including the observed data of the sample in which the observed value was observed, the observed data of the sample in which the observed value was not observed, and the variable indicating whether or not the observed value was observed for each sample
- the model that represents the probability distribution of the censored data corresponds to the sample, represented by the mixture model of each component that represents the distribution of the observed values, represented by using the probability density function of the observation data, the model that represents the probability distribution of the censored data, and obtained from the censored data
- the model representing the probability distribution of the censored data of the estimation device is represented by using a probability density function of the observation data and a length of time until the end of the observation given in advance for each sample.
- the probability distribution of the variable, the probability density function of the observation data, and the length of time to the end of observation given in advance for each sample And the probability distribution of the observation data.
- the objective function of the estimation device may be Kullback-Leibler divergence or L 2 divergence between the model representing the probability distribution of the censored data and the probability distribution of the censored data.
- the estimation device the estimation method, and the program of the present invention, it is possible to accurately estimate the parameters of the model representing the probability distribution of the censored data, while suppressing the calculation time.
- the first is an estimation method based on Kullback-Leibler (KL: Kullback-Leibler) divergence minimization between probability distributions
- the second is an estimation method based on L 2 divergence minimization between probability distributions.
- the first estimation method allows parameter estimation with a very simple iterative calculation
- the second estimation method allows parameter estimation analytically without even needing iteration.
- a key point in constructing the method according to the embodiment of the present invention is the use of an approach (reference 1) called an exemplar based model (hereinafter, emb).
- an approach hereinafter, emb.
- the parameters of each component of the mixed model are not treated explicitly as parameters, but each component is placed at the point where data points exist.
- an algorithm that converges to a global optimal solution can be constructed by formulating only the mixture ratio (weight parameter of each component).
- the above approach can be viewed as an evolution of this approach to use censored data as input.
- the method of the reference proposes a method of performing emb by KL divergence minimization using normal data, but it cannot handle censored data.
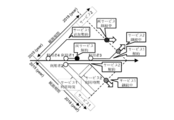
- FIG. 1 shows an example of one-dimensional cutoff data. As shown in the example of FIG. 1, description will be given using device failure data, which is a typical example of termination data.
- the time when each device was installed and the time of the failure when the failure occurred are recorded.
- the time is recorded because a failure occurs during the observation period.
- the devices 3 and 4 did not fail during the observation period, and the observation was terminated, so that the time of the failure is not recorded.
- both the device 3 and the device 4 always fail sometime, and the time of the failure is after the observation end time.
- data consisting of a set of data such as the devices 1 and 2 whose observed values (failure times) are known and devices 3 and 4 whose observed values (failure time) are equal to or greater than a certain value. Is called censored data.
- the device failure data in Fig. 1 is one-dimensional censored data, but this method can handle censored data of two or more dimensions, so it will be described here.
- 2 is two-dimensional censored data that represents the usage period of users of a certain two services.
- User 1 started using both services at the same time and canceled at the same time during the observation period, so the cancellation times of both services are recorded.
- User 2 starts to use both services at the same time and cancels only service 2 during the observation period.
- User 3 starts using both services at the same time and cancels only service 1 during the observation period.
- the user 4 first starts using the service 2, and additionally contracts the service 1 during the observation period. Therefore, due to the termination of the observation, the cancellation time of the service 1 of the user 2, the cancellation time of the service 2 of the user 3, and the cancellation times of the services 1 and 2 of the user 4 are not recorded.
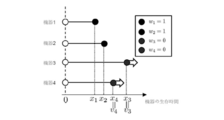
- FIG. 3 shows the observation data of FIG. 1 expressed by survival time
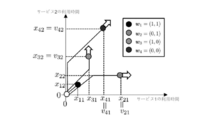
- FIG. 4 shows the observation data of FIG. 2 expressed by survival time. Since the data is defined as multidimensional censored data, FIG. 4 will be used as an example for description below.
- Is. x ij represents the usage time of the service j of the user i
- v ij represents the length from the service j use start time of the user i to the observation end time.
- K is the number of mixtures
- Probability distribution of components For example, a Gaussian distribution represented by the following formula can be used.
- ⁇ represent the mean and standard deviation of the Gaussian distribution.
- ⁇ represents a value randomly generated from a probability distribution (eg, exponential distribution) having a value of 0 or more.
- a probability distribution e.g, exponential distribution
- the standard deviation ⁇ can be determined by a cross-validation method or the like.
- f tr is a truncated distribution of a distribution in which f is marginalized with respect to an unobserved element, and is represented by the following formula.
- f tr complies with the following equations (5) to (6).
- L 2 divergence is defined as the squared error of two probability density functions. Which divergence to use depends on the problem. Therefore, in the embodiment of the present invention, two types of methods are constructed so that they can be applied regardless of which divergence is used.
- the constraint condition (the parameter element is 0 or more and the sum is 1) is for the mixed model f to have a probability distribution.
- optimization can be performed by repeating the update of.
- ⁇ k is smaller than a certain threshold value (for example, 10 ⁇ 3 /n)
- ⁇ k 0.
- a renormalization operation may be performed in which the sum is adjusted to be 1.
- the objective function can be designed as in the following equation by replacing the place where the KL divergence/log likelihood ratio is used in each of these two terms with L 2 divergence.
- Is a value that can be analytically calculated when a Gaussian distribution is used as the component distribution, and can be expressed as in the following equation (21).
- the numerical problem solver can directly solve the optimization problem of the above formula (22). In that case, you may decide to solve the following optimization problem which added the regularization term.
- ⁇ represents a hyper parameter.
- the following approximate method may be used.
- the optimum solution of the problem in which the constraint condition is removed from the optimization problem of the above formula (22) is obtained as in the following formulas (23) and (24).
- Is a regularization term and ⁇ is a hyperparameter, which has an effect of preventing the divergence of the parameter.
- the parameter of the model is estimated by one of the above-described two methods, thereby suppressing the calculation time and accurately estimating the parameter of the model representing the probability distribution of the censored data.
- FIG. 5 is a block diagram showing a schematic configuration of a computer that functions as the estimation device 1 according to the embodiment of the present invention.
- FIG. 6 is a block diagram showing the configuration of the estimation device 1 according to the embodiment of the present invention.
- the estimation device 1 includes a CPU 110, a memory 120 such as a RAM, a communication interface (IF) unit 130, an input unit 140 such as a keyboard, a display unit 150 such as a display, and an estimation described later.
- the computer is provided with a storage unit 160 such as a ROM that stores a program 170 for executing the processing routine.
- the CPU 110, the memory 120, the communication IF unit 130, the input unit 140, the display unit 150, and the storage unit 160 are connected via the bus 100.
- the communication IF unit 130 is connected to the external device 2 by a communication line such as a LAN cable. Note that the external device 2 may be connected via a network (not shown).
- the estimation device 1 includes a data processing unit 10, a parameter estimation unit 20, a parameter output unit 30, a storage unit 40, an input unit 50, and an output unit 60. Prepared for.
- the data processing unit 10 is the observation data of the sample in which the observation value received by the input unit 50 is observed. And the observation data of the sample for which the observation value was not observed And a variable that indicates whether the observed value was observed for each sample Censored data including and Are stored in the data storage unit 41.
- the sample is, for example, each device in the examples of FIGS. 1 and 3 and each user in the examples of FIGS.
- the parameter estimation unit 20 uses the censored data received by the input unit 50.
- the censored data received by the input unit 50 Censoring data obtained from True probability distribution of By optimizing the objective function, which is the divergence with To estimate.
- the parameter estimation unit 20 first determines the censored data True probability distribution of Ask for.
- the parameter estimation unit 20 sets the objective function to the censored data.
- Model representing the probability distribution of And the censored data True probability distribution of The parameter is estimated as KL divergence with or L 2 divergence.
- a model that represents the probability distribution of censored data Is the probability distribution function of the observation data, which is expressed using the probability density function of the observation data and the length of time until the end of the observation, which is given in advance for each sample, as shown in the above equation (8). And a probability density function of the observation data, and a probability distribution of the variables under the given variables, which is represented by the length of time to the end of the observation given in advance for each sample. And are represented using.
- the parameter estimation unit 20 estimates the parameter by repeating the parameter update of the equation (15). Further, the parameter estimator 20, when using a L 2 divergence, the equation (24), to estimate parameters using (25).
- the parameter estimation unit 20 calculates the estimated parameter Is stored in the parameter storage unit 42.
- the parameter output unit 30 is the parameter of the parameter storage unit 42. Is obtained, and the parameter is output to the parameter output unit 30. give.
- the storage unit 40 includes a data storage unit 41 and a parameter storage unit 42.
- the data storage unit 41 stores censored data. Is stored.
- the parameter storage unit 42 stores the model parameters. Is stored.
- the input unit 50 receives the censored data from the external device 2. Accepts input. Then, the input unit 50 receives the censored data To the data processing unit 10.
- the output unit 60 is the model parameter received from the parameter output unit 30. Is output to the external device 2.
- FIG. 7 is a flowchart showing an estimation processing routine according to the embodiment of the present invention.
- step S100 the input unit 50 sets the observation data of the sample in which the observation value is observed. And the observation data of the sample for which the observation value was not observed And a variable that indicates whether the observed value was observed for each sample Censored data including and Accepts input.
- the input unit 50 also receives an input of the length of time until the observation end time for each sample i.
- step S110 the parameter estimation unit 20 sets the objective function to the censored data.
- Model representing the probability distribution of And the censored data Probability distribution of As KL divergence or L 2 divergence, the parameters are estimated by repeating the parameter update of the above equation (15), or the parameters are estimated using the above equations (24) and (25).
- step S120 the output unit 60 uses the parameters estimated in step S110. Is output.
- the observed data of the sample in which the observed value is observed, the observed data of the sample in which the observed value is not observed, and the observed value for each sample are Corresponding to each sample of censored data including a variable representing whether or not observed, represented by a mixed model of each component representing the distribution of observed values, represented using the probability density function of the observed data,
- the parameters of the model are estimated, so that the calculation time is suppressed. , It is possible to accurately estimate the parameters of the model that represents the probability distribution of censored data.
- the present invention is not limited to this and the present invention can be applied to any censored data that is not time-series data. It can be applied.
- estimation device 1 has been described as a configuration in which the processing of each unit is constructed as a program and installed and executed in a computer used as the estimation device, but as a configuration to be distributed via a network. Good.
- the program can be stored in a computer-readable recording medium and provided.
Landscapes
- Engineering & Computer Science (AREA)
- Physics & Mathematics (AREA)
- Theoretical Computer Science (AREA)
- General Physics & Mathematics (AREA)
- Data Mining & Analysis (AREA)
- Mathematical Physics (AREA)
- General Engineering & Computer Science (AREA)
- Mathematical Optimization (AREA)
- Computational Mathematics (AREA)
- Pure & Applied Mathematics (AREA)
- Mathematical Analysis (AREA)
- Software Systems (AREA)
- Operations Research (AREA)
- Algebra (AREA)
- Databases & Information Systems (AREA)
- Bioinformatics & Cheminformatics (AREA)
- Probability & Statistics with Applications (AREA)
- Evolutionary Biology (AREA)
- Life Sciences & Earth Sciences (AREA)
- Bioinformatics & Computational Biology (AREA)
- Evolutionary Computation (AREA)
- Computing Systems (AREA)
- Computer Hardware Design (AREA)
- Geometry (AREA)
- Medical Informatics (AREA)
- Computer Vision & Pattern Recognition (AREA)
- Artificial Intelligence (AREA)
- Complex Calculations (AREA)
- Management, Administration, Business Operations System, And Electronic Commerce (AREA)
Abstract
計算時間を抑えて、打ち切りデータの確率分布を表すモデルのパラメタを精度良く推定することができるようにする。 パラメタ推定部20が、観測値が観測されたサンプルの観測データと、観測値が観測されなかったサンプルの観測データと、各サンプルについて観測値が観測されたか否かを表す変数とを含む打ち切りデータの各サンプルに対応する、観測値の分布を表す各コンポーネントの混合モデルで表される、観測データの確率密度関数を用いて表される、当該打ち切りデータの確率分布を表すモデルと、当該打ち切りデータから得られる、当該打ち切りデータの確率分布とのダイバージェンスである目的関数を最適化することにより、モデルのパラメタを推定する。
Description
本発明は、推定装置、推定方法、及びプログラムに係り、特に、打ち切りデータから混合モデルのパラメタを推定するための推定装置、推定方法、及びプログラムに関する。
打ち切りデータとは、観測値がある閾値以上(またはある閾値以下)であるサンプルについては、値が観測されず、閾値以上である、という情報しか得られないデータのことを指す。病気の発症や人の死亡などを記述する臨床データや、インターネット回線利用者の契約履歴データ、Eコマースサイトのサービス利用履歴データなど多くのデータが打ち切りデータとして表現される。打ち切りデータを用いる問題の代表例は、例えばある機器が故障するまでに要する時間の分布を推定する、生存時間分析である。生存時間分布は、初期故障や劣化故障などの存在によりしばしば多峰性をもつため、混合モデルを用いた分布推定が広く用いられる。
打ち切りデータから混合モデルのパラメタを推定するには、文献(非特許文献1)で提案されているEMCM(Expectation Maximization for Censored Mixturemodels)アルゴリズムが適用できる。
Didier Chauveau. A stochastic em algorithm for mixtures with censored data. Journal of statistical planning and inference, Vol.46, No.1, 1995, pp.1-25.
しかし、このアプローチには以下の2つの問題があった。
1つ目は、局所最適解の存在である。すなわち、EMCMは目的関数の単調減少は保証されるものの収束先は初期値に依存して変わるため、異なる初期値からの繰り返し実行が必要となってしまう、という問題があった。
2つ目は、モデルで利用する確率分布の切断分布(ある一定の範囲でしか値をとらないように変更した分布)の統計量の計算の必要性である。すなわち、1次元正規分布の切断分布である1次元切断正規分布などの例外的なものを除き、この統計量は解析的に計算することができず、モンテカルロ法などの数値計算を利用することが必要となる、という問題があった。EMCMは、パラメタの更新と統計量の計算を何度も繰り返すアルゴリズムであるから、各反復で数値計算を繰り返すことは避けることが望ましいと考えられる。
本発明は上記の点に鑑みてなされたものであり、計算時間を抑えて、打ち切りデータの確率分布を表すモデルのパラメタを精度良く推定することができる推定装置、推定方法、及びプログラムを提供することを目的とする。
本発明に係る推定装置は、観測値が観測されたサンプルの観測データと、観測値が観測されなかったサンプルの観測データと、各サンプルについて観測値が観測されたか否かを表す変数とを含む打ち切りデータの確率分布を表すモデルのパラメタを推定する推定装置であって、前記打ち切りデータの入力を受け付ける入力部と、前記入力部が受け付けた前記打ち切りデータの各サンプルに対応する、観測値の分布を表す各コンポーネントの混合モデルで表される、前記観測データの確率密度関数を用いて表される、前記打ち切りデータの確率分布を表すモデルと、前記入力部が受け付けた前記打ち切りデータから得られる、前記打ち切りデータの確率分布とのダイバージェンスである目的関数を最適化することにより、前記モデルのパラメタを推定するパラメタ推定部と、を備えて構成される。
また、本発明に係る推定方法は、観測値が観測されたサンプルの観測データと、観測値が観測されなかったサンプルの観測データと、各サンプルについて観測値が観測されたか否かを表す変数とを含む打ち切りデータの確率分布を表すモデルのパラメタを推定する推定方法であって、入力部が、前記打ち切りデータの入力を受け付け、パラメタ推定部が、前記入力部が受け付けた前記打ち切りデータの各サンプルに対応する、観測値の分布を表す各コンポーネントの混合モデルで表される、前記観測データの確率密度関数を用いて表される、前記打ち切りデータの確率分布を表すモデルと、前記入力部が受け付けた前記打ち切りデータから得られる、前記打ち切りデータの確率分布とのダイバージェンスである目的関数を最適化することにより、前記モデルのパラメタを推定する。
また、本発明に係るプログラムは、観測値が観測されたサンプルの観測データと、観測値が観測されなかったサンプルの観測データと、各サンプルについて観測値が観測されたか否かを表す変数とを含む打ち切りデータの確率分布を表すモデルのパラメタを推定する処理をコンピュータに実行させるプログラムであって、入力部が、前記打ち切りデータの入力を受け付け、パラメタ推定部が、前記入力部が受け付けた前記打ち切りデータの各サンプルに対応する、観測値の分布を表す各コンポーネントの混合モデルで表される、前記観測データの確率密度関数を用いて表される、前記打ち切りデータの確率分布を表すモデルと、前記入力部が受け付けた前記打ち切りデータから得られる、前記打ち切りデータの確率分布とのダイバージェンスである目的関数を最適化することにより、前記モデルのパラメタを推定することを含む処理をコンピュータに実行させるプログラムである。
本発明に係る推定装置、推定方法及びプログラムによれば、入力部が、観測値が観測されたサンプルの観測データと、観測値が観測されなかったサンプルの観測データと、各サンプルについて観測値が観測されたか否かを表す変数とを含む打ち切りデータの入力を受け付ける。
そして、パラメタ推定部が、入力部が受け付けた打ち切りデータの各サンプルに対応する、観測値の分布を表す各コンポーネントの混合モデルで表される、観測データの確率密度関数を用いて表される、打ち切りデータの確率分布を表すモデルと、入力部が受け付けた打ち切りデータから得られる、打ち切りデータの確率分布とのダイバージェンスである目的関数を最適化することにより、モデルのパラメタを推定する。
このように、観測値が観測されたサンプルの観測データと、観測値が観測されなかったサンプルの観測データと、各サンプルについて観測値が観測されたか否かを表す変数とを含む打ち切りデータの各サンプルに対応する、観測値の分布を表す各コンポーネントの混合モデルで表される、観測データの確率密度関数を用いて表される、当該打ち切りデータの確率分布を表すモデルと、当該打ち切りデータから得られる、当該打ち切りデータの確率分布とのダイバージェンスである目的関数を最適化することにより、モデルのパラメタを推定することにより、計算時間を抑えて、打ち切りデータの確率分布を表すモデルのパラメタを精度良く推定することができる。
また、本発明に係る推定装置の前記打ち切りデータの確率分布を表すモデルは、前記観測データの確率密度関数と、各サンプルについて予め与えられた、観測終了までの時間の長さとを用いて表される、前記変数の確率分布と、前記観測データの確率密度関数と、各サンプルについて予め与えられた、観測終了までの時間の長さとを用いて表される、前記変数が与えられた下での、前記観測データの確率分布と、を用いて表されることができる。
また、本発明に係る推定装置の前記目的関数は、前記打ち切りデータの確率分布を表すモデルと、前記打ち切りデータの確率分布とのカルバックライブラーダイバージェンス、又はL2ダイバージェンスであることができる。
本発明の推定装置、推定方法、及びプログラムによれば、計算時間を抑えて、打ち切りデータの確率分布を表すモデルのパラメタを精度良く推定することができる。
以下、本発明の実施の形態について図面を用いて説明する。
<本発明の実施の形態に係る推定装置の原理>
まず、本発明の実施形態の原理について説明する。
まず、本発明の実施形態の原理について説明する。
本発明の実施の形態では、次に示す目的関数の異なる2つの手法を構築した。1つ目は確率分布間のKullback-Leibler(KL:カルバック-ライブラー)ダイバージェンス最小化に基づく推定手法、2つ目は確率分布間のL2ダイバージェンス最小化に基づく推定手法である。1つ目の推定手法では非常にシンプルな繰り返し計算でパラメタの推定が可能であり、2つ目の推定手法では、繰り返しの必要すらなく解析的にパラメタの推定が可能である。
本発明の実施の形態に係る手法を構築する上でポイントとなるのは、examplar based model(以下、emb)と呼ばれるアプローチ(参考文献1)の利用である。
[参考文献1]Danial Lashkari and Polina Golland, "Convex clustering with exemplar-based models", In Advances in neural information processing systems, 2008, pp.825-832.
[参考文献1]Danial Lashkari and Polina Golland, "Convex clustering with exemplar-based models", In Advances in neural information processing systems, 2008, pp.825-832.
embアプローチでは、混合モデルの各コンポーネントのパラメタを陽にパラメタとしては扱わず、データ点の存在する点に各コンポーネントを配置する。これによって、混合比(各コンポーネントの重みパラメタ)のみの推定を行う定式化をすることで大域的最適解へ収束するアルゴリズムが構築できる。上記の手法は、このアプローチに対して打ち切りデータを入力として利用できるよう発展させたものとみなすことができる。
更に、上述したEMCMで必要となる切断分布の統計量はコンポーネントのパラメタの推定に必要なものであったため、このアプローチの採用により数値計算の繰り返し実行の必要のない手法を構築することができる。
なお、文献(参考文献1)の方法では、通常のデータを用いてKLダイバージェンス最小化によるembを行う手法を提案しているが、打ち切りデータを扱うことができない。
確率分布の誤差の関数にL2ダイバージェンスを用いるアプローチは文献(参考文献2)でも考えられているが、打ち切りデータではなく通常のデータを入力する状況を考えている。
[参考文献2]DavidW Scott, "Parametric statistical modeling by minimum integrated square error", Technometrics, Vol.43, No.3, 2001, pp.274-285.
[参考文献2]DavidW Scott, "Parametric statistical modeling by minimum integrated square error", Technometrics, Vol.43, No.3, 2001, pp.274-285.
また、打ち切りデータを利用し、かつL2ダイバージェンスを用いる研究には文献(参考文献3)が存在するが、指数分布、ワイブル分布のように単峰の単純な分布をモデルとして用いる場合のみが考えられている。
[参考文献3]Srabashi Basu, Ayanendranath Basu, and MCJones, "Robust and efficient parametric estimation for censored survival data", Annals of the Institute of Statistical Mathematics, Vol.58, No.2, 2006, pp.341-355.
[参考文献3]Srabashi Basu, Ayanendranath Basu, and MCJones, "Robust and efficient parametric estimation for censored survival data", Annals of the Institute of Statistical Mathematics, Vol.58, No.2, 2006, pp.341-355.
<<準備>>
<<<打ち切りデータ>>>
まず、打ち切りデータについて説明する。図1に、1次元の打ち切りデータの例を示す。図1の例に示すように、打ち切りデータの代表例である機器故障データを用いて説明する。
<<<打ち切りデータ>>>
まず、打ち切りデータについて説明する。図1に、1次元の打ち切りデータの例を示す。図1の例に示すように、打ち切りデータの代表例である機器故障データを用いて説明する。
機器故障データでは、各機器の設置された時刻と故障が起こった際の故障の時刻が記録されている。機器1及び2に関しては観察期間中に故障が起きているため、その時刻が記録されている。一方、機器3及び4に関しては観察期間中には故障せずに、観察が打ち切られたため、故障の時刻が記録されてはいない。
しかしながら、機器3及び機器4の何れも、いつかは必ず故障するとして、故障の時刻は観察終了時刻以降にあるということは読み取れる。このように機器1と2のように観測値(故障の時刻)が分かるデータと機器3と4のように観測値(故障の時刻)がある値以上であることが分かるデータの組からなるデータを、打ち切りデータと呼ぶ。
図1の機器故障データは、1次元の打ち切りデータであるが、本手法では2次元以上の打ち切りデータも扱うことができるためここで説明する。
図2は、ある2つのサービスの利用者の利用期間を表す2次元の打ち切りデータである。図2のケースでは、利用者の(少なくとも1つの)サービスを利用開始した時刻と各サービスを追加契約または解約した時刻が記録されている。
利用者1は両サービスを同時に利用開始し、観察期間中に同時に解約しているため両方のサービスの解約時刻が記録されている。利用者2は両サービスを同時に利用開始し、観察期間中にサービス2のみを解約している。利用者3は両サービスを同時に利用開始し、観察期間中にサービス1のみを解約している。利用者4はサービス2をまず利用開始し、観察期間中にサービス1を追加契約している。よって、観測の打ち切りによって、利用者2のサービス1の解約時刻、利用者3のサービス2の解約時刻、利用者4のサービス1と2の解約時刻は記録されていない。
このように2次元の打ち切りデータにおいては、打ち切られている値の次元が異なる、3通りの打ち切りの種類が存在する。一般にn次元の打ち切りデータでは2n-1種類の打ち切りが存在する。なお、以下、各次元に観測が打ち切られるかが決まる例を用いて説明するが、どれか一つの要素が打ち切られたときに全ての要素が観測されなくなるという状況でも同様のアプローチで対応することができる。
ここで、打ち切りデータの定義を与える。扱いを簡単にするため、観測データは図1のようなカレンダー時刻ではなく、生存時間(機器の設置から故障までの時間、サービスの契約から解約までの時間)を用いて表現する。図1の観測データを生存時間で表現したものを図3、図2の観測データを生存時間で表現したものを図4に示す。多次元の打ち切りデータとして定義するため、以下では図4を説明の例に用いる。
打ち切りデータを

と書く。ここで、
と、

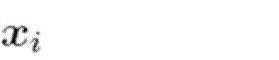
とは共にdx次元のベクトルであり、

、

である。xijが利用者iのサービスjの利用時間、wijが利用者iのサービスjの解約時刻が記録されたか(wij=1)、打ち切りにより記録されなかったか(wij=0)を表す。同様に、i番目の利用者の、観測終了時刻までの時間の長さを

と書く。vijが利用者iのサービスj利用開始時刻から観測終了時刻までの長さを表す。打ち切りにより観測値が観測されなかったとき(wij=0)には、xij=vijと設定されているとする。
と書く。ここで、
と、
とは共にdx次元のベクトルであり、
、
である。xijが利用者iのサービスjの利用時間、wijが利用者iのサービスjの解約時刻が記録されたか(wij=1)、打ち切りにより記録されなかったか(wij=0)を表す。同様に、i番目の利用者の、観測終了時刻までの時間の長さを
と書く。vijが利用者iのサービスj利用開始時刻から観測終了時刻までの長さを表す。打ち切りにより観測値が観測されなかったとき(wij=0)には、xij=vijと設定されているとする。
<<<混合モデル>>>
次に、本発明の実施の形態で用いるモデルについて説明する。混合モデルで表される、観測値の確率密度関数は一般に下記式(1)で定義される。
次に、本発明の実施の形態で用いるモデルについて説明する。混合モデルで表される、観測値の確率密度関数は一般に下記式(1)で定義される。

ここで、Kは混合数、

がk番目コンポーネントの確率分布を表す。コンポーネントの確率分布

には、例えば下記式で表されるガウス分布が利用できる。
がk番目コンポーネントの確率分布を表す。コンポーネントの確率分布
には、例えば下記式で表されるガウス分布が利用できる。

ここで、

とσとは、ガウス分布の平均と標準偏差を表す。ただし、ebm(参考文献1)のアプローチに従い、コンポーネントの確率分布のパラメタ

はK=nとして、それぞれが観測データ点に対応するよう

と設定されたもの等であるとする。この場合には、観測値の確率密度関数は、観測データの各々に対する、各コンポーネントの混合モデルで表され、各コンポーネントに含まれる、ガウス分布の平均を、対応する観測値とする。本手法は打ち切りデータを扱うため、K=nとし、値が観測されていれば(wij=1)、μij=xij、そうでなければ(wij=0)、μij=xij+εと設定してもよい。εは0以上の値を取る確率分布(例えば指数分布)からランダムに生成した値を表す。また、データ数が多い場合には、例えばランダムに選んだ100個のデータのみを用いてもよいし、事前知識に基づいて設定したコンポーネントを用いてもよい。標準偏差σは交差検証法等により決定することが可能である。
とσとは、ガウス分布の平均と標準偏差を表す。ただし、ebm(参考文献1)のアプローチに従い、コンポーネントの確率分布のパラメタ
はK=nとして、それぞれが観測データ点に対応するよう
と設定されたもの等であるとする。この場合には、観測値の確率密度関数は、観測データの各々に対する、各コンポーネントの混合モデルで表され、各コンポーネントに含まれる、ガウス分布の平均を、対応する観測値とする。本手法は打ち切りデータを扱うため、K=nとし、値が観測されていれば(wij=1)、μij=xij、そうでなければ(wij=0)、μij=xij+εと設定してもよい。εは0以上の値を取る確率分布(例えば指数分布)からランダムに生成した値を表す。また、データ数が多い場合には、例えばランダムに選んだ100個のデータのみを用いてもよいし、事前知識に基づいて設定したコンポーネントを用いてもよい。標準偏差σは交差検証法等により決定することが可能である。
上記モデルを用いたときの打ち切りデータ

の生成過程は次のように記述できる。まず、各サンプルについて観測終了までの時間の長さ

が既知のもと、打ち切りが起こるか否かを表す変数

が、下記式(2)の確率分布に従い生成される。
の生成過程は次のように記述できる。まず、各サンプルについて観測終了までの時間の長さ
が既知のもと、打ち切りが起こるか否かを表す変数
が、下記式(2)の確率分布に従い生成される。
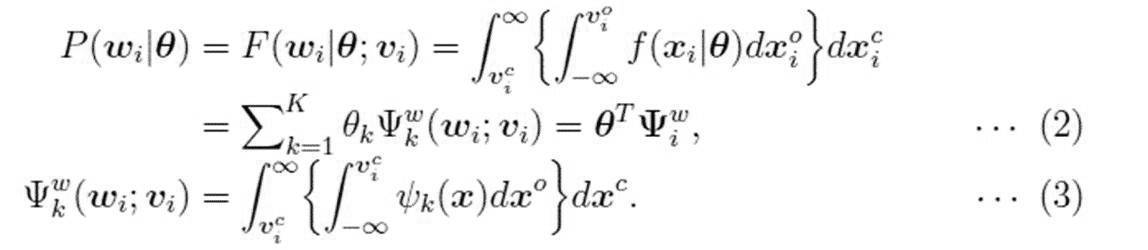
ただし、

と、

とのうち、wij=1である、観測値が観測された要素の集合を

とし、wij=0である、観測値が観測されなかった集合を

とする。また、観測値が観測された要素と、観測値が観測されなかった要素とを区別しない場合に、観測データと呼ぶこととする。コンポーネントの確率分布

に、上記式(2)のガウス分布のように標準的な確率分布を利用すると、

を累積密度関数を用いて解析的に計算できる。
と、
とのうち、wij=1である、観測値が観測された要素の集合を
とし、wij=0である、観測値が観測されなかった集合を
とする。また、観測値が観測された要素と、観測値が観測されなかった要素とを区別しない場合に、観測データと呼ぶこととする。コンポーネントの確率分布
に、上記式(2)のガウス分布のように標準的な確率分布を利用すると、
を累積密度関数を用いて解析的に計算できる。

であり、少なくとも一つ観測された要素がある場合、

は下記式(4)で表される分布にしたがって生成される。

ここで、

はデルタ関数であり、ftrはfを観測されなかった要素に関して周辺化した分布の切断分布であり、下記式で表される。
はデルタ関数であり、ftrはfを観測されなかった要素に関して周辺化した分布の切断分布であり、下記式で表される。

ただし、ftrは下記式(5)~(6)に従う。

コンポーネントが上記式(2)のガウス分布である場合、

は

となる。ただし、

はそれぞれ

から

と

に対応する次元の要素を抜き出したベクトルである。
は
となる。ただし、
はそれぞれ
から
と
に対応する次元の要素を抜き出したベクトルである。

であり、一つも観測された要素がない場合、下記式(7)で示すように、デルタ関数のみの表現となる。

よって、上記をまとめると、各打ち切りデータの生成確率は、下記式(8)で与えられる。

<<KLダイバージェンスとL2ダイバージェンス>>
次に、提案手法の目的関数を定義する際に利用するダイバージェンスについて記す。良く知られるように、確率分布p(x)とq(x)とに対するカルバックライブラー(KL)ダイバージェンスは下記式(9)で定義される。
次に、提案手法の目的関数を定義する際に利用するダイバージェンスについて記す。良く知られるように、確率分布p(x)とq(x)とに対するカルバックライブラー(KL)ダイバージェンスは下記式(9)で定義される。

これに加え、本発明の実施の形態では、下記で定義されるL2ダイバージェンス(参考文献2)も利用する場合についても説明する(下記式(10))。

L2ダイバージェンスは、2つの確率密度関数の2乗誤差として定義されている。何れのダイバージェンスを用いるべきかについては、問題に応じて異なる。よって、本発明の実施の形態では、何れのダイバージェンスを利用する場合にも適用できるように、2種類の手法を構築することとした。
<<KLダイバージェンスの最適化による推定>>
まず、目的関数としてKLダイバージェンスを利用する場合の提案手法を示す。打ち切りデータの確率分布を表すモデル

と、打ち切りデータから得られる真の確率分布

とのKLダイバージェンスは、上記式(9)の定義に従い、下記式(11)で与えられる。
まず、目的関数としてKLダイバージェンスを利用する場合の提案手法を示す。打ち切りデータの確率分布を表すモデル
と、打ち切りデータから得られる真の確率分布
とのKLダイバージェンスは、上記式(9)の定義に従い、下記式(11)で与えられる。

これは、下記式(12)のように式変形することができる。
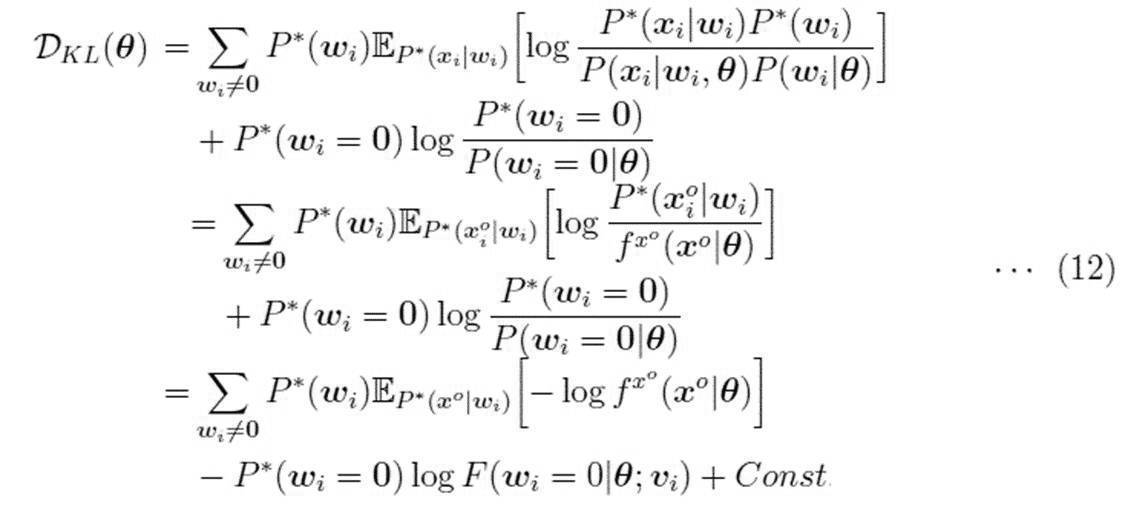
定数項を除去し、未知である真の分布

に関する期待値を標本平均で置き換えれば、下記の式(13)が導かれる。
に関する期待値を標本平均で置き換えれば、下記の式(13)が導かれる。

ここで、

は、データから計算できる量であり、これを目的関数とすることでアルゴリズムを導く。具体的には、下記式(14)の最適化問題を解けばよい。
は、データから計算できる量であり、これを目的関数とすることでアルゴリズムを導く。具体的には、下記式(14)の最適化問題を解けばよい。

ここで、制約条件(パラメタの要素が0以上、かつ、和が1)は、混合モデルfが確率分布となるためのものである。ラグランジュの未定乗数法を用いると、上記の最適化問題の解は、下記式(15)を満たすことが分かる。

よって、上記式(15)に基づいて

の更新を繰り返すことにより、最適化が可能となる。なお、参考文献1の手法と同様に、計算量の削減と収束を早めるため、パラメタ更新の際にθkがある閾値(例えば10-3/n)より小さい場合には、θk=0と設定した後に、全体を和が1になるように調整する、再正規化操作を行ってもよい。
の更新を繰り返すことにより、最適化が可能となる。なお、参考文献1の手法と同様に、計算量の削減と収束を早めるため、パラメタ更新の際にθkがある閾値(例えば10-3/n)より小さい場合には、θk=0と設定した後に、全体を和が1になるように調整する、再正規化操作を行ってもよい。
<<L2ダイバージェンスの最適化による推定>>
次に、L2ダイバージェンスを利用する場合の提案手法を示す。KLダイバージェンスとは異なり、L2ダイバージェンスの定義から直接目的関数を定義することはせず、KLダイバージェンスを用いた際の目的関数に注目することにより新たな目的関数を定義する。
次に、L2ダイバージェンスを利用する場合の提案手法を示す。KLダイバージェンスとは異なり、L2ダイバージェンスの定義から直接目的関数を定義することはせず、KLダイバージェンスを用いた際の目的関数に注目することにより新たな目的関数を定義する。
KLダイバージェンスを用いた際の目的関数(式(12))に注目すると、混合モデルfの周辺分布

と、変数が与えられた下での観測値の真の分布

のKLダイバージェンスに対応する項と、観測値が観測されなかったことを表す変数のモデルの分布

と、真の分布

を用いた対数尤度比に対応する項との2つの項をそれぞれ

で重み付き和を取ることで構成されていることが分かる。
と、変数が与えられた下での観測値の真の分布
のKLダイバージェンスに対応する項と、観測値が観測されなかったことを表す変数のモデルの分布
と、真の分布
を用いた対数尤度比に対応する項との2つの項をそれぞれ
で重み付き和を取ることで構成されていることが分かる。
この洞察に基づき、これら2つの各項でKLダイバージェンス/対数尤度比を用いている箇所をL2ダイバージェンスに置き換えることで、目的関数を下記式のように設計することができる。

これを式変形すれば、

となる。更に、定数項(Const)を除去し、真の分布に関する平均を標本平均で置き換えた下記式の最適化を考える。
となる。更に、定数項(Const)を除去し、真の分布に関する平均を標本平均で置き換えた下記式の最適化を考える。
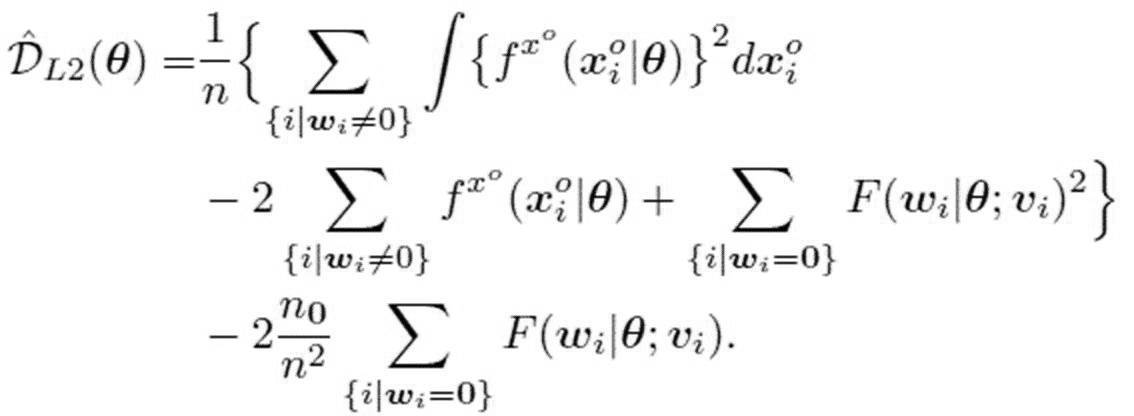
ただし、

とおいた。これを目的関数とすることで、アルゴリズムを導出する。

は、行列・ベクトル形式で、下記式(16)、(17)のように表すことができる。
とおいた。これを目的関数とすることで、アルゴリズムを導出する。
は、行列・ベクトル形式で、下記式(16)、(17)のように表すことができる。

ただし、下記式(18)~(20)に従う。

また、

は、コンポーネントの分布にガウス分布を用いる場合、解析的に計算できる値であり、下記式(21)のように表すことができる。
は、コンポーネントの分布にガウス分布を用いる場合、解析的に計算できる値であり、下記式(21)のように表すことができる。

上記式(21)中で、

に関して総和をとる際、

や

は

の値によって異なる値であることを明記しておく。これにより、目的関数は

に関する2次の形式で表現されることが分かる。よって、パラメタの推定値は下記で示す制約付きの2次最適化問題を解くことで得ることができる。
に関して総和をとる際、
や
は
の値によって異なる値であることを明記しておく。これにより、目的関数は
に関する2次の形式で表現されることが分かる。よって、パラメタの推定値は下記で示す制約付きの2次最適化問題を解くことで得ることができる。

数値ソルバーを用いて直接上記式(22)の最適化問題を解くことができる。その際、正則化項を加えた下記の最適化問題を解くことにしてもよい。

ただし、βがハイパーパラメタを表す。また、例えば次に示す近似的な方法を用いてもよい。上記式(22)の最適化問題から制約条件を外した問題の最適解は下記式(23)、(24)のように求められる。

ただし、

は正則化項、βはハイパーパラメタであり、パラメタの発散を防ぐ効果がある。

は、値が0以上かつ和が1であるから、下記式(25)の処理で条件を満たす

が得られる。
は正則化項、βはハイパーパラメタであり、パラメタの発散を防ぐ効果がある。
は、値が0以上かつ和が1であるから、下記式(25)の処理で条件を満たす
が得られる。
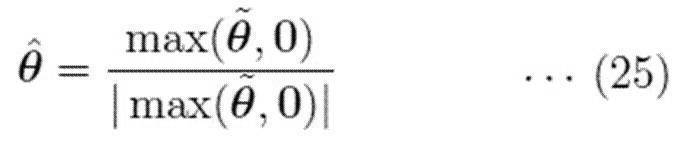
ただし、

は、

ノルムを表す
は、
ノルムを表す
本発明の実施の形態では、以上説明した2つの手法の何れかにより、モデルのパラメタを推定することにより、計算時間を抑えて、打ち切りデータの確率分布を表すモデルのパラメタを精度良く推定することができる。
<本発明の実施の形態に係る推定装置の構成>
次に、図5及び図6を参照して、本発明の実施の形態に係る推定装置1の構成について説明する。図5は、本発明の実施の形態に係る推定装置1として機能するコンピュータの概略構成を示すブロック図である。図6は、本発明の実施の形態に係る推定装置1の構成を示すブロック図である。
次に、図5及び図6を参照して、本発明の実施の形態に係る推定装置1の構成について説明する。図5は、本発明の実施の形態に係る推定装置1として機能するコンピュータの概略構成を示すブロック図である。図6は、本発明の実施の形態に係る推定装置1の構成を示すブロック図である。
図5に示すように、推定装置1は、CPU110と、RAM等のメモリ120と、通信インターフェース(IF)部130と、キーボード等の入力部140と、ディスプレイ等の表示部150と、後述する推定処理ルーチンを実行するためのプログラム170を記憶したROM等の記憶部160とを備えたコンピュータで構成されている。また、CPU110、メモリ120、通信IF部130、入力部140、表示部150、及び記憶部160は、バス100を介して接続されている。また、通信IF部130は、LANケーブル等の通信回線により外部装置2と接続されている。なお、ネットワーク(図示しない)を介して外部装置2と接続される構成としてもよい。
図6に示すように、本実施形態に係る推定装置1は、データ処理部10と、パラメタ推定部20と、パラメタ出力部30と、記憶部40と、入力部50と、出力部60とを備えて構成される。
データ処理部10は、入力部50が受け付けた観測値が観測されたサンプルの観測データ

と、観測値が観測されなかったサンプルの観測データ

と、各サンプルについて観測値が観測されたか否かを表す変数

とを含む打ち切りデータ

をデータ記憶部41に格納する。サンプルは、例えば、上述の図1、3の例では各機器のこと、図2、4の例では各利用者のことである。
と、観測値が観測されなかったサンプルの観測データ
と、各サンプルについて観測値が観測されたか否かを表す変数
とを含む打ち切りデータ
をデータ記憶部41に格納する。サンプルは、例えば、上述の図1、3の例では各機器のこと、図2、4の例では各利用者のことである。
パラメタ推定部20は、入力部50が受け付けた打ち切りデータ

の各サンプルに対応する、観測値の分布を表す各コンポーネントの混合モデルで表される、観測データの確率密度関数を用いて表される、打ち切りデータ

の確率分布を表すモデル

と、入力部50が受け付けた打ち切りデータ

から得られる、当該打ち切りデータ

の真の確率分布

とのダイバージェンスである目的関数を最適化することにより、モデルのパラメタ

を推定する。
の各サンプルに対応する、観測値の分布を表す各コンポーネントの混合モデルで表される、観測データの確率密度関数を用いて表される、打ち切りデータ
の確率分布を表すモデル
と、入力部50が受け付けた打ち切りデータ
から得られる、当該打ち切りデータ
の真の確率分布
とのダイバージェンスである目的関数を最適化することにより、モデルのパラメタ
を推定する。
具体的には、パラメタ推定部20は、まず、当該打ち切りデータ

の真の確率分布

を求める。
の真の確率分布
を求める。
次に、パラメタ推定部20は、目的関数を、当該打ち切りデータ

の確率分布を表すモデル

と、当該打ち切りデータ

の真の確率分布

とのKLダイバージェンス、又はL2ダイバージェンスとして、パラメタを推定する。
の確率分布を表すモデル
と、当該打ち切りデータ
の真の確率分布
とのKLダイバージェンス、又はL2ダイバージェンスとして、パラメタを推定する。
ここで、打ち切りデータの確率分布を表すモデル

は、上記式(8)で示すように、観測データの確率密度関数と、各サンプルについて予め与えられた、観測終了までの時間の長さとを用いて表される、観測データの確率分布

と、観測データの確率密度関数と、各サンプルについて予め与えられた、観測終了までの時間の長さとを用いて表される、変数が与えられた下での、変数の確率分布

と、を用いて表される。
は、上記式(8)で示すように、観測データの確率密度関数と、各サンプルについて予め与えられた、観測終了までの時間の長さとを用いて表される、観測データの確率分布
と、観測データの確率密度関数と、各サンプルについて予め与えられた、観測終了までの時間の長さとを用いて表される、変数が与えられた下での、変数の確率分布
と、を用いて表される。
パラメタ推定部20は、KLダイバージェンスを用いる場合、上記式(15)のパラメタ更新を繰り返すことにより、パラメタを推定する。また、パラメタ推定部20は、L2ダイバージェンスを用いる場合、上記式(24)、(25)を用いてパラメタを推定する。
そして、パラメタ推定部20は、推定したパラメタ

をパラメタ記憶部42に格納する。
をパラメタ記憶部42に格納する。
パラメタ出力部30は、パラメタ記憶部42のパラメタ

を取得し、パラメタ出力部30に当該パラメタ

を渡す。
を取得し、パラメタ出力部30に当該パラメタ
を渡す。
記憶部40は、データ記憶部41と、パラメタ記憶部42とを含む。データ記憶部41には、打ち切りデータ

が格納される。また、パラメタ記憶部42には、モデルのパラメタ

が格納される。
が格納される。また、パラメタ記憶部42には、モデルのパラメタ
が格納される。
入力部50は、外部装置2から、打ち切りデータ

の入力を受け付ける。そして、入力部50は、受け付けた打ち切りデータ

を、データ処理部10に渡す。
の入力を受け付ける。そして、入力部50は、受け付けた打ち切りデータ
を、データ処理部10に渡す。
出力部60は、パラメタ出力部30から受け取ったモデルのパラメタ

を、外部装置2へ出力する。
を、外部装置2へ出力する。
<本発明の実施の形態に係る推定装置の作用>
図7は、本発明の実施の形態に係る推定処理ルーチンを示すフローチャートである。
図7は、本発明の実施の形態に係る推定処理ルーチンを示すフローチャートである。
入力部50に打ち切りデータ

が入力されると、推定装置1において、図7に示す推定処理ルーチンが実行される。
が入力されると、推定装置1において、図7に示す推定処理ルーチンが実行される。
まず、ステップS100において、入力部50は、観測値が観測されたサンプルの観測データ

と、観測値が観測されなかったサンプルの観測データ

と、各サンプルについて観測値が観測されたか否かを表す変数

とを含む打ち切りデータ

の入力を受け付ける。また、入力部50は、各サンプルiについての観測終了時刻までの時間の長さの入力を受け付ける。
と、観測値が観測されなかったサンプルの観測データ
と、各サンプルについて観測値が観測されたか否かを表す変数
とを含む打ち切りデータ
の入力を受け付ける。また、入力部50は、各サンプルiについての観測終了時刻までの時間の長さの入力を受け付ける。
ステップS110において、パラメタ推定部20は、目的関数を、当該打ち切りデータ

の確率分布を表すモデル

と、当該打ち切りデータ

の確率分布

とのKLダイバージェンス、又はL2ダイバージェンスとして、上記式(15)のパラメタ更新を繰り返すことにより、パラメタを推定するか、あるいは、上記式(24)、(25)を用いてパラメタを推定する。
の確率分布を表すモデル
と、当該打ち切りデータ
の確率分布
とのKLダイバージェンス、又はL2ダイバージェンスとして、上記式(15)のパラメタ更新を繰り返すことにより、パラメタを推定するか、あるいは、上記式(24)、(25)を用いてパラメタを推定する。
ステップS120において、出力部60は、上記ステップS110により推定されたパラメタ

を出力する。
を出力する。
以上説明したように、本発明の実施形態に係る推定装置によれば、観測値が観測されたサンプルの観測データと、観測値が観測されなかったサンプルの観測データと、各サンプルについて観測値が観測されたか否かを表す変数とを含む打ち切りデータの各サンプルに対応する、観測値の分布を表す各コンポーネントの混合モデルで表される、観測データの確率密度関数を用いて表される、当該打ち切りデータの確率分布を表すモデルと、当該打ち切りデータから得られる、当該打ち切りデータの確率分布とのダイバージェンスである目的関数を最適化することにより、モデルのパラメタを推定するため、計算時間を抑えて、打ち切りデータの確率分布を表すモデルのパラメタを精度良く推定することができる。
なお、本発明は、上述した実施の形態に限定されるものではなく、この発明の要旨を逸脱しない範囲内で様々な変形や応用が可能である。
例えば、上述の実施の形態では、ダイバージェンスとしてKLダイバージェンス又はL2ダイバージェンスを用いる場合について説明したが、これに限定されるものではなく、他のダイバージェンスを用いることも可能である。
また、上述の実施の形態では、時系列データである打ち切りデータを前提に記載しているが、これに限定されるものではなく、時系列データではない任意の打ち切りデータに対しても本発明の適用が可能である。
また、上述の実施の形態に係る推定装置1は、各部の処理をプログラムとして構築し、推定装置として利用されるコンピュータにインストールして実行させる構成として説明したが、ネットワークを介して流通させる構成としてもよい。
また、本願明細書中において、プログラムが予めインストールされている実施形態として説明したが、当該プログラムを、コンピュータ読み取り可能な記録媒体に格納して提供することも可能である。
1 推定装置
2 外部装置
10 データ処理部
20 パラメタ推定部
30 パラメタ出力部
40 記憶部
41 データ記憶部
42 パラメタ記憶部
50 入力部
60 出力部
100 バス
110 CPU
120 メモリ
130 通信IF部
140 入力部
150 表示部
160 記憶部
170 プログラム
2 外部装置
10 データ処理部
20 パラメタ推定部
30 パラメタ出力部
40 記憶部
41 データ記憶部
42 パラメタ記憶部
50 入力部
60 出力部
100 バス
110 CPU
120 メモリ
130 通信IF部
140 入力部
150 表示部
160 記憶部
170 プログラム
Claims (5)
- 観測値が観測されたサンプルの観測データと、観測値が観測されなかったサンプルの観測データと、各サンプルについて観測値が観測されたか否かを表す変数とを含む打ち切りデータの確率分布を表すモデルのパラメタを推定する推定装置であって、
前記打ち切りデータの入力を受け付ける入力部と、
前記入力部が受け付けた前記打ち切りデータの各サンプルに対応する、観測値の分布を表す各コンポーネントの混合モデルで表される、前記観測データの確率密度関数を用いて表される、前記打ち切りデータの確率分布を表すモデルと、前記入力部が受け付けた前記打ち切りデータから得られる、前記打ち切りデータの確率分布とのダイバージェンスである目的関数を最適化することにより、前記モデルのパラメタを推定するパラメタ推定部と、
を含む推定装置。 - 前記打ち切りデータの確率分布を表すモデルは、
前記観測データの確率密度関数と、各サンプルについて予め与えられた、観測終了までの時間の長さとを用いて表される、前記変数の確率分布と、
前記観測データの確率密度関数と、各サンプルについて予め与えられた、観測終了までの時間の長さとを用いて表される、前記変数が与えられた下での、前記観測データの確率分布と、
を用いて表される請求項1記載の推定装置。 - 前記目的関数は、前記打ち切りデータの確率分布を表すモデルと、前記打ち切りデータの確率分布とのカルバックライブラーダイバージェンス、又はL2ダイバージェンスである
請求項1又は2記載の推定装置。 - 観測値が観測されたサンプルの観測データと、観測値が観測されなかったサンプルの観測データと、各サンプルについて観測値が観測されたか否かを表す変数とを含む打ち切りデータの確率分布を表すモデルのパラメタを推定する推定方法であって、
入力部が、前記打ち切りデータの入力を受け付け、
パラメタ推定部が、前記入力部が受け付けた前記打ち切りデータの各サンプルに対応する、観測値の分布を表す各コンポーネントの混合モデルで表される、前記観測データの確率密度関数を用いて表される、前記打ち切りデータの確率分布を表すモデルと、前記入力部が受け付けた前記打ち切りデータから得られる、前記打ち切りデータの確率分布とのダイバージェンスである目的関数を最適化することにより、前記モデルのパラメタを推定する
推定方法。 - 観測値が観測されたサンプルの観測データと、観測値が観測されなかったサンプルの観測データと、各サンプルについて観測値が観測されたか否かを表す変数とを含む打ち切りデータの確率分布を表すモデルのパラメタを推定する処理をコンピュータに実行させるプログラムであって、
入力部が、前記打ち切りデータの入力を受け付け、
パラメタ推定部が、前記入力部が受け付けた前記打ち切りデータの各サンプルに対応する、観測値の分布を表す各コンポーネントの混合モデルで表される、前記観測データの確率密度関数を用いて表される、前記打ち切りデータの確率分布を表すモデルと、前記入力部が受け付けた前記打ち切りデータから得られる、前記打ち切りデータの確率分布とのダイバージェンスである目的関数を最適化することにより、前記モデルのパラメタを推定する
ことを含む処理をコンピュータに実行させるプログラム。
Priority Applications (1)
| Application Number | Priority Date | Filing Date | Title |
|---|---|---|---|
| US17/431,791 US20220138375A1 (en) | 2019-02-21 | 2020-02-07 | Estimation device, estimation method, and program |
Applications Claiming Priority (2)
| Application Number | Priority Date | Filing Date | Title |
|---|---|---|---|
| JP2019-029769 | 2019-02-21 | ||
| JP2019029769A JP7107246B2 (ja) | 2019-02-21 | 2019-02-21 | 推定装置、推定方法、及びプログラム |
Publications (1)
| Publication Number | Publication Date |
|---|---|
| WO2020170867A1 true WO2020170867A1 (ja) | 2020-08-27 |
Family
ID=72144974
Family Applications (1)
| Application Number | Title | Priority Date | Filing Date |
|---|---|---|---|
| PCT/JP2020/004909 Ceased WO2020170867A1 (ja) | 2019-02-21 | 2020-02-07 | 推定装置、推定方法、及びプログラム |
Country Status (3)
| Country | Link |
|---|---|
| US (1) | US20220138375A1 (ja) |
| JP (1) | JP7107246B2 (ja) |
| WO (1) | WO2020170867A1 (ja) |
Families Citing this family (4)
| Publication number | Priority date | Publication date | Assignee | Title |
|---|---|---|---|---|
| JP7107246B2 (ja) * | 2019-02-21 | 2022-07-27 | 日本電信電話株式会社 | 推定装置、推定方法、及びプログラム |
| US11921488B2 (en) * | 2020-12-15 | 2024-03-05 | Xerox Corporation | System and method for machine-learning-enabled micro-object density distribution control with the aid of a digital computer |
| US20230359882A1 (en) * | 2022-05-06 | 2023-11-09 | International Business Machines Corporation | Training a neural network to achieve average calibration |
| CN119128368B (zh) * | 2024-11-14 | 2025-02-21 | 中国建设银行股份有限公司 | 回归模型的构建方法及装置、程序产品、存储介质 |
Family Cites Families (21)
| Publication number | Priority date | Publication date | Assignee | Title |
|---|---|---|---|---|
| US20040117051A1 (en) * | 2000-06-06 | 2004-06-17 | Ford Dean M. | Method of determining a cumulative distribution function confidence bound |
| US8438126B2 (en) * | 2007-07-13 | 2013-05-07 | The Regents Of The University Of California | Targeted maximum likelihood estimation |
| US8204714B2 (en) * | 2010-02-26 | 2012-06-19 | International Business Machines Corporation | Method and computer program product for finding statistical bounds, corresponding parameter corners, and a probability density function of a performance target for a circuit |
| US20140149205A1 (en) * | 2012-11-29 | 2014-05-29 | Adobe Systems Incorporated | Method and Apparatus for an Online Advertising Predictive Model with Censored Data |
| JP6194450B2 (ja) * | 2013-04-15 | 2017-09-13 | 株式会社メガチップス | 状態推定装置、プログラムおよび集積回路 |
| JP6366999B2 (ja) * | 2014-05-22 | 2018-08-01 | 株式会社メガチップス | 状態推定装置、プログラムおよび集積回路 |
| PT3188060T (pt) * | 2014-08-27 | 2023-06-27 | Nec Corp | Dispositivo de simulação, método de simulação e meios de memória |
| WO2017170086A1 (ja) * | 2016-03-31 | 2017-10-05 | 日本電気株式会社 | 情報処理システム、情報処理装置、シミュレーション方法およびシミュレーションプログラムが記録された記録媒体 |
| US20190057065A1 (en) * | 2016-04-01 | 2019-02-21 | Hitachi, Ltd. | Modeling device |
| JP6686151B2 (ja) * | 2017-01-27 | 2020-04-22 | 三菱日立パワーシステムズ株式会社 | モデルパラメータ値推定装置及び推定方法、プログラム、プログラムを記録した記録媒体、モデルパラメータ値推定システム |
| US10528644B1 (en) * | 2017-06-30 | 2020-01-07 | Cadence Design Systems, Inc. | Estimation and visualization of a full probability distribution for circuit performance obtained with Monte Carlo simulations over scaled sigma sampling |
| JP6935765B2 (ja) * | 2018-02-13 | 2021-09-15 | 日本電信電話株式会社 | 動的分布推定装置、方法、及びプログラム |
| JP7064356B2 (ja) * | 2018-03-14 | 2022-05-10 | 株式会社日立製作所 | 将来状態推定装置および将来状態推定方法 |
| WO2019217876A1 (en) * | 2018-05-10 | 2019-11-14 | Equifax Inc. | Training or using sets of explainable machine-learning modeling algorithms for predicting timing of events |
| JP7172616B2 (ja) * | 2019-01-11 | 2022-11-16 | 日本電信電話株式会社 | データ解析装置、方法、及びプログラム |
| US10977341B2 (en) * | 2019-01-18 | 2021-04-13 | Hide Housing Corporation | Insolation probability distribution analysis method, insolation probability distribution analysis system, insolation probability distribution analysis program product, insolation normalization statistical analysis method, insolation normalization statistical analysis system, and insolation normalization statistical analysis program product |
| JP7107246B2 (ja) * | 2019-02-21 | 2022-07-27 | 日本電信電話株式会社 | 推定装置、推定方法、及びプログラム |
| WO2020261447A1 (ja) * | 2019-06-26 | 2020-12-30 | 日本電信電話株式会社 | パラメタ推定装置、パラメタ推定方法、及びパラメタ推定プログラム |
| US11010222B2 (en) * | 2019-08-29 | 2021-05-18 | Sap Se | Failure mode specific analytics using parametric models |
| US20220343199A1 (en) * | 2019-10-02 | 2022-10-27 | Nippon Telegraph And Telephone Corporation | Parameter estimation device, parameter estimation method, and parameter estimation program |
| JP7374868B2 (ja) * | 2020-08-28 | 2023-11-07 | 株式会社東芝 | 情報処理装置、情報処理方法およびプログラム |
-
2019
- 2019-02-21 JP JP2019029769A patent/JP7107246B2/ja active Active
-
2020
- 2020-02-07 WO PCT/JP2020/004909 patent/WO2020170867A1/ja not_active Ceased
- 2020-02-07 US US17/431,791 patent/US20220138375A1/en not_active Abandoned
Non-Patent Citations (2)
| Title |
|---|
| BASU, SRABASHI ET AL.: "Robust and efficient parametric estimation for censored survival data", ANNALS OF THE INSTITUTE OF STATISTICAL MATHEMATICS [ ONLINE, vol. 58, no. 2, 2006, pages 341 - 355, XP019390068, ISSN: 0020-3157, Retrieved from the Internet <URL:https://www.ism.ac.jp/editsec/aism/pdf/058_2_0341.pdf> [retrieved on 20200318], DOI: 10.1007/s10463-005-0004-x * |
| KOHJIMA, MASAHIRO; KIYOTAKE, HIROSHI; MATSUBAYASHI, TATSUSHI; SHIOHARA, HISAKO; TODA, HIROYUKI: "Introduction of Online EM Method for Mixed Models for Censored Data, Arrival Time Estimation for Large-Scale Gathering Events. DEIM Forum 2018", 16TH ANNUAL MEETING OF THE DATABASE SOCIETY OF JAPAN, DEIM FORUM 2018, March 2018 (2018-03-01), pages 8 pp., XP009523480 * |
Also Published As
| Publication number | Publication date |
|---|---|
| JP7107246B2 (ja) | 2022-07-27 |
| JP2020135554A (ja) | 2020-08-31 |
| US20220138375A1 (en) | 2022-05-05 |
Similar Documents
| Publication | Publication Date | Title |
|---|---|---|
| WO2020170867A1 (ja) | 推定装置、推定方法、及びプログラム | |
| Taylor et al. | Performance estimation toolbox (PESTO): Automated worst-case analysis of first-order optimization methods | |
| Eduarda Da Silva et al. | Difference equations for the higher‐order moments and cumulants of the INAR (1) model | |
| Ma | Adaptive shrinkage in Pólya tree type models | |
| Pan et al. | Adaptive importance sampling for extreme quantile estimation with stochastic black box computer models | |
| CN115828414A (zh) | 雷达罩结构的分布参数不确定性可靠性灵敏度分析方法 | |
| Mohammadi et al. | An Introduction to the BDgraph for Bayesian Graphical Models | |
| Antoniano‐Villalobos et al. | A nonparametric model for stationary time series | |
| Cui et al. | Multilevel dimension-independent likelihood-informed MCMC for large-scale inverse problems | |
| WO2020145252A1 (ja) | データ解析装置、方法、及びプログラム | |
| Song et al. | Wasserstein generative regression | |
| Vexler et al. | Computing critical values of exact tests by incorporating Monte Carlo simulations combined with statistical tables | |
| de la Fuente et al. | An efficient nonlinear programming strategy for PCA models with incomplete data sets | |
| JP2018067227A (ja) | データ分析装置、データ分析方法、データ分析処理プログラム | |
| Lu et al. | Likelihood based confidence intervals for the tail index | |
| US11443136B2 (en) | System and method for signal pre-processing based on data driven models and data dependent model transformation | |
| Wen et al. | Laplace Error Penalty‐based Variable Selection in High Dimension | |
| Liu et al. | On Random Batch Methods (RBM) for interacting particle systems driven by Lévy processes | |
| JP6398991B2 (ja) | モデル推定装置、方法およびプログラム | |
| Wang et al. | Constrained spline regression in the presence of AR (p) errors | |
| Alanazi | A mixture of regular vines for multiple dependencies | |
| Sköld et al. | Density estimation for the Metropolis–Hastings algorithm | |
| Chesi | Stabilization and entropy reduction via SDP-based design of fixed-order output feedback controllers and tuning parameters | |
| Delattre et al. | Local distortion and μ-mass of the cells of one dimensional asymptotically optimal quantizers | |
| Chan et al. | Model predictive control of Hammerstein systems with multivariable nonlinearities |
Legal Events
| Date | Code | Title | Description |
|---|---|---|---|
| 121 | Ep: the epo has been informed by wipo that ep was designated in this application |
Ref document number: 20758795 Country of ref document: EP Kind code of ref document: A1 |
|
| NENP | Non-entry into the national phase |
Ref country code: DE |
|
| 122 | Ep: pct application non-entry in european phase |
Ref document number: 20758795 Country of ref document: EP Kind code of ref document: A1 |