WO2020153150A1 - グラフ要約装置、グラフ要約方法及びプログラム - Google Patents
グラフ要約装置、グラフ要約方法及びプログラム Download PDFInfo
- Publication number
- WO2020153150A1 WO2020153150A1 PCT/JP2020/000596 JP2020000596W WO2020153150A1 WO 2020153150 A1 WO2020153150 A1 WO 2020153150A1 JP 2020000596 W JP2020000596 W JP 2020000596W WO 2020153150 A1 WO2020153150 A1 WO 2020153150A1
- Authority
- WO
- WIPO (PCT)
- Prior art keywords
- node
- graph
- factor
- nodes
- degree
- Prior art date
- Legal status (The legal status is an assumption and is not a legal conclusion. Google has not performed a legal analysis and makes no representation as to the accuracy of the status listed.)
- Ceased
Links
Images




Classifications
-
- G—PHYSICS
- G06—COMPUTING OR CALCULATING; COUNTING
- G06N—COMPUTING ARRANGEMENTS BASED ON SPECIFIC COMPUTATIONAL MODELS
- G06N5/00—Computing arrangements using knowledge-based models
- G06N5/02—Knowledge representation; Symbolic representation
-
- G—PHYSICS
- G06—COMPUTING OR CALCULATING; COUNTING
- G06F—ELECTRIC DIGITAL DATA PROCESSING
- G06F16/00—Information retrieval; Database structures therefor; File system structures therefor
- G06F16/90—Details of database functions independent of the retrieved data types
- G06F16/901—Indexing; Data structures therefor; Storage structures
-
- G—PHYSICS
- G06—COMPUTING OR CALCULATING; COUNTING
- G06F—ELECTRIC DIGITAL DATA PROCESSING
- G06F16/00—Information retrieval; Database structures therefor; File system structures therefor
- G06F16/90—Details of database functions independent of the retrieved data types
- G06F16/901—Indexing; Data structures therefor; Storage structures
- G06F16/9024—Graphs; Linked lists
-
- G—PHYSICS
- G06—COMPUTING OR CALCULATING; COUNTING
- G06F—ELECTRIC DIGITAL DATA PROCESSING
- G06F18/00—Pattern recognition
- G06F18/20—Analysing
- G06F18/29—Graphical models, e.g. Bayesian networks
-
- G—PHYSICS
- G06—COMPUTING OR CALCULATING; COUNTING
- G06N—COMPUTING ARRANGEMENTS BASED ON SPECIFIC COMPUTATIONAL MODELS
- G06N7/00—Computing arrangements based on specific mathematical models
- G06N7/01—Probabilistic graphical models, e.g. probabilistic networks
Definitions
- the present invention relates to a graph summarizing device, a graph summarizing method and a program.
- Non-Patent Document 1 Bayesian Network
- Non-Patent Document 2 decision tree
- Non-Patent Document 3 proposes a technique that simplifies Bayesian Network from structural information to improve estimation efficiency.
- the susceptibility of each node to the factor in system operation needs to take into account not only the structural information of the graph but also the information indicating whether or not the node was a factor in the past failure. Then, there is a problem that the accuracy of the factor estimation of the causal graph decreases.
- the technology that targets the relationships between individuals or communities and the citation relations of papers is a method specialized for their analysis, a summary that emphasizes the influence of each node such as the degree of the node will be performed.
- the present invention has been made in view of the above points, and an object of the present invention is to realize a graph summary capable of suppressing a decrease in the accuracy of factor estimation by a causal graph.
- the graph summarizing device is such that each node has a factor degree indicating the degree of the factor with respect to the state of the graph, and each edge has a weight indicating the strength of the causal relationship between the nodes. Then, for each node of the graph after the change, a calculation unit that calculates the importance based on the factor degree of the node of the graph before the change, and the first node whose importance is equal to or less than the threshold value as candidates for deletion. It has a selection part which selects and a deletion part which deletes the 1st node.
- FIG. 6 is a flowchart for explaining an example of a processing procedure executed by the failure factor estimation device 10. It is a figure which shows the 1st example of a graph structure used for description of determination of a weight. It is a figure which shows the 2nd example of a graph structure used for description of determination of a weight. It is a figure which shows the graph before the summary in the evaluation of this Embodiment. It is a figure which shows the graph after the summary in the evaluation of this Embodiment. It is a figure which shows the heat map of the difference of the factor degree between arbitrary nodes of the graph after a summary.
- the present embodiment discloses a graph summarizing method that considers important points in summarizing a causal graph, and a failure factor estimating apparatus 10 that executes the graph summarizing method. To be done.
- the failure factor estimation device 10 executes the following flow according to the occurrence of a failure in the monitored ICT (Information and Communication Technology) system (hereinafter, simply referred to as “system”).
- ICT Information and Communication Technology
- Step 1 Extract events from the log data output from the system at the present time (a certain period from the present to the past).
- the abnormal event may be extracted by using log template.
- each type of alert may be extracted as an abnormal event instead of extracting the event from the log data.
- the template of the log for example, “T. Kimura et. al., "Spatio-temporal Factorization of Log Data for for Understanding Network Events," IEEEINFOCOM 2014, pp. 610-618, 2014.” May be
- Step 2 Create a causal graph showing the causal relationship of events by combining the event information of past similar failures and the event information of the events extracted in step 1.
- a causal graph showing the causal relationship of events see, for example, "P. Chen, Y. Qi, P. Zheng and D. Hou, "CauseInfer:Automatic and Distributed Performance Diagnosis with Hierarchical Causality Graph in Large Distributed Systems IEEE INFOCOM 2014, pp. 1887-1895, 2014.”, or ⁇ B.
- Step 3 Summarize the graph created in Step 2.
- Step 4 Factor estimation from the graph after the summary.
- factor estimation for example, see ⁇ B. Zong, Y. Wu, J. Song, A. K. Singh, H. Cam, J. Han, and X. Yan, "Towards scalable critical alert mining,” in Proceedings of The 20th ACMSIG KDD international conference conference on Knowledge discovery and data mining (KDD'14), pp.1057-1066, 2014.” may be used as a reference.
- Step 5 Return the information before summarization only for the vicinity of the event that was the factor in step 4, and estimate the factor again. Thereby, the obstacle factor is estimated.
- the new technology is proposed by focusing on the graph summarization technology in step 3 above.
- the following three points are important points in summarizing the causal graph used for factor estimation.
- Nodes that are likely to be a factor are left after summarization.
- the graph after the summary has no cycle structure.
- the failure factor estimation device 10 of the present embodiment performs graph summarization applicable to factor estimation by a causal graph by considering the above points (1) to (3). This embodiment is executed by the following flow.
- Step 1 Detect nodes of low importance by considering point (1)
- Step 2 Consider edges (2) and determine edges and weights of the graph after deleting the corresponding node
- Step 3 Consider points (3) , Determine whether to delete the detected node [Problem setting]
- V(G) ⁇ v 1 ,...
- V N(G) ⁇ is a set of nodes of the graph G, and each node represents an alert generated at the time of failure, or an event extracted from log data at the time of failure,
- Each has a factor factor.
- the factor degree is an index indicating the degree of being a factor for the current state (structure) of the causal graph G.
- N(G) is the number of nodes in the graph G
- E(G) ⁇ e j,k
- j,k 1,...
- N(G) ⁇ is a set of edges of the graph G
- e j,k Represents an edge from the node v j to the node v k .
- f G : E(G) ⁇ R + is a function representing the weight of the side of G. However, R + represents a set of all real numbers of 0 or more.
- the edge weight indicates the strength of the causal relationship between the nodes connected by the edge.
- the edge weight indicates the probability that the cause of the event related to the node ahead of the side is the event related to the source node of the side.
- a causal graph G 1 is generated.
- the probability space ( ⁇ , F, p) is set.
- ⁇ is a group consisting of all subsets of V(G).
- ⁇ X j 1 ⁇ ).
- F Gi for each i is a function that approximates f G and is determined by an existing method.
- G * ⁇ G, R * G * satisfying ⁇ R, R * is obtained, P * therefrom; main factor for the fault by calculating the ( ⁇ R *) Is confirmed.
- G * and R * it is necessary to estimate the main factor using the information obtained at that time, and to estimate the main factor as quickly and accurately as possible. Accordingly, G 1, ..., with respect to G i-1 of using information summarizing the G i, V (G G 'after having created a i' i) ⁇ V (G i ) G satisfies the 'i We will consider achieving the above by estimating the factors.
- FIG. 1 is a diagram showing a hardware configuration example of a failure factor estimation device 10 according to an embodiment of the present invention.
- the failure factor estimation device 10 of FIG. 1 is a computer including a drive device 100, an auxiliary storage device 102, a memory device 103, a CPU 104, an interface device 105, etc., which are connected to each other by a bus B.
- a program that implements the processing in the failure factor estimation device 10 is provided by a recording medium 101 such as a CD-ROM.
- a recording medium 101 such as a CD-ROM.
- the program is installed in the auxiliary storage device 102 from the recording medium 101 via the drive device 100.
- the program does not necessarily have to be installed from the recording medium 101, and may be downloaded from another computer via a network.
- the auxiliary storage device 102 stores the installed program and also stores necessary files and data.
- the memory device 103 reads the program from the auxiliary storage device 102 and stores it when an instruction to activate the program is given.
- the CPU 104 executes the function related to the failure factor estimation device 10 according to the program stored in the memory device 103.
- the interface device 105 is used as an interface for connecting to a network.
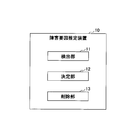
- FIG. 2 is a diagram showing a functional configuration example of the failure factor estimation device 10 according to the exemplary embodiment of the present invention.
- the failure factor estimation device 10 includes a detection unit 11, a determination unit 12, and a deletion unit 13. Each of these units is realized by a process that causes the CPU 104 to execute one or more programs installed in the failure factor estimation apparatus 10.
- FIG. 3 is a flowchart for explaining an example of a processing procedure executed by the failure factor estimation device 10.
- step S101 the detection unit 11 calculates the importance of each node in the causal graph G i after the change in accordance with the occurrence of the i-th failure.
- G i-1 is a causal graph before the occurrence of the i- th failure (that is, before the change).
- the event v having a large b i (v), that is, a large factor in G i ⁇ 1 is expected to have a high factor in G i , but the newly added event u ⁇ V(G i ) ⁇ V Regarding (G i ⁇ 1 ), if the event u can be a factor of the event v having a large factor in G i ⁇ 1 , the factor may be high. However, the load of calculation of the factor degree of each node in G i is high. Therefore, the detection unit 11 determines, in G i-1 , the importance degree that is an approximate value of the factor degree (a value that can approximate the magnitude relationship of the factor degrees) and that can be calculated by a calculation load lower than the factor degree.
- the factor degrees are used to calculate for each node of G i .
- b i [b i (v 1 ),..., b i (v N(Gi) )] T is defined.
- ⁇ X j 1 ⁇ ) It is considered that they have been multiplied by and added up for k. As a result, it is possible to prevent the importance of an event, which may have a relatively high factor in G i , from becoming relatively low.
- the detection unit 11 the importance of the G i as follows c i: V (G i) ⁇ calculate the R +.
- a i represents the G i of the adjacency matrix A (G i).
- the detection unit 11 considers v that the importance c i (v) calculated by the equation (1) becomes relatively small as not so important in factor estimation and selects it as a candidate for deletion. .. The following holds.
- the fetched node is deleted from D.
- the extracted node is referred to as “node v j ”.
- the order of extracting the nodes is not limited to a particular order.
- the node having the lowest importance level c i (v) may be extracted, the node having the smallest index may be extracted, or the nodes may be randomly extracted.
- An index is an identifier given to a node, and is, for example, a numerical value indicating the order in which the nodes were generated.
- the determining unit 12 determines how to attach the edges when the node v j is deleted (after the deletion) (S105). Specifically, determining unit 12, among the nodes adjacent to node v j, the weight of the edge from v j is to identify the node v k that maximizes, v j and v k to be regarded as one node Then, the edge of v j and the edge of v k are attached to the one node.
- the reason why the node with the maximum weight is used is to minimize the influence of the change in weight in the calculation of the factor before and after deleting the node when the weight is determined by the method described below.
- the determining unit 12 determines the weight of each side for which the attachment method is determined in step S105 so that the factor factor of each node does not change before and after the node deletion in the following three simple structures (S106). ..
- the graph before the node v j is deleted is represented by G B
- the graph after the deletion is represented by G A.
- Both v j and v k have no edges from the common node, and no edges extend from both v j and v k to the common node (that is, node v j is a parent of node v k ). If it is a node), then f GA is created by multiplying the edge weights f GB (e jk ) from v j to v k by all the edge weights emanating from v k . By determining the weight in this way, it is possible to prevent the factor factor from changing for the tree before and after node deletion.
- step S105 When the common node v l in G B has edges extending from both v j and v k , in step S105, the three edges e jk , e kl , and e jl become one edge e jl in G A. ..
- the deletion unit 13 deletes v j if all the eigenvalues of A(G A ) are 0 (Yes in S108), and does not delete v j otherwise (No in S108).
- the deletion unit 13 adds the edge to G i and the weight to the edge according to the execution results of steps S105 and S106.
- step S104 The process from step S104 is executed until D becomes empty. That is, step S104 and subsequent steps are executed for each v j ⁇ D.
- G i may be assumed to be an upper triangular matrix. Changes from A (G B) to A (G A), of the nodes adjacent to v j, the rows and columns and the change in the weight of the edge from v j corresponds to a node v k that maximizes the node Delete the row and column corresponding to v j .
- the structure of the upper triangular matrix is changed only by the change in the row and column corresponding to the node v k , so the number of components other than the upper triangular component of G A is small. Therefore, the amount of calculation required for QR decomposition necessary to numerically obtain the eigenvalue of G A is small.
- Evaluation 1
- is represented by a heat map as shown in FIG. In most u,v pairs, the value of
- was 0.1 or less. This means that when R 2 ⁇ v ⁇ is set, the difference in the factor of the event u before and after the graph summarization is within 0.1 or less.
- propagation of past information is performed in a form suitable for factor estimation by a causal graph, and unnecessary nodes are detected based on the result to summarize the graph. That is, unimportant vertices are detected by determining the importance of each node using past information. Since it can be shown that this degree of importance converges to a value that is equal to or greater than the true factor degree, nodes that are likely to be factors can remain after summarization. As a result, it is possible to realize a graph summary that can suppress a decrease in the accuracy of factor estimation by a causal graph in system operation.
- a causal graph showing the causal relationship of events obtained by a failure is summarized so that the most important events are left as much as possible and the effect on the result of factor estimation is minimized, and the structure of the graph is maintained.
- factor estimation can be speeded up while maintaining a certain degree of accuracy.
- further accuracy can be achieved by restoring the deleted vertices and re-estimating the factor only around the node with the high factor in the graph after the summarization. This makes it possible to speed up the response when a failure occurs while maintaining accuracy.
- the failure factor estimation device 10 is an example of a causal graph summarization device.
- the detection unit 11 is an example of a calculation unit and a selection unit.
Landscapes
- Engineering & Computer Science (AREA)
- Theoretical Computer Science (AREA)
- Physics & Mathematics (AREA)
- General Physics & Mathematics (AREA)
- Data Mining & Analysis (AREA)
- General Engineering & Computer Science (AREA)
- Databases & Information Systems (AREA)
- Software Systems (AREA)
- Artificial Intelligence (AREA)
- Evolutionary Computation (AREA)
- Computing Systems (AREA)
- Mathematical Physics (AREA)
- Computational Linguistics (AREA)
- Computer Vision & Pattern Recognition (AREA)
- Evolutionary Biology (AREA)
- Bioinformatics & Computational Biology (AREA)
- Bioinformatics & Cheminformatics (AREA)
- Life Sciences & Earth Sciences (AREA)
- Probability & Statistics with Applications (AREA)
- Algebra (AREA)
- Computational Mathematics (AREA)
- Mathematical Analysis (AREA)
- Mathematical Optimization (AREA)
- Pure & Applied Mathematics (AREA)
- Information Retrieval, Db Structures And Fs Structures Therefor (AREA)
Abstract
グラフ要約装置は、各ノードがグラフの状態に対する要因の度合いを示す要因度を有し、各辺がノード間の因果関係の強さを示す重みを有するグラフが変化すると、変化後の前記グラフの各ノードについて、変化前の前記グラフのノードの要因度に基づく重要度を計算する計算部と、前記重要度が閾値以下である第1のノードを削除の候補として選択する選択部と、前記第1のノードを削除する削除部と、を有することで、因果グラフによる要因推定の精度の低下を抑制可能なグラフ要約を実現する。
Description
本発明は、グラフ要約装置、グラフ要約方法及びプログラムに関する。
システム運用において、オペレータの運用負荷低減のため、故障対応の自動化技術が検討されている。特に、障害発生時に障害の要因を特定することは人手では膨大な時間を要する場合が多く、障害要因推定技術に関する研究は重要である。これらの技術はBayesian Network(非特許文献1)や決定木(非特許文献2)などの因果グラフを用いて行われるケースが多い。
将来的には、仮想化技術の浸透により、システムの大規模化・複雑化が見込まれる。このため、障害発生時のアラートや異常なイベントの数が増加し、それらの因果関係も複雑化すると見込まれる。これにより、上記のような要因推定技術において、大規模かつ複雑なグラフが生じると見込まれる。
グラフに関する一般的な技術として、グラフの重要な部分を抜き出して単純化する、グラフ要約の技術が提案されている。これを因果グラフに適用できれば、グラフ要約を用いて要約後のグラフで要因推定を行い、おおまかな要因を推定した上で、要因となったイベントの付近のみについて要約前の情報を戻し、もう一度要因推定を行うことで計算時間の削減が期待できる。要因推定の対象となるイベント数が削減されることで計算時間が削減され、さらに、2段階の推定により、精度も確保される。
グラフ要約に関しては、個人又はコミュニティ同士の関係性や論文の引用関係の解析を対象とした研究が行なわれてきたが(非特許文献3)、要因推定を目的として因果グラフに対して適用するための技術は少ない。非特許文献4では、構造的な情報からBayesian Networkを単純化することで、推定を効率化する技術が提案されている。
E. R. J. Hruschka, M. do Carmo Nicoletti, V. A. de Oliveira, and G. M. Bressan, "Markov-blanket based strategy for translating a bayesian classifier into a reduced set of classification rules," in Proceedings of the 7th International Conference on Hybrid Intelligent Systems (HIS '07), pp. 192-197, 2007.
A. X. Zheng, J. Lloyd, and E. Brewer, "Failure diagnosis using decision trees," in proceedings of the First International Conference on Autonomic Computing (ICAC '04), pp. 36-43, 2004.
Y. Liu, T. Safavi, A. Dighe and D. Koutra, "Graph Summarization Methods and Applications: A Survey, ACM Computing Surveys," 51(3), pp. 1-34, 2018.
M. Shiba, A. Takahashi, S. Aoki, H. Tsuji and S. Inoue, "Numerical experimentation on structure simplification in Bayesian network," 2009 IEEE International Conference on Systems, Man and Cybernetics, pp. 4698-4703, 2009.
因果グラフに対してグラフ要約を適用することを考慮した方法は少ないながら存在するが、いずれの方法も、末端にあるノードを削除する、隣接ノードを共有している複数のノードをグルーピングするなど、グラフの構造的な情報しか用いていない。さらに、指針のみが示されており、削除するノードやグルーピングするノードの決定方法が明確に示されているわけではない。
一方、システム運用における各ノードの要因へのなりやすさは、グラフの構造的な情報に加えて、過去の障害においてそのノードが要因であったか否かの情報も考慮する必要があるため、従来技術では因果グラフの要因推定の精度が落ちてしまうという課題がある。 また、個人又はコミュニティ同士の関係性や論文の引用関係を対象とした技術は、それらの解析に特化した方法であるため、ノードの次数など各ノードの影響力を重視した要約を行う。
一方、因果グラフによる要因推定においては、各ノードの要因へのなりやすさが重要となるため、上記のような既存技術でも因果グラフの要因推定の精度が落ちてしまうという課題がある。
このように、システム運用における因果グラフによる要因推定に適したグラフ要約は、既存技術のみでは達成することができない。
本発明は、上記の点に鑑みてなされたものであって、因果グラフによる要因推定の精度の低下を抑制可能なグラフ要約を実現することを目的とする。
そこで上記課題を解決するため、グラフ要約装置は、各ノードがグラフの状態に対する要因の度合いを示す要因度を有し、各辺がノード間の因果関係の強さを示す重みを有するグラフが変化すると、変化後の前記グラフの各ノードについて、変化前の前記グラフのノードの要因度に基づく重要度を計算する計算部と、前記重要度が閾値以下である第1のノードを削除の候補として選択する選択部と、前記第1のノードを削除する削除部と、を有する。
因果グラフによる要因推定の精度の低下を抑制可能なグラフ要約を実現することができる。
以下、図面に基づいて本発明の実施の形態を説明する。計算時間の増大と精度の低下という課題解決のため、本実施の形態では因果グラフの要約において重要なポイントを考慮したグラフ要約方法と、当該グラフ要約方法を実行する障害要因推定装置10とが開示される。障害要因推定装置10は、監視対象のICT(Information and Communication Technology)システム(以下、単に「システム」という。)の障害の発生に応じて以下のフローを実行する。
ステップ1:現在(現在から過去の一定期間)においてシステムから出力されたログデータからイベントを抽出。ログデータから異常なイベントを抽出する場合、ログのテンプレート化を用いて異常なイベントが抽出されてもよい。また、システムが、明示的に異常なイベント(アラート)を出力する場合、ログデータからイベントを抽出するのではなく、各種類のアラートが、異常なイベントとして抽出されてもよい。なお、ログのテンプレート化については、例えば、「T. Kimura et. al., "Spatio-temporal Factorization of Log Data for Understanding Network Events," IEEE INFOCOM 2014, pp. 610-618, 2014.」等が参考とされてもよい。
ステップ2:過去の類似障害におけるイベント情報と、ステップ1において抽出されたイベントのイベント情報とを組み合わせて、イベントの因果関係を表す因果グラフを作成。イベントの因果関係を示す因果グラフの作成については、例えば、「P. Chen, Y. Qi, P. Zheng and D. Hou, "CauseInfer:Automatic and Distributed Performance Diagnosis with Hierarchical Causality Graph in Large Distributed Systems," IEEE INFOCOM 2014, pp. 1887-1895, 2014.」、あるいは、「B. Zong, Y. Wu, J. Song, A. K. Singh, H. Cam, J. Han, and X. Yan, "Towards scalable critical alert mining," in Proceedings of the 20th ACM SIGKDD international conference on Knowledge discovery and data mining (KDD '14), pp.1057-1066, 2014.」等が参考とされてもよい。
ステップ3:ステップ2で作成したグラフを要約。
ステップ4:要約後のグラフで要因推定。要因推定については、例えば、「B. Zong, Y. Wu, J. Song, A. K. Singh, H. Cam, J. Han, and X. Yan, "Towards scalable critical alert mining," in Proceedings of the 20th ACM SIGKDD international conference on Knowledge discovery and data mining (KDD '14), pp.1057-1066, 2014.」等が参考とされてもよい。
ステップ5:ステップ4で要因となったイベントの付近のみについて要約前の情報を戻し、もう一度要因推定。これにより、障害要因が推定される。
本実施の形態では、上記のステップ3のグラフ要約技術に焦点を当て、新技術を提案する。要因推定に用いる因果グラフの要約において重要なポイントとなるのは次の3つである。
(1)要因となる可能性が高いノードは要約後も残す。
(2)要約の前後で要因推定の結果に変化が少ない。
(3)要約後のグラフはサイクル構造を持たない。
(1)要因となる可能性が高いノードは要約後も残す。
(2)要約の前後で要因推定の結果に変化が少ない。
(3)要約後のグラフはサイクル構造を持たない。
本実施の形態の障害要因推定装置10は、上記(1)~(3)のポイントを考慮することで、因果グラフによる要因推定において適用可能なグラフ要約を行う。本実施の形態は以下のフローで実行される。
ステップ1:ポイント(1)を考慮し重要度の低いノードを検出
ステップ2:ポイント(2)を考慮し、該当ノード削除後のグラフの辺及び重みを決定
ステップ3:ポイント(3)を考慮し、検出したノードを削除するか否かを判断
[問題設定]
因果グラフGは、G=(V(G),E(G),fG)とする。但し、V(G)={v1,…,vN(G)}は、グラフGのノードの集合で、各ノードは障害時に発生したアラート、又は障害時にログデータから抽出したイベントを表し、それぞれが要因度を有する。要因度とは、因果グラフGの現在の状態(構造)に対する要因である度合いを示す指標である。なお、本実施の形態では、障害時に発生したアラート及びログデータから抽出したイベントのいずれをも、イベントと呼ぶ。N(G)は、グラフGのノード数、E(G)={ej,k|j,k=1,…,N(G)}は、グラフGの辺の集合で、ej,kは、ノードvjからノードvkへ向かう辺を表す。fG:E(G)→R+は、Gの辺の重みを表す関数とする。ただし、R+は0以上の実数全体の集合を表す。辺の重みは、当該辺によって接続されるノード間の因果関係の強さを示す。すなわち、辺の重みは、当該辺の先のノードに係るイベントの要因が、当該辺の元のノードに係るイベントである可能性の高さを示す。また、Gの隣接行列A(G)を、A(G)=[fG(ej,k)]j,kで定める。
ステップ2:ポイント(2)を考慮し、該当ノード削除後のグラフの辺及び重みを決定
ステップ3:ポイント(3)を考慮し、検出したノードを削除するか否かを判断
[問題設定]
因果グラフGは、G=(V(G),E(G),fG)とする。但し、V(G)={v1,…,vN(G)}は、グラフGのノードの集合で、各ノードは障害時に発生したアラート、又は障害時にログデータから抽出したイベントを表し、それぞれが要因度を有する。要因度とは、因果グラフGの現在の状態(構造)に対する要因である度合いを示す指標である。なお、本実施の形態では、障害時に発生したアラート及びログデータから抽出したイベントのいずれをも、イベントと呼ぶ。N(G)は、グラフGのノード数、E(G)={ej,k|j,k=1,…,N(G)}は、グラフGの辺の集合で、ej,kは、ノードvjからノードvkへ向かう辺を表す。fG:E(G)→R+は、Gの辺の重みを表す関数とする。ただし、R+は0以上の実数全体の集合を表す。辺の重みは、当該辺によって接続されるノード間の因果関係の強さを示す。すなわち、辺の重みは、当該辺の先のノードに係るイベントの要因が、当該辺の元のノードに係るイベントである可能性の高さを示す。また、Gの隣接行列A(G)を、A(G)=[fG(ej,k)]j,kで定める。
システム運用において、最初の障害が起こると、因果グラフG1が生成される。次に類似した障害が起こった場合、1度目の障害の情報に2度目の障害の情報が加わり、V(G1)⊆V(G2)を満たす因果グラフG2が生成される(グラフG1の状態(構造)がグラフG2に変化する)。障害が起こる度にこれが行われ、類似障害に対するグラフの列{Gi}i=1
∞が生成される。また、i度目の障害時に発生したイベントの集合をRi⊆V(Gi)とし、集合列{Ri}i=1
∞が生成されるとする。iが増加するにしたがって、イベント間の因果関係は定まり、真の因果関係を表す因果グラフへ収束していくとする。また、iが増加するにしたがって各発生イベントがノイズかどうかの判断が可能となり、真の発生イベントへ収束するとする。つまり、次を満たすG=(V(G),E(G),fG)とRが存在すると仮定する。

極限グラフGにおいて、確率空間(Ω,F,p)が定まるとする。但し、Ωは、V(G)の全ての部分集合からなる集合族とする。また、各vj∈V(G)に対して確率変数Xj:Ω→{0,1}を、vj∈ωのときXj(ω)=1、vj∈ωでないときXj(ω)=0で定める。fG(ej,k)=p({Xk=1}|{Xj=1})とする。各iに対してfGiは、fGを近似する関数で、既存手法により定める。
このとき、イベントvj∈V(Gi)が起こった際に、イベントvl∈Riが起こる確率の和Σvl∈Rip({Xl=1}|{Xj=1})の近似Pi(vj;Ri)をvjの要因度とし、この値が高いイベントが、i度目の障害時の主要因であると推定することとする。但し、Piは次のように定める。
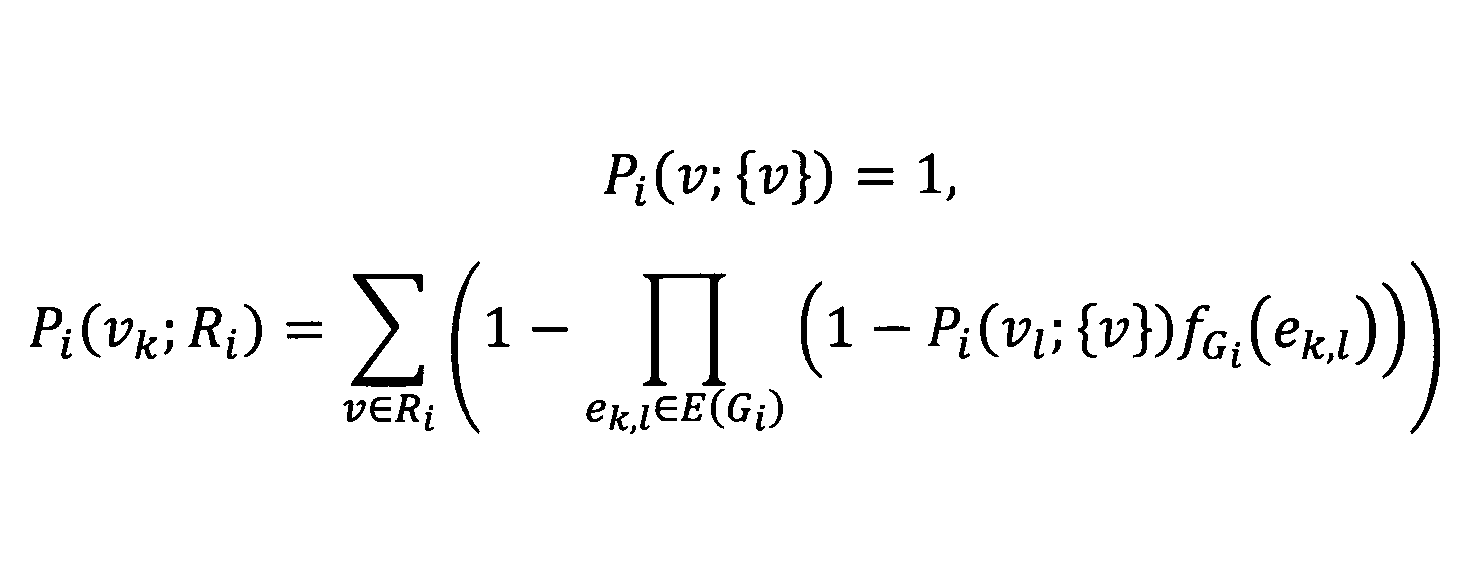
このとき、limi→∞Pi(・;Ri)=P(・;R)(各点)が成り立つ。但し、
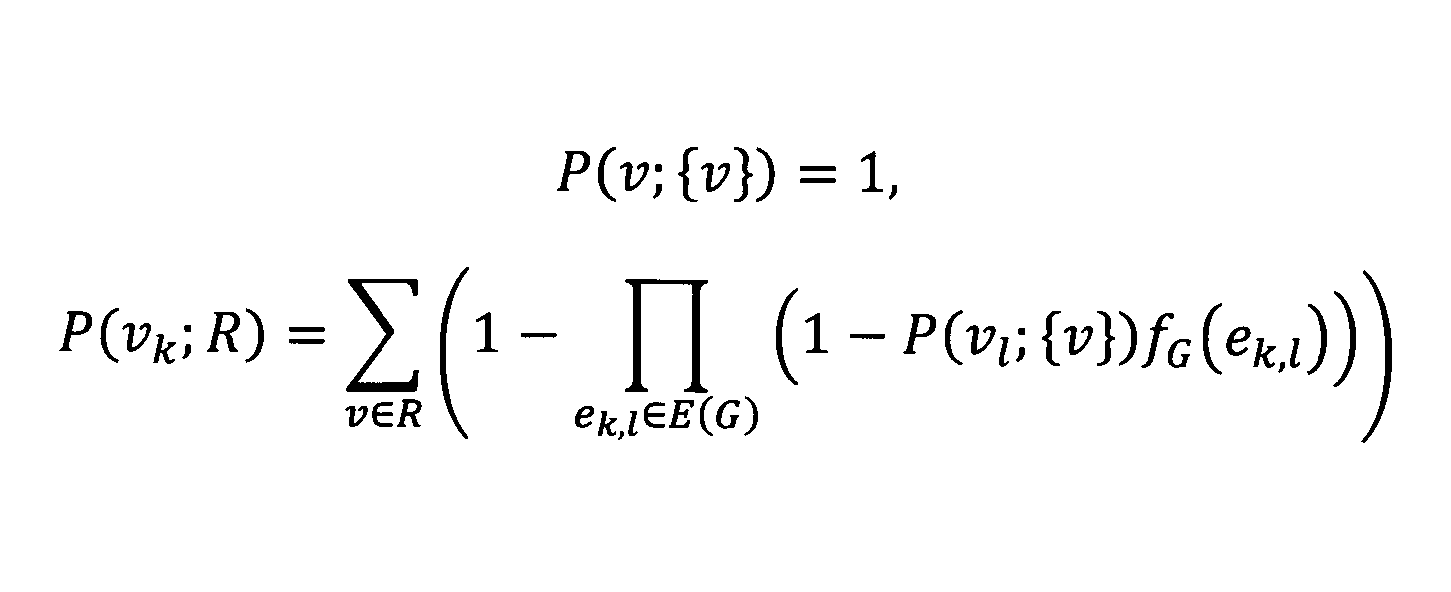
類似障害が十分な回数起これば、G*≒G、R*≒Rを満たすG*、R*が得られ、そこからP*(・;R*)を計算することでその故障に対する主要因が確定する。しかし、G*、R*が得られるまでは、その時点で得られている情報を用いて要因推定を行い、出来るだけ高速、かつ、正確に主要因を推定する必要がある。そこで、G1,…,Gi-1の情報を用いてGiを要約し、V(G'i)⊂V(Gi)を満たすG'iを作成した上でG'iに対して要因推定を行うことで、上記を達成することを考える。
[障害要因推定装置10]
上記考えに基づく障害要因推定装置10について説明する。図1は、本発明の実施の形態における障害要因推定装置10のハードウェア構成例を示す図である。図1の障害要因推定装置10は、それぞれバスBで相互に接続されているドライブ装置100、補助記憶装置102、メモリ装置103、CPU104、及びインタフェース装置105等を有するコンピュータである。
上記考えに基づく障害要因推定装置10について説明する。図1は、本発明の実施の形態における障害要因推定装置10のハードウェア構成例を示す図である。図1の障害要因推定装置10は、それぞれバスBで相互に接続されているドライブ装置100、補助記憶装置102、メモリ装置103、CPU104、及びインタフェース装置105等を有するコンピュータである。
障害要因推定装置10での処理を実現するプログラムは、CD-ROM等の記録媒体101によって提供される。プログラムを記憶した記録媒体101がドライブ装置100にセットされると、プログラムが記録媒体101からドライブ装置100を介して補助記憶装置102にインストールされる。但し、プログラムのインストールは必ずしも記録媒体101より行う必要はなく、ネットワークを介して他のコンピュータよりダウンロードするようにしてもよい。補助記憶装置102は、インストールされたプログラムを格納すると共に、必要なファイルやデータ等を格納する。
メモリ装置103は、プログラムの起動指示があった場合に、補助記憶装置102からプログラムを読み出して格納する。CPU104は、メモリ装置103に格納されたプログラムに従って障害要因推定装置10に係る機能を実行する。インタフェース装置105は、ネットワークに接続するためのインタフェースとして用いられる。
図2は、本発明の実施の形態における障害要因推定装置10の機能構成例を示す図である。図2において、障害要因推定装置10は、検出部11、決定部12及び削除部13を有する。これら各部は、障害要因推定装置10にインストールされた1以上のプログラムが、CPU104に実行させる処理により実現される。
図3は、障害要因推定装置10が実行する処理手順の一例を説明するためのフローチャートである。
ステップS101において、検出部11は、i度目の障害の発生に応じた変化後の因果グラフGiにおける各ノードの重要度を計算する。
Giにおいて要因推定を行う際、bi(v)=Pi-1(v;Ri-1)(v∈V(Gi-1)⊆V(Gi)のとき)、bi(v)=0(v∈V(Gi)\V(Gi-1)のとき)と定める。なお、Gi-1は、i度目の障害の発生前(すなわち、変化前の)因果グラフである。
bi(v)が大きい、つまり、Gi-1において要因度が大きかったイベントvは、Giでも要因度が高くなると見込まれるが、新たに加わったイベントu∈V(Gi)\V(Gi-1)については、当該イベントuがGi-1において要因度が大きかったイベントvの要因となり得る場合、要因度が高くなる可能性がある。但し、Giにおける各ノードの要因度の計算の負荷は高い。そこで、検出部11は、要因度の近似値であって(要因度の大小関係を近似できる値であって)、要因度よりも低い計算負荷によって計算可能な重要度を、Gi-1における要因度を用いてGiの各ノードについて計算する。
v∈V(Gi)の重要度をci(v)とおき、ci=[ci(v1),…,ci(vN(Gi))]T、と定める。さらに、bi=[bi(v1),…,bi(vN(Gi))]Tと定める。重要度は、時刻t=0においてbiであり、時刻t=1においてciになるとする。biとciを時刻tについて滑らかにつなぐ関数di:[0,T]→R+
N(Gi)を考える。vjを、Giにおいて新たに加わったイベントとする。微小時t=0からt=hにおけるdiの第j成分の変化量を考える。vjに隣接しているノードの集合を

具体的には、検出部11は、次のようにしてGiにおける重要度ci:V(Gi)→R+を計算する。
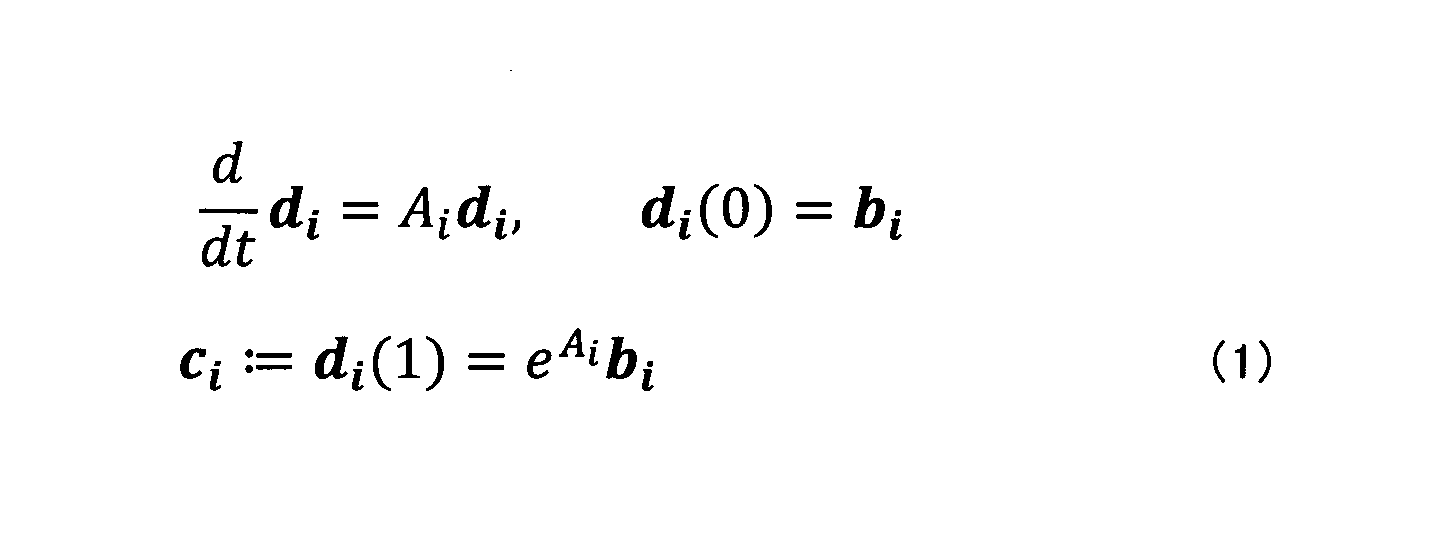
後述されるように、検出部11は、(1)式により計算した重要度ci(v)が相対的に小さくなるvを、要因推定においてあまり重要ではないとみなし、削除の候補として選択する。以下が成立する。

また、diの各成分は単調増加するため、任意のv∈V(Gi)に対して、bi(v)≦ci(v)が成り立つから、Gi-1において要因度が相対的に高かったノードが削除されることはない。これにより、ポイント(1)を考慮した検出が可能となる。
続いて、検出部11は、ci(v)が一定の閾値cmax以下であるノードの集合を抽出し、抽出した集合をDに代入する(S102)。すなわち、以下の演算が行われる。
D={v∈V(Gi)|ci(v)≦cmax}
続いて、決定部12は、該当ノード(Dに含まれるノード)の有無(Dが空であるか否か)を判定する(S103)。該当ノードが無い場合(Dが空である場合)(S103でYes)、図3の処理は終了する。該当ノードが有る場合(S103でNo)、決定部12は、Dから一つのノードを取り出す(S104)。取り出されたノードは、Dから削除される。以下、取り出されたノードを、「ノードvj」という。なお、ノードの取り出し順は、特定の順序に限定されない。例えば、重要度ci(v)が最も低いノードが取り出されてもよいし、インデックスが最も小さいノードが取り出されてもよいし、ランダムにノードが取り出されてもよい。インデックスとは、ノードに付与される識別子であり、例えば、ノードが生成された順番を示す数値である。
D={v∈V(Gi)|ci(v)≦cmax}
続いて、決定部12は、該当ノード(Dに含まれるノード)の有無(Dが空であるか否か)を判定する(S103)。該当ノードが無い場合(Dが空である場合)(S103でYes)、図3の処理は終了する。該当ノードが有る場合(S103でNo)、決定部12は、Dから一つのノードを取り出す(S104)。取り出されたノードは、Dから削除される。以下、取り出されたノードを、「ノードvj」という。なお、ノードの取り出し順は、特定の順序に限定されない。例えば、重要度ci(v)が最も低いノードが取り出されてもよいし、インデックスが最も小さいノードが取り出されてもよいし、ランダムにノードが取り出されてもよい。インデックスとは、ノードに付与される識別子であり、例えば、ノードが生成された順番を示す数値である。
続いて、決定部12は、ノードvjを削除した際(削除した後)の辺の付け方を決定する(S105)。具体的には、決定部12は、ノードvjに隣接するノードのうち、vjからの辺の重みが最大になるノードvkを特定し、vjとvkを1つのノードとみなすことにより、当該1つのノードにvjの辺及びvkの辺を付ける。
重みが最大になるノードを用いる理由は、以下で説明する方法で重みを決定した場合に、ノード削除前と削除後の要因度の計算における重みの変化の影響を最小にするためである。
続いて、決定部12は、ステップS105において付け方が決定された各辺の重みを、次の3つの単純な構造において、ノード削除前後で各ノードの要因度が変化しないように決定する(S106)。以下では、ノードvj削除前のグラフをGB、削除後のグラフをGAと表す。
[木構造]
共通のノードからvjとvkの両方に辺が入っておらず、かつ、共通のノードにvjとvk両方から辺がのびていない場合(すなわち、ノードvjがノードvkの親ノードである場合)、vjからvkへ向かう辺の重みfGB(ejk)を、vkから出ている辺の重み全てに掛け合わせることにより、fGAを作成する。このようにして重みを決定することで、木に対してはノード削除前後で要因度が変化しないようにすることができる。
共通のノードからvjとvkの両方に辺が入っておらず、かつ、共通のノードにvjとvk両方から辺がのびていない場合(すなわち、ノードvjがノードvkの親ノードである場合)、vjからvkへ向かう辺の重みfGB(ejk)を、vkから出ている辺の重み全てに掛け合わせることにより、fGAを作成する。このようにして重みを決定することで、木に対してはノード削除前後で要因度が変化しないようにすることができる。
[図4の構造]
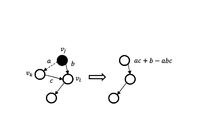
GBにおいて共通のノードvlからvjとvkの両方に辺が入っている場合、ステップS105ではejk、elk、eljの3辺が、GAにおいて一つの辺elkとなる。重みは、fGA(elk)=fGB(elj)・fGB(ejk)+fGB(elk)-fGB(elj)・fGB(ejk)・fGB(elk)により決定する。このように決定することで、図4のような構造に対してはノード削除前後で要因度が変化しないようにすることができる。なお、図4において、a=fGB(elj)、b=fGB(elk)、c=fGB(ejk)である。
GBにおいて共通のノードvlからvjとvkの両方に辺が入っている場合、ステップS105ではejk、elk、eljの3辺が、GAにおいて一つの辺elkとなる。重みは、fGA(elk)=fGB(elj)・fGB(ejk)+fGB(elk)-fGB(elj)・fGB(ejk)・fGB(elk)により決定する。このように決定することで、図4のような構造に対してはノード削除前後で要因度が変化しないようにすることができる。なお、図4において、a=fGB(elj)、b=fGB(elk)、c=fGB(ejk)である。
[図5の構造]
GBにおいて共通のノードvlに、vjとvkの両方から辺がのびている場合、ステップS105ではejk、ekl、ejlの3辺が、GAにおいて一つの辺ejlとなる。重みは、fGA(ekl)=fGB(ekl)・fGB(ejk)+fGB(ejl)-fGB(ekl)・fGB(ejk)・fGB(ejl)により決定する。このように決定することで、図5のような構造に対してはノード削除前後で要因度が変化しないようにすることができる。なお、図5において、図4において、a=fGB(ejk)、b=fGB(ejl)、c=fGB(ekl)である。
GBにおいて共通のノードvlに、vjとvkの両方から辺がのびている場合、ステップS105ではejk、ekl、ejlの3辺が、GAにおいて一つの辺ejlとなる。重みは、fGA(ekl)=fGB(ekl)・fGB(ejk)+fGB(ejl)-fGB(ekl)・fGB(ejk)・fGB(ejl)により決定する。このように決定することで、図5のような構造に対してはノード削除前後で要因度が変化しないようにすることができる。なお、図5において、図4において、a=fGB(ejk)、b=fGB(ejl)、c=fGB(ekl)である。
続いて、削除部13は、ノードvjを削除するか否かを判断する(S107)。具体的には、削除部13は、削除候補のvjの削除前のグラフをGB、削除後のグラフをGAとした場合にGAの隣接行列の固有値を調べることで、GAにサイクル構造があるか否かを調べる。一般に、グラフGの隣接行列A(G)に対して、次が成り立つ。
A(G)の固有値が全て0
⇒A(G)n=0
⇒Gに長さn以上のパスは無い。
⇒Gにサイクル構造が無い。
A(G)の固有値が全て0
⇒A(G)n=0
⇒Gに長さn以上のパスは無い。
⇒Gにサイクル構造が無い。
よって、削除部13は、A(GA)の固有値が全て0ならば(S108でYes)、vjを削除し、そうでなければ(S108でNo)、vjを削除しない。なお、削除部13は、vjを削除した場合、ステップS105及びS106の実行結果に従って、Giに対する辺の付与及び当該辺に対する重みを付与する。
ステップS104以降は、Dが空になるまで実行される。すなわち、各vj∈Dに対してステップS104以降が実行される。
一般の行列に対する固有値の計算は計算コストが高いが、次の理由により、今回の場合は計算コストが削減される。一般に、グラフGにサイクル構造が無ければ、A(G)は上三角行列にできる。よって、Giは上三角行列と仮定されてよい。A(GB)からA(GA)への変化は、vjに隣接するノードのうち、vjからの辺の重みが最大になるノードvkに対応する行と列の変化と、ノードvjに対応する行と列の削除である。この変化の中で上三角行列の構造に変化を与えるのはノードvkに対応する行と列の変化のみであるから、GAの上三角成分以外の成分の数は少ない。よって、GAの固有値を数値的に求めるために必要なQR分解に必要な計算量は少なくなる。
[評価結果]
ランダムに作成した小さなグラフに対して本実施の形態を適用することで、上記のポイント(1)~(3)のうち、「(1)要因となる可能性が高いノードは要約後も残す」、「(2)要約の前後で要因推定の結果に変化が少ない」について評価を行った。
ランダムに作成した小さなグラフに対して本実施の形態を適用することで、上記のポイント(1)~(3)のうち、「(1)要因となる可能性が高いノードは要約後も残す」、「(2)要約の前後で要因推定の結果に変化が少ない」について評価を行った。
[設定]
以下のようにして、[問題設定]で述べた状況を模擬し、評価を行った。
1.ノード数が25のランダムなグラフG1を作成。
2.R1=V(G1)として、G1の各ノードv∈V(G1)に関して、要因度P1(v;R1)を計算。
3.G1にノードを付け加えノード数を50にし、ランダムに辺を付け加えてG2を作成。
4.図3に示した処理手順で要約を行い、要約後のグラフG'2を作成。
5.評価1:本実施の形態を用いて要約を行った際に、要約前後で各ノードの要因度の違いが小さいということを確認することを目的とし、各u,v∈V(G'2)に対し、P2(v;{u})と、G'2において計算した要因度P'2(v;{u})との差P2(v;{u})-P'2(v;{u})を計算。
6.R2を、R1の元のうちのランダムに選んだ5つを、V(G2)\R1の元からランダムに選んだ5つによって交換したものをR2として設定。
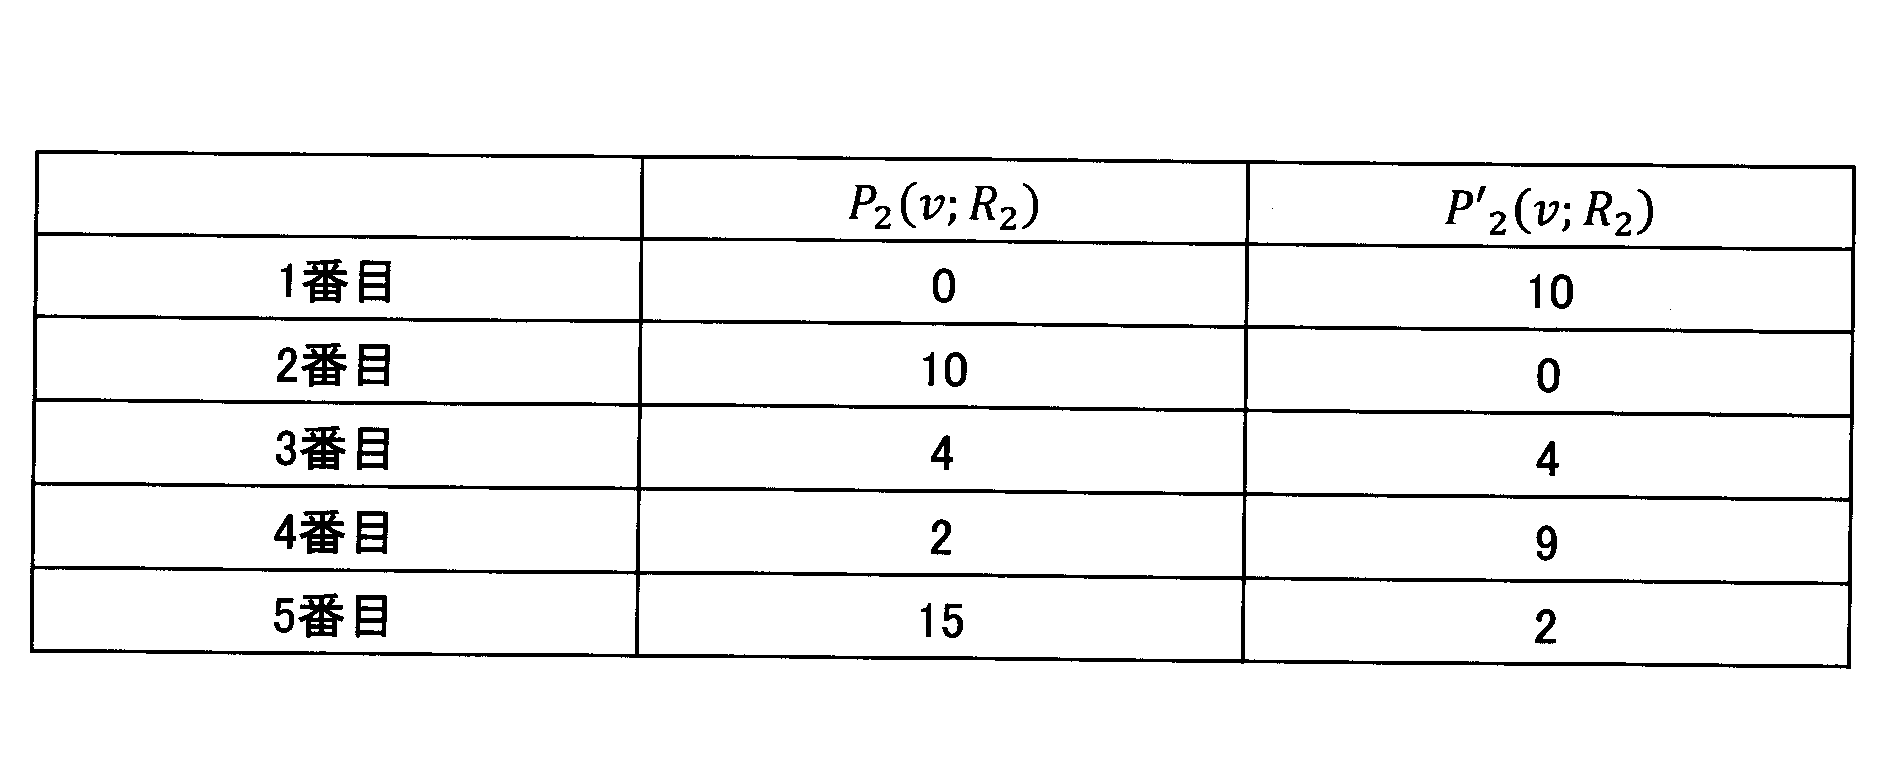
7.評価2:本実施の形態を用いて要約を行った際に、要約前後で主な要因として抽出される上位5イベントに差異が少ないということを確認することを目的とし、P2(v;R2)が大きくなる上位5つのv∈V(G2)と、P'2(v;R2)が大きくなる5つのv∈V(G'2)を求め、両者を比較する。
以下のようにして、[問題設定]で述べた状況を模擬し、評価を行った。
1.ノード数が25のランダムなグラフG1を作成。
2.R1=V(G1)として、G1の各ノードv∈V(G1)に関して、要因度P1(v;R1)を計算。
3.G1にノードを付け加えノード数を50にし、ランダムに辺を付け加えてG2を作成。
4.図3に示した処理手順で要約を行い、要約後のグラフG'2を作成。
5.評価1:本実施の形態を用いて要約を行った際に、要約前後で各ノードの要因度の違いが小さいということを確認することを目的とし、各u,v∈V(G'2)に対し、P2(v;{u})と、G'2において計算した要因度P'2(v;{u})との差P2(v;{u})-P'2(v;{u})を計算。
6.R2を、R1の元のうちのランダムに選んだ5つを、V(G2)\R1の元からランダムに選んだ5つによって交換したものをR2として設定。
7.評価2:本実施の形態を用いて要約を行った際に、要約前後で主な要因として抽出される上位5イベントに差異が少ないということを確認することを目的とし、P2(v;R2)が大きくなる上位5つのv∈V(G2)と、P'2(v;R2)が大きくなる5つのv∈V(G'2)を求め、両者を比較する。
[結果]
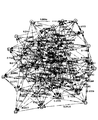
要約前のグラフG2の50のノード数に対し、要約後のグラフG'2のノード数は40となった。要約前のグラフG2を図6に示し、要約後のグラフG'2を図7に示す。
要約前のグラフG2の50のノード数に対し、要約後のグラフG'2のノード数は40となった。要約前のグラフG2を図6に示し、要約後のグラフG'2を図7に示す。
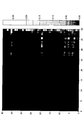
評価1:要約後のグラフG'2の任意のノードu,v∈V(G'2)に対してノードuのインデックスを縦軸、ノードvのインデックスを横軸にとった時の|P2(v;{u})-P'2(v;{u})|の値をヒートマップで表すと図8のようになった。ほとんどのu,vのペアでは、|P2(v;{u})-P'2(v;{u})|の値は0.1以下となった。これは、R2={v}とした際、グラフ要約の前後でイベントuの要因度の差がほぼ0.1以内で収まっていることを表している。
評価2:P2(v;R2)が大きくなる上位5つのv∈V(G2)のインデックスと、P'2(v;R2)が大きくなる5つのv∈V(G'2)のインデックスとは表1のようになった。
上述したように、本実施の形態によれば、過去の情報の伝播を因果グラフによる要因推定に適する形で行い、その結果を基に不要なノードを検出することでグラフを要約する。すなわち、過去の情報を用いて各ノードの重要度を決定することで、重要でない頂点を検出する。この重要度は真の要因度以上の値に収束することが示せるから、要因となる可能性が高いノードは要約後も残すことができる。その結果、システム運用における因果グラフによる要因推定の精度の低下を抑制可能なグラフ要約を実現することができる。
また、単純な構造において、ノード削除前後で要因度が変化しないように辺の重みを決定することで、要約の前後で要因推定の結果に変化が少なくなる。さらに、隣接行列の固有値を計算することで、要約後のグラフはサイクル構造を持たないことが達成できる。隣接行列の構造を考慮すると、この固有値計算は少ない計算量で達成できる。
すなわち、障害によって得られたイベントの因果関係を表す因果グラフを、できるだけ重要なイベントを残し、かつ、要因推定の結果に与える影響を出来るだけ小さくするように、かつ、グラフの構造を保って要約することで、ある程度の正確性を保ったまま要因推定を高速化できる。さらに、要約後のグラフで要因度が高かったノードの周辺のみ、削除した頂点を元に戻して再度要因推定を行えば、さらなる正確性を達成できる。これにより、障害発生時の対応を、正確性を保ったまま高速化できる。
なお、本実施の形態において、障害要因推定装置10は、因果グラフ要約装置の一例である。検出部11は、計算部及び選択部の一例である。
以上、本発明の実施の形態について詳述したが、本発明は斯かる特定の実施形態に限定されるものではなく、請求の範囲に記載された本発明の要旨の範囲内において、種々の変形・変更が可能である。
10 障害要因推定装置
11 検出部
12 決定部
13 削除部
100 ドライブ装置
101 記録媒体
102 補助記憶装置
103 メモリ装置
104 CPU
105 インタフェース装置
B バス
11 検出部
12 決定部
13 削除部
100 ドライブ装置
101 記録媒体
102 補助記憶装置
103 メモリ装置
104 CPU
105 インタフェース装置
B バス
Claims (7)
- 各ノードがグラフの状態に対する要因の度合いを示す要因度を有し、各辺がノード間の因果関係の強さを示す重みを有するグラフが変化すると、変化後の前記グラフの各ノードについて、変化前の前記グラフのノードの要因度に基づく重要度を計算する計算部と、
前記重要度が閾値以下である第1のノードを削除の候補として選択する選択部と、
前記第1のノードを削除する削除部と、
を有することを特徴とするグラフ要約装置。 - 前記第1のノードごとに、当該第1のノードと、当該第1のノードからの辺の重みが最大である第2のノードとを1つのノードとして、当該第1のノードが削除された場合に前記グラフに付ける辺を決定し、当該第1のノードの削除前後における要因度が変化しないように当該辺の重みを決定する決定部、
を有することを特徴とする請求項1記載のグラフ要約装置。 - 前記削除部は、前記第1のノードを削除した場合に前記グラフにサイクル構造が発生しない場合に当該第1のノードを削除する、
ことを特徴とする請求項1又は2記載のグラフ要約装置。 - 各ノードがグラフの状態に対する要因の度合いを示す要因度を有し、各辺がノード間の因果関係の強さを示す重みを有するグラフが変化すると、変化後の前記グラフの各ノードについて、変化前の前記グラフのノードの要因度に基づく重要度を計算する計算手順と、
前記重要度が閾値以下である第1のノードを削除の候補として選択する選択手順と、
前記第1のノードを削除する削除手順と、
をコンピュータが実行することを特徴とするグラフ要約方法。 - 前記第1のノードごとに、当該第1のノードと、当該第1のノードからの辺の重みが最大である第2のノードとを1つのノードとして、当該第1のノードが削除された場合に前記グラフに付ける辺を決定し、当該第1のノードの削除前後における要因度が変化しないように当該辺の重みを決定する決定手順、
を前記コンピュータが実行することを特徴とする請求項4記載のグラフ要約方法。 - 前記削除手順は、前記第1のノードを削除した場合に前記グラフにサイクル構造が発生しない場合に当該第1のノードを削除する、
ことを特徴とする請求項4又は5記載のグラフ要約方法。 - 請求項4乃至6いずれか一項記載のグラフ要約方法をコンピュータに実行させることを特徴とするプログラム。
Priority Applications (1)
| Application Number | Priority Date | Filing Date | Title |
|---|---|---|---|
| US17/421,128 US20220108189A1 (en) | 2019-01-23 | 2020-01-10 | Graph summarization apparatus, graph summarization method and program |
Applications Claiming Priority (2)
| Application Number | Priority Date | Filing Date | Title |
|---|---|---|---|
| JP2019-009760 | 2019-01-23 | ||
| JP2019009760A JP7120043B2 (ja) | 2019-01-23 | 2019-01-23 | グラフ要約装置、グラフ要約方法及びプログラム |
Publications (1)
| Publication Number | Publication Date |
|---|---|
| WO2020153150A1 true WO2020153150A1 (ja) | 2020-07-30 |
Family
ID=71736911
Family Applications (1)
| Application Number | Title | Priority Date | Filing Date |
|---|---|---|---|
| PCT/JP2020/000596 Ceased WO2020153150A1 (ja) | 2019-01-23 | 2020-01-10 | グラフ要約装置、グラフ要約方法及びプログラム |
Country Status (3)
| Country | Link |
|---|---|
| US (1) | US20220108189A1 (ja) |
| JP (1) | JP7120043B2 (ja) |
| WO (1) | WO2020153150A1 (ja) |
Cited By (1)
| Publication number | Priority date | Publication date | Assignee | Title |
|---|---|---|---|---|
| EP4647973A1 (en) | 2024-05-09 | 2025-11-12 | Fujitsu Limited | Recording medium, information processing method, and information processing device |
Families Citing this family (3)
| Publication number | Priority date | Publication date | Assignee | Title |
|---|---|---|---|---|
| JP7576468B2 (ja) * | 2021-01-12 | 2024-10-31 | 株式会社日立製作所 | 情報処理装置および情報処理方法 |
| KR102471829B1 (ko) * | 2021-04-20 | 2022-11-30 | 주식회사 유디엠텍 | 실시간 이상 탐지를 위한 gnn 기반의 마스터 상태 생성 방법 |
| US20260119576A1 (en) | 2024-10-25 | 2026-04-30 | Fujitsu Limited | Recording medium, information processing method, and information processing device |
Citations (3)
| Publication number | Priority date | Publication date | Assignee | Title |
|---|---|---|---|---|
| JP2008052494A (ja) * | 2006-08-24 | 2008-03-06 | Sony Corp | ネットワーク分析支援装置および方法、プログラム並びに記録媒体 |
| US20180025040A1 (en) * | 2016-07-22 | 2018-01-25 | Ebay Inc. | Multiple workspace database engine |
| JP2018124829A (ja) * | 2017-02-01 | 2018-08-09 | 日本電信電話株式会社 | 状態判定装置、状態判定方法及びプログラム |
Family Cites Families (15)
| Publication number | Priority date | Publication date | Assignee | Title |
|---|---|---|---|---|
| US5999931A (en) * | 1997-10-17 | 1999-12-07 | Lucent Technologies Inc. | Concurrency control protocols for management of replicated data items in a distributed database system |
| US7509344B1 (en) * | 2003-08-18 | 2009-03-24 | Google Inc. | Method for detecting link spam in hyperlinked databases |
| WO2013050072A1 (en) * | 2011-10-05 | 2013-04-11 | Telefonaktiebolaget Lm Ericsson (Publ) | Method and apparatuses for enabling recommendations |
| JP5834883B2 (ja) * | 2011-12-20 | 2015-12-24 | 日本電気株式会社 | 因果関係要約方法、因果関係要約装置及び因果関係要約プログラム |
| US8682932B2 (en) * | 2012-02-16 | 2014-03-25 | Oracle International Corporation | Mechanisms for searching enterprise data graphs |
| US9645802B2 (en) * | 2013-08-07 | 2017-05-09 | Nvidia Corporation | Technique for grouping instructions into independent strands |
| US9210185B1 (en) * | 2014-12-05 | 2015-12-08 | Lookingglass Cyber Solutions, Inc. | Cyber threat monitor and control apparatuses, methods and systems |
| US10083073B2 (en) * | 2015-09-14 | 2018-09-25 | Dynatrace Llc | Method and system for real-time causality and root cause determination of transaction and infrastructure related events provided by multiple, heterogeneous agents |
| US10235231B2 (en) * | 2015-11-18 | 2019-03-19 | Nec Corporation | Anomaly fusion on temporal casualty graphs |
| US9558265B1 (en) * | 2016-05-12 | 2017-01-31 | Quid, Inc. | Facilitating targeted analysis via graph generation based on an influencing parameter |
| CN106155791B (zh) * | 2016-06-30 | 2019-05-07 | 电子科技大学 | 一种分布式环境下的工作流任务调度方法 |
| US10536472B2 (en) * | 2016-08-15 | 2020-01-14 | International Business Machines Corporation | Cognitive analysis of security data with signal flow-based graph exploration |
| US10147020B1 (en) * | 2017-07-28 | 2018-12-04 | Cognism Limited | System and method for computational disambiguation and prediction of dynamic hierarchical data structures |
| US10725982B2 (en) * | 2017-11-20 | 2020-07-28 | International Business Machines Corporation | Knowledge graph node expiration |
| US10742670B1 (en) * | 2018-04-18 | 2020-08-11 | NortonLifeLock Inc. | Detecting and preventing execution of a malicious computer application using utility driven graph summarization |
-
2019
- 2019-01-23 JP JP2019009760A patent/JP7120043B2/ja active Active
-
2020
- 2020-01-10 WO PCT/JP2020/000596 patent/WO2020153150A1/ja not_active Ceased
- 2020-01-10 US US17/421,128 patent/US20220108189A1/en not_active Abandoned
Patent Citations (3)
| Publication number | Priority date | Publication date | Assignee | Title |
|---|---|---|---|---|
| JP2008052494A (ja) * | 2006-08-24 | 2008-03-06 | Sony Corp | ネットワーク分析支援装置および方法、プログラム並びに記録媒体 |
| US20180025040A1 (en) * | 2016-07-22 | 2018-01-25 | Ebay Inc. | Multiple workspace database engine |
| JP2018124829A (ja) * | 2017-02-01 | 2018-08-09 | 日本電信電話株式会社 | 状態判定装置、状態判定方法及びプログラム |
Cited By (1)
| Publication number | Priority date | Publication date | Assignee | Title |
|---|---|---|---|---|
| EP4647973A1 (en) | 2024-05-09 | 2025-11-12 | Fujitsu Limited | Recording medium, information processing method, and information processing device |
Also Published As
| Publication number | Publication date |
|---|---|
| US20220108189A1 (en) | 2022-04-07 |
| JP2020119261A (ja) | 2020-08-06 |
| JP7120043B2 (ja) | 2022-08-17 |
Similar Documents
| Publication | Publication Date | Title |
|---|---|---|
| CN113032238B (zh) | 基于应用知识图谱的实时根因分析方法 | |
| WO2020153150A1 (ja) | グラフ要約装置、グラフ要約方法及びプログラム | |
| CN112804208B (zh) | 一种基于攻击者特性指标的网络攻击路径预测方法 | |
| US9230102B2 (en) | Apparatus and method for detecting traffic flooding attack and conducting in-depth analysis using data mining | |
| EP3997633A1 (en) | Automated generation of machine learning models for network evaluation | |
| CN111355697B (zh) | 僵尸网络域名家族的检测方法、装置、设备及存储介质 | |
| JP2022533552A (ja) | システムレベルセキュリティのための階層的挙動行動のモデル化および検出システムおよび方法 | |
| US11797360B2 (en) | Method for generating topology diagram, anomaly detection method, device, apparatus, and storage medium | |
| US20240152622A1 (en) | System and method for scoring security alerts incorporating anomaly and threat scores | |
| CN120179509B (zh) | 基于因果推断与知识图谱的微服务故障定位方法、设备 | |
| JP6988304B2 (ja) | 運用管理システム、監視サーバ、方法およびプログラム | |
| CN118555110B (zh) | 一种攻击检测和溯源方法、装置、电子设备及存储介质 | |
| US20250047693A1 (en) | Systems and methods for machine learning based network alert sequence anomaly detection | |
| CN117675512A (zh) | 多节点系统异常根因定位方法、装置、设备及存储介质 | |
| CN114638234B (zh) | 应用于线上业务办理的大数据挖掘方法及系统 | |
| CN111159702A (zh) | 一种进程名单生成方法和装置 | |
| KR20220077184A (ko) | 베이지안 확률 및 폐쇄 패턴 마이닝 방식을 이용한 로그 이상 탐지 시스템 및 방법과, 이를 위한 컴퓨터 프로그램 | |
| Cai et al. | TraceModel: An automatic anomaly detection and root cause localization framework for microservice systems | |
| CN113961425B (zh) | 一种告警消息的处理方法、装置及设备 | |
| US20100287016A1 (en) | Method of monitoring a combined workflow with rejection determination function, device and recording medium therefor | |
| CN120145161B (zh) | 一种基于关键图结构特征聚合的民航日志数据处理方法 | |
| CN110889493A (zh) | 针对关系网络添加扰动的方法及装置 | |
| CN107920067B (zh) | 一种主动对象存储系统上的入侵检测方法 | |
| JP2012222371A (ja) | ネットワーク管理装置及びネットワーク管理方法及びプログラム | |
| CN111695583A (zh) | 一种基于因果网络的特征选择方法 |
Legal Events
| Date | Code | Title | Description |
|---|---|---|---|
| 121 | Ep: the epo has been informed by wipo that ep was designated in this application |
Ref document number: 20744420 Country of ref document: EP Kind code of ref document: A1 |
|
| NENP | Non-entry into the national phase |
Ref country code: DE |
|
| 122 | Ep: pct application non-entry in european phase |
Ref document number: 20744420 Country of ref document: EP Kind code of ref document: A1 |