WO2020146652A1 - Multiplexed assay and methods of use thereof - Google Patents
Multiplexed assay and methods of use thereof Download PDFInfo
- Publication number
- WO2020146652A1 WO2020146652A1 PCT/US2020/012959 US2020012959W WO2020146652A1 WO 2020146652 A1 WO2020146652 A1 WO 2020146652A1 US 2020012959 W US2020012959 W US 2020012959W WO 2020146652 A1 WO2020146652 A1 WO 2020146652A1
- Authority
- WO
- WIPO (PCT)
- Prior art keywords
- amyloidosis
- apoe
- subject
- amyloid
- value
- Prior art date
Links
Classifications
-
- G—PHYSICS
- G01—MEASURING; TESTING
- G01N—INVESTIGATING OR ANALYSING MATERIALS BY DETERMINING THEIR CHEMICAL OR PHYSICAL PROPERTIES
- G01N33/00—Investigating or analysing materials by specific methods not covered by groups G01N1/00 - G01N31/00
- G01N33/48—Biological material, e.g. blood, urine; Haemocytometers
- G01N33/50—Chemical analysis of biological material, e.g. blood, urine; Testing involving biospecific ligand binding methods; Immunological testing
- G01N33/68—Chemical analysis of biological material, e.g. blood, urine; Testing involving biospecific ligand binding methods; Immunological testing involving proteins, peptides or amino acids
- G01N33/6893—Chemical analysis of biological material, e.g. blood, urine; Testing involving biospecific ligand binding methods; Immunological testing involving proteins, peptides or amino acids related to diseases not provided for elsewhere
- G01N33/6896—Neurological disorders, e.g. Alzheimer's disease
-
- G—PHYSICS
- G01—MEASURING; TESTING
- G01N—INVESTIGATING OR ANALYSING MATERIALS BY DETERMINING THEIR CHEMICAL OR PHYSICAL PROPERTIES
- G01N33/00—Investigating or analysing materials by specific methods not covered by groups G01N1/00 - G01N31/00
- G01N33/48—Biological material, e.g. blood, urine; Haemocytometers
- G01N33/50—Chemical analysis of biological material, e.g. blood, urine; Testing involving biospecific ligand binding methods; Immunological testing
- G01N33/92—Chemical analysis of biological material, e.g. blood, urine; Testing involving biospecific ligand binding methods; Immunological testing involving lipids, e.g. cholesterol, lipoproteins, or their receptors
-
- G—PHYSICS
- G16—INFORMATION AND COMMUNICATION TECHNOLOGY [ICT] SPECIALLY ADAPTED FOR SPECIFIC APPLICATION FIELDS
- G16H—HEALTHCARE INFORMATICS, i.e. INFORMATION AND COMMUNICATION TECHNOLOGY [ICT] SPECIALLY ADAPTED FOR THE HANDLING OR PROCESSING OF MEDICAL OR HEALTHCARE DATA
- G16H10/00—ICT specially adapted for the handling or processing of patient-related medical or healthcare data
- G16H10/20—ICT specially adapted for the handling or processing of patient-related medical or healthcare data for electronic clinical trials or questionnaires
-
- G—PHYSICS
- G16—INFORMATION AND COMMUNICATION TECHNOLOGY [ICT] SPECIALLY ADAPTED FOR SPECIFIC APPLICATION FIELDS
- G16H—HEALTHCARE INFORMATICS, i.e. INFORMATION AND COMMUNICATION TECHNOLOGY [ICT] SPECIALLY ADAPTED FOR THE HANDLING OR PROCESSING OF MEDICAL OR HEALTHCARE DATA
- G16H10/00—ICT specially adapted for the handling or processing of patient-related medical or healthcare data
- G16H10/40—ICT specially adapted for the handling or processing of patient-related medical or healthcare data for data related to laboratory analysis, e.g. patient specimen analysis
-
- G—PHYSICS
- G16—INFORMATION AND COMMUNICATION TECHNOLOGY [ICT] SPECIALLY ADAPTED FOR SPECIFIC APPLICATION FIELDS
- G16H—HEALTHCARE INFORMATICS, i.e. INFORMATION AND COMMUNICATION TECHNOLOGY [ICT] SPECIALLY ADAPTED FOR THE HANDLING OR PROCESSING OF MEDICAL OR HEALTHCARE DATA
- G16H50/00—ICT specially adapted for medical diagnosis, medical simulation or medical data mining; ICT specially adapted for detecting, monitoring or modelling epidemics or pandemics
- G16H50/30—ICT specially adapted for medical diagnosis, medical simulation or medical data mining; ICT specially adapted for detecting, monitoring or modelling epidemics or pandemics for calculating health indices; for individual health risk assessment
-
- G—PHYSICS
- G01—MEASURING; TESTING
- G01N—INVESTIGATING OR ANALYSING MATERIALS BY DETERMINING THEIR CHEMICAL OR PHYSICAL PROPERTIES
- G01N2333/00—Assays involving biological materials from specific organisms or of a specific nature
- G01N2333/435—Assays involving biological materials from specific organisms or of a specific nature from animals; from humans
- G01N2333/46—Assays involving biological materials from specific organisms or of a specific nature from animals; from humans from vertebrates
- G01N2333/47—Assays involving proteins of known structure or function as defined in the subgroups
- G01N2333/4701—Details
- G01N2333/4709—Amyloid plaque core protein
-
- G—PHYSICS
- G01—MEASURING; TESTING
- G01N—INVESTIGATING OR ANALYSING MATERIALS BY DETERMINING THEIR CHEMICAL OR PHYSICAL PROPERTIES
- G01N2800/00—Detection or diagnosis of diseases
- G01N2800/28—Neurological disorders
- G01N2800/2814—Dementia; Cognitive disorders
-
- G—PHYSICS
- G01—MEASURING; TESTING
- G01N—INVESTIGATING OR ANALYSING MATERIALS BY DETERMINING THEIR CHEMICAL OR PHYSICAL PROPERTIES
- G01N2800/00—Detection or diagnosis of diseases
- G01N2800/28—Neurological disorders
- G01N2800/2814—Dementia; Cognitive disorders
- G01N2800/2821—Alzheimer
-
- G—PHYSICS
- G01—MEASURING; TESTING
- G01N—INVESTIGATING OR ANALYSING MATERIALS BY DETERMINING THEIR CHEMICAL OR PHYSICAL PROPERTIES
- G01N2800/00—Detection or diagnosis of diseases
- G01N2800/56—Staging of a disease; Further complications associated with the disease
-
- Y—GENERAL TAGGING OF NEW TECHNOLOGICAL DEVELOPMENTS; GENERAL TAGGING OF CROSS-SECTIONAL TECHNOLOGIES SPANNING OVER SEVERAL SECTIONS OF THE IPC; TECHNICAL SUBJECTS COVERED BY FORMER USPC CROSS-REFERENCE ART COLLECTIONS [XRACs] AND DIGESTS
- Y02—TECHNOLOGIES OR APPLICATIONS FOR MITIGATION OR ADAPTATION AGAINST CLIMATE CHANGE
- Y02A—TECHNOLOGIES FOR ADAPTATION TO CLIMATE CHANGE
- Y02A90/00—Technologies having an indirect contribution to adaptation to climate change
- Y02A90/10—Information and communication technologies [ICT] supporting adaptation to climate change, e.g. for weather forecasting or climate simulation
Definitions
- the present disclosure relates to the use of a single assay for the detection of amyloidosis disorders using peripheral blood.
- the disclosure provides the use of a combination of markers of amyloid plaques (amyloid beta 42, amyloid beta 40), genetic risk (ApoE phenotype), and neurodegeneration (e.g.
- neurofilament light chain tau and visinin-like protein one
- amyloid PET and/or CSF biomarkers are used to evaluate for evidence of brain amyloidosis.
- amyloid PET scans and/or CSF biomarkers are used to confirm brain amyloidosis in participants suspected to have Alzheimer disease dementia or to screen for individuals with preclinical Alzheimer disease (asymptomatic brain amyloidosis) for prevention trials.
- both amyloid PET and CSF biomarkers have significant drawbacks including cost, availability and potential risks.
- the present invention provides a method for identifying a subject as a candidate for further diagnostic testing and/or a therapeutic intervention, the method comprising: (a) detecting an ApoE peptide and measuring the concentration of Ab42 and Ab40 and optionally a marker of neurodegeneration in a blood sample obtained from the subject, and then determining ApoE e4 status, calculating the Ab42/Ab40 value and optionally determining the concentration of the marker of neurodegeneration; and (b) identifying the subject as a candidate further diagnostic testing and/or a therapeutic intervention when the Ab42/Ab40 value is less than 0.126, and the Ab42/Ab40 value is obtained by a system that provides a probability of detecting Ab amyloidosis equal to or greater than about 90%.
- the present invention provides a method for screening subjects for a clinical trial for Ab amyloidosis, the method comprising: (a) detecting an ApoE peptide and measuring the concentration of Ab42 and Ab40 and optionally a marker of neurodegeneration in a blood sample obtained from the subject, and then determining ApoE e4 status, calculating the Ab42/Ab40 value and determining the concentration of the marker of neurodegeneration; and (b) identifying the subject as a candidate for the clinical trial when the Ab42/Ab40 value is less than 0.126, and the Ab42/Ab40 value is obtained by a system that provides a probability of detecting Ab amyloidosis equal to or greater than about 90%.
- the present invention provides a method to grade a subject for the stage or severity of disease, e.g. Ab amyloidosis, the method comprising: (a) detecting an ApoE peptide and measuring the concentration of Ab42 and Ab40 and optionally a marker of neurodegeneration in a blood sample obtained from the subject, and then determining ApoE e4 status, calculating the Ab42/Ab40 value and optionally determining the concentration of the marker of neurodegeneration; and (b) identifying the subject as having or at risk of developing Ab amyloidosis when the Ab42/Ab40 value is less than 0.126, and the Ab42/Ab40 value is obtained by a system that provides a probability of detecting Ab amyloidosis equal to or greater than about 90%.
- Ab amyloidosis e.g. Ab amyloidosis
- FIG. 1 depicts the correspondence of baseline plasma and CSF Ab42/Ab40 with baseline amyloid PET.
- Baseline plasma (A) and CSF (B) Ab42/Ab40 were decreased in baseline amyloid PET-positive individuals.
- Receiver operating characteristic analyses demonstrate that baseline plasma (C) and CSF (D) Ab42/Ab40 were highly predictive of baseline amyloid PET status.
- the area under the curve (AUC) is noted with 95% confidence intervals.
- PPA positive percent agreement
- NPA negative percent agreement
- Baseline plasma (E) and CSF (F) Ab42/Ab40 were inversely correlated with baseline amyloid PET binding as measured on the centiloid scale.
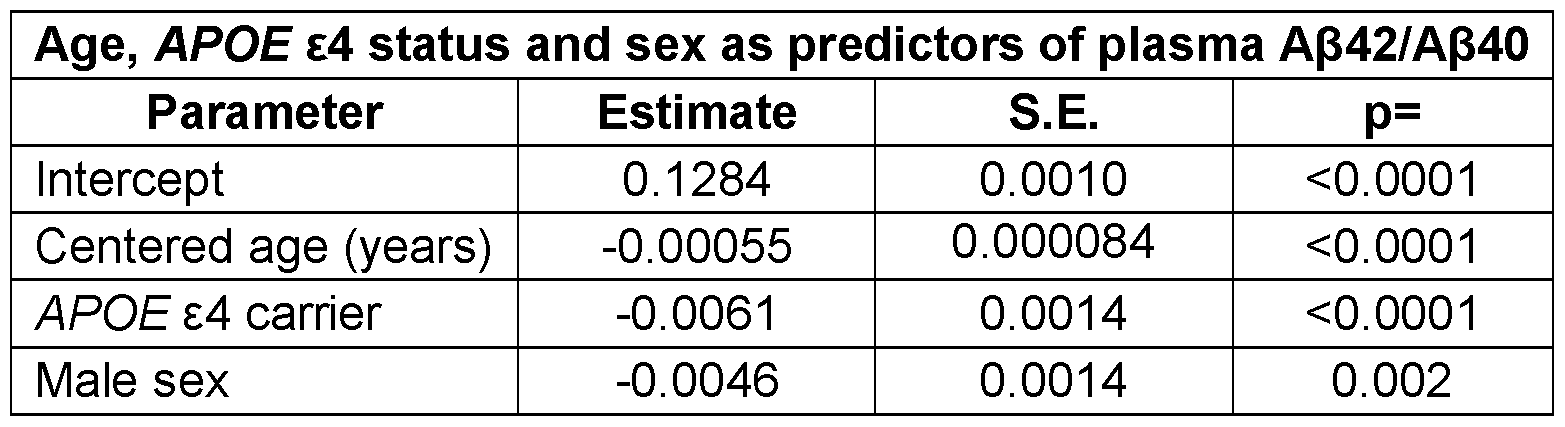
- FIG. 2 depicts the relationship of age, APOE e4 status, and sex with baseline plasma and CSF Ab42/Ab40.
- Baseline plasma Ab42/Ab40 was lower with older age and was lower in APOE e4 carriers and men (A).
- Baseline CSF Ab42/Ab40 was lower with older age and was lower in APOE e4 carriers.
- Horizontal dashed red lines depict cut-offs for plasma or CSF Ab42/Ab40. Sloped lines represent the estimated Ab42/Ab40 as a function of age for the cross-sectional groups.
- Receiver operating characteristic analysis demonstrated a trend towards a higher area under the curve (AUC) for prediction of amyloid PET status when age and APOE e4 status were included in the model (C). The AUC is noted with 95% confidence intervals.
- the combination of plasma Ab42/Ab40, age and APOE e4 status were used to predict the likelihood of amyloid PET positivity (D).
- FIG. 3 depicts the baseline plasma and CSF Ab42/Ab40 predict amyloid PET status conversion. Individuals who were amyloid PET-negative at baseline and converted to amyloid PET-positive over the follow-up period had lower baseline plasma Ab42/Ab40 than individuals who remained amyloid PET-negative (A). There was also a trend towards lower baseline CSF Ab42/Ab40 in amyloid PET converters versus non-converters (B). Dashed red lines depict cut-offs for plasma or CSF Ab42/Ab40. Individuals who were amyloid PET-negative at baseline with a positive plasma Ab42/Ab40 had a 12-fold greater risk of conversion to amyloid PET- positive over the follow-up period compared to individuals with a negative plasma Ab42/Ab40 (C).
- FIG. 4 depicts the longitudinal change in plasma and CSF
- Ab42/Ab40 compared to individuals who were amyloid PET-positive at both first and last time points (D). Dashed red lines depict a slope of zero (no change). Dotted lines are the average rate of change by linear regression for the entire longitudinal cohort..
- FIG. 5 depicts the correlation of plasma and CSF Ab42/Ab40 with amyloid PET measures by PET tracer.
- Plasma (A-C) and CSF (D-F) Ab42/Ab40 were inversely correlated with measures of amyloid PET binding, regardless of the PET tracer used.
- the Spearman rho (r) is noted..
- FIG. 6 depicts extracted ion chromatograms from LC/MS of ApoE proteoforms (Baker-Nigh et. al. JBC, 2016) ApoE isoforms are each measured together on a single LC run across five minutes, capturing E2, 3, and 4 specific peptides, accurately identifying the ApoE geno/phenotype of an individual and quantifying the amount of ApoE.
- ApoE isoform type can be determined in as little as 10 mcl.
- Peptides indicated in the figure are SEQ ID Nos: 1 -6.
- FIG. 7 depicts ROC curve for Ab42/40, APOE e4 and age vs. Ab42/40 in blood plasma. Comparison demonstrates the improved concordance of blood plasma with amyloid PET status by including age and ApoE.
- FIG. 8 depicts evidence for plasma NfL as a useful marker for neurodegeneration.
- FIG. 11 A, B, and C depict graphs (Fig. 1 1A and 1 1 B) and a table
- FIG. 12A, 12B, 12C, and 12D depict graphs illustrating that ApoE genotype can be determined from 20% of an Abeta immunoprecipitation with 100% accuracy.
- Fig. 12A illustrates the detection of the E4 specific peptide (LGADMEDVR). Specific patient identifying numbers have been removed from the chart, but all samples were accurately determined with the assay.
- Fig. 12B illustrates the detection of the E2 and E3 specific peptide (LGADMEDVCGR). Specific patient identifying numbers have been removed from the chart, but all samples were accurately determined with the assay.
- Fig. 12C illustrates the detection of the E2 specific peptide (CLAVYQAGR; SEQ ID NO:7).
- FIG. 12D illustrates the data normalized to total signal for the E2 specific peptide (CLAVYQAGR; SEQ ID NO:7). Specific patient identifying numbers have been removed from the chart, but all samples were accurately determined with the assay.
- the present invention relates to blood-based methods for detecting Ab amyloidosis, and a system therefor. While Ab42/ Ab40 ratios in the CSF are decreased by about 50% in the presence of Ab amyloidosis, Ab42/ Ab40 ratios in blood are decreased on average by 14% in amyloid positive subjects as compared to amyloid negative subjects. Importantly, the methods and systems described herein measure plasma concentrations of individual Ab species with a high degree of precision. These precise measurements allow the small differences in plasma Ab42 concentration between amyloid positive and amyloid negative subjects to be quantified accurately and therefore have clinical utility. Sensitivity and specificity of the amyloid-beta blood test substantially improve when ApoE status is determined.
- a single plasma based blood test analyzing Ab42/40 along with ApoE status increased the AUC from 88% to 95% relative to Ab42/ Ab40 ratios alone.
- the inclusion of one or more markers of neurodegeneration has the potential to more effectively aid in staging AD (e.g.
- the present invention also relates to methods to inform and direct clinical decisions including, but not limited to, conducting further diagnostic tests, enrolling a subject in a clinical trial, and initiating or continuing medical treatment.
- range such as from 1 to 6 should be considered to have specifically disclosed sub-ranges such as from 1 to 3, from 1 to 4, from 1 to 5, from 2 to 4, from 2 to 6, from 3 to 6 etc., as well as individual numbers within that range, for example, 1 , 2, 3, 4, 5, and 6, and decimals and fractions, for example, 1 .2, 3.8, 1 1 ⁇ 2, and 43 ⁇ 4 This applies regardless of the breadth of the range.
- Ab refers to peptides derived from a region in the carboxy terminus of a larger protein called amyloid precursor protein (APP).
- APP amyloid precursor protein
- the gene encoding APP is located on chromosome 21.
- Ab peptides are typically 37-43 amino acid sequences long, though they can have truncations and modifications changing their overall size. They can be found in soluble and insoluble compartments, in monomeric, oligomeric and aggregated forms, intracellularly or extracellularly, and may be complexed with other proteins or molecules.
- the adverse or toxic effects of Ab may be attributable to any or all of the above noted forms, as well as to others not described specifically.
- Ab typically refers to a plurality of Ab species without discrimination among individual Ab species. Specific Ab species are identified by the size of the peptide, e.g., Ab42, Ab40, Ab38 etc.
- the term“Ab42/ Ab40 value” means the ratio of the concentration of Ab42 in a blood sample obtained from a subject compared to the concentration of Ab40 in the same blood sample.
- the term“Ab42/ Ab cc value” means the ratio of the concentration of Ab42 in a blood sample obtained from a subject compared to the concentration of another Ab species in the same blood sample.
- “Ab amyloidosis” is clinically defined as evidence of Ab deposition in the brain. A subject that is clinically determined to have Ab amyloidosis is referred to herein as“amyloid positive,” while a subject that is clinically determined to not have Ab amyloidosis is referred to herein as“amyloid negative.” Ab amyloidosis likely exists before it is detectable by current techniques. Nonetheless, there are accepted indicators of Ab amyloidosis in the art.
- Ab amyloidosis is typically identified by amyloid imaging (e.g., PiB PET, fluorbetapir, or other imaging methods known in the art) or by decreased cerebrospinal fluid (CSF) Ab42 or a decreased CSF Ab42/40 ratio.
- amyloid imaging e.g., PiB PET, fluorbetapir, or other imaging methods known in the art
- CSF cerebrospinal fluid
- [ 11 C]PIB-PET imaging with mean cortical binding potential (MCBP) score > 0.18 is an indicator of Ab amyloidosis, as is cerebral spinal fluid (CSF) Ab42 concentration of about 1 ng/ml by immunoprecipitation and mass spectrometry (IP/MS)). Values such as these, or others known in the art, may be used alone or in combination to clinically confirm Ab amyloidosis.
- amyloidosis may or may not be symptomatic, and symptomatic subjects may or may not satisfy the clinical criteria for a disease associated with Ab amyloidosis.
- symptoms associated with Ab amyloidosis may include impaired cognitive function, altered behavior, abnormal language function, emotional dysregulation, seizures, dementia, and impaired nervous system structure or function.
- Diseases associated with Ab amyloidosis include, but are not limited to, Alzheimer's Disease (AD), cerebral amyloid angiopathy, Lewy body dementia, and inclusion body myositis.
- Subjects with Ab amyloidosis are at an increased risk of developing a disease associated with Ab amyloidosis.
- A“clinical sign of Ab amyloidosis” refers to a measure of Ab deposition known in the art.
- Clinical signs of Ab amyloidosis may include, but are not limited to, Ab deposition identified by amyloid imaging (e.g. PiB PET, fluorbetapir, or other imaging methods known in the art) or by decreased cerebrospinal fluid (CSF) Ab42 or Ab42/40 ratio.
- amyloid imaging e.g. PiB PET, fluorbetapir, or other imaging methods known in the art
- CSF cerebrospinal fluid
- Clinical signs of Ab amyloidosis may also include measurements of the metabolism of Ab, in particular measurements of Ab42 metabolism alone or in comparison to measurements of the metabolism of other Ab variants (e.g. Ab37, Ab38, Ab39, Ab40, and/or total Ab), as described in U.S. Patent Serial Nos. 14/366,831 , 14/523, 148 and 14/747,453, each hereby incorporated by reference in its entirety.
- A“candidate for amyloid imaging” refers to a subject that has been identified by a clinician as in individual for whom amyloid imaging may be clinically warranted.
- a candidate for amyloid imaging may be a subject with one or more clinical signs of Ab amyloidosis, one or more Ab plaque associated symptoms, on one or more CAA associated symptoms, or combinations thereof.
- a clinician may recommend amyloid imaging for such a subject to direct his or her clinical care.
- a candidate for amyloid imaging may be a potential participant in a clinical trial for a disease associated with Ab amyloidosis (either a control subject or a test subject).
- An“Ab plaque associated symptom” or a“CAA associated symptom” refers to any symptom caused by or associated with the formation of amyloid plaques or CAA, respectively, being composed of regularly ordered fibrillar aggregates called amyloid fibrils.
- Exemplary Ab plaque associated symptoms may include, but are not limited to, neuronal degeneration, impaired cognitive function, impaired memory, altered behavior, emotional dysregulation, seizures, impaired nervous system structure or function, and an increased risk of development or worsening of Alzheimer's disease or CAA.
- Neuronal degeneration may include a change in structure of a neuron (including molecular changes such as intracellular accumulation of toxic proteins, protein aggregates, etc.
- Impaired cognitive function may include but is not limited to difficulties with memory, attention, concentration, language, abstract thought, creativity, executive function, planning, and organization.
- Altered behavior may include, but is not limited to, physical or verbal aggression, impulsivity, decreased inhibition, apathy, decreased initiation, changes in personality, abuse of alcohol, tobacco or drugs, and other addiction-related behaviors.
- Emotional dysregulation may include, but is not limited to, depression, anxiety, mania, irritability, and emotional incontinence.
- Seizures may include but are not limited to generalized tonic-clonic seizures, complex partial seizures, and non-epileptic, psychogenic seizures.
- Impaired nervous system structure or function may include, but is not limited to, hydrocephalus, Parkinsonism, sleep disorders, psychosis, impairment of balance and coordination. This may include motor impairments such as monoparesis, hemiparesis, tetraparesis, ataxia, ballismus and tremor. This also may include sensory loss or dysfunction including olfactory, tactile, gustatory, visual and auditory sensation.
- this may include autonomic nervous system impairments such as bowel and bladder dysfunction, sexual dysfunction, blood pressure and temperature dysregulation.
- autonomic nervous system impairments such as bowel and bladder dysfunction, sexual dysfunction, blood pressure and temperature dysregulation.
- this may include hormonal impairments attributable to dysfunction of the hypothalamus and pituitary gland such as deficiencies and dysregulation of growth hormone, thyroid stimulating hormone, lutenizing hormone, follicle stimulating hormone, gonadotropin releasing hormone, prolactin, and numerous other hormones and modulators.
- the term“probability for detecting Ab amyloidosis” refers to the extent to which detection is likely to occur, and is an indicator of the accuracy of a diagnostic test.
- ApoE (NP_000032.1 , UniProtKB Identifier P02649) is an apolipoprotein expressed from the APOE gene mapped to chromosome 19 (for example, the nucleotide sequence identified as GenBank Accession Number NM_000041 , or NCBI Reference Sequence: NC_000019.10).
- ApoE has three major polymorphic forms: ApoE2 (Cys1 12, Cys158), ApoE3 (Cys1 12, Arg158), and ApoE4 (Arg1 12, Arg158).
- the ApoE2, ApoE3, and ApoE4 isoforms are encoded by the e2, e3 and e4 alleles of the APOE gene.
- “ApoE” refers to “human ApoE,” and includes functional fragments.
- “Recombinant ApoE” refers to ApoE encoded by a nucleic acid that has been introduced into a system (e.g. a prokaryotic cell, a eukaryotic cell, or a cell-free expression system) that supports expression of the nucleic acid and its translation into a protein. Methods for producing recombinant proteins are well-known in the art, and the production of recombinant ApoE disclosed herein is not limited to a particular system.
- the term“ApoE e4 status” refers to the presence of the epsilon 4 allele on the apolipoprotein E gene.
- ApoE e4 status may be determined at the nucleic acid level (e.g. sequencing the apolipoprotein E gene, etc.) or at the protein level (e.g. sequencing the ApoE protein, antibody-based methods, mass spectrometry based methods, etc.).
- markers of neurodegeneration refers to
- biomarkers of neurodegenerative diseases or disorders such as Alzheimer's disease (AD), vascular disease dementia, frontotemporal dementia (FTD), corticobasal degeneration (CBD), progressive supranuclear palsy (PSP), Lewy body dementia, tangle-predominant senile dementia, Pick's disease (PiD), argyrophilic grain disease, amyotrophic lateral sclerosis (ALS), other motor neuron diseases, Guam parkinsonism- dementia complex, FTDP-17, Lytico-Bodig disease, multiple sclerosis, traumatic brain injury (TBI), and Parkinson's disease. Marks of neurodegeneration and methods of detecting the same are known in the art.
- Non-limiting examples of a marker of neurodegeneration include Tau, phosphorylated Tau, TDP-43, a-synuclein, SOD-1 , FBP1 , FUS, FKBP51 , IRS-1 , phosphorylated IRS-1 , cathepsin D (CTSD), type 1 lysosome-associated membrane protein (LAMP1 ), ubiquitinylated proteins (UBP), heat- shock protein 70 (HSP70), neuron-specific enolase (NSE), neurofilament light chain (NFL), CD9, CD63, CD81 , CD171 , Visinin-like protein 1 , BACE1 , amyloid beta precursor protein, GHR, PD-1 , APEX1 , huntingtin, PRKN, and PSEN1.
- CSD cathepsin D
- LAMP1 type 1 lysosome-associated membrane protein
- UBP ubiquitinylated proteins
- HSP70 heat- shock protein 70
- NSE neuron
- Neurofilaments are type IV intermediate filament heteropolymers composed of light, medium, and heavy chains. They may also play a role in intracellular transport to axons and dendrites. Mutations in the neurofliament light chain (Nfl) gene cause Charcot-Marie-Tooth disease types 1 F (CMT1 F) and 2E (CMT2E), disorders of the peripheral nervous system that are characterized by distinct neuropathies.
- CMT1 F Charcot-Marie-Tooth disease types 1 F
- CMT2E Charcot-Marie-Tooth disease types 1 F
- a pseudogene has been identified on chromosome Y. Nfl levels may be determined at the nucleic acid level (e.g. RT-PCR sequencing, etc.) or at the protein level (e.g., antibody- based methods, mass spectrometry based methods, etc.).
- “Visinin-like protein 1” (NP_003376, UniProtKB Identifier P62760) is a protein that in humans is encoded by the VSNL1 gene. This gene is a member of the visinin/recoverin subfamily of neuronal calcium sensor proteins. The encoded protein is strongly expressed in granule cells of the cerebellum where it associates with membranes in a calcium-dependent manner and modulates intracellular signaling pathways of the central nervous system by directly or indirectly regulating the activity of adenylyl cyclase. Alternatively spliced transcript variants have been observed, but their full-length nature has not been determined.
- ROC means“receiver operating characteristic”.
- a ROC analysis may be used to evaluate the diagnostic performance, or predictive ability, of a test or a method of analysis.
- a ROC graph is a plot of sensitivity and specificity of a test at various thresholds or cut-off values. Each point on a ROC curve represents the sensitivity and its respective specificity.
- a threshold value can be selected based on an ROC curve to identify a point where sensitivity and specificity both have acceptable values, and this value can be used in applying the test for diagnostic purposes.
- test will be less likely to generate a false positive (diagnosis of the disease in more subjects who do not have the disease) at the cost of an increased likelihood that some cases of disease will not be identified (e.g. false negatives). If sensitivity is only optimized, the test will be more likely to identify most or all of the subjects with the disease, but will also diagnose the disease in more subjects who do not have the disease (e.g. false positives).
- a user is able to modify the parameters, and therefore select an ROC threshold value suitable for a given clinical situation, in ways that will be readily understood by those skilled in the art.
- AUC area under the curve
- sensitivity refers to the percentage of truly positive observations which is classified as such by a test, and indicates the proportion of subjects correctly identified as amyloid positive. In other words, sensitivity is equal to (true positive result)/[(true positive result)+(false negative result)].
- the term“specificity” refers to the percentage of truly negative observations which is classified as such by a test, and indicates the proportion of subjects correctly identified as amyloid negative. In other words, the percentage of healthy people who are correctly identified as not having a condition. Specificity is equal to (true negative result)/[(true negative result)+(false positive result).
- the range of the highest sensitivity is from 0.8 to 1. In another embodiment, the range of the highest specificity is from 0.8 to 1. In one embodiment, the range of the highest sensitivity is from 0.8 to 1 and the range of the highest specificity is from 0.8 to 1.
- the term“subject” refers to a mammal, preferably a human.
- the mammals include, but are not limited to, humans, primates, livestock, rodents, and pets.
- a subject may be waiting for medical care or treatment, may be under medical care or treatment, or may have received medical care or treatment.
- the term“healthy control group,”“normal group” or a sample from a“healthy” subject means a subject, or group subjects, who is/are diagnosed by a physician as not suffering from Ab amyloidosis, or a clinical disease associated with Ab amyloidosis (including but not limited to Alzheimer's disease) based on qualitative or quantitative test results.
- A“normal” subject is usually about the same age as the individual to be evaluated, including, but not limited, subjects of the same age and subjects within a range of 5 to 10 years.
- blood sample refers to a biological sample derived from blood, preferably peripheral (or circulating) blood.
- the blood sample can be whole blood, plasma or serum, although plasma is typically preferred.
- the terms“treat,” “treating,” or “treatment” as used herein, refers to the provision of medical care by a trained and licensed professional to a subject in need thereof.
- the medical care may be a diagnostic test, a therapeutic treatment, and/or a prophylactic or preventative measure.
- the object of therapeutic and prophylactic treatments is to prevent or slow down (lessen) an undesired physiological change or disease/disorder.
- Beneficial or desired clinical results of therapeutic or prophylactic treatments include, but are not limited to, alleviation of symptoms, diminishment of extent of disease, stabilized (i.e.
- “Treatment” can also mean prolonging survival as compared to expected survival if not receiving treatment.
- Those in need of treatment include those already with the disease, condition, or disorder as well as those prone to have the disease, condition or disorder or those in which the disease, condition or disorder is to be prevented.
- One aspect of the present invention is a blood-based method for detecting Ab amyloidosis, neurodegeneration, and/or for tau staging.
- the method comprises detecting and quantifying the concentration of Ab42, and optionally one other Ab peptide, in a blood sample obtained from a subject, and comparing the Ab42 concentration (or the Ab42/ Ab cc value) to a predetermined threshold value.
- the method also generally comprises detecting ApoE and optionally a marker of neurodegeneration in the same blood sample and determining ApoE e4 status and the concentration of the marker of neurodegeneration.
- the methods described herein measure plasma concentrations of individual Ab species and ApoE status with a high degree of precision. These precise measurements allow the small differences in plasma Ab42 concentration between amyloid positive and amyloid negative subjects to be quantified accurately. Multiplexing Ab42/ Ab40, ApoE
- the method can be used to produce a system that has a probability for detecting Ab amyloidosis equal to or greater than about 80%, equal to or greater than about 85%, equal to or greater than about 90%, preferably at least about 95%.
- the system can be used to grade a subject for the stage of disease, e.g. Ab amyloidosis, including identifying subjects most likely to develop Ab amyloidosis.
- neurodegenerative markers into the assay has the potential to increase the specificity and sensitivity of the assay to aid in staging AD (e.g. asymptomatic years to symptom onset vs. mildly and moderately affected) and in monitoring response to therapeutics during clinical drug trials.
- the method is not limited to a particular group of subjects.
- the method may be incorporated into routine screening practices performed by general medical practitioners or specialists.
- a subject may be a participant in a clinical trial, a subject at risk of developing Ab amyloidosis (e.g., due to known genetic, environmental, or lifestyle risks), a subject with at least one symptom of Ab amyloidosis, a subject with a CAA associated symptom, or a subject initiating or continuing treatment for Ab amyloidosis or a clinical disease associated with Ab amyloidosis.
- the other Ab peptide may be Ab40, Ab38, or any other Ab peptide. In preferred embodiments, the other Ab peptide is Ab40 or Ab38.
- a blood sample obtained from a subject is required.
- a blood sample may contain Ab that is not modified to include a detectable label (“unlabeled Ab”), or the sample may contain in vivo labeled Ab.
- the term“in vivo labeled Ab” refers to Ab that was labeled in vivo following administration of label to a subject.
- Suitable labels are known in the art and include, but are not limited to, amino acids or amino acid precursors labeled with radioactive or non-radioactive isotopes. See, for example, US 20090142766 and US 201301 15716, each hereby incorporated by reference in its entirety.
- in vivo labeling methods may increase the sensitivity of a detection method
- an advantage of the present invention is that in vivo labeled Ab is not required.
- the blood sample contains unlabeled Ab.
- the blood sample does not contain in vivo labeled Ab.
- the blood sample should typically be large enough to allow the measurement of Ab, ApoE and optionally a marker of neurodegeneration.
- a typical blood sample may be from about 0.5 ml to about 10 ml. More than one sample may be pooled for a particular time point.
- the blood sample may be collected directly as part of the method. Alternatively, a previously-obtained blood sample may be used. Methods of collecting a blood sample are well known in the art. For example, venipuncture, with or without a catheter, may be used to collect a blood sample. In another example, a finger stick, or the equivalent, may be used to collect a blood sample. Additives may or may not be added to the collected blood prior to plasma separation. Suitable additives include citrate, heparin, EDTA, Tween, and protease inhibitors.
- the method of detecting and quantifying Ab, ApoE, and optionally markers of neurodegeneration can and will vary but should be sensitive and precise enough to accurately quantify the concentration of Ab, markers of neurodegeneration and APOE e4 status in blood.
- a non-limiting measurement of assay precision is the coefficient of variation (CV).
- the CV may be less than 5%. In some embodiments, the CV may be about 2-3%. Suitable methods are known in the art and include, but are not limited to, capture-specific assays, in particular antibody-based assays (e.g.
- the method of detecting Ab may also be used to quantify the concentration of Ab and the method of detecting ApoE may be used to determine ApoE e4 status.
- quantification encompasses determining the Ab42/ value.
- a blood sample typically in the form of a plasma sample, may be used directly. Generally, however, additional processing of the sample occurs prior to analyzing the sample.
- one or more protease inhibitors are added to the sample.
- the blood sample may be aliquoted allowing the sample to be processed to detect Ab, markers of
- the samples may be then pooled together prior to analysis.
- additional techniques may be used to separate Ab, markers of neurodegeneration and ApoE from other blood components (either partially or completely), or to concentrate the Ab, markers of neurodegeneration and ApoE in a sample.
- immunoprecipitation may be used to partially or completely purify Ab before it is analyzed.
- the immunoprecipitation antibody may be attached to a solid support, such as a bead or resin.
- Use of an antibody that binds to the mid-domain of Ab can be used to immunoprecipitate multiple Ab peptides, while selection of an antibody that binds to the N- or C-terminus of Ab can be used to immunoprecipitate a subset of Ab peptide(s).
- Protocols for immunoprecipitations are known in the art.
- immuno-enrichment or non-immuno-enrichment techniques may be used to separate and concentrate from other blood components.
- an antibody- independent method of detecting and quantitating ApoE isoform-specific proteins is used.
- PHM-LiposorbTM Calbiochem, San Diego, CA
- an absorbent typically used to remove lipids and lipoproteins from serum or plasma may be used to capture ApoE from biological fluids.
- neurodegeneration or ApoE or fragments thereof by size, hydrophobicity or affinity.
- Ab, markers of neurodegeneration and/or ApoE may also be cleaved into smaller peptides prior to detection.
- Ab, markers of neurodegeneration and/or ApoE may be enzymatically cleaved with a protease to create several small peptides. Suitable proteases include, but are not limited to, trypsin, Lys-N, Lys-C, and Arg-N.
- Ab may be enzymatically cleaved with Lys-N.
- ApoE may be enzymatically cleaved with trypsin.
- a capture-specific assay is used. Prior to analyzing the sample, one or more protease inhibitors are added to the sample. The sample, now containing one or more protease inhibitor(s), is then analyzed to determine the concentration of Ab42. In certain embodiments, the concentration of at least one other Ab peptide is also determined, for example Ab40 and/or Ab38.
- the capture-specific reagent of the assay is an antibody that is
- high-resolution tandem mass spectrometry is used prior to analyzing the sample.
- one or more protease inhibitors are added to the sample, the sample is aliquoted so Ab, markers of neurodegeneration and ApoE can be detected in parallel.
- Ab is immunoprecipitated using an anti-Ab antibody, preferably an anti-Ab antibody that specifically binds all targeted Ab peptides.
- ApoE and optionally a marker of neurodegeneration is concentrated with or without immuno-enrichment. Following one or more wash steps, the concentrated peptides are proteolytically digested and the samples are pooled for analysis.
- Suitable proteases include, but are not limited to, trypsin, Lys-N, Lys-C, and Arg-N. Digestion may occur following elution or while the peptides are bound. Following one or more clean-up steps, digested peptides are analyzed by a liquid chromatography system interfaced with a high-resolution tandem MS unit (LC-MS/MS).
- LC-MS/MS high-resolution tandem MS unit
- Additional processing of the sample may also occur prior to LC- MS/MS analysis.
- the sample may be further processed following digestion by trichloroacetic acid (TCA) or trifluoroacetic acid (TFA) precipitation.
- TCA trichloroacetic acid
- TFA trifluoroacetic acid
- PEG and other contaminants cause ion suppression of Ab peptides in the mass spectrometer.
- TCA or TFA precipitation can reduce such contamination.
- the sample may be further processed following digestion (and optional TCA/TFA precipitation) with peracids, in non-limiting examples, performic acid (PFA), peracetic acid (PAA), pertrifluroacetic acid (PTFA) and such other peracids.
- peracids in non-limiting examples, performic acid (PFA), peracetic acid (PAA), pertrifluroacetic acid (PTFA) and such other peracids.
- the mass spectrometry protocol outlined in the Examples is used.
- Detection of Ab amyloidosis occurs when the Ab42 concentration (or Ab42/ Ab cc value) in a blood sample obtained from a subject is lower than a predetermined threshold value that discriminates amyloid positive subjects from amyloid negative subjects, and when the predetermined threshold is obtained by a system that provides a probability of detecting Ab amyloidosis equal to or greater than about 80%, equal to or greater than about 85%, equal to or greater than about 90%, preferably at least about 95%.
- the term“system” refers to the set of procedures used to determine a threshold value that discriminates amyloid positive subjects from amyloid negative subjects, including but not limited to the reagents, the assay used to detect and quantify Ab, markers of neurodegeneration and ApoE, and the statistical methods used in the analysis.
- a system has either been validated to perform at a level that has a probability of detecting Ab amyloidosis equal to or greater than 80%, or the system presently performs at said level even though validation has not been performed.
- the method for detecting and quantifying Ab, ApoE and optionally a marker of neurodegeneration is selected from those disclosed in Section II (b), and the predetermined threshold value and probability of detecting Ab amyloidosis is calculated by using a receiver operating characteristic (ROC) curve or other substantially similar method known in the art.
- ROC receiver operating characteristic
- an ROC curve may be generated using the covariates Ab42 concentration (or Ab42/ Ab cc value), ApoE e4 status, concentration of neurodegenerative marker and amyloid status (i.e. amyloid positive or amyloid negative) using blood samples obtained from amyloid positive or amyloid negative individuals of the same species as the subject.
- a plot is thus generated, which can be used to determine the sensitivity and specificity of various Ab42 concentrations (or Ab42/ Ab cc values), marker of neurodegeneration
- ROC AUC ROC AUC 0.80 indicates there is an 80% probability that a randomly chosen individual with Ab amyloidosis would have lower plasma Ab42/ Ab40 value compared to a randomly chosen individual without Ab amyloidosis.
- Various methods are known in the art for determining an optimal cut-off value that maximizes sensitivity and specificity to serve as a threshold for discriminating amyloid positive subjects.
- the predetermined threshold is determined by a data point of the highest specificity at the highest sensitivity on the ROC curve.
- the predetermined threshold is determined by a composit score via mathematical combination (for example logistical regression) of amyloid beta, ApoE isoform(s), and optionally one or more markers of
- Another aspect of the present invention is a blood-based biomarker of Ab amyloidosis, wherein the blood-based biomarker is an Ab42/ Ab40 value less than 0.130, determined by a system that provides a probability of detecting Ab amyloidosis equal to or greater than about 80%, more preferably 85%.
- an Ab42/ Ab40 value that can be used to identify an amyloid positive subject is an Ab42/ Ab40 value less than 0.130.
- a blood-based biomarker of Ab amyloidosis is an Ab42/ Ab40 value less than about 0.128, preferably less than about 0.125.
- an Ab42/ Ab40 value that can be used to identify an amyloid positive subject may be less than about 0.124, less than about 0.123, less than about 0.120, or less than about 0.1 17. In another example, an Ab42/ Ab40 value that can be used to identify an amyloid positive subject may be less than about 0.115. In an exemplary embodiment, an Ab42/ Ab40 value that indicates a subject is amyloid positive is an Ab42/ Ab40 value of about 0.113 or less. In another exemplary embodiment, an Ab42/ Ab40 value that indicates a subject is amyloid positive is an Ab42/ Ab40 value of about 0.109 to about 0.1 13.
- the blood-based biomarker of Ab amyloidosis described above can be optionally combined with an additional biomarker to further improve the diagnostic accuracy.
- APOE e4 status, and optionally age are included with a plasma Ab42/Ab40 value in a system for detecting Ab amyloidosis, the ROC AUC increased to 0.95 (0.91 to 0.98).
- Another aspect of the present invention is a blood-based biomarker of Ab amyloidosis, wherein the blood-based biomarker is an Ab42/ Ab cc value, wherein Ab cc is an Ab peptide other than Ab42.
- the blood-based biomarker is an Ab42/ Ab cc value, wherein Ab cc is an Ab peptide other than Ab42.
- neurodegenerative marker peptides are known, and also described in Section II. IV. METHODS FOR IDENTIFYING A SUBJECT AS A CANDIDATE FOR FURTHER
- Another aspect of the present invention is a method for identifying or classifying a subject as a candidate for further diagnostic testing and/or for
- the method comprises detecting and quantifying the
- the method is not limited to a particular group of subjects.
- the method may be incorporated into routine screening practices performed by general medical practitioners or specialists.
- a subject may be a participant or potential participant in a clinical trial, a subject at risk of developing Ab amyloidosis (e.g., due to known genetic, environmental, or lifestyle risks), a subject with at least one symptom of Ab amyloidosis, a subject with at least one CAA associated symptom.
- the subject is a candidate for amyloid imaging.
- a further diagnostic test is a cerebral spinal fluid (CSF) test to measure the concentration of one or more biomolecules found in the CSF.
- CSF cerebral spinal fluid
- Non-limiting examples include one or more Ab peptide, in particular Ab42, tau, phospho-tau, neurofilament light chain, visinin-like protein one and ApoE.
- a further diagnostic test is a neuroimaging test, such as a structural imaging test, a functional imaging test, or a molecular imaging test.
- Structural imaging tests are typically performed by magnetic resonance imaging (MRI) and/or computed tomography (CT) to provide information about the shape, position, or volume of brain tissue.
- MRI magnetic resonance imaging
- CT computed tomography
- Functional imaging tests are typically performed by positron emission testing (PET) and functional MRI (fMRI) to measure cellular activity in one or more regions of the brain.
- PET positron emission testing
- fMRI functional MRI
- a non-limiting example of a functional imaging test is fluorodeoxyglucose (FDG)-PET.
- FDG fluorodeoxyglucose
- Molecular imaging tests use highly targeted radiotracers to detect cellular or chemical changes and are performed by technologies including PET, fMRI, and single photon emission computed tomography (SPECT).
- Non-limiting examples of a molecular imaging test include Pittsburgh compound B (PIB)-PET, florbetaben-PET, florbetapir- PET, and flutemetamol-PET.
- the methods disclosed herein may also be used to identify subjects in need of therapeutic intervention.
- therapeutic intervention may slow, inhibit or reverse amyloid deposition. Until such interventions advance from clinical trial stages, the methods disclosed herein may be used to identify subjects for enrollment in clinical trials and/or evaluate a subject’s status during a clinical trial.
- therapeutic intervention may slow or inhibit the worsening of the symptom and/or slow, inhibit, or prevent the onset of new symptoms.
- Another aspect of the invention is a method for treating a subject with a non-pharmacological treatment, a pharmacological treatment, or an imaging agent based on the subject’s positive test result for a blood-based biomarker of Section III or the subject’s blood Ab42 concentration (or a ratio of Ab42 concentration to the concentration of another Ab peptide) and ApoE status as described in Section II.
- the method comprises measuring the Ab42 concentration, ApoE status, and optionally a marker of neurodegeneration in a blood sample obtained from a subject, wherein the subject is diagnosed with Ab amyloidosis when the Ab42 concentration is less than a predetermined threshold value, wherein the Ab42 concentration is compared to the subjects ApoE status and that discriminates amyloid positive subjects from amyloid negative subjects from subjects likely to develop Ab amyloidosis.
- the predetermined threshold is obtained by a system that provides a probability of detecting Ab amyloidosis equal to or greater than 80%, preferably at least about 85%; and administering a treatment to the diagnosed subject.
- the predetermined threshold value can be set as required by situational circumstances.
- the method further comprises measuring the concentration of another Ab variant (Abcc) in the blood sample, wherein the subject is diagnosed with Ab amyloidosis when the blood
- Ab42/Abcc value is less than a predetermined threshold value that discriminates amyloid positive subjects from amyloid negative subjects.
- Abcc is Ab42, Ab40, or Ab38.
- the method comprises requesting a test that provides the results of an analysis determining whether the subject has an Ab42 blood concentration less than a predetermined threshold value in view of the subjects ApoE status and optionally the concentration of a marker of neurodegeneration that discriminates amyloid positive subjects from amyloid negative subjects from subjects likely to develop Ab amyloidosis, wherein the Ab42 blood concentration was obtained by a system that provides a probability of detecting Ab amyloidosis equal to or greater than 80%, preferably at least about 85%; diagnosing the subject with Ab amyloidosis when the test results indicate the subject’s Ab42 blood concentration is less than a predetermined threshold value; and administering a treatment to the diagnosed subject.
- Requesting at test may refer to a physician requesting or ordering a test from a third party, from an in-house laboratory facility, or from a scientific lab capable of performing the test.
- the predetermined threshold value can be set as required by situational circumstances. For example, in certain clinical situations it may be desirable to minimize false-positive rates. These clinical situations may include, but are not limited to, the use of an experimental treatment (e.g., in a clinical trial) or the use of a treatment associated with serious adverse events and/or a higher than average number of side effects. Alternatively, it may be desirable to minimize false-negative rates in other clinical situations.
- Non-limiting examples may include treatment with a non-pharmacological intervention, the use of a treatment with a good risk-benefit profile, or treatment with a functional imaging agent, a molecular imaging agent (e.g., a radioimaging agent, etc.) followed by detection with PET, fMRI, SPECT, or the like.
- a functional imaging agent e.g., a radioimaging agent, etc.
- a molecular imaging agent e.g., a radioimaging agent, etc.
- the method further comprises requesting a test that provides the results of an analysis determining whether the patient has a blood Ab42/ Abcc value less than a predetermined threshold value, in view of the subjects ApoE status, that discriminates amyloid positive subjects from amyloid negative subjects; and diagnosing the subject with Ab amyloidosis when the test results indicated the subject’s blood Ab42/ Abcc value is less than a predetermined threshold value.
- Abcc is Ab42, Ab40, or Ab38.
- the method comprises measuring the Ab42 concentration and the Ab40 concentration in a blood sample obtained from a subject, wherein the subject is diagnosed with Ab amyloidosis when the calculated Ab42/ Ab40 value is less than 0.126, as determined by a system that provides a probability of detecting Ab amyloidosis equal to or greater than 80%, or optionally equal to or greater than about 85%; and administering a treatment to the diagnosed subject.
- the Ab42/ Ab40 value may be less than about 0.124, less than about 0.123, or less than about 0.120.
- the Ab42/ Ab40 value may be less than about 0.1 17 or less than about 0.1 15.
- the Ab42/ Ab40 value may be less about 0.113 or less. Alternatively, the Ab42/ Ab40 value may be about 0.109 to about 0.1 13.
- the treatment may be a non-pharmacological treatment, a pharmacological treatment, or treatment with an imaging agent followed by detection of the imaging agent (e.g. with PET, fMRI, SPECT, or the like).
- the method comprises requesting a test that provides the results of an analysis determining whether the subject has an Ab42/ Ab40 blood value less than 0.126, as determined by a system that provides a probability of detecting Ab amyloidosis equal to or greater than 80%, or optionally equal to or greater than about 85%; diagnosing the subject with Ab amyloidosis when the test results indicate the subject’s blood Ab42/ Ab40 value is less than 0.126, and
- the Ab42/ Ab40 value may be less than about 0.124, less than about 0.123, less than about 0.120, or less than about 0.1 17. In still further embodiments, the Ab42/ Ab40 value may be less than about 0.1 15, or a value of about 0.113 or less. Alternatively, the Ab42/ Ab40 value may be about 0.109 to about 0.1 13.
- the treatment may be a non-pharmacological treatment, a pharmacological treatment, or treatment with an imaging agent followed by detection with PET, fMRI, SPECT, or the like.
- Non-limiting examples of non-pharmacological treatments include cognitive behavioral therapy, psychotherapy, behavioral management therapy,
- Non-limiting examples of pharmacological treatments include cholinesterase inhibitors, N-methyl D-aspartate (NMDA) antagonists, antidepressants (e.g., selective serotonin reuptake inhibitors, atypical antidepressants, aminoketones, selective serotonin and norepinephrine reuptake inhibitors, tricyclic antidepressants, etc.), gamma-secretase inhibitors, beta- secretase inhibitors, anti-Ab antibodies (including antigen-binding fragments, variants, or derivatives thereof), anti-tau antibodies (including antigen- binding fragments, variants, or derivatives thereof), stem cells, dietary supplements (e.g.
- TRx0237 methylthionimium chloride, etc.
- therapies to improve blood sugar control e.g., insulin, exenatide, liraglutide pioglitazone, etc.
- anti-inflammatory agents e.g., insulin, exenatide, liraglutide pioglitazone, etc.
- anti-inflammatory agents e.g., insulin, exenatide, liraglutide pioglitazone, etc.
- phosphodiesterase 9A inhibitors e.g., insulin, exenatide, liraglutide pioglitazone, etc.
- sigma-1 receptor agonists e.g., sigma-1 receptor agonists, kinase inhibitors, angiotensin receptor blockers, CB1 and/or CB2 endocannabinoid receptor partial agonists, b-2 adrenergic receptor agonists, nicotinic acetylcholine receptor agonists
- Non-limiting examples of imaging agents include functional imaging agents (e.g. fluorodeoxyglucose, etc.) and molecular imaging agents (e.g., Pittsburgh compound B, florbetaben, florbetapir, flutemetamol, radionuclide-labeled antibodies, etc.)
- functional imaging agents e.g. fluorodeoxyglucose, etc.
- molecular imaging agents e.g., Pittsburgh compound B, florbetaben, florbetapir, flutemetamol, radionuclide-labeled antibodies, etc.
- a non-invasive, inexpensive screening test for Alzheimer disease (AD) is needed to advance clinical and prevention trials.
- An immunoprecipitation mass spectrometry (IPMS) blood test that is sensitive and specific for amyloid-b (Ab) peptides Ab42 and Ab40 has been developed.
- IPMS immunoprecipitation mass spectrometry
- Ab42/Ab40 as measured by IPMS is significantly decreased in amyloid PET-positive individuals compared to amyloid PET-negative individuals.
- a logistic regression model for prediction of amyloid PET status by plasma Ab42/Ab40 had a ROC AUC of 0.88, which increased to 0.95 when APOE e4 status and age were included in the model.
- a single assay for plasma Ab42/Ab40 and APOE e4 status would reduce screening costs for enrolling participants in AD drug trials and has the potential to be used in clinical diagnosis.
- CDR Clinical Dementia Rating
- MMSE Mini-Mental State Examination
- CSF was collected as previously described 17 . Participants underwent LP at 8 am following overnight fasting. Twenty to thirty mis of CSF was collected in a 50 ml polypropylene tube via gravity drip using an atraumatic Sprotte 22- gauge spinal needle. The tube was gently inverted to disrupt potential gradient effects and centrifuged at low speed to pellet any cellular debris. CSF was aliquoted into polypropylene tubes and stored at -80°C. CSF Ab42, tTau, and pTau were measured with the corresponding Elecsys immunoassays on the Roche cobas e601 analyzer 18 .
- polypropylene tubes containing 120 pi 0.5 M EDTA The samples were kept on wet ice until centrifugation ( ⁇ 2 hours) to separate plasma from blood cells. The plasma was then transferred to a single 50 ml_ polypropylene tube, gently mixed, aliquoted into polypropylene tubes and stored at -80°C.
- Targeted Ab isoforms (Ab38, Ab40, and Ab42) were simultaneously immunoprecipitated from 1.6 ml_ of plasma or 0.5 ml_ of CSF via a monoclonal anti-Ab mid-domain antibody (HJ5.1 , 3h ⁇ -Ab13-28) conjugated to M-270 Epoxy Dynabeads (Invitrogen, Carlsbad, CA, USA).
- assay tubes Prior to the plasma sample addition, assay tubes were pre-treated with 380 mI_ of a master mix containing 5.26 X protease inhibitor cocktail (Roche, Basel, Switzerland), 0.263% (w/v) Tween-20, 2.63 X PBS, and 2.63 M guanidine.
- plasma samples were spiked with 20 mI_ of a solution containing 3.75 pg/pL 1 3 ⁇ 4 15 N-Ab38, 25 pg/pL 1 3 ⁇ 4 15 N-Ab40, and 2.5 pg/pL 1 3 ⁇ 4 15 N-Ab42 (labeled peptides from RPeptide, Athens, GA, USA) in 4: 1 0.1 % ammonium
- Peptides derived from human Ab contained amino acids with the naturally-occurring 14 Nitrogen ( 14 N) isotope, while peptides derived from the exogenous Ab spiked into samples as a standard contained amino acids that were uniformly labeled with 15 Nitrogen ( 15 N) isotope.
- the precursor/product ion pairs utilized for PRM (plasma) and SRM (CSF) analyses were chosen as previously described 12 and the derived integrated peak areas were analyzed using the Skyline software package 19 .
- the Ab42/Ab40 ratio was calculated as follows: ((the sum of the integrated peak areas for 14 N product ions for Ab42/ ⁇ Ipb sum of the integrated peak areas for 15 N product ions for Ab42) times the Ab42 15 N calculated internal standard amount) divided by ((the sum of the integrated peak areas for 14 N product ions for Ab40/ ⁇ Ipb sum of the integrated peak areas for 15 N product ions for Ab40) times the Ab40 15 N calculated internal standard amount).
- Amyloid PET was used as the reference standard for amyloidosis because it is a well-established biomarker and widely used in clinical trials for assessment of brain amyloid burden 5, 6 8 .
- Participants underwent a 60-minute dynamic scan with either 11 C Pittsburgh Compound B (PIB) or AV45. PET imaging was performed with a Siemens 962 HR+ ECAT PET or Biograph 40 scanner (Siemens/CTI, Knoxville KY). Structural magnetic resonance imaging (MRI) using MPRAGE T1 - weighted images was also acquired and processed using FreeSurfer 20
- the plasma or CSF Ab42/Ab40 value with the maximum Youden index was selected as the cut-off value and had the highest combined PPA and NPA, therefore best distinguishing between amyloid PET-positive and PET-negative individuals. Because amyloid PET centiloid values were not normally distributed, Spearman correlations were used to evaluate the relationship between amyloid PET centiloid and plasma or CSF Ab42/Ab40. Analysis of covariance with plasma or CSF Ab42/Ab40 as the outcome variable and centered age (age - the mean age for the cohort of 63.70 years), APOE z4 status and sex as predictors were implemented with PROC GLM.
- IPMS IPMS
- CSF samples collected the same day as plasma from 145 individuals were assayed for Ab42/Ab40 by IPMS. Data on CSF Ab42, tTau and pTau, as measured by Elecsys immunoassay, was available for 152 individuals.
- An amyloid PET scan performed within eighteen months of the baseline plasma sample was negative for 1 15 individuals and positive for 43 individuals.
- the average interval between the plasma collection and the amyloid PET scan was 0.26 ⁇ 0.35 years (mean ⁇ standard deviation) with a range of 0 to 1.5 years.
- the age range extended from 46.1 to 86.9 years old.
- Ab42/Ab40 assay the ROC AUC was 0.85 (0.79 to 0.92) for a CSF Elecsys rTqu/Ab42 cut-off of 0.0198 18 and 0.85 (0.78 to 0.92) for a CSF Elecsys pTauA ⁇ 42 cut-off of 0.0220 27 .
- Our cohort represented a wide age range, but the performance of the assay was very similar in sub-cohort of individuals older than age 60 years (ROC AUC 0.87, 0.80 to 0.94).
- a plasma Ab42/Ab40 cut-off of ⁇ 0.1218 was considered positive and had the maximum Youden Index with a positive percent agreement (PPA) of 0.88 (0.75 to 0.96) and a negative percent agreement (NPA) of 0.76 (0.67 to 0.83) with amyloid PET status (Fig. 1C).
- Baseline plasma Ab42/Ab40 was inversely correlated with amyloid PET on the continuous centiloid scale (Fig. 1E), with a Spearman rho of -0.55 (-0.65 to - 0.43).
- Fig. 1E continuous centiloid scale
- Baseline plasma Ab42/Ab40 was lower with older age (p ⁇ 0.0001 ) and was lower in APOE z4 carriers (p ⁇ 0.0001) and men (p ⁇ 0.002), (Fig. 2A and Table 2). There was no significant interaction between age and APOE zA status. Each decade of age, APOE z4 carrier status and male sex was associated with lower plasma Ab42/Ab40 levels by -0.005 (for comparison, the difference between plasma
- baseline CSF Ab42/Ab40 was lower with older age and was lower in APOE z4 carriers (both p ⁇ 0.0001 ), (Fig. 2B and Table 2).
- CSF Ab42/Ab40 did not vary by sex. Table 2. Relationship between plasma or CSF Ab42/Ab40 and age, APOE e4 status and sex. Centered age (age-63.70 years), APOE e4 status and sex were used as predictors of baseline plasma and CSF Ab42/Ab40 values in analyses of covariance. Baseline plasma Ab42/Ab40 was lower with older age, in APOE e4 carriers and men.
- Baseline CSF Ab42/Ab40 was lower with age and in APOE e4 carriers but did not vary by sex.
- the intercept is the estimated plasma or CSF APOE e4 at the mean age (63.70 years) for a female APOE e4 non-carrier.
- the estimates are the differences in the plasma or CSF Ab42/Ab40 per year of age greater than 63.70 years, for APOE e4 carriers and for men.
- Amyloid PET converters had a significantly higher baseline amyloid PET centiloid compared to individuals who remained amyloid PET-negative (6.9 ⁇ 4.7 versus -0.5 ⁇ 4.0, p ⁇ 0.0001 ), suggesting amyloid PET converters had below-threshold brain amyloidosis.
- One individual classified as an amyloid PET converter with negative plasma and CSF Ab42/Ab40 at both the first and last time points had Elecsys CSF biomarkers that were inconsistent with brain amyloidosis (at the last time point CSF Ab42 was 1434 pg/ml, tTau was 193 pg/ml and pTau was 17.5 pg/ml), suggesting that their last PET scan may be false positive.
- the average interval between the first and last plasma collections was 3.6 ⁇ 1.2 years with a range of 1 .9 to 7.1 years.
- Table 4 Baseline characteristics of individuals who contributed baseline plasma samples and longitudinal PET data. Continuous measures are presented as the mean ⁇ standard deviation. The significance of differences between the amyloid PET- negative, stable group and the other two groups were determined by T-tests for continuous variables and by Chi-Square or Fisher exact tests for categorical variables.
- the frequency of amyloid PET positivity as a function of age group and APOE z4 status was based on data from the Anti-Amyloid Treatment in Alzheimer’s (A4) prevention study, which included cognitively normal individuals aged 65-85 years 11 .
- the probability of a positive amyloid PET scan for individuals with a positive blood test was based on a logistic regression model generated with data from the present study. By screening individuals with a positive plasma Ab42/Ab40, fewer confirmatory amyloid PET scans would be required to obtain a cohort of 100 individuals with a positive amyloid PET scan.
- the percentage of PET scans saved by first screening participant with plasma Ab42/Ab40 was highest in APOE zA non-carriers and younger individuals. For a cohort similar to A4, screening participants with plasma Ab42/Ab40 could reduce the number of amyloid PET scans required by approximately 62%.
- Ab42/Ab40 as measured by a high precision assay, could accurately detect brain amyloidosis in AD prevention drug trials that recruit cognitively normal research participants.
- the most immediate use of the plasma Ab42/Ab40 assay is screening potential participants for Alzheimer’s drug trials for brain amyloidosis. Age and APOE z4 status could be used to improve the accuracy of the screen. If the plasma Ab42/Ab40 screen was positive, then a confirmatory test such as amyloid PET or CSF biomarkers may be performed, depending on the needs of the study. The plasma Ab42/Ab40 screen could significantly reduce or eliminate the number of confirmatory tests required to select a cohort of research participants with brain amyloidosis, especially in the case of prevention trials, which recruit cognitively normal individuals who have a relatively low rate of brain amyloidosis.
- Alzheimer's & dementia the journal of the Alzheimer's Association 2018; 14: P215- P216.
- Alzheimer's & dementia the journal of the Alzheimer's Association
- Fagan AM Mintun MA
- Mach RH Mach RH
- et al Inverse relation between in vivo amyloid imaging load and cerebrospinal fluid Abeta42 in humans. Annals of neurology
- AD Alzheimer’s disease
- Current clinical diagnosis has both poor sensitivity and specificity for AD and other neurodegenerative dementias.
- Current diagnostic tests in development include CSF and PET scans for tau tangle and amyloid-plaque pathologies.
- these approaches are invasive, require significant training, and are expensive.
- early asymptomatic detection of AD pathology is necessary for enrollment of participants in research studies, clinical trials and prevention trials.
- test should include measures of the key domains of AD: genetic risk (ApoE), pathology of amyloid plaques and tau tangles, and
- Apolipoprotein E has three major isoforms: e2, e3, and e4, which have single amino acid variations that lead to differences in molecular weight, structure and function. Importantly, a single Apo e4 allele increases risk of AD 3-4 fold and two Apo e4 alleles increase AD risk by 10-14 fold (3).
- Methods have been developed to measure ApoE status by sequencing (genotype measurement) and by liquid chromatography mass spectrometry LC/MS) (phenotype measurement) with 100% concordance (Fig. 6). Sensitivity and specificity of the amyloid-beta blood test substantially improve when ApoE status is combined with age.
- Parameters to be optimized are described above and include analytical sensitivity (LOQ), accuracy, precision, and stability.
- LOQ analytical sensitivity
- the multiplexed and individual assays will be run on 100 blood samples (50 amyloid positive by CSF and PET AD vs. 50 cognitive normal, amyloid negative by PET and CSF age matched controls).
- Neurofilament light chain (NfL) is a major component of the cytoskeleton of neurons. Upon neurodegeneration, it is released into the CSF and blood, and can be measured in both as a biomarker of neurodegeneration. Although Nfl is increased in many neurodegenerative diseases, NfL has the potential to aid in staging AD (e.g. asymptomatic years to symptom onset vs. mildly and moderately affected) and in monitoring response to therapeutics during clinical drug trials. A study by Mattsson et. al. (JAMA Neurology, 2017) reports an AUC of 0.87 for plasma NfL differentiating between an AD dementia group and controls (FIG. 8). To date, NfL analysis has predominantly been done by immunoassay.
- Nfl in our mass spectrometric assay is expected to result in an assay that is more specific for neuronal (and potentially neuron subtypes), sensitive and cost-effective with multiplexing.
- additional staging information can be added to the high accuracy blood plasma detection of amyloid plaques.
- VILIP-1 Visinin-like protein one
- ILIP-1 is a calcium-sensor neuronal protein that is elevated following neuronal injury.
- Immunoassay studies by Tarawneh et. al. in both CSF and plasma show separation between the AD group and controls (FIG. 9). Similar to our expectations for NfL, we expect the VILIP-1 mass spectrometry assay to be more specific and precise than the immunoassay and to be amenable to multiplexing.
- NfL Assay Development Antibody development and selection: Recombinant human NfL will be expressed as described by Lewcuk et. al. 2018. Briefly, nucleotides encoding Neurofilament light (NfL) protein amino acids 1 -396, (NfL-head + core) will be amplified from a full-length cDNA (RC205920, Origene). The PCR fragments will be purified and cloned into BamHI/EcoRI digested pG (GST) expression plasmid (GE Healthcare). Constructs will be sequenced and transformed into E. coli BL21 (DE3). E.
- coli BL21 (DE3) containing the construct will be cultured in LB media containing ampicillin and protein expression will be induced with isopropyl b-D-l - thiogalactopyranoside (IPTG). Cells will be pelleted via centrifugation and stored at -20 °C pending purification. The pellet will re-suspended in lysis buffer (20 mM Tris, 150 mM NaCI, 1 % NP40 pH 7.5) plus complete protease inhibitors (Complete, Roche) and GST- NfL fusion protein will be purified using Glutathione-Sepharose 4B (GE Healthcare). On- bead cleavage of the GST-fusion protein by thrombin will be performed.
- the cleaved, untagged protein will be eluted with PBS containing protease inhibitor.
- Monoclonal antibodies against NfL will be generated by immunization of 8-week-old Balb/c mice with the recombinant protein fragments (head + core) using complete Freund’s adjuvant (Sigma) as described for generation of tau monoclonal antibodies (Yanamandra et al. 2013). Briefly, after 2-3 dosages with the recombinant protein fragment (approximately 75 pg/mouse), the spleen will be removed and B cells will be fused with the myeloma cell line SP2/0 following standard procedures.
- NfL antibodies Approximately 10 days after fusion, cell media will be screened for NfL antibodies using recombinant protein fragment head + core (amino acids 1 -396), and purified bovine NfL protein (Karlsson et al. 1987). Clones that reacted with the recombinant NfL proteins and bovine NfL, but not with a negative control protein will be further grown, subcloned, and subsequently frozen in liquid nitrogen. Reactivity against human NfL will be determined by Western blot from cortex of human brain samples. The isotypes of the antibodies will be determined using a commercially available kit (Pierce Rapid Isotyping Kit-Mouse). Finally, antibodies will be purified using a protein G column (GE Healthcare). Purified NfL antibodies (Table 1 ) will be compared to commercially available antibodies for their ability to immunoprecipitate NfL from human serum. Table 6: Representative table of antibodies to be compared for immunoprecipitation of NfL
- Target peptides will be chosen empirically. Recombinant human NfL will be digested with Trypsin or LysN, and analyzed by LC/MS/MS with data dependent acquisition. Candidate peptides will be chosen based on peptide chemistry (lack of oxidation and alkylation sites), retention time, charge states, relative intensity and fragmentation. The top candidates will be analyzed for uniqueness with a BLAST search, then further analyzed in pooled CSF and plasma using a minimum of five technical replicates. Transition ions will be selected from fragmentation of the peptides by collision induced dissociation and the most reproducible fragment ions will be chosen for quantitation. This iterative process will result in selection of several target peptides with two to four transition ions each.
- VILIP-1 Assay Development Antibodies: Immunoassays and monoclonal antibodies against VILIP-1 have been developred. These antibodies, including clone 3A8.1 against epitope S96-Y108, and clone 2B9.3 against epitope F55- D73, will be compared for their ability to immunoprecipitate VILIP-1 from human plasma.
- Enzyme and peptide selection The same iterative process as described for NfL above will be utilized for VILIP-1 mass spectrometry assay
- NfL and VILIP-1 are quantified by the mass spectrometry assays and their ability to predict disease state assessed. Prior to analyzing the 50 amyloid positive AD and 50 amyloid negative control samples internal standards, calibration curves, and quality control samples based on our current protocols for plasma Ab are prepared. Measurement and optimization of analytical sensitivity (LOQ),
- Quality control samples QC samples are utilized in our lab with amyloid positive AD and amyloid negative cognitively healthy controls. Aliquots from each QC pool will be spiked with internal standard, processed with all test samples and run at the beginning, middle and end of each batch. Acceptability characteristics will be determined for QC material (+/-2SD, %CV ⁇ 3%) and will be used to detect analytical errors. Any sample with QC outside of two standard deviations will flag an error and will be rerun after the error is corrected.
- Limit of quantitation and analytical measurement range: We will spike standards into matrix to determine the concentration at which the signal to noise (S/N) is between 10: 1 and 20: 1 and set that as the lower limit of detection.
- S/N signal to noise
- the linear range will also be determined by this method and will be assessed at +/- 20% of the theoretical concentration range. For multiple concentrations over the linear range we will assess peak shape, retention time and ion ratio.
- Precision/Repeatability and carryover We will assess 3 levels of QC over 5 days with 5 replicates each day. Carryover will be assessed by including matrix blanks. Acceptable carryover is ⁇ 20% of lower LOQ.
- Stability We will test the stability of samples, internal standards, calibrators, and QCs in solution and in matrix. Short-term stability will be determined at room temperature and long-term stability at -80°C, -20°C, and 4°C. The maximum number of freeze thaw cycles will also be determined.
- Accuracy We will compare results from mass spectrometry assays to those from existing immunoassays and assess both the concordance between methods and the individual method’s ability to predict disease state.
- IP immunoprecipitation
- FIG 12 shows a skyline analysis of each of the 20 samples, low control, high control, and 3 pooled plasma controls. All samples were resuspended in 0.1 % FA except PP controls 2 and 3, which were resuspended in 5% CAN.
- the pooled plasma control 1 ApoE IP (1 :500 dilution compared to other samples).
Abstract
Description


Claims
Priority Applications (11)
| Application Number | Priority Date | Filing Date | Title |
|---|---|---|---|
| JP2021539978A JP2022516991A (en) | 2019-01-09 | 2020-01-09 | Multiplex assay and how to use it |
| AU2020206137A AU2020206137A1 (en) | 2019-01-09 | 2020-01-09 | Multiplexed assay and methods of use thereof |
| SG11202106410VA SG11202106410VA (en) | 2019-01-09 | 2020-01-09 | Multiplexed assay and methods of use thereof |
| US17/422,051 US20220120765A1 (en) | 2019-01-09 | 2020-01-09 | Multiplexed assay and methods of use thereof |
| CN202080008688.1A CN113302702A (en) | 2019-01-09 | 2020-01-09 | Multiplexed assays and methods of use thereof |
| EP20739219.2A EP3909063A4 (en) | 2019-01-09 | 2020-01-09 | Multiplexed assay and methods of use thereof |
| BR112021012352A BR112021012352A2 (en) | 2019-01-09 | 2020-01-09 | Multiplexed assay and its methods of use |
| KR1020217023965A KR20210127145A (en) | 2019-01-09 | 2020-01-09 | Multiple assays and how to use them |
| CA3124123A CA3124123A1 (en) | 2019-01-09 | 2020-01-09 | Multiplexed assay and methods of use thereof |
| MX2021007951A MX2021007951A (en) | 2019-01-09 | 2020-01-09 | Multiplexed assay and methods of use thereof. |
| IL284475A IL284475A (en) | 2019-01-09 | 2021-06-29 | Multiplexed assay and methods of use thereof |
Applications Claiming Priority (2)
| Application Number | Priority Date | Filing Date | Title |
|---|---|---|---|
| US201962790290P | 2019-01-09 | 2019-01-09 | |
| US62/790,290 | 2019-01-09 |
Publications (1)
| Publication Number | Publication Date |
|---|---|
| WO2020146652A1 true WO2020146652A1 (en) | 2020-07-16 |
Family
ID=71521111
Family Applications (1)
| Application Number | Title | Priority Date | Filing Date |
|---|---|---|---|
| PCT/US2020/012959 WO2020146652A1 (en) | 2019-01-09 | 2020-01-09 | Multiplexed assay and methods of use thereof |
Country Status (12)
| Country | Link |
|---|---|
| US (1) | US20220120765A1 (en) |
| EP (1) | EP3909063A4 (en) |
| JP (1) | JP2022516991A (en) |
| KR (1) | KR20210127145A (en) |
| CN (1) | CN113302702A (en) |
| AU (1) | AU2020206137A1 (en) |
| BR (1) | BR112021012352A2 (en) |
| CA (1) | CA3124123A1 (en) |
| IL (1) | IL284475A (en) |
| MX (1) | MX2021007951A (en) |
| SG (1) | SG11202106410VA (en) |
| WO (1) | WO2020146652A1 (en) |
Cited By (2)
| Publication number | Priority date | Publication date | Assignee | Title |
|---|---|---|---|---|
| US11085935B2 (en) | 2018-05-03 | 2021-08-10 | Washington University | Methods of treating based on site-specific tau phosphorylation |
| WO2022115705A3 (en) * | 2020-11-30 | 2022-07-21 | Enigma Biointelligence, Inc. | Non-invasive assessment of alzheimer's disease |
Citations (2)
| Publication number | Priority date | Publication date | Assignee | Title |
|---|---|---|---|---|
| US20150212098A1 (en) * | 2012-09-10 | 2015-07-30 | The Johns Hopkins University | Diagnostic assay for alzheimer's disease |
| US20150254421A1 (en) * | 2012-11-20 | 2015-09-10 | Washington University | Methods of diagnosing amyloid pathologies using analysis of amyloid-beta enrichment kinetics |
-
2020
- 2020-01-09 CA CA3124123A patent/CA3124123A1/en active Pending
- 2020-01-09 WO PCT/US2020/012959 patent/WO2020146652A1/en unknown
- 2020-01-09 EP EP20739219.2A patent/EP3909063A4/en active Pending
- 2020-01-09 KR KR1020217023965A patent/KR20210127145A/en unknown
- 2020-01-09 SG SG11202106410VA patent/SG11202106410VA/en unknown
- 2020-01-09 AU AU2020206137A patent/AU2020206137A1/en active Pending
- 2020-01-09 BR BR112021012352A patent/BR112021012352A2/en unknown
- 2020-01-09 CN CN202080008688.1A patent/CN113302702A/en active Pending
- 2020-01-09 JP JP2021539978A patent/JP2022516991A/en active Pending
- 2020-01-09 US US17/422,051 patent/US20220120765A1/en active Pending
- 2020-01-09 MX MX2021007951A patent/MX2021007951A/en unknown
-
2021
- 2021-06-29 IL IL284475A patent/IL284475A/en unknown
Patent Citations (2)
| Publication number | Priority date | Publication date | Assignee | Title |
|---|---|---|---|---|
| US20150212098A1 (en) * | 2012-09-10 | 2015-07-30 | The Johns Hopkins University | Diagnostic assay for alzheimer's disease |
| US20150254421A1 (en) * | 2012-11-20 | 2015-09-10 | Washington University | Methods of diagnosing amyloid pathologies using analysis of amyloid-beta enrichment kinetics |
Non-Patent Citations (2)
| Title |
|---|
| IGOR O. KOROLEV, SYMONDS LAURA L., BOZOKI ANDREA C.: "Predicting Progression from Mild Cognitive Impairment to Alzheimer's Dementia Using Clinical, MRI, and Plasma Biomarkers via Probabilistic Pattern Classification", PLOS ONE., vol. 11, no. 2, 22 February 2016 (2016-02-22), pages e0138866, XP055724447 * |
| See also references of EP3909063A4 * |
Cited By (3)
| Publication number | Priority date | Publication date | Assignee | Title |
|---|---|---|---|---|
| US11085935B2 (en) | 2018-05-03 | 2021-08-10 | Washington University | Methods of treating based on site-specific tau phosphorylation |
| US11402392B2 (en) | 2018-05-03 | 2022-08-02 | Washington University | Methods of treating based on site-specific tau phosphorylation |
| WO2022115705A3 (en) * | 2020-11-30 | 2022-07-21 | Enigma Biointelligence, Inc. | Non-invasive assessment of alzheimer's disease |
Also Published As
| Publication number | Publication date |
|---|---|
| CN113302702A (en) | 2021-08-24 |
| CA3124123A1 (en) | 2020-07-16 |
| EP3909063A1 (en) | 2021-11-17 |
| EP3909063A4 (en) | 2022-11-16 |
| IL284475A (en) | 2021-08-31 |
| AU2020206137A1 (en) | 2021-07-08 |
| KR20210127145A (en) | 2021-10-21 |
| JP2022516991A (en) | 2022-03-03 |
| US20220120765A1 (en) | 2022-04-21 |
| BR112021012352A2 (en) | 2021-11-09 |
| MX2021007951A (en) | 2021-08-18 |
| SG11202106410VA (en) | 2021-07-29 |
Similar Documents
| Publication | Publication Date | Title |
|---|---|---|
| Lewczuk et al. | Cerebrospinal fluid and blood biomarkers for neurodegenerative dementias: An update of the Consensus of the Task Force on Biological Markers in Psychiatry of the World Federation of Societies of Biological Psychiatry | |
| Suárez‐Calvet et al. | Novel tau biomarkers phosphorylated at T181, T217 or T231 rise in the initial stages of the preclinical Alzheimer’s continuum when only subtle changes in Aβ pathology are detected | |
| Nakamura et al. | High performance plasma amyloid-β biomarkers for Alzheimer’s disease | |
| Meyer et al. | Plasma p‐tau231, p‐tau181, PET biomarkers, and cognitive change in older adults | |
| TWI788704B (en) | Method of analyzing sample from subject | |
| Hu et al. | Biomarker discovery for Alzheimer’s disease, frontotemporal lobar degeneration, and Parkinson’s disease | |
| JP7301394B2 (en) | Diagnostic and therapeutic methods based on site-specific tau phosphorylation | |
| Beyer et al. | Amyloid‐beta misfolding and GFAP predict risk of clinical Alzheimer's disease diagnosis within 17 years | |
| US20220120765A1 (en) | Multiplexed assay and methods of use thereof | |
| Marques et al. | Identification of cerebrospinal fluid biomarkers for parkinsonism using a proteomics approach | |
| US20220299527A1 (en) | Methods to detect mtbr tau isoforms and use thereof | |
| Greco et al. | Direct analytical sample quality assessment for biomarker investigation: qualifying cerebrospinal fluid samples | |
| Zecca et al. | Plasma β-amyloid1–42 reference values in cognitively normal subjects | |
| Choi et al. | Endogenous Aβ peptide promote Aβ oligomerization tendency of spiked synthetic Aβ in Alzheimer's disease plasma | |
| Liu et al. | Development of a high-sensitivity method for the measurement of human nasal Aβ 42, Tau, and phosphorylated Tau | |
| WO2006108051A2 (en) | Compositions and methods relating to alzheimer's disease | |
| Manzine et al. | BACE1 levels are increased in plasma of Alzheimer's disease patients compared with matched cognitively healthy controls | |
| Veenstra | Neuroproteomic tools for battling Alzheimer's disease | |
| EP3361257B1 (en) | Method and kit for diagnosing alzheimer's disease using g72 protein and slc7a11 mrna as biomarkers | |
| Liu et al. | Periphery biomarkers for objective diagnosis of cognitive decline in type 2 diabetes patients | |
| Gaetani et al. | Required improvements for cerebrospinal fluid-based biomarker tests of Alzheimer’s disease | |
| US20210255201A1 (en) | Blood-based methods for determing a-beta amyloidosis | |
| WO2023220276A1 (en) | METHODS TO DETECT Aβ PROTEOFORMS AND USE THEREOF | |
| US20230280357A1 (en) | Csf phosphorylated tau and amyloid beta profiles as biomarkers of tauopathies | |
| Blennow | Development of Fluid Biomarkers for Alzheimer’s Disease |
Legal Events
| Date | Code | Title | Description |
|---|---|---|---|
| 121 | Ep: the epo has been informed by wipo that ep was designated in this application |
Ref document number: 20739219 Country of ref document: EP Kind code of ref document: A1 |
|
| ENP | Entry into the national phase |
Ref document number: 3124123 Country of ref document: CA |
|
| ENP | Entry into the national phase |
Ref document number: 2021539978 Country of ref document: JP Kind code of ref document: A Ref document number: 2020206137 Country of ref document: AU Date of ref document: 20200109 Kind code of ref document: A |
|
| NENP | Non-entry into the national phase |
Ref country code: DE |
|
| REG | Reference to national code |
Ref country code: BR Ref legal event code: B01A Ref document number: 112021012352 Country of ref document: BR |
|
| ENP | Entry into the national phase |
Ref document number: 2020739219 Country of ref document: EP Effective date: 20210809 |
|
| REG | Reference to national code |
Ref country code: BR Ref legal event code: B01E Ref document number: 112021012352 Country of ref document: BR Free format text: COM BASE NA PORTARIA 405 DE 21/12/2020, SOLICITA-SE QUE SEJA APRESENTADO, EM ATE 60 (SESSENTA) DIAS, NOVO CONTEUDO DE LISTAGEM DE SEQUENCIA POIS O CONTEUDO APRESENTADO NA PETICAO NO 870210056165 DE 22/06/2021 POSSUI INFORMACOES DIVERGENTES AO PEDIDO EM QUESTAO. DEVERA SER INCLUIDO O CAMPO 140 / 141 UMA VEZ QUE O DEPOSITANTE JA POSSUI O NUMERO DO PEDIDO NO BRASIL |
|
| ENP | Entry into the national phase |
Ref document number: 112021012352 Country of ref document: BR Kind code of ref document: A2 Effective date: 20210622 |