WO2020110649A1 - アンテナ設計支援装置、アンテナ設計支援プログラム及びアンテナ設計支援方法 - Google Patents
アンテナ設計支援装置、アンテナ設計支援プログラム及びアンテナ設計支援方法 Download PDFInfo
- Publication number
- WO2020110649A1 WO2020110649A1 PCT/JP2019/043652 JP2019043652W WO2020110649A1 WO 2020110649 A1 WO2020110649 A1 WO 2020110649A1 JP 2019043652 W JP2019043652 W JP 2019043652W WO 2020110649 A1 WO2020110649 A1 WO 2020110649A1
- Authority
- WO
- WIPO (PCT)
- Prior art keywords
- antenna
- performance
- design support
- data
- support device
- Prior art date
- Legal status (The legal status is an assumption and is not a legal conclusion. Google has not performed a legal analysis and makes no representation as to the accuracy of the status listed.)
- Ceased
Links
Images










Classifications
-
- G—PHYSICS
- G06—COMPUTING OR CALCULATING; COUNTING
- G06F—ELECTRIC DIGITAL DATA PROCESSING
- G06F30/00—Computer-aided design [CAD]
- G06F30/20—Design optimisation, verification or simulation
- G06F30/27—Design optimisation, verification or simulation using machine learning, e.g. artificial intelligence, neural networks, support vector machines [SVM] or training a model
-
- G—PHYSICS
- G06—COMPUTING OR CALCULATING; COUNTING
- G06F—ELECTRIC DIGITAL DATA PROCESSING
- G06F30/00—Computer-aided design [CAD]
- G06F30/10—Geometric CAD
-
- H—ELECTRICITY
- H01—ELECTRIC ELEMENTS
- H01Q—ANTENNAS, i.e. RADIO AERIALS
- H01Q1/00—Details of, or arrangements associated with, antennas
- H01Q1/12—Supports; Mounting means
- H01Q1/1271—Supports; Mounting means for mounting on windscreens
Definitions
- the present invention relates to an antenna design support device, an antenna design support program, and an antenna design support method that support antenna design.
- Patent Document 1 discloses a technique for obtaining good reception characteristics of a terrestrial digital television (DTV) by using an antenna configured with a relatively simple pattern as an antenna for a vehicle.
- DTV terrestrial digital television
- An auxiliary antenna element is arranged.
- antenna design largely depends on human experience, and it is often difficult for an unskilled person to perform optimum antenna design. In addition, even a skilled person often requires a great deal of time and effort to design an antenna.
- the present invention has been made in view of the above, and it is easy to design an antenna that can be attached to a vehicle antenna, a building such as a building (for example, a glass surface), and various other electronic devices. It is an object of the present invention to obtain an antenna design support device, an antenna design support program, and an antenna design support method.
- an antenna design support device is an antenna design support device that supports antenna design, wherein the shape of the antenna is pixel data represented by a plurality of pixels.
- An antenna performance prediction unit that predicts the antenna performance based on a plurality of the pixel data by using a deep learning convolutional neural network with a set of the antenna performance data indicating the antenna performance as training data.
- FIG. 1 for explaining the DNN (Deep Neural Network) model
- FIG. 2 is a diagram for explaining the DNN model.
- FIG. 5 is a diagram for explaining a learning condition of the DNN model and a parameter error obtained by performing deep learning according to the learning condition.
- FIG. 10 is a diagram showing variations in predicted values with respect to actual measured values shown in FIG. 7 is a flowchart showing a procedure for supporting antenna design in the antenna design support device 100 according to the present embodiment.
- the figure for demonstrating an example of the pixel data which shows an antenna shape.
- the figure which is an example of the pixel data 50 which is training data and the antenna performance data collected by the three-dimensional electromagnetic field analysis simulator.
- Diagram showing design example of CNN (Convolutional Neural Network) model The figure which shows the prediction accuracy by a CNN model when changing the number of training data.
- FIG. 1 for demonstrating the prediction result of the antenna performance output by inputting the shape data of an unknown antenna to the learned CNN model.
- FIG. 2 is a diagram for explaining a prediction result of antenna performance output by inputting shape data of a plurality of antennas to the CNN model learned in step S14. Diagram for explaining the operation of the antenna extraction unit
- the figure which shows the antenna performance when the L-shaped antenna pattern shown in FIG. 23 is finely adjusted.
- the antenna design support device, antenna design support program, and antenna design support method according to the embodiment of the present invention will be described in detail below with reference to the drawings.
- the case where the antenna is provided on the glass provided in the vehicle body will be described in detail, but the present invention is not limited to the vehicle body antenna.
- FIG. 1 is a configuration diagram of an antenna design support device according to an embodiment of the present invention.
- the antenna design support device 100 according to the present embodiment is a device that supports the design of an antenna provided on a glass included in a vehicle body of an automobile or the like and an antenna provided near the glass with a certain distance from the glass.
- a display 200 is connected to the antenna design support device 100.
- the antenna design support device 100 is realized, for example, by installing a program for supporting the design of an antenna in a computer.
- the design of an antenna means the thickness, length, and length of a conductor (hereinafter also referred to as “antenna conductor”) that configures the antenna so that it has desired transmission and reception characteristics after the antenna is provided on the glass of a vehicle such as an automobile. This is an operation to optimize the position on the glass.
- the outline of the antenna design will be described with reference to FIGS. 2 and 3 described later.
- the program may be, for example, recorded in a recording medium and installed in the computer from the recording medium, or may be stored in a storage device connected to a network, a network storage, or the like in an externally accessible state, and requested. It may be installed after being downloaded to the computer.
- the computer may be a workstation, a personal computer, or the like, or may be a server connected to these via a network. Note that this embodiment describes a structural example of the antenna design support device 100 which assists the design of an antenna provided on glass, but the antenna is limited to one having a two-dimensional pattern provided on the main surface of the glass. Instead, it may be provided in the vicinity of the glass at a certain distance from the glass and may have a three-dimensional pattern.
- antenna design may be referred to as “antenna design”. Details of the configuration of the antenna design support device 100 will be described later. Note that the above-mentioned “two-dimensional pattern” includes, for example, a pattern of an antenna that is provided along a gentle curved surface in a glass included in a vehicle body.
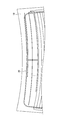
- FIG. 2 is a diagram showing an example of the shape of an antenna provided on the main surface of the rear glass of an automobile.
- the antenna 20 is shown by a thick solid line.
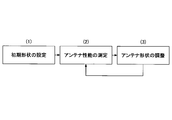
- FIG. 3 is a diagram showing a rough flow of antenna design.
- antenna design includes three steps: (1) initial shape setting, (2) antenna performance measurement, and (3) antenna shape adjustment.
- the shape of the antenna 20 as shown in FIG. 2 is determined by making use of the electromagnetic theory, the accumulated design database, human experience, and the like.
- a measuring device is used in the measurement of the antenna performance of (2). By improving the calculation capability of the measuring device, the measuring time can be shortened and more accurate measurement can be performed.
- the index indicating the antenna performance there are an antenna gain, a return loss, a directional characteristic (half-value angle, front-back ratio (F/B)), and the like.
- the length of the antenna conductor, the antenna, the antenna conductor length, the antenna, etc. are used so that the measured antenna performance satisfies a desired target value by utilizing the electromagnetic theory, the accumulated design database, and human experience.
- the position of the conductor is adjusted.
- the work of adding an antenna conductor is also performed. What is indicated by a chain line in FIG. 2 is the added antenna conductor.
- the antenna performance in (2) is measured again. As described above, in antenna design, the antenna performance is often measured and the antenna shape is adjusted multiple times.
- the antenna design support device 100 is configured to predict the antenna performance using a machine-learned multilayer neural network in order to facilitate antenna design.
- the antenna design support device 100 includes an information storage unit 1, a pixel data output unit 2, an antenna performance prediction unit 3, an antenna extraction unit 4, and an antenna performance display.
- the unit 5 and the display control unit 6 are provided.
- the antenna performance prediction unit 3 is a multilayer neural network having a certain level of prediction performance (performance for predicting antenna performance) for an unknown antenna shape. This multi-layer neural network has been subjected to machine learning (deep learning) in advance using training data composed of a known antenna shape and a corresponding antenna performance data set.
- the results of verifying whether or not the antenna performance can be predicted using the multilayer neural network will be described with reference to FIGS. 4 to 11.
- a design example of a multilayer neural network provided in the antenna design support device 100 and an operation of deep learning for the multilayer neural network will be described. Further, the configuration and operation (antenna performance prediction, antenna extraction, etc.) of the antenna design support apparatus 100 using the learned neural network will be described in order.
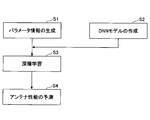
- FIG. 4 is a flowchart showing the procedure for verifying the predictability of antenna performance using a multilayer neural network.
- a DNN Deep Neural Network
- parameter information indicating the antenna shape required for deep learning is generated (step S1), and a DNN model is created in parallel with the generation of parameter information (step S2).
- the DNN is a multi-layered structure of an algorithm designed for pattern recognition using a human or animal cranial nerve circuit as a model. Deep learning is performed by giving parameter information to the created DNN model (step S3), and antenna performance is predicted using the learned DNN model (step S4).
- FIG. 5 is a diagram showing an example of an antenna pattern serving as a model of the parameter information generated in step S1.
- FIG. 5 shows the glass 10 provided in the vehicle and the antenna pattern 20A provided on the glass 10.
- the portion indicated by the solid line illustrates the actual antenna shape
- the portion indicated by the broken line illustrates the portion that can be added as the antenna shape.
- the antenna pattern 20A is formed by printing a paste containing a metal such as silver paste on a glass surface and baking the paste, or a linear or foil-like body made of a conductive substance such as copper is attached to the glass surface with an adhesive. It is a conductor used for transmitting and receiving radio waves, which is formed by pasting with, for example, or sandwiched between two glass plates constituting a laminated glass.
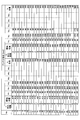
- FIG. 6A is a diagram showing an example of the parameter information generated in step S1.
- FIG. 6B is a diagram showing an example of the parameter information generated in step S1.
- the parameter information shown in FIGS. 6A and 6B is associated with a variable element that affects the antenna performance and a value that indicates the antenna performance.
- the variable elements include information indicating the antenna shape and information indicating the measurement conditions.
- the information indicating the antenna shape corresponds to the antenna pattern 20A shown in FIG. 5. For example, the position of the feeding point 21 at which the routing of the antenna conductor is started, the conductor portion of the antenna conductor that extends linearly in one direction. (Each), the number of times the antenna conductor is bent, the total length of the antenna conductor, and the like.
- the information indicating the measurement conditions is, for example, the glass configuration, the presence/absence of implementation in a test vehicle, the presence/absence of implementation in a dark room, and the like.
- the information indicating the antenna performance is, for example, the average value or the minimum value of the frequency band received by the antenna.
- the antenna pattern 20A has various types depending on the type of vehicle, the shape of glass, and the like, and thus is created for each type.
- FIG. 7 is a first diagram for explaining the DNN model.
- the DNN model is created by describing the DNN code using a development language “Python”, a Google statistical calculation library “Tensorflow”, a neural net library “Keras”, and the like.
- FIG. 8 is a second diagram for explaining the DNN model.
- the DNN model illustrated in FIG. 8 has an input layer, an intermediate layer called a hidden layer, and an output layer.
- the DNN model adopts a structure in which the number of intermediate layers is increased to form a multilayer structure.
- the number of neurons in the input layer is 12
- the number of neurons in the output layer is 1
- the number of intermediate layers is 3, and the number of neurons in the intermediate layer is 20.
- the method of connecting neurons (nodes) is called full connection.
- a ramp function "ReLU”, a linear function "Linear”, etc. are used as the activation function.
- the activation function means a non-linear function or an identity function that is applied after performing a linear transformation in the neural network.
- FIG. 9 is a diagram for explaining the learning condition of the DNN model and the parameter error obtained by deep learning according to the learning condition.
- the learning conditions of the DNN model are shown on the upper side of FIG.
- the number of data batches, the number of learning epochs, and the number of test data, which are learning conditions are adjusted as shown in FIG.
- the number of data batches is 20
- the number of learning epochs is 2500
- the number of test data is 5% of the learning data.
- a graph showing the parameter error is shown on the lower side of FIG.
- the horizontal axis of the graph represents the learning epoch number (epoch), and the vertical axis of the graph represents the error (parameter error: loss) between the predicted value predicted by deep learning and the actual measurement value.
- the dotted line is the training data (train data) used to train the model, and the solid line is the test data (test data) for checking whether the program is proceeding properly.
- some data groups for example, 266 data
- the remaining data groups correspond to test data. From the graph of FIG. 9, it can be seen that the parameter error converges as the number of learning increases. This indicates that machine learning is proceeding properly.
- FIG. 10 is a diagram showing a result of predicting antenna performance using the DNN model learned in step S3.
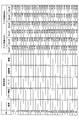
- the horizontal axis of FIG. 10 represents the data number, and the number of verification data is 31 here.
- the vertical axis of FIG. 10 indicates the antenna performance (here, band average gain).
- the chain line is a predicted value predicted using the DNN model, and is a plot of 31 pieces of verification data shown in FIG. 9. That is, the chain line in FIG. 10 shows the result of the learned DNN model predicting the antenna performance for the antenna shape that is not used at all in the deep learning process of step S3.
- the solid line is the actual measurement value of the performance for each antenna shape measured by the measuring device connected to the actual antenna, and is the plot of the actual measurement data corresponding to each of the 31 pieces of verification data. It can be seen from the graph of FIG. 10 that the predicted value is close to the measured value.
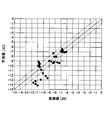
- FIG. 11 is a diagram showing the variation of the predicted value with respect to the actually measured value shown in FIG.
- the horizontal axis of FIG. 11 represents the actual measurement value
- the vertical axis of FIG. 11 represents the predicted value.
- a solid diagonal line represents a line where the actual measurement value and the predicted value match, and a range surrounded by a dashed diagonal line indicates a region where the predicted value is ⁇ 1 dB with respect to the actual measurement value.
- the band average gain predicted using the DNN model after learning is distributed in the range of approximately ⁇ 1 dB from the actual measurement value. That is, it is understood that the antenna performance can be accurately predicted by using the learned neural network. From this, the learned neural network can be effectively used for antenna design support.
- the following will describe the configuration of the antenna design support device 100 according to the present embodiment that utilizes a neural network.
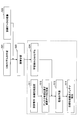
- FIG. 12 is a flowchart showing a procedure for supporting antenna design in the antenna design support device 100 according to this embodiment.
- design requirements and target performance are set for the antenna design support device 100.
- the design requirements are, for example, constraints on the area where the antenna conductor can be arranged on the glass surface and constraints on the shape of the antenna conductor.
- the target performance is a numerical target of performance indicators such as antenna gain, return loss, and directional characteristics (half-value angle, front-back ratio (F/B)).
- antenna image data representing an antenna shape that satisfies the design requirements is generated.
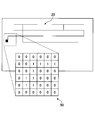
- the antenna image data is, for example, pixel data indicating an antenna shape composed of a plurality of pixels arranged two-dimensionally as shown in FIG.
- pixel data composed of a plurality of pixels arranged two-dimensionally is used instead of the parameter information described above.
- Pixel data 50 indicating the shape of the antenna is shown on the lower side of FIG.
- the pixel data 50 is data in which the shape of the antenna 20 shown on the upper side of FIG. 13 is represented by a plurality of pixels which are two-dimensionally arranged.
- the pixel value of the portion where the antenna 20 exists is “1”
- the pixel value of the portion where the antenna 20 does not exist is “0”.
- the pixel data is generated using the pixel data output unit 2 shown in FIG. 1, for example.
- the number of training data increases as the size of one pixel decreases, and it is easy to obtain high prediction accuracy by the CNN model, but the CNN model tends to be large-scale.
- the pixel data 50 may be set to have a pixel size that does not significantly reduce the prediction accuracy of the CNN model and does not increase the size unnecessarily.
- step S13 the pixel data described above is input to a learned CNN model described later, and the performance of the antenna represented by the pixel data is predicted.
- step S14 it is determined whether or not the performance predicted in step S13 satisfies the target performance, and an antenna that satisfies the target performance is extracted.
- a convolutional neural network (CNN) model is used as a neural network for predicting the performance from the shape of the antenna.
- CNN is a forward-propagation neural network widely used as a DNN model suitable for processing two-dimensional information.
- the CNN performs a convolution operation using a filter on pixel data of a plurality of pixels that are two-dimensionally arranged, and detects a spatial feature (for example, edge feature) of image data.
- the antenna design support apparatus 100 creates a CNN model that receives the two-dimensionally arrayed pixel data as an input and outputs a one-dimensional array for storing the performance prediction value at each reception frequency of the antenna.
- CNN model training data is collected.
- the training data is a plurality of data sets in which the shape of the antenna and the performance of the antenna are associated with each other, and may be data quoted from past experimental data or data generated by a three-dimensional electromagnetic field analysis simulator.
- the training data may be stored in the information storage unit 1 or read from an external medium or the like.
- step S23 deep learning of the CNN model is performed using the training data collected in step S22.
- step S24 as a result of deep learning, a CNN model whose internal parameters are optimized for antenna performance prediction is generated. This is called a learned CNN model.
- the antenna design support device 100 can support the antenna design by using the learned CNN model.
- FIG. 14 is a diagram showing an example of the pixel data 50, which is training data, and the antenna performance data collected by the three-dimensional electromagnetic field analysis simulator.
- An antenna-shaped image is shown on the left side of FIG.
- the image of this antenna shape is created by, for example, "Python".
- 4,802 antenna-shaped images are created.
- the antenna-shaped image is created as the pixel data 50 shown on the lower side of FIG.
- antenna performance data corresponding to each of the 4,802 antenna-shaped images is shown.
- a set of these pixel data 50 and antenna performance data becomes training data, and 4,802 training data are created.
- FIG. 15 is a diagram showing a design example of the CNN model.
- FIG. 15 shows an example of designing a CNN model using "Python".
- the potential of the CNN model is determined by the hierarchical structure of the network, the connection condition between the network layers, the setting of the activation function of each network layer, and the like.
- model building, performance verification, and structural improvement are repeated several times.
- the structural improvement for example, the value indicating the fully connected layer (Dense) is changed from 0.5 to 0.0, the activation function (Activation) is changed from the linear function “Linear” to the ramp function “ReLU”, and the convolution is performed.
- One layer “Conv2D” is added.
- Training data and CNN model are created in the processes up to this point, and deep learning is executed in the next process (step S23).
- deep learning for a CNN model for the purpose of general image recognition learning is performed with a data set in which a large amount of image data is associated with classification labels of the images as training data.
- Learning refers to the task of applying certain image data to a CNN model to perform image classification, and when the result is different from the correct label, updating the value of the internal parameter of the CNN model so that the result approaches the correct label. ..
- the CNN model can gradually classify unknown images with high accuracy.
- the image recognition technology based on deep learning is disclosed in, for example, Japanese Patent Application Laid-Open No.
- the inventor of the present application performs deep learning on a CNN model with pixel data representing the antenna shape and a large number of training data consisting of the antenna performance, so that the CNN model can accurately predict the antenna performance for an unknown antenna shape. I found that. That is, the inventor of the present application learns the extraction of the spatial feature of the antenna shape represented by the pixel data and the antenna performance prediction considering the degree of influence of the feature on the antenna performance from the CNN model from a large number of training data. I found that it can be done.
- the final capability (prediction accuracy) of the CNN model is determined by the setting conditions for learning execution.
- the main setting conditions are the number of training data, the batch size and the number of epochs.
- the batch size is the number of training data used for one weight update calculation.
- the number of epochs is the number of repetitions of learning using the training data.
- FIG. 16 is a diagram showing the prediction accuracy by the CNN model when the number of training data is changed.
- the horizontal axis in FIG. 16 represents the number of learning data (Datanum).
- the graph indicated by square points represents an error (Error) between the antenna performance prediction value and the actual measurement value by the learned CNN model.
- the graph indicated by a circle represents the correlation (Correlation) between the predicted antenna performance value and the actually measured value according to the learned CNN model. According to FIG. 16, it can be seen that the prediction accuracy improves as the number of learning data increases.
- FIG. 17 is a diagram showing the prediction accuracy by the CNN model when the batch size is changed.
- the horizontal axis of FIG. 17 represents the batch size (Batch).
- the graph indicated by square points represents an error (Error) between the antenna performance prediction value and the actual measurement value by the learned CNN model.
- the graph indicated by a circle represents the correlation (Correlation) between the predicted antenna performance value and the actually measured value according to the learned CNN model. It can be seen from FIG. 17 that the prediction accuracy improves as the batch size decreases.
- FIG. 18 is a diagram showing the prediction accuracy by the CNN model when the number of epochs is changed.
- the horizontal axis of FIG. 18 represents the number of epochs (Epoch).
- the graph indicated by square points represents an error (Error) between the antenna performance prediction value and the actual measurement value by the learned CNN model.
- the graph indicated by a circle represents the correlation (Correlation) between the predicted antenna performance value and the actually measured value according to the learned CNN model. It can be seen from FIG. 18 that the prediction accuracy improves as the number of epochs increases.
- the trained CNN model is given image data of an unknown antenna shape, that is, the antenna pattern that does not match any of the training data of 4,802, and the performance of the antenna based on the pattern is predicted, and the predicted value and the measured value are compared. As a result, the results shown in FIGS. 19 and 20 were obtained.
- FIG. 19 is a first diagram for explaining the prediction result of the antenna performance output by inputting the unknown antenna shape data to the learned CNN model.
- FIG. 19 shows an unknown antenna pattern extending in a predetermined direction from the feeding point 21 shown in FIG. 5, for example, and the horizontal axis of FIG. 19 indicates the length of the antenna conductor extending in the horizontal direction of the rear glass of the automobile, for example. Represents.
- the vertical axis of FIG. 19 represents, for example, the length of the antenna conductor extending in the vertical direction of the rear glass of the automobile.
- FIG. 20 is a second diagram for explaining the prediction result of the antenna performance output by inputting the shape data of the unknown antenna to the CNN model already trained in step S14.
- FIG. 20 shows the actual measurement value and the predicted value corresponding to the antenna pattern shown in FIG.
- the horizontal axis of FIG. 20 represents frequency, and the vertical axis of FIG. 20 represents antenna gain.
- the graph shown by the square points is the predicted value (AI predicted) predicted by the learned CNN model, and the graph shown by the circle points is the measured value (True Data). As is clear from FIG. 20, it was found that the predicted value of the antenna performance predicted by the learned CNN model substantially matches the measured value.
- the result of comparing the predicted value of the antenna performance predicted by the learned model with the measured value for the image data of 48,549 unknown antenna shapes in the learned CNN model The mean square error of the difference between the predicted value and the measured value at each frequency was 1.63 dB. Further, as a result of calculating the correlation coefficient between the predicted value and the actually measured value, the calculation result of the correlation coefficient was 0.94. This shows that the trained CNN model can predict the performance with sufficient accuracy for an unknown antenna shape.
- step S14 the operation (step S14) of extracting the antenna whose predicted value of the antenna performance matches the target performance by the antenna extraction unit 4 shown in FIG. 1 will be described with reference to FIG.
- FIG. 21 is a diagram for explaining the operation of the antenna extraction unit.
- the 26,800th to the 27,800th The antenna gain (predicted value of antenna performance) of is extracted and shown as points.
- the horizontal axis of FIG. 21 represents the antenna number.
- the vertical axis of FIG. 21 represents the antenna gain.
- the broken line represents the target value of the antenna performance.
- the target value is set in consideration of the prediction accuracy level of the CNN model.
- the antenna extraction unit 4 automatically selects, from among the plurality of antennas whose antenna performance is predicted by the antenna performance prediction unit 3, a predicted antenna performance value that exceeds the target value of the antenna performance, that is, an antenna that meets the required specifications of the antenna. To extract.
- the antenna design support device 100 can present a plurality of patterns that are likely to meet the required specifications to the antenna designer. That is, the antenna designer can obtain an antenna pattern having a high possibility of satisfying the required specifications only by setting the required specifications in the antenna design support device 100, and the work of designing the antenna becomes extremely easy as compared with the conventional case.
- the time taken from setting antenna design requirements to presenting a plurality of candidate antenna patterns that satisfy the required specifications. was about 20 minutes.
- the antenna design support device 100 may be configured to display the antenna performance of the antenna pattern handwritten on the screen of the display device 200 in real time on the screen. That is, step S12 of the antenna design support device 100 may be generated by handwriting input by a person, and step S14 may be extracted by a person's judgment. This configuration example will be specifically described with reference to FIGS. 22 to 24.
- FIG. 22 is a diagram showing an example of a first screen on which an antenna pattern input by handwriting is displayed and a second screen on which the antenna performance predicted by the antenna performance prediction unit 3 is displayed.
- the display device 200 is provided with a screen 201 such as a liquid crystal display or a touch panel.
- the two first screen 201a and second screen 201b shown in FIG. 22 are different from each other in that the screen 201 is a two-screen display in order to display different contents.
- a point 220 (for example, the feeding point 21 shown in FIG. 5) at which the drawing of the antenna pattern is started is shown. It should be noted that in FIG. 22, a point 220 is displayed for the sake of convenience in order to describe the location where the drawing of the antenna pattern is started, but the display of the point 220 is not always necessary.
- FIG. 23 is a diagram showing the shape of the antenna pattern at which handwriting input is started on the first screen shown in FIG. 22 and the antenna performance reflected on the second screen.
- a drag operation is started from a point 220 with a mouse or the like, and, for example, the pointer 210 is moved to the upper side of the first screen 201a by several cm, and then the pointer 210 is moved to the right by several cm.
- an L-shaped antenna pattern 230 (having a predetermined conductor width) is drawn on the first screen 201a.
- the antenna performance prediction unit 3 estimates the antenna performance corresponding to the antenna pattern 230 drawn on the first screen 201a.
- the antenna performance corresponding to the antenna pattern 230 during the drag operation that is, the predicted value of the antenna performance estimated by the antenna performance prediction unit 3 is visualized and displayed in real time.
- the display control unit 6 controls the display of the predicted value of the antenna performance on the second screen 201b.
- the target value of the antenna performance is displayed on the second screen 201b by the display control unit 6 reading the target value stored in advance.
- FIG. 24 is a diagram showing the antenna performance when the L-shaped antenna pattern shown in FIG. 23 is finely adjusted.
- the pointer 210 is moved downward by about several cm above the first screen 201a.
- a C-shaped antenna pattern 230 (having a predetermined conductor width) is drawn on the first screen 201a.
- the antenna performance corresponding to the C-shaped antenna pattern 230 is reflected on the second screen 201b.
- the user can draw the antenna pattern 230 whose antenna performance exceeds the target value, and can immediately reflect the antenna pattern 230 having a shape exceeding the target value on the prototype.
- the user can immediately grasp the antenna performance predicted from the antenna pattern 230 while drawing the antenna pattern 230. Therefore, the antenna designer can easily estimate the antenna performance predicted from the antenna pattern 230, and can significantly reduce the lead time required for trial manufacture of the antenna. In other words, even an antenna based on conventional trial manufacture and measurement can be designed extremely efficiently based on design and analysis by an electromagnetic field simulator.
- the time required from the handwriting input of the antenna shape to the performance display was 0.1 seconds or less.
- FIG. 25 is a diagram showing a hardware configuration example for realizing the antenna design support apparatus according to the embodiment of the present invention.
- the antenna design support device 100 includes a CPU (Central Processing Unit) 41 that executes various processes, a RAM (Random Access Memory) 42 that includes a program storage area and a data storage area, and a ROM (Read Only Memory) that is a non-volatile memory. 43 and an external storage device 44 that is a storage unit that stores data. Further, the antenna design support device 100 has a communication interface (I/F) 45 with an external device, an input device 46 that receives an input operation by a user, and a GPU (Graphical Processing Unit) used for image processing and deep learning calculation. 47 and a display device 200 for displaying information on various screens. The display device 200 may be provided outside the antenna design support device 100.
- the units shown in FIG. 25 are connected to each other via a bus 48.
- the external storage device 44 is, for example, an SSD (Solid State Drive) or an HDD (Hard Disk Drive), and corresponds to the information storage unit 1 shown in FIG.
- the input device 46 is the above-mentioned mouse, keyboard, or the like.
- the ROM 43 stores programs such as a BIOS (Basic Input/Output System) and a UEFI (Unified Extensible Firmware Interface) for controlling the computer.
- BIOS Basic Input/Output System
- UEFI Unified Extensible Firmware Interface
- a program for the antenna design support device 100 is stored in the ROM 43, and after this program is stored in the RAM 42 and executed by the CPU 41, the pixel data output unit 2, The antenna performance prediction unit 3, the antenna extraction unit 4, the antenna performance display unit 5, and the display control unit 6 are realized.
- the program for the antenna design support device 100 is a program that executes the functions of the pixel data output unit 2 and the like.
- the I/F 45 is used when information is transmitted between the CPU 41 and the display 200 when the display 200 is provided outside the antenna design support device 100.
- pixel data indicating an antenna shape composed of a plurality of pixels which are two-dimensionally arranged is used, but the data is two-dimensionally arranged.
- the pixel data is not limited, and may be, for example, three-dimensionally arrayed pixel data that includes elements in the depth direction in addition to elements in the vertical and horizontal directions of the glass, and further, material characteristics (conductivity, etc.) at positions corresponding to each pixel. It may be four-dimensionally arranged pixel data including the elements of.
- the configuration example of the antenna design support device 100 that estimates the performance of the antenna provided on the glass has been described.
- the antenna design support device 100 is an antenna provided on a medium (dielectric) other than glass. It is also possible to estimate the performance of.
- a set of pixel data in which the shape of the antenna is represented by a plurality of pixels and performance data indicating the antenna performance of the antenna is used as training data
- a deeply learned convolutional neural network it is configured to include an antenna performance prediction unit that predicts antenna performance based on a plurality of pixel data.
- the antenna design support device 100 even when performing antenna design under such an environment, it is possible to immediately estimate the antenna performance by giving the antenna design conditions. Will be able to prototype an antenna pattern after understanding whether or not the design conditions satisfy the required antenna performance. Therefore, the steps (1) to (3) shown in FIG. 3 can be shortened. Further, according to the antenna design support device 100 according to the present embodiment, the result of antenna shape adjustment (antenna performance after adjustment) can be immediately grasped, and therefore the steps (2) and (3) shown in FIG. Can be significantly shortened. As a result, the load required for antenna design is reduced, and efficient, highly accurate and stable evaluation is possible.
- the antenna design support apparatus 100 extracts an antenna from among a plurality of antennas whose antenna performance is predicted by the antenna performance prediction unit, which extracts an antenna whose predicted value of the antenna performance matches the required specifications of the antenna. It is configured to include the section 4. With this configuration, even when a large amount of antenna data is input, one or a plurality of antenna patterns that satisfy desired antenna performance can be immediately extracted. Therefore, it is possible to evaluate the performance of a larger number of antenna patterns, as compared with the conventional case where the antenna patterns are determined by making use of specialized knowledge of electromagnetism and human experience.
- the “Linear” function as the activation function in the antenna design support device 100 according to this embodiment.
- the "Softmax” function a non-linear function that makes the output value fall within "0 to 1"
- the output value becomes “antenna performance (gain or impedance characteristic)”, and it becomes possible to take the output value range from ⁇ to + ⁇ .
- 1 information storage unit 2 pixel data output unit, 3 antenna performance prediction unit, 4 antenna extraction unit, 5 antenna performance display unit, 6 display control unit, 10 glass, 20 antenna, 20A antenna pattern, 21 feeding point, 41 CPU, 42 RAM, 43 ROM, 44 external storage device, 45 I/F, 46 input device, 47 GPU, 48 bus, 50 pixel data, 100 antenna design support device, 200 display, 201 screen, 201a first screen, 201b first screen 2 screens, 210 pointers, 220 points, 230 antenna patterns.
Landscapes
- Engineering & Computer Science (AREA)
- Physics & Mathematics (AREA)
- Theoretical Computer Science (AREA)
- Geometry (AREA)
- General Physics & Mathematics (AREA)
- Evolutionary Computation (AREA)
- General Engineering & Computer Science (AREA)
- Computer Hardware Design (AREA)
- Medical Informatics (AREA)
- Software Systems (AREA)
- Computer Vision & Pattern Recognition (AREA)
- Artificial Intelligence (AREA)
- Computational Mathematics (AREA)
- Mathematical Analysis (AREA)
- Mathematical Optimization (AREA)
- Pure & Applied Mathematics (AREA)
- Variable-Direction Aerials And Aerial Arrays (AREA)
Abstract
車両用のアンテナをはじめ、ビル等の建物(例えば、ガラス面)や、その他に様々な電子機器等に取り付け可能なアンテナの設計を容易化するアンテナ設計支援装置、アンテナ設計支援プログラム及びアンテナ設計支援方法を得ることを目的とする。アンテナ設計支援装置(100)は、アンテナの形状が複数画素で表された画素データとアンテナのアンテナ性能を示す性能データとのセットを訓練データとして深層学習された畳み込みニューラルネットワークを用いて、複数の画素データに基づきアンテナ性能を予測するアンテナ性能予測部(3)を備える。
Description
本発明は、アンテナの設計を支援するアンテナ設計支援装置、アンテナ設計支援プログラム及びアンテナ設計支援方法に関する。
所定の周波数帯の電波を送受するアンテナでは、所望の特性(利得)となるようにアンテナの形状、配置などを最適化することが重要である。特許文献1には、車両用のアンテナとして、比較的簡単なパターンで構成されるアンテナを利用して良好な地上波デジタルテレビ(DTV)の受信特性を得る技術が開示される。特許文献1に開示される技術によれば、第1、第2及び第3の線状導体で構成される主アンテナ素子をベースにして、第1線状導体の途中に存在する接続点に、補助アンテナ素子が配置される。このような補助アンテナ素子を配置することで、DTVの周波数帯のうち、とくに低周波数帯の感度が高くなり、補助アンテナ素子のパターンを工夫することで、主アンテナ素子において不足するアンテナ感度を高めるチューニングが行われる。
しかしながら特許文献1に代表される従来技術では、所定のアンテナの設計仕様に合わせて最適な感度を得るためには、アンテナパターンすなわちアンテナ導体の形状、大きさなどを、最適化する作業を繰り返す必要があり、適切なアンテナパターンを得るための作業(アンテナ設計)が容易ではなかった。例えば、自動車のリアガラスにアンテナを設ける場合には、リアガラスにはアンテナ導体以外にも電熱線が設けられる領域が存在する場合があり、自動車のフロントガラスにアンテナを設ける場合には、視界を妨げないように限られた領域へアンテナパターンを設けなければならない。このように制約される環境下で所望の特性を満足するアンテナの設計を行うのは容易ではない。
さらに、アンテナの送受信特性は、自動車のボディ形状、ガラス形状、電熱線の位置などに依存し、また車種毎に異なる。従って、アンテナ設計は人の経験による要素が大きく、熟練者でなければ最適なアンテナ設計を行うことが困難な場合が多い。また熟練者であってもアンテナ設計には多大な時間と労力を要する場合が多い。
本発明は、上記に鑑みてなされたものであって、車両用のアンテナをはじめ、ビル等の建物(例えば、ガラス面)や、その他に様々な電子機器等に取り付け可能なアンテナの設計を容易化するアンテナ設計支援装置、アンテナ設計支援プログラム及びアンテナ設計支援方法を得ることを目的とする。
上述した課題を解決し、目的を達成するため、本発明に係るアンテナ設計支援装置は、アンテナの設計を支援するアンテナ設計支援装置であって、前記アンテナの形状が複数画素で表された画素データと前記アンテナのアンテナ性能を示す性能データとのセットを訓練データとして深層学習された畳み込みニューラルネットワークを用いて、複数の前記画素データに基づき前記アンテナ性能を予測するアンテナ性能予測部を備える。
本発明によれば、アンテナの設計を容易化できる、という効果を奏する。
以下に、本発明の実施の形態に係るアンテナ設計支援装置、アンテナ設計支援プログラム及びアンテナ設計支援方法を図面に基づいて詳細に説明する。なお、この実施の形態ではとくに、車体に備わるガラスにアンテナを設ける場合について詳細な説明をするが、この発明が車体用のアンテナに限定されるものではない。
実施の形態.
図1は本発明の実施の形態に係るアンテナ設計支援装置の構成図である。本実施の形態に係るアンテナ設計支援装置100は、例えば自動車などの車体が備えるガラスに設けられるアンテナや、ガラスから一定距離離隔ててガラス近傍に設けられるアンテナの設計を支援する装置である。アンテナ設計支援装置100には表示器200が接続される。アンテナ設計支援装置100は、例えばアンテナの設計を支援するためのプログラムをコンピュータにインストールして実現される。アンテナの設計とは、自動車などの車両のガラスにアンテナが設けられた後、所望の送受信特性になるようにアンテナを構成する導体(以下「アンテナ導体」ともいう。)の太さ、長さ及びガラス上の位置などを最適化する作業である。アンテナ設計の概要については、後述する図2及び図3を用いて説明する。
図1は本発明の実施の形態に係るアンテナ設計支援装置の構成図である。本実施の形態に係るアンテナ設計支援装置100は、例えば自動車などの車体が備えるガラスに設けられるアンテナや、ガラスから一定距離離隔ててガラス近傍に設けられるアンテナの設計を支援する装置である。アンテナ設計支援装置100には表示器200が接続される。アンテナ設計支援装置100は、例えばアンテナの設計を支援するためのプログラムをコンピュータにインストールして実現される。アンテナの設計とは、自動車などの車両のガラスにアンテナが設けられた後、所望の送受信特性になるようにアンテナを構成する導体(以下「アンテナ導体」ともいう。)の太さ、長さ及びガラス上の位置などを最適化する作業である。アンテナ設計の概要については、後述する図2及び図3を用いて説明する。
プログラムは、例えば記録媒体に記録され、その記録媒体からコンピュータにインストールされたものでもよいし、ネットワークに接続された記憶装置、ネットワークストレージなどに外部からアクセス可能な状態で記憶され、要求に応じてコンピュータにダウンロードされた後にインストールされたものでもよい。コンピュータは、ワークステーション、パーソナルコンピュータなどでもよいし、これらとネットワークを介して接続されたサーバでもよい。なお本実施の形態では、ガラスに設けられるアンテナの設計を支援するアンテナ設計支援装置100の構成例について説明するが、アンテナは、ガラスの主面に設けられる二次元形状のパターンを有するものに限定されず、ガラスから一定距離隔ててガラス近傍に設けられるものとして三次元形状のパターンを有するものでもよい。以下では、「アンテナの設計」を「アンテナ設計」と称する場合がある。アンテナ設計支援装置100の構成の詳細については後述する。なお、上記の「二次元形状のパターン」とは、例えば、車体が備えるガラスにおいて、なだらかな曲面に沿って設けられるアンテナのパターンも含まれるものとする。
図2は自動車のリアガラスの主面に設けられたアンテナ形状の一例を示す図である。図2ではアンテナ20が太実線で示される。図3はアンテナ設計の大まかな流れを示す図である。図3に示されるように、アンテナ設計には、(1)初期形状の設定、(2)アンテナ性能の測定、(3)アンテナ形状の調整、という3つの工程が含まれる。(1)の初期形状の設定では、電磁気学理論や蓄積された設計データベース、人の経験などを生かして、図2に示されるような、アンテナ20の形状が決定される。(2)のアンテナ性能の測定では、測定装置が利用される。測定装置は、それの演算能力を向上させることによって、測定時間が短縮され、さらに正確な測定が実施可能である。アンテナ性能を表す指標としては、アンテナ利得、リターンロス、指向特性(半値角、前後比(F/B))などがある。(3)のアンテナ形状の調整では、測定されたアンテナ性能が所望の目標値を満たすように、電磁気学理論や蓄積された設計データベース、人の経験などを生かして、アンテナ導体の長さ、アンテナ導体の位置などが調整される。さらに(3)のアンテナ形状の調整では、アンテナ導体を追加する作業なども行われる。図2の鎖線で示されるものが、追加されたアンテナ導体である。(3)のアンテナ形状の調整が行われた後、再び(2)のアンテナ性能の測定が行われる。このようにアンテナ設計では、アンテナ性能の測定とアンテナ形状の調整が複数回行われる場合が多い。
本実施の形態に係るアンテナ設計支援装置100は、アンテナ設計を容易にするため、機械学習された多層ニューラルネットワークを用いてアンテナ性能を予測するように構成されている。このようなアンテナ性能の予測を実現するため、図1に示すようにアンテナ設計支援装置100は、情報格納部1、画素データ出力部2、アンテナ性能予測部3、アンテナ抽出部4、アンテナ性能表示部5及び表示制御部6を備える。アンテナ性能予測部3は、未知のアンテナ形状に対してある程度の予測性能(アンテナ性能を予測する性能)を持つ多層ニューラルネットワークである。この多層ニューラルネットワークは、既知のアンテナ形状とそれに対応したアンテナ性能のデータセットから成る訓練データを用いて、予め機械学習(深層学習)が行われたものである。
以下では、まず、図4から図11を利用して、多層ニューラルネットワークを利用したアンテナ性能の予測可否を検証した結果について説明する。その次に、アンテナ設計支援装置100に設けられる多層ニューラルネットワークの設計例と、多層ニューラルネットワークへの深層学習の動作とを説明する。さらに、学習後の多層ニューラルネットワークを用いたアンテナ設計支援装置100の構成と動作(アンテナ性能予測、アンテナ抽出など)を順に説明する。
図4は多層ニューラルネットワークを利用したアンテナ性能の予測可能性について検証する手順を示すフローチャートである。多層ニューラルネットワークを利用してアンテナ性能を予測するためには、アンテナ性能の予測に用いられるDNN(Deep Neural Network)モデルを作成し、DNNモデルに対して、教師データ又は訓練データと呼ばれるデータを利用した深層学習をさせることが必要である。そのため深層学習に必要なアンテナ形状を示すパラメータ情報が生成され(ステップS1)、パラメータ情報の生成と並行して、DNNモデルが作成される(ステップS2)。DNNは、人間や動物の脳神経回路をモデルとして、パターン認識をするように設計されたアルゴリズムを多層構造化したものである。作成されたDNNモデルにパラメータ情報を与えることによって深層学習が行われ(ステップS3)、学習後のDNNモデルを利用したアンテナ性能の予測が行われる(ステップS4)。
図5はステップS1で生成されるパラメータ情報のモデルとなるアンテナパターンの一例を示す図である。図5には、車両が備えるガラス10と、ガラス10に設けられるアンテナパターン20Aとが示される。なお、図5のアンテナパターン20Aは、実線で示す部分が実際のアンテナ形状を例示したものであり、破線で示す部分がアンテナ形状として追加し得る部分を例示したものある。アンテナパターン20Aは、銀ペースト等の金属を含有するペーストをガラス表面にプリントし焼付けることにより形成されたり、銅などの導電性物質からなる線状体や箔状体を、ガラス表面に接着剤などで貼付することによって形成されたり、合わせガラスを構成する2枚のガラス板の間に挟み込むことによって形成された、電波の送受信に利用される導電体である。
図6AはステップS1で生成されるパラメータ情報の一例を示す図である。図6BはステップS1で生成されるパラメータ情報の一例を示す図である。図6A及び図6Bに示されるパラメータ情報には、アンテナ性能に影響を与える変動要素と、アンテナ性能を示す値とが対応付けられている。例えば変動要素としては、アンテナ形状を示す情報、測定条件を示す情報などである。アンテナ形状を示す情報は、図5に示されるアンテナパターン20Aに対応しており、例えばアンテナ導体の引き回しが開始される給電点21の位置、アンテナ導体のうち一方向に直線状に延伸する導体部分の(各々の)長さ、アンテナ導体の折れ回数、アンテナ導体の全長などである。測定条件を示す情報は、例えばガラス構成、試験車での実施の有無、暗室での実施の有無などである。アンテナ性能を示す情報は、アンテナが受信する周波数帯域の平均値、最小値などである。アンテナパターン20Aは、車両の種類、ガラスの形状などによって様々な種類があるため、種類毎に作成される。
図7はDNNモデルについて説明するための第1図である。図7に示されるように、DNNモデルは、開発言語「Python」、Googleの統計計算ライブラリ「Tensorflow」、ニューラルネットライブラリ「Keras」などを用いて、DNNのコードを記述することによって作成される。
図8はDNNモデルについて説明するための第2図である。図8に例示されるDNNモデルは、入力層と、隠れ層と呼ばれる中間層と、出力層とを有する。DNNモデルでは、中間層の数を増やして重層構造にする構成が採られる。図8のDNNモデルでは、入力層のニューロン数が12個とされ、出力層のニューロン数が1個とされ、中間層の数が3層とされ、中間層のニューロン数が20個とされ、ニューロン(ノード)の結合方法が全結合とされる。活性化関数にはランプ関数「ReLU」、線形関数「Linear」などが利用される。活性化関数は、ニューラルネットワークにおいて、線形変換をした後に適用する非線形関数もしくは恒等関数を意味する。
図9はDNNモデルの学習条件と、学習条件に従って深層学習することで得られるパラメータ誤差とを説明するための図である。図9の上側には、DNNモデルの学習条件を示す。例えば、同じ測定条件の280個のデータを用いて深層学習させる場合、学習条件であるデータバッチ数、学習エポック数及びテストデータ数は、図9に示されるように調整される。図9において、データバッチ数が20、学習エポック数が2500、テストデータ数が学習用データの内の5%とされる。図9の下側には、パラメータ誤差を示すグラフを示す。グラフの横軸は、学習エポック数(epoch)を表し、グラフの縦軸は、深層学習によって予測された予測値と実測値との誤差(パラメータ誤差:loss)を表す。点線はモデルの学習に使用する学習用データ(train data)であり、実線はプログラムが、学習が適切に進行しているかどうかを確認するためのテストデータ(test data)である。例えば上記の280個のデータの内、一部のデータ群(例えば266個のデータ)が学習用データに該当し、残りのデータ群(例えば14個のデータ)がテストデータに該当する。図9のグラフより、学習回数が増えるほど、パラメータ誤差が収束することが分かる。これは機械学習が適切に進行していることを表している。
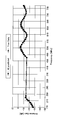
図10はステップS3で学習されたDNNモデルを用いてアンテナ性能を予測した結果を示した図である。図10の横軸は、データ番号を表し、ここでは検証データ数が31とされる。図10の縦軸は、アンテナ性能(ここでは帯域平均利得とする)が示される。鎖線は、DNNモデルを用いて予測される予測値であり、図9に示される31個の検証データをプロットしたものである。すなわち、図10の鎖線は、ステップS3の深層学習の過程で全く使用されていないアンテナ形状に対して、学習済みDNNモデルがアンテナ性能を予測した結果を示す。実線は、実際のアンテナに接続される測定装置で測定された各アンテナ形状に対する性能の実測値であり、31個の検証データのそれぞれに対応する実測データをプロットしたものである。図10のグラフより、予測値は実測値と近い値を示すことが分かる。
図11は図10に示される実測値に対する予測値のばらつきを示した図である。図11の横軸は実測値を表し、図11の縦軸は予測値を表す。実線の斜線は、実測値と予測値が一致する線を表し、破線の斜線で囲まれた範囲は、予測値が実測値に対して±1dBとなる領域を示す。図11から分かるように、学習後のDNNモデルを用いて予測される帯域平均利得は、概ね実測値から±1dBの範囲に分布している。すなわち、学習済みのニューラルネットワークを用いてアンテナ性能を精度良く予測できることが分かる。このことから、学習済みのニューラルネットワークをアンテナの設計支援に有効活用できる。
以下では、ニューラルネットワークを活用した本実施の形態に係るアンテナ設計支援装置100の構成について説明する。
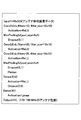
図12は本実施の形態に係るアンテナ設計支援装置100においてアンテナの設計を支援する手順を示すフローチャートである。ステップS11では、アンテナ設計支援装置100に対して設計要件と目標性能を設定する。設計要件とは、ガラス面内でアンテナ導体を配置できる領域の制約条件や、アンテナ導体の形状に対する制約条件などである。目標性能とは、アンテナ利得、リターンロス、指向特性(半値角、前後比(F/B))などの性能指標の数値目標である。ステップS12では、設計要件を満たすアンテナ形状を表すアンテナ画像データを生成する。アンテナ画像データとは、例えば、図13に示すような二次元配列された複数画素で構成されるアンテナ形状を示す画素データである。アンテナ設計支援装置100では、前述したパラメータ情報の代わりに、二次元配列された複数画素で構成される画素データが利用される。
図13の上側には、アンテナ20の一例を示す。図13の下側には、アンテナ形状を示す画素データ50を示す。画素データ50は、図13の上側に示したアンテナ20の形状を二次元配列された複数画素で表したデータである。画素データ50では、アンテナ20が存在する部分のピクセル値は「1」とし、アンテナ20が存在しない部分のピクセル値は「0」とする。画素データは、例えば、図1に示される画素データ出力部2を用いて生成したものである。画素データ50は、1ピクセルのサイズを小さくするほど訓練データ数が増加して、CNNモデルによる高い予測精度が得られやすい一方で、CNNモデルが大規模になる傾向がある。従って、画素データ50は、CNNモデルによる予測精度を大きく低下させることなく、かつ、必要以上に大規模にならないようなピクセルサイズとなるように設定するとよい。ステップS13では、後述する学習済みCNNモデルに対して前述した画素データを入力し、その画素データが表すアンテナの性能を予測させる。ステップS14では、ステップS13で予測された性能が目標性能を満たすがどうかを判別し、目標性能を満たすアンテナを抽出する。
本実施の形態に係るアンテナ設計支援装置100では、アンテナの形状から性能を予測するためのニューラルネットワークとして畳み込みニューラルネットワーク(CNN)モデルが利用される。CNNは、二次元情報の処理に適したDNNモデルとして広く利用される順伝播型のニューラルネットワークである。CNNは、二次元配列された複数画素の画素データに対して、フィルタを利用した畳み込み演算を行い、画像データの空間的特徴(例えばエッジの特徴など)を検出する。アンテナ設計支援装置100では、ステップS21において、二次元配列された画素データを入力とし、アンテナの各受信周波数における性能予測値を格納するための一次元配列を出力とするCNNモデルが作成される。ステップS22では、CNNモデルの訓練データが収集される。訓練データとは、アンテナの形状とそのアンテナの性能が紐づいた複数のデータセットであり、過去の実験データから引用したものでもよいし、3次元電磁界解析シミュレータで生成されたデータでもよい。また、これらの訓練データは情報格納部1に格納されたものでもよいし、外部媒体等から読み込んだものでもよい。ステップS23では、ステップS22で収集された訓練データを用いてCNNモデルの深層学習が行われる。ステップS24では、深層学習の結果、その内部パラメータがアンテナ性能予測に最適化されたCNNモデルが生成される。これを学習済みCNNモデルと呼ぶ。前述したように、アンテナ設計支援装置100では、この学習済みCNNモデルを用いることによりアンテナ設計を支援することが可能となる。
以下では、アンテナ設計支援装置100を用いたアンテナ設計支援の実施例を説明する。前述したように、訓練データは、3次元電磁界解析シミュレータを使用して、4,802個作成した。4,802個の学習用データのそれぞれは、互いに形状が異なるアンテナパターンに対応しているものを使用した。これらのデータの作成条件は、以下の通りである。
[モデル]
自動車の車体(導体)+ガラス+アンテナ(導体)
[解析条件]
水平偏波受信利得、垂直偏波受信利得、リターンロスを計算
周波数範囲:170-240MHz, 470-610MHz, 620-790MHz 各10MHzピッチ
[アンテナ形状]
1000mm×450mmのガラス面上にアンテナを設置
ガラスの側辺エッジから90mm以内、ガラスの上/下辺エッジから100mm以内の領域
アンテナ線1本で折れ回数2回以下、又はアンテナ線2本でそれぞれ折れ回数1回
数十mmピッチで各線の長さを変えたもの
自動車の車体(導体)+ガラス+アンテナ(導体)
[解析条件]
水平偏波受信利得、垂直偏波受信利得、リターンロスを計算
周波数範囲:170-240MHz, 470-610MHz, 620-790MHz 各10MHzピッチ
[アンテナ形状]
1000mm×450mmのガラス面上にアンテナを設置
ガラスの側辺エッジから90mm以内、ガラスの上/下辺エッジから100mm以内の領域
アンテナ線1本で折れ回数2回以下、又はアンテナ線2本でそれぞれ折れ回数1回
数十mmピッチで各線の長さを変えたもの
図14は訓練データである、画素データ50及び3次元電磁界解析シミュレータにより収集されたアンテナ性能データの一例を示す図である。図14の左側にはアンテナ形状の画像が示される。このアンテナ形状の画像は例えば「Python」で作成される。ここでは4,802個のアンテナ形状の画像が作成される。なおアンテナ形状の画像は、図13の下側に示される画素データ50として作成される。図14の右側には、4,802個のアンテナ形状の画像のそれぞれに対応するアンテナ性能データが示される。これら画素データ50とアンテナ性能データの組が訓練データとなり、4,802個の訓練データが作成される。
図15はCNNモデルの設計例を示す図である。図15には「Python」を用いてCNNモデルを設計する例を示す。CNNモデルの潜在能力は、ネットワークの階層構造、ネットワークの階層同士の接続条件、ネットワークの各階層の活性化関数の設定等で決定される。CNNモデルの設計では、モデル構築、性能検証及び構造改良が、数回繰り返される。構造改良では、例えば、全結合層(Dense)を示す値が0.5から0.0に変更され、活性化関数(Activation)が線形関数「Linear」からランプ関数「ReLU」に変更され、畳み込み層「Conv2D」が1段追加される。
ここまでの工程で訓練データとCNNモデルが作成され、次の工程(ステップS23)で深層学習が実行される。一般的な画像認識を目的としたCNNモデルに対する深層学習では、大量の画像データとその画像の分類ラベルが紐づいたデータセットを訓練データとして学習が行われる。学習とは、ある画像データをCNNモデルに与えて画像分類をさせ、その結果が正解ラベルと異なる場合に、その結果が正解ラベルに近づくようにCNNモデルの内部パラメータの値を更新する作業を指す。大量の画像データによりこの作業を繰り返すことで、CNNモデルは次第に未知の画像に対しても精度よく分類ができるようになる。なお、ディープラーニングによる画像認識技術については、例えば特開2014-063522号公報、特開2016-048238号公報などに開示されるため、詳細な説明は割愛する。本願発明者は、アンテナ形状を表す画素データとそのアンテナ性能からなる多数の訓練データでCNNモデルに深層学習を施すことにより、CNNモデルが未知のアンテナ形状に対して精度よくアンテナ性能を予測できるようになることを見出した。つまり、本願発明者は、画素データで表されたアンテナ形状の空間的特徴の抽出、及び、その特徴がアンテナ性能に及ぼす影響度合いを加味したアンテナ性能予測を、多数の訓練データからCNNモデルに習得させ得ることを見出した。
CNNモデルの最終的な能力(予測精度)は、学習実行の際の設定条件により決まる。主な設定条件は、訓練データ数、バッチサイズ及びエポック数である。バッチサイズは、1回の重み更新計算に使用する訓練データの個数である。エポック数は、訓練データを用いた学習の繰り返し回数である。以下では、図16から図18を用いて、これらの設定条件を変化させたときのCNNモデルによる予測精度について説明する。
図16は訓練データ数を変化させたときのCNNモデルによる予測精度を示す図である。図16の横軸は学習用データ数(Data num)を表す。四角の点で示されるグラフは学習済みCNNモデルによるアンテナ性能予測値と実測値の誤差(Error)を表す。丸の点で示されるグラフは学習済みCNNモデルによるアンテナ性能予測値と実測値の相関性(Correlation)を表す。図16によれば、学習用データ数が増える程、予測精度が向上することが分かる。
図17はバッチサイズを変化させたときのCNNモデルによる予測精度を示す図である。図17の横軸はバッチサイズ(Batch)を表す。四角の点で示されるグラフは学習済みCNNモデルによるアンテナ性能予測値と実測値の誤差(Error)を表す。丸の点で示されるグラフは学習済みCNNモデルによるアンテナ性能予測値と実測値の相関性(Correlation)を表す。図17によれば、バッチサイズが小さいほど、予測精度が向上することが分かる。
図18はエポック数を変化させたときのCNNモデルによる予測精度を示す図である。図18の横軸はエポック数(Epoch)を表す。四角の点で示されるグラフは学習済みCNNモデルによるアンテナ性能予測値と実測値の誤差(Error)を表す。丸の点で示されるグラフは学習済みCNNモデルによるアンテナ性能予測値と実測値の相関性(Correlation)を表す。図18によれば、エポック数が増えるほど、予測精度が向上することが分かる。
次に、CNNモデルの精度を検証した結果について、図19及び図20を用いて説明する。学習済みのCNNモデルに、未知のアンテナ形状、すなわち訓練データ4,802個のどれとも一致しないアンテナパターンの画像データを与え、そのパターンに基づくアンテナの性能を予測させ、予測値と実測値を比較したところ、図19及び図20に示されるような結果が得られた。
図19は学習済みのCNNモデルに未知のアンテナの形状データを入力することで出力されたアンテナ性能の予測結果を説明するための第1図である。図19には、例えば図5に示す給電点21を起点に所定の方向に伸びる未知のアンテナパターンが示され、図19の横軸は、例えば自動車のリアガラスの横方向に伸びるアンテナ導体の長さを表す。図19の縦軸は、例えば自動車のリアガラスの縦方向に伸びるアンテナ導体の長さを表す。
図20はステップS14で学習済みのCNNモデルに未知のアンテナの形状データを入力することで出力されたアンテナ性能の予測結果を説明するための第2図である。図20には、図19に示されるアンテナパターンに対応する実測値と予測値とが示される。図20の横軸は周波数を表し、図20の縦軸はアンテナ利得を表す。四角の点で示されるグラフは学習済みのCNNモデルによって予測された予測値(AI predicted)であり、丸の点で示されるグラフは実測値(True Data)である。図20から明らかなように、学習済みCNNモデルが予測したアンテナ性能の予測値は、実測値とほぼ一致することがわかった。
さらなる予測精度検証のために、学習済みのCNNモデルに、48,549個の未知のアンテナ形状の画像データに対して、学習済みモデルが予測したアンテナ性能の予測値と実測値とを比較した結果、予測値と実測値との各周波数における差分の平均二乗誤差は1.63dBであった。また、予測値と実測値との間の相関係数を演算した結果、相関係数の演算結果は0.94であった。これは、学習済みCNNモデルが未知のアンテナ形状に対して十分な精度で性能予測が可能であることを示している。
次に、図21を用いて、図1に示されるアンテナ抽出部4によって、アンテナ性能の予測値が目標の性能に適合するアンテナを抽出する動作(ステップS14)について説明する。
図21はアンテナ抽出部の動作を説明するための図である。図21には、あらかじめ設定した設計要件(アンテナの配置が可能な領域を特定した要件)を満たすように生成した48,549個のアンテナ画像データの内、26,800番目から27,800番目までのアンテナ利得(アンテナ性能の予測値)を抜粋して点で示す。図21の横軸はアンテナ番号を表す。図21の縦軸はアンテナ利得を表す。破線は、アンテナ性能の目標値を表す。なお目標値は、CNNモデルの予測精度レベルを考慮して設定される。
図21に示されるように、26,800番目から27,800番目までのアンテナの中には、アンテナ利得(アンテナ性能の予測値)が目標値を満たすものが複数存在する。アンテナ抽出部4は、アンテナ性能予測部3でアンテナ性能が予測された複数のアンテナの内、アンテナ性能の予測値がアンテナ性能の目標値を超えるもの、すなわちアンテナの要求仕様に適合するアンテナを自動で抽出する。これにより、アンテナ設計支援装置100は、アンテナ設計者に対して要求仕様を満たす可能性の高いパターンを複数通り提示できる。つまり、アンテナ設計者は要求仕様をアンテナ設計支援装置100に設定するだけで要求仕様を満たす可能性の高いアンテナパターンを得ることができ、アンテナを設計する作業が従来に比べて極めて容易になる。なお、市販されている一般的なモバイルPCを用いて実施した本実施例の場合、アンテナの設計要件を設定してから、要求仕様を満たす候補となる複数のアンテナパターンの提示までにかかった時間は約20分であった。
さらに、本実施の形態に係るアンテナ設計支援装置100は、表示器200の画面上に手書き入力されたアンテナパターンのアンテナ性能を、当該画面上にリアルタイムに表示するように構成してもよい。つまり、アンテナ設計支援装置100のステップS12を人による手書き入力による生成とし、ステップS14を人の判断による抽出としてもよい。図22から図24を用いてこの構成例について具体的に説明する。
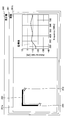
図22は手書き入力されたアンテナパターンが表示される第1画面と、アンテナ性能予測部3で予測されたアンテナ性能が表示される第2画面との一例を示す図である。図22に示すように、表示器200には、液晶ディスプレイ、タッチパネルなどの画面201が設けられる。図22に示される2つの第1画面201a及び第2画面201bは、異なる内容を表示するため、画面201を二画面表示にしたものである。左側の第1画面201aには、例えばマンマシンインターフェースの一つであるマウスの動きに連動するポインタ210が表示される。また第1画面201aには、アンテナパターンの描画が開始される点220(例えば、図5に示す給電点21)が示される。なお、図22には、アンテナパターンの描画が開始される箇所を説明するため、便宜上、点220が表示されているが、点220の表示は必ずしも必要ではない。
図23は図22に示される第1画面において、手書き入力が開始されたアンテナパターンの形状と、第2画面に反映されるアンテナ性能とを示す図である。図23では、点220からマウス等でドラッグ操作が開始され、例えば第1画面201aの上側にポインタ210が数cm程度移動された後、右方向にポインタ210が数cm程度移動される。このようにしてドラッグ操作が行われた結果、第1画面201a上には(所定の導体の幅を有する)L字形状のアンテナパターン230が描かれる。このとき、アンテナ性能予測部3では、第1画面201aに描かれたアンテナパターン230に対応するアンテナ性能が推定される。そして、第2画面201bには、ドラッグ操作途中のアンテナパターン230に対応するアンテナ性能、すなわちアンテナ性能予測部3で推定されたアンテナ性能の予測値が、リアルタイムに視覚化して表示される。アンテナ性能の予測値の第2画面201bへの表示制御は、表示制御部6によって行われる。なお、第2画面201bには、アンテナ性能の目標値も表示させることが望ましい。予め保存された目標値を表示制御部6が読み出すことにより、アンテナ性能の目標値が第2画面201bに表示される。このように表示制御部6を用いることによって、画面上に手書きで入力されたアンテナパターン230から予測されるアンテナ性能が、目標値に対してどの程度の値であるかをユーザに視覚化して提供できる。
図24は図23に示されるL字状のアンテナパターンを微調整したときのアンテナ性能を示す図である。図24の例では、第1画面201aの上側にポインタ210が下方向に数cm程度移動される。このようにしてドラッグ操作が行われた結果、第1画面201a上には、(所定の導体の幅を有する)C字形状のアンテナパターン230が描かれる。そして、第2画面201bには、C字形状のアンテナパターン230に対応するアンテナ性能が反映される。その結果、ユーザは、アンテナ性能が目標値を超えるアンテナパターン230を描くことができ、目標値を超えた形状のアンテナパターン230を、試作品へ即座に反映できる。
また、ユーザは、アンテナパターン230を描きながら、即時にそのアンテナパターン230から予測されるアンテナ性能を把握できる。そのため、アンテナ設計者は、アンテナパターン230から予測されるアンテナ性能を容易に推測でき、アンテナの試作に要するリードタイムを大幅に短縮できる。つまり、従来の試作・測定に基づくアンテナも、設計や電磁界シミュレータによる解析に基づく、著しく効率的にアンテナの設計を行うことができる。なお、市販されている一般的なモバイルPCを用いて実施した本実施例の場合、アンテナ形状の手書き入力から性能表示までにかかった時間は0.1秒以下であった。また、どのような形状のアンテナパターン230を作ることで、アンテナ性能が向上するのかを即座に把握できる効果を奏する。
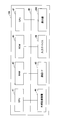
図25は本発明の実施の形態に係るアンテナ設計支援装置を実現するためのハードウェア構成例を示す図である。アンテナ設計支援装置100は、各種処理を実行するCPU(Central Processing Unit)41と、プログラム格納領域及びデータ格納領域を含むRAM(Random Access Memory)42と、不揮発性メモリであるROM(Read Only Memory)43と、データを記憶する記憶部である外部記憶装置44とを備える。またアンテナ設計支援装置100は、外部機器との通信インタフェース(I/F)45と、ユーザによる入力操作を受け付ける入力デバイス46と、画像処理や深層学習の演算に使用されるGPU(Graphical Processing Unit)47と、各種画面にて情報を表示する表示器200を備える。表示器200は、アンテナ設計支援装置100の外部に設けられていてもよい。図25に示す各部は、バス48を介して相互に接続されている。
外部記憶装置44は、例えばSSD(Solid State Drive)、HDD(Hard Disk Drive)であり、図1に示される情報格納部1に相当する。入力デバイス46は、前述したマウス、キーボードなどである。ROM43には、コンピュータを制御のためのプログラムであるBIOS(Basic Input/Output System)、UEFI(Unified Extensible Firmware Interface)などが格納されている。
アンテナ設計支援装置100を実現する場合、アンテナ設計支援装置100用のプログラムをROM43に格納しておき、このプログラムがRAM42に格納された後、CPU41で実行されることにより、画素データ出力部2、アンテナ性能予測部3、アンテナ抽出部4、アンテナ性能表示部5及び表示制御部6が実現される。アンテナ設計支援装置100用のプログラムは、画素データ出力部2などの機能を実行するプログラムである。I/F45は、表示器200がアンテナ設計支援装置100の外部に設けられている場合に、CPU41と表示器200との間で情報の伝送するときに利用される。
なお、本実施の形態に係るアンテナ設計支援装置100では、二次元配列された複数画素で構成されるアンテナ形状を示す画素データが利用されているが、当該データは、二次元配列されたものに限定されず、例えばガラスの縦方向と横方向の要素に加えて、奥行き方向の要素を含む三次元配列された画素データでもよいし、さらに各画素に該当する位置の材料特性(導電率など)の要素を含む四次元配列された画素データでもよい。また、本実施の形態では、ガラスに設けられるアンテナの性能を推定するアンテナ設計支援装置100の構成例を説明したが、アンテナ設計支援装置100は、ガラス以外の媒体(誘電体)に設けられるアンテナの性能を推定することも可能である。
以上に説明したように本実施の形態に係るアンテナ設計支援装置100によれば、アンテナの形状が複数画素で表された画素データとアンテナのアンテナ性能を示す性能データとのセットを訓練データとして、深層学習された畳み込みニューラルネットワークを用いて、複数の画素データに基づきアンテナ性能を予測するアンテナ性能予測部を備えるように構成されている。この構成により、新たに入力される画素データの元になるアンテナの形状に対応したアンテナ性能を、容易にかつ正確に推定できる。例えば、アンテナ性能予測部に画素データが入力された直後にアンテナ性能を推定可能である。本実施の形態に係るアンテナ設計支援装置100によれば、このような環境下でアンテナ設計を行う場合でも、アンテナの設計条件を与えることによって即座にアンテナ性能を推定できるため、アンテナ設計を行う者は、設計条件が要求されるアンテナ性能を満たすか否かを把握した上でアンテナパターンを試作できるようになる。従って図3に示される(1)から(3)までの工程を短縮できる。また本実施の形態に係るアンテナ設計支援装置100によれば、アンテナ形状の調整の結果(調整後のアンテナ性能)を即座に把握できるため、図3に示される(2)と(3)の工程を大幅に短縮できる。その結果、アンテナ設計に要する負荷が軽減され、効率的かつ、高精度で安定した評価が可能になる。
また本実施の形態に係るアンテナ設計支援装置100は、アンテナ性能予測部でアンテナ性能が予測された複数のアンテナの内、アンテナ性能の予測値がアンテナの要求仕様に適合するアンテナを抽出するアンテナ抽出部4を備えるように構成されている。この構成により、大量のアンテナデータを入力した場合でも、所望のアンテナ性能を満たす1又は複数のアンテナパターンを即座に抽出できる。そのため、従来のように電磁気学の専門知識や人の経験などを生かしてアンテナパターンを決定する場合に比べて、より多くのアンテナパターンの性能評価が可能になる。
なお、本実施の形態に係るアンテナ設計支援装置100には、活性化関数として「Linear」関数を用いることが望ましい。従来の画像分類AIでは、最終層の出力に"Softmax"関数(出力値が「0~1」に収まるようにした非線形の関数)などが使われる。これに対して「Linear」関数を用いた場合、出力値が「アンテナ性能(利得やインピーダンス特性)」となり、出力値の範囲を-∞~+∞の範囲で取ることが可能になる。
本国際特許出願は2018年11月26日に出願した日本国特許出願第2018-220076号に基づきその優先権を主張するものであり、日本国特許出願第2018-220076号の全内容を本願に援用する。
以上の実施の形態に示した構成は、本発明の内容の一例を示すものであり、別の公知の技術と組み合わせることも可能であるし、本発明の要旨を逸脱しない範囲で、構成の一部を省略、変更することも可能である。
1 情報格納部、2 画素データ出力部、3 アンテナ性能予測部、4 アンテナ抽出部、5 アンテナ性能表示部、6 表示制御部、10 ガラス、20 アンテナ、20A アンテナパターン、21 給電点、41 CPU、42 RAM、43 ROM、44 外部記憶装置、45 I/F、46 入力デバイス、47 GPU、48 バス、50 画素データ、100 アンテナ設計支援装置、200 表示器、201 画面、201a 第1画面、201b 第2画面、210 ポインタ、220 点、230 アンテナパターン。
Claims (11)
- アンテナの設計を支援するアンテナ設計支援装置であって、
前記アンテナの形状が複数画素で表された画素データと前記アンテナのアンテナ性能を示す性能データとのセットを訓練データとして深層学習された畳み込みニューラルネットワークを用いて、複数の前記画素データに基づき前記アンテナ性能を予測するアンテナ性能予測部を備えるアンテナ設計支援装置。 - 前記アンテナ性能予測部でアンテナ性能が予測された複数のアンテナの内、アンテナ性能の予測値がアンテナ性能の目標値を超えるアンテナを抽出するアンテナ抽出部を備える請求項1に記載のアンテナ設計支援装置。
- 表示器の画面に描かれたアンテナパターンに対応する前記アンテナ性能が前記アンテナ性能予測部で予測されたとき、予測された前記アンテナ性能を、前記アンテナパターンと共に前記表示器にグラフ表示する表示制御部と備える請求項1又は2に記載のアンテナ設計支援装置。
- 前記表示制御部は、予測された前記アンテナ性能のグラフ表示と共にアンテナ性能の目標値を表示する請求項3に記載のアンテナ設計支援装置。
- 前記アンテナは車体に設けられる、請求項1~4のいずれか1項に記載のアンテナ設計支援装置。
- 前記アンテナは、前記車体の窓ガラスに設けられる、請求項5に記載のアンテナ設計支援装置。
- 前記アンテナは、前記窓ガラスの主面に設けられる二次元形状のパターンを有する、請求項6に記載のアンテナ設計支援装置。
- アンテナの設計を支援するコンピュータで実行されるアンテナ設計支援プログラムであって、
前記アンテナの形状が複数画素で表された画素データと前記アンテナのアンテナ性能を示す性能データとのセットを訓練データとしてニューラルネットワークに深層学習させる学習ステップと、
前記学習ステップで深層学習された畳み込みニューラルネットワークを用いて、複数の前記画素データに基づき前記アンテナ性能を予測する予測ステップと、
をコンピュータに実行させるアンテナ設計支援プログラム。 - 前記アンテナは車体に設けられる、請求項8に記載のアンテナ設計支援プログラム。
- アンテナの設計を支援するアンテナ設計支援装置で実行されるアンテナ設計支援方法であって、
前記アンテナの形状が複数画素で表された画素データと前記アンテナのアンテナ性能を示す性能データとのセットを訓練データとしてニューラルネットワークに深層学習させる学習ステップと、
前記学習ステップで深層学習された畳み込みニューラルネットワークを用いて、複数の前記画素データに基づき前記アンテナ性能を予測する予測ステップと、
を含むアンテナ設計支援方法。 - 前記アンテナは車体に設けられる、請求項10に記載のアンテナ設計支援方法。
Priority Applications (2)
| Application Number | Priority Date | Filing Date | Title |
|---|---|---|---|
| JP2020558256A JP7393603B2 (ja) | 2018-11-26 | 2019-11-07 | アンテナ設計支援装置、アンテナ設計支援プログラム及びアンテナ設計支援方法 |
| DE112019005878.9T DE112019005878T5 (de) | 2018-11-26 | 2019-11-07 | Antennenkonstruktions-Unterstützungsvorrichtung, Antennenkonstruktions-Unterstützungsprogramm und Antennenkonstruktions-Unterstützungsverfahren |
Applications Claiming Priority (2)
| Application Number | Priority Date | Filing Date | Title |
|---|---|---|---|
| JP2018-220076 | 2018-11-26 | ||
| JP2018220076 | 2018-11-26 |
Publications (1)
| Publication Number | Publication Date |
|---|---|
| WO2020110649A1 true WO2020110649A1 (ja) | 2020-06-04 |
Family
ID=70852234
Family Applications (1)
| Application Number | Title | Priority Date | Filing Date |
|---|---|---|---|
| PCT/JP2019/043652 Ceased WO2020110649A1 (ja) | 2018-11-26 | 2019-11-07 | アンテナ設計支援装置、アンテナ設計支援プログラム及びアンテナ設計支援方法 |
Country Status (3)
| Country | Link |
|---|---|
| JP (1) | JP7393603B2 (ja) |
| DE (1) | DE112019005878T5 (ja) |
| WO (1) | WO2020110649A1 (ja) |
Cited By (2)
| Publication number | Priority date | Publication date | Assignee | Title |
|---|---|---|---|---|
| DE102023122206A1 (de) | 2022-08-26 | 2024-02-29 | AGC Inc. | Antennengestaltungsunterstützungsvorrichtung, Trainingsvorrichtung und Programm |
| JP2025521599A (ja) * | 2022-07-01 | 2025-07-10 | コリア インスティチュート オブ オーシャン サイエンス アンド テクノロジー | 畳み込みニューラルネットワークを用いた船舶性能係数推定システムおよび方法 |
Families Citing this family (1)
| Publication number | Priority date | Publication date | Assignee | Title |
|---|---|---|---|---|
| DE102024105472A1 (de) * | 2024-02-27 | 2025-08-28 | Dr. Ing. H.C. F. Porsche Aktiengesellschaft | Computerimplementiertes Verfahren für die Ausgabe von Informationen betreffend die Konfiguration eines Messaufbaus |
Citations (1)
| Publication number | Priority date | Publication date | Assignee | Title |
|---|---|---|---|---|
| WO2008020658A1 (en) * | 2006-08-16 | 2008-02-21 | Hutech21. Co., Ltd. | A printed dipole antenna for rfid tag and the design method therefor |
Family Cites Families (3)
| Publication number | Priority date | Publication date | Assignee | Title |
|---|---|---|---|---|
| JP5061015B2 (ja) | 2008-04-07 | 2012-10-31 | 日本板硝子株式会社 | 車両用ガラスアンテナ |
| US9086872B2 (en) | 2009-06-30 | 2015-07-21 | Intel Corporation | Unpacking packed data in multiple lanes |
| JP6601947B2 (ja) | 2014-08-25 | 2019-11-06 | 国立大学法人 鹿児島大学 | ナビゲーションシステム、ナビゲーション方法及びプログラム |
-
2019
- 2019-11-07 WO PCT/JP2019/043652 patent/WO2020110649A1/ja not_active Ceased
- 2019-11-07 JP JP2020558256A patent/JP7393603B2/ja active Active
- 2019-11-07 DE DE112019005878.9T patent/DE112019005878T5/de active Pending
Patent Citations (1)
| Publication number | Priority date | Publication date | Assignee | Title |
|---|---|---|---|---|
| WO2008020658A1 (en) * | 2006-08-16 | 2008-02-21 | Hutech21. Co., Ltd. | A printed dipole antenna for rfid tag and the design method therefor |
Non-Patent Citations (1)
| Title |
|---|
| TSUKAMOTO, SHOTA ET AL.: "Optimum Design of Metallic Patch Antennas based on Topology Optimization", TRANSACTIONS OF THE JAPAN SOCIETY FOR COMPUTATIONAL ENGINEERING AND SCIENCE, vol. 2012, no. 20120015, 31 October 2012 (2012-10-31), pages 1 - 7, XP055712717, ISSN: 1347-8826 * |
Cited By (4)
| Publication number | Priority date | Publication date | Assignee | Title |
|---|---|---|---|---|
| JP2025521599A (ja) * | 2022-07-01 | 2025-07-10 | コリア インスティチュート オブ オーシャン サイエンス アンド テクノロジー | 畳み込みニューラルネットワークを用いた船舶性能係数推定システムおよび方法 |
| DE102023122206A1 (de) | 2022-08-26 | 2024-02-29 | AGC Inc. | Antennengestaltungsunterstützungsvorrichtung, Trainingsvorrichtung und Programm |
| JP2024031475A (ja) * | 2022-08-26 | 2024-03-07 | Agc株式会社 | アンテナ設計支援装置、学習装置、及びプログラム |
| JP7794092B2 (ja) | 2022-08-26 | 2026-01-06 | Agc株式会社 | アンテナ設計支援装置、学習装置、及びプログラム |
Also Published As
| Publication number | Publication date |
|---|---|
| JPWO2020110649A1 (ja) | 2021-10-14 |
| JP7393603B2 (ja) | 2023-12-07 |
| DE112019005878T5 (de) | 2021-09-02 |
Similar Documents
| Publication | Publication Date | Title |
|---|---|---|
| CN108182450B (zh) | 一种基于深度卷积网络的机载探地雷达目标识别方法 | |
| JP7393603B2 (ja) | アンテナ設計支援装置、アンテナ設計支援プログラム及びアンテナ設計支援方法 | |
| US10885706B2 (en) | System and method for design of additively manufactured products | |
| US10571408B2 (en) | System and method for determining structure of material | |
| CN108197652A (zh) | 用于生成信息的方法和装置 | |
| US11861808B2 (en) | Electronic device, image processing method, and computer-readable recording medium | |
| CN117475158A (zh) | 电容式电压互感器误差预测方法、装置、设备及介质 | |
| CN113743437B (zh) | 使用相异训练源训练分类模型及应用其的推论引擎 | |
| US9568624B2 (en) | Method for predicting electromagnetic radiation characteristics, computer-readable recording medium and simulator | |
| Arani et al. | A state-of-the-art survey on advanced electromagnetic design: A machine-learning perspective | |
| CN117034090A (zh) | 模型参数调整、模型应用方法、装置、设备及介质 | |
| Jin et al. | EMI radiation prediction and structure optimization of packages by deep learning | |
| CN115265881B (zh) | 压力检测方法和装置 | |
| CN120182582B (zh) | 小样本hrrp雷达目标识别方法、装置、设备和介质 | |
| US20250273105A1 (en) | Apparatus and method for determining status of flexible display | |
| DE102022201781A1 (de) | Ein System und ein Verfahren zum Vorhersagen von Mehrfingerkraft in Berührungsbildschirmen unter Verwendung von künstlicher Intelligenz | |
| Zhou et al. | Data-driven modeling and optimization for cavity filters using linear programming support vector regression | |
| US20230113786A1 (en) | Artifact reduction for solutions to inverse problems | |
| CN118395877A (zh) | 微带贴片天线的优化设计方法、装置、设备及介质 | |
| JP7401766B2 (ja) | アンテナ設計プログラム、アンテナ設計方法及び情報処理装置 | |
| US20170228124A1 (en) | Pointing detection | |
| Zhou et al. | Incorporating prior knowledge and multi-kernel into linear programming support vector regression | |
| US20250190670A1 (en) | Antenna design system | |
| CN118643550B (zh) | 一种鞋外底的设计方法及相关装置 | |
| Zhang et al. | Stretchable wideband dipole antenna using machine learning assisted optimization for soft electronics |
Legal Events
| Date | Code | Title | Description |
|---|---|---|---|
| 121 | Ep: the epo has been informed by wipo that ep was designated in this application |
Ref document number: 19891325 Country of ref document: EP Kind code of ref document: A1 |
|
| ENP | Entry into the national phase |
Ref document number: 2020558256 Country of ref document: JP Kind code of ref document: A |
|
| 122 | Ep: pct application non-entry in european phase |
Ref document number: 19891325 Country of ref document: EP Kind code of ref document: A1 |