WO2020044562A1 - 画像処理装置、画像処理方法およびプログラム - Google Patents
画像処理装置、画像処理方法およびプログラム Download PDFInfo
- Publication number
- WO2020044562A1 WO2020044562A1 PCT/JP2018/032474 JP2018032474W WO2020044562A1 WO 2020044562 A1 WO2020044562 A1 WO 2020044562A1 JP 2018032474 W JP2018032474 W JP 2018032474W WO 2020044562 A1 WO2020044562 A1 WO 2020044562A1
- Authority
- WO
- WIPO (PCT)
- Prior art keywords
- image
- image processing
- signal value
- detection
- unit
- Prior art date
- Legal status (The legal status is an assumption and is not a legal conclusion. Google has not performed a legal analysis and makes no representation as to the accuracy of the status listed.)
- Ceased
Links
Images








Classifications
-
- A—HUMAN NECESSITIES
- A61—MEDICAL OR VETERINARY SCIENCE; HYGIENE
- A61B—DIAGNOSIS; SURGERY; IDENTIFICATION
- A61B1/00—Instruments for performing medical examinations of the interior of cavities or tubes of the body by visual or photographical inspection, e.g. endoscopes; Illuminating arrangements therefor
- A61B1/04—Instruments for performing medical examinations of the interior of cavities or tubes of the body by visual or photographical inspection, e.g. endoscopes; Illuminating arrangements therefor combined with photographic or television appliances
- A61B1/045—Control thereof
Definitions
- the present disclosure relates to an image processing apparatus, an image processing method, and a program for performing image processing on image data input from the outside.
- Patent Document 1 a technique for displaying an image that emphasizes a color difference between an abnormal part such as an atrophy part in which a gastric mucosa has atrophy and a normal part is known.
- a first signal ratio between two color image signals of a first color image signal including at least one narrowband signal and a second signal ratio between two color image signals different from the first signal ratio are used.
- a moving process of moving the first range, the second range, and the third range in which the observation target in the subject is distributed is performed, and the first signal ratio after the moving process is performed.
- Patent Document 2 there is known a technique for observing biological information of a subject and detecting an abnormality in a biological state without giving the subject a sense of discomfort or discomfort.
- the biological information of the subject is detected from a predetermined region in an image composed of a plurality of temporally continuous frames, and the detected biological information data or a change in the biological information data is detected.
- the abnormality is compared with a predetermined biological parameter used for determining the abnormality of the state of the living body, and an abnormality occurring in the biological state of the subject is detected.
- the observer discriminates by emphasizing the abnormal portion and the normal portion for each region based on the color difference. For example, since there is no difference in color in an area having inflammation or early cancer, there is a problem that an observer cannot determine an abnormal portion.
- Patent Document 2 since the living body state of the observer is determined based on the pulse rate, there is a problem that it is not possible to determine normal or abnormal for each region in the image. .
- the present disclosure has been made in view of the above, and provides an image processing apparatus, an image processing method, and a program that can intuitively grasp an abnormal part of a living body for each region in an image.
- an image processing apparatus includes an acquisition unit configured to acquire a plurality of temporally continuous image data generated by imaging one part of a living body. For each of the plurality of images corresponding to the plurality of image data, a setting unit that sets a plurality of detection areas in which image signal values change according to the movement of the living body, for each of the plurality of images, A detection unit that detects the image signal value in each of a plurality of detection regions; and a correlation value between the image signal value in each of the plurality of detection regions and a preset time-varying reference signal value. A calculation unit; and a generation unit that generates, for each of the correlation values of each of the plurality of detection regions, visualization information for identifying the correlation value.
- the reference signal value is detected by the detection unit in any one of the plurality of detection areas in the image at the same time or temporally before and after.
- the image signal value is detected by the detection unit in any one of the plurality of detection areas in the image at the same time or temporally before and after.
- the setting unit may include a plurality of past images generated by imaging the same part of the living body, the plurality of images being different in time from the plurality of images.
- the plurality of detection areas are set, and the detection unit detects the image signal value in each of the plurality of detection areas in the plurality of past images, and the reference signal value is The image signal value detected by the detection unit for each of the plurality of detection regions in a plurality of past images.
- the image processing device is the image processing device according to the above disclosure, wherein the correlation value is learned based on a plurality of temporally continuous learning images generated by imaging each of a normal tissue and an abnormal tissue.
- the discriminator further determines whether the correlation value is abnormal.
- the image processing device in the above disclosure, further includes a display control unit that superimposes the visualization information on the image and outputs the image to an external display device.
- the image processing device in the above disclosure, further includes a display control unit that outputs to an external display device by emphasizing each of the plurality of detection regions in a distinguishable manner based on the correlation value.
- the image processing method obtains a plurality of temporally continuous image data generated by imaging one part of a living body, and obtains each of a plurality of images corresponding to the plurality of image data.
- a plurality of detection areas in which image signal values change according to the movement of the living body are set, and for each of the plurality of images, the image signal values are detected in each of the plurality of detection areas, and the plurality of detection areas are detected. Calculating a correlation value between the image signal value of each of the detection areas and a preset time-varying reference signal value; identifying the correlation value for each of the correlation values of each of the plurality of detection areas; Generate visualization information.
- the program according to the present disclosure obtains a plurality of temporally continuous image data generated by imaging one part of a living body, and for each of a plurality of images corresponding to the plurality of image data. Setting a plurality of detection areas in which image signal values change in accordance with the movement of the living body, detecting the image signal values in each of the plurality of detection areas, for each of the plurality of images, Calculating a correlation value between each of the image signal values and a preset time-varying reference signal value, and for each of the correlation values of each of the plurality of detection regions, visualization for identifying the correlation value Generate information.
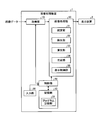
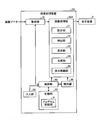
- FIG. 1 is a block diagram illustrating a functional configuration of the image processing apparatus according to the first embodiment.
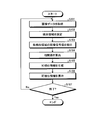
- FIG. 2 is a flowchart illustrating an outline of processing executed by the image processing apparatus according to the first embodiment.
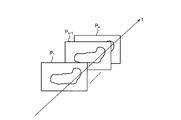
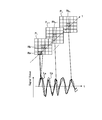
- FIG. 3 is a diagram schematically illustrating an example of a plurality of temporally continuous images acquired by the acquiring unit according to the first embodiment.
- FIG. 4 is a diagram schematically illustrating a plurality of detection regions set by a setting unit according to the first embodiment for a predetermined region of an image.
- FIG. 5 is a diagram schematically illustrating an example of a calculation method of a correlation value calculated by the calculation unit according to the first embodiment.
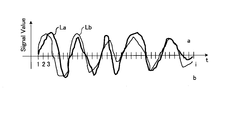
- FIG. 6 is a diagram showing a temporal change of the image signal value in the detection area in FIG.
- FIG. 7 is a diagram schematically illustrating a correlation value of each detection area calculated by the calculation unit according to the first embodiment.
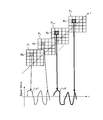
- FIG. 8 is a diagram schematically illustrating an example of a calculation method of a correlation value calculated by the calculation unit according to the second embodiment.
- FIG. 9 is a diagram schematically illustrating an example of a calculation method of a correlation value calculated by the calculation unit according to the third embodiment.
- FIG. 10 is a block diagram illustrating a functional configuration of the image processing apparatus according to the fourth embodiment.
- FIG. 11 is a diagram schematically illustrating a determination method determined by the classifier according to the fourth embodiment.
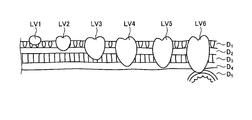
- FIG. 12 is a diagram schematically illustrating the state of each abnormal level.
- FIG. 13 is a diagram schematically illustrating a plurality of detection regions in an image.
- FIG. 14 is a diagram schematically showing the similarity of the detection region R1 in FIG.
- FIG. 15 is a diagram schematically illustrating the similarity of the detection region R2 in FIG.
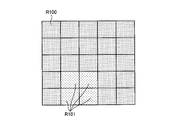
- FIG. 16 is a diagram schematically showing visible information output by the display control unit according to the second modification of the first to fourth embodiments.
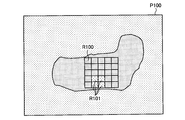
- FIG. 17 is a diagram in which visible information output by the display control unit according to the second modification of the first to fourth embodiments is superimposed on an image.
- FIG. 18 is a diagram schematically showing visible information output by the display control unit according to the third modification of the first to fourth embodiments.
- FIG. 19 is a diagram schematically illustrating an image output by the display control unit according to the third modification of the first to fourth embodiments.
- embodiments for implementing the present disclosure (hereinafter, referred to as “embodiments”) will be described.
- an image processing apparatus capable of bidirectionally communicating with any one of an endoscope, an imaging device, and a microscope that generates image data (RAW data) by imaging a subject or a subject will be described. I do.
- the present disclosure is not limited by the embodiments.
- the same portions are denoted by the same reference numerals and described.
- FIG. 1 is a block diagram illustrating a functional configuration of the image processing apparatus according to the first embodiment.
- the image processing apparatus 1 illustrated in FIG. 1 includes an endoscope (an endoscope such as a flexible endoscope and a rigid endoscope) or a capsule endoscope (hereinafter, these are collectively referred to simply as “endoscope”).
- endoscope an endoscope such as a flexible endoscope and a rigid endoscope
- endoscope a capsule endoscope
- Mirror an image corresponding to image data composed of a plurality of temporally consecutive frames acquired by continuously imaging the same part of a living body irradiated with light in a predetermined wavelength band.
- the image data is usually color image data having a pixel level (pixel value) for wavelength components of R (red), G (green), and B (blue) at each pixel position.
- the image processing apparatus 1 illustrated in FIG. 1 includes an acquisition unit 10, an input unit 20, a recording unit 30, a control unit 40, and an image processing unit 50.
- the acquisition unit 10 acquires an image corresponding to the image data captured by the endoscope, and outputs the acquired image data to the image processing unit 50.
- the acquisition unit 10 is appropriately configured according to the mode of the system including the endoscope.
- the acquisition unit 10 is a reader device that detachably mounts the recording medium and reads out the recorded image data. Be composed.
- the acquisition unit 10 is configured by a communication device or the like that can bidirectionally communicate with the server, and performs image data communication with the server. To get.
- the acquisition unit 10 may be configured by an interface device or the like to which image data is input from an endoscope via a cable.
- the input unit 20 receives input of various operations by the observer, and outputs an operation signal corresponding to the received operation to the control unit 40.
- the input unit 20 is configured using an input interface such as a keyboard, a mouse, a touch panel, a switch, and a button.
- the recording unit 30 operates the image processing apparatus 1 in addition to the image data and the moving image data acquired by the acquisition unit 10 and a program for causing the image processing apparatus 1 to execute various functions. Record the data used, etc.
- the recording unit 30 has a program recording unit 31 that records a program executed by the image processing apparatus 1.
- the recording unit 30 is realized by various IC memories such as a flash memory, a ROM (Read Only Memory) and a RAM (Random Access Memory), and a hard disk and an SSD (Solid State Drive) built in or connected by a data communication terminal.
- the control unit 40 is configured using a general-purpose processor such as a CPU (Central Processing Unit) or a dedicated processor such as an arithmetic circuit that executes a specific function such as an ASIC (Application Specific Integrated Circuit) or an FPGA (Field Programmable Gate Array). Is done.
- a general-purpose processor such as a CPU (Central Processing Unit) or a dedicated processor such as an arithmetic circuit that executes a specific function such as an ASIC (Application Specific Integrated Circuit) or an FPGA (Field Programmable Gate Array). Is done.
- the control unit 40 is a general-purpose processor
- the recording unit 30 reads various programs to be recorded, issues instructions to each unit constituting the image processing apparatus 1, transfers data, and the like, and controls the overall operation of the image processing apparatus 1. And control.
- the control unit 40 is a special-purpose processor, the processor may execute various processes independently, or the processor and the recording unit 30 may cooperate or use various data recorded by the recording unit 30. Various processes may be executed
- the image processing unit 50 performs image processing on the image data input from the acquisition unit 10 and outputs the image data to the display device 2.
- the image processing unit 50 is configured using a dedicated processor such as an arithmetic circuit that executes a specific function such as an ASIC, an FPGA, and a GPU (Graphics Processing Unit).
- the image processing unit 50 reads a program recorded by the recording unit 30 to be described later, and generates a visualized image of a correlation value between an image signal value for each predetermined region and a reference signal in an image corresponding to the acquired image data. Generate and output this image to the display device 2.
- the processor may execute various processes independently, or the processor and the recording unit 30 may cooperate by using various data and the like recorded by the recording unit 30. Alternatively, the processing may be executed in combination.
- the image processing unit 50 includes a setting unit 51, a detection unit 52, a calculation unit 53, a generation unit 54, and a display control unit 55.
- the setting unit 51 sets, for each of the plurality of images acquired by the acquiring unit 10, a plurality of detection regions in which image signal values change according to the movement of the living body. Specifically, the setting unit 51 sets, for each of the plurality of images, a region in which the image signal value temporally changes due to the origin of a circulatory organ (for example, a heart, a blood vessel, a lymph vessel, or the like) in the living body.
- the image is divided into regions, and the plurality of divided regions are set as a plurality of detection regions.
- the setting unit 51 detects an area in which the image signal value changes with time due to a pulse or the like in a living body based on the image signal value of each pixel of the plurality of images, and converts the detected area into a plurality of areas. A plurality of detection areas are set by dividing.
- the setting unit 51 detects a region where the image signal value periodically changes due to a pulse in the living body or the like based on the image signal value.
- the setting unit 51 is not limited to this. Based on the color, etc., a region that changes with time due to the origin of the circulatory organ in the living body may be detected.
- the detection unit 52 detects an image signal value that changes with time in each of the plurality of detection regions set by the setting unit 51 for each of a plurality of images. Specifically, the detection unit 52 detects an image signal value that changes with time for each detection area set by the setting unit 51.
- the calculation unit 53 calculates a correlation value between the image signal value of each of the plurality of detection regions detected by the detection unit 52 and a preset time-varying reference signal value. Specifically, the calculation unit 53 compares the image signal value of each detection area detected by the detection unit 52 with a preset time-varying reference signal value, and calculates the comparison result as a correlation value. I do.
- the generation unit 54 generates visualization information for identifying a correlation value for each of the correlation values of the plurality of detection regions calculated by the calculation unit 53.
- the display control unit 55 superimposes the visualization information generated by the generation unit 54 on the plurality of images acquired by the acquisition unit 10 and outputs the visualized information to the external display device 2.
- FIG. 2 is a flowchart illustrating an outline of a process executed by the image processing apparatus 1.
- the setting unit 51 determines, for a plurality of images corresponding to the plurality of image data input from the acquisition unit 10, a plurality of detection regions in which image signal values change according to time derived from a circulatory organ in a living body. It is set (step S102). Specifically, as shown in FIG. 4, the setting unit 51 sets a plurality of detection regions R 1 ⁇ R n for a given area of the image P 1. The setting unit 51 sets, for example, an area in which the rate of change or the amount of change in the image signal value between temporally adjacent images is equal to or greater than a predetermined threshold as a detection area.
- the detection unit 52 detects, for each of the plurality of images, the image signal value of each of the plurality of detection regions set by the setting unit 51 (Step S103).
- the calculation unit 53 calculates a correlation value between the image signal value that changes with time and the reference signal in each of the plurality of detection regions detected by the detection unit 52 (Step S104). After step S104, the image processing apparatus 1 proceeds to step S105 described below.
- FIG. 5 is a diagram schematically illustrating an example of a calculation method of the correlation value calculated by the calculation unit 53.
- FIG. 6 is a diagram showing a temporal change of the image signal value of the detection area Ra of FIG. 5 and a temporal change of the reference signal of the reference area Rb.
- the horizontal axis represents time
- the vertical axis represents the intensity of the image signal (Signal ⁇ value).
- a curve La indicates a temporal change of the image signal value of the detection area Ra of FIG. 5
- a curve Lb indicates a temporal change of the reference signal of the reference area Rb of FIG.
- the reference region Rb is set according to an instruction signal from the input unit 20.
- the Euclidean distance d is calculated by the following equation (1).
- step S105 the generation unit 54 generates visualization information in which the correlation values of the plurality of detection regions calculated by the calculation unit 53 are visualized. Specifically, as illustrated in FIG. 7, the generation unit 54 generates visualization information in which a number corresponding to each correlation value of the plurality of detection regions R1 calculated by the calculation unit 53 is assigned.
- the display control unit 55 superimposes the visualization information generated by the generation unit 54 on the image and outputs the image to the display device 2 (step S106).
- the display control unit 55 superimposes the visualization information generated by the generation unit 54 on the image and outputs the image to the display device 2 (step S106).
- Step S107: Yes the image processing apparatus 1 ends this processing.
- Step S107: No the image processing apparatus 1 returns to Step S101 described above.
- an abnormal part of a living body can be intuitively grasped for each region in an image.
- the calculation unit 53 calculates the correlation value between the image signal value of the detection area Ra detected by the detection unit 52 and the reference signal value of the reference area Rb.
- the reference region Rb can be appropriately changed according to the above, and of course, a reference signal value created using image data generated by imaging a normal tissue in advance may be used.
- Embodiment 2 Next, a second embodiment will be described.
- the calculation method calculated by the calculation unit is different. Specifically, in Embodiment 1 described above, the calculating unit 53 calculates the correlation value between the image signal of the detection area Ra detected by the detecting unit 52 and the preset reference signal. In mode 2, a correlation value between an image signal of a detection area in an image acquired within the same time and a reference signal of a preset reference area is calculated.
- a calculation method calculated by the calculation unit according to the second embodiment will be described. Note that the same components as those of the image processing apparatus 1 according to the first embodiment described above are denoted by the same reference numerals, and detailed description thereof will be omitted.
- FIG. 8 is a diagram schematically illustrating an example of a calculation method of the correlation value calculated by the calculation unit 53.
- FIG. 8 shows the detection area Ra and the reference area Rb calculated by the calculation unit 53.
- FIG. 8 shows a temporal change of the image signal value of the detection area Ra and a temporal change of the reference signal value of the reference area Rb.
- the horizontal axis represents time
- the vertical axis represents the intensity (Signal value) of the image signal.
- a curve La indicates a temporal change of the image signal value of the detection area Ra to the detection area Ra n of FIG. 8
- a curve Lb indicates the reference signal value of the reference area Rb to the detection area Rb n of FIG. Shows the change over time.
- the calculation unit 53 calculates a correlation value between the image signal value of the detection region Ra detected by the detection unit 52 and the reference signal value of the reference region Rb at the same time. Specifically, the calculation unit 53 calculates the image signal of each of the plurality of detection regions Ra and the reference signal value of the reference region Rb in the image acquired in the same time by the same calculation method as in the first embodiment described above. Is calculated.
- an abnormal part of a living body can be intuitively grasped for each region in an image.
- the calculation unit 53 calculates the correlation value between the image signal value of the detection region Ra and the reference signal value of the reference region Rb at the same time detected by the detection unit 52.
- the reference region Rb can be appropriately changed according to the operation of 20, or the correlation value may be calculated using the reference signal value of the reference region Rb in the image that is temporally successive.
- the calculation method calculated by the calculation unit is different. Specifically, in Embodiment 1 described above, the calculating unit 53 calculates the correlation value between the image signal of the detection area Ra detected by the detecting unit 52 and the preset reference signal. In mode 3, a correlation value is calculated using one of image signals in the same detection region of two or more images acquired at different times as a reference signal.
- a calculation method calculated by the calculation unit according to the second embodiment will be described. Note that the same components as those of the image processing apparatus 1 according to the first embodiment described above are denoted by the same reference numerals, and detailed description thereof will be omitted.
- FIG. 9 is a diagram schematically illustrating an example of a calculation method of the correlation value calculated by the calculation unit 53.
- FIG. 9 shows a detection region Rc1 and a detection region rc2 which are reference regions calculated by the calculation unit 53.
- FIG. 9 shows a temporal change of the image signal value of the detection region Ra and a temporal change of the reference signal of the reference region Rb.
- the horizontal axis represents time
- the vertical axis represents the intensity of the image signal.
- a curve La indicates a temporal change of the image signal of the detection area Ra of FIG. 9
- a curve Lb indicates a temporal change of the reference signal of the reference area Rb of FIG.
- the calculation unit 53 uses the image signal values of the detection area Ra detected by the detection unit 52 and the detection areas in the images P 1 and P 2 (two past images) as a reference area.
- a correlation value with a reference signal value as Rc is calculated.
- the calculation unit 53 calculates each of the plurality of reference regions Rc in the images P 1 and P 2 separated by a predetermined time (for example, 24 hours or more) by a calculation method similar to that of the first embodiment.
- a correlation value between the reference signal and the image signal value of the detection area Rc of the latest images P n-1 and P n is calculated.
- an abnormal part of a living body can be intuitively grasped for each region in an image.
- the image processing apparatus according to the fourth embodiment has a different configuration from the image processing apparatus 1 according to the first embodiment. Specifically, in the above-described first embodiment, the calculation unit 53 calculates the correlation value between the image signal of the detection area and the preset reference signal. Using the discriminator created based on the learning result learned using the data, it is determined whether the detection area is normal or abnormal.
- the configuration of the image processing apparatus according to the fourth embodiment will be described. Note that the same components as those of the image processing apparatus 1 according to the first embodiment described above are denoted by the same reference numerals, and detailed description thereof will be omitted.
- FIG. 10 is a block diagram illustrating a functional configuration of the image processing apparatus according to the fourth embodiment.
- the image processing apparatus 1A shown in FIG. 10 further includes a discriminator 60 in addition to the configuration of the image processing apparatus 1 according to Embodiment 1 described above.
- the classifier 60 is calculated by the calculation unit 53 based on a learning result of learning a correlation value based on a plurality of temporally continuous learning images generated by imaging each of a normal tissue and an abnormal tissue. It is determined whether or not the correlation value is abnormal, and this determination result is output to the image processing unit 50.
- FIG. 11 is a diagram schematically illustrating a determination method performed by the classifier 60.
- the discriminator 60 uses image signal values (curves L11 to L16) of a plurality of temporally continuous learning images generated by imaging each of a normal tissue and an abnormal tissue. Based on the learning result learned, it is determined whether the correlation value calculated by the calculation unit 53 is abnormal, and this determination result is output to the image processing unit 50.
- the curves L11 to L16 show image signals corresponding to the states of the respective abnormal levels shown in FIG. Specifically, a curve L11 indicates a normal level image signal, a curve L12 indicates an abnormal level LV1 image signal, a curve L13 indicates an abnormal level LV2 image signal, and a curve L16 indicates an abnormal level LV6. 5 shows an image signal of the first embodiment.
- FIG. 12 is a diagram schematically illustrating the state of each abnormal level.
- the abnormal level LV1 which is an early cancer moistens the colon mucosa D1
- the abnormal level LV2 which is an early cancer moistens the colon mucosa D1 and the submucosa D2
- the abnormal level LV3 which is an advanced cancer Is moist to the proper muscle layer D3
- the abnormal levels LV4 and LV5, which are advanced cancer are moistened to the lower serosal layer D4 and the water film D5
- the abnormal level LV6, which is advanced cancer infiltrates the adjacent organ D6.
- the discriminator 60 performs learning using the image signal values of the learning image obtained by imaging the cancer at each level.
- the display control unit 55 outputs the determination result of the discriminator 60 to the display device 2 by superimposing the determination result of the discriminator 60 on the image, or outputs the determination result of the discriminator 60 to the display device 2.
- the observer can intuitively grasp the state of the subject.
- the observer can intuitively grasp the state of the subject.
- FIG. 13 is a diagram schematically showing a plurality of detection areas in an image.
- FIG. 14 is a diagram schematically illustrating a calculation result using cross-correlation with respect to the image signal of the detection region R1 in FIG.
- FIG. 15 is a diagram schematically showing a calculation result using the cross-correlation with respect to the image signal of the detection region R2 in FIG.
- the calculation unit 53 calculates the correlation between the image signals of the detection region R1 and the detection region R2 with respect to the time-series reference signal. Specifically, when the similarity is z ( ⁇ ), the reference signal is h (t), and the image signal is x (t), the calculation unit 53 calculates the reference signal using the following integral equation (2). Formulate similarity.
- the correlation value Pmax1 of the reference signal is low in the detection region R1
- the correlation value Pmax2 of the reference signal is high in the detection region R2 as shown in FIG.
- an abnormal part of a living body can be intuitively grasped for each region in an image.
- the display control unit 55 outputs the visualization information to the display device 2
- the visualization information generated by the generation unit 54 is used. Is superimposed on the image and output to the display device 2.
- the display control unit 55 superimposes the visualization information generated by the generation unit 54 on the image P100 and outputs it to the display device 2.
- the display control unit 55 superimposes the visualization information R101 generated by the generation unit 54 on the image P100 so as to be distinguishable from the other detection regions R100, and outputs it to the display device 2.
- the display control unit 55 transmits the visualization information and superimposes it on the image P100 and outputs it to the display device 2.
- the present invention is not limited to this. An image in which a frame, a symbol, or the like is superimposed on a detection area smaller than the threshold value may be output to the display device 2.
- the display control unit 55 according to the above-described first to fourth embodiments outputs the visualization information to the display device 2.
- the correlation value calculated by the calculation unit 53 is used.
- Each of the plurality of detection areas is identifiably emphasized and output to the external display device 2.
- the display control unit 55 sets the correlation value of the plurality of detection regions R200 to a predetermined threshold value based on the correlation value calculated by the calculation unit 53, for example.
- Each of the smaller detection regions R201 is distinguishably emphasized with respect to the detection region R200 and output to the external display device 2. Thereby, the observer can intuitively grasp the abnormal area.
- the imaging apparatus is used. Even if there is, it can be applied.
- the “unit” described above can be read as “means” or “circuit”.
- the control unit can be read as a control unit or a control circuit.
Landscapes
- Health & Medical Sciences (AREA)
- Life Sciences & Earth Sciences (AREA)
- Surgery (AREA)
- Nuclear Medicine, Radiotherapy & Molecular Imaging (AREA)
- Biomedical Technology (AREA)
- Optics & Photonics (AREA)
- Pathology (AREA)
- Radiology & Medical Imaging (AREA)
- Biophysics (AREA)
- Engineering & Computer Science (AREA)
- Physics & Mathematics (AREA)
- Heart & Thoracic Surgery (AREA)
- Medical Informatics (AREA)
- Molecular Biology (AREA)
- Animal Behavior & Ethology (AREA)
- General Health & Medical Sciences (AREA)
- Public Health (AREA)
- Veterinary Medicine (AREA)
- Endoscopes (AREA)
Abstract
画像内の領域毎に生体の異常部を直感的に把握することができる画像処理装置、画像処理方法およびプログラムを提供する。画像処理装置(1)は、複数の画像データを外部から取得する取得部(10)と、複数の画像データに対応する複数の画像の各々に対して、生体の動作に応じて画像信号値が変化する複数の検出領域を設定する設定部(51)と、複数の画像毎に、複数の検出領域の各々において画像信号値を検出する検出部(52)と、複数の検出領域の各々の画像信号値と予め設定された時間的に変化する基準信号値との相関値を算出する算出部(53)と、複数の検出領域の各々の相関値のそれぞれについて、相関値を識別する可視化情報を生成する生成部(54)と、を備える。
Description
本開示は、外部から入力される画像データに対して画像処理を行う画像処理装置、画像処理方法およびプログラムに関する。
近年、内視鏡システムにおいては、胃粘膜が萎縮した萎縮部等の異常部と正常部との色の差を強調した画像を表示する技術が知られている(特許文献1参照)。この技術では、狭帯域信号を少なくとも1つを含む第1カラー画像信号のうち、2色の画像信号間の第1信号比と、この第1信号比と異なる2色の画像信号間の第2信号比とで形成される特徴区間において、被検体内の観察対象が分布する第1範囲、第2範囲および第3範囲を移動させる移動処理を行い、この移動処理した後の第1信号比と第2信号比から得られる特殊画像を表示することによって、異常部と正常部との色の差を強調する。
また、被観察者に違和感や不快感を与えることなく、被検体者の生体情報の観察および生体状態の異常の検出を行う技術が知られている(特許文献2参照)。この技術によれば、時間的に連続した複数のフレームで構成された画像内の所定の領域から被観察者の生体情報を検出し、この検出した生体情報のデータまたは生体情報のデータの変化と、生体の状態の異常の判定に用いられる所定の生体パラメータとを比較し、被観察者の生体状態に発した異常を検出する。
しかしながら、上述した特許文献1では、色の差によって異常部と正常部とを領域毎に強調されることによって観察者が判別しているが、異常部によっては色の差がほとんど生じない領域、例えば炎症や初期癌等を有する領域においては色の差異が生じないため、観察者が異常部の判別を行うことができないという問題点があった。
また、上述した特許文献2では、脈拍数に基づいて、被観察者の生体状態を判定しているため、画像内の領域毎の正常または異常の判定を行うことができないという問題点があった。
本開示は、上記に鑑みてなされたものであって、画像内の領域毎に生体の異常部を直感的に把握することができる画像処理装置、画像処理方法およびプログラムを提供する。
上述した課題を解決し、目的を達成するために、本開示に係る画像処理装置は、生体の一部位を撮像することによって生成された時間的に連続する複数の画像データを取得する取得部と、前記複数の画像データに対応する複数の画像の各々に対して、前記生体の動作に応じて画像信号値が変化する複数の検出領域を設定する設定部と、前記複数の画像毎に、前記複数の検出領域の各々において前記画像信号値を検出する検出部と、前記複数の検出領域の各々の前記画像信号値と予め設定された時間的に変化する基準信号値との相関値を算出する算出部と、前記複数の検出領域の各々の前記相関値のそれぞれについて、前記相関値を識別する可視化情報を生成する生成部と、を備える。
また、本開示に係る画像処理装置は、上記開示において、前記基準信号値は、同一時間または時間的に前後する前記画像内における前記複数の検出領域のいずれか1つにおいて前記検出部が検出した前記画像信号値である。
また、本開示に係る画像処理装置は、上記開示において、前記設定部は、前記生体の同一部位を撮像することによって生成された複数の過去画像であって、前記複数の画像と時間が異なる複数の過去画像に対して、前記複数の検出領域を設定し、前記検出部は、前記複数の過去画像おける前記複数の検出領域の各々において前記画像信号値を検出し、前記基準信号値は、前記複数の過去画像おける前記複数の検出領域の各々に対して、前記検出部が検出した前記画像信号値である。
また、本開示に係る画像処理装置は、上記開示において、正常組織および異常組織の各々を撮像することによって生成された時間的に連続する複数の学習画像に基づいて、前記相関値を学習した識別器をさらに備え、前記識別器は、前記相関値が異常であるか否かを判定する。
また、本開示に係る画像処理装置は、上記開示において、前記可視化情報を前記画像に重畳して外部の表示装置へ出力する表示制御部をさらに備える。
また、本開示に係る画像処理装置は、上記開示において、前記相関値に基づいて、前記複数の検出領域の各々を識別可能に強調することによって外部の表示装置へ出力する表示制御部をさらに備える。
また、本開示に係る画像処理方法は、生体の一部位を撮像することによって生成された時間的に連続する複数の画像データを取得し、前記複数の画像データに対応する複数の画像の各々に対して、前記生体の動作に応じて画像信号値が変化する複数の検出領域を設定し、前記複数の画像毎に、前記複数の検出領域の各々において前記画像信号値を検出し、前記複数の検出領域の各々の前記画像信号値と予め設定された時間的に変化する基準信号値との相関値を算出し、前記複数の検出領域の各々の前記相関値のそれぞれについて、前記相関値を識別する可視化情報を生成する。
また、本開示に係るプログラムは、生体の一部位を撮像することによって生成された時間的に連続する複数の画像データを取得し、前記複数の画像データに対応する複数の画像の各々に対して、前記生体の動作に応じて画像信号値が変化する複数の検出領域を設定し、前記複数の画像毎に、前記複数の検出領域の各々において前記画像信号値を検出し、前記複数の検出領域の各々の前記画像信号値と予め設定された時間的に変化する基準信号値との相関値を算出し、前記複数の検出領域の各々の前記相関値のそれぞれについて、前記相関値を識別する可視化情報を生成する。
本開示によれば、画像内の領域毎に生体の異常部を直感的に把握することができるという効果を奏する。
以下、本開示を実施するための形態(以下、「実施の形態」という)について説明する。この実施の形態では、被検体や被観察者を撮像することによって画像データ(RAWデータ)を生成する内視鏡、撮像装置および顕微鏡のいずれか1つと双方向に通信可能な画像処理装置について説明する。また、この実施の形態により、本開示が限定されるものでない。さらに、図面の記載において、同一部分には同一の符号を付して説明する。
(実施の形態1)
〔画像処理装置の構成〕
図1は、実施の形態1に係る画像処理装置の機能構成を示すブロック図である。図1に示す画像処理装置1は、一例として、内視鏡(軟性内視鏡および硬性内視鏡等の内視鏡スコープ)またはカプセル型内視鏡(以下、これらをまとめて単に「内視鏡」という)によって、所定の波長帯域の光が照射された生体の同一部位を連続的に撮像することにより取得された時間的に連続する複数のフレームで構成された画像データに対応する画像内における所定の領域を複数の検出領域として分割し、この複数の検出領域の各々において時間的に変化する画像信号値と予め設定された時間的に変化する基準信号値とを比較した相関値を可視化する画像処理を実行する装置である。また、画像データは、通常、各画素位置において、R(赤)、G(緑)、B(青)の波長成分に対する画素レベル(画素値)を持つカラー画像データである。
〔画像処理装置の構成〕
図1は、実施の形態1に係る画像処理装置の機能構成を示すブロック図である。図1に示す画像処理装置1は、一例として、内視鏡(軟性内視鏡および硬性内視鏡等の内視鏡スコープ)またはカプセル型内視鏡(以下、これらをまとめて単に「内視鏡」という)によって、所定の波長帯域の光が照射された生体の同一部位を連続的に撮像することにより取得された時間的に連続する複数のフレームで構成された画像データに対応する画像内における所定の領域を複数の検出領域として分割し、この複数の検出領域の各々において時間的に変化する画像信号値と予め設定された時間的に変化する基準信号値とを比較した相関値を可視化する画像処理を実行する装置である。また、画像データは、通常、各画素位置において、R(赤)、G(緑)、B(青)の波長成分に対する画素レベル(画素値)を持つカラー画像データである。
図1に示す画像処理装置1は、取得部10と、入力部20と、記録部30と、制御部40と、画像処理部50と、を備える。
取得部10は、内視鏡によって撮像された画像データに対応する画像を取得し、取得した画像データを画像処理部50へ出力する。取得部10は、内視鏡を含むシステムの態様に応じて適宜構成される。例えば、取得部10は、内視鏡との間の画像データの受け渡しに可搬型の記録媒体が使用される場合、この記録媒体を着脱自在に装着し、記録された画像データを読み出すリーダ装置として構成される。また、取得部10は、内視鏡によって撮像された画像データを記録するサーバを用いる場合、このサーバと双方向に通信可能な通信装置等で構成され、サーバとデータ通信を行うことによって画像データを取得する。さらにまた、取得部10は、内視鏡からケーブルを介して画像データが入力されるインターフェース装置等で構成してもよい。
入力部20は、観察者による各種操作の入力を受け付け、この受け付けた操作に応じた操作信号を制御部40へ出力する。入力部20は、例えばキーボード、マウス、タッチパネル、スイッチおよびボタン等の入力インターフェースを用いて構成される。
記録部30は、取得部10によって取得された画像データや動画データの他、画像処理装置1を動作させるとともに、種々の機能を画像処理装置1に実行させるためのプログラム、このプログラムの実行中に使用されるデータ等を記録する。記録部30は、画像処理装置1が実行するプログラムを記録するプログラム記録部31を有する。記録部30は、フラッシュメモリ、ROM(Read Only Memory)およびRAM(Random Access Memory)といった各種ICメモリ、および内蔵若しくはデータ通信端子で接続されたハードディスクおよびSSD(Solid State Drive)等によって実現される。
制御部40は、CPU(Central Processing Unit)等の汎用プロセッサまたはASIC(Application Specific Integrated Circuit)やFPGA(Field Programmable Gate Array)等の特定の機能を実行する各種演算回路等の専用プロセッサを用いて構成される。制御部40が汎用プロセッサである場合、記録部30が記録する各種プログラムを読み込むことによって画像処理装置1を構成する各部への指示やデータの転送等を行い、画像処理装置1全体の動作を統括して制御する。また、制御部40が専用プロセッサである場合、プロセッサが単独で種々の処理を実行しても良いし、記録部30が記録する各種データ等を用いることで、プロセッサと記録部30が協働または結合して種々の処理を実行してもよい。
画像処理部50は、取得部10から入力された画像データに対して画像処理を施して表示装置2へ出力する。画像処理部50は、ASIC、FPGAおよびGPU(Graphics Processing Unit)等の特定の機能を実行する各種演算回路等の専用プロセッサを用いて構成される。画像処理部50は、後述する記録部30が記録するプログラムを読み込むことにより、取得した画像データに対応する画像内における所定の領域毎の画像信号値と基準信号との相関値の可視化した画像を生成し、この画像を表示装置2へ出力する。また、画像処理部50が専用プロセッサである場合、プロセッサが単独で種々の処理を実行してもよいし、記録部30が記録する各種データ等を用いることで、プロセッサと記録部30が協働または結合して処理を実行してもよい。
ここで、画像処理部50の詳細な構成について説明する。
画像処理部50は、設定部51と、検出部52と、算出部53と、生成部54と、表示制御部55と、を備える。
画像処理部50は、設定部51と、検出部52と、算出部53と、生成部54と、表示制御部55と、を備える。
設定部51は、取得部10によって取得された複数の画像の各々に対して、生体の動作に応じて画像信号値が変化する複数の検出領域を設定する。具体的には、設定部51は、複数の画像の各々に対して、生体内における循環器(例えば心臓、血管およびリンパ管等)の由来によって時間的に画像信号値が変化する領域を複数の領域に分割し、この分割した複数を複数の検出領域として設定する。例えば、設定部51は、複数の画像の各画素の画像信号値に基づいて、生体内の脈拍等によって時間的に画像信号値が変化する領域を検出し、この検出した領域を複数の領域に分割することによって複数の検出領域を設定する。なお、設定部51は、画像信号値に基づいて、生体内の脈拍等によって周期的に画像信号値が変化する領域を検出しているが、これに限定されることなく、彩度、明るさ、色味等に基づいて、生体内における循環器の由来によって時間的に変化する領域を検出してもよい。
検出部52は、複数の画像毎に、設定部51によって設定された複数の検出領域の各々において時間的に変化する画像信号値を検出する。具体的には、検出部52は、設定部51によって設定された検出領域毎に時間的に変化する画像信号値を検出する。
算出部53は、検出部52によって検出された複数の検出領域の各々の画像信号値と予め設定された時間的に変化する基準信号値との相関値を算出する。具体的には、算出部53は、検出部52によって検出された各検出領域の画像信号値と予め設定された時間的に変化する基準信号値とを比較し、この比較結果を相関値として算出する。
生成部54は、算出部53によって算出された複数の検出領域の各々の相関値のそれぞれについて、相関値を識別する可視化情報を生成する。
表示制御部55は、生成部54によって生成された可視化情報を、取得部10が取得した複数の画像に重畳して外部の表示装置2へ出力する。
〔画像処理装置の処理〕
次に、画像処理装置1が実行する処理について説明する。図2は、画像処理装置1が実行する処理の概要を示すフローチャートである。
次に、画像処理装置1が実行する処理について説明する。図2は、画像処理装置1が実行する処理の概要を示すフローチャートである。
図2に示すように、まず、取得部10は、外部から生体の同一部位を撮像した複数のデータであって、時間的に異なる複数の画像データを取得する(ステップS101)。具体的には、図3に示すように、取得部10は、生体の同一部位を撮像した時間的に連続する複数の画像データ(画像P1,・・・,Pn―1,Pn(n=3以上の整数))を内視鏡または外部のサーバ等から取得する。
続いて、設定部51は、取得部10から入力された複数の画像データに対応する複数の画像に対して、生体内の循環器に由来した時間によって画像信号値が変化する複数の検出領域を設定する(ステップS102)。具体的には、図4に示すように、設定部51は、画像P1の所定の領域に対して複数の検出領域R1~Rnを設定する。なお、設定部51は、例えば時間的に隣接する画像間の画像信号値の変化率または変化量が所定の閾値以上の領域を検出領域として設定する。
続いて、検出部52は、複数の画像毎に、設定部51によって設定された複数の検出領域の各々の画像信号値を検出する(ステップS103)。
その後、算出部53は、検出部52が検出した複数の検出領域の各々において時間的に変化する画像信号値と基準信号との相関値を算出する(ステップS104)。ステップS104の後、画像処理装置1は、後述するステップS105へ移行する。
図5は、算出部53が算出する相関値の算出方法の一例を模式的に説明する図である。図6は、図5の検出領域Raの画像信号値の時間的な変化および基準領域Rbの基準信号の時間的な変化を示す図である。また、図6において、横軸が時間を示し、縦軸が画像信号の強度(Signal value)を示す。さらに、図6において、曲線Laが図5の検出領域Raの画像信号値の時間的な変化を示し、曲線Lbが図5の基準領域Rbの基準信号の時間的な変化を示す。なお、基準領域Rbは、入力部20からの指示信号に応じて設定される。
図6の曲線Laおよび曲線Lbに示すように、算出部53は、検出部52が検出した検出領域Raの画像信号値と基準領域Rbの基準信号値との相関値を算出する。具体的には、算出部53は、検出領域Raの画像信号値を画像信号値a、基準信号値を基準信号値bとした場合、周知のユークリッド距離によって、検出領域Raの画像信号値と基準信号値との相関値を算出する。例えば、図6に示すように、算出部53は、画像信号値a=(a1,a2,a3,・・・ai)、基準信号値b=(b1,b2,b3,・・・,bi)とした場合において、以下の式(1)によって、ユークリッド距離dを算出する。

上記において、算出部53は、相関値(類似度)=1/(1+d)と定義すると、完全に画像信号値aと基準信号値bとが一致する場合、d=0と算出し,相関値=1と算出する。即ち、ユークリッド距離dは、画像信号値aと基準信号値bとに差に応じて大きくなり、類似度が0に近づく。
図2に戻り、ステップS105以降の説明を続ける。
ステップS105において、生成部54は、算出部53が算出した複数の検出領域の各々の相関値の可視化を行った可視化情報を生成する。具体的には、図7に示すように、生成部54は、算出部53が算出した複数の検出領域R1の各々の相関値に対応する数字を割り当てた可視化情報を生成する。
ステップS105において、生成部54は、算出部53が算出した複数の検出領域の各々の相関値の可視化を行った可視化情報を生成する。具体的には、図7に示すように、生成部54は、算出部53が算出した複数の検出領域R1の各々の相関値に対応する数字を割り当てた可視化情報を生成する。
続いて、表示制御部55は、生成部54が生成した可視化情報を画像に重畳して表示装置2へ出力する(ステップS106)。これにより、表示装置2が表示する画像を観察するだけで、他の領域と異常の領域とを直感的に把握することができる。
その後、被検体の検査を終了する場合(ステップS107:Yes)、画像処理装置1は、本処理を終了する。これに対して、被検体の検査を終了しない場合(ステップS107:No)、画像処理装置1は、上述したステップS101へ戻る。
以上説明した実施の形態1によれば、画像内の領域毎に生体の異常部を直感的に把握することができる。
なお、実施の形態1では、算出部53が検出部52によって検出された検出領域Raの画像信号値と基準領域Rbの基準信号値との相関値を算出していたが、入力部20の操作に応じて基準領域Rbを適宜変更することができるし、もちろん、予め正常組織を撮影して生成した画像データを用いて作成した基準信号値を用いてもよい。
(実施の形態2)
次に、実施の形態2について説明する。実施の形態2では、算出部が算出する算出方法が異なる。具体的には、上述した実施の形態1では、算出部53が検出部52によって検出された検出領域Raの画像信号と予め設定された基準信号との相関値を算出していたが、実施の形態2では、同時間内で取得した画像内における検出領域の画像信号と予め設定された基準領域の基準信号との相関値を算出する。以下においては、実施の形態2に係る算出部が算出する算出方法について説明する。なお、上述した実施の形態1に係る画像処理装置1と同一の構成には同一の符号を付して詳細な説明は省略する。
次に、実施の形態2について説明する。実施の形態2では、算出部が算出する算出方法が異なる。具体的には、上述した実施の形態1では、算出部53が検出部52によって検出された検出領域Raの画像信号と予め設定された基準信号との相関値を算出していたが、実施の形態2では、同時間内で取得した画像内における検出領域の画像信号と予め設定された基準領域の基準信号との相関値を算出する。以下においては、実施の形態2に係る算出部が算出する算出方法について説明する。なお、上述した実施の形態1に係る画像処理装置1と同一の構成には同一の符号を付して詳細な説明は省略する。
〔算出部の算出方法〕
図8は、算出部53が算出する相関値の算出方法の一例を模式的に説明する図である。図8は、算出部53が算出する検出領域Raおよび基準領域Rbを示す。また、図8は、検出領域Raの画像信号値の時間的な変化および基準領域Rbの基準信号値の時間的な変化を示す。また、図8において、横軸が時間を示し、縦軸が画像信号の強度(Signal value)を示す。さらに、図8において、曲線Laが図8の検出領域Ra~検出領域Ranの画像信号値の時間的な変化を示し、曲線Lbが図8の基準領域Rb~検出領域Rbnの基準信号値の時間的な変化を示す。
図8は、算出部53が算出する相関値の算出方法の一例を模式的に説明する図である。図8は、算出部53が算出する検出領域Raおよび基準領域Rbを示す。また、図8は、検出領域Raの画像信号値の時間的な変化および基準領域Rbの基準信号値の時間的な変化を示す。また、図8において、横軸が時間を示し、縦軸が画像信号の強度(Signal value)を示す。さらに、図8において、曲線Laが図8の検出領域Ra~検出領域Ranの画像信号値の時間的な変化を示し、曲線Lbが図8の基準領域Rb~検出領域Rbnの基準信号値の時間的な変化を示す。
図6の曲線Laおよび曲線Lbに示すように、算出部53は、検出部52が検出した検出領域Raの画像信号値と同一時間の基準領域Rbの基準信号値との相関値を算出する。具体的には、算出部53は、上述した実施の形態1と同様の算出方法によって、同時間内で取得した画像内における複数の検出領域Raの各々の画像信号と基準領域Rbの基準信号値との相関値を算出する。
以上説明した実施の形態2によれば、画像内の領域毎に生体の異常部を直感的に把握することができる。
なお、実施の形態2では、算出部53が検出部52によって検出された同一時間の検出領域Raの画像信号値と基準領域Rbの基準信号値との相関値を算出していたが、入力部20の操作に応じて基準領域Rbを適宜変更することができるし、もちろん、時間的に前後する画像内における基準領域Rbの基準信号値を用いて相関値を算出してもよい。
(実施の形態3)
次に、実施の形態3について説明する。実施の形態3では、算出部が算出する算出方法が異なる。具体的には、上述した実施の形態1では、算出部53が検出部52によって検出された検出領域Raの画像信号と予め設定された基準信号との相関値を算出していたが、実施の形態3では、異なる時間に取得した2つ以上の画像の同じ検出領域における画像信号のどちらか一方を基準信号として相関値を算出する。以下においては、実施の形態2に係る算出部が算出する算出方法について説明する。なお、上述した実施の形態1に係る画像処理装置1と同一の構成には同一の符号を付して詳細な説明は省略する。
次に、実施の形態3について説明する。実施の形態3では、算出部が算出する算出方法が異なる。具体的には、上述した実施の形態1では、算出部53が検出部52によって検出された検出領域Raの画像信号と予め設定された基準信号との相関値を算出していたが、実施の形態3では、異なる時間に取得した2つ以上の画像の同じ検出領域における画像信号のどちらか一方を基準信号として相関値を算出する。以下においては、実施の形態2に係る算出部が算出する算出方法について説明する。なお、上述した実施の形態1に係る画像処理装置1と同一の構成には同一の符号を付して詳細な説明は省略する。
〔算出部の算出方法〕
図9は、算出部53が算出する相関値の算出方法の一例を模式的に説明する図である。図9は、算出部53が算出する基準領域となる検出領域Rc1および検出領域rc2を示す。また、図9は、検出領域Raの画像信号値の時間的な変化および基準領域Rbの基準信号の時間的な変化を示す。また、図9において、横軸が時間を示し、縦軸が画像信号の強度を示す。さらに、図9において、曲線Laが図9の検出領域Raの画像信号の時間的な変化を示し、曲線Lbが図9の基準領域Rbの基準信号の時間的な変化を示す。
図9は、算出部53が算出する相関値の算出方法の一例を模式的に説明する図である。図9は、算出部53が算出する基準領域となる検出領域Rc1および検出領域rc2を示す。また、図9は、検出領域Raの画像信号値の時間的な変化および基準領域Rbの基準信号の時間的な変化を示す。また、図9において、横軸が時間を示し、縦軸が画像信号の強度を示す。さらに、図9において、曲線Laが図9の検出領域Raの画像信号の時間的な変化を示し、曲線Lbが図9の基準領域Rbの基準信号の時間的な変化を示す。
図9の曲線Laおよび曲線Lbに示すように、算出部53は、検出部52が検出した検出領域Raの画像信号値と画像P1,P2(2つの過去画像)における検出領域を基準領域Rcとする基準信号値との相関値を算出する。具体的には、算出部53は、上述した実施の形態1と同様の算出方法によって、所定の時間(例えば24時間以上)離れた画像P1,P2内における複数の基準領域Rcの各々の基準信号と最新の画像Pn-1,Pnの検出領域Rcの画像信号値との相関値を算出する。
以上説明した実施の形態3によれば、画像内の領域毎に生体の異常部を直感的に把握することができる。
(実施の形態4)
次に、実施の形態4について説明する。実施の形態4に係る画像処理装置は、上述した実施の形態1に係る画像処理装置1と構成が異なる。具体的には、上述した実施の形態1では、算出部53が検出領域の画像信号と予め設定された基準信号との相関値を算出していたが、実施の形態4では、予め複数の画像データを用いて学習された学習結果に基づいて作成された識別器を用いて、検出領域の正常または異常であるか否かを判定する。以下においては、実施の形態4に係る画像処理装置の構成について説明する。なお、上述した実施の形態1に係る画像処理装置1と同一の構成には同一の符号を付して詳細な説明は省略する。
次に、実施の形態4について説明する。実施の形態4に係る画像処理装置は、上述した実施の形態1に係る画像処理装置1と構成が異なる。具体的には、上述した実施の形態1では、算出部53が検出領域の画像信号と予め設定された基準信号との相関値を算出していたが、実施の形態4では、予め複数の画像データを用いて学習された学習結果に基づいて作成された識別器を用いて、検出領域の正常または異常であるか否かを判定する。以下においては、実施の形態4に係る画像処理装置の構成について説明する。なお、上述した実施の形態1に係る画像処理装置1と同一の構成には同一の符号を付して詳細な説明は省略する。
〔画像処理装置の構成〕
図10は、実施の形態4に係る画像処理装置の機能構成を示すブロック図である。図10に示す画像処理装置1Aは、上述した実施の形態1に係る画像処理装置1の構成に加えて、識別器60をさらに備える。
図10は、実施の形態4に係る画像処理装置の機能構成を示すブロック図である。図10に示す画像処理装置1Aは、上述した実施の形態1に係る画像処理装置1の構成に加えて、識別器60をさらに備える。
まず、識別器60について説明する。識別器60は、正常組織および異常組織の各々を撮像することによって生成された時間的に連続する複数の学習画像に基づいて、相関値を学習した学習結果に基づいて、算出部53が算出した相関値が異常であるか否かを判定し、この判定結果を画像処理部50へ出力する。
〔識別器による判定方法〕
次に、識別器60が判定する判定方法について説明する。図11は、識別器60が判定する判定方法を模式的に示す図である。
次に、識別器60が判定する判定方法について説明する。図11は、識別器60が判定する判定方法を模式的に示す図である。
図11に示すように、識別器60は、正常組織および異常組織の各々を撮像することによって生成された時間的に連続する複数の学習画像の画像信号値(曲線L11~曲線L16)を用いて学習した学習結果に基づいて、算出部53が算出した相関値が異常であるか否かを判定し、この判定結果を画像処理部50へ出力する。ここで、曲線L11~曲線L16は、図12に示す各異常レベルの状態に応じた画像信号を示す。具体的には、曲線L11は、正常レベルの画像信号を示し、曲線L12は、異常レベルLV1の画像信号を示し、曲線L13は、異常レベルLV2の画像信号を示し、曲線L16は、異常レベルLV6の画像信号を示す。
図12は、各異常レベルの状態を模式的に説明する図である。図13に示すように、早期癌である異常レベルLV1は、大腸粘膜D1を湿潤し、早期癌である異常レベルLV2は、大腸粘膜D1および粘膜下層D2を湿潤し、進行癌である異常レベルLV3は、固有筋層D3まで湿潤し、進行癌である異常レベルLV4,LV5は、漿膜下層D4および水膜D5まで湿潤し、進行癌である異常レベルLV6は、隣接臓器D6へ浸潤している。このように、識別器60は、レベル毎の癌を撮像した学習画像の画像信号値を用いて学習を行う。これにより、表示制御部55は、識別器60の判定結果を画像に重畳して表示装置2へ出力する、または識別器60の判定結果を表示装置2へ出力する。この結果、観察者は、直感的に被検体の状態を把握することができる。
以上説明した実施の形態4によれば、観察者が直感的に被検体の状態を把握することができる。
(実施の形態1~4の変形例1)
次に、上述した実施の形態1~4の変形例1について説明する。実施の形態1~4の変形例1では、算出部が算出する相関値の算出方法が異なる。以下においては、実施の形態1~4の変形例1に係る算出部が算出する相関値の算出方法について説明する。なお、上述した実施の形態1に係る画像処理装置1と同一の構成には同一の符号を付して詳細な説明は省略する。
次に、上述した実施の形態1~4の変形例1について説明する。実施の形態1~4の変形例1では、算出部が算出する相関値の算出方法が異なる。以下においては、実施の形態1~4の変形例1に係る算出部が算出する相関値の算出方法について説明する。なお、上述した実施の形態1に係る画像処理装置1と同一の構成には同一の符号を付して詳細な説明は省略する。
図13は、画像内における複数の検出領域を模式的に示す図である。図14は、図13の検出領域R1の画像信号に対して相互相関(Cross-Correlation)を用いた計算結果を模式的に示す図である。図15は、図13の検出領域R2の画像信号に対して相互相関を用いた計算結果を模式的に示す図である。
図13~図15に示すように、算出部53は、時系列の基準信号に対して、検出領域R1および検出領域R2の各々の画像信号の相互関係を算出する。具体的には、算出部53は、類似度をz(τ)、基準信号をh(t)、画像信号をx(t)とした場合、以下の積分式(2)を用いて基準信号に対する類似度を定式化する。

具体的には、図14に示すように、検出領域R1では、基準信号の相関値Pmax1が低く、また、図15に示すように検出領域R2では、基準信号の相関値Pmax2が高い。
以上説明した実施の形態1~4の変形例1によれば、画像内の領域毎に生体の異常部を直感的に把握することができる。
(実施の形態1~4の変形例2)
次に、実施の形態1~4の変形例2について説明する。上述した実施の形態1~4に係る表示制御部55は、可視化情報を表示装置2へ出力していたが、実施の形態1~4の変形例2では、生成部54によって生成された可視化情報を画像に重畳して表示装置2に出力する。具体的には、図16および図17に示すように、表示制御部55は、生成部54によって生成された可視化情報を画像P100に重畳して表示装置2へ出力する。具体的には、表示制御部55は、生成部54によって生成された可視化情報R101を他の検出領域R100と識別可能に画像P100に重畳して表示装置2へ出力する。これにより、観察者は、直感的に異常領域を把握することができる。なお、図16および図17では、表示制御部55は、可視化情報を透過させて画像P100に重畳して表示装置2へ出力しているが、これに限定されることなく、例えば相関値が所定の閾値値より小さい検出領域に対して枠や記号等を重畳した画像を表示装置2へ出力してもよい。
次に、実施の形態1~4の変形例2について説明する。上述した実施の形態1~4に係る表示制御部55は、可視化情報を表示装置2へ出力していたが、実施の形態1~4の変形例2では、生成部54によって生成された可視化情報を画像に重畳して表示装置2に出力する。具体的には、図16および図17に示すように、表示制御部55は、生成部54によって生成された可視化情報を画像P100に重畳して表示装置2へ出力する。具体的には、表示制御部55は、生成部54によって生成された可視化情報R101を他の検出領域R100と識別可能に画像P100に重畳して表示装置2へ出力する。これにより、観察者は、直感的に異常領域を把握することができる。なお、図16および図17では、表示制御部55は、可視化情報を透過させて画像P100に重畳して表示装置2へ出力しているが、これに限定されることなく、例えば相関値が所定の閾値値より小さい検出領域に対して枠や記号等を重畳した画像を表示装置2へ出力してもよい。
(実施の形態1~4の変形例3)
次に、実施の形態1~4の変形例3について説明する。上述した実施の形態1~4に係る表示制御部55は、可視化情報を表示装置2へ出力していたが、実施の形態1~4の変形例3では、算出部53によって算出された相関値に基づいて、複数の検出領域の各々を識別可能に強調して外部の表示装置2へ出力する。具体的には、図18および図19に示すように、表示制御部55は、算出部53によって算出された相関値に基づいて、複数の検出領域R200のうち、例えば相関値が所定の閾値値より小さい検出領域R201の各々を検出領域R200に対して識別可能に強調して外部の表示装置2へ出力する。これにより、観察者は、直感的に異常領域を把握することができる。
次に、実施の形態1~4の変形例3について説明する。上述した実施の形態1~4に係る表示制御部55は、可視化情報を表示装置2へ出力していたが、実施の形態1~4の変形例3では、算出部53によって算出された相関値に基づいて、複数の検出領域の各々を識別可能に強調して外部の表示装置2へ出力する。具体的には、図18および図19に示すように、表示制御部55は、算出部53によって算出された相関値に基づいて、複数の検出領域R200のうち、例えば相関値が所定の閾値値より小さい検出領域R201の各々を検出領域R200に対して識別可能に強調して外部の表示装置2へ出力する。これにより、観察者は、直感的に異常領域を把握することができる。
(その他の実施の形態)
上述した本開示の実施の形態1~4に開示されている複数の構成要素を適宜組み合わせることによって、種々の発明を形成することができる。例えば、上述した本開示の実施の形態1~4に記載した全構成要素からいくつかの構成要素を削除してもよい。さらに、上述した本開示の実施の形態1~4で説明した構成要素を適宜組み合わせてもよい。
上述した本開示の実施の形態1~4に開示されている複数の構成要素を適宜組み合わせることによって、種々の発明を形成することができる。例えば、上述した本開示の実施の形態1~4に記載した全構成要素からいくつかの構成要素を削除してもよい。さらに、上述した本開示の実施の形態1~4で説明した構成要素を適宜組み合わせてもよい。
また、本開示の実施の形態1~4では、撮像装置であったが、例えば被検体を撮像する内視鏡システムやビデオマイクロスコープ、撮像機能を有する携帯電話および撮像機能を有するタブレット型端末であっても適用することができる。
また、本開示の実施の形態1~4では、上述してきた「部」は、「手段」や「回路」などに読み替えることができる。例えば、制御部は、制御手段や制御回路に読み替えることができる。
以上、本願の実施の形態のいくつかを図面に基づいて詳細に説明したが、これらは例示であり、本開示の欄に記載の態様を始めとして、当業者の知識に基づいて種々の変形、改良を施した他の形態で本開示を実施することが可能である。
1,1A 画像処理装置
2 表示装置
10 取得部
20 入力部
30 記録部
31 プログラム記録部
40 制御部
50 画像処理部
51 設定部
52 検出部
53 算出部
54 生成部
55 表示制御部
60 識別器
2 表示装置
10 取得部
20 入力部
30 記録部
31 プログラム記録部
40 制御部
50 画像処理部
51 設定部
52 検出部
53 算出部
54 生成部
55 表示制御部
60 識別器
Claims (8)
- 生体の一部位を撮像することによって生成された時間的に連続する複数の画像データを取得する取得部と、
前記複数の画像データに対応する複数の画像の各々に対して、前記生体の動作に応じて画像信号値が変化する複数の検出領域を設定する設定部と、
前記複数の画像毎に、前記複数の検出領域の各々において前記画像信号値を検出する検出部と、
前記複数の検出領域の各々の前記画像信号値と予め設定された時間的に変化する基準信号値との相関値を算出する算出部と、
前記複数の検出領域の各々の前記相関値のそれぞれについて、前記相関値を識別する可視化情報を生成する生成部と、
を備える画像処理装置。 - 請求項1に記載の画像処理装置であって、
前記基準信号値は、同一時間または時間的に前後する前記画像内における前記複数の検出領域のいずれか1つにおいて前記検出部が検出した前記画像信号値である
画像処理装置。 - 請求項1に記載の画像処理装置であって、
前記設定部は、前記生体の同一部位を撮像することによって生成された複数の過去画像であって、前記複数の画像と時間が異なる複数の過去画像に対して、前記複数の検出領域を設定し、
前記検出部は、前記複数の過去画像おける前記複数の検出領域の各々において前記画像信号値を検出し、
前記基準信号値は、前記複数の過去画像おける前記複数の検出領域の各々に対して、前記検出部が検出した前記画像信号値である
画像処理装置。 - 請求項1~3のいずれか一つに記載の画像処理装置であって、
正常組織および異常組織の各々を撮像することによって生成された時間的に連続する複数の学習画像に基づいて、前記相関値を学習した識別器をさらに備え、
前記識別器は、前記相関値が異常であるか否かを判定する
画像処理装置。 - 請求項1~4のいずれか一つに記載の画像処理装置であって、
前記可視化情報を前記画像に重畳して外部の表示装置へ出力する表示制御部をさらに備える
画像処理装置。 - 請求項1~4のいずれか一つに記載の画像処理装置であって、
前記相関値に基づいて、前記複数の検出領域の各々を識別可能に強調することによって外部の表示装置へ出力する表示制御部をさらに備える
画像処理装置。 - 画像処理装置が実行する画像処理方法であって、
生体の一部位を撮像することによって生成された時間的に連続する複数の画像データを取得し、
前記複数の画像データに対応する複数の画像の各々に対して、前記生体の動作に応じて画像信号値が変化する複数の検出領域を設定し、
前記複数の画像毎に、前記複数の検出領域の各々において前記画像信号値を検出し、
前記複数の検出領域の各々の前記画像信号値と予め設定された時間的に変化する基準信号値との相関値を算出し、
前記複数の検出領域の各々の前記相関値のそれぞれについて、前記相関値を識別する可視化情報を生成する
画像処理方法。 - 画像処理装置に実行させるプログラムであって、
生体の一部位を撮像することによって生成された時間的に連続する複数の画像データを取得し、
前記複数の画像データに対応する複数の画像の各々に対して、前記生体の動作に応じて画像信号値が変化する複数の検出領域を設定し、
前記複数の画像毎に、前記複数の検出領域の各々において前記画像信号値を検出し、
前記複数の検出領域の各々の前記画像信号値と予め設定された時間的に変化する基準信号値との相関値を算出し、
前記複数の検出領域の各々の前記相関値のそれぞれについて、前記相関値を識別する可視化情報を生成する
プログラム。
Priority Applications (1)
| Application Number | Priority Date | Filing Date | Title |
|---|---|---|---|
| PCT/JP2018/032474 WO2020044562A1 (ja) | 2018-08-31 | 2018-08-31 | 画像処理装置、画像処理方法およびプログラム |
Applications Claiming Priority (1)
| Application Number | Priority Date | Filing Date | Title |
|---|---|---|---|
| PCT/JP2018/032474 WO2020044562A1 (ja) | 2018-08-31 | 2018-08-31 | 画像処理装置、画像処理方法およびプログラム |
Publications (1)
| Publication Number | Publication Date |
|---|---|
| WO2020044562A1 true WO2020044562A1 (ja) | 2020-03-05 |
Family
ID=69643205
Family Applications (1)
| Application Number | Title | Priority Date | Filing Date |
|---|---|---|---|
| PCT/JP2018/032474 Ceased WO2020044562A1 (ja) | 2018-08-31 | 2018-08-31 | 画像処理装置、画像処理方法およびプログラム |
Country Status (1)
| Country | Link |
|---|---|
| WO (1) | WO2020044562A1 (ja) |
Citations (2)
| Publication number | Priority date | Publication date | Assignee | Title |
|---|---|---|---|---|
| JP2009039280A (ja) * | 2007-08-08 | 2009-02-26 | Arata Satori | 内視鏡システム及び内視鏡システムを用いた被写体の検出方法 |
| JP2013048646A (ja) * | 2011-08-30 | 2013-03-14 | Hoya Corp | 診断システム |
-
2018
- 2018-08-31 WO PCT/JP2018/032474 patent/WO2020044562A1/ja not_active Ceased
Patent Citations (2)
| Publication number | Priority date | Publication date | Assignee | Title |
|---|---|---|---|---|
| JP2009039280A (ja) * | 2007-08-08 | 2009-02-26 | Arata Satori | 内視鏡システム及び内視鏡システムを用いた被写体の検出方法 |
| JP2013048646A (ja) * | 2011-08-30 | 2013-03-14 | Hoya Corp | 診断システム |
Similar Documents
| Publication | Publication Date | Title |
|---|---|---|
| JP6150583B2 (ja) | 画像処理装置、内視鏡装置、プログラム及び画像処理装置の作動方法 | |
| CN112040830B (zh) | 内窥镜图像处理装置、内窥镜图像处理方法和记录介质 | |
| JP7229996B2 (ja) | 流れを視覚化するための機械学習を使用したスペックルコントラスト分析 | |
| JP6392570B2 (ja) | 画像処理装置、画像処理装置の作動方法、画像処理プログラム、及び内視鏡システム | |
| JP5276225B2 (ja) | 医用画像処理装置及び医用画像処理装置の作動方法 | |
| US9826884B2 (en) | Image processing device for correcting captured image based on extracted irregularity information and enhancement level, information storage device, and image processing method | |
| JP7158471B2 (ja) | 検査動画処理装置、検査動画処理装置の作動方法及び検査動画処理プログラム | |
| WO2006123455A1 (ja) | 画像表示装置 | |
| WO2013077381A1 (ja) | 画像処理装置、画像処理方法、及び画像処理プログラム | |
| US20150363942A1 (en) | Image processing device, endoscope apparatus, image processing method, and information storage device | |
| EP2912988A1 (en) | Medical image processing device and medical image processing method | |
| WO2020170809A1 (ja) | 医療画像処理装置、内視鏡システム、及び医療画像処理方法 | |
| JP2011024628A (ja) | 画像処理装置、画像処理プログラムおよび画像処理方法 | |
| US20220346632A1 (en) | Image processing apparatus, image processing method, and non-transitory storage medium storing computer program | |
| US9323978B2 (en) | Image processing device, endoscope apparatus, and image processing method | |
| CN110769731B (zh) | 内窥镜系统、内窥镜用处理系统、图像处理方法 | |
| WO2022230563A1 (ja) | 内視鏡システム及びその作動方法 | |
| WO2020044562A1 (ja) | 画像処理装置、画像処理方法およびプログラム | |
| WO2022180786A1 (ja) | 画像処理装置、画像処理方法及び記憶媒体 | |
| JP5940604B2 (ja) | 画像処理装置、画像処理装置の作動方法及びプログラム | |
| JP6251059B2 (ja) | 電子内視鏡システム | |
| JP7823750B2 (ja) | 画像処理装置、画像処理方法及びプログラム | |
| WO2023181353A1 (ja) | 画像処理装置、画像処理方法及び記憶媒体 | |
| WO2023187886A1 (ja) | 画像処理装置、画像処理方法及び記憶媒体 | |
| US20150003700A1 (en) | Image processing device, endoscope apparatus, and image processing method |
Legal Events
| Date | Code | Title | Description |
|---|---|---|---|
| 121 | Ep: the epo has been informed by wipo that ep was designated in this application |
Ref document number: 18932114 Country of ref document: EP Kind code of ref document: A1 |
|
| NENP | Non-entry into the national phase |
Ref country code: DE |
|
| 122 | Ep: pct application non-entry in european phase |
Ref document number: 18932114 Country of ref document: EP Kind code of ref document: A1 |
|
| NENP | Non-entry into the national phase |
Ref country code: JP |