WO2020040262A1 - 管理方法及び管理装置 - Google Patents
管理方法及び管理装置 Download PDFInfo
- Publication number
- WO2020040262A1 WO2020040262A1 PCT/JP2019/032888 JP2019032888W WO2020040262A1 WO 2020040262 A1 WO2020040262 A1 WO 2020040262A1 JP 2019032888 W JP2019032888 W JP 2019032888W WO 2020040262 A1 WO2020040262 A1 WO 2020040262A1
- Authority
- WO
- WIPO (PCT)
- Prior art keywords
- path
- processing function
- resource
- resource amount
- amount
- Prior art date
- Legal status (The legal status is an assumption and is not a legal conclusion. Google has not performed a legal analysis and makes no representation as to the accuracy of the status listed.)
- Ceased
Links
Images



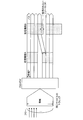
Classifications
-
- H—ELECTRICITY
- H04—ELECTRIC COMMUNICATION TECHNIQUE
- H04L—TRANSMISSION OF DIGITAL INFORMATION, e.g. TELEGRAPHIC COMMUNICATION
- H04L41/00—Arrangements for maintenance, administration or management of data switching networks, e.g. of packet switching networks
- H04L41/50—Network service management, e.g. ensuring proper service fulfilment according to agreements
- H04L41/5041—Network service management, e.g. ensuring proper service fulfilment according to agreements characterised by the time relationship between creation and deployment of a service
Definitions
- the present invention relates to a management method and a management device.
- Non-Patent Document 1 A service chaining technique for performing a plurality of processes such as address conversion, packet filtering, firewall, parental control, etc. by transferring between a plurality of processing devices for one communication flow transferred on a network has been known. (For example, see Non-Patent Document 1).
- a path called a service path is set between the processing devices in order to pass each processing device in the processing order determined for the flow.
- the bandwidth of one SP is limited by the resource amount of the processing device.
- the resource amount of the processing device is, for example, a processing capacity represented by a throughput. Therefore, when the amount of traffic that collects flows exceeds the amount of resources of one processing device, a plurality of SPs are set even for the same processing. Then, the flow identification device serving as the entrance of the SP assigns the SP to each flow. Then, the flow identification device distributes the packet of each flow to the assigned SP.
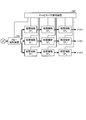
- FIG. 7 is a diagram illustrating an example of a system configuration of the service chaining technology.
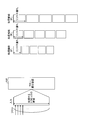
- FIG. 8 is a diagram for explaining a conventional resource allocation method using the service chaining technique.
- FIG. 9 is a diagram for explaining a conventional resource allocation method using the service chaining technique.
- a flow is a group of packets transmitted when one terminal communicates with another terminal, and a combination of a destination address, a source address, a destination port number, and a source port number of a packet header is used. Defined as the same packet group.
- one flow is processed by the processing functions SF 1 , SF 2 , and SF 3 .
- each device processing functions SF 1, SF 2, SF 3 has a flow identification device 20P and service path management device 10P.
- the service path management device 10P manages information on the traffic to be processed, allocates resources of the processing devices, and passes the paths (for example, the path 1) to the flow identification device 20P and the processing devices SF 1 , SF 2 , and SF 3 according to the resource allocation. Set 3).
- the resource amounts of the apparatuses are the same as long as the processing functions are the same.
- the resource amounts of the processing functions SF 1 , SF 2 , and SF 3 are represented as R 1 , R 2 , and R 3 , respectively, and the sizes thereof are defined as R 1 ⁇ R 2 ⁇ R 3 .
- path bandwidth is limited by the amount of resources minimal processing apparatus SF 1, it can not be the R 1 or more.
- the path band is the same for all the processing devices.
- the bandwidth is the same for all paths. Five paths (SC 1 , SC 2 , SC 3 , SC 4 , SC 5 ) of band R 1 are set based on the traffic volume to be processed.
- the path band is R 1
- the device processing functions SF 1 but assigned all resources in the path
- the apparatus of processing functions SF 2, SF 3 the amount of resources There is larger than R 1, remained without assigned all resources in the path, resource utilization is low.
- the resource amount allocated to the path among the resources of one processing device is an integral multiple of the path bandwidth. Then, among the resources of one processing device, the amount of resources that are not allocated to the path and are not used is less than the path bandwidth. Therefore, if the path bandwidth is reduced, the resource usage rate can be increased, but the number of paths increases.
- FIG. 10 is a diagram illustrating a conventional method for selecting a path band.
- the resource usage rate of the entire system is set to 90% or more.
- a device processing function A
- the processing function B the resource amount of the other device (for example, the processing function B)
- the path bandwidth P is equal to or less than 10% of the resource amount of the other device B. That is, since the amount of unused resources of each device is less than the path bandwidth P, the resource usage rate of each device can be 90% or more. Therefore, the resource usage rate of the entire system is 90% or more.
- the present invention has been made in view of the above, and an object of the present invention is to provide a management method and a management apparatus capable of maximizing a path bandwidth while keeping the resource usage rate of the entire system at or above a target value.
- a management method sets a path passing through a processing function extracted from a plurality of processing function groups, and sets an amount of processing function according to a path band. This is a management method that allocates resources to paths and distributes the flows received at the entrance of the paths to the paths and transfers them.
- a first calculating step of calculating a rate, a determining step of determining a maximum value of a path band in which the resource usage is equal to or more than a target value and a resource amount having a maximum value as a path band set in the processing function, Is set for each processing function, and a path setting step of allocating resources according to the determined path bandwidth is included.
- the path bandwidth can be maximized while keeping the resource usage rate of the entire system at or above the target value.
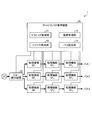
- FIG. 1 is a diagram illustrating an example of a configuration of an entire service chaining system including a service path management device according to an embodiment.
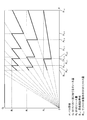
- FIG. 2 is a diagram illustrating the relationship between the path bandwidth and the amount of resources allocated to the path in each processing function.
- FIG. 3 is a diagram illustrating a relationship between a path band and resources allocated to the path.
- FIG. 4 is a flowchart for explaining a processing procedure up to path band setting by the service path management device shown in FIG.
- FIG. 5 is a diagram illustrating a relationship between a path band and a used resource amount.
- FIG. 6 is a diagram illustrating an example of a computer in which a service path management device is realized by executing a program.
- FIG. 1 is a diagram illustrating an example of a configuration of an entire service chaining system including a service path management device according to an embodiment.
- FIG. 2 is a diagram illustrating the relationship between the path bandwidth and the amount of resources allocated to the path in each processing function.
- FIG. 7 is a diagram illustrating an example of a system configuration of the service chaining technology.
- FIG. 8 is a diagram for explaining a conventional resource allocation method using the service chaining technique.
- FIG. 9 is a diagram for explaining a conventional resource allocation method using the service chaining technique.
- FIG. 10 is a diagram illustrating a conventional method for selecting a path band.
- FIG. 1 is a diagram illustrating an example of a configuration of an entire service chaining system including a service path management device according to an embodiment.
- the service chaining system 1 of FIG. 1 performs a predetermined process on an input flow and outputs one of a plurality of processing devices having the same processing function among a plurality of processing functions that output a processing result flow.
- a path is set through each of the extracted processing devices, resources of the processing device corresponding to the bandwidth of the route are allocated to the route, and the flow received at the entrance of the route is distributed to the route and transferred.
- a flow is a group of packets transmitted when one terminal communicates with another terminal. Packets having the same combination of the destination address, source address, destination port number, and source port number of the packet header Defined as a group.
- the service chaining system 1 includes processing devices having processing functions SF 1 , SF 2 , and SF 3 , a service path management device 10, and a flow identification device 20.
- processing devices having processing functions SF 1 , SF 2 , and SF 3 , a service path management device 10, and a flow identification device 20.
- the resource amount of the device is the same as long as the processing function is the same.
- the path bands are all the same.
- the service path management device 10 manages information on traffic to be processed, allocates resources of the processing devices, and passes the paths (for example, the path 1) to the flow identification device 20 and the processing devices SF 1 , SF 2 , and SF 3 according to the resource allocation. Set 3).
- the flow identification device 20 that has received the packet identifies the flow to which the packet belongs from the header information of the packet, assigns a path to the flow, and stores the correspondence between the flow and the path. If the received packet belongs to a flow to which a path has already been assigned, the flow identification device 20 identifies a transfer destination path from information on the correspondence between the possessed flow and the path, and transmits the packet to the path.
- Device processing function SF 1 processes the packet transmitted from the flow identification device 20, according to the setting of the path by the service path management device 10, and transfers to the next processing function SF 2 of the device on the path.
- device processing functions SF 2 processes the packet transmitted from the device processing functions SF 1, and transfers to the next processing function SF 3 of the device on the path. After the device processing functions SF 3 performing the process, transfers the packet to the destination described in the header of the packet.
- the service path management device 10 reads a predetermined program into a computer or the like including, for example, a ROM (Read Only Memory), a RAM (Random Access Memory), a flash memory (Flash Memory), a CPU (Central Processing Unit), and the like. This is realized by the CPU executing a predetermined program.
- the service path management device 10 has a communication interface that transmits and receives various information to and from other devices connected via a network or the like.
- the service path management device 10 has a NIC (Network Interface Card) or the like, and performs communication with another device via a telecommunication line such as a LAN (Local Area Network) or the Internet.
- NIC Network Interface Card
- the service path management device 10 includes a traffic management unit 11, a device management unit 12, a resource allocation unit 13 (determination unit), and a path setting unit 14 (setting unit).
- the traffic management unit 11 manages information on traffic to be processed.
- the device management unit 12 manages information of each processing device and the flow identification device 20.
- the resource allocation unit 13 calculates a path band to be set for a path from the traffic information of the traffic management unit 11 and the information of the processing device of the device management unit 12.
- the path setting unit 14 sets a path to the flow identification device 20 and each processing device (processing function) according to the determination of the resource allocation unit 13, and allocates resources according to the determined path bandwidth.
- the processing of the resource allocation unit 13 will be described.
- the resource allocating unit 13 first calculates a path band Plmx in which the amount of resources allocated to the device having the processing function has a maximum value. At this time, when there are a plurality of devices, the resource allocating unit 13 calculates the path bandwidth Plmx for all the devices having the processing functions. Subsequently, the resource allocation unit 13, among the calculated path bandwidth P lmx, to calculate the resource usage of the system from the large value in order, pass band the maximum of the path bandwidth P lmx resource utilization is equal to or greater than the target value To be determined.
- the communication system 1 can set a path with a high resource usage rate of the network system and a maximum bandwidth.
- R i is the resource amount of the processing function SF i .
- the subscript i is an identifier of the processing function SF.
- floor is a function for truncation below the decimal point.
- K is an integer.
- the resource amount Q 1 assigned to the path processing function SF i is represented by the formula (2).
- Figure 2 is a diagram showing the path bandwidth P, and the relationship between the amount of resources Q i allocated to a path in each SF. That is, FIG. 2 can be said to be a diagram showing an example of the relationship of Expression (2).
- the horizontal axis is the path bandwidth P
- the vertical axis represents the resource amount Q i allocated to a path in each SF.
- the resource amount is represented by the throughput of the device.
- the minimum guaranteed bandwidth is B min
- the resource amount of the SF having the smallest resource amount among all SFs is R min .
- R min R 1
- the range of the path band P can be represented by Expression (3).
- the upper limit of the path band is limited by the resource amount R min of the SF with the minimum resource amount, and the maximum value of the path band P becomes R min .
- P 1-1 P at which the resource amount Q 1 assigned to the SF 1 path is the maximum value R 1 is P 1-1 .
- P 2-1 , P 2-2 , and P 2-3 be the P at which the resource amount Q 2 allocated to the SF 2 path is the maximum R 2 .
- P 3-1 , P 3-2 , P 3-3 , and P 3-4 be P 3-1 at which the resource amount Q 3 allocated to the SF 3 path is the maximum R 3 .
- FIG. 2 As shown in FIG. 2, with an increase of the path band P, the resource amount Q i allocated to the path is repeatedly increased or decreased.
- FIG. Figure 3 is a diagram showing the relationship between resource Q 2 to which assigned to the path bandwidth P and path.
- the resource amount R 2 of SF 2 can include five path bands P ((1) in FIG. 3). reference).
- resources SF 2 all assigned to the path, the resource utilization becomes 100%.
- ⁇ P indicates a minute amount as compared with P.
- the resource amount of 5 pieces of the P is, for more than R 2, the number of P that may be included in R 2 may be four.
- the resource amount Q 2 to which is assigned to the path is reduced, also decreases the resource utilization.
- P increases, the amount of resources allocated to the path increases, and the resource usage rate also increases.
- the resource amount Q 2 of SF 2 allocated to a path with increasing P repeats increase and decrease.
- the resource amounts Q 1 and Q 3 allocated to the path repeatedly increase and decrease as P increases.
- the P resource amount Q i allocated to the path is the maximum value depends SF.
- Total resource usage rate E a description will be given of a method of calculating the entire resource usage rate including the value of the path band P including all SFs.
- Traffic for processing is T, device number N i of SF i, when the seek Q i from equation (2) can be shown as equation (4).
- the number of devices Ni is an integer, but here, it is treated as a real number, and decimals are not rounded up or down. This eliminates the influence of the fractional traffic volume less than the resource of one device on the calculation of the resource usage rate. For example, in the case of 1.5R traffic amount is 1.5 times the amount of resources R of the device, when the two devices the number N i, by not used because there traffic to be processed amount of resources 0.5 R, Resource utilization is low. Therefore, resource utilization was calculated N i as integer will include factors other than the result of adjusting the P in order to improve the resource utilization in terms of guaranteed minimum bandwidth. To calculate the N i as a real number in order to remove the influence.
- Resource amount of the whole apparatus of SF i (including the resources that are not allocated to the path) H i can be represented by the formula (6).
- ⁇ Expression (7) can be derived from Expression (4) and Expression (6).
- the resource amount ZT used by all SFs can be expressed by Expression (8) from Expression (5).
- ⁇ Expression (10) can be derived from Expression (7) and Expression (9).
- Equation (12) the overall resource usage rate E can be represented by Equation (12).
- the P resource amount Q i becomes maximum value R i to be allocated to the path in either SF, and P lmx, the resource utilization of the target and E 0.
- P lmx1 ⁇ P lmx2 the resource utilization of the target and E 0.
- Equation (14) can be derived from Equations (1) and (2).
- Expression (16) can be derived from Expression (14) and Expression (15).
- Expression (17) can be derived from Expressions (3) and (16).
- equation (18) is obtained.
- the resource allocating unit 13 can obtain P Imx at which Q i becomes the maximum value R i for each value of K by using Expression (16).
- the resource allocation unit 13 selects P Imx from all P Imx in descending order, and calculates the resource usage rate E.
- E is smaller than E 0
- the resource usage rate E does not exceed the target resource usage rate E 0 in the path band P up to the next value of P lmx , so the resource usage rate E needs to be checked. There is no. Therefore, the resource allocation unit 13 calculates the resource usage rate E of the next largest P lmx .
- the resource allocating unit 13 sets the path band P Imx to the maximum value that achieves the target resource usage rate E 0. Is determined as the path band set for the processing function.
- Resource allocation unit 13 if there is no but also become more resource utilization E 0 goal to calculate the resource usage rate E of all P lmx, path bandwidth achievable resource utilization E 0 goal exists Otherwise, the process ends.
- FIG. 4 is a flowchart for explaining a processing procedure up to path band setting by the service path management device 10 shown in FIG.
- the resource allocating unit 13 selects one SF and assigns the selected SF to SF i (step S1).
- Resource allocation unit 13 obtains a satisfying integer K shown formula (18) from the resource amount R i of the selected SF (step S2).
- the resource allocating unit 13 selects one K (step S3), and obtains Plmx for the value of K from equation (16) (step S4).
- the resource allocating unit 13 determines whether Plmx has been calculated for all the Ks (Step S5). When determining that Plmx has not been calculated for all the Ks (step S5: No), the resource allocation unit 13 returns to step S3 and selects the next K.
- Step S5 when it is determined that P Imx has been calculated for all Ks (Step S5: Yes), the resource allocation unit 13 determines whether P Imx has been calculated for all SFs (Step S6). ). When it is determined that Plmx has not been calculated for all SFs (step S6: No), the resource allocating unit 13 returns to step S1, selects the next SF, and proceeds with the processing from step S2.
- step S6 When it is determined that P Imx has been calculated in all SFs (step S6: Yes), the resource allocation unit 13 determines whether there is P Imx for which the resource usage rate E has not been calculated. (Step S7).
- Resource allocation unit 13 if it is determined that P lmx not calculate the resource usage rate E is present (step S7: Yes), those values in the P lmx is maximum not calculate the resource usage rate E Select (step S8). Then, the resource allocation unit 13 calculates the resource usage rate E of the selected Plmx (Step S9).
- Resource allocation unit 13 determines whether the usage rate E 0 of E ⁇ target (step S10). Resource allocation unit 13, when it is determined not utilization E 0 of E ⁇ target (Step S10: No), the flow returns to step S7.
- the resource allocation unit 13 if it is determined that the usage rate E 0 of E ⁇ target (Step S10: Yes), were selected. Plmx1 is determined as the pass band (step S11), and the process ends.
- the resource allocation unit 13 if the P lmx not calculate the resource usage rate E is determined not to exist (step S7: No), path bandwidth does not exist to achieve resource utilization E 0 of the target (step S12) is determined, and the process ends.
- FIG. 5 is a diagram illustrating a relationship between a path band and a used resource amount.
- the maximum path bandwidth is found with the goal of increasing the resource usage rate of the entire system to 90% or more.
- the resource allocating unit 13 calculates all the path bandwidths Plmx such that the used resource amount of each device becomes all device resources.
- the value of the pass band P lmx is the value of P at which the graph has a local maximum value.
- the resource allocating unit 13 obtains Plmx in all devices. Then, the resource allocation unit 13 calculates the resource usage rate from Plmx having a large value regardless of the device.
- the next value to calculate the resource usage rate P b is a large P lmx it was 95% for. This is above the target resource utilization of 90%.
- P b ⁇ P because P lmx is not to achieve a resource utilization target, the maximum of the path bandwidth P b to achieve resource utilization target.
- the resource assignment unit 13 adopts a P b as a path bandwidth.
- the above processing is executed by the resource allocation unit 13 to determine a path band, and the path setting unit 14 sets a path of the determined band.
- the service path management device 10 calculates the resource usage rate in order from the largest value in the path bandwidth in which the resource amount allocated to the processing function has the maximum value, and The maximum value of the path band where the resource amount becomes the maximum value which is equal to or more than the target value is determined as the path band set for the processing function, and the resource is allocated according to the determined path band. Therefore, according to the present embodiment, it is possible to maximize the path bandwidth while keeping the resource usage rate of the entire system equal to or higher than the target value.
- each component of each device illustrated is a functional concept and does not necessarily need to be physically configured as illustrated.
- the specific form of distribution / integration of each device is not limited to that shown in the figure, and all or a part thereof may be functionally or physically distributed / arbitrarily divided into arbitrary units according to various loads and usage conditions. Can be integrated and configured.
- all or any part of each processing function performed by each device can be realized by a CPU and a program analyzed and executed by the CPU, or can be realized as hardware by wired logic.
- all or a part of the processes described as being performed automatically can be manually performed, or the processes described as being performed manually can be performed. All or part can be automatically performed by a known method.
- the processes described in the present embodiment may be executed not only in chronological order according to the order of description, but also in parallel or individually according to the processing capability of the device that executes the processes or as necessary. .
- the processing procedures, control procedures, specific names, and information including various data and parameters shown in the above documents and drawings can be arbitrarily changed unless otherwise specified.
- FIG. 6 is a diagram illustrating an example of a computer in which the service path management device 10 is realized by executing a program.
- the computer 1000 has, for example, a memory 1010 and a CPU 1020.
- the computer 1000 has a hard disk drive interface 1030, a disk drive interface 1040, a serial port interface 1050, a video adapter 1060, and a network interface 1070. These components are connected by a bus 1080.
- the memory 1010 includes a ROM 1011 and a RAM 1012.
- the ROM 1011 stores, for example, a boot program such as a BIOS (Basic Input Output System).
- BIOS Basic Input Output System
- the hard disk drive interface 1030 is connected to the hard disk drive 1090.
- the disk drive interface 1040 is connected to the disk drive 1100.
- a removable storage medium such as a magnetic disk or an optical disk is inserted into the disk drive 1100.
- the serial port interface 1050 is connected to, for example, a mouse 1110 and a keyboard 1120.
- the video adapter 1060 is connected to the display 1130, for example.
- the hard disk drive 1090 stores, for example, the OS 1091, the application program 1092, the program module 1093, and the program data 1094. That is, a program that defines each process of the service path management device 10 is implemented as a program module 1093 in which codes executable by the computer 1000 are described.
- the program module 1093 is stored in, for example, the hard disk drive 1090.
- a program module 1093 for executing the same processing as the functional configuration in the service path management device 10 is stored in the hard disk drive 1090.
- the hard disk drive 1090 may be replaced by an SSD (Solid State Drive).
- the setting data used in the processing of the above-described embodiment is stored as the program data 1094 in, for example, the memory 1010 or the hard disk drive 1090. Then, the CPU 1020 reads out the program module 1093 and the program data 1094 stored in the memory 1010 and the hard disk drive 1090 to the RAM 1012 as needed, and executes them.
- the program module 1093 and the program data 1094 are not limited to being stored in the hard disk drive 1090, but may be stored in, for example, a removable storage medium and read out by the CPU 1020 via the disk drive 1100 or the like. Alternatively, the program module 1093 and the program data 1094 may be stored in another computer connected via a network (LAN, Wide Area Network (WAN), or the like). Then, the program module 1093 and the program data 1094 may be read from another computer by the CPU 1020 via the network interface 1070.
- LAN Local Area Network
- WAN Wide Area Network
Landscapes
- Engineering & Computer Science (AREA)
- Computer Networks & Wireless Communication (AREA)
- Signal Processing (AREA)
- Data Exchanges In Wide-Area Networks (AREA)
Abstract
サービスパス管理装置(10)は、処理機能に割当てられたリソース量が極大値となるパス帯域のうち、大きい値から順にリソース使用率を算出し、リソース使用率が目標値以上となる、リソース量が極大値となるパス帯域の最大値を、処理機能に設定するパス帯域として決定するリソース割当部(13)と、パスを各処理機能に設定し、決定されたパス帯域に応じたリソースの割り当てを行うパス設定部(14)とを有する。
Description
本発明は、管理方法及び管理装置に関する。
従来、ネットワーク上を転送される1つの通信フローに対して、アドレス変換、パケットフィルタリング、ファイアウォール、ペアレンタルコントロール等の複数の処理を、複数の処理装置間を転送して行うサービスチェイニング技術が知られている(例えば非特許文献1を参照)。
サービスチェイニング技術によりフローの処理を行う場合、フローに決められた処理順で各処理装置を通過させるために、処理装置間にサービスパス(SP)という経路が設定される。1つのSPの帯域は、処理装置のリソース量によって制限される。処理装置のリソース量は、例えばスループットで表される処理能力である。そのため、フローを集めたトラヒック量が1つの処理装置のリソース量を超える場合は、同じ処理であっても複数のSPを設定する。そして、SPの入口となるフロー識別装置は、各フローにSPを割り当てる。そして、フロー識別装置は、各フローのパケットを割り当てたSPへ振り分ける。
"draft-ietf-sfc-architecture-02" [online]、 2014年9月20日、 [2018年8月2日検索]、 インターネット(https://datatracker.ietf.org/doc/draft-ietf-sfc-architecture/02/)
図7は、サービスチェイニング技術のシステム構成の一例を示す図である。図8は、サービスチェイニング技術による従来のリソースの割り当て方法について説明するための図である。図9は、サービスチェイニング技術による従来のリソースの割り当て方法について説明するための図である。
ここでは、フローを、1台の端末が他の1台の端末と通信する際に送信するパケット群であり、パケットヘッダの宛先アドレス、送信元アドレス、宛先ポート番号、送信元ポート番号の組み合わせが同じパケット群と定義する。図7の例では、1つのフローを処理機能SF1,SF2,SF3により処理する。システムは、処理機能SF1,SF2,SF3の各装置、フロー識別装置20P及びサービスパス管理装置10Pを有する。
サービスパス管理装置10Pは、処理するトラヒックの情報を管理し、処理装置のリソースを割り当て、リソースの割り当てに従い、フロー識別装置20P及び処理装置SF1,SF2,SF3にパス(例えば、パス1~3)を設定する。
ここで、このシステムでは、前提として、同じ処理機能であれば、装置のリソース量は同じであるとする。また、図8に示すように、処理機能SF1,SF2,SF3のリソース量をそれぞれR1,R2,R3と表し、その大きさをR1<R2<R3とする。
図8に示す条件のもとでパスを設定した場合、図9に示すように、パス帯域は、リソース量最小の処理装置SF1によって制限され、R1以上にはできない。なお、ここでは、パス帯域は、全ての処理装置で同じとする。また、全てのパスで帯域は同じとする。処理するトラヒック量から帯域R1のパスを5つ(SC1,SC2,SC3,SC4,SC5)設定する。
ここで、図9に示すように、パス帯域がR1であるため、処理機能SF1の装置は、リソースの全てをパスに割り当てられるが、処理機能SF2,SF3の装置では、リソース量がR1よりも大きいため、リソースが全てパスに割り当てられずに残り、リソースの使用率が低くなる。
処理装置のリソース量を、スループットすなわち帯域で表すと、処理装置1台のリソースのうち、パスへ割り当てられるリソース量は、パス帯域の整数倍になる。そして、処理装置1台のリソースのうち、パスへ割り当てられず使用されないリソース量は、パス帯域未満となる。したがって、パス帯域を小さくするとリソース使用率を高くすることができるものの、パス数が増加する。
そして、トラヒック処理に必要なパスの数が多くなると、装置故障や保守作業のために経路切り替えを行うときに長い時間がかかる。また、パス数が多いと、パス機能の死活監視を行う場合、死活監視を行う装置の負荷が大きくなる。このトラヒック処理に必要なパス数を少なくするには、パス帯域を最大化すればよい。
高いリソース使用率を達成し、パス数を少なくするには、目標のリソース使用率を達成できるパス帯域の中で最大のパス帯域を選択する方法が考えられる。図10は、パス帯域を選択する従来の方法を説明する図である。
図10の例では、システム全体のリソース使用率を90%以上とする。続いて、トラヒックを処理する装置の中でリソース量が最小の装置(処理機能A)を選び、その装置のリソース量の10%の大きさをパス帯域Pとする。他の装置(例えば、処理機能B)のリソース量は、選択した装置のリソース量以上であるため、パス帯域Pは、他の装置Bのリソース量の10%以下である。すなわち、各装置の使用されないリソース量は、パス帯域P未満なので、各装置のリソース使用率を90%以上とすることができる。したがって、システム全体としてもリソース使用率は90%以上となる。
ただし、この方法では、システム全体のリソース使用率を目標値以上にできるものの、パス帯域が最大になるとは限らないという課題があった。
本発明は、上記に鑑みてなされたものであって、システム全体のリソース使用率を目標値以上にしながら、パス帯域を最大にできる管理方法及び管理装置を提供することを目的とする。
上述した課題を解決し、目的を達成するために、本発明に係る管理方法は、複数の処理機能群から抽出した処理機能を経由するパスを設定し、パス帯域に応じた量の処理機能のリソースをパスに割り当て、パスの入口で受信したフローをパスに振り分けて転送する管理方法であって、処理機能に割当てられたリソース量が極大値となるパス帯域のうち、大きい値から順にリソース使用率を算出する第1の算出工程と、リソース使用率が目標値以上となる、リソース量が極大値となるパス帯域の最大値を、処理機能に設定するパス帯域として決定する決定工程と、パスを各処理機能に設定し、決定されたパス帯域に応じたリソースの割り当てを行うパス設定工程と、含んだことを特徴とする。
本発明によれば、システム全体のリソース使用率を目標値以上にしながら、パス帯域を最大にできる。
以下、図面を参照して、本発明の一実施形態を詳細に説明する。なお、この実施の形態により本発明が限定されるものではない。また、図面の記載において、同一部分には同一の符号を付して示している。
[実施の形態]
[通信システムの概要]
まず、図1を用いて、実施の形態に係る通信システムを説明する。実施の形態に係る通信システムは、サービスチェイニング技術を適用したシステムである。図1は、実施の形態に係るサービスパス管理装置を含むサービスチェイニングシステム全体の構成の一例を示す図である。
[通信システムの概要]
まず、図1を用いて、実施の形態に係る通信システムを説明する。実施の形態に係る通信システムは、サービスチェイニング技術を適用したシステムである。図1は、実施の形態に係るサービスパス管理装置を含むサービスチェイニングシステム全体の構成の一例を示す図である。
図1のサービスチェイニングシステム1は、入力されたフローに所定の処理を行い、処理結果のフローを出力する複数の処理機能のうち、同じ処理機能を有する複数の処理装置群のそれぞれから1つずつ抽出した処理装置の全てを経由する経路を設定し、経路の帯域に応じた量の処理装置のリソースを経路に割り当て、経路の入口で受信したフローを経路に振り分けて転送する。
フローとは、1台の端末が他の1台の端末と通信する際に送信するパケット群であり、パケットヘッダの宛先アドレス、送信元アドレス、宛先ポート番号、送信元ポート番号の組み合わせが同じパケット群と定義する。
図1の例では、1つのフローを処理機能SF1,SF2,SF3により処理する。サービスチェイニングシステム1は、処理機能SF1,SF2,SF3を有する各処理装置、サービスパス管理装置10、フロー識別装置20を有する。ここで、このサービスチェイニングシステム1では、前提として、同じ処理機能であれば、装置のリソース量は同じであるとする。また、パス帯域は全て同じであることを前提とする。
サービスパス管理装置10は、処理するトラヒックの情報を管理し、処理装置のリソースを割り当て、リソースの割り当てに従い、フロー識別装置20及び処理装置SF1,SF2,SF3にパス(例えば、パス1~3)を設定する。
パケットを受信したフロー識別装置20は、パケットのヘッダ情報よりパケットが属するフローを識別し、フローに対してパスを割り当て、フローとパスの対応関係を記憶する。受信したパケットが既にパスを割り当てたフローに属する場合、フロー識別装置20は、所持するフローとパスの対応関係の情報から転送先のパスを識別し、当該パスへ送信する。
処理機能SF1の装置は、フロー識別装置20から送られてきたパケットを処理し、サービスパス管理装置10によるパスの設定に従い、パス上の次の処理機能SF2の装置へ転送する。同様に、処理機能SF2の装置は、処理機能SF1の装置から送られてきたパケットを処理し、パス上の次の処理機能SF3の装置へ転送する。処理機能SF3の装置は処理を行った後、パケットのヘッダに記載されている宛先へパケットを転送する。
[サービスパス管理装置の構成]
続いて、サービスパス管理装置10の構成について説明する。サービスパス管理装置10は、例えば、ROM(Read Only Memory)、RAM(Random Access Memory)、フラッシュメモリ(Flash Memory)、CPU(Central Processing Unit)等を含むコンピュータ等に所定のプログラムが読み込まれて、CPUが所定のプログラムを実行することで実現される。また、サービスパス管理装置10は、ネットワーク等を介して接続された他の装置との間で、各種情報を送受信する通信インタフェースを有する。例えば、サービスパス管理装置10は、NIC(Network Interface Card)等を有し、LAN(Local Area Network)やインターネットなどの電気通信回線を介した他の装置との間の通信を行う。
続いて、サービスパス管理装置10の構成について説明する。サービスパス管理装置10は、例えば、ROM(Read Only Memory)、RAM(Random Access Memory)、フラッシュメモリ(Flash Memory)、CPU(Central Processing Unit)等を含むコンピュータ等に所定のプログラムが読み込まれて、CPUが所定のプログラムを実行することで実現される。また、サービスパス管理装置10は、ネットワーク等を介して接続された他の装置との間で、各種情報を送受信する通信インタフェースを有する。例えば、サービスパス管理装置10は、NIC(Network Interface Card)等を有し、LAN(Local Area Network)やインターネットなどの電気通信回線を介した他の装置との間の通信を行う。
図1に示すように、サービスパス管理装置10は、トラヒック管理部11、装置管理部12、リソース割当部13(決定部)及びパス設定部14(設定部)を有する。
トラヒック管理部11は処理するトラヒックの情報を管理する。装置管理部12は各処理装置とフロー識別装置20の情報を管理する。リソース割当部13は、トラヒック管理部11が持つトラヒック情報及び装置管理部12が持つ処理装置の情報から、パスに設定するパス帯域を算出する。パス設定部14は、リソース割当部13の決定に従い、パスをフロー識別装置20と各処理装置(処理機能)に設定し、決定されたパス帯域に応じたリソースの割り当てを行う。
リソース割当部13の処理について説明する。リソース割当部13は、最初に、処理機能の装置に割当てられたリソース量が極大値となるパス帯域Plmxを算出する。この際、リソース割当部13は、装置が複数の場合には、処理機能の装置の全てについてパス帯域Plmxを算出する。続いて、リソース割当部13は、算出したパス帯域Plmxのうち、大きい値から順にシステムのリソース使用率を算出し、リソース使用率が目標値以上となるパス帯域Plmxの最大値をパス帯域として決定する。
この結果、通信システム1は、ネットワークシステムのリソース使用率が高くかつ帯域が最大となるパスを設定することが可能になる。
[パス帯域Pと、各SFでパスに割り当てられるリソース量Qiとの関係]
ここで、サービスパス管理装置10が、帯域Pのパスを設定する場合について説明する。帯域Pのパスを設定する場合、各処理機能SFで設定できるパスの数Kは、式(1)のように示される。
ここで、サービスパス管理装置10が、帯域Pのパスを設定する場合について説明する。帯域Pのパスを設定する場合、各処理機能SFで設定できるパスの数Kは、式(1)のように示される。

ここで、Riは、処理機能SFiのリソース量である。また、添え字iは、処理機能SFの識別子である。floorは、小数点以下切り捨ての関数である。Kは整数である。したがって、処理機能SFiでパスに割り当てられるリソース量Q1は、式(2)で示される。

図2は、パス帯域Pと、各SFでパスに割り当てられるリソース量Qiとの関係を示す図である。すなわち、図2は、式(2)の関係の例を示す図といえる。なお、図2では、例えば、処理機能SF1,SF2,SF3について、パス帯域Pと、各SFでパスに割り当てられるリソース量Qiとの関係を示す。
図2において、横軸は、パス帯域Pであり、縦軸は、各SFでパスに割り当てられるリソース量Qiである。リソース量は装置のスループットで表すものとする。最低保証帯域をBmin、全SFの中で最もリソース量が少ないSFのリソース量をRminとする。この例では、Rmin=R1とする。この場合、パス帯域Pの範囲は、式(3)で示すことができる。

パスは、全てのSFを通ることから、リソース量最小のSFのリソース量Rminによってパス帯域の上限が制限され、パス帯域Pの最大値がRminになる。
SF1のパスへ割り当てるリソース量Q1が極大値のR1となるPをP1-1とする。同様に、SF2のパスへ割り当てるリソース量Q2が極大値のR2となるPをP2-1,P2-2,P2-3とする。そして、SF3のパスへ割り当てるリソース量Q3が極大値のR3となるPをP3-1,P3-2,P3-3,P3-4とする。
図2に示すように、パス帯域Pの増加に伴って、パスに割り当てられるリソース量Qiが増減を繰り返している。この理由を、図3を参照して説明する。図3は、パス帯域Pとパスへ割り当てるリソースQ2の関係を示す図である。
図3に示すように、図2のSF2において、パス帯域PがBminのとき、SF2のリソース量R2は、5個のパス帯域Pを含むことができる(図3の(1)参照)。パス帯域Pを大きくしていくと、P=P2-1のときに、Pの5個分のリソース量Q2が、R2と同じ量になる(図3の(2)参照)。このとき、SF2のリソースは、全てパスに割り当てられ、リソース使用率は、100%になる。
さらに、Pが増加する場合(図3の(3)参照)について説明する。なお、ΔPは、Pと比較して微小な量を示す。この場合、Pの5個分のリソース量が、R2を超えるため、R2に含むことができるPの数は4個になる。このとき、パスへ割り当てられるリソース量Q2は減少し、リソース使用率も低下する。さらにPが増加するとパスへ割り当てられるリソース量は増加し、リソース使用率も高くなっていく。
このように、Pの増加に伴ってパスに割り当てられるSF2のリソース量Q2は、増減を繰り返す。同様に、SF1,SF3においても、Pの増加に伴ってパスに割り当てられるリソース量Q1,Q3は、増減を繰り返す。ただし、SF毎にリソース量が異なるため、図2に示すように、パスに割り当てられるリソース量Qiが極大値となるPは、SFによって異なる。
[全体でのリソース使用率E]
次に、パス帯域Pの値に対して、全SFを含めた全体のリソース使用率を算出する方法を述べる。処理するトラヒック量をTとし、SFiの装置数Ni、式(2)からQiを求めるとすると、式(4)のように示すことができる。
次に、パス帯域Pの値に対して、全SFを含めた全体のリソース使用率を算出する方法を述べる。処理するトラヒック量をTとし、SFiの装置数Ni、式(2)からQiを求めるとすると、式(4)のように示すことができる。

本来、装置数Niは整数であるが、ここでは実数として扱い、少数点以下を切り上げも切り捨てもしない。これにより、装置1台のリソースに満たない端数のトラヒック量によるリソース使用率の計算への影響がなくなる。例えば、トラヒック量が装置のリソース量Rの1.5倍である1.5Rの場合、装置数Niを2台とすると、処理すべきトラヒックがないために使用されないリソース量0.5Rにより、リソース使用率が低くなる。したがって、Niを整数として算出したリソース使用率は、最低帯域を保証した上でリソース使用率を向上させるためにPを調整した結果以外の要因を含むことになる。その影響を除くためにNiを実数として計算する。
そして、SFiの全装置の使用するリソース量Ziは、式(5)に示すように、トラヒック量Tに等しい。

SFiの全装置のリソース量(パスに割り当てないリソースを含む)Hiは、式(6)で示すことができる。

式(4)及び式(6)より、式(7)を導出できる。

SFの種類の数をmとすると、全SFの使用するリソース量ZTは、式(5)より、式(8)で示すことができる。

そして、全SFの装置のリソース量HTは、式(9)のように示すことができる。

式(7)及び式(9)より、式(10)を導出できる。

全体でのリソース使用率Eは、式(11)で示すことができる。

式(8)、式(10)及び式(11)より、全体でのリソース使用率Eは、式(12)で示すことができる。

[パス帯域Pとリソース使用率Eとの関係]
次に、パス帯域Pとリソース使用率Eとの関係を説明する。ここで例として、図2において、SFは異なるが、Qiが極大値RiとなるPの中で隣り合うP3-3とP2-3との間に着目する。P、P3-3及びP2-3は、以下の式(13)で示す関係を有する。
次に、パス帯域Pとリソース使用率Eとの関係を説明する。ここで例として、図2において、SFは異なるが、Qiが極大値RiとなるPの中で隣り合うP3-3とP2-3との間に着目する。P、P3-3及びP2-3は、以下の式(13)で示す関係を有する。

式(13)の範囲ではPが増加すると、Q1,Q2,Q3は、全て単調増加する。従って、Pが式(13)の範囲の場合、SF1,SF2,SF3の全てで、P=P2-3のときに、Q1,Q2,Q3は、最大値となる。したがって、式(12)より、Pが式(13)の範囲では、P=P2-3のとき、リソースの使用率Eが最大となる。
このことを一般的に説明する。いずれかのSFでパスへ割り当てるリソース量Qiが極大値RiになるPを、Plmxとし、目標とするリソース使用率をE0とする。Plmxの中で隣り合うPlmx1とPlmx2の間(Plmx1<Plmx2)では、式(2)よりPが増加するとQi全てが単調増加し、P=Plmx2のときにQiの全てが最大となる。したがって、式(12)より、P=Plmx2のときにリソースの使用率Eが最大となる。
このことから、P=Plmx2のときにリソース使用率Eが目標のリソース使用率E0よりも小さい場合、Plmx1<P≦Plmx2の範囲のパス帯域Pではリソース使用率Eが目標のリソース使用率E0以上になることはない。
[パス帯域Plmxの算出]
各SFにおいて、全てのリソースがパスに割り当てられ、Qiが極大値RiとなるPを探索する。Kを整数とすると、式(1)及び式(2)より、式(14)を導出できる。
各SFにおいて、全てのリソースがパスに割り当てられ、Qiが極大値RiとなるPを探索する。Kを整数とすると、式(1)及び式(2)より、式(14)を導出できる。

Qiが極大値Riと一致することから、式(15)となる。

式(14)及び式(15)より、式(16)を導出できる。

そして、式(3)及び式(16)より式(17)を導出できる。

すなわち、式(18)となる。

リソース量RiのSFiには、Qiが極大値RiとなるPlmxが、この条件を見たす整数Kと同数存在する。リソース割当部13は、式(16)を用いることによって、各Kの値に対してQiが極大値RiとなるPlmxを求めることができる。
[最大のパス帯域の算出]
次に、目標のリソース使用率を達成する最大のパス帯域を求める算出方法について説明する。この算出は、リソース割当部13が実行する。まず、リソース割当部13は、各SFに対して、式(18)を満たすKを求め、式(16)から各Kに対応するPlmxを算出する。
次に、目標のリソース使用率を達成する最大のパス帯域を求める算出方法について説明する。この算出は、リソース割当部13が実行する。まず、リソース割当部13は、各SFに対して、式(18)を満たすKを求め、式(16)から各Kに対応するPlmxを算出する。
続いて、リソース割当部13は、全てのPlmxの中から大きい順にPlmxを選択し、リソース使用率Eを計算する。EがE0よりも小さい場合、次のPlmxの値までのパス帯域Pでは、リソース使用率Eが目標のリソース使用率E0以上になることはないため、リソース使用率Eを確認する必要がない。このため、リソース割当部13は、次に大きいPlmxのリソース使用率Eを計算する。
選択したPlmxのリソース使用率Eが初めて目標のリソース使用率E0以上となった場合、値が大きいPlmxからリソース使用率Eを計算しているため、そのPlmxが目標のリソース使用率E0を達成する最大のパス帯域となる。したがって、リソース割当部13は、選択したPlmxのリソース使用率Eが初めて目標のリソース使用率E0以上となった場合、このパス帯域Plmxを、目標のリソース使用率E0を達成する最大のパス帯域と判定し、処理機能に設定するパス帯域として決定する。
リソース割当部13は、全てのPlmxのリソース使用率Eを計算しても目標のリソース使用率E0以上になるものがなかった場合、目標のリソース使用率E0を達成できるパス帯域は存在せず、処理は終了する。
[処理手順]
次に、リソース割当部13が、目標とするリソース使用率E0を達成する最大のパス帯域を算出するまでの処理について説明する。図4は、図1に示すサービスパス管理装置10によるパス帯域設定までの処理手順を説明するフローチャートである。
次に、リソース割当部13が、目標とするリソース使用率E0を達成する最大のパス帯域を算出するまでの処理について説明する。図4は、図1に示すサービスパス管理装置10によるパス帯域設定までの処理手順を説明するフローチャートである。
図4に示すように、まず、リソース割当部13は、SFを1つ選択し、選択したSFをSFi(ステップS1)。リソース割当部13は、選択したSFのリソース量Riから式(18)示す条件を満たす整数Kを求める(ステップS2)。
続いて、リソース割当部13は、Kを1つ選択し(ステップS3)、Kの値に対して式(16)よりPlmxを求める(ステップS4)。リソース割当部13は、全てのKでPlmxを、算出済みか否かを判定する(ステップS5)。リソース割当部13は、全てのKでPlmxを算出済みでないと判定した場合(ステップS5:No)、ステップS3に戻り、次のKを選択する。
一方、リソース割当部13は、全てのKでPlmxを算出済みであると判定した場合(ステップS5:Yes)、全てのSFでPlmxを算出済みであるか否かを判定する(ステップS6)。リソース割当部13は、全てのSFでPlmxを算出済みでないと判定した場合(ステップS6:No)、ステップS1に戻り、次のSFを選択して、ステップS2以降の処理を進める。
また、リソース割当部13は、全てのSFでPlmxを算出済みであると判定した場合(ステップS6:Yes)、リソース使用率Eを計算していないPlmxが存在するか否かを判定する(ステップS7)。
リソース割当部13は、リソース使用率Eを計算していないPlmxが存在すると判定した場合(ステップS7:Yes)、リソース使用率Eを計算していないPlmxの中で値が最大のものを選択する(ステップS8)。そして、リソース割当部13は、選択したPlmxのリソース使用率Eを算出する(ステップS9)。
リソース割当部13は、E≧目標の使用率E0であるか否かを判定する(ステップS10)。リソース割当部13は、E≧目標の使用率E0でないと判定した場合(ステップS10:No)、ステップS7に戻る。
これに対し、リソース割当部13は、E≧目標の使用率E0であると判定した場合(ステップS10:Yes)、選択した。Plmx1をパス帯域として決定して(ステップS11)、処理を終了する。
また、リソース割当部13は、リソース使用率Eを計算していないPlmxが存在しないと判定した場合(ステップS7:No)、目標のリソース使用率E0を達成できるパス帯域は存在しない(ステップS12)と判定し、処理を終了する。
[パス帯域決定の具体例]
図5を用いて、リソース割当部13によるパス帯域の決定方法を具体的に説明する。図5は、パス帯域と、使用リソース量との関係を示す図である。本具体例では、システム全体のリソース使用率を90%以上にすることを目標とし、最大のパス帯域を見つける。
図5を用いて、リソース割当部13によるパス帯域の決定方法を具体的に説明する。図5は、パス帯域と、使用リソース量との関係を示す図である。本具体例では、システム全体のリソース使用率を90%以上にすることを目標とし、最大のパス帯域を見つける。
リソース割当部13は、各装置の使用リソース量が全ての装置リソースとなるようなパス帯域Plmxを全て算出する。図5の例では、パス帯域Plmxの値は、グラフが極大値となるPの値である。リソース割当部13は、全ての装置でPlmxを求める。そして、リソース割当部13は、装置に関わらず値が大きいPlmxからリソース使用率を算出する。
図5でリソース量R3のSFで最も大きな値のPlmxをPaとする。そして、その次に値が大きいリソース量R2のSFのPlmxをPbとする。Paでのリソース使用率が85%だったとすると、Pb<P≦Paの範囲では、リソース使用率は85%未満である。これは、図5が示すように、Pb<P≦Paの範囲では全ての装置においてパス帯域Pの値が減少すると、使用リソース量が減少し、リソース使用率も減少するためである。したがって、Pb<P<Paの範囲ではリソース使用率を調べる必要がない。
続いて、次に値が大きなPlmxであるPbでリソース使用率を計算すると95%だったとする。これは、目標のリソース使用率90%を上回っている。前述のように、Pb<Pの範囲では、目標のリソース使用率を達成するPlmxはないため、Pbが目標のリソース使用率を達成する最大のパス帯域となる。
したがって、この例では、リソース割当部13は、Pbをパス帯域として採用する。以上の処理をリソース割当部13が実行してパス帯域を決定し、パス設定部14において、決定された帯域のパスを設定する。
[実施の形態の効果]
このように、本実施の形態に係るサービスパス管理装置10は、処理機能に割り当てられたリソース量が極大値となるパス帯域のうち、大きい値から順にリソース使用率を算出し、リソース使用率が目標値以上となる、リソース量が極大値となるパス帯域の最大値を、処理機能に設定するパス帯域として決定し、決定したパス帯域に応じたリソースの割り当てを行う。このため、本実施の形態によれば、システム全体のリソース使用率を目標値以上にしながら、パス帯域を最大にできる。
このように、本実施の形態に係るサービスパス管理装置10は、処理機能に割り当てられたリソース量が極大値となるパス帯域のうち、大きい値から順にリソース使用率を算出し、リソース使用率が目標値以上となる、リソース量が極大値となるパス帯域の最大値を、処理機能に設定するパス帯域として決定し、決定したパス帯域に応じたリソースの割り当てを行う。このため、本実施の形態によれば、システム全体のリソース使用率を目標値以上にしながら、パス帯域を最大にできる。
[システム構成等]
図示した各装置の各構成要素は機能概念的なものであり、必ずしも物理的に図示の如く構成されていることを要しない。すなわち、各装置の分散・統合の具体的形態は図示のものに限られず、その全部又は一部を、各種の負荷や使用状況等に応じて、任意の単位で機能的又は物理的に分散・統合して構成することができる。さらに、各装置にて行なわれる各処理機能は、その全部又は任意の一部が、CPU及び当該CPUにて解析実行されるプログラムにて実現され、あるいは、ワイヤードロジックによるハードウェアとして実現され得る。
図示した各装置の各構成要素は機能概念的なものであり、必ずしも物理的に図示の如く構成されていることを要しない。すなわち、各装置の分散・統合の具体的形態は図示のものに限られず、その全部又は一部を、各種の負荷や使用状況等に応じて、任意の単位で機能的又は物理的に分散・統合して構成することができる。さらに、各装置にて行なわれる各処理機能は、その全部又は任意の一部が、CPU及び当該CPUにて解析実行されるプログラムにて実現され、あるいは、ワイヤードロジックによるハードウェアとして実現され得る。
また、本実施形態において説明した各処理のうち、自動的に行われるものとして説明した処理の全部又は一部を手動的におこなうこともでき、あるいは、手動的におこなわれるものとして説明した処理の全部又は一部を公知の方法で自動的におこなうこともできる。また、本実施形態において説明した各処理は、記載の順にしたがって時系列に実行されるのみならず、処理を実行する装置の処理能力あるいは必要に応じて並列的にあるいは個別に実行されてもよい。この他、上記文書中や図面中で示した処理手順、制御手順、具体的名称、各種のデータやパラメータを含む情報については、特記する場合を除いて任意に変更することができる。
[プログラム]
図6は、プログラムが実行されることにより、サービスパス管理装置10が実現されるコンピュータの一例を示す図である。コンピュータ1000は、例えば、メモリ1010、CPU1020を有する。また、コンピュータ1000は、ハードディスクドライブインタフェース1030、ディスクドライブインタフェース1040、シリアルポートインタフェース1050、ビデオアダプタ1060、ネットワークインタフェース1070を有する。これらの各部は、バス1080によって接続される。
図6は、プログラムが実行されることにより、サービスパス管理装置10が実現されるコンピュータの一例を示す図である。コンピュータ1000は、例えば、メモリ1010、CPU1020を有する。また、コンピュータ1000は、ハードディスクドライブインタフェース1030、ディスクドライブインタフェース1040、シリアルポートインタフェース1050、ビデオアダプタ1060、ネットワークインタフェース1070を有する。これらの各部は、バス1080によって接続される。
メモリ1010は、ROM1011及びRAM1012を含む。ROM1011は、例えば、BIOS(Basic Input Output System)等のブートプログラムを記憶する。ハードディスクドライブインタフェース1030は、ハードディスクドライブ1090に接続される。ディスクドライブインタフェース1040は、ディスクドライブ1100に接続される。例えば磁気ディスクや光ディスク等の着脱可能な記憶媒体が、ディスクドライブ1100に挿入される。シリアルポートインタフェース1050は、例えばマウス1110、キーボード1120に接続される。ビデオアダプタ1060は、例えばディスプレイ1130に接続される。
ハードディスクドライブ1090は、例えば、OS1091、アプリケーションプログラム1092、プログラムモジュール1093、プログラムデータ1094を記憶する。すなわち、サービスパス管理装置10の各処理を規定するプログラムは、コンピュータ1000により実行可能なコードが記述されたプログラムモジュール1093として実装される。プログラムモジュール1093は、例えばハードディスクドライブ1090に記憶される。例えば、サービスパス管理装置10における機能構成と同様の処理を実行するためのプログラムモジュール1093が、ハードディスクドライブ1090に記憶される。なお、ハードディスクドライブ1090は、SSD(Solid State Drive)により代替されてもよい。
また、上述した実施形態の処理で用いられる設定データは、プログラムデータ1094として、例えばメモリ1010やハードディスクドライブ1090に記憶される。そして、CPU1020が、メモリ1010やハードディスクドライブ1090に記憶されたプログラムモジュール1093やプログラムデータ1094を必要に応じてRAM1012に読み出して実行する。
なお、プログラムモジュール1093やプログラムデータ1094は、ハードディスクドライブ1090に記憶される場合に限らず、例えば着脱可能な記憶媒体に記憶され、ディスクドライブ1100等を介してCPU1020によって読み出されてもよい。あるいは、プログラムモジュール1093及びプログラムデータ1094は、ネットワーク(LAN、WAN(Wide Area Network)等)を介して接続された他のコンピュータに記憶されてもよい。そして、プログラムモジュール1093及びプログラムデータ1094は、他のコンピュータから、ネットワークインタフェース1070を介してCPU1020によって読み出されてもよい。
以上、本発明者によってなされた発明を適用した実施形態について説明したが、本実施形態による本発明の開示の一部をなす記述及び図面により本発明は限定されることはない。すなわち、本実施形態に基づいて当業者等によりなされる他の実施形態、実施例及び運用技術等は全て本発明の範疇に含まれる。
1 サービスチェイニングシステム
10 サービスパス管理装置
20 フロー識別装置
11 トラヒック管理部
12 装置管理部
13 リソース割当部
14 パス設定部
10 サービスパス管理装置
20 フロー識別装置
11 トラヒック管理部
12 装置管理部
13 リソース割当部
14 パス設定部
Claims (5)
- 複数の処理機能群から抽出した処理機能を経由するパスを設定し、パス帯域に応じた量の前記処理機能のリソースを前記パスに割り当て、前記パスの入口で受信したフローを前記パスに振り分けて転送する管理方法であって、
前記処理機能に割当てられたリソース量が極大値となるパス帯域のうち、大きい値から順にリソース使用率を算出する第1の算出工程と、
前記リソース使用率が目標値以上となる、前記リソース量が極大値となるパス帯域の最大値を、前記処理機能に設定するパス帯域として決定する決定工程と、
前記パスを各処理機能に設定し、決定されたパス帯域に応じたリソースの割り当てを行うパス設定工程と、
含んだことを特徴とする管理方法。 - 前記第1の算出工程の前に、前記処理機能に割当てられたリソース量が極大値となるパス帯域を算出する第2の算出工程
をさらに含んだことを特徴とする請求項1に記載の管理方法。 - 前記第2の算出工程は、前記処理機能を選択し、選択した処理機能のリソース量と、全処理機能の中で最もリソース量が少ない処理機能のリソース量と、最低保証帯域とを基に、選択した処理機能について前記リソース量が極大値となるパス帯域を算出することを特徴とする請求項2に記載の管理方法。
- 前記第2の算出工程は、全処理機能の中で最もリソース量が少ない処理機能のリソース量に対する前記選択した処理機能のリソース量の比以上であり、前記最低保証帯域に対する前記選択した処理機能のリソース量の比以下である整数を求め、求めた整数ごとに、前記整数に対する前記選択した処理機能のリソース量の比を、前記リソース量が極大値となるパス帯域として算出することを特徴とする請求項3に記載の管理方法。
- 複数の処理機能群から抽出した処理機能を経由するパスを設定し、パス帯域に応じた量の前記処理機能のリソースを前記パスに割り当て、前記パスの入口で受信したフローを前記パスに振り分けて転送する管理装置であって、
前記処理機能に割当てられたリソース量が極大値となるパス帯域のうち、大きい値から順にリソース使用率を算出して、前記リソース使用率が目標値以上となる、前記リソース量が極大値となるパス帯域の最大値を、前記処理機能に設定するパス帯域として決定する決定部と、
前記パスを各処理機能に設定し、決定されたパス帯域に応じたリソースの割り当てを行う設定部と、
有することを特徴とする管理装置。
Applications Claiming Priority (2)
| Application Number | Priority Date | Filing Date | Title |
|---|---|---|---|
| JP2018-156593 | 2018-08-23 | ||
| JP2018156593A JP2020031364A (ja) | 2018-08-23 | 2018-08-23 | 管理方法及び管理装置 |
Publications (1)
| Publication Number | Publication Date |
|---|---|
| WO2020040262A1 true WO2020040262A1 (ja) | 2020-02-27 |
Family
ID=69592504
Family Applications (1)
| Application Number | Title | Priority Date | Filing Date |
|---|---|---|---|
| PCT/JP2019/032888 Ceased WO2020040262A1 (ja) | 2018-08-23 | 2019-08-22 | 管理方法及び管理装置 |
Country Status (2)
| Country | Link |
|---|---|
| JP (1) | JP2020031364A (ja) |
| WO (1) | WO2020040262A1 (ja) |
Citations (2)
| Publication number | Priority date | Publication date | Assignee | Title |
|---|---|---|---|---|
| JP2017034535A (ja) * | 2015-08-04 | 2017-02-09 | 日本電信電話株式会社 | サービスチェイン管理装置およびサービスチェイン管理方法 |
| JP2018029263A (ja) * | 2016-08-17 | 2018-02-22 | 日本電信電話株式会社 | サービスパス管理装置およびサービスパス管理方法 |
-
2018
- 2018-08-23 JP JP2018156593A patent/JP2020031364A/ja active Pending
-
2019
- 2019-08-22 WO PCT/JP2019/032888 patent/WO2020040262A1/ja not_active Ceased
Patent Citations (2)
| Publication number | Priority date | Publication date | Assignee | Title |
|---|---|---|---|---|
| JP2017034535A (ja) * | 2015-08-04 | 2017-02-09 | 日本電信電話株式会社 | サービスチェイン管理装置およびサービスチェイン管理方法 |
| JP2018029263A (ja) * | 2016-08-17 | 2018-02-22 | 日本電信電話株式会社 | サービスパス管理装置およびサービスパス管理方法 |
Also Published As
| Publication number | Publication date |
|---|---|
| JP2020031364A (ja) | 2020-02-27 |
Similar Documents
| Publication | Publication Date | Title |
|---|---|---|
| US7957284B2 (en) | System and method for optimizing network bandwidth usage | |
| CN110248417B (zh) | 一种电力物联网中上行通信业务的资源分配方法及系统 | |
| Kuo et al. | Service chain embedding with maximum flow in software defined network and application to the next-generation cellular network architecture | |
| CN103036792B (zh) | 一种最大化最小公平多数据流传输调度方法 | |
| CA2938033A1 (en) | Reception packet distribution method, queue selector, packet processing device, and recording medium | |
| US20170048145A1 (en) | Switching device and control method of switching device | |
| JP6395260B2 (ja) | 仮想ネットワーク割当方法および装置 | |
| JP2017500816A (ja) | 大規模データセンターネットワークのためのトラフィック工学 | |
| CN111835849B (zh) | 增强接入网服务能力的方法和装置 | |
| CN107113323B (zh) | 一种数据存储方法、装置和系统 | |
| CN112714081B (zh) | 一种数据处理方法及其装置 | |
| CN114095806A (zh) | 用于聚合链路的流量分配方法、装置、光线路终端及介质 | |
| EP3200494A1 (en) | Radio resource allocation method and radio network controller | |
| CN116887080B (zh) | 云边弹性光网络中频谱和计算资源占用联合卸载方法 | |
| JP2016032210A (ja) | 仮想ネットワーク割当方法および装置 | |
| CN112948104B (zh) | 负载均衡的数据采集方法及装置 | |
| JP6363976B2 (ja) | サービスチェイン管理装置およびサービスチェイン管理方法 | |
| WO2020040262A1 (ja) | 管理方法及び管理装置 | |
| JP6557191B2 (ja) | サービスパス管理装置およびサービスパス管理方法 | |
| CN109862619A (zh) | 一种多信道分配方法 | |
| WO2020027065A1 (ja) | 通信システム及び通信方法 | |
| CN107770083A (zh) | 一种交换网络、控制器及负载均衡方法 | |
| CN117835098A (zh) | 弹性光网络中频谱高效的专用和共享路径混合保护方法 | |
| US12206589B2 (en) | Communication control device and communication control method | |
| JP6891831B2 (ja) | コントローラおよび通信システム |
Legal Events
| Date | Code | Title | Description |
|---|---|---|---|
| 121 | Ep: the epo has been informed by wipo that ep was designated in this application |
Ref document number: 19852090 Country of ref document: EP Kind code of ref document: A1 |
|
| NENP | Non-entry into the national phase |
Ref country code: DE |
|
| 122 | Ep: pct application non-entry in european phase |
Ref document number: 19852090 Country of ref document: EP Kind code of ref document: A1 |