PROCEDE ET DISPOSITIF D’AFFICHAGE DE DONNEES SONAR OU RADAR A HAUTE DYNAMIQUE METHOD AND APPARATUS FOR DISPLAYING HIGH DYNAMIC SONAR OR RADAR DATA
Domaine de l’invention Field of the invention
L’invention concerne le domaine du sonar ou du radar. Plus précisément, l’invention concerne un procédé et un dispositif permettant la visualisation de données dont la dynamique en amplitude est trop importante pour être directement rendue sur un moyen de visualisation tel qu'un écran ou du papier après impression. Etat de la Technique The invention relates to the field of sonar or radar. More specifically, the invention relates to a method and a device allowing the visualization of data whose dynamic range in amplitude is too great to be directly rendered on a visualization means such as a screen or paper after printing. State of the art
Les données sonar ou radar sont caractérisées par le fait que leur dynamique est très importante, facilement 60 dB ou plus. Deux types de rendus de ces données sont classiquement utilisés : un rendu en échelle logarithmique ou un rendu de l'amplitude du signal après normalisation et écrêtage (connu en anglais comme « clamping »). Sonar or radar data are characterized by the fact that their dynamics are very important, easily 60 dB or more. Two types of rendering of this data are conventionally used: rendering on a logarithmic scale or rendering of the amplitude of the signal after normalization and clipping (known in English as "clamping").
Le rendu sur échelle logarithmique a l'avantage de bien compresser la dynamique des images sur une plage pouvant être rendue à l'écran. Néanmoins ce rendu a l'inconvénient de gêner l'interprétation intuitive de l'image étant donné que l'on ne visualise pas l'amplitude du signal. Rendering on a logarithmic scale has the advantage of compressing the dynamics of the images well over a range that can be rendered on the screen. However, this rendering has the disadvantage of hampering the intuitive interpretation of the image since the signal amplitude is not displayed.
Dans le rendu en amplitude, les approches les plus communes font partie d’une famille de méthodes connues dans la communauté sous le nom de rendu à basse dynamique, ou en anglais, « Low Dynamic Rendering » (LDR). Les données à visualiser sont d’abord normalisées par application d'un contrôle automatique de gain ou d'un gain variable temporellement, sont ensuite écrêtées (en anglais « clamping » ) puis transcodées vers une couleur par le biais d'une fonction dite de transcodage (en anglais, « transcoding » ou « color mapping »), la
luminance de ladite couleur suivant classiquement une loi non linéaire de « tone mapping ». L’écrêtage se justifie par le fait que seuls quelques points dans l'image (moins de 0,5% typiquement) sont réellement à des niveaux très importants, l'essentiel du signal étant concentré dans une plage de dynamique plus réduite (de l’ordre de 10 dB) qui est celle mise en avant par le rendu. L'inconvénient de cette méthode est que l'écrêtage donne la même importance à des données d'intensité très fortes et des données d'intensité intermédiaires mais néanmoins trop importantes pour être correctement rendues sur le moyen de visualisation envisagé (écran, papier). En effet, ces données importantes, bien que statistiquement peu présentes dans l'image, sont en réalité porteuses d'information car ce sont des échos forts trahissant la présence d'un objet ou d'une cible. In amplitude rendering, the most common approaches are part of a family of methods known in the community as low dynamic rendering, or in English, "Low Dynamic Rendering" (LDR). The data to be displayed are first normalized by application of an automatic gain control or a time-variable gain, are then clipped (in English "clamping") and then transcoded to a color by means of a so-called transcoding (in English, "transcoding" or "color mapping"), the luminance of said color conventionally following a non-linear law of "tone mapping". Clipping is justified by the fact that only a few points in the image (typically less than 0.5%) are really at very high levels, most of the signal being concentrated in a smaller dynamic range (from 1 'order of 10 dB) which is the one highlighted by the rendering. The disadvantage of this method is that the clipping gives the same importance to very strong intensity data and intermediate intensity data but nevertheless too important to be correctly rendered on the visualization means envisaged (screen, paper). Indeed, these important data, although statistically little present in the image, are in reality carriers of information because they are strong echoes betraying the presence of an object or a target.
Des tentatives plus récentes utilisent des techniques dites de rendu à haute dynamique ou HDR pour « High Dynamic Rendering » en anglais, permettant de mélanger des images acquises à des niveaux de gains différents pour obtenir une seule image unique, afin de privilégier localement le niveau de gain permettant de voir le mieux les détails. Cette image unique est affichée avec une dynamique plus faible adaptée au moyen de visualisation. L'inconvénient de cette technique, prise telle quelle, est que des points isolés d'intensité très forte, seront malgré tout difficile à percevoir car leur étendue spatiale reste trop faible. More recent attempts use techniques known as high dynamic rendering or HDR for "High Dynamic Rendering" in English, allowing to mix images acquired at different gain levels to obtain a single single image, in order to favor locally the level of gain to see the details better. This single image is displayed with a lower dynamic range adapted to the visualization means. The drawback of this technique, taken as it is, is that isolated points of very high intensity will nevertheless be difficult to perceive because their spatial extent remains too small.
Le problème de ces approches LDR et HDR est qu’il n’est pas possible de visualiser des données dont la dynamique peut excéder 30 dB, car cela dépasse largement la dynamique admissible par un médium d'affichage commun (écran, papier) ou par l'œil humain. Par ailleurs, ces techniques ne permettent pas de visualiser des images à haute dynamique où des points de forte intensité sont statistiquement peu présents (typiquement moins de 0.5% des cas), ces points de forte intensité présentant une étendue spatiale faible dans l'image. Dans cette situation, le rendu direct de l'image avec une carte de couleurs
représentant l'amplitude du signal à représenter vers un niveau de gris linéaire est problématique. En effet, la majeure partie du signal étant de faible intensité, sauf pour quelques rares points brillants, l'image apparaîtrait comme globalement noire. The problem with these LDR and HDR approaches is that it is not possible to visualize data the dynamics of which can exceed 30 dB, as this greatly exceeds the admissible dynamics by a common display medium (screen, paper) or by the human eye. Furthermore, these techniques do not make it possible to visualize images with high dynamics where points of high intensity are statistically little present (typically less than 0.5% of the cases), these points of high intensity having a weak spatial extent in the image. In this situation, the direct rendering of the image with a color card representing the amplitude of the signal to be represented towards a linear gray level is problematic. Indeed, the major part of the signal being of weak intensity, except for some rare bright points, the image would appear as generally black.
Pour mieux comprendre les inconvénients des techniques précitées, le problème technique à résoudre est formulé comme ci-après. To better understand the drawbacks of the aforementioned techniques, the technical problem to be solved is formulated as below.
Soit /(x, y) la donnée image issue d’un senseur, un réel situé dans un intervalle [A, B] Dans le cas où l’image est issue d’un radar ou d’un sonar on note p(x,y ) la distance du point de coordonnées (x,y) au senseur au moment où l’information correspondant au dit point est acquise. Le temps et l’espace sont liés en radar et sonar par la relation p = et/ 2 où p est la distance de la cible au senseur, t est le temps aller- retour de l’onde et c la célérité de l’onde. La distance p est donc également proportionnelle à un temps. Let / (x, y) be the image data coming from a sensor, a real situated in an interval [A, B] In the case where the image comes from a radar or a sonar we note p (x , y) the distance from the coordinate point (x, y) to the sensor when the information corresponding to said point is acquired. Time and space are linked in radar and sonar by the relation p = and / 2 where p is the distance from the target to the sensor, t is the round trip time of the wave and c the speed of the wave . The distance p is therefore also proportional to a time.
La donnée affichée en sortie 0 x, y) = [r{x,y),· g{x,y),- b{x, y)Y est la donnée affichée (un vecteur de trois composantes entre [0,1] codant les composantes rouge r(x, y), vert g(x, y ), bleu b(x,y ) de la couleur affichée). La donnée affichée est supposée résider dans l’intervalle [0,1] tandis que la donnée issue du senseur est supposée résider dans un intervalle [A, B]. La valeur B - A est la dynamique du signal d’entrée. The data displayed at the output 0 x, y) = [r {x, y), · g {x, y), - b {x, y) Y is the data displayed (a vector of three components between [0,1 ] coding the components red r (x, y), green g (x, y), blue b (x, y) of the displayed color). The data displayed is assumed to reside in the range [0,1] while the data from the sensor is assumed to reside in the range [A, B]. The value B - A is the dynamic range of the input signal.
Dans la problématique évoquée où le signal est de forte dynamique, alors B - A » 1 (typiquement B - A peut aller jusqu'à 1012 en sonar ou en radar, voire beaucoup plus). In the problem mentioned where the signal is of strong dynamics, then B - A »1 (typically B - A can go up to 10 12 in sonar or radar, or even much more).
Selon l’approche de traitement d’image retenue, le codage des données est le suivant : Depending on the image processing approach adopted, the data coding is as follows:
- Dans la solution dite naïve de codage simple par la couleur, le codage de l'information par la couleur consiste à associer une couleur à une intensité /(x, y) avec une carte couleur (« color map » en anglais)
judicieusement choisie afin que les intensités faibles soient dans des tons données (par exemple des tons rouges), les intensités moyennes soient dans d'autres tons (par exemple des tons verts), et enfin des intensités fortes dans encore d'autres tons (par exemple des tons bleus). La donnée en sortie 0 x, y) peut être représentée par l’équation : - In the so-called naive simple color coding solution, coding information by color consists in associating a color with an intensity / (x, y) with a color map ("color map" in English) judiciously chosen so that the weak intensities are in given tones (for example red tones), the average intensities are in other tones (for example green tones), and finally strong intensities in still other tones (for example example of blue tones). The output data 0 x, y) can be represented by the equation:
0 x,y) = c(I x,y )) où‘c’ représente la carte couleur. 0 x, y) = c (I x, y)) where‘c ’represents the color card.
L'inconvénient de cette solution de codage simple par la couleur, est la difficulté à lire l'image par une surcharge de couleurs, ainsi que des problèmes perceptuels et de goûts personnels des opérateurs. Il y a aussi l'habitude des opérateurs à manipuler une image essentiellement monochrome (en nuances de gris, de vert ou d'ambre) étant donné que la donnée sonar ou radar a été affichée jusqu'à récemment (début des années 2000) sur des écrans cathodiques monochromes ou imprimés sur du papier thermique: c'est la luminance de la couleur qui, essentiellement, code l'information d'amplitude du signal. The disadvantage of this simple color coding solution is the difficulty in reading the image due to an overload of colors, as well as perceptual problems and personal tastes of the operators. There is also the habit of operators to manipulate an essentially monochrome image (in shades of gray, green or amber) since sonar or radar data was displayed until recently (early 2000s) on monochrome cathode screens or printed on thermal paper: it is the luminance of the color which, essentially, codes the signal amplitude information.
- Dans l’approche LDR « Low Dynamic Rendering » , les données à afficher subissent classiquement un traitement comprenant des opérations de normalisation (1 ), d’écrêtage (2) et de transcodage (3). En entrée, la donnée (2D) à afficher I(x,y ) est comprise dans un intervalle [A, B] et est proportionnelle au signal mesuré. Le traitement consiste en : - In the LDR “Low Dynamic Rendering” approach, the data to be displayed conventionally undergoes processing comprising normalization (1), clipping (2) and transcoding (3) operations. At the input, the data (2D) to be displayed I (x, y) is included in an interval [A, B] and is proportional to the measured signal. The treatment consists of:
(1 ) La normalisation des données N{x,y) par rapport à une valeur de référence. Celle-ci peut être réalisée dans le domaine du sonar ou du radar, soit: (1) Normalization of the data N (x, y) with respect to a reference value. This can be done in the area of sonar or radar, either:
1.a. par un gain variable dans le temps (TVG) pour « Time Variable Gain», c'est-à-dire par une loi f{p{x,y )) prédéfinie dépendant de la géométrie du problème: 1.a. by a variable time gain (TVG) for "Time Variable Gain", that is to say by a predefined law f (p {x, y)) depending on the geometry of the problem:
N{x,y) = ( I(x, y) - A ) x /(p(x,y))
1.b. par un contrôle automatique de gain local (AGC) pour « Automatic Gain Control » qui revient à appliquer un filtre passe-haut h au signal par convolution ou par filtrage récursif afin de supprimer une composante moyenne lentement variable: N {x, y) = (I (x, y) - A) x / (p (x, y)) 1.b. by an automatic local gain control (AGC) for “Automatic Gain Control” which amounts to applying a high-pass filter h to the signal by convolution or by recursive filtering in order to remove a slowly variable average component:
N x,y ) = (/(x, y)— A) * h(x, y ) Dans les deux cas 1.a et 1.b, la fonction / ou h, est judicieusement choisie pour qu’en moyenne, N{x,y ) soit voisine d'une valeur cible m définie comme un paramètre du problème. Cette valeur est prise égale à 1 pour la suite de la description. N x, y) = (/ (x, y) - A) * h (x, y) In the two cases 1.a and 1.b, the function / or h is judiciously chosen so that on average, N {x, y) is close to a target value m defined as a parameter of the problem. This value is taken equal to 1 for the rest of the description.
Le gain variable dans le temps ou le contrôle automatique de gain local peut être implémenté soit dans un circuit électronique analogique comme un étage de mise en forme de la donnée (avant conversion analogique vers numérique, CAN, dans le cas où le composant de CAN est de dynamique faible), soit de manière numérique avant affichage. The time-variable gain or the automatic local gain control can be implemented either in an analog electronic circuit as a data shaping stage (before analog to digital conversion, CAN, in the case where the CAN component is dynamic), either digitally before display.
La manière exacte de calculer les deux fonctions f ou h dépend du senseur et peut varier dans les détails sans changer l'esprit du traitement. The exact way of calculating the two functions f or h depends on the sensor and can vary in details without changing the spirit of the treatment.
(2) L’écrêtage des données E{x, y) pour les forcer à résider dans un intervalle [0, T] avec m < T : (2) Clipping of data E {x, y) to force them to reside in an interval [0, T] with m <T:
E{x,y) = min(iV(x, y), r) où la valeur de T est un paramètre du problème. (3) Le transcodage des données vers une carte de couleurs: E {x, y) = min (iV (x, y), r) where the value of T is a parameter of the problem. (3) Transcoding data to a color map:
0 x, y) = c E{x,y)) avec [0, G] [0,1]3 choisie judicieusement pour percevoir au mieux les données. La fonction c est la «carte des couleurs » utilisée pour le rendu des données. 0 x, y) = c E {x, y)) with [0, G] [0,1] 3 chosen judiciously to better perceive the data. Function c is the "color map" used for rendering the data.
En sortie, l'image 2D couleur 0(x, y) est affichée.
Un premier inconvénient de l’approche LDR est la perte d'information de la valeur originale du signal suite à l'étape (1 ) de normalisation. En effet les données sont ramenées à une valeur moyenne m qui n'est pas forcément dans l'intervalle d'origine [A, B] Il n'y a donc plus de lien direct entre la « couleur » présentée à l'écran et l'intensité mesurée du signal. As output, the 2D color image 0 (x, y) is displayed. A first drawback of the LDR approach is the loss of information of the original value of the signal following the normalization step (1). Indeed, the data are brought back to an average value m which is not necessarily in the original interval [A, B] There is therefore no longer a direct link between the "color" presented on the screen and the measured signal strength.
Un second inconvénient de cette méthode est l'étape (2) d'écrêtage qui ramène à une couleur identique toutes les données supérieures à la valeur m. Ce problème est très pénalisant pour l'identification de cibles caractérisées par des intensités l(x,y) très importantes, qui après l'écrêtage, vont être représentées à l'identique d’autres cibles d'intensité beaucoup plus faible, mais pourtant ramenées également à la valeur T. Il est donc impossible de distinguer des échos très forts, d'échos d'intensité intermédiaire, car les deux types sont en général supérieurs à T et sont donc représentés de la même manière. Idéalement la valeur de T doit être la plus grande possible afin que la probabilité de trouver une valeur N{x, y) > T soit la plus faible possible, mais cela n'est pas toujours possible. A second drawback of this method is the clipping step (2) which brings all the data greater than the value m to an identical color. This problem is very penalizing for the identification of targets characterized by very high intensities l (x, y), which after clipping will be represented identically to other targets of much lower intensity, but nevertheless also reduced to the value T. It is therefore impossible to distinguish very strong echoes from echoes of intermediate intensity, because the two types are generally greater than T and are therefore represented in the same way. Ideally the value of T should be as large as possible so that the probability of finding a value N (x, y)> T is as low as possible, but this is not always possible.
La figure 1 permet d’illustrer les inconvénients précités des fonctions de normalisation et d’écrêtage (avant le transcodage) sur un exemple simplifié de signal 1 D. Il est visible sur la courbe du bas, qu'après l’écrêtage les deux pics d'intensités élevées sont représentés à la même valeur alors qu'ils sont pourtant d'intensité différente dans le signal d’origine tel que montré sur la courbe du haut. FIG. 1 illustrates the aforementioned drawbacks of the normalization and clipping functions (before transcoding) on a simplified example of a 1 D signal. It is visible on the bottom curve that after clipping the two peaks high intensities are represented at the same value whereas they are however of different intensity in the original signal as shown on the upper curve.
Certaines améliorations sont proposées à cette approche. Pour les décrire, on notera L la luminance associée à la couleur c, et qui est définie dans la norme ITU BT.709 par l’équation ci-après: (c) = 0,2126 r + 0,7152# + 0,0722 b
où c = [r; g,- b]T avec r, g, b le triplet de couleurs rouge, vert, bleu (de valeurs codées entre 0 et 1 ). Dans la suite on notera L(x,ÿ) la luminance associée à la couleur codée au pixel de coordonnées (x,y). On notera également S(c) la saturation de la couleur c, prise entre 0 et 1 , et H(c) la nuance de la couleur c. Some improvements are proposed to this approach. To describe them, we will denote by L the luminance associated with the color c, which is defined in the ITU standard BT.709 by the following equation: (c) = 0.2126 r + 0.7152 # + 0, 0722 b where c = [r; g, - b] T with r, g, b the triplet of colors red, green, blue (of values coded between 0 and 1). In the following, we will denote L (x, ÿ) the luminance associated with the color coded at the pixel with coordinates (x, y). We will also note S (c) the saturation of color c, taken between 0 and 1, and H (c) the shade of color c.
Une première amélioration de l'algorithme de rendu LDR précédent consiste naïvement à l'étape (3) de transcodage à choisir c de telle manière que L suive une loi linéaire en fonction de c(E(x, y )) = [r(x, y); g x, y); b{x, y)]r, ce qui exige généralement de choisir une valeur d'écrêtage T très proche de zéro afin de permettre à l'œil humain de voir les données intéressantes dans l'image. Or, il est souhaitable d’avoir T le plus grand possible puisque ce terme régule la dynamique perceptible dans le moyen de visualisation. A first improvement of the previous LDR rendering algorithm naively consists in the transcoding step (3) in choosing c so that L follows a linear law as a function of c (E (x, y)) = [r ( x, y); gx, y); b {x, y)] r , which generally requires choosing a clipping value T very close to zero in order to allow the human eye to see the data of interest in the image. However, it is desirable to have T as large as possible since this term regulates the perceptible dynamics in the display means.
Une autre amélioration est l'utilisation à l'étape (3) de transcodage d'un procédé nommé « tone mapping », qui n'est rien d'autre que l'application d'une fonction non linéaire à E(x, y ). Dans le cas de données autres que du sonar ou du radar, par exemple des images photographiques, une loi qui est classiquement utilisée est la compression gamma : Another improvement is the use in step (3) of transcoding of a process called "tone mapping", which is nothing other than the application of a nonlinear function to E (x, y ). In the case of data other than sonar or radar, for example photographic images, a law which is conventionally used is gamma compression:
L{x, y) = E x, y)r où le paramètre y régule le contraste. Une valeur basse de ydonne un contraste plus faible donc une image plus« terne» mais augmente la visibilité de zones de l'image où le signal l(x) est faible. L {x, y) = E x, y) r where the parameter y regulates the contrast. A low value of y gives a lower contrast, therefore a more “dull” image, but increases the visibility of areas of the image where the signal l (x) is weak.
Une autre manière de réaliser le « tone mapping » est de passer en échelle logarithmique. Ainsi, afficher les valeurs en décibels avec une rampe de couleurs linéaire dans le domaine logarithmique, est un exemple de tone mapping log-linéaire : Another way to achieve "tone mapping" is to go on a logarithmic scale. Thus, displaying the values in decibels with a linear color ramp in the logarithmic domain, is an example of log-linear tone mapping:
L{x, y) = K1. log (x, y) + K2
des paramètres de la loi.
Dans le cas de données sonar ou radar actif, la fonction c est généralement choisie pour que la luminance L associée suive une loi substantiellement log-sigmoïdale, c'est-à-dire que si m = 1 alors l'évolution de L(x, y) en fonction de E(x, y) suit une relation voisine de:
L {x, y) = K 1 . log (x, y) + K 2 parameters of the law. In the case of active sonar or radar data, the function c is generally chosen so that the associated luminance L follows a substantially log-sigmoidal law, that is to say that if m = 1 then the evolution of L (x , y) as a function of E (x, y) follows a relation close to:
L(x, y ) = E(-x y +1 avec Y un paramètre réglant la pente de la fonction L autour de E{x, y) = 1 (cette pente vaut y/4 et est laissée en général comme un paramètre de réglage de l'opérateur, puisque qu'elle correspond perceptuellement au contraste: plus y est faible, plus les zones de signal /(x,y) faible seront lisibles). La forme de cette loi est justifiée physiquement par la loi de Weber-Fechner qui dicte que la perception humaine d'un grand nombre de stimuli, dont la vue, augmente de manière logarithmique avec l'intensité du stimulus, ce qui explique par exemple que la magnitude des étoiles soit prise comme une échelle logarithmique. On se rapproche donc d'une loi logarithmique pour des valeurs proches de 1 , et on s'en éloigne ensuite pour des valeurs plus fortes. L (x, y) = E (-xy +1 with Y a parameter regulating the slope of the function L around E {x, y) = 1 (this slope is worth y / 4 and is generally left as a parameter of adjustment of the operator, since it perceptually corresponds to the contrast: the lower the y, the more the areas of weak signal / (x, y) will be readable) The form of this law is physically justified by the Weber-Fechner law which dictates that the human perception of a large number of stimuli, including sight, increases logarithmically with the intensity of the stimulus, which explains for example that the magnitude of the stars is taken as a logarithmic scale. We thus approach a logarithmic law for values close to 1, and we move away from it for higher values.
Dans les deux cas le fait de jouer sur le paramètre y permet d'étendre quelque peu l'intervalle utile des données, c'est-à-dire d'augmenter T, mais cette augmentation reste bornée à des valeurs qui ne sont pas suffisantes pour être réellement utiles. In both cases the fact of playing on the parameter y makes it possible to extend the useful interval of the data somewhat, that is to say to increase T, but this increase remains limited to values which are not sufficient to be really useful.
Des améliorations existent aussi sur l’approche en rendu HDR en imagerie optique et en sonar/radar. En notant l(x, y) l'image brute captée par le senseur et L(x, y ) la luminance associée (/ = L dans le cas d'une image en niveaux de gris), le rendu HDR en imagerie optique consiste à acquérir une pluralité d'images 0, y), ... In(x, y) de la même scène: Improvements also exist on the HDR rendering approach in optical imagery and in sonar / radar. By noting l (x, y) the raw image captured by the sensor and L (x, y) the associated luminance (/ = L in the case of a grayscale image), HDR rendering in optical imagery consists to acquire a plurality of images 0, y), ... I n (x, y) of the same scene:
- soit par des réglages différents du senseur (exposition, ouverture, gains) avec des acquisitions réalisées consécutivement dans le temps dans un intervalle très court où l'on a donc 40, y), les réglages du
senseur étant calés sur un intervalle de luminance [Ak-1 Ak\ avec AQ = A et An = B. - either by different settings of the sensor (exposure, aperture, gains) with acquisitions carried out consecutively over time in a very short interval where there are therefore 40, y), the settings of the sensor being calibrated on a luminance interval [A k-1 A k \ with A Q = A and A n = B.
- soit en faisant l'acquisition d'une seule image /(x, y) puis en découpant l'intervalle [A, B] en une pluralité d'intervalles de luminance [A0 = A, A·^, [A2,A3], ... , [An-2,An_i\, [Ah-1 Ah = B], puis en construisant : (x, y) G [Ak,Ak+1]- either by acquiring a single image / (x, y) and then cutting the interval [A, B] into a plurality of luminance intervals [A 0 = A, A · ^, [A 2 , A 3 ], ..., [A n-2 , A n _i \, [A h-1 A h = B], then constructing: (x, y) G [A k , A k + 1 ]
Ensuite une image de dynamique plus faible est construite :
avec
wfc(x, y) = 1, wk(x,y ) étant un poids judicieusement choisi pour privilégier en (x, y) la donnée Ik avec k choisi de telle sorte que 4(x, y) soit le plus proche possible du milieu de l'intervalle [Ak-1 Ak et la fonction / réalisant le « tone mapping » de l'image pour la ramener à des composantes dans l’intervalle [0,1]. Concrètement, cette formulation permet de privilégier, en un pixel de coordonnées (x, y), la valeur k pour laquelle l’image Ik (x, y) donne une intensité qui n’est ni sous-, ni sur exposée. Par contre, un inconvénient fondamental est que la luminance de l’objet n’est plus nécessairement proportionnelle à l’intensité de la donnée brute. Then a weaker dynamic image is constructed: with w fc (x, y) = 1, w k (x, y) being a weight judiciously chosen to privilege in (x, y) the datum I k with k chosen so that 4 (x, y) is the most possible as close to the middle of the interval [A k-1 A k and the function / performing the “tone mapping” of the image to bring it back to components in the interval [0,1]. Concretely, this formulation makes it possible to favor, in a pixel of coordinates (x, y), the value k for which the image I k (x, y) gives an intensity which is neither under nor over exposed. On the other hand, a fundamental drawback is that the luminance of the object is no longer necessarily proportional to the intensity of the raw data.
Les documents suivants sont à considérer comme des techniques connues de rendu HDR et rendu amélioré en sonar, radar et en optique: The following documents are to be considered as known HDR and improved rendering techniques in sonar, radar and optics:
- Jarostaw Duda, "Zastosowanie techniki HDR do obrazôw pozyskiwanych z sektorowego sonaru skanujgcego" , Biuletyn WAT Vol. LX, Nr 3, 201 1 ;
- Frédo Durand et Julie Dorsey, "Fast Bilateral Filtering for the Display of High-Dynamic-Range Images". ACM Transactions on Graphies, 2002, 21 , 3, 257-266; - Jarostaw Duda, "Zastosowanie techniki HDR do obrazôw pozyskiwanych z sektorowego sonaru skanujgcego", Biuletyn WAT Vol. LX, Nr 3, 201 1; - Frédo Durand and Julie Dorsey, "Fast Bilateral Filtering for the Display of High-Dynamic-Range Images". ACM Transactions on Graphies, 2002, 21, 3, 257-266;
- P. E. Debevec, J. Malik, Recovering High Dynamic Range Radiance Maps from Photographs, International Conférence on Computer Graphies and Interactive Techniques, Addison-Wesley Publishing Co., New York, USA, 1997; - P. E. Debevec, J. Malik, Recovering High Dynamic Range Radiance Maps from Photographs, International Conférence on Computer Graphies and Interactive Techniques, Addison-Wesley Publishing Co., New York, USA, 1997;
- Martin Lambers, Andréas Kolb, "Adaptive Dynamic Range Réduction for SAR /mages", 7m European conférence on synthetic aperture radar (EUSAR), 2008; - Martin Lambers, Andréas Kolb, "Adaptive Dynamic Range Reduction for SAR / mages", 7m European conference on synthetic aperture radar (EUSAR), 2008;
- Satoshi Hisanaga, Koji Wakimoto and Koji Okamura, "Compression Method for High Dynamic Range Intensity to Improve SAR Image Visibility", Proc. International MultiConference of Engineers and Computer Scientists 201 1 vol. 1 , IMECS 201 1 , March 16-18, 201 1 , Hong Kong. La méthode décrite dans l’article de P.E. Debevec a été adaptée de l'optique pour le sonar par J. Duda. Une méthode voisine, celle de F. Durand et J. Dorsey a été adaptée de l'optique pour le domaine du radar par M. Lambers et A. Kolb et s'applique aussi bien au sonar. Une autre approche relativement voisine a été proposée par S. Hisanaga, K. Wakimoto et K. Okamura également dans le domaine du radar. - Satoshi Hisanaga, Koji Wakimoto and Koji Okamura, "Compression Method for High Dynamic Range Intensity to Improve SAR Image Visibility", Proc. International MultiConference of Engineers and Computer Scientists 201 1 vol. 1, IMECS 201 1, March 16-18, 201 1, Hong Kong. The method described in the article by P.E. Debevec was adapted from sonar optics by J. Duda. A similar method, that of F. Durand and J. Dorsey has been adapted from optics for the radar domain by M. Lambers and A. Kolb and applies equally well to sonar. Another relatively similar approach has been proposed by S. Hisanaga, K. Wakimoto and K. Okamura also in the field of radar.
Les demandes de brevets suivantes sont citées comme proposant des solutions de rendu HDR : The following patent applications are cited as offering HDR rendering solutions:
- CN104408752B de XIDIAN University décrit une méthode de compression d'image à plage dynamique élevée, basée sur un algorithme de mappage de tons mixtes ; et - CN104408752B from XIDIAN University describes a high dynamic range image compression method, based on a mixed tone mapping algorithm; and
- W020071 13824 A2 décrit une méthode pour faciliter la visualisation en volume d’images synthétiques issues de données radar à plage dynamique élevée.
En résumé, les inconvénients des solutions existantes sont alors : - WO20071 13824 A2 describes a method for facilitating the visualization in volume of synthetic images derived from radar data with high dynamic range. In summary, the disadvantages of existing solutions are:
- Pour la méthode naïve : la difficulté de trouver une carte de couleur qui soit adaptée au problème et lisible par l'opérateur qui est habitué à voir des données d'amplitude essentiellement codées par la luminance (une amplitude plus grande du signal donne une luminance plus grande de sa représentation à l'écran). - For the naive method: the difficulty of finding a color map which is adapted to the problem and readable by the operator who is used to seeing amplitude data essentially coded by the luminance (a larger amplitude of the signal gives a luminance of its representation on the screen).
- Pour la méthode classique LDR (normalisation, écrêtage, transcodage) : celle-ci ne permet d'afficher que des images ayant une dynamique utile faible. Cette dynamique peut être augmentée par une utilisation de techniques de tone mapping, mais ne permet cependant pas d'augmenter la dynamique de manière satisfaisante. - For the classic LDR method (normalization, clipping, transcoding): this only displays images with low useful dynamics. This dynamic can be increased by using tone mapping techniques, but does not allow the dynamics to be satisfactorily increased.
- Pour le rendu HDR: bien que permettant d'augmenter la dynamique de manière satisfaisante, cette approche a des limites pour les données qui présentent des pics d'intensité de taille spatiale très petite (un ou deux pixels de large). Bien qu’ils soient rendus avec une couleur différente par un procédé adapté, ces pics sont tellement petits qu'ils sont souvent difficiles à voir même à pleine résolution, et plus difficiles encore si l'image subit une réduction d’échelle (« zoom arrière »). - For HDR rendering: although it allows the dynamics to be satisfactorily increased, this approach has limits for data which have intensity peaks of very small spatial size (one or two pixels wide). Although they are rendered with a different color by a suitable process, these peaks are so small that they are often difficult to see even at full resolution, and even more difficult if the image is downscaled ("zoom back ").
Il est donc nécessaire de fournir une solution qui ne présente pas les inconvénients précités, et qui permette de rapidement mettre en évidence des points de forte intensité tout en permettant une lecture adaptée et fiable d’une image là où l'intensité est faible, et ce quelle que soit l’échelle de visualisation de l’image. It is therefore necessary to provide a solution which does not have the aforementioned drawbacks, and which makes it possible to quickly highlight points of high intensity while allowing suitable and reliable reading of an image where the intensity is low, and whatever the scale of visualization of the image.
La présente invention répond à ce besoin. The present invention meets this need.
Résumé de l’invention Summary of the invention
Un objet de la présente invention est de proposer une solution qui consiste essentiellement à combiner deux images: l’une correspondant à
des dynamiques basses, l'autre correspondant à des dynamiques plus élevées. Les deux images sont rendues avec des nuances de couleurs différentes afin de pouvoir distinguer, à l'issue de la fusion, de quelle image d'origine provient l'information. Avantageusement, la solution se distingue d'un rendu haute dynamique classique par le fait que l'image contenant les informations correspondant aux fortes dynamiques, a au préalable subi un prétraitement permettant d'augmenter l'étalement spatial des points d'échos forts, la taille de cet étalement croissant avec l'amplitude du signal à représenter, tout en étant également contrôlé par l'échelle de visualisation de l'image à l'écran : vue globale ou vue locale avec fort grossissement, afin de permettre dans le premier cas de rapidement mettre en évidence tous les échos d'une grande zone, et dans l'autre cas, de mettre en évidence la structure des points d'échos forts, dits aussi «points brillants» (« bright points » en anglais), dans l'image des cibles. Ce prétraitement est de plus fondamentalement configuré de manière à ce que des échos très forts ne viennent pas perturber la lecture de zones d'intensité très faible situées à proximité, ce qui permet de comprendre l'image dans son entièreté. Le prétraitement est également configuré de manière à ce que l’étalement spatial des points brillants puisse optionnellement varier avec l’échelle de visualisation de l’image, permettant aux échelles les plus petites (images de détail) de percevoir la configuration des points brillants de la cible pour permettre à l’opérateur d’effectuer une tâche de classification, et permettant de mettre en évidence la cible en entier dans les échelles les plus grossières, afin d’assurer une tâche de détection. An object of the present invention is to propose a solution which essentially consists in combining two images: one corresponding to low dynamics, the other corresponding to higher dynamics. The two images are rendered with shades of different colors in order to be able to distinguish, after the fusion, from which original image the information comes from. Advantageously, the solution differs from a conventional high dynamic rendering by the fact that the image containing the information corresponding to the strong dynamics, has previously undergone a pretreatment making it possible to increase the spatial spreading of the strong echo points, the size of this increasing spread with the amplitude of the signal to be represented, while also being controlled by the scale for viewing the image on the screen: global view or local view with high magnification, in order to allow in the first case to quickly highlight all the echoes of a large area, and in the other case, to highlight the structure of the strong echo points, also called “bright points”, in the image of the targets. This preprocessing is moreover fundamentally configured so that very strong echoes do not disturb the reading of zones of very low intensity located nearby, which makes it possible to understand the image in its entirety. The preprocessing is also configured so that the spatial spreading of the bright points can optionally vary with the scale of visualization of the image, allowing the smallest scales (detail images) to perceive the configuration of the bright points of the target to allow the operator to perform a classification task, and making it possible to highlight the entire target in the coarsest scales, in order to ensure a detection task.
L’invention permet en particulier de mettre rapidement des échos forts en évidence, d'évaluer l'indice de cibles sur une large plage de dynamique, ainsi que d'analyser la structure de la répartition de points brillants d’une cible.
Pour atteindre cet objectif, le procédé de l’invention pour visualiser des données d'imagerie à forte dynamique (typiquement sonar ou radar), permet de faire une moyenne pondérée pixel à pixel de deux images, l'une correspondant à des données de basse intensité, et l'autre à des données de haute intensité, les deux images étant rendues avec deux cartes de couleurs distinctes afin de mettre en évidence la nature de l’information à un pixel donné (basse ou haute intensité), l'image de haute intensité subissant un filtrage passe-bas dont la réponse impulsionnelle a une largeur croissant avec l’amplitude du signal à représenter et variant avec l’échelle de visualisation de l'image, de manière à mettre en évidence les échos forts, permettre une lecture visuelle de la répartition des points brillants, ainsi que de permettre d’avoir une estimation rapide et visuelle de l’intensité d’un point brillant. The invention makes it possible in particular to rapidly highlight strong echoes, to evaluate the target index over a wide dynamic range, as well as to analyze the structure of the distribution of bright spots of a target. To achieve this objective, the method of the invention for viewing high dynamic imaging data (typically sonar or radar), makes it possible to make a weighted pixel-to-pixel average of two images, one corresponding to low data. intensity, and the other to high intensity data, the two images being rendered with two separate color maps in order to highlight the nature of the information at a given pixel (low or high intensity), the image of high intensity undergoing a low-pass filtering whose impulse response has a width increasing with the amplitude of the signal to be represented and varying with the scale of visualization of the image, so as to highlight the strong echoes, allow a reading visual distribution of the bright spots, as well as allowing a quick and visual estimate of the intensity of a bright spot.
L'invention présente les avantages suivants par rapport à l’état de l’art : elle met en évidence des points isolés d'intensité forte sans perturber la visibilité de points d’intensité faible au voisinage ; elle permet une lecture directe de l’intensité, éventuellement relative, des points ; elle permet également, par une utilisation judicieuse de l’échelle de visualisation dans l’étage de filtrage non linéaire, de permettre à un opérateur de réaliser des tâches de détection d'échos et d'analyse de la structure des échos par la seule manipulation de l’échelle de visualisation. The invention has the following advantages over the state of the art: it highlights isolated points of high intensity without disturbing the visibility of points of low intensity in the vicinity; it allows a direct reading of the intensity, possibly relative, of the points; it also allows, by judicious use of the display scale in the non-linear filtering stage, to allow an operator to perform tasks of detecting echoes and analyzing the structure of echoes by the only manipulation of the visualization scale.
La présente invention trouvera une application avantageuse dans le domaine du sonar ou du radar. Dans le domaine spécifique du sonar, elle s'applique aussi bien au sonar d’imagerie (imagerie du fond, à des fins hydrographiques ou militaires, par exemple en guerre des mines), qu’au données de sondeurs, éventuellement multi-faisceaux comme les (MBES) pour « MultiBeam Echo Sounder » en anglais, ou aux sonars de lutte anti sous-marine (ASuW) pour « Anti-Submarine Warfe » en anglais ou encore à tout affichage à haute dynamique tel que les affichages connus sous le nom d'Active Géographie Plot (AGP) décrit dans la
demande de brevet EP120488B1 ou Energy Géographie Plot (EGP) décrit dans la demande de brevet EP1360522B1. Dans le domaine du radar, elle est particulièrement indiquée dans la visualisation de données à fort contraste, tel que rencontré en surveillance maritime. The present invention will find an advantageous application in the field of sonar or radar. In the specific field of sonar, it applies as well to imaging sonar (bottom imaging, for hydrographic or military purposes, for example in mine warfare), as to sounders data, possibly multi-beam like the (MBES) for "MultiBeam Echo Sounder" in English, or anti-submarine sonar (ASuW) for "Anti-Submarine Warfe" in English or any high dynamic display such as the displays known under the name of Active Geography Plot (AGP) described in the Patent application EP120488B1 or Energy Géographie Plot (EGP) described in patent application EP1360522B1. In the radar field, it is particularly indicated in the visualization of high contrast data, as encountered in maritime surveillance.
Dans un mode de réalisation, l’invention consiste en un procédé de visualisation de données matricielles / contenant des valeurs de forte dynamique prises dans un intervalle [A, B] connu, permettant de transformer la matrice en un tableau à deux dimensions contenant des vecteurs de taille‘3’ représentant des couleurs pouvant être affichées sur un périphérique de visualisation tel qu’un écran, ou être imprimées. Le tableau résulte de la combinaison par le biais d’une moyenne pondérée, d’une première image couleur dite de « basse intensité » dont les couleurs représentent des informations d’amplitude situées entre [A, A + r , et d’une seconde image couleur de « haute intensité » dont les couleurs représentent des informations d’amplitude situées entre [A, A + T2], et où toutes les données supérieures à A + T2 sont représentées de la même couleur que les données de valeur A + T2. Avantageusement le procédé est caractérisé en ce que l’image de « haute intensité » subit un filtrage passe-bas non linéaire tel que la largeur de la zone où la valeur absolue de la réponse impulsionnelle locale du filtre est non négligeable, croît avec l’intensité locale de l’image en ce point, créant un halo autour des points de forte intensité, halo dont la taille augmente avec l’intensité locale. De manière avantageuse, le filtre passe-bas non linéaire ainsi que les palettes de couleurs utilisées pour le rendu des images de « basse intensité » et « haute intensité » sont judicieusement configurés pour permettre à un opérateur d’effectuer plus facilement les tâches suivantes : In one embodiment, the invention consists of a method for viewing matrix data / containing high dynamic values taken in a known interval [A, B], making it possible to transform the matrix into a two-dimensional table containing vectors of size '3' representing colors which can be displayed on a display device such as a screen, or be printed. The table results from the combination by means of a weighted average, of a first color image known as of “low intensity” whose colors represent information of amplitude located between [A, A + r, and of a second “high intensity” color image whose colors represent amplitude information situated between [A, A + T 2 ], and where all the data greater than A + T 2 are represented in the same color as the data of value A + T 2 . Advantageously, the method is characterized in that the “high intensity” image undergoes non-linear low-pass filtering such that the width of the zone where the absolute value of the local impulse response of the filter is not negligible, increases with local intensity of the image at this point, creating a halo around the points of high intensity, halo whose size increases with local intensity. Advantageously, the non-linear low-pass filter as well as the color palettes used for rendering "low intensity" and "high intensity" images are judiciously configured to allow an operator to more easily perform the following tasks:
- visualiser des données de faible et forte intensité de manière simultanée ;
- détecter et interpréter la disposition spatiale de points correspondant à du signal de forte intensité (souvent associés physiquement à des cibles) ; la probabilité de cette détection par un opérateur est sensiblement augmentée par l’augmentation de leur taille spatiale grâce à l’étape de filtrage passe-bas non linéaire, ce qui permet alors de voir des zones de forte intensité auparavant invisibles car trop petites; - view low and high intensity data simultaneously; - detect and interpret the spatial arrangement of points corresponding to a strong signal (often physically associated with targets); the probability of this detection by an operator is appreciably increased by the increase in their spatial size thanks to the non-linear low-pass filtering step, which then makes it possible to see areas of high intensity previously invisible because too small;
- lire le niveau d’intensité des points par le biais de la couleur et de la luminance, ainsi que par la taille des halos autour des échos obtenus grâce à l’étape de filtrage non linéaire. - read the intensity level of the points through color and luminance, as well as by the size of the halos around the echoes obtained thanks to the non-linear filtering step.
Pour obtenir les résultats recherchés, un procédé de rendu d’image pour des données matricielles issues d’un signal d’entrée ayant une forte dynamique est proposé. Le procédé mis en œuvre par ordinateur comprend des étapes consistant à : To obtain the desired results, an image rendering method for raster data originating from an input signal having a strong dynamic is proposed. The process implemented by computer comprises steps consisting in:
- générer à partir des données matricielles une première image couleur dite « image de basse intensité » dont les couleurs représentent des intensités faibles du signal d’entrée ; - generate from the matrix data a first color image called "low intensity image" whose colors represent low intensities of the input signal;
- générer à partir des données matricielles une seconde image couleur dite « image de haute intensité » dont les couleurs représentent des intensités fortes du signal d’entrée, ladite étape comprenant au moins une étape de filtrage consistant à appliquer en chaque point (x, ) de l’image, un filtre passe-bas non linéaire de réponse impulsionnelle monomodale, symétrique centralement par rapport au point de coordonnées (0,0); - generate from the matrix data a second color image called "high intensity image" whose colors represent strong intensities of the input signal, said step comprising at least one filtering step consisting in applying at each point (x,) from the image, a non-linear low-pass filter with a single-mode impulse response, symmetrical centrally with respect to the point of coordinates (0,0);
- générer une image couleur fusionnée combinant point à point l’image de basse intensité et l’image de haute intensité en une moyenne, pondérée par un facteur constant, de chacune des composantes de couleurs;
- normaliser l’image combinée de manière à ce qu'en chaque point, la luminance de l'image résultante soit égale à la luminance de l'image de basse intensité; et - generate a merged color image combining point to point the low intensity image and the high intensity image in an average, weighted by a constant factor, of each of the color components; - normalize the combined image so that at each point, the luminance of the resulting image is equal to the luminance of the low intensity image; and
- redimensionner l'image résultante sur au moins un axe de la matrice. - resize the resulting image on at least one axis of the matrix.
Selon des modes de réalisation : According to embodiments:
- la génération de l’image de basse intensité comprend des étapes consistant à construire une première matrice temporaire égale à l’image originale I à laquelle est soustrait son minimum A, puis à construire une seconde matrice temporaire égale à la première, sauf pour les entrées de valeur supérieure à un seuil prédéfini T , lesdites entrées étant mises à T , puis à construire une image couleur de basse intensité à partir de la seconde matrice temporaire, par application d’une première palette de couleurs. the generation of the low intensity image comprises steps consisting in constructing a first temporary matrix equal to the original image I from which its minimum A is subtracted, then in constructing a second temporary matrix equal to the first, except for the inputs with a value greater than a predefined threshold T, said inputs being set to T, then constructing a low intensity color image from the second temporary matrix, by applying a first palette of colors.
- la génération de l’image de haute intensité comprend des étapes consistant à : - the generation of the high intensity image includes steps consisting in:
- calculer une troisième matrice temporaire, égale partout à la première matrice temporaire, sauf pour les entrées de valeur inférieure au seuil prédéfini Tl t lesdites entrées étant mises à zéro, et sauf pour les entrées de valeur supérieure à un seuil T2, lesdites entrées étant mises à T2 - calculating a third temporary matrix, equal everywhere to the first temporary matrix, except for the inputs of value less than the predefined threshold T lt said inputs being set to zero, and except for the inputs of value greater than a threshold T 2 , said inputs being set to T 2
- calculer le maximum de cette troisième matrice temporaire; - calculate the maximum of this third temporary matrix;
- appliquer à la troisième matrice temporaire un filtrage passe-bas non linéaire de réponse impulsionnelle monomodale, symétrique centralement par rapport au point de coordonnées (0,0);
- diviser point à point le résultat du filtrage passe-bas non linéaire, par le maximum global de ce résultat, et multiplier par le maximum de la troisième matrice temporaire ; et - apply to the third temporary matrix a non-linear low-pass filtering of single-mode impulse response, symmetrical centrally with respect to the point of coordinates (0,0); - divide point to point the result of the non-linear low-pass filtering, by the global maximum of this result, and multiply by the maximum of the third temporary matrix; and
- construire une image couleur de haute intensité par application d’une seconde palette de couleurs au résultat de cette division. - build a high intensity color image by applying a second color palette to the result of this division.
De manière plus précise, la réponse impulsionnelle locale du filtre passe-bas non linéaire a les propriétés suivantes : elle est séparable, elle est maximale en l’origine, elle décroît symétriquement autour de l’origine, et ses « largeurs typiques », correspondant aux dimensions selon les deux axes de la matrice de l’image de la zone où ladite réponse est sensiblement non nulle, sont croissantes avec l’intensité du signal en entrée de l’étage. More precisely, the local impulse response of the non-linear low-pass filter has the following properties: it is separable, it is maximum at the origin, it decreases symmetrically around the origin, and its "typical widths", corresponding the dimensions along the two axes of the image matrix of the area where said response is substantially non-zero, are increasing with the intensity of the signal at the input of the stage.
Dans des variantes de réalisation : In alternative embodiments:
- le redimensionnement de l’image résultante consiste en un sur échantillonnage ou un sous-échantillonnage sur au moins l’un des deux axes, par des facteurs qui sont soit prédéfinis, soit laissés à la commande de l’opérateur ; - the resizing of the resulting image consists of oversampling or undersampling on at least one of the two axes, by factors which are either predefined or left to the operator's control;
- les largeurs typiques de la réponse impulsionnelle du filtre non linéaire sur les deux axes horizontaux et verticaux de la matrice de l'image, dépendent de la résolution spatiale des données en entrée le long de ces deux axes ; - the typical widths of the impulse response of the non-linear filter on the two horizontal and vertical axes of the image matrix, depend on the spatial resolution of the input data along these two axes;
- les largeurs typiques de la réponse impulsionnelle du filtre non linéaire sur les deux axes horizontaux et verticaux de la matrice de l’image, dépendent du taux de sur-échantillonnage ou sous-échantillonnage de l’image sur les deux axes ; - the typical widths of the impulse response of the non-linear filter on the two horizontal and vertical axes of the image matrix, depend on the rate of oversampling or undersampling of the image on the two axes;
- la palette des couleurs utilisée pour générer l’image de basse intensité est de nuance et de saturation essentiellement constantes et le codage
des données est réalisé par une variation de luminance, laquelle croît avec l’intensité du signal ; - the color palette used to generate the low intensity image is of essentially constant shade and saturation and the coding data is achieved by a variation in luminance, which increases with the intensity of the signal;
- le signal d’entrée est pré-conditionné pour que sa moyenne sur un horizon local soit contraint à une valeur cible m, et où la luminance de la palette des couleurs utilisée pour l’image de basse intensité suit une loi log-sigmoïdale. De manière plus précise, si l’intensité du signal est notée x, alors la luminance obéit à la loi (x/ )y/((x/ )y + 1) avec y un paramètre constant soit codé en dur, soit fourni par l’opérateur comme un paramètre de réglage ; - la palette des couleurs utilisée pour générer l’image de haute intensité est d’une part essentiellement de luminance nulle pour I{x, y) £ A + T et croissante avec /(x, ), et d’autre part de nuance et saturation variables, la variation de nuance et de saturation codant une information d’intensité du signal ; - la réponse impulsionnelle du filtre non linéaire est une fonction gaussienne 2D dont l’écart-type est le paramètre de « largeur typique ». - the input signal is preconditioned so that its average over a local horizon is constrained to a target value m, and where the luminance of the color palette used for the low intensity image follows a log-sigmoidal law. More precisely, if the signal intensity is denoted x, then the luminance obeys the law (x /) y / ((x /) y + 1) with y a constant parameter either hard coded or provided by the operator as an adjustment parameter; - the color palette used to generate the high intensity image is on the one hand essentially of zero luminance for I (x, y) £ A + T and increasing with / (x,), and on the other hand of nuance and variable saturation, the variation in hue and saturation encoding signal intensity information; - the impulse response of the non-linear filter is a 2D Gaussian function whose standard deviation is the "typical width" parameter.
L’invention couvre aussi un dispositif de rendu d’image pour des données matricielles issues d’un signal d’entrée ayant une forte dynamique, qui comprend des moyens pour mettre en oeuvre les étapes du procédé revendiqué dans ses différentes variantes. The invention also covers an image rendering device for matrix data originating from an input signal having a high dynamic range, which comprises means for implementing the steps of the process claimed in its different variants.
L’invention peut opérer sous la forme d’un produit programme d’ordinateur qui comprend des instructions de code permettant d’effectuer les étapes du procédé revendiqué lorsque le programme est exécuté sur un ordinateur. The invention can operate in the form of a computer program product which includes code instructions for performing the steps of the claimed process when the program is run on a computer.
Description des figures
Différents aspects et avantages de l’invention vont apparaître en appui de la description d’un mode préféré d’implémentation de l’invention mais non limitatif, avec référence aux figures ci-dessous : Description of the figures Various aspects and advantages of the invention will appear in support of the description of a preferred mode of implementation of the invention but not limiting, with reference to the figures below:
La figure 1 illustre les fonctions de normalisation et d’écrêtage sur un exemple simplifié de signal 1 D; Figure 1 illustrates the normalization and clipping functions on a simplified example of a 1 D signal;
La figure 2 illustre des étapes générales du procédé d’affichage de données sonar ou radar à haute dynamique selon un mode de réalisation de l’invention; FIG. 2 illustrates general steps of the method for displaying high dynamic range sonar or radar data according to an embodiment of the invention;
Les figures 3a et 3b détaillent les étapes du procédé de la figure 2; Les figures 4a, 4b et 4c illustrent sur un histogramme de valeurs, le principe de création des images écrêtées de basse intensité El0 et de haute intensité Ehi à partir d’une donnée initiale /; Figures 3a and 3b detail the steps of the process of Figure 2; Figures 4a, 4b and 4c illustrate on a histogram of values, the principle of creation of clipped images of low intensity E l0 and high intensity E hi from an initial data /;
La figure 5 illustre le principe du filtrage non linéaire; Figure 5 illustrates the principle of non-linear filtering;
Les figures 6a et 6b illustrent l’évolution de la valeur de chaque composante de couleur pour respectivement l’image de basse intensité El0 et l’image de haute intensité Ehi ; et FIGS. 6a and 6b illustrate the evolution of the value of each color component for the low intensity image E l0 and the high intensity image E hi respectively ; and
La figure 7 illustre le rendu brut d’une pseudo-image sonar ou radar par les techniques usuelles de rendu LDR et HDR en comparaison avec le rendu obtenu par le procédé de l'invention. Description détaillée de l’invention FIG. 7 illustrates the raw rendering of a sonar or radar pseudo-image by the usual LDR and HDR rendering techniques in comparison with the rendering obtained by the method of the invention. Detailed description of the invention
La description qui suit s’appuie sur des exemples dans le domaine des données sonar pour permettre une bonne compréhension des principes de l’invention, et une application concrète, mais n’est en rien limitative et doit permettre à l’homme du métier d’appliquer des modifications et des variantes d’implémentation en gardant les mêmes principes.
Passant à la figure 2, des étapes générales du procédé permettant l’affichage de données sonar ou radar à haute dynamique selon un mode de réalisation de l’invention sont décrites. The following description is based on examples in the field of sonar data to allow a good understanding of the principles of the invention, and a concrete application, but is in no way limiting and must allow the skilled person to '' apply modifications and implementation variants keeping the same principles. Turning to FIG. 2, general steps of the method allowing the display of high dynamic range sonar or radar data according to an embodiment of the invention are described.
Le procédé débute par une étape (200) d’acquisition de données d’entrée. Dans un mode de réalisation, l’entrée est une fonction The method begins with a step (200) of acquiring input data. In one embodiment, entry is a function
/ : R2 ® [A, B] (x, y) ® /(x,y). Cette fonction est une image 2D. La valeur /(x,y) est une valeur scalaire enregistrée par un senseur (par exemple, proportionnelle à une tension en Volts), correspondant par exemple à une amplitude d’une onde acoustique ou radioélectrique. On note [U], l’unité des valeurs utilisées dans /. Dans une implémentation particulière l’image 2D est une matrice 2D où chaque entrée de la matrice contient un scalaire. /: R 2 ® [A, B] (x, y) ® / (x, y). This function is a 2D image. The value / (x, y) is a scalar value recorded by a sensor (for example, proportional to a voltage in Volts), corresponding for example to an amplitude of an acoustic or radioelectric wave. We denote by [U], the unit of values used in /. In a particular implementation, the 2D image is a 2D matrix where each entry in the matrix contains a scalar.
L’image a pour résolutions px (resp. py) sur l’axe x (resp.y), ces résolutions étant en unités physiques, comme des unités de distance ou des unités angulaires. Les axes principaux de l’image ne correspondent pas forcément physiquement à des axes orthogonaux. The image has the resolutions p x (resp. P y ) on the x axis (resp.y), these resolutions being in physical units, such as distance units or angular units. The main axes of the image do not necessarily correspond physically to orthogonal axes.
Dans une étape suivante (202), le procédé permet de générer une première image couleur dite « image de basse intensité » dont les couleurs correspondent à des intensités faibles du signal d’entrée, et notée k0 (x, y) . In a following step (202), the method makes it possible to generate a first color image called “low intensity image” whose colors correspond to low intensities of the input signal, and denoted k 0 (x, y).
Dans une étape suivante (204), le procédé permet de générer une seconde image couleur dite « image de haute intensité » dont les couleurs représentent des intensités fortes du signal d’entrée. Avantageusement, la génération de la seconde image couleur comprend au moins une étape de filtrage qui consiste à appliquer en chaque point (x,y) de l’image, un filtre passe-bas non linéaire de réponse impulsionnelle monomodale, symétrique centralement par rapport au point de coordonnées (0,0).
Puis dans une étape suivante (206), le procédé permet de calculer une image couleur fusionnée des premières et deuxièmes images couleur. L’image couleur fusionnée est obtenue en combinant point à point l’image de basse intensité et l’image de haute intensité en une moyenne, pondérée par un facteur constant, de chacune des composantes de couleurs. In a following step (204), the method makes it possible to generate a second color image called “high intensity image” whose colors represent strong intensities of the input signal. Advantageously, the generation of the second color image comprises at least one filtering step which consists in applying, at each point (x, y) of the image, a non-linear low-pass filter of single-mode impulse response, symmetrically central to the coordinate point (0,0). Then in a following step (206), the method makes it possible to calculate a merged color image of the first and second color images. The merged color image is obtained by combining point to point the low intensity image and the high intensity image as an average, weighted by a constant factor, of each of the color components.
Dans une étape suivante (208), le procédé permet de normaliser l’image combinée de manière à ce qu'en chaque point, la luminance de l'image résultante soit égale à la luminance de l'image de basse intensité. In a following step (208), the method makes it possible to normalize the combined image so that at each point, the luminance of the resulting image is equal to the luminance of the low intensity image.
Puis le procédé permet (210) de redimensionner l'image résultante sur au moins un axe de la matrice. La sortie est une fonction Then the method allows (210) to resize the resulting image on at least one axis of the matrix. The output is a function
R2 ® [0,1]3; (x, ) ® 0(x,y). Cette fonction est une image 2D couleurs correspondant à l’image à afficher. Dans une implémentation particulière, l’image 2D est un tableau 2D contenant, à chaque entrée, un vecteur à trois dimensions contenant les composantes de couleur à afficher. R 2 ® [0.1] 3 ; (x,) ® 0 (x, y). This function is a 2D color image corresponding to the image to be displayed. In a particular implementation, the 2D image is a 2D array containing, at each entry, a three-dimensional vector containing the color components to be displayed.
On peut considérer que les composantes de couleurs sont codées entre 0 et 1 mais un intervalle exact utilisé en pratique peut être différent, par exemple de 0 à 255, sans changer le principe de l’invention. We can consider that the color components are coded between 0 and 1 but an exact interval used in practice can be different, for example from 0 to 255, without changing the principle of the invention.
Les figures 3a et 3b illustrent plus en détail les différentes étapes du procédé de la figure 2. Afin de permettre une bonne compréhension de la description, les paramètres suivants sont définis : FIGS. 3a and 3b illustrate in more detail the different stages of the method of FIG. 2. In order to allow a good understanding of the description, the following parameters are defined:
- Deux seuils T > 0 et T2
pris dans M et exprimés en unités [U] ; - Two thresholds T> 0 and T 2 taken in M and expressed in units [U];
- Deux rayons r et r2 exprimés en pixels, variables en fonction de la résolution de l’image / et de la résolution d’affichage de ladite image ; - Two rays r and r 2 expressed in pixels, variable as a function of the resolution of the image / and of the display resolution of said image;
- Un facteur de pondération a e [0,1] constant, soit prédéfini, soit paramétrable ;
- Une première carte de couleurs
® [0,1]3 telle que C10 (0) =- A constant weighting factor ae [0,1], either predefined or configurable; - A first color card ® [0,1] 3 such that C 10 (0) =
[0; 0; 0]r (noir) et Ct0 (v) = [1; 1; 1]T pour v =
Pour des données sonar ou radar ayant été pré-conditionnées pour que la moyenne de l’image soit sensiblement constante sur un horizon local suffisamment grand, la couleur Cl0 (v) présente de manière non essentielle mais préférentielle, les trois caractéristiques suivantes illustrées à la figure 6a: [0; 0; 0] r (black) and C t0 (v) = [1; 1; 1] T for v = For sonar or radar data having been preconditioned so that the average of the image is substantially constant over a sufficiently large local horizon, the color C l0 (v) presents in a non-essential but preferential manner, the following three characteristics illustrated in Figure 6a:
- La luminance L(Cl0 (v)) est croissante avec v (mais pas forcément de manière linéaire) ; - The luminance L (C l0 (v)) is increasing with v (but not necessarily linearly);
- La luminance L(Cl0 (v)) croît encore plus préférentiellement selon une allure log-sigmoïdale, c’est-à-dire selon une sigmoïde avec- The luminance L (C l0 (v)) increases even more preferentially according to a log-sigmoidal shape, that is to say according to a sigmoid with
\og v . \ og v.
- La nuance (en anglais « hue ») et la saturation (en anglais « saturation ») de la couleur varient peu et sont idéalement constantes. - Une deuxième carte de couleurs C/li: [r1, r2] ® [0,1] 3 telle que, étant données n valeurs ^, ί e q . h telles que v0 = T , vi < vi+1 et vn = T2 , ainsi que n couleurs associées aux valeurs vt alors : si vi £ v < vi+1 on a : - The shade (in English "hue") and the saturation (in English "saturation") of the color vary little and are ideally constant. - A second color map C / li : [r 1 , r 2 ] ® [0,1] 3 such that, given n values ^, ί eq. h such that v 0 = T, vi <v i + 1 and v n = T 2 , as well as n colors associated with the values v t then: if vi £ v <v i + 1 we have:
(moyenne pondérée
(weighted average
vectorielle des composantes de couleur) ; c = [0; 0; 0f (noir). color components); c = [0; 0; 0f (black).
Cette seconde carte de couleur code une information d’intensité par une nuance et une saturation variable, et une luminance croissante (nulle pour toute valeur v < T^. La figure 6b illustre l’évolution de la valeur de chaque composante de couleur (Luminance, Saturation, Nuance) pour la valeur à coder pour la carte de couleurs de l’image de haute intensité.
- Deux facteurs d’échelle fx e R+ et fy e R+à appliquer sur les axes x et y respectivement, pour redimensionner l’image à l’affichage. Si fx (resp. fy) est plus grand que 1 , alors l’image est agrandie (effet de « zoom avant »), sinon elle est rétrécie (« zoom arrière »). Ces facteurs d’échelle sont soit prédéfinis, soit commandés par l’opérateur/utilisateur par le biais d’une interface graphique ou physique telle qu’une touche clavier, un bouton, une molette ou un potentiomètre par exemple. This second color map codes intensity information by a variable shade and saturation, and an increasing luminance (zero for any value v <T ^. Figure 6b illustrates the evolution of the value of each color component (Luminance , Saturation, Hue) for the value to be coded for the color map of the high intensity image. - Two scale factors f x e R + and f y e R + to be applied on the x and y axes respectively, to resize the image on display. If f x (resp. F y ) is greater than 1, then the image is enlarged ("zoom in" effect), otherwise it is shrunk ("zoom out"). These scale factors are either predefined or controlled by the operator / user via a graphical or physical interface such as a keyboard key, a button, a wheel or a potentiometer for example.
Après une première étape (300) d’acquisition et mise en forme des données image selon la fonction /: E2 ® [A, B] (x,y) ® /(x,y) , le procédé permet (302) de faire un décalage (en anglais « offset ») et un écrêtage des données de / pour les forcer à résider dans [0, r : After a first step (300) of acquisition and shaping of the image data according to the function /: E 2 ® [A, B] (x, y) ® / (x, y), the method allows (302) to make an offset (in English "offset") and clipping the data from / to force them to reside in [0, r:
Ei0 (x, y) = min(/ (x, y) - A. TJ E i0 (x, y) = min (/ (x, y) - A. TJ
Les figures 4a et 4b illustrent sur un histogramme de valeurs, le principe de constitution de / et de Ei0 pour la création des images écrêtées de basse intensité El0 à partir d’une donnée initiale /. Ainsi sur la figure 4a, h(I) est le nombre h de pixels ayant pour valeur / . On constate que la valeur de h I) est non nulle entre [A, B] pour /. Dans la figure 4b, on montre que les valeurs h(El0 ) sont ramenées entre 0 et T par translation de l’histogramme. Un pic est présent en Tx égal au nombre de pixels supérieurs ou égaux à A + T dans /. Une fois Ei0 construite, les données sont ensuite (304) transcodées vers une première carte de couleurs : FIGS. 4a and 4b illustrate on a histogram of values, the principle of constitution of / and of E i0 for the creation of clipped images of low intensity E l0 from an initial datum /. Thus in FIG. 4a, h (I) is the number h of pixels having the value /. We note that the value of h I) is not zero between [A, B] for /. In Figure 4b, we show that the values h (E l0 ) are brought back between 0 and T by translation of the histogram. A peak is present in T x equal to the number of pixels greater than or equal to A + T in /. Once E i0 has been constructed, the data is then (304) transcoded to a first color map:
Cl0 (bΐo (c > )) avec Ci0 :[0 ® [0,1] 3 telle décrite plus haut. C l0 (b ΐo ( c > )) with C i0 : [0 ® [0,1] 3 as described above.
Les étapes de décalage, écrêtage et transcodage (302, 304) permettent de produire une première image couleur ll0 (x, y) correspondant à des intensités faibles dans le signal d’entrée (étape 202
de la figure 2). La valeur /i0 (x,y) est donc une couleur, décrite comme un vecteur de trois composantes (rouge, vert, bleu). The steps of shifting, clipping and transcoding (302, 304) make it possible to produce a first color image l l0 (x, y) corresponding to low intensities in the input signal (step 202 in Figure 2). The value / i0 (x, y) is therefore a color, described as a vector of three components (red, green, blue).
Les étapes suivantes (306) à (314) permettent de produire une deuxième image couleur lhi(x, y ) correspondant à des intensités fortes dans le signal d’entrée (étape 204 de la figure 2). Ainsi, à l’étape 306, le procédé permet d’initialiser Ehi (x,y) à zéro si I(x, y) - A < T^, et à T2 si I(x, y) - A > T2 et I(x, y) - A, sinon. C’est-à-dire que seuls les pixels d’intensité trop forte pour être rendus dans Ei0 sont conservés. The following steps (306) to (314) make it possible to produce a second color image l hi (x, y) corresponding to strong intensities in the input signal (step 204 of FIG. 2). Thus, in step 306, the method makes it possible to initialize E hi (x, y) at zero if I (x, y) - A <T ^, and at T 2 if I (x, y) - A> T 2 and I (x, y) - A, otherwise. That is to say that only the pixels of intensity too strong to be rendered in E i0 are preserved.
Les figures 4a et 4c illustrent sur un histogramme de valeurs, le principe de création des images écrêtées de haute intensité Ehi à partir d’une donnée (ou image) initiale /. La figure 4c illustre l’histogramme de Ehi où l’on voit un premier pic en zéro correspondant à tous les pixels de valeur inférieure à A + T± dans / , et un second pic en T2 correspondant aux pixels de valeur supérieure à A + T2 dans /, le reste de l’histogramme étant le translaté de celui de ¾(/) (figure 4a). Figures 4a and 4c illustrate on a histogram of values, the principle of creation of high intensity clipped images E hi from an initial data (or image) /. FIG. 4c illustrates the histogram of E hi where we see a first peak at zero corresponding to all the pixels of value less than A + T ± in /, and a second peak at T 2 corresponding to the pixels of value greater than A + T 2 in /, the rest of the histogram being the translate of that of ¾ (/) (Figure 4a).
Puis l’étape (308) permet de calculer le maximum :
Then step (308) allows the maximum to be calculated:
L’étape suivante (310) permet d’appliquer à Ehi une fonction B(Ehi) qui consiste à réaliser, en chaque point (x,y), un filtrage passe-bas non linéaire de l’image Ehi de réponse impulsionnelle monomodale symétrique centralement par rapport au point (0,0). The next step (310) makes it possible to apply to E hi a function B (E hi ) which consists in carrying out, at each point (x, y), a non-linear low-pass filtering of the response image E hi single-mode pulse symmetrical centrally with respect to the point (0,0).
Avantageusement, plus la valeur de Ehi est importante, plus le flou ou halo produit par la fonction B est important, le rayon du halo produit par ledit filtre variant localement en (x,y) et croissant avec Ehi(x, y). On note Ëhi la version filtrée de Ehi - Advantageously, the greater the value of E hi , the greater the blurring or halo produced by the function B, the radius of the halo produced by said filter varying locally in (x, y) and increasing with E hi (x, y) . We note Ë hi the filtered version of E hi -
Ehi B^E^I, r r2)
Optionnellement, le flou peut être asservi à la résolution de l’image px, py et des facteurs d’échelle fx, fy \ E hi B ^ E ^ I, rr 2 ) Optionally, the blur can be controlled by the resolution of the image p x , p y and the scale factors f x , f y \
Ehi E{Efli, T- , T2, fx, fy, px, Py, b†, bp) E hi E {Ef l i, T-, T 2 , fx, fy, p x , Py, b †, bp)
Dans une implémentation, la fonction de filtrage est définie comme étant: In an implementation, the filtering function is defined as:
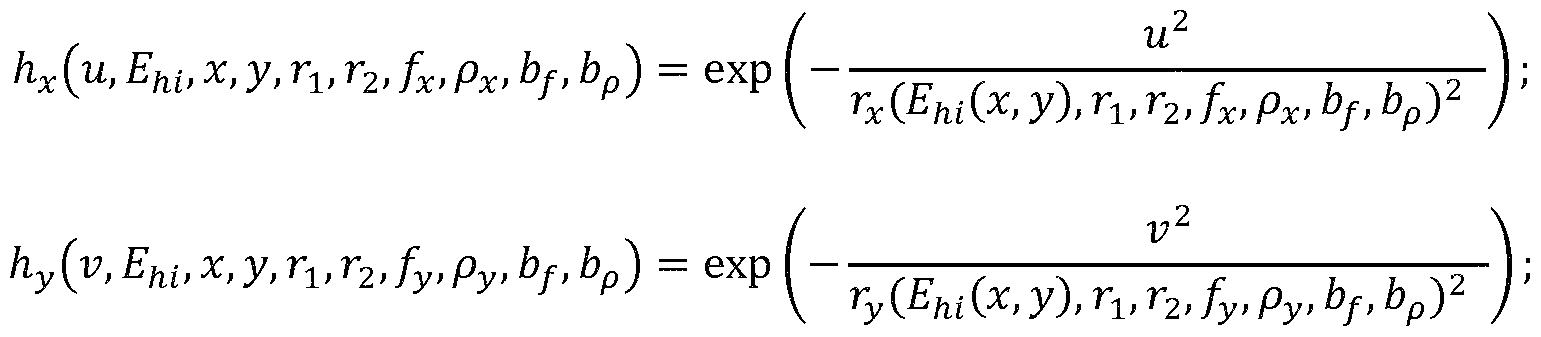
où la réponse impulsionnelle 2D locale h du filtre, finie ou infinie, a les caractéristiques suivantes : where the local 2D impulse response h of the filter, finite or infinite, has the following characteristics:
- La réponse impulsionnelle est séparable i.e. le filtrage 2D peut être réalisé comme un filtrage 1 D avec un filtre non linéaire hx sur l’axe x suivi d’un autre filtrage hy sur l’autre axe ; - The impulse response is separable ie the 2D filtering can be carried out as a 1D filtering with a non-linear filter h x on the x axis followed by another filtering h y on the other axis;
- La réponse impulsionnelle hx (resp. hy) vaut 1 quand u (resp. v) vaut 0 et est décroissante symétriquement autour de 0 en fonction de u (resp. v) : elle est monomodale symétrique centralement. - Le support spatial typique de chacun de ces filtres, c’est-à-dire la largeur de la région où la réponse impulsionnelle des filtres est significativement plus grande que zéro, est proportionnel à un rayon rx (sur l’axe x) et ry (sur l’axe y).
- Ces rayons rx (sur l’axe x) et ry (sur l’axe y) sont variables en fonction de la coordonnée (x,y) ce qui rend le filtre non linéaire et ils suivent les relations suivantes : rx (Ehi (x, y), r1 r2, fx, px, bf, bp ) kx ( px , fx, fy, bf, bp)r(Ehi (x, y), r , r2) - The impulse response h x (resp. H y ) is worth 1 when u (resp. V) is worth 0 and is decreasing symmetrically around 0 as a function of u (resp. V): it is centrally symmetric monomodal. - The typical spatial support of each of these filters, i.e. the width of the region where the impulse response of the filters is significantly greater than zero, is proportional to a radius r x (on the x axis) and r y (on the y axis). - These radii r x (on the x axis) and r y (on the y axis) are variable depending on the coordinate (x, y) which makes the filter non-linear and they follow the following relationships: r x (E hi (x, y), r 1 r 2 , f x , p x , b f , b p ) k x (p x , f x , f y , bf, b p ) r (E hi (x, y), r, r 2 )
ry Ehi{x,y), r1, r2,fy, py, bf, bp) = kyipy. fy. bf. b^riE^x. y , ^, ^
r y E hi {x, y), r 1 , r 2 , f y , p y , b f , b p ) = k y ip y . f y . bf. b ^ x ^ RIE. y, ^, ^
fonction r étant croissante (éventuellement par paliers) avec les valeurs de Efo (x, y) . function r being increasing (possibly in stages) with the values of E f o (x, y).
La figure 5 illustre le principe du filtrage non linéaire mis en oeuvre dans le procédé de l’invention. Tel que cela est visible, la largeur r des réponses impulsionnelles est dépendante de la valeur de Ehi(x, y) et varie entre r et r2. FIG. 5 illustrates the principle of non-linear filtering implemented in the method of the invention. As can be seen, the width r of the impulse responses is dependent on the value of E hi (x, y) and varies between r and r 2 .
Les termes kx et ky sont des facteurs de proportionnalité fonctions de la résolution sur les deux axes px, py et des facteurs d’échelle fx et fy. Ces facteurs de proportionnalité peuvent être choisis selon plusieurs stratégies : The terms k x and k y are proportionality factors which are functions of the resolution on the two axes p x , p y and scale factors f x and f y . These proportionality factors can be chosen according to several strategies:
- Soit kx = ky = k, la constante k exprimée en pixels étant soit prédéfinie dans un fichier de paramétrage par exemple, soit laissée à l’opérateur comme un paramétrage ; dans ce cas le filtre est indépendant de la résolution de l’image d’entrée et la réponse impulsionnelle de B est de taille identique sur les deux axes. Cette option est utilisée lorsque l’opérateur réalise une action de basculement d’un booléen à « faux » par le biais d’une interface graphique ou physique telle qu’un bouton. - Let k x = k y = k, the constant k expressed in pixels being either predefined in a configuration file for example, or left to the operator as a configuration; in this case the filter is independent of the resolution of the input image and the impulse response of B is of identical size on the two axes. This option is used when the operator performs an action of switching from a boolean to "false" through a graphic or physical interface such as a button.
- Soit kx = px x k et ky = py x k, la constante k exprimée en mètres étant soit prédéfinie dans un fichier de paramétrage par exemple, soit laissée à l’opérateur comme un paramétrage. Dans ce cas le filtre est
dépendant de la résolution de l’image d’entrée et la réponse impulsionnelle de B n’est plus de taille identique sur les deux axes. Cette option est utilisée lorsque l’opérateur réalise une action de basculement d’un booléen à « vrai » par le biais d’une interface graphique ou physique telle qu’un bouton. - Let k x = p x xk and k y = p y xk, the constant k expressed in meters being either predefined in a configuration file for example, or left to the operator as a configuration. In this case the filter is depending on the resolution of the input image and the impulse response of B is no longer of identical size on the two axes. This option is used when the operator performs an action of switching from a Boolean to "true" through a graphical or physical interface such as a button.
- On peut également avoir une dépendance de kx et ky aux facteurs d’échelle fx et fy. Par exemple si les facteurs d’échelle augmentent (« zoom avant ») il est intéressant de réduire kx et ky afin de réduire le rayon du halo induit par B ; et inversement en cas de « zoom arrière » ou l’on souhaite au contraire augmenter le rayon du halo. - We can also have a dependence of k x and k y on the scale factors f x and f y . For example if the scale factors increase (“zoom in”) it is interesting to reduce k x and k y in order to reduce the radius of the halo induced by B; and vice versa in the event of a “zoom out” or on the contrary one wishes to increase the radius of the halo.
Par ailleurs, la forme et l’implémentation exacte du filtre n’a aucune importance du moment que les caractéristiques sont vérifiées. Deux exemples de filtres sont donnés : Furthermore, the exact shape and implementation of the filter does not matter as long as the characteristics are checked. Two examples of filters are given:
Le filtre gaussien avec: The Gaussian filter with:
- Le filtre exponentiel avec: - The exponential filter with:
L’homme du métier comprend que l’implémentation de ces filtres peut subir diverses optimisations connues notamment pour accélérer la vitesse du calcul, mais qui ne changent en rien l’essence de l’invention.
Revenant à la figure 3, après l’étape de filtrage, le maximum de Ëhi est différent de celui de Ehi. Le procédé permet (312) de renormaliser l’image (linéairement) pour que son maximum redevienne mhi : Those skilled in the art understand that the implementation of these filters can undergo various known optimizations in particular to accelerate the speed of the calculation, but which in no way change the essence of the invention. Returning to FIG. 3, after the filtering step, the maximum of Ë hi is different from that of E hi . The method allows (312) to normalize the image (linearly) so that its maximum becomes m hi again:
Ëfii (x, y) = Ehi( c,y} mhi , puis de transcoder (314) les données vers ma xx,y Ehi Ë fii (x, y) = Ehi (c, y } m hi , then transcode (314) the data to ma x x , y E hi
une deuxième carte de couleurs:
avec Chi :[0 , T2— r ® [0,1] 3 telle décrite plus haut. La valeur Ihi (x, y) est donc une couleur, décrite comme un vecteur de trois composantes (rouge, vert, bleu). a second color card: with C hi : [0, T 2 - r ® [0,1] 3 as described above. The value I hi (x, y) is therefore a color, described as a vector of three components (red, green, blue).
Dans une étape suivante (31 6), le procédé permet de calculer une image couleur fusionnée 0(x, y), définie comme la moyenne pondérée par a, pour chacune des trois composantes (rouge, vert, bleu) : In a following step (31 6), the method makes it possible to calculate a merged color image 0 (x, y), defined as the average weighted by a, for each of the three components (red, green, blue):
Ô(x, y) = (1 - a)Il0 (x, y) + alhi {x, y) Ô (x, y) = (1 - a) I l0 (x, y) + al hi {x, y)
Cette image couleur contient des données de basse intensité combinées avec des données de haute intensité entourées d’un halo, le halo ayant été obtenu précédemment à l’étape 310. This color image contains low intensity data combined with high intensity data surrounded by a halo, the halo having been obtained previously in step 310.
Le procédé permet ensuite (318) de renormaliser l’image fusionnée afin de retrouver la luminance de l’image de basse intensité :
The method then makes it possible (318) to renormalize the merged image in order to find the luminance of the low intensity image:
Dans une étape suivante (320), le procédé permet de redimensionner l’image normalisée selon des facteurs d’échelle, un facteur fx sur l’axe des x et un facteur fy sur l’axe des y, par application d’un algorithme de redimensionnement R
fy)
Cette étape utilise classiquement, mais de manière non exclusive un filtre passe-bas anti-repliement de spectre (en anglais « anti-aliasing ») suivi d’un ré-échantillonnage. In a following step (320), the method makes it possible to resize the normalized image according to scale factors, a factor f x on the x axis and a factor f y on the y axis, by applying an R resizing algorithm f y ) This step conventionally, but not exclusively, uses a low-pass anti-aliasing filter (in English "anti-aliasing") followed by a resampling.
Le procédé permet ensuite de visualiser (322) l’image redimensionnée obtenue O ·. E2 ® [0,1]3; (x, ) ® 0 x,y ) , par affichage ou impression par exemple. The method then makes it possible to view (322) the resized image obtained O ·. E 2 ® [0.1] 3 ; (x,) ® 0 x, y), by display or printing for example.
Dans des variantes de réalisation, différents traitements algorithmiques peuvent être insérés entre les étapes de redimensionnement (320) et de visualisation (322), entre les étapes d’écrêtage (302) et de transcodage (304), ou même avant l’étape d’écrêtage, sans influence sur les principes du procédé de rendu d’image de l’invention. In alternative embodiments, different algorithmic processing can be inserted between the resizing (320) and display (322) steps, between the clipping (302) and transcoding (304) steps, or even before step d clipping, without influence on the principles of the image rendering method of the invention.
Le procédé proposé est une variante de rendu HDR qui est optimisée par l’ajout des étapes de filtrage (204) ou (306 à 314) et par un choix judicieux des cartes de couleurs Cl0 et u. non pas dans des nuances monochromatiques (avec nuances et saturations constantes) mais au contraire, et surtout pour C/u, dans une palette de couleur riche. The proposed method is a variant of HDR rendering which is optimized by adding the filtering steps (204) or (306 to 314) and by a judicious choice of the color maps C l0 and u . not in monochromatic nuances (with constant nuances and saturations) but on the contrary, and especially for C / u , in a rich color palette.
Ainsi, la méthode de l’invention présente les avantages suivants : Thus, the method of the invention has the following advantages:
- Contrairement au rendu HDR classique, le fait d’appliquer un filtrage passe-bas non linéaire à la partie « haute intensité » de l’image (contenue dans la donnée Ehi) permet d’augmenter le support spatial des pixels de forte intensité. Ainsi, par exemple dans le domaine du radar ou du sonar, si un écho fort ponctuel est présent, il sera mis en évidence car son support spatial sera augmenté ; il sera donc mieux perceptible même lorsque l’image est rééchantillonnée (« zoom arrière ») à l’étape (320). - Unlike conventional HDR rendering, the fact of applying a non-linear low-pass filtering to the “high intensity” part of the image (contained in the data item E hi ) makes it possible to increase the spatial support of the pixels of high intensity. . Thus, for example in the field of radar or sonar, if a strong punctual echo is present, it will be highlighted because its spatial support will be increased; it will therefore be better perceptible even when the image is resampled (“zoom out”) in step (320).
- Choisir typiquement la palette de couleurs Cl0 comme un dégradé de couleurs de nuance et saturation constantes afin de se rapprocher du rendu classique pour les échos faibles qui constituent la majeure partie de
la scène. Par contre, pour les quelques échos forts rendus dans les tons de la palette de couleurs
le fait de choisir des nuances riches et variées permet de directement coder l’intensité des échos forts, ce qui permet à l’opérateur de réaliser une action d’appréciation de la force des échos par la relation : intensité-couleur. L’impression de force des échos est également renforcée par le fait du support spatial du halo entourant ces échos. La mise en évidence des échos peut participer à un allègement de la charge cognitive de l’opérateur lors de l’analyse de la scène. - Typically choose the color palette C l0 as a gradient of colors of constant hue and saturation in order to approximate the classic rendering for weak echoes which constitute the major part of the scene. On the other hand, for the few strong echoes rendered in the tones of the color palette the choice of rich and varied nuances makes it possible to directly code the intensity of the strong echoes, which allows the operator to carry out an action of appreciation of the strength of the echoes by the relation: intensity-color. The impression of strength of the echoes is also reinforced by the spatial support of the halo surrounding these echoes. The highlighting of the echoes can contribute to a reduction in the cognitive load of the operator during the analysis of the scene.
- Le fait de pouvoir, par une simple action d’activation d’une option, relier la taille du halo obtenu (constantes kx et ky) aux paramètres d’échelle de visualisation fx, fy, permet avantageusement à l’opérateur de réaliser deux types de tâches avec pour seule commande l’échelle de visualisation fx, fy, typiquement entrée par le biais d’un périphérique (touches clavier, molette d’une souris, etc.) Ces deux tâches sont : - The fact of being able, by a simple action of activating an option, to link the size of the halo obtained (constants k x and k y ) to the display scale parameters f x , f y , advantageously allows the operator to carry out two types of tasks with only the visualization scale f x , f y , typically entered via a peripheral (keyboard keys, mouse wheel, etc.) These two tasks are:
- La détection visuelle des échos forts, qui sont potentiellement des cibles, lorsque le « zoom arrière » est important et que l’opérateur perçoit la scène dans sa globalité, ou au moins sur un horizon large. Cette fonction est possible si l’effet de « halo » est important, ce qui permet de « voir les échos de loin » alors que sans l’étape de filtrage ces échos disparaîtraient par la mise à l’échelle ; - Visual detection of strong echoes, which are potentially targets, when the "zoom out" is important and the operator perceives the scene as a whole, or at least over a wide horizon. This function is possible if the "halo" effect is strong, which makes it possible to "see the echoes from afar" while without the filtering step these echoes would disappear by scaling;
- L’analyse visuelle de la structure des échos, lorsque le niveau de « zoom » codé par les facteurs est important, et où l’opérateur est plus intéressé par la répartition de pixels de signal important (connus par l’homme de l’art sous le nom « points brillants ») le long des cibles, et pour lesquels un fort niveau de précision spatial est important : dans ce cas l’effet de « flou » apporté par l’étape de filtrage passe-bas non linéaire doit être réduit, mais il doit être suffisamment fort pour augmenter la compréhension de la scène par rapport à ce
qu’apporterait l’utilisation d’une méthode HDR classique sans l’étape de filtrage non linéaire, et plus encore qu’avec la méthode LDR (où une cible est typiquement un amas de pixels (« pixel blob » en anglais) de couleur uniforme, du fait de l’étape d’écrêtage ramenant tous les pixels forts à une valeur unique). - Visual analysis of the structure of echoes, when the level of “zoom” coded by the factors is important, and where the operator is more interested in the distribution of pixels of important signal (known by the man of the art under the name "bright points") along the targets, and for which a high level of spatial precision is important: in this case the effect of "blurring" brought by the non-linear low-pass filtering step must be reduced but it should be strong enough to increase understanding of the scene compared to what that would bring the use of a classic HDR method without the non-linear filtering step, and even more than with the LDR method (where a target is typically a cluster of pixels (“pixel blob” in English) of color uniform, due to the clipping step bringing all the strong pixels to a single value).
- Le fait fondamental d’utiliser une palette Cl0 de couleurs dont la nuance et la saturation sont essentiellement constantes, et une palette Chi de couleurs riches avec une luminance croissante, permet en outre un effet intéressant, par le biais de l’étape de la moyenne pondérée (316) suivie de la renormalisation effectuée à l’étape (318). En effet la moyenne pondérée permet d’apprécier la présence d’un écho fort sans pour autant masquer la présence de pixels de signal faible au voisinage, qui sera toujours rendu à la même luminance que dans l’image de « basse intensité » à cause de la renormalisation qui suit. Cet effet est important car en radar et en sonar, un signal faible apporte de l’information sur la scène généralement par une ombre. Sans ce choix judicieux des palettes, l’ombre pourrait disparaître. - The fundamental fact of using a palette C l0 of colors whose shade and saturation are essentially constant, and a palette C hi of rich colors with increasing luminance, also allows an interesting effect, through the step the weighted average (316) followed by the renormalization carried out in step (318). Indeed, the weighted average makes it possible to appreciate the presence of a strong echo without masking the presence of pixels of weak signal in the vicinity, which will always be rendered at the same luminance as in the image of "low intensity" because of the renormalization that follows. This effect is important because in radar and in sonar, a weak signal brings information on the scene generally by a shadow. Without this judicious choice of palettes, the shadow could disappear.
La figure 7 illustre le rendu brut d’une pseudo-image sonar ou radar par les techniques usuelles de rendu LDR (700, 720) et HDR (740) en comparaison avec le rendu (760) obtenu par le procédé de l'invention. Les références représentant les mêmes éléments sont identiques sur les différents résultats de rendu d’image. FIG. 7 illustrates the raw rendering of a sonar or radar pseudo-image by the usual rendering techniques LDR (700, 720) and HDR (740) in comparison with the rendering (760) obtained by the method of the invention. The references representing the same elements are identical on the different image rendering results.
Dans le rendu LDR (700), un intervalle [A, B] est mappé linéairement vers un intervalle de luminance [0,1 ]. Dans ce cas précis, on ne perçoit que quelques rares points brillants (710) et (712). On constate que les points brillants (710) et (712) sont généralement constitués d’un pic central (714), (716) et d’une « base » physiquement créée par les lobes secondaires de l’antenne ou du traitement de compression d’impulsion. Dans l’exemple illustré, les deux points brillants sont
d’intensité différente, le point brillant de droite (712) étant d’une intensité moins importante que le point brillant de gauche (710), il est alors rendu dans l’image avec une luminance moins proche du blanc. Par contre, le reste de l’image (702) où la donnée brute est d’intensité très faible, est rendue par une couleur de luminance proche de zéro (noir). Il est donc impossible dans cette approche de rendu LDR de percevoir d’autres objets dans la scène. C’est la limite du rendu linéaire. In LDR rendering (700), an interval [A, B] is mapped linearly to a luminance interval [0,1]. In this specific case, there are only a few rare bright spots (710) and (712). It can be seen that the bright points (710) and (712) generally consist of a central peak (714), (716) and a "base" physically created by the secondary lobes of the antenna or of the compression treatment. pulse. In the example shown, the two bright dots are of different intensity, the bright point on the right (712) being of lesser intensity than the bright point on the left (710), it is then rendered in the image with a luminance less close to white. On the other hand, the rest of the image (702) where the raw data is of very low intensity, is rendered by a luminance color close to zero (black). It is therefore impossible in this LDR rendering approach to perceive other objects in the scene. This is the limit of linear rendering.
Le rendu LDR (720) illustre le résultat de l'écrêtage d'une pseudo image symbolisant une image sonar ou radar. L'écrêtage révèle une zone d'ombre très sombre (706), une zone de réverbération sombre correspondant au sol (704), un écho intermédiaire isolé (722), une zone d'écho d'intensité médiane (708) supérieure à l’écho isolé (722). Ces éléments n’étaient pas visibles dans le rendu linéaire (700). Les deux points brillants (710) et (712) sont dans cette approche ramenés à la même intensité et apparaissent identiques, ne faisant pas apparaître une différence d'intensité entre leur pic central (714, 716, non visibles) et leur base. Il est donc impossible dans cette approche de comparer l’intensité du signal reçu pour les deux points brillants. The LDR rendering (720) illustrates the result of clipping a pseudo image symbolizing a sonar or radar image. Clipping reveals a very dark shadow zone (706), a dark reverberation zone corresponding to the ground (704), an isolated intermediate echo (722), an echo zone of median intensity (708) greater than l isolated echo (722). These elements were not visible in the linear rendering (700). The two bright points (710) and (712) are in this approach reduced to the same intensity and appear identical, not showing a difference in intensity between their central peak (714, 716, not visible) and their base. It is therefore impossible in this approach to compare the strength of the received signal for the two bright spots.
Le rendu HDR (740) d’une pseudo-image sonar ou radar diffère du rendu LDR précédent (720) par le fait que le « tone mapping » permet de ramener sélectivement les points brillants (710, 712) à des niveaux de luminance plus bas, permettant ainsi d’apprécier leur structure - pics (714, 716) et bases - et de réduire sélectivement la luminance de la zone d’écho d’intensité médiane (708) au même niveau que celle utilisée pour représenter l’écho isolé (722) car elle est proche des points brillants (710, 712). Un inconvénient de ce type de rendu HDR est que la surface spatiale des pics (714, 716) reste très modeste. Un autre inconvénient est que le niveau de luminance utilisé pour rendre les échos (708, 722) est identique alors que l’intensité des données brutes est différente, ce qui ne permet pas de comparer les intensités relatives des objets.
La figure 7 illustre symboliquement en bas à droite (760) le rendu d’une pseudo-image sonar ou radar par application du procédé de l’invention. Ainsi, le rendu des éléments de basse intensité (704), (706), (708) et (722) est réalisé en conservant une relation d’ordre entre les luminances (par rapport à l’intensité de la donnée brute), contrairement au rendu HDR (740). Le rendu des éléments de haute intensité se fait en privilégiant l’utilisation de la nuance et de la saturation des couleurs, au lieu de la luminance, ce qui est symbolisé par des hachures, utilisées pour rendre les pics des points brillants (714) et (716), la différence de ces nuances et saturation codant le niveau de signal. Enfin, l’étendue spatiale des pics (714) et (716) est augmentée par l’effet de halo, symbolisé par des cercles hachurés (718) et (724), dont le rayon augmente avec l’intensité des pics. Cet effet de halo est configuré pour utiliser principalement la couleur et ne pas masquer les ombres (706) lors de l’étape de combinaison des images de haute et de basse intensité. The HDR rendering (740) of a sonar or radar pseudo-image differs from the previous LDR rendering (720) in that the "tone mapping" allows the bright points (710, 712) to be brought selectively to higher luminance levels. low, thus making it possible to appreciate their structure - peaks (714, 716) and bases - and to selectively reduce the luminance of the mid-intensity echo zone (708) to the same level as that used to represent the isolated echo (722) because it is close to the bright spots (710, 712). A drawback of this type of HDR rendering is that the spatial surface of the peaks (714, 716) remains very modest. Another disadvantage is that the level of luminance used to render the echoes (708, 722) is identical while the intensity of the raw data is different, which does not allow the relative intensities of the objects to be compared. FIG. 7 symbolically illustrates at the bottom right (760) the rendering of a sonar or radar pseudo-image by application of the method of the invention. Thus, the rendering of the low intensity elements (704), (706), (708) and (722) is carried out while preserving an order relationship between the luminances (relative to the intensity of the raw data), unlike HDR rendering (740). The rendering of high intensity elements is done by favoring the use of hue and color saturation, instead of luminance, which is symbolized by hatching, used to make the peaks of the bright points (714) and (716), the difference of these nuances and saturation coding the signal level. Finally, the spatial extent of the peaks (714) and (716) is increased by the halo effect, symbolized by hatched circles (718) and (724), whose radius increases with the intensity of the peaks. This halo effect is configured to mainly use color and not hide shadows (706) when combining high and low intensity images.
L’homme de l’art peut penser que la méthode est inspirée de l’effet de halo produit en imagerie optique par l’effet de « blooming ». Those skilled in the art may think that the method is inspired by the halo effect produced in optical imaging by the "blooming" effect.
Pour rappel, le blooming ou « glare » (éblouissement) est un effet qui résulte de causes physiques et physiologiques dans l’œil humain résultat de la diffusion de la lumière dans la cornée, la rétine ou bien la lentille de l’appareil de mesure ainsi que la diffraction dans ces mêmes milieux. Ces effets provoquent un halo lumineux autour d’objets très lumineux dans une scène, qui viennent masquer les objets peu lumineux situés à proximité. Cet effet peut être modélisé par la convolution d’une image radiométrique avec une fonction de réponse impulsionnelle P(0) dépendant de l’angle Q formé par la droite (S/s) et la droite (S, /) où S est la position de la source lumineuse dans la scène, ls est l’image de la source sur le plan du senseur (CCD, rétine), et / un autre point quelconque du plan du senseur. La réponse impulsionnelle est :
avec d la distribution de Dirac, a la fraction de lumière non diffusée, et F une fonction de l’angle Q qui détermine la diffusion (avec / k/F{9) valant typiquement 10% pour un observateur humain). Plusieurs modèles existent pour F dont notamment le modèle de Vos décrit dans Greg Spencer; Peter Shirley; Kurt Zimmerman; Donald P. Greenberg (1995), " Physically-based glare effects for digital images". Siggraph: 325. doi.10.1145/218380.218466. ISBN 0897917014. Il convient de bien souligner que le rayon perçu du halo dépend de l’angle Q sous-tendu par l’objet à la position de l’observateur ou de manière équivalente, de la distance de l’observateur (du senseur) à la source lumineuse. En sonar et en radar ce phénomène ne se manifeste pas. Aussi, le blooming tel qu’actuellement connu dans la littérature n’est pas un effet qui est ajouté dans la représentation des images sonar ou radar. As a reminder, blooming or "glare" (glare) is an effect which results from physical and physiological causes in the human eye result of the diffusion of light in the cornea, the retina or the lens of the measuring device as well as diffraction in these same media. These effects cause a luminous halo around very bright objects in a scene, which come to mask the little luminous objects located nearby. This effect can be modeled by the convolution of a radiometric image with an impulse response function P (0) depending on the angle Q formed by the line (S / s ) and the line (S, /) where S is the position of the light source in the scene, l s is the image of the source on the plane of the sensor (CCD, retina), and / any other point on the plane of the sensor. The impulse response is: with d the Dirac distribution, at the fraction of non-scattered light, and F a function of the angle Q which determines the scattering (with / k / F (9) typically equal to 10% for a human observer). Several models exist for F, including the Vos model described in Greg Spencer; Peter Shirley; Kurt Zimmerman; Donald P. Greenberg (1995), "Physically-based glare effects for digital images". Siggraph: 325. doi.10.1145 / 218380.218466. ISBN 0897917014. It should be emphasized that the perceived radius of the halo depends on the angle Q subtended by the object at the position of the observer or, in an equivalent manner, on the distance of the observer (from the sensor) at the light source. In sonar and radar this phenomenon does not appear. Also, blooming as currently known in the literature is not an effect which is added in the representation of sonar or radar images.
La simulation du blooming est communément réalisée dans le domaine du jeu vidéo aujourd’hui afin d’augmenter la sensation de réalisme et la perception de l’intensité d’une source lumineuse. Ce rendu est généralement effectué en temps réel par le biais d’un programme nommé « shader » sur une carte graphique. Cette simulation de blooming est couramment ajoutée comme un étage suivant celui d’un rendu HDR, mais uniquement pour la simulation d’images optiques. Blooming simulation is commonly performed in the video game industry today to increase the feeling of realism and the perception of the intensity of a light source. This rendering is usually done in real time through a program called "shader" on a graphics card. This blooming simulation is commonly added as a stage following that of an HDR rendering, but only for the simulation of optical images.
La méthode proposée diffère sensiblement de ce procédé par le fait que la loi utilisée pour calculer le rayon du halo ne dépend pas de la distance de l’observateur à la cible ni de l’angle sous-tendu par celle-ci, mais dépend d’autres paramètres avec une formulation judicieusement choisie pour réaliser des effets augmentant la visibilité des cibles. Il ne s’agit pas du « blooming » connu pour les raisons suivantes. Tout d’abord, la méthode proposée n’utilise pas les équations physiques du
blooming, et notamment, la réponse impulsionnelle du filtre utilisée à l’étape (310) varie en fonction de l’intensité du signal ce qui n’est pas le cas du blooming. De plus, contrairement à la simulation du blooming couramment utilisée dans le domaine du jeu vidéo, la taille de ladite réponse impulsionnelle peut être judicieusement paramétrée et reliée à l’échelle de l’image afin de produire deux effets intéressants en fonction de ladite échelle : la détection des échos forts à une résolution réduite, et l’analyse des points brillants des cibles, à pleine résolution. Enfin, et de manière fondamentale, le blooming, par le fait même qu’il correspond à un éblouissement, masque la présence de signal faible au voisinage d’un pixel de signal fort, ce qui n’est justement pas le cas avec la présente méthode si les palettes de couleurs Cl0 et Chi sont judicieusement choisies comme décrit plus haut.
The proposed method differs significantly from this method in that the law used to calculate the radius of the halo does not depend on the distance from the observer to the target nor on the angle subtended by it, but depends on '' other parameters with a formulation judiciously chosen to achieve effects increasing the visibility of targets. It is not known blooming for the following reasons. First of all, the proposed method does not use the physical equations of the blooming, and in particular, the impulse response of the filter used in step (310) varies as a function of the signal intensity, which is not the case with blooming. In addition, unlike the blooming simulation commonly used in the video game industry, the size of said impulse response can be judiciously configured and linked to the scale of the image in order to produce two interesting effects as a function of said scale: detecting strong echoes at reduced resolution, and analyzing bright spots on targets at full resolution. Finally, and fundamentally, blooming, by the very fact that it corresponds to a glare, masks the presence of weak signal in the vicinity of a pixel of strong signal, which is precisely not the case with the present method if the color palettes C l0 and C hi are judiciously chosen as described above.