WO2019225504A1 - 生物組織画像処理装置及び方法 - Google Patents
生物組織画像処理装置及び方法 Download PDFInfo
- Publication number
- WO2019225504A1 WO2019225504A1 PCT/JP2019/019739 JP2019019739W WO2019225504A1 WO 2019225504 A1 WO2019225504 A1 WO 2019225504A1 JP 2019019739 W JP2019019739 W JP 2019019739W WO 2019225504 A1 WO2019225504 A1 WO 2019225504A1
- Authority
- WO
- WIPO (PCT)
- Prior art keywords
- image
- film
- biological tissue
- processing apparatus
- image processing
- Prior art date
- Legal status (The legal status is an assumption and is not a legal conclusion. Google has not performed a legal analysis and makes no representation as to the accuracy of the status listed.)
- Ceased
Links
Images






Classifications
-
- G—PHYSICS
- G01—MEASURING; TESTING
- G01N—INVESTIGATING OR ANALYSING MATERIALS BY DETERMINING THEIR CHEMICAL OR PHYSICAL PROPERTIES
- G01N23/00—Investigating or analysing materials by the use of wave or particle radiation, e.g. X-rays or neutrons, not covered by groups G01N3/00 – G01N17/00, G01N21/00 or G01N22/00
- G01N23/22—Investigating or analysing materials by the use of wave or particle radiation, e.g. X-rays or neutrons, not covered by groups G01N3/00 – G01N17/00, G01N21/00 or G01N22/00 by measuring secondary emission from the material
- G01N23/225—Investigating or analysing materials by the use of wave or particle radiation, e.g. X-rays or neutrons, not covered by groups G01N3/00 – G01N17/00, G01N21/00 or G01N22/00 by measuring secondary emission from the material using electron or ion
- G01N23/2251—Investigating or analysing materials by the use of wave or particle radiation, e.g. X-rays or neutrons, not covered by groups G01N3/00 – G01N17/00, G01N21/00 or G01N22/00 by measuring secondary emission from the material using electron or ion using incident electron beams, e.g. scanning electron microscopy [SEM]
-
- G—PHYSICS
- G06—COMPUTING OR CALCULATING; COUNTING
- G06T—IMAGE DATA PROCESSING OR GENERATION, IN GENERAL
- G06T7/00—Image analysis
Definitions
- the present disclosure relates to a biological tissue image processing apparatus and method.
- 3D microscopy is known as a technique for analyzing or imaging the 3D structure of biological tissue.
- an electron microscope or an optical microscope is generally used.
- three-dimensional microscopy using a scanning electron microscope includes Focused Ion Beam SEM (FIB-SEM) method, Serial Block-Face SEM (SBF-SEM) method, and serial section SEM (Serial Section (SEM) method (see Non-Patent Document 1) has been proposed.
- the continuous section SEM method is also called an array tomography method.
- a plurality of sample sections (ultra-thin pieces) continuous in the depth direction are cut out from a sample of a biological tissue, and they are arranged on a substrate.
- Each sample section on the substrate is sequentially observed with a scanning electron microscope, whereby a plurality of images are acquired. Based on the acquired images, the three-dimensional structure of a specific organ (cell, mitochondria, nucleus, etc.) contained in the biological tissue is analyzed or imaged. According to the continuous section SEM method, it is possible to observe a sample section that has already been observed again.
- the element of interest is a specific tissue constituent element (or cell constituent element) to be detected or identified during image processing.
- the final analysis target or imaging target may be the target element, or a tissue component other than the final analysis target or imaging target may be the target element. In the latter example, when imaging a cell lumen (cytoplasm) surrounded by a cell membrane, the cell membrane is first detected or identified as an element of interest.
- An object of the present disclosure is to support manual correction for a plurality of attention element images that are continuous on the space axis or the time axis in biological tissue image processing.
- an object of the present disclosure is to enable manual correction for a plurality of attention element images to be performed efficiently or accurately in biological tissue image processing.
- the biological tissue image processing apparatus applies a process of estimating an element of interest included in the biological tissue to a plurality of original images that are continuous on a spatial axis or a time axis obtained by observing the biological tissue.
- An image generation unit that includes a machine learning type estimator and generates a plurality of attention element images from the plurality of original images; and a position on a space axis or a time axis selected by the user from the plurality of attention element images
- a work support unit that takes out a specific attention element image corresponding to, displays it as a work target image, and reflects a user's correction on the work target image in the specific attention element image.
- a plurality of original images corresponding to a plurality of depths obtained by microscopic observation of a biological tissue are input to a machine learning type film estimator.
- Obtaining a plurality of membrane likelihood maps corresponding to a plurality of depths, obtaining a plurality of membrane images corresponding to the plurality of depths based on the plurality of membrane likelihood maps, and the plurality of membrane images Taking out a specific film image corresponding to the depth selected by the user from among them, displaying it as a work target image, and reflecting the user's correction for the work target image to the specific film image, Is included.
- the above method is realized as a hardware function or a software function.
- a program for executing the function is installed in the information processing apparatus via a network or a portable storage medium.
- the concept of the information processing apparatus includes a personal computer, an electron microscope system, an optical microscope system, and the like.
- the biological tissue image processing apparatus includes an image generation unit including a machine learning type estimator and a work support unit.
- the machine learning type estimator is an element of interest (more precisely, an image of the element of interest) included in the biological tissue with respect to a plurality of original images connected on the space axis or time axis obtained by observation of the biological tissue. Is applied.
- a plurality of attention element images are generated from a plurality of original images.
- the work support unit extracts a specific attention element image corresponding to the position selected by the user from the plurality of attention element images, displays the target attention image as a work target image, and performs a user's correction on the work target image with a specific attention. This is reflected in the element image.
- a specific attention element image corresponding to the selected position is displayed as a work target image. If the displayed work target image is corrected, the correction is reflected in the work target image, that is, the specific attention element image.
- the two positions adjacent on the space axis or the time axis may be selected alternately.
- the displayed individual work target images may be corrected as necessary while sequentially selecting the depth from a certain depth on the space axis to the shallow side or the deep side. Good.
- a plurality of attention element images corresponding to a plurality of positions are corrected, work efficiency can be improved or work accuracy can be improved.
- a plurality of original images arranged on the depth axis as a space axis are input to the estimator, but a plurality of images arranged on the time axis may be input to the estimator.
- the attention element is a specific tissue constituent element or a specific cell constituent element, and in the embodiment, the attention element is a cell membrane.
- Cell cavities (cytoplasm) surrounded by cell membranes, intracellular organelles (Organelle), and the like may be considered as elements of interest.
- the machine learning type estimator is configured by CNN, for example, but other types of machine learning type estimators may be used.
- the work support unit can also be used when generating a correct image given to the estimator in the learning process of the estimator.
- a plurality of original images are acquired by the continuous section SEM method (array tomography method). However, even if a plurality of original images are acquired by the FIB-SEM method, the SBF-SEM method, and other methods. Good.
- the user who corrects each element of interest image is usually an expert who has a certain knowledge about the biological tissue.
- Each attention element image may be corrected in another person.
- the estimator generates a plurality of attention element likelihood maps based on a plurality of original images
- the image generation unit generates an image of a plurality of attention element images based on the plurality of attention element likelihood maps.
- the image generation unit includes an estimator and an image generator. All of them may be configured by a machine learning type estimation unit.
- the image generator is constituted by a binarizer, for example.
- the work support unit displays a work window including a work target image
- the work window includes a position selection display element that is operated when a position is selected.
- the position can be easily selected by operating the position selection display element.
- the display element for position selection it is desirable to employ an element having a slider as a display element that slides on a predetermined axis. According to such a configuration, it becomes easy to intuitively recognize the position to be selected, and operability can be improved.
- the position selection display element is a depth selection display element.
- the work window further includes a display element for addition that is operated when adding the contents of the work target image, and a display element for deletion that is operated when deleting the contents of the work target image. included.
- a display element for addition that is operated when adding the contents of the work target image
- a display element for deletion that is operated when deleting the contents of the work target image. included.
- the work window further includes a labeling display element that is operated when labeling the work target image in a predetermined unit.
- Labeling is attribute assignment, that is, labeling, for managing a three-dimensional connection relationship. For example, when it is determined that an intracellular region at a certain depth and an intracellular region at another depth belong to the same cell, the same label is given to those regions. That work is equivalent to annotation.
- the labeling since the labeling can be performed while correcting the work target image, the work efficiency can be improved. Labeling may be performed automatically. Alternatively, one or more candidates may be automatically selected and presented during labeling.
- the work support unit has a function of simultaneously displaying a specific original image corresponding to the selected position as the background image when displaying the work target image.
- the work target image can be corrected or labeled while referring to the original image, so that the workability or the accuracy thereof can be improved.
- one of the images is displayed in black and white, and the other of them is displayed in color so that the original image and the work support image displayed in combination can be distinguished from each other.
- the work support unit has a function of displaying a specific original image corresponding to the selected position in addition to a function of displaying the work target image, and a specific attention element likelihood corresponding to the selected position. It has a function to display a degree map. If the original image is displayed, the work target image can be corrected while referring to the original image. If the attention element likelihood map is displayed, it is possible to evaluate the validity of the estimation result of the estimator and the validity of the binarization processing result.
- the work support unit causes the first image stack including a plurality of original images, the second image stack including a plurality of attention element likelihood maps, and the third image including a plurality of attention element images. The three stacks are managed while being associated with each other.
- the work support unit displays the image corresponding to the selected position when displaying any one of the specific original image, the specific attention element likelihood map, and the specific attention element image.
- the image has the function of displaying another image corresponding to a position different from the selected position, which is the same type of image as the image. From the continuity of the tissue on the space axis or the time axis, if a plurality of images arranged on the axis are simultaneously displayed in an overlapping manner, it is possible to accurately determine whether or not correction is necessary from the comparison between them. Moreover, according to such superposition display, it becomes possible to perform labeling correctly. In superposition display, it is desirable that at least the transparency of the upper image can be varied. Three or more images that are continuous on the space axis or the time axis may be superimposed.
- the work support unit includes a three-dimensional image processing unit that creates a three-dimensional image representing a labeling result based on the labeling results for a plurality of target element images and displays the three-dimensional image.
- a three-dimensional image processing unit that creates a three-dimensional image representing a labeling result based on the labeling results for a plurality of target element images and displays the three-dimensional image.
- the work support unit selects one or more of the second target element images in the plurality of target element images based on the labeling result for the first target element image in the plurality of target element images.
- a candidate selection unit for selecting a plurality of labeling candidates is provided. This configuration makes use of the labeling result at one position for labeling at another position on the premise of the continuity of the tissue on the space axis or the time axis. According to this configuration, the burden on the user when labeling is reduced.
- the candidate selection unit performs each labeling based on the similarity between the part labeled in the first target element image and each labeling candidate included in the second target element image.
- the display mode of the candidate is changed. According to this configuration, since the possibility of connection can be intuitively recognized from the display mode of each labeling candidate, labeling by the user can be supported.
- the biological tissue image processing apparatus applies a process of estimating a specific film included in a biological tissue to a plurality of original images that are continuous on a spatial axis or a time axis obtained by observing the biological tissue.
- a machine learning type first film estimator that generates a plurality of first film likelihood maps corresponding to a plurality of positions, and a machine learning type film estimator different from the first film estimator.
- An image generator that generates a plurality of membrane images corresponding to a plurality of positions based on the degree map, and a specific attention element image corresponding to the position selected by the user from the plurality of attention element images
- a work support unit that displays images as work target images. Te, is intended to include, a work support portion for displaying identify a correction candidates included in the work object image on the basis of a difference between the plurality of first Makuyudo map and a plurality of second Makuyudo map.
- the above configuration uses two types of machine learning type film estimators in combination. It is possible to prompt the user to correct the portion where the estimation results of the two film estimators are dissociated. Note that an element of interest other than the film may be an estimation target. Three or more types of membrane estimators may be used.
- N target element estimators including the above estimators (where N is an integer of 3 or more) are provided, and the work target image is based on the N target element likelihood maps output from the N target element estimators. May be identified and displayed.
- variation information of the attention element likelihood may be calculated for each pixel based on the N attention element likelihood maps, and a pixel that is a correction candidate may be specified based on the variation information.
- the variation information is, for example, standard deviation.
- the biological tissue image processing apparatus applies a process of estimating a cell membrane contained in a biological tissue to a plurality of original images that are continuous on a spatial axis or a time axis obtained by observing the biological tissue.
- a machine learning type first estimator that generates a plurality of film likelihood maps corresponding to a plurality of positions, and an estimator integrated with or separated from the first estimator,
- a machine learning type second estimator that applies a process for estimating an organelle contained in a biological tissue to generate a plurality of organelle likelihood maps, and a plurality of membranes based on the plurality of organelle likelihood maps.
- a correction unit for correcting the likelihood map an image generator for generating a plurality of film images corresponding to a plurality of positions based on a plurality of corrected film likelihood maps, and a user selecting from a plurality of film images Corresponding to the position Is intended to include, a work support unit for displaying it as a work target image is taken out a specific film image.
- the above configuration separately estimates an organelle (intracellular organelle) as an element of interest other than the cell membrane, and uses the estimation result for correction of the membrane likelihood map.
- organelle intracellular organelle
- the said structure estimates an organelle or its film
- a single estimator may function as the first and second estimators.
- the first estimator and the second estimator may be configured by separate estimators. It is also conceivable to apply the same configuration as described above to combinations other than the combination of the cell membrane and the organelle. Three or more estimation targets may be estimated in parallel.
- the learning process of the estimator includes a primary learning process and a secondary learning process, and in the secondary learning process, a plurality of attention element images corrected by the work support unit are given to the estimator. That is, the work support unit functions both in the learning process of the estimator and the subsequent image processing process.
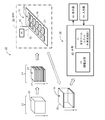
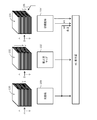
- FIG. 1 shows a biological tissue image processing system according to an embodiment.
- the illustrated biological tissue image processing system 10 is a system for analyzing and imaging a three-dimensional structure of a biological tissue. Using this biological tissue image processing system, for example, an image that three-dimensionally represents nerve cells in the brain of a human body or an animal is generated. Any tissue, organ, etc. in the organism can be the object of analysis or imaging.
- the biological tissue image processing system 10 includes a sample pretreatment device 12, a continuous section creation device 14, a scanning electron microscope (SEM) 16, and a biological tissue image processing device 18. .
- SEM scanning electron microscope
- the sample pretreatment device 12 is a device that performs pretreatment on the tissue 20 extracted from a living body, or corresponds to various instruments for the pretreatment.
- the pretreatment include fixing treatment, dyeing treatment, conductive treatment, resin embedding treatment, and shaping treatment. All or some of them are implemented as necessary.
- the staining treatment osmium tetroxide, uranium acetate, lead citrate, or the like may be used. A staining process may be performed on each sample section described below. Some or all of the steps included in the pretreatment may be performed manually.
- the continuous section preparation device 14 is provided outside the SEM 16 or inside the SEM 16.
- a plurality of sample sections 24 arranged in the depth direction (Z direction) are cut out from the cubic sample after the pretreatment by the continuous section creating apparatus 14.
- an apparatus such as an ultramicrotome may be used.
- the work may be performed manually.
- a plurality of sample sections 24 constitute a sample section group 22.
- the plurality of sample sections cut out are arranged on the substrate 28 in a predetermined arrangement.
- the substrate 28 is, for example, a glass substrate or a silicone substrate.
- the sample section array 22 ⁇ / b> A composed of two sample section rows is configured on the substrate 28, but this is merely an example.
- a sample unit 26 is configured by the substrate 28 and the sample section array 22A.
- each sample section 24 is, for example, on the order of nm or ⁇ m.
- a sample section 24 having a larger size may be produced.
- the thickness (size in the Z direction) of each sample section 24 is, for example, in the range of several nm to several hundred nm, and in the embodiment, the thickness is in the range of, for example, 30 to 70 nm. Any numerical value given in this specification is an example.
- the SEM 16 includes an electron gun, a deflector (scanner), an objective lens, a sample chamber, a detector 34, and the like.
- a stage for holding the sample unit 26 and a moving mechanism for moving the stage are provided in the sample chamber.
- the control unit in the SEM 16 controls the operation of the moving mechanism, that is, the movement of the stage.
- the electron beam 30 is irradiated to a specific sample section 24 selected from the sample section array 22A.
- scanning the irradiation position for example, raster scanning
- the reflected electrons 32 emitted from each irradiation position are detected by the detector 34.
- an SEM image is formed. This is performed for each sample section 24.
- a plurality of SEM images 38 that are observation results of the plurality of sample sections 24 are obtained.
- the plurality of SEM images 38 constitute an SEM image stack 36.
- the X direction observation range and the Y direction observation range coincide with each other.
- the observation range (electron beam two-dimensional scanning range) in each sample section 24 is determined. Instead of the reflected electrons 32, secondary electrons or the like may be detected.
- the control unit in the SEM 16 also has a function of changing the acceleration voltage for forming the electron beam 30. Depending on the biological tissue, the observation target in the biological tissue, the observation purpose, etc., the acceleration voltage at the time of forming the electron beam may be switched. In general, the same acceleration voltage is set in the learning process of the membrane estimator described later and the analysis process of the biological tissue thereafter.
- the SEM image stack 36 includes a plurality of SEM images 38 corresponding to a plurality of depths (a plurality of depths on the depth axis) in the Z direction (in other words, arranged in the Z direction in the data storage space). Is done.
- Each SEM image 38 is an original image or an input image when viewed from the biological tissue image processing apparatus 18 side.
- Each SEM image 38 is electronic data, and each SEM image is transmitted from the SEM 16 to the biological tissue image processing apparatus 18 via a network or a portable storage medium.
- the biological tissue image processing apparatus 18 is configured by a personal computer in the illustrated configuration example.
- the biological tissue image processing apparatus 18 may be incorporated in the SEM 16, or the biological tissue image processing apparatus 18 may be incorporated in a system computer that controls the SEM 16 or the like.
- the SEM 16 may be controlled by the biological tissue image processing apparatus 18.
- the biological tissue image processing apparatus 18 has a main body 40, a display 46 and an input device 48.
- the plurality of functions of the main body 40 will be described in detail later with reference to FIGS.
- FIG. 1 two typical functions (film estimation function and processing function) exhibited by the main body 40 are represented as blocks.
- the main body 40 includes a machine learning type film estimator 42 and a processing tool unit (work support unit) 44.
- the display 46 is configured by an LCD, an organic EL display device, or the like.
- the input device 48 includes a keyboard operated by a user, a pointing device, and the like.
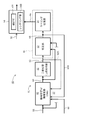
- FIG. 2 shows a first configuration example of the main body 40.
- the main body 40 includes a machine learning type film estimator 42, a binarizer (image generator) 50, a processing tool unit (work support unit) 44, a volume data processing unit 56, and the like.
- the processing tool unit 44 includes a correction unit 52 and a labeling processing unit 54.
- the volume data processing unit 56 includes an analysis unit 56A and a rendering unit 56B.
- each configuration shown in FIG. 2 is basically software or a program executed by a general-purpose processor such as a CPU or GPU except for a portion corresponding to a user's work or action. However, part or all of the configuration may be configured by a dedicated processor or other hardware. All or part of the functions of the biological tissue image processing apparatus may be executed by one or a plurality of information processing devices existing on the network.
- a general-purpose processor such as a CPU or GPU
- All or part of the functions of the biological tissue image processing apparatus may be executed by one or a plurality of information processing devices existing on the network.
- the film estimator 42 functions as a film estimation means.
- the film estimator 42 applies a film estimation process to the input original image (SEM image) 58, and outputs a film likelihood map 60 thereby.
- the film estimator 42 is configured by CNN (Convolutional Neural Network). A specific configuration example will be described later with reference to FIG.
- the CNN learning process Prior to the actual operation of the CNN, the CNN learning process is performed in advance so that the film is correctly estimated by the CNN.
- the learning process includes a primary learning process (initial learning process) and a secondary learning process.
- each image pair is composed of an original image (SEM image) 58 and a correct image 68 corresponding thereto.
- the correct image 68 is created by, for example, manual work on the original image 58.
- the correct image 68 may be created from the original image 58 by an unsupervised machine learning device, a simple classifier (for example, SVM (Support Vector Vector)) or the like.
- the output may be used as the correct image 68.
- the correct answer image 68 may be created based on the output of the film estimator 42 that has undergone a certain primary learning process.
- a plurality of image pairs are given as teacher data to the membrane estimator 42 as in the primary learning process.
- the teacher data includes a plurality of image pairs used in the primary learning process and a plurality of image pairs added in the secondary learning process.
- Each added image pair includes an original image 58 and a corresponding correct image 64A.
- the correct image 64A is created by the biological image processing apparatus itself by the configuration from the membrane estimator 42 to the processing tool unit 44. Specifically, when the original image 58 is input to the membrane estimator 42, the membrane likelihood map 60 is output from the membrane estimator 42 as an estimation result image.
- a correct image 64 ⁇ / b> A is created through generation of a mask image based on the film likelihood map 60 and user (expert) correction to the mask image 62 using the processing tool unit 44.
- Each process will be described in detail later. It is also conceivable to use the mask image 62 as the correct image 62A.
- the CNN parameter group in the film estimator 42 is further improved by the secondary learning process. That is, the machine learning result is further accumulated in the film estimator 42.
- the secondary learning process ends when it is determined that the result of the estimation process on the original image 58 is sufficiently similar to the correct images 68 and 64A corresponding to the original image 58. Thereafter, re-learning of the film estimator 42 is executed by the same method as described above as necessary.
- a correct image can be created based on the membrane estimation result, so that the burden on the user is greatly reduced compared to the case where all the correct images are manually created from the original image.
- a plurality of image pairs may be collectively given to the film estimator 42 and may be batch processed.
- the database 57 stores a plurality of original images 58, a plurality of correct images 68, 68A, and the like.
- the film estimator 42 and the database 57 may be integrated.
- U-net may be used, or SVM, random forest, or the like may be used.
- the binarizer 50 functions as an image generator. Specifically, the binarizer 50 is a module that generates a temporary membrane image 62 by binarization processing on the membrane likelihood map 60, as will be exemplified later with reference to FIG.
- the film likelihood map 60 includes a plurality of film likelihoods arranged two-dimensionally. Each film likelihood is a numerical value indicating the probability (probability) of being a film. The film likelihood is, for example, between 0 and 1.
- the film likelihood map 60 can also be understood as a film likelihood image.
- a threshold is set in the binarizer 50, and the binarizer 50 converts a film likelihood that is equal to or greater than the threshold to 1 and converts a film likelihood that is less than the threshold to 0.
- the image generated as a result is a temporary membrane image 62.
- the film image before correction is referred to as a temporary film image 62 in order to distinguish the film image before correction from the film image after correction.
- the image generation unit 61 is configured by both the film estimator 42 and the binarizer 50.
- the entire image generation unit 61 may be configured by CNN or the like. Even in such a case, the stepwise generation of the membrane likelihood map and the temporary membrane image can be considered. It is also possible to use the temporary membrane image 62 as the correct image 62A. Prior to binarization processing, processing such as noise removal and edge enhancement may be applied to the film likelihood map 60.
- the machining tool unit 44 functions as a work support unit or work support means.
- the processing tool unit 44 has a display processing function and an image processing function from the viewpoint of information processing. From the viewpoint of work, it has a correction function and a labeling function. In FIG. 2, these functions are expressed as a correction unit 52 and a labeling processing unit 54.
- a plurality of specific functions exhibited by the processing tool unit 44 will be organized later with reference to FIG. Here, the outline or its main functions will be described.
- the correction unit 52 displays, as a work target image, a mask image that is a work target for the user via a work window illustrated in FIG. 6 later, and accepts a user's correction instruction on the work target image. Is.
- the correction contents are reflected in the mask image that is the work target image.
- the work target image includes a discontinuous portion of the film
- a film pixel group is added to the discontinuous portion.
- the correction unit 52 is a module that supports the user's work or operation and manages each mask image.
- the input original image 58 and the generated membrane likelihood map 60 are also provided to the correction unit 52 (or the processing tool unit 44). Input sequentially.
- the original image 58 or the membrane likelihood map 60 corresponding to the work target image can be displayed together with or instead of the temporary membrane image as the work target image. This will be described later with reference to FIGS.
- the interpolation processing executed in the correction unit 52 will be described later with reference to FIGS.
- the labeling processing unit 54 is a module for performing labeling (painting and labeling) on individual regions (cell lumens) included in the corrected membrane image (or the uncorrected membrane image). Labeling includes manual labeling by the user and automatic labeling. The labeling will be described later with reference to FIGS. The management table for managing the labeling result will be exemplified later in FIG. At the stage where the correction work and the labeling work are completed, the three-dimensional labeling data 66 in which the cell lumen is distinguished from the others is configured. This is sent to the volume data processing unit 56.
- an original image stack (SEM image stack) 36 including a plurality of original images is input to the volume data processing unit 56.
- the original image stack 36 constitutes volume data.
- the three-dimensional labeling data 66 is also input to the volume data processing unit 56. It is also a kind of volume data.
- the analysis unit 56A analyzes a target organ (for example, a nerve cell) based on the three-dimensional labeling data 66, for example. For example, the form, volume, length, etc. may be analyzed.
- the original image stack 36 is analyzed with reference to the three-dimensional labeling data.
- the rendering unit 56B forms a three-dimensional image (stereoscopic expression image) based on the three-dimensional labeling data 66. For example, an imaging portion may be extracted from the original image stack 36 based on the three-dimensional labeling data 66, and a rendering process may be applied to the extracted image portion.
- each corrected membrane image 64 is input to the membrane estimator 42 as a correct image 64A.
- each correct image 64A can be used as compared with the case where they are not used.
- the production burden is greatly reduced. That is, according to the above configuration, it is possible to reduce labor and time required in the learning process of the film estimator 42.
- the combined use of the film estimator 42 and the processing tool unit 44 can improve the quality of the image group to be analyzed or rendered, and easily and quickly generate the image group. Is possible.
- the processing tool unit 44 also functions as a three-dimensional image processing unit (three-dimensional image generation unit) and a candidate selection unit (candidate selection unit).
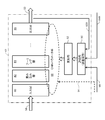
- FIG. 3 schematically shows a configuration example of the membrane estimator 42.
- the membrane estimator 42 has a number of layers, including an input layer 80, a convolution layer 82, a pooling layer 84, an output layer 86, and the like. They act according to the CNN parameter group 88.
- the CNN parameter group 88 includes a number of weighting factors, a number of bias values, and the like.
- the CNN parameter group 88 is initially configured by an initial value group 94. For example, the initial value group 94 is generated using random numbers or the like.
- the evaluation unit 90 and the update unit 92 function.
- the evaluation unit 90 calculates an evaluation value based on a plurality of image pairs (the original image 58 and the corresponding correct images 68 and 64A) constituting the teacher data. Specifically, the evaluation value is calculated by sequentially giving the estimation result 60A for the original image 58 and the correct images 68 and 64A corresponding to the original image 58 to the error function.
- the updating unit 92 updates the CNN parameter group 88 so that the evaluation value changes in a favorable direction. By repeating this, the CNN parameter group 88 is optimized as a whole. Actually, the end of the learning process is determined when the evaluation value reaches a certain value.
- the configuration shown in FIG. 3 is merely an example, and it is possible to use estimators having various structures as the film estimator 42.
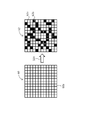
- FIG. 4 shows the operation of the binarizer.
- a film likelihood map 60 is output from the film estimator.
- the film likelihood map 60 is composed of a plurality of film likelihoods 60a corresponding to a plurality of pixels, and each film likelihood 60a is a numerical value indicating the probability of being a film.
- the binarizer binarizes the membrane likelihood map 60, thereby generating a temporary membrane image 62 as a binarized image.
- each film likelihood 60a is compared with a threshold value.
- a membrane likelihood 60a that is equal to or greater than the threshold is converted into a pixel 62a having a value of 1, and a membrane likelihood 60a that is less than the threshold is converted into a pixel 62b having a value of 0.
- the pixel 62a is handled as a pixel (film pixel) constituting the film.
- the threshold value can be variably set by the user. The setting may be automated. For example, the threshold value may be changed while observing the temporary membrane image 62.
- FIG. 5 a plurality of functions of the machining tool unit are organized.
- the upper part (A) shows a plurality of functions of the correction unit, and the lower part (B) shows a plurality of functions of the labeling processing unit. Details or specific examples of these functions will be described with reference to FIGS. This section outlines these functions.
- the correction to the mask image is roughly classified into manual correction (A1) and automatic correction (A2).
- manual correction (A1) a virtual pen and a virtual eraser are used as correction tools.
- the pen is a correction tool for drawing a film (converting a non-film pixel into a film pixel)
- the eraser is a correction tool for erasing the film (converting a film pixel into a non-film image).
- Other correction tools may be provided.
- a temporary membrane image corresponding to the depth selected by the user is displayed in color as a work target image.
- the original image corresponding to the selected depth is displayed as a monochrome image as a background image.
- a plurality of images of the same type original image, membrane likelihood map, or temporary membrane image
- correction candidates may be displayed to support manual correction work.
- a film break portion included in the temporary film image is automatically interpolated. Specifically, two points designated by the user are automatically connected. For this purpose, several functions are prepared, and any one of these functions is selected as necessary. For example, as indicated by (A21), two points on the work target image may be interpolated based on the work target image (temporary membrane image). As indicated by (A22), two points on the work target image may be interpolated based on the original image corresponding to the work target image. As indicated by (A23), two points on the work target image may be interpolated based on a likelihood map corresponding to the work target image. As indicated by (A24), three-dimensional interpolation may be performed based on a plurality of images (original image, membrane likelihood map, or temporary membrane image) that are continuous in the depth direction.
- a labeling tool In manual labeling (B1), a labeling tool is used, and a specific area (closed area) is designated as a labeling target by the user. Then, the area is painted, and a unique label is given to the area.
- the label is an identifier or attribute value for managing the connection relationship.
- an image corresponding to another depth for example, an adjacent temporary membrane image that has been labeled
- the connection relationship between the regions in the depth direction may be automatically determined, and one or a plurality of labeling candidates may be displayed on the work target image. At that time, the possibility of connection may be automatically determined, and the display mode of each labeling candidate may be controlled based on the determination result.
- the connection relation of the areas between layers is automatically determined, and thereby painting and labeling are automatically performed.
- a perpendicular virtual line parallel to the Z direction passing through the representative coordinates is defined, and one or more through which the perpendicular passes
- the same label as that attached to a specific area may be attached to the area (skewer method).
- a certain range may be set on both sides in the depth direction with the depth at which the specific region exists as a reference depth, and automatic labeling may be executed within the range.
- connection relationship between layers is automatically determined based on the similarity between regions in the depth direction, and labeling is automatically performed based on the determination result. It may be.
- labeling result is usually visually confirmed by the user.
- machining tool unit is installed so that the correction work and labeling work by the user is efficient or the burden is reduced, and further, the quality of the three-dimensional labeling data is increased. It is desirable to configure.
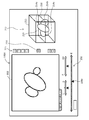
- FIG. 6 illustrates a work window displayed by the machining tool unit.
- the work window 100 includes a display image 102.
- the display image 102 is a composite image composed of a mask image (work target image) corresponding to the depth selected by the user and the original image.
- An original image as a gray scale image constitutes a background image, and a temporary membrane image (work target image) as a color image (for example, a blue image) is superimposed and displayed on the background image.
- the illustrated display image 102 shows brain tissue, in which cross sections of a plurality of cells appear. At the same time, a cross section of an organelle (such as mitochondria) in the cell also appears.
- the display image 102 described above is displayed.
- the tab 105 is selected, only the original image as a gray scale image is displayed.
- the tab 106 is selected, only the film likelihood map (film likelihood image) as a gray scale image is displayed.
- a tab for displaying only a mask image as a work target image may be added.
- a membrane likelihood map may be used as a background image, and a temporary membrane image may be superimposed on the background image.
- the depth selection tool 108 is a display element (operation element) for selecting a specific depth (display depth as a display position) in the Z direction (that is, on the depth axis as a space axis). It consists of a Z-axis symbol 108b representing the Z-axis and a marker 108a as a slider that slides along the Z-axis symbol 108b. It is possible to select the desired depth by moving the marker 108a. According to such a depth selection tool 108, it is possible to obtain an advantage that it is easy to intuitively recognize the depth to be selected and the depth change amount.
- the left end point of the Z-axis symbol 108b corresponds to zero depth, and the right end point of the Z-axis symbol 108b corresponds to the maximum depth.
- Depth selection tools having other forms may be employed.
- the depth input field 114 is a field for directly specifying the depth as a numerical value. The depth currently selected according to the position of the marker 108a may be displayed as a numerical value in
- the transparency adjustment tool 110 is a tool for adjusting the transparency (display weight) of the color temporary membrane image (work target image) displayed in a synthesized state in a state where the display image 102 is displayed. For example, when the marker 110a is moved to the left side, the display weight of the color mask image is reduced, the transparency is increased, and the original image is dominantly displayed. On the contrary, when the marker 110a is moved to the right side, the display weight of the color mask image increases, the transparency decreases, and the color mask image becomes more clearly expressed.
- the superimposition display tool 112 is an image (display image, original image, or film likelihood map) adjacent to the currently displayed image (display image, original image, or film likelihood map) on the shallow side in the depth direction. Or it is operated when displaying an image (display image, original image or film likelihood map) adjacent to the deep side in the depth direction in an overlapping manner.
- the marker 112a is moved to the left side, the display weight for the image adjacent to the shallow side increases.
- the marker 112a is moved to the right side, the display weight for the image adjacent to the deep side increases.
- Three or more images may be superimposed and displayed. Of course, if too many images are superimposed, the image content becomes too complex, so it is desirable to overlay a small number of images.
- Such superposition display makes it easy to obtain depth information.
- the button row 115 includes a plurality of virtual buttons 116, 118, 120, 121, 122, 126.
- the button 116 is a display element operated when performing image zoom (enlargement or reduction).
- the button 118 is a display element that is operated when the pen tool is used. When the button 118 is turned on, the shape of the cursor is changed to a pen shape, and a film pixel can be added using the cursor shape. It is also possible to change the pen size.
- the button 120 is a display element that is operated when using an eraser. When the button 120 is turned on, the shape of the cursor is changed to an eraser shape, and the film pixel can be deleted using the cursor shape. It is also possible to change the size of the eraser.
- the button 121 is a display element that is operated when painting. If any area is designated after the button 121 is turned on, the area is filled. It is also possible to select an arbitrary function from a plurality of functions prepared for painting (or labeling) by operating the button 121.
- the color palette 124 is displayed. For example, a color selected from the color palette is given to the painted area. Thereby, the area is colored by the selected color.
- Each color is associated with an object number. If the same color, that is, the same object number is given to a plurality of regions across the layers, a three-dimensional lumen region in a specific cell is defined by these regions.
- the button 126 is a button for black and white reversal. When it is operated, a portion displayed in black in the displayed image is displayed in white, and conversely, a portion displayed in white is displayed in black.
- the content of the work window 100 shown in FIG. 6 is merely an example, and it is desirable that the content is appropriately determined so that the workability is improved in the user work.
- the display process in the machining tool unit will be described with reference to FIGS.
- the process shown in FIG. 7 corresponds to the display process shown in (A11) in FIG.
- the process shown in FIG. 8 corresponds to the display process shown in (A12) and (B11) in FIG.
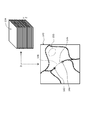
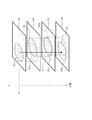
- the original image stack 130 includes a plurality of original images arranged in the Z direction (depth direction).
- the film likelihood map stack 132 includes a plurality of film likelihood maps arranged in the Z direction.
- the mask image stack 134 includes a plurality of mask image stacks arranged in the Z direction. Each temporary mask image becomes a film image after the correction, but this is a distinction for convenience.
- the mask image is referred to as a mask image without distinguishing between before correction and after correction.
- the stacks 130, 132, and 134 are managed by the processing tool unit, or managed by a control unit included in the biological tissue processing apparatus.
- the original image 130i corresponding to the depth Zi selected by the user is taken out from the original image stack 130 and displayed on the display unit 46.
- the film likelihood map 132i corresponding to the depth Zi selected by the user is extracted from the film likelihood map stack 132 and displayed on the display unit 46.
- a mask image 134 i corresponding to the depth Z i selected by the user is taken out from the mask image stack 134 and displayed on the display 46.
- the mask image 134 i corresponding to the depth Zi is synthesized on the original image 130 i corresponding to the depth Zi, and the synthesized image is displayed on the display 46.
- the mask image 134i Prior to the synthesis, the mask image 134i is converted into a blue color image, for example.
- the display weight w0 is multiplied to the original image 130i, and the display weight w1 is multiplied to the temporary membrane image 134i.
- Each display weight w0, w1 can be changed by the user.
- the mask image 134i is a work target image.
- the correction content is immediately reflected in the mask image 134i as indicated by reference numeral 135.
- correction processing and labeling processing are performed on each displayed work target image.
- the original image 130i or the membrane likelihood map 132i can be displayed alone as necessary.
- correction contents for the past m times are managed as a correction history in the ring buffer, and an Undo operation can be performed as necessary.
- FIG. 8 shows a display process when the superposition display is selected.
- the same reference numerals are given to the same components as those shown in FIG. 7, and the description thereof will be omitted.
- the superposition display process can be selectively applied to three types of display images.
- the superposition display process may be applied to only some images.
- the original image 130i and the depth Zi corresponding to the depth Zi are obtained from the original image stack 130.
- the original image 130i-1 corresponding to -1 is extracted. They are polymerized and displayed. Even when the original image 130i + 1 corresponding to the depth Zi + 1 is superimposed on the original image 130i, the same processing as described above is executed.
- the transparency of the additionally displayed original images 130i-1 and 130i + 1 is adjusted by changing the display weight w3.
- the film likelihood map stack 132 sets the depth Zi to the depth Zi.
- the corresponding film likelihood map 132i and the film likelihood map 132i-1 (or film likelihood map 132i + 1) corresponding to the depth Zi-1 (or depth Zi + 1) are extracted. They are polymerized and displayed.
- the mask image stack 134 A mask image 134i corresponding to the depth Zi and a mask image 134i-1 (or mask image 134i + 1) corresponding to the depth Zi-1 (or depth Zi + 1) are extracted. They are polymerized and displayed. In that case, two adjacent composite images are actually displayed in a superimposed manner. A polymerization treatment may be performed after the synthesis treatment.
- FIG. 9 shows a first example of interpolation processing. This corresponds to the interpolation processing indicated by (A21) in FIG.
- a mask image corresponding to the depth Zi is extracted from the mask image stack 134 and displayed as a work target image 140.
- both ends of the film interruption portion 146 are designated by the two points 142 and 144 by the user.
- Reference numeral 148 indicates an automatically added interpolation line (connection line). In that case, spline interpolation or other techniques can be used.
- a cell component other than the cell membrane is detected as a membrane, as indicated by reference numeral 150, it is erased by an eraser.
- FIG. 10 shows a second example of interpolation processing. This corresponds to the interpolation processing indicated by (A22) in FIG.
- a mask image corresponding to the depth Zi is extracted from the mask image stack 134 and displayed as a work target image 140.
- the user designates the two ends 142 and 144 of the both ends of the film interruption portion.
- the original image 152 corresponding to the depth Zi is also taken out from the original image stack 130.
- Edge enhancement processing is applied to the original image 152 as necessary.
- two points corresponding to the two points 142 and 144 are identified on the original image 152 (see reference numeral 154), and interpolation is performed between these points (see reference numeral 156).
- a route connecting two points is searched.
- various known techniques can be used.
- an interpolation line 158 having the same form as the searched route is added on the work target image 140.
- various methods for solving the shortest route problem can be used. For example, the Dijkstra method may be used.
- a three-dimensional route may be searched by the same method as described above.
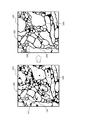
- FIG. 11 shows a temporary membrane image 180 before correction and a temporary membrane image 182 after correction.
- the temporary film image 180 before correction includes film break portions 184 and 188.
- the corrected temporary membrane image 182 as shown by reference numerals 186 and 190, the film interruption portion is repaired.
- the temporary membrane image 180 before correction includes non-membrane portions 192 and 196.
- those non-membrane portions have disappeared. According to the corrected mask image 182, it is possible to accurately perform labeling, and consequently, it is possible to improve the quality of the three-dimensional labeling data.
- FIG. 12 illustrates a three-dimensional splicing process included in the labeling process.
- the contents correspond to the process shown in (B21) or the process shown in (B22) in FIG.
- a plurality of temporary membrane images D1 to D4 arranged in the Z direction are shown.
- a temporary membrane image D1 corresponding to the depth Zi is a work target image. This is a reference image in the processing described below.
- a representative point is specified for the region R1 included in the mask image D1 that is the reference image. For example, a center point, a center of gravity point, etc. are specified as representative points.
- a perpendicular C passing through the representative point is defined. From the reference image, for example, N masked membrane images are referred to on the deep side, and each region through which the perpendicular C passes is specified in these images. And the same label is provided with respect to area
- the above processing may be applied to N temporary film images on the shallow side from the reference image. The result of automatic labeling is usually visually confirmed by the user.
- the region R1 (outer edge) included in the temporary membrane image D1 is projected onto the temporary membrane image D2, and the projection region R1a is defined.
- a region R2 that most overlaps the projection region R1a is specified on the mask image D2.
- the region R2 is projected onto the mask image D3, and the projection region R2a is defined.
- a region R3 that most overlaps the projection region R2a is specified on the mask image D3.
- a projection region R3a is defined on the mask image D4, and the region R4 is specified based on the projection region R3a.
- the same label is assigned to the region R1 and all of the regions R2, R3, and R4 identified from the region R1.
- the projection source area is sequentially updated when the layer is changed, but it may be fixed.
- the region R1 may be projected onto the mask images D2, D3, D4.
- the connection destination is searched from the reference image to one side in the Z direction, but the connection destination may be searched from the reference image to both sides in the Z direction.
- the search range may be selected by the user.
- the result of automatic labeling is usually visually confirmed by the user. In that case, the work window shown in FIG. 6 is used.
- the three-dimensional connection process described above is an example, and a three-dimensional connection process other than the above may be employed.
- one or a plurality of feature amounts for each region can be used.
- As the feature amount of the area an area, a form, a perimeter, a barycentric point, a luminance histogram, a texture, or the like may be used.
- a superposition area, a distance between representative points, or the like may be used as a feature amount between regions.
- FIG. 13 shows an example of candidate display. This process corresponds to the process indicated by (A13) in FIG.
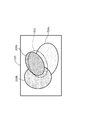
- a projection area 202 is defined on the mask image (work target image) 200 corresponding to the depth Zi.
- the projection area 202 is an area defined by, for example, projection of the original area labeled on the mask image corresponding to the depth Zi-1.
- a plurality of regions 204a, 204b, and 204c that overlap with the projection region 202 are specified. Further, the similarity (for example, the overlapping area) is calculated between the projection area 202 (or the original area) and each of the areas 204a, 204b, and 204c.
- each of the areas 204a, 204b, and 204c is identified and expressed with a different color. That is, the difference in similarity is identified and expressed as a difference in hue.
- the user can perform labeling while referring to the similarity between the individual regions 204a, 204b, and 204c. For example, in the example shown in the figure, the same label as that assigned to the original area is assigned to the area 204a having the highest similarity.
- FIG. 14 illustrates a management table.
- the illustrated management table 206 is a table for managing the result of the labeling process.
- the management table 206 is constructed in the labeling processing unit, for example.
- the management table 206 includes a plurality of records 206a, and each record 206a corresponds to one pixel.
- pixel coordinates, classes, and labels are managed.
- the class is data for identifying the film, the inside of the film, and others as the attribute of the pixel.
- the label is numerical data for specifying a connection relationship in the three-dimensional data space. The same label is given to the pixel groups that are connected (inside a certain cell membrane).
- FIG. 15 the same components as those shown in FIG. 6 are denoted by the same reference numerals, and the description thereof is omitted.
- the button row 115 in the work window 100A includes a button 210 for displaying a three-dimensional image.
- the sub display image 212 is displayed on the display image 102 or at a different location.
- the sub display image 212 includes a wire frame (a graphic indicating a coordinate system) 213 representing a three-dimensional space, and a three-dimensional image 215 represented inside the wire frame.
- the three-dimensional image 215 is an aggregate of three portions 214a, 214b, and 214c in the illustrated example. Each portion 214a, 214b, 214c shows the three-dimensional form of the cell lumen.
- a three-dimensional image 215 having a stereoscopic effect is generated by executing a rendering process based on the three-dimensional labeling data generated by the labeling process. Parameters such as the viewpoint and the light source can be changed by the user.
- the sub display image 212 may be popped up in the form of another window.
- the sub display image 212 includes a frame graphic 216 indicating the currently selected depth.
- the marker 108a is slid in the depth selection tool 108 included in the work window 100A, the content of the displayed work target image changes, and at the same time, the frame figure 216 moves in the depth direction.
- the work target layer in the three-dimensional data space can be intuitively recognized.
- the three-dimensional images 226 and 227 shown in FIG. 16 may be displayed.
- the three-dimensional images 226 and 227 represent a certain cell lumen as a stacked body of a plurality of disks 228. According to such three-dimensional images 226 and 227, the thickness of each sample section can be reflected in the three-dimensional image.
- a plurality of flat disks may be displayed instead of the plurality of disks.
- FIG. 17 shows a second configuration example of the main body of the biological tissue image processing apparatus.
- the same components as those shown in FIG. 2 are denoted by the same reference numerals, and the description thereof is omitted.
- the membrane estimator 250 has a function of simultaneously estimating a cell membrane and other membranes (mitochondrial membrane in the illustrated configuration example).
- the membrane likelihood map A254 is output as the estimation result of the cell membrane, and at the same time, the membrane likelihood map B258 is output as the estimation result of the mitochondrial membrane.
- the film likelihood map correction unit 262 is a module that corrects the film likelihood map A based on the film likelihood map B. Specifically, if the film likelihood b of the coordinates (x, y) constituting the film likelihood map B258 is equal to or greater than the determination threshold ⁇ , the film likelihood a of the coordinates (x, y) in the film likelihood map A254 is The value of is replaced with 0. On the other hand, if the film likelihood b at the coordinates (x, y) in the film likelihood map B258 is smaller than the determination threshold ⁇ , the value of the film likelihood a at the coordinates (x, y) in the film likelihood map A254 is maintained. The film likelihood map correction unit 262 outputs a corrected film likelihood map 264.
- the binarizer 50 binarizes the membrane likelihood map 264 and generates a temporary membrane image 62.
- the binarizer 268 and the correction unit 270 provided in parallel with the binarizer 50 and the correction unit 52 are for creating the correct image 272 based on the film likelihood map B258.
- the binarizer 268 has the same function as the binarizer 50 and generates a temporary membrane image from the membrane likelihood map B.
- the correction unit 270 has the same function as the correction unit 52.
- the masking image is manually corrected or automatically corrected by the correcting unit 52, thereby generating a correct image 272.
- the processing tool unit 266 includes a correction unit 52, a labeling processing unit 54, and a correction unit 270.
- the original image 58 and the corresponding correct images 64A and 68 are used as teacher data.
- the correct image 64A is a film image 64 after correction by the correction unit 52, and the correct image 68 is an image created separately from the original image.
- the original image 58 and the corresponding correct images 272 and 274 are used as teacher data.
- the correct image 272 is a film image after correction by the correction unit 270, and the correct image 274 is an image created separately from the original image.
- a temporary membrane image 62 can be used instead of the correct image 64A.
- the estimation result of the cell membrane is corrected by another estimation result, so that the estimation accuracy of the cell membrane can be increased.
- the work window shown in FIG. 6 can be used, so that the work efficiency can be improved in the correction work.
- correction is performed when the film likelihood in the film likelihood map B258 is greater than or equal to the threshold value ⁇ .
- the correction degree is variable depending on the magnitude of the film likelihood in the film likelihood map B258. You may be made to do.
- a membrane estimator for estimating the cell membrane and a membrane estimator for estimating the mitochondrial membrane may be provided side by side.
- the two film estimators are each configured by a machine learning type estimator.
- a multi-class estimation type estimator that estimates the cell membrane, mitochondria, and background individually and simultaneously may be provided.
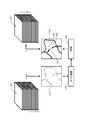
- FIG. 18 shows a third configuration example of the main body of the biological tissue image processing apparatus.
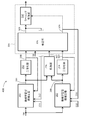
- the main body 40B has two machine learning type film estimators 280 and 282 that input the original image 58 and perform film estimation.
- the two machine learning type film estimators 280 and 282 have different configurations, that is, their types or schemes are different from each other.
- the film estimator 280 corresponds to the film estimator 42 shown in FIG. 2, and is configured by CNN, for example.
- the film estimator 282 is constituted by a random forest, for example.
- the membrane estimators 280 and 282 are both for estimating the cell membrane, but the estimation results of the two membrane estimators 280 and 282 are not necessarily the same because of differences in their properties or characteristics.
- one of the film estimators 280 and 282 may be determined to be a film, and the other of them may be determined to be a film.
- One may be judged as a membrane and the other of them may be judged as a non-membrane.
- the processing unit 296 compares the film likelihood map A 284 output from the film estimator 280 with the film likelihood map B 286 output from the film estimator 282, and corrects a pixel (or pixel group) having a large difference between the two. It is determined as a candidate. In the illustrated configuration example, information 302 specifying correction candidates is sent from the processing unit 296 to the correction unit 306. A processing unit 296 may be provided in the correction unit 306.
- the binarizer 292 corresponds to the binarizer 50 shown in FIG. 2, which generates a temporary membrane image 298 from the membrane likelihood map A284.
- the binarizer 294 exhibits the same operation as the binarizer 292, and generates the temporary membrane image 300 from the membrane likelihood map B286.
- the machining tool unit 304 has the same function as the machining tool unit 44 shown in FIG. 2, and includes a correction unit 306 and a labeling processing unit 310.
- the correcting unit 306 is for correcting the temporary mask image 298 output from the binarizer 292 and the temporary mask image 300 output from the binarizer 294.
- the corrected film image 308 is sent to the labeling processing unit 310.
- the membrane image 308 is sent to the membrane estimator 280 as the correct image 312.
- the corrected membrane image 309 is sent to the membrane estimator 282 as a correct image 316.
- the processing tool unit 304 has a function of identifying and displaying correction candidates when displaying the mask image corresponding to the selected depth or when displaying the input mask image 298. The specification of the correction candidate and its identification display will be described later with reference to FIGS. 19 and 20.
- the corrected film image 309 may be sent to the labeling processing unit 310.
- the original image 58 and the corresponding correct images 312 and 314 are input to the film estimator 280 as teacher data.
- the correct image 312 is a corrected membrane image 308.
- the correct answer image 314 is created separately from the original image.
- the original image 58 and the corresponding correct images 316 and 318 are input to the membrane estimator 282 as teacher data.
- the correct image 316 is a film image 309 after correction.
- the correct answer image 318 is created separately from the original image.
- the film likelihood map A and the film likelihood map B are compared in units of pixels.
- the comparison unit may be another unit.
- a difference map is generated by comparing the two film likelihood maps A and B.
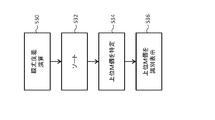
- a plurality of difference values constituting the difference map are sorted. That is, a ranking is made for them.
- the top M difference values are specified in the sorted difference value sequence. That is, M difference values including the maximum difference value are specified.
- a plurality of pixels corresponding to them become correction candidates.
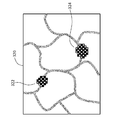
- a plurality of correction candidates are identified and displayed on the work target image. For example, it is displayed with high brightness or with a specific hue.
- the local portions 322 and 324 are portions where a plurality of correction candidate images are densely packed. Usually, a plurality of correction candidate pixels are locally concentrated in this way. In some cases, a plurality of correction candidate pixels are arranged along the edge. In any case, according to such a candidate display, the user specifies a portion that should be corrected or a portion where dissociation has occurred in the two film estimation results, and is necessary for that portion. Correction can be performed. This improves the accuracy of the correction work.
- variation information is calculated in units of pixels based on N film likelihood maps calculated in parallel, a correction candidate is identified from the variation information, and the correction candidate is identified and displayed.
- N is an integer greater than or equal to 3
- N film estimators of different types an arithmetic unit that calculates a standard deviation of film likelihoods in pixel units based on N film likelihood maps output from them, and pixel units
- Information other than the standard deviation (for example, variance or information corresponding thereto) may be calculated as the variation information.
- N estimation results are not available, there is a high possibility that the estimation result is not a film, so that it is displayed as a correction candidate.
- a mask image corresponding to a desired depth is displayed in the work window by operating the depth selection tool included in the work window, and necessary corrections and labeling are performed on the image.
- the corresponding original image is displayed as a background image, so the validity of the estimation result is confirmed while comparing the original image with the mask image. You can make corrections.
- a plurality of original images may be acquired by a transmission electron microscope or an optical microscope.
- a cell membrane a cell lumen, an organelle (organelle), or the like may be an estimation target in the estimator.
- the continuous section SEM method is employed, but the FIB-SEM method, the SBF-SEM method, and other methods may be employed.
- image sequences that are continuous on the space axis image sequences that are continuous on the time axis may be processed.
- a biological tissue image processing apparatus (or corresponding software) having a membrane estimator that has undergone a secondary learning process may be provided or delivered to a user.
- the parameter set that has undergone the secondary learning process may be provided from the cloud (server) on the Internet to the information processing apparatus on the user side.
Landscapes
- General Physics & Mathematics (AREA)
- Engineering & Computer Science (AREA)
- Physics & Mathematics (AREA)
- Immunology (AREA)
- Health & Medical Sciences (AREA)
- Biochemistry (AREA)
- General Health & Medical Sciences (AREA)
- Chemical & Material Sciences (AREA)
- Life Sciences & Earth Sciences (AREA)
- Pathology (AREA)
- Analytical Chemistry (AREA)
- Computer Vision & Pattern Recognition (AREA)
- Theoretical Computer Science (AREA)
- Image Analysis (AREA)
- Investigating Or Analysing Biological Materials (AREA)
- Apparatus Associated With Microorganisms And Enzymes (AREA)
- Analysing Materials By The Use Of Radiation (AREA)
- Image Processing (AREA)
Abstract
生物組織画像処理装置は、機械学習型の膜推定器を有する。膜推定器により、複数の元画像から複数の膜尤度マップが生成される。複数の膜尤度マップから複数の仮膜画像が生成される。作業ウインドウ(100)内に、選択された深さに対応する仮膜画像(作業対象画像)がカラー表示される。作業ウインドウ(100)内には、深さ選択ツール(108)が含まれ、膜追加用ボタン(118)及び膜削除用ボタン(120)も含まれる。
Description
本開示は生物組織画像処理装置及び方法に関する。
生物組織の三次元構造を解析し又はそれをイメージングするための手法として、三次元顕微鏡法が知られている。三次元顕微鏡法においては、一般に、電子顕微鏡又は光学顕微鏡が用いられる。例えば、走査型電子顕微鏡(Scanning Electron Microscope)を用いた三次元顕微鏡法として、Focused Ion Beam SEM(FIB-SEM)法、Serial Block-Face SEM(SBF-SEM)法、及び、連続切片SEM(Serial Section SEM)法(非特許文献1を参照)が提案されている。連続切片SEM法は、アレイトモグラフィ(Array-tomography)法とも呼ばれている。
連続切片SEM法では、生物組織の試料から、深さ方向に連なる複数の試料切片(極薄片)が切り出され、それらが基板上に配列される。基板上の各試料切片が走査型電子顕微鏡により順次観察され、これにより複数の画像が取得される。取得された複数の画像に基づいて、生物組織に含まれる特定の器官(細胞、ミトコンドリア、核等)の三次元構造が解析され、あるいは、それがイメージングされる。連続切片SEM法によれば、既に観察した試料切片を再び観察することが可能である。
甲賀ほか「連続切片SEM法とゴルジ装置の3D構造解析への応用」顕微鏡,49巻3号,2014.
上記のように、生物組織について、その三次元構造を解析又はイメージングする場合、生物組織における複数の深さに位置する面又は層が観察され、これにより複数の深さに対応する複数の画像が取得される。その上で、各画像に対して、注目要素(Target Component)を検出又は識別する処理が適用される。ここで、注目要素は、画像処理に際して、検出対象又は識別対象となる特定の組織構成要素(又は細胞構成要素)である。最終的な解析対象又は画像化対象が注目要素とされてもよいし、最終的な解析対象又は画像化対象とは別の組織構成要素が注目要素とされてもよい。後者の例を挙げると、細胞膜に囲まれた細胞内腔(細胞質)の画像化に際しては、最初に、細胞膜が注目要素として検出又は識別される。
多数の画像において注目要素を検出又は識別する処理の全部を手作業で行うのは非常に大変である。その処理を機械学習型の推定器に行わせることが考えられる。しかし、生物組織は非常に複雑な三次元構造を有しており、また、それには個体差もある。推定結果としての複数の注目要素画像を、目視観察しながら、必要に応じて、マニュアル修正することが必要となる。その作業を支援する手段又はツールの実現が望まれている。なお、時間軸上において並ぶ複数の注目要素画像についても、それらのマニュアル修正を支援する手段又はツールの実現が望まれている。
本開示の目的は、生物組織画像処理において、空間軸上又は時間軸上で連なる複数の注目要素画像に対するマニュアル修正を支援することにある。あるいは、本開示の目的は、生物組織画像処理において、複数の注目要素画像に対するマニュアル修正を効率的に又は正確に行えるようにすることにある。
本開示に係る生物組織画像処理装置は、生物組織の観察により得られた空間軸上又は時間軸上で連なる複数の元画像に対して前記生物組織に含まれる注目要素を推定する処理を適用する機械学習型の推定器を含み、前記複数の元画像から複数の注目要素画像を生成する画像生成部と、前記複数の注目要素画像の中からユーザー選択された空間軸上又は時間軸上の位置に対応する特定の注目要素画像を取り出してそれを作業対象画像として表示し、当該作業対象画像に対するユーザーの修正を前記特定の注目要素画像へ反映させる作業支援部と、を含むものである。
本開示に係る生物組織画像処理方法は、機械学習型の膜推定器に対して、生物組織の顕微鏡観察により得られた複数の深さに対応する複数の元画像を入力し、これにより前記複数の深さに対応する複数の膜尤度マップを得る工程と、前記複数の膜尤度マップに基づいて、前記複数の深さに対応する複数の膜画像を得る工程と、前記複数の膜画像の中からユーザーにより選択された深さに対応する特定の膜画像を取り出してそれを作業対象画像として表示し、当該作業対象画像に対するユーザーの修正を前記特定の膜画像へ反映させる工程と、を含むものである。
上記方法は、ハードウエアの機能又はソフトウエアの機能として実現され、後者の場合、その機能を実行するプログラムが、ネットワーク又は可搬型記憶媒体を介して、情報処理装置へインストールされる。情報処理装置の概念には、パーソナルコンピュータ、電子顕微鏡システム、光学顕微鏡システム等が含まれる。
(A)実施形態の概要
実施形態に係る生物組織画像処理装置には、機械学習型の推定器を含む画像生成部、及び、作業支援部が含まれる。機械学習型の推定器は、生物組織の観察により得られた空間軸上又は時間軸上で連なる複数の元画像に対して、生物組織に含まれる注目要素(より正確には注目要素の像)を推定する処理を適用するものである。この処理により、複数の元画像から複数の注目要素画像が生成される。作業支援部は、複数の注目要素画像の中からユーザー選択された位置に対応する特定の注目要素画像を取り出して、それを作業対象画像として表示し、作業対象画像に対するユーザーの修正を特定の注目要素画像へ反映させるものである。
実施形態に係る生物組織画像処理装置には、機械学習型の推定器を含む画像生成部、及び、作業支援部が含まれる。機械学習型の推定器は、生物組織の観察により得られた空間軸上又は時間軸上で連なる複数の元画像に対して、生物組織に含まれる注目要素(より正確には注目要素の像)を推定する処理を適用するものである。この処理により、複数の元画像から複数の注目要素画像が生成される。作業支援部は、複数の注目要素画像の中からユーザー選択された位置に対応する特定の注目要素画像を取り出して、それを作業対象画像として表示し、作業対象画像に対するユーザーの修正を特定の注目要素画像へ反映させるものである。
上記構成によれば、空間軸上又は時間軸上の位置を選択すると、選択された位置に対応する特定の注目要素画像が作業対象画像として表示される。表示された作業対象画像を修正すれば、その修正が作業対象画像つまり特定の注目要素画像に反映される。修正作業過程において、例えば、空間軸上又は時間軸上で隣接する2つの注目要素画像を対比したい場合、空間軸上又は時間軸上で隣接する2つの位置を交互に選択すればよい。具体的には、例えば、空間軸上のある深さから浅い側又は深い側へ、深さを順次選択しながら、表示された個々の作業対象画像に対して必要な修正を施すようにしてもよい。このように、上記構成によれば、複数の位置に対応する複数の注目要素画像を修正する場合に、作業効率を高められ、あるいは、作業の正確性を高められる。実施形態においては、空間軸としての深さ軸上において並ぶ複数の元画像が推定器に入力されるが、時間軸上において並ぶ複数の画像が推定器に入力されてもよい。
注目要素は、特定の組織構成要素又は特定の細胞構成要素であり、実施形態において、注目要素は細胞膜である。細胞膜によって囲まれた細胞内腔(細胞質)、細胞内の小器官(オルガネラ(Organelle))等が注目要素とされてもよい。機械学習型の推定器は、例えばCNNで構成されるが、他のタイプの機械学習型の推定器が利用されてもよい。実施形態において、作業支援部は、推定器の学習過程で推定器に与えられる正解画像を生成する場合においても利用され得る。実施形態においては、連続切片SEM法(アレイトモグラフィ法)により複数の元画像が取得されているが、FIB-SEM法、SBF-SEM法、その他の手法により複数の元画像が取得されてもよい。各注目要素画像を修正するユーザーは、通常、生物組織について一定の知識を有する専門家である。他の者において各注目要素画像が修正されてもよい。
実施形態において、推定器は、複数の元画像に基づいて複数の注目要素尤度マップを生成し、画像生成部は、複数の注目要素尤度マップに基づいて複数の注目要素画像を生成する画像生成器を含む。すなわち、実施形態において、画像生成部は、推定器と、画像生成器と、により構成される。それら全体が機械学習型推定部により構成されてもよい。画像生成器は例えば二値化器により構成される。
実施形態において、作業支援部は、作業対象画像を含む作業ウインドウを表示し、作業ウインドウには、位置を選択する際に操作される位置選択用表示要素が含まれる。この構成によれば、位置選択用表示要素を操作することにより、位置を簡便に選択できる。位置選択用表示要素として、所定の軸上をスライド運動する表示要素としてのスライダを有するものを採用するのが望ましい。そのような構成によれば、選択する位置を直感的に認識し易くなり、操作性を向上できる。実施形態において、位置選択用表示要素は深さ選択用表示要素である。
実施形態において、作業ウインドウには、更に、作業対象画像の内容を追加する際に操作される追加用表示要素と、作業対象画像の内容を削除する際に操作される削除用表示要素と、が含まれる。例えば、作業対象画像として細胞膜を示す膜画像が表示されている状態において、追加用表示要素の操作によって膜画像中における膜途切れ部分に複数の膜画素が補間され、一方、削除用表示要素の操作によって膜画像中における誤推定部分(例えばミトコンドリアの膜に相当する複数の膜画素)が削除される。
実施形態において、作業ウインドウには、更に、作業対象画像に対して所定単位でラベリングを行う際に操作されるラベリング用表示要素が含まれる。ラベリングは、三次元の繋がり関係を管理するための属性付け、つまりラベル付けである。例えば、ある深さにおける細胞内領域と他の深さにおける細胞内領域が同じ細胞に属すると判断された場合、それらの領域に対して同じラベルが与えられる。その作業はアノテーションに相当するものである。実施形態においては、作業対象画像の修正を行いつつ、ラベリングを行えるので、作業効率を高められる。ラベリングが自動的に行われてもよい。あるいは、ラベリングに際して1又は複数の候補が自動的に選定及び提示されてもよい。
実施形態において、作業支援部は、作業対象画像の表示に際し、その背景画像として、選択された位置に対応する特定の元画像を同時に表示する機能を有する。この構成によれば、元画像を参照しながら、作業対象画像を修正し又はラベル付けすることが可能となるので、その作業性又はその正確性を高められる。合成表示される元画像及び作業支援画像を相互に識別できるように、望ましくは、それらの内で一方の画像が白黒で表示され、それらの内で他方がカラーで表示される。
実施形態において、作業支援部は、作業対象画像を表示する機能に加えて、選択された位置に対応する特定の元画像を表示する機能、及び、選択された位置に対応する特定の注目要素尤度マップを表示する機能を有する。元画像が表示されれば、その元画像を参考にしながら、作業対象画像を修正することが可能となる。また、注目要素尤度マップが表示されれば、推定器の推定結果の妥当性や二値化処理の結果等の妥当性を評価することが可能となる。実施形態においては、作業支援部により、複数の元画像からなる第1の画像スタック、複数の注目要素尤度マップからなる第2の画像スタック、及び、複数の注目要素画像からなる第3の画像スタック、の3つのスタックが相互に対応付けられながら管理される。
実施形態において、作業支援部は、選択された位置に対応する、特定の元画像、特定の注目要素尤度マップ、及び、特定の注目要素画像の内のいずれかの画像の表示に際し、当該画像に対して、当該画像と同じ種類の画像であって、選択された位置とは異なる位置に対応する他の画像を重ねて表示する機能を有する。空間軸上又は時間軸上の組織の連続性から、当該軸上において並ぶ複数の画像を同時に重ねて表示すれば、相互の対比から、修正の要否を的確に判断することが可能となる。また、そのような重合表示によれば、ラベル付けを正確に行うことが可能となる。重合表示に際しては、少なくとも上側の画像の透過度を可変できるように構成するのが望ましい。空間軸上又は時間軸上において連なる3枚以上の画像が重ね合わされてもよい。
実施形態において、作業支援部は、複数の注目要素画像に対するラベル付け結果に基づいて、そのラベル付け結果を表す三次元像を作成しその三次元像を表示する三次元像処理部を有する。この構成によれば、三次元像を観察しながら、作業対象画像の修正やラベル付け結果の修正を行える。三次元像によれば、各深さで行われた修正やラベル付けの結果の適否を容易に判断することが可能となる。例えば、ラベル付けが誤っている場合、三次元像が不自然に歪んだり、三次元像において不自然な欠損部又は突起部が生じたりする。そのような情報に基づいてラベル付け結果等が修正される。
実施形態において、作業支援部は、複数の注目要素画像の中における第1の注目要素画像に対するラベル付け結果に基づいて、複数の注目要素画像の中における第2の注目要素画像の中から1又は複数のラベル付け候補を選定する候補選定部を有する。この構成は、空間軸又は時間軸上の組織の連続性を前提として、ある位置でのラベル付け結果を、他の位置でのラベル付けに役立てるものである。この構成によれば、ラベル付けに際してのユーザーの負担が軽減される。
実施形態において、候補選定部は、第1の注目要素画像においてラベル付けされた部分と、第2の注目要素画像に含まれる各ラベル付け候補と、の間における類似度に基づいて、各ラベル付け候補の表示態様を変化させる。この構成によれば、各ラベル付け候補の表示態様から、繋がり可能性の大小を直感的に認識できるので、ユーザーによるラベル付けを支援することが可能となる。
実施形態に係る生物組織画像処理装置は、生物組織の観察により得られた空間軸上又は時間軸上で連なる複数の元画像に対して生物組織に含まれる特定の膜を推定する処理を適用し、これにより複数の位置に対応する複数の第1膜尤度マップを生成する機械学習型の第1膜推定器と、第1膜推定器とは異なるタイプの機械学習型の膜推定器であって、複数の元画像に対して特定の膜を推定する処理を適用し、これにより複数の第2膜尤度マップを生成する機械学習型の第2膜推定器と、複数の第1膜尤度マップに基づいて複数の位置に対応する複数の膜画像を生成する画像生成器と、複数の注目要素画像の中からユーザーにより選択された位置に対応する特定の注目要素画像を取り出してそれを作業対象画像として表示する作業支援部であって、複数の第1膜尤度マップと複数の第2膜尤度マップの差分に基づいて作業対象画像に含まれる修正候補を識別表示する作業支援部と、を含むものである。
上記構成は、2種類の機械学習型の膜推定器を併用するものである。2つの膜推定器の推定結果が解離している部分について、ユーザーに対して修正を促せる。なお、膜以外の注目要素が推定対象とされてもよい。3種類以上の膜推定器が利用されてもよい。
上記の推定器を含むN(但しNは3以上の整数)個の注目要素推定器を設け、N個の注目要素推定器から出力されたN個の注目要素尤度マップに基づいて作業対象画像に含まれる修正候補を特定しそれを識別表示してもよい。その場合、N個の注目要素尤度マップに基づいて、画素ごとに注目要素尤度のばらつき情報を演算し、そのばらつき情報に基づいて修正候補となる画素を特定するようにしてもよい。ばらつき情報は例えば標準偏差である。
実施形態に係る生物組織画像処理装置は、生物組織の観察により得られた空間軸上又は時間軸上で連なる複数の元画像に対して生物組織に含まれる細胞膜を推定する処理を適用し、これにより複数の位置に対応する複数の膜尤度マップを生成する機械学習型の第1推定器と、第1推定器と一体化又は別体化された推定器であって、複数の元画像に対して生物組織に含まれるオルガネラを推定する処理を適用し、これにより複数のオルガネラ尤度マップを生成する機械学習型の第2推定器と、複数のオルガネラ尤度マップに基づいて、複数の膜尤度マップを補正する補正部と、補正後の複数の膜尤度マップに基づいて複数の位置に対応する複数の膜画像を生成する画像生成器と、複数の膜画像の中からユーザーにより選択された位置に対応する特定の膜画像を取り出してそれを作業対象画像として表示する作業支援部と、を含むものである。
上記構成は、細胞膜以外の注目要素としてのオルガネラ(細胞内小器官)を別途推定し、その推定結果を膜尤度マップの補正で利用するものである。細胞膜の推定に際しては、オルガネラ又はその膜が誤認対象となりやすい。上記構成は、オルガネラ又はその膜を別途推定し、その推定結果に基づいて、膜尤度マップを優良化するものである。単一の推定器が第1推定器及び第2推定器として機能してもよい。第1推定器と第2推定器がそれぞれ別々の推定器により構成されてもよい。なお、細胞膜とオルガネラとの組み合わせ以外の組み合わせに対して、上記同様の構成を適用することも考えられる。3つ以上の推定対象が並列的に推定されてもよい。
実施形態においては、推定器の学習過程には、一次学習過程及び二次学習過程が含まれ、二次学習過程では作業支援部による修正を経た複数の注目要素画像が推定器に与えられる。すなわち、推定器の学習過程及びその後の画像処理過程の両方において作業支援部が機能する。
(B)実施形態の詳細
図1には、実施形態に係る生物組織画像処理システムが示されている。図示された生物組織画像処理システム10は、生物組織について、三次元構造の解析やイメージングを行うためのシステムである。この生物組織画像処理システムを利用して、例えば、人体又は動物の脳内の神経細胞を三次元的に表現した画像が生成される。生物中の任意の組織、器官、その他が解析対象又はイメージング対象になり得る。
図1には、実施形態に係る生物組織画像処理システムが示されている。図示された生物組織画像処理システム10は、生物組織について、三次元構造の解析やイメージングを行うためのシステムである。この生物組織画像処理システムを利用して、例えば、人体又は動物の脳内の神経細胞を三次元的に表現した画像が生成される。生物中の任意の組織、器官、その他が解析対象又はイメージング対象になり得る。
図1に示す構成例において、生物組織画像処理システム10は、試料前処理装置12、連続切片作成装置14、走査型電子顕微鏡(SEM)16、及び、生物組織画像処理装置18によって構成されている。
試料前処理装置12は、生体から取り出された組織20に対して前処理を行う装置であり、又は、その前処理のための各種の器具に相当する。前処理として、固定処理、染色処理、導電処理、樹脂包埋処理、整形処理等が挙げられる。それらの全部又は一部が、必要に応じて、実施される。染色処理においては四酸化オスミウム(osmium tetroxide)、酢酸ウラン(uranium acetate)、クエン酸鉛(lead citrate)等が用いられてもよい。染色処理が以下に説明する各試料切片に対して行われてもよい。前処理に含まれる一部又は全部の工程が手作業によって行われてもよい。
連続切片作成装置14は、SEM16の外部に設けられ、あるいは、SEM16の内部に設けられる。連続切片作成装置14により、前処理後のキュービック状の試料から、深さ方向(Z方向)に並ぶ複数の試料切片24が切り出される。その際には、ウルトラミクロトーム(Ultramicrotome)等の装置が利用されてもよい。その作業が手作業で行われてもよい。複数の試料切片24により、試料切片群22が構成される。実際には、切り出された複数の試料切片は、基板28上に所定の配列で配置される。基板28は、例えば、ガラス基板、シリコーン基板である。図1においては、基板28上に、2つの試料切片列からなる試料切片アレイ22Aが構成されているが、それは例示に過ぎない。基板28及び試料切片アレイ22Aにより、試料ユニット26が構成される。
ちなみに、個々の試料切片24における縦及び横のサイズは、例えば、nmオーダー又はμmオーダーである。それ以上のサイズ(例えばmmオーダーのサイズ)を有する試料切片24が作製されてもよい。個々の試料切片24の厚み(Z方向のサイズ)は、例えば、数nm~数百nmの範囲内にあり、実施形態においては、その厚みは例えば30~70nmの範囲内にある。本願明細書において挙げる数値はいずれも例示である。
SEM16は、電子銃、偏向器(走査器)、対物レンズ、試料室、検出器34等を有している。試料室内には、試料ユニット26を保持するステージ、及び、そのステージを移動させる移動機構、が設けられている。SEM16内の制御部により、移動機構の動作つまりステージの移動が制御される。具体的には、試料切片アレイ22Aの中から選択された特定の試料切片24に対して電子ビーム30が照射される。照射位置を走査(例えばラスタースキャン)させながら、各照射位置から放出される反射電子32が検出器34で検出される。これによりSEM画像が形成される。これが試料切片24ごとに実行される。その結果として、複数の試料切片24の観察結果である複数のSEM画像38が得られる。複数のSEM画像38はSEM画像スタック36を構成する。
なお、Z方向に直交する方向をX方向と定義し、Z方向及びX方向に直交する方向をY方向と定義した場合、望ましくは、X方向観察範囲及びY方向観察範囲が互いに一致するように、各試料切片24における観察範囲(電子ビーム二次元走査範囲)が定められる。反射電子32ではなく、二次電子等が検出されてもよい。SEM16内の制御部は、電子ビーム30を形成するための加速電圧を可変する機能も備えている。生物組織、生物組織中の観察対象、観察目的等に応じて、電子ビーム形成時の加速電圧が切り替えられてもよい。一般に、後述する膜推定器の学習過程及びその後の生物組織の解析過程では同じ加速電圧が設定される。
上記のSEM画像スタック36は、Z方向における複数の深さ(深さ軸上の複数の深さ)に対応する(換言すればデータ記憶空間内でZ方向に並ぶ)複数のSEM画像38により構成される。各SEM画像38は、生物組織画像処理装置18側から見て、元画像又は入力画像である。各SEM画像38は電子データであり、各SEM画像がSEM16から生物組織画像処理装置18へ、ネットワーク又は可搬型記憶媒体を介して、伝送される。
生物組織画像処理装置18は、図示の構成例において、パーソナルコンピュータによって構成されている。生物組織画像処理装置18がSEM16内に組み込まれてもよく、生物組織画像処理装置18がSEM16等を制御するシステムコンピュータ内に組み込まれてもよい。生物組織画像処理装置18によりSEM16が制御されてもよい。
生物組織画像処理装置18は、本体40、表示器46及び入力器48を有している。本体40が有する複数の機能については、後に、図2以降の各図に基づいて詳しく説明する。図1においては、本体40が発揮する代表的な2つの機能(膜推定機能及び加工機能)がそれぞれブロックとして表現されている。具体的には、本体40は、機械学習型の膜推定器42及び加工ツールユニット(作業支援部)44を有している。表示器46は、LCD、有機EL表示デバイス等によって構成される。入力器48は、ユーザーによって操作されるキーボード、ポインティングデバイス等によって構成される。
図2には、本体40についての第1構成例が示されている。本体40は、機械学習型の膜推定器42、二値化器(画像生成器)50、加工ツールユニット(作業支援部)44、ボリュームデータ処理部56、等を有する。加工ツールユニット44は、修正部52及びラベリング処理部54を有している。ボリュームデータ処理部56は、解析部56A及びレンダリング部56Bを有している。
図2に示される各構成の実体は、ユーザーの作業又は行為に相当する部分を除いて、基本的に、CPU、GPU等の汎用プロセッサによって実行されるソフトウエアつまりプログラムである。もっとも、それらの構成の一部又は全部が専用プロセッサ又は他のハードウエアによって構成されてもよい。生物組織画像処理装置が有する機能の全部又は一部がネットワーク上に存在する1又は複数の情報処理デバイスにより実行されてもよい。以下、本体40内の各構成について詳述する。
膜推定器42は、膜推定手段として機能する。膜推定器42は、入力された元画像(SEM画像)58に対して膜推定処理を適用し、これによって膜尤度マップ60を出力するものである。図示の構成例において、膜推定器42は、CNN(Convolutional Neural Network)により構成されている。その具体的な構成例については後に図3を用いて説明する。CNNによって膜が正しく推定されるように、CNNの実際の稼働に先立って、CNN学習過程が事前に実行される。その学習過程には、一次学習過程(初期学習過程)と、二次学習過程と、が含まれる。
一次学習過程では、教師データを構成する複数の画像ペアが膜推定器42に与えられ、これにより膜推定器42内のCNNパラメータ群が優良化(最適化)される。すなわち、膜推定器42内に機械学習結果が蓄積される。ここで、個々の画像ペアは、元画像(SEM画像)58とそれに対応する正解画像68とにより構成される。正解画像68は、例えば、元画像58に対する手作業により作成される。教師なし機械学習器、簡易な識別器(例えばSVM(Support Vector Machine))等によって、元画像58から正解画像68が作成されてもよい。この場合、かかる識別器に対して元画像58を入力し、その出力に基づいてユーザーにおいて識別器がある程度働いていると判断できた場合に、その出力を正解画像68として利用してもよい。一定の一次学習過程を経た膜推定器42の出力に基づいて正解画像68が作成されてもよい。
続く二次学習過程では、一次学習過程を経て膜推定器42がある程度働くことを前提として、膜推定器42に対して、一次学習過程と同様に、教師データとして複数の画像ペアが与えられる。実施形態においては、その教師データは、一次学習過程で利用された複数の画像ペアと二次学習過程で追加された複数の画像ペアとにより構成される。追加される各画像ペアは、元画像58とそれに対応する正解画像64Aとからなる。正解画像64Aは、膜推定器42から加工ツールユニット44までの構成により、生物画像処理装置自身によって作成される。具体的には、元画像58を膜推定器42に入力すると、膜推定器42から推定結果画像として膜尤度マップ60が出力される。膜尤度マップ60に基づく仮膜画像の生成、及び、加工ツールユニット44を利用した仮膜画像62に対するユーザー(専門家)修正を経て、正解画像64Aが作成される。個々の処理については後に詳述する。仮膜画像62を正解画像62Aとして利用することも考えられる。二次学習過程により、膜推定器42内のCNNパラメータ群が更に優良化される。つまり、膜推定器42内に機械学習結果が更に蓄積される。二次学習過程は、例えば、元画像58に対する推定処理の結果が、元画像58に対応する正解画像68,64Aに十分に類似したと判断された場合に終了する。その後、必要に応じて、上記同様の手法により、膜推定器42の再学習が実行される。
二次学習過程では、膜推定結果を基礎として正解画像を作成できるので、元画像から正解画像の全部を手作業で作成する場合に比べ、ユーザーの負担が大幅に軽減される。二次学習過程後における必要な学習過程においても同様である。なお、一次学習過程及び二次学習過程において、膜推定器42に対し、複数の画像ペアが一括して与えられて、それがバッチ処理されてもよい。
データベース57には、複数の元画像58、複数の正解画像68,68A等が格納される。膜推定器42とデータベース57とが一体化されてもよい。機械学習型の膜推定器として、U-netが利用されてもよく、また、SVM、ランダムフォレスト等が利用されてもよい。
二値化器50は、画像生成器として機能するものである。具体的には、二値化器50は、後に図4を用いて例示するように、膜尤度マップ60に対する二値化処理により、仮膜画像62を生成するモジュールである。膜尤度マップ60は、二次元配列された複数の膜尤度からなる。個々の膜尤度は、膜である確からしさ(確率)を示す数値である。膜尤度は例えば0から1の間をとる。膜尤度マップ60を膜尤度画像として捉えることもできる。実施形態において、二値化器50には閾値が設定されており、二値化器50は閾値以上の膜尤度を1に変換し、閾値未満の膜尤度を0に変換する。その結果として生成される画像が仮膜画像62である。実施形態においては、便宜上、修正前の膜画像を修正後の膜画像から区別するために、修正前の膜画像を仮膜画像62と呼んでいる。
なお、膜推定器42及び二値化器50の両者により画像生成部61が構成される。画像生成部61の全体がCNN等により構成されてもよい。その場合でも、膜尤度マップ及び仮膜画像の段階的な生成を観念できる。仮膜画像62を正解画像62Aとして用いることも可能である。二値化処理前に、膜尤度マップ60に対して、ノイズ除去、エッジ強調等の処理が適用されてもよい。
加工ツールユニット44は、作業支援部又は作業支援手段として機能するものである。加工ツールユニット44は、情報処理の観点から見て、表示処理機能及び画像処理機能を有している。作業の観点から見て、修正機能及びラベリング機能を有しており、図2においては、それらの機能が修正部52及びラベリング処理部54として表現されている。加工ツールユニット44が発揮する具体的な複数の機能については後に図5を用いて整理する。ここでは、その概要又はその主要な機能について説明する。
修正部52は、後に図6において例示する作業ウインドウを介して、ユーザーに対して作業対象となった仮膜画像を作業対象画像として表示し、また、作業対象画像上におけるユーザーの修正指示を受け付けるものである。修正内容は作業対象画像となった仮膜画像に反映される。作業対象画像内に例えば膜の途切れ部分が含まれる場合、その途切れ部分に対して膜画素群が追加される。作業対象画像内に例えば膜以外の部分が含まれ、その部分が膜として誤認されている場合、その部分を構成する膜画素群が削除される。そのような追加及び削除に際し、ユーザーの作業又は操作を支援し各仮膜画像を管理するモジュールが修正部52である。
図示の構成例においては、修正部52(又は加工ツールユニット44)に対して、生成された仮膜画像62の他に、入力された元画像58、及び、生成された膜尤度マップ60も順次入力されている。これにより、作業対象画像としての仮膜画像と共に、又はそれに代えて、作業対象画像に対応する元画像58又は膜尤度マップ60を表示することが可能である。これに関しては、後に図7、8を用いて説明する。修正部52において実行される補間処理については、後に図9、10等を用いて説明する。
ラベリング処理部54は、修正後の膜画像(又は修正未了の膜画像)に含まれる個々の領域(細胞内腔)に対して、ラベリング(ペイント及びラベル付け)を行うためのモジュールである。ラベリングには、ユーザーによるマニュアルでのラベリング、及び、自動的なラベリングがある。ラベリングについては、後に図12、13を用いて説明する。ラベリング結果を管理するための管理テーブルについては、後に図14に例示する。修正作業及びラベリング作業が完了した段階で、細胞内腔とそれ以外とが区別された三次元ラベリングデータ66が構成される。それがボリュームデータ処理部56へ送られる。
ボリュームデータ処理部56には、図示の構成例において、複数の元画像からなる元画像スタック(SEM画像スタック)36が入力されている。元画像スタック36はボリュームデータを構成するものである。また、ボリュームデータ処理部56には、上記のように、三次元ラベリングデータ66も入力されている。それもボリュームデータの一種である。
解析部56Aは、例えば、三次元ラベリングデータ66に基づいて、対象器官(例えば神経細胞)を解析する。例えば、形態、体積、長さ等が解析されてもよい。その際、三次元ラベリングデータを参照しながら元画像スタック36が解析される。レンダリング部56Bは、三次元ラベリングデータ66に基づいて、三次元画像(立体的表現画像)を形成するものである。例えば、三次元ラベリングデータ66に基づいて、元画像スタック36の中から画像化部分が抽出され、それに対してレンダリング処理が適用されてもよい。
既に説明した二次学習過程においては、修正後の各膜画像64がそれぞれ正解画像64Aとして膜推定器42に入力される。各正解画像64Aの作製に際して、膜推定器42による推定結果を利用することができるので、且つ、加工ツールユニット44を利用することができるので、それらを利用しない場合に比べて、各正解画像64Aの作製負担が大幅に削減される。すなわち、上記構成によれば、膜推定器42の学習過程で要する労力及び時間を削減することが可能である。二次学習過程後の解析過程においては、膜推定器42及び加工ツールユニット44の併用により、解析対象又はレンダリング対象となる画像群の品質を高められ、また、その画像群を簡便かつ迅速に生成することが可能である。後に説明するように、加工ツールユニット44は、三次元像処理部(三次元像生成手段)及び候補選定部(候補選定手段)としても機能する。
図3には、膜推定器42の構成例が模式的に示されている。膜推定器42は、多数の層を有しており、それには、入力層80、畳み込み層82、プーリング層84、出力層86等が含まれる。それらはCNNパラメータ群88に従って作用する。CNNパラメータ群88には、多数の重み係数、多数のバイアス値、その他が含まれる。CNNパラメータ群88は最初に初期値群94によって構成される。例えば、乱数等を利用して初期値群94が生成される。
学習過程では、評価部90及び更新部92が機能する。例えば、評価部90は、教師データを構成する複数の画像ペア(元画像58とそれに対応する正解画像68,64A)に基づいて評価値を計算するものである。具体的には、元画像58に対する推定処理の結果60Aと元画像58に対応する正解画像68,64Aとを誤差関数に順次与えることにより評価値が演算される。更新部92は、その評価値が良い方向に変化するように、CNNパラメータ群88を更新する。それを繰り返すことによって、CNNパラメータ群88が全体的に最適化される。実際には、評価値が一定値に到達した時点で、学習過程の終了が判断される。図3に示した構成は単なる例示に過ぎず、膜推定器42として、多様な構造を有する推定器を利用することが可能である。
図4には、二値化器の作用が示されている。膜推定器から膜尤度マップ60が出力される。膜尤度マップ60は、複数の画素に相当する複数の膜尤度60aからなるものであり、個々の膜尤度60aは膜であることの確からしさを示す数値である。符号50Aで示すように、二値化器は膜尤度マップ60を二値化し、これにより二値化画像としての仮膜画像62を生成する。二値化に際しては、個々の膜尤度60aが閾値と比較される。例えば、閾値以上の膜尤度60aが値1を有する画素62aに変換され、閾値未満の膜尤度60aが値0を有する画素62bに変換される。画素62aが膜を構成する画素(膜画素)として取り扱われる。閾値はユーザーにより可変設定し得る。その設定が自動化されてもよい。例えば、仮膜画像62を観察しながら閾値が可変されてもよい。
図5には、加工ツールユニットが有する複数の機能が整理されている。上段(A)には修正部が有する複数の機能が示されており、下段(B)にはラベリング処理部が有する複数の機能が示されている。それらの機能の詳細又は具体例については、図6以降の各図を参照しながら説明する。ここでは、それらの機能について概説する。
まず、修正部の機能について説明する。仮膜画像に対する修正には、大別して、マニュアル修正(A1)と自動修正(A2)とがある。マニュアル修正(A1)では、修正ツールとしての仮想的なペン及び仮想的な消しゴムが利用される。ペンは膜を描く(非膜画素を膜画素に転換する)ための修正ツールであり、消しゴムは膜を消去する(膜画素を非膜画像に転換する)ための修正ツールである。他の修正ツールが設けられてもよい。
マニュアル修正(A1)に際しては、(A11)で示されるように、ユーザーによって選択された深さに対応する仮膜画像が作業対象画像としてカラーで表示される。その際、背景画像として、選択された深さに対応する元画像が白黒画像として表示される。(A12)で示されるように、選択された深さを基準として、深さ方向に並んだ同種の複数の画像(元画像、膜尤度マップ又は仮膜画像)を重ねて表示することも可能である。更に、(A13)で示されるように、マニュアル修正作業を支援するために、修正候補が表示されてもよい。
自動修正(A2)では、仮膜画像に含まれる膜途切れ部分が自動的に補間される。具体的には、ユーザー指定された2点の間が自動的に連結される。そのために幾つかの機能が用意されており、必要に応じて、それらの中からいずれかの機能が選択される。例えば、(A21)で示されるように、作業対象画像(仮膜画像)に基づいて、作業対象画像上の2点間が補間されてもよい。(A22)で示されるように、作業対象画像に対応する元画像に基づいて、作業対象画像上の2点間が補間されてもよい。(A23)で示されるように、作業対象画像に対応する尤度マップに基づいて、作業対象画像上の2点間が補間されてもよい。(A24)で示されるように、深さ方向に連なる複数の画像(元画像、膜尤度マップ又は仮膜画像)に基づいて、三次元補間が実行されてもよい。
次に、ラベリング処理部の機能について説明する。ラベリング方法として、マニュアルラベリング(B1)と、自動ラベリング(B2)とがある。
マニュアルラベリング(B1)では、ラベリングツールが利用され、ユーザーによって特定の領域(閉領域)がラベリング対象として指定される。すると、その領域がペイント処理され、また、その領域に対して固有のラベルが付与される。ラベルは、繋がり関係を管理するための識別子又は属性値である。その際、必要に応じて、(B11)で示されるように、作業対象画像上に、他の深さに対応する画像(例えば、ラベリング済みの隣接する仮膜画像)がオーバーレイ表示されてもよい。あるいは、(B12)で示されるように、深さ方向における領域間の繋がり関係が自動的に判定され、作業対象画像上に1又は複数のラベリング候補が表示されてもよい。その際に繋がり可能性の大小が自動的に判定され、その判定結果に基づいて各ラベリング候補の表示態様が制御されてもよい。
自動ラベリング(B2)においては、レイヤ間での領域の繋がり関係が自動的に判定され、これによってペイント及びラベル付けが自動的に遂行される。その場合、例えば、(B21)で示すように、ラベル付けされた特定の領域について、その代表座標を通過する垂線(Z方向に平行な仮想線)を定義し、その垂線が通過する1又は複数の領域に対して、特定の領域に付されたラベルと同じラベルを付すようにしてもよい(串刺し方式)。その場合、特定の領域が存在する深さを基準深さとして、深さ方向の両側に一定の範囲を設定し、その範囲内において自動的なラベリングが実行されてもよい。また、(B22)で示されるように、深さ方向における領域間の類似度等を基準として、レイヤ間において繋がり関係を自動的に判定し、その判定結果に基づいて自動的にラベリングを行うようにしてもよい。自動的なラベリングが実行された場合、通常、そのラベリング結果がユーザーにおいて目視確認される。
以上挙げた機能は例示であり、ユーザーによる修正作業及びラベリング作業が効率的となり、あるいは、その負担が軽減されるように、更には、三次元ラベリングデータの品質が高まるように、加工ツールユニットを構成するのが望ましい。
図6には、加工ツールユニットにより表示される作業ウインドウが例示されている。図示の例において、作業ウインドウ100は、表示画像102を含んでいる。表示画像102は、ユーザーによって選択された深さに対応する仮膜画像(作業対象画像)及び元画像からなる複合画像である。グレイスケール画像としての元画像が背景画像を構成しており、それに対して、カラー画像(例えば青色画像)としての仮膜画像(作業対象画像)が重畳表示されている。なお、図示された表示画像102は脳組織を示しており、そこには、複数の細胞の断面が現れている。同時に、細胞内の小器官(ミトコンドリア等)の断面も現れている。
タブ104が選択された場合、上記で説明した表示画像102が表示される。タブ105が選択された場合、グレイスケール画像としての元画像だけが表示される。タブ106が選択された場合、グレイスケール画像としての膜尤度マップ(膜尤度画像)だけが表示される。尤度マップの観察により、閾値が適切に設定されていること等を確認できる。また、元画像の単独表示によれば、膜の細部を詳細観察することが容易となる。作業対象画像としての仮膜画像だけを表示するタブを追加してもよい。膜尤度マップを背景画像とし、それに対して仮膜画像が重畳表示されてもよい。
深さ選択ツール108は、Z方向(つまり空間軸としての深さ軸上)において、特定の深さ(表示位置としての表示深さ)を選択するための表示要素(操作要素)である。それは、Z軸を表すZ軸シンボル108bと、Z軸シンボル108bに沿ってスライド運動するスライダとしてのマーカー108aと、からなる。マーカー108aを移動させて、所望の深さを選択することが可能である。このような深さ選択ツール108によれば、選択する深さや深さ変化量を直感的に認識し易いという利点を得られる。なお、Z軸シンボル108bの左端点が深さゼロに相当し、Z軸シンボル108bの右端点が最大深さに相当している。他の形態を有する深さ選択ツールを採用してもよい。深さ入力欄114は、深さを数値として直接的に指定するための欄である。深さ入力欄114に、マーカー108aの位置によって現在選択されている深さが数値として表示されてもよい。
透過度調整ツール110は、表示画像102が表示されている状態において、合成表示されているカラーの仮膜画像(作業対象画像)の透過度(表示重み)を調整するためのツールである。例えば、マーカー110aを左側へ移動させると、カラーの仮膜画像の表示重みが小さくなり、その透明度が上がって、元画像が支配的に表示されるようになる。逆に、マーカー110aを右側へ移動させると、カラーの仮膜画像の表示重みが大きくなり、その透明度が下がって、カラーの仮膜画像がよりはっきりと表現されるようになる。
重合表示ツール112は、現在表示されている画像(表示画像、元画像又は膜尤度マップ)に対して、深さ方向に浅い側に隣接する画像(表示画像、元画像又は膜尤度マップ)又は深さ方向に深い側に隣接する画像(表示画像、元画像又は膜尤度マップ)を重ねて表示する場合において操作されるものである。マーカー112aを左側へ移動させると、浅い側に隣接する画像に対する表示重みが大きくなり、逆に、マーカー112aを右側へ移動させると、深い側に隣接する画像に対する表示重みが大きくなる。3つ以上の画像を重ね合わせて表示してもよい。もっとも、あまり多くの画像を重ね合わせると、画像内容が複雑になり過ぎてしまうので、少数の画像を重ね合わせるのが望ましい。このような重合表示によれば、奥行き情報を得られ易くなる。
ボタン列115は、仮想的な複数のボタン116,118,120,121,122,126によって構成される。ボタン116は、画像ズーム(拡大又は縮小)を行う場合に操作される表示要素である。ボタン118は、ペンツールを利用する場合に操作される表示要素である。ボタン118をオンにすると、カーソルの形態がペン形に代わり、それを用いて膜画素の追加を行える。ペンのサイズを変更することも可能である。ボタン120は、消しゴムを利用する場合に操作される表示要素である。ボタン120をオンにすると、カーソルの形態が消しゴム形に代わり、それを用いて膜画素の削除を行える。消しゴムのサイズを変更することも可能である。
ボタン121は、ペイントを行う場合に操作される表示要素である。ボタン121をオンした上で、いずれかの領域を指定すれば、その領域が塗り潰される。また、ボタン121の操作によって、ペイント(又はラベリング)のために用意されている複数の機能の中から任意の機能を選択することも可能である。オブジェクト番号(ラベル)付けボタン122の操作により、カラーパレット124が表示される。例えば、ペイント処理済み領域に対して、カラーパレットの中から選択されたカラーが与えられる。これにより、その領域が、選択されたカラーによって着色される。個々の色がそれぞれオブジェクト番号に対応付けられている。レイヤ間にわたって複数の領域に対して同じカラーつまり同じオブジェクト番号を付与すれば、それらの領域によって特定細胞内の三次元内腔領域が画定される。
ボタン126は、白黒反転用のボタンである。それを操作すると、表示された画像において、黒く表示されていた部分が白く表示され、逆に白く表示されていた部分が黒く表示される。
上記の他、三次元像を表示させるためのボタンを設けるのが望ましい。三次元像の表示に関しては後に図15及び図16を用いて説明する。図6に示した作業ウインドウ100の内容は例示に過ぎず、ユーザー作業においてその作業性が良好になるように、その内容が適宜定められるのが望ましい。
図7及び図8に基づいて、加工ツールユニットにおける表示処理について説明する。図7に示す処理は図5において(A11)で示した表示処理に相当するものである。図8に示す処理は図5において(A12)及び(B11)で示した表示処理に相当するものである。
図7において、元画像スタック130は、Z方向(深さ方向)に並ぶ複数の元画像により構成される。膜尤度マップスタック132は、Z方向に並ぶ複数の膜尤度マップにより構成される。仮膜画像スタック134は、Z方向に並ぶ複数の仮膜画像スタックにより構成される。個々の仮膜画像は、その修正後において膜画像となるが、それは便宜上の区別であり、ここでは、修正前及び修正後を区別することなく、仮膜画像と称することにする。それらのスタック130,132,134は、加工ツールユニットによって管理され、あるいは、生物組織処理装置が有する制御部によって管理される。
元画像の表示が指定されている場合、元画像スタック130から、ユーザーによって選択された深さZiに対応する元画像130iが取り出され、それが表示器46に表示される。膜尤度マップの表示が指定されている場合、膜尤度マップスタック132から、ユーザーによって選択された深さZiに対応する膜尤度マップ132iが取り出され、それが表示器46に表示される。仮膜画像の表示が指定されている場合、仮膜画像スタック134から、ユーザーによって選択された深さZiに対応する仮膜画像134iが取り出され、それが表示器46に表示される。実際には、深さZiに対応する元画像130i上に、深さZiに対応する仮膜画像134iが合成され、その合成画像が表示器46に表示される。合成に先立って、仮膜画像134iが例えば青色のカラー画像に変換される。また合成時においては、元画像130iに対して表示重みw0が乗算され、仮膜画像134iに対して表示重みw1が乗算される。各表示重みw0、w1をユーザーにより変更し得る。
仮膜画像134iは作業対象画像であり、それに対してユーザーが修正を行うと、符号135で示されるように、その修正内容が直ちに仮膜画像134iに反映される。深さZiを変更しながら、表示された各作業対象画像に対して、修正処理及びラベリング処理が施される。その過程において、必要に応じて、元画像130i又は膜尤度マップ132iを単独で表示することも可能である。実施形態においては、リングバッファ内に過去m回分の修正内容が修正履歴として管理されており、必要に応じて、Undo操作を行える。
図8には、重合表示が選択された場合の表示処理が示されている。図7に示した構成と同様の構成には同一符号を付しその説明を省略する。図示した表示処理では、3種類の表示画像に対して重合表示処理を選択的に適用することが可能である。一部の画像だけに対して重合表示処理が適用されてもよい。
元画像の表示が指定されている場合であって、Z方向に浅い側の隣接画像の重合表示が指示された場合、元画像スタック130から、深さZiに対応する元画像130i及び深さZi-1に対応する元画像130i-1が取り出される。それらが重合されて表示される。元画像130iに対して、深さZi+1に対応する元画像130i+1を重合する場合にも、上記同様の処理が実行される。なお、追加的に表示される元画像130i-1,130i+1の透過度は、表示重みw3を可変することによって調整される。
膜尤度マップの表示が指定されている場合であって、Z方向に浅い側(又は深い側)の隣接画像の重合表示が指示された場合、膜尤度マップスタック132から、深さZiに対応する膜尤度マップ132i、及び、深さZi-1(又は深さZi+1)に対応する膜尤度マップ132i-1(又は膜尤度マップ132i+1)が取り出される。それらが重合されて、表示される。
これと同様に、仮膜画像の表示が指定されている場合であって、Z方向に浅い側(又は深い側)の隣接画像の重合表示が指示された場合、仮膜画像スタック134から、深さZiに対応する仮膜画像134i、及び、深さZi-1(又は深さZi+1)に対応する仮膜画像134i-1(又は仮膜画像134i+1)が取り出される。それらが重合されて、表示される。その場合、実際には、隣接する2つの合成画像が重合表示されることになる。合成処理後に重合処理されてもよい。
図9には、補間処理の第1例が示されている。これは図5において(A21)で示した補間処理に相当するものである。図9において、仮膜画像スタック134から深さZiに対応する仮膜画像が取り出され、それが作業対象画像140として表示される。作業対象画像140の修正過程において、ユーザーにより、膜途切れ部分146の両端が2つの点142,144により指定される。2つの点142,144の間が作業対象画像140の内容に基づいて自動的に補間される。符号148は、自動的に追加された補間線(連結線)を示している。その場合、スプライン補間その他の技術を利用し得る。なお、作業対象画像140中において、細胞膜以外の細胞構成要素が膜として検出されている場合、符号150で示されるように、それが消しゴムによって消去される。
図10には、補間処理の第2例が示されている。これは図5において(A22)で示した補間処理に相当するものである。図10において、仮膜画像スタック134から、深さZiに対応する仮膜画像が取り出され、それが作業対象画像140として表示される。作業対象画像140上において、ユーザーにより、膜途切れ部分の両端が2つの点142,144により指定される。一方、元画像スタック130から、深さZiに対応する元画像152も取り出される。その元画像152に対して必要に応じてエッジ強調処理が適用される。その上で、元画像152上において、2つの点142,144に対応する2つの点が特定され(符号154を参照)、それらの点の間が補間される(符号156を参照)。例えば、2つの点の間を結ぶ経路が探索される。その場合には公知の各種技術を利用可能である。図10において、作業対象画像140上には、探索された経路と同じ形態を有する補間線158が追加されている。経路の探索に際しては、例えば、最短経路問題を解く各種の方法を利用し得る。例えば、Dijkstra法が利用されてもよい。上記同様の手法によって三次元の経路が探索されてもよい。
図11には、修正前の仮膜画像180と修正後の仮膜画像182とが示されている。修正前の仮膜画像180には、膜途切れ部分184,188が含まれる。修正後の仮膜画像182においては、符号186及び符号190で示されているように、膜途切れ部分が補修されている。また、修正前の仮膜画像180には、非膜部分192,196が含まれている。修正後の仮膜画像182においては、符号194及び符号198で示されているように、それらの非膜部分が消失している。修正後の仮膜画像182によれば、ラベリングを的確に行うことが可能となり、ひいては、三次元ラベリングデータの品質を高めることが可能となる。
図12には、ラベリング処理に含まれる三次元繋ぎ処理が例示されている。その内容は図5において(B21)で示した処理又は(B22)で示した処理に相当するものである。図12においては、Z方向に並ぶ複数の仮膜画像D1~D4が示されている。深さZiに対応する仮膜画像D1が作業対象画像である。それが以下に説明する処理での基準画像とされる。
上記の(B21)で示した処理においては、基準画像である仮膜画像D1に含まれる領域R1について代表点が特定される。例えば、代表点として中心点、重心点等が特定される。次いで、その代表点を通過する垂線Cが定義される。基準画像から、例えば、深い側にN枚の仮膜画像が参照され、それらの画像において垂線Cが通過している各領域が特定される。そして、垂線Cが通過している領域R1,R2,R3,R4,・・・に対して、同じラベルが付与される。また、以上の処理が基準画像から浅い側のN枚の仮膜画像に対して適用されてもよい。自動的なラベリングの結果は、通常、ユーザーによって目視確認される。
上記の(B22)で示した処理においては、仮膜画像D1に含まれる領域R1(の外縁)が仮膜画像D2上に投影され、投影領域R1aが定義される。仮膜画像D2上において、投影領域R1aに対して最も重なり合う領域R2が特定される。続いて、領域R2が仮膜画像D3上に投影され、投影領域R2aが定義される。仮膜画像D3上において、投影領域R2aに対して最も重なり合う領域R3が特定される。同様に、仮膜画像D4上において、投影領域R3aが定義され、それに基づいて領域R4が特定される。領域R1、及び、それを出発点として特定された領域R2,R3,R4の全部に対して、同じラベルが付与される。
上記の処理では、投影元の領域がレイヤ変更時に逐次更新されていたが、それを固定するようにしてもよい。例えば、領域R1を仮膜画像D2,D3,D4に投影するようにしてもよい。また、上記の処理では、基準画像からZ方向の一方側に繋がり先が探索されていたが、基準画像からZ方向の両側に繋がり先が探索されてもよい。その探索範囲がユーザー選択されてもよい。いずれにしても、自動的なラベリングの結果が、通常、ユーザーによって目視確認される。その場合には、図6に示した作業ウインドウが利用される。
以上説明した三次元繋ぎ処理は例示であり、上記以外の三次元繋ぎ処理が採用されてもよい。領域間における繋がり関係の特定に際しては、領域ごとの1又は複数の特徴量が利用され得る。領域の特徴量として、面積、形態、周囲長、重心点、輝度ヒストグラム、テクスチャ、等が利用されてもよい。あるいは、領域間の特徴量として、重合面積、代表点間距離、等が利用されてもよい。
図13には、候補表示の一例が示されている。その処理は、図5において(A13)で示した処理に相当するものである。深さZiに対応する仮膜画像(作業対象画像)200上に、投影領域202が定義されている。投影領域202は、例えば、深さZi-1に対応する仮膜画像上でラベル付けされた元領域の投影により定義される領域である。仮膜画像200において、投影領域202と重なり合う複数の領域204a,204b,204cが特定される。また、投影領域202(又は元領域)と、各領域204a,204b,204cとの間で、それぞれ類似度(例えば重合面積)が演算される。各領域204a,204b,204cについて演算された各類似度に基づいて、各領域204a,204b,204cがそれぞれ異なるカラーで識別表現される。すなわち、類似度の違いが色相の違いとして識別表現される。これにより、ユーザーは、個々の領域204a,204b,204cの類似度を参考にしながら、ラベリングを行うことが可能となる。例えば、図示の例では、最も類似度の大きい領域204aに対して、元領域に付与したラベルと同じラベルが付与される。
図14には、管理テーブルが例示されている。図示された管理テーブル206は、ラベリング処理の結果を管理するためのテーブルである。管理テーブル206は、例えば、上記ラベリング処理部の中に構築される。管理テーブル206は、複数のレコード206aからなり、個々のレコード206aは1つの画素に対応している。レコード206aにおいては、画素座標、クラス、及び、ラベルが管理されている。クラスは、画素の属性として、膜、膜内部、及び、その他を識別するデータである。ラベルは、三次元データ空間内において繋がり関係を特定する数値データである。繋がり関係のある(ある細胞膜の内部の)画素群には同じラベルが付与される。
次に、図15及び図16を用いて、作業ウインドウの他の例について説明する。図15において、図6に示した構成と同様の構成には同一符号を付し、その説明を省略する。
図15において、作業ウインドウ100A内のボタン列115には、三次元像表示のためのボタン210が含まれる。ボタン210を操作すると、表示画像102上に又はそれとは別の場所に、サブ表示画像212が表示される。図示の例では、サブ表示画像212は、三次元空間を表すワイヤーフレーム(座標系を示す図形)213、及び、その内部に表現された三次元像215を含む。三次元像215は、図示の例では、3つの部分214a,214b,214cの集合体である。各部分214a,214b,214cはそれぞれ細胞内腔の三次元形態を示している。
具体的には、ラベリング処理によって生成された三次元ラベリングデータに基づいてレンダリング処理を実行することにより、立体感を有する三次元像215が生成されている。視点、光源等のパラメータはユーザーにより変更され得る。サブ表示画像212が別ウインドウの形式でポップアップ表示されてもよい。三次元像215の参照により、修正結果の妥当性やラベリング処理結果の妥当性を容易に判断することが可能となる。
サブ表示画像212には、現在選択されている深さを示す枠図形216が含まれる。作業ウインドウ100A内に含まれる深さ選択ツール108において、マーカー108aをスライド移動させると、表示されている作業対象画像の内容が変化し、同時に、枠図形216が深さ方向に運動する。枠図形216の位置を参照することによって、三次元データ空間内における作業対象レイヤを直感的に認識することが可能となる。
図16に示される三次元像226,227が表示されてもよい。三次元像226,227は、ある細胞内腔を複数のディスク228の積層体として表現したものである。このような三次元像226,227によれば、各試料切片の厚さを三次元像に反映させることが可能となる。複数のディスクに代えて複数の平板状円板を表示するようにしてもよい。
図17には、生物組織画像処理装置の本体の第2構成例が示されている。図2に示した構成と同様の構成には同一符号を付し、その説明を省略する。
本体40Aにおいて、膜推定器250は、細胞膜と他の膜(図示の構成例ではミトコンドリア膜)とを同時に推定する機能を有している。膜推定器250に対して元画像(SEM画像)58を入力すると、細胞膜の推定結果として膜尤度マップA254が出力され、同時に、ミトコンドリア膜の推定結果として膜尤度マップB258が出力される。
膜尤度マップ補正部262は、膜尤度マップBに基づいて、膜尤度マップAを補正するモジュールである。具体的には、膜尤度マップB258を構成する座標(x,y)の膜尤度bが判定閾値α以上であれば、膜尤度マップA254における座標(x,y)の膜尤度aの値が0に置換される。一方、膜尤度マップB258における座標(x,y)の膜尤度bが判定閾値αよりも小さければ、膜尤度マップA254における座標(x,y)の膜尤度aの値が維持される。膜尤度マップ補正部262から、補正後の膜尤度マップ264が出力される。二値化器50は膜尤度マップ264を二値化処理し、仮膜画像62を生成する。
二値化器50及び修正部52に対して並列に設けられた二値化器268及び修正部270は、膜尤度マップB258に基づいて正解画像272を作成するためのものである。二値化器268は、二値化器50と同様の機能を有し、膜尤度マップBから仮膜画像を生成する。修正部270は、修正部52と同様の機能を有する。修正部52により、仮膜画像がマニュアルで修正され、あるいは、自動的に修正され、これにより正解画像272が生成される。加工ツールユニット266は、修正部52、ラベリング処理部54、及び、修正部270によって構成されている。
膜推定器250における細胞膜の学習のために、元画像58とそれに対応する正解画像64A,68とが教師データとして利用される。正解画像64Aは修正部52による修正が行われた後の膜画像64であり、正解画像68は元画像から別途作成された画像である。膜推定器250におけるミトコンドリア膜についての学習のために、元画像58とそれに対応する正解画像272,274とが教師データとして利用される。正解画像272は修正部270による修正が行われた後の膜画像であり、正解画像274は元画像から別途作成された画像である。なお、教師データとして、正解画像64Aに代えて、仮膜画像62を用いることもできる。
第2構成例によれば、細胞膜の推定結果が他の推定結果により補正されるので、細胞膜の推定精度を高めることが可能となる。また、ミトコンドリア膜を示す膜画像の修正に際して、図6に示した作業ウインドウを利用することができるから、その修正作業において作業効率を高められる。
上記第2構成例では、膜尤度マップB258における膜尤度が閾値α以上である場合に補正が実行されていたが、膜尤度マップB258における膜尤度の大小に応じて補正度合いが可変されるようにしてもよい。単一の膜推定器250に代えて、細胞膜を推定する膜推定器とミトコンドリア膜を推定する膜推定器とを併設するようにしてもよい。その場合、望ましくは、2つの膜推定器がそれぞれ機械学習型の推定器で構成される。細胞膜、ミトコンドリア、及び、背景を個別的に且つ同時に推定する多クラス推定型の推定器を設けてもよい。
図18には、生物組織画像処理装置の本体の第3構成例が示されている。本体40Bは、元画像58を入力して膜推定を行う2つの機械学習型膜推定器280,282を有する。2つの機械学習型膜推定器280,282は互いに異なる構成を有し、すなわち、それらのタイプ又は方式は互いに相違する。例えば、膜推定器280は、図2に示した膜推定器42に相当し、それは例えばCNNにより構成される。膜推定器282は例えばランダムフォレストにより構成される。膜推定器280,282はいずれも細胞膜の推定を行うためのものであるが、それらの性質又は特性に相違があることから、2つの膜推定器280,282の推定結果は必ずしも同一にならない。例えば、元画像中のある部分について、膜推定器280,282の内の一方が膜と判断し、それらの内の他方も膜と判断することもあれば、膜推定器280,282の内の一方が膜と判断し、それらの内の他方が非膜と判断することもある。
処理部296は、膜推定器280から出力された膜尤度マップA284と膜推定器282から出力された膜尤度マップB286とを比較し、両者の差が大きい画素(又は画素群)を修正候補として判定するものである。図示の構成例では、処理部296から修正部306へ修正候補を特定する情報302が送られている。修正部306内に処理部296が設けられもよい。
二値化器292は、図2に示した二値化器50に相当し、それは膜尤度マップA284から仮膜画像298を生成するものである。二値化器294は、二値化器292と同様の作用を発揮するものであり、それは膜尤度マップB286から仮膜画像300を生成するものである。
加工ツールユニット304は、図2に示した加工ツールユニット44と同様の機能を有し、それは、修正部306及びラベリング処理部310を有する。修正部306は、二値化器292から出力された仮膜画像298及び二値化器294から出力された仮膜画像300に対して修正を施すためのものである。修正後の膜画像308がラベリング処理部310に送られている。その膜画像308は、正解画像312として膜推定器280へ送られている。修正後の膜画像309は、正解画像316として膜推定器282へ送られている。加工ツールユニット304は、選択された深さに対応する仮膜画像の表示に際して、あるいは、入力された仮膜画像298の表示に際して、修正候補を識別表示する機能を有する。修正候補の特定及びその識別表示については、後に図19及び図20を用いて説明する。なお、修正後の膜画像309がラベリング処理部310へ送られてもよい。
膜推定器280の学習過程では、膜推定器280に対して、元画像58とそれに対応する正解画像312,314とが教師データとして入力される。正解画像312は、修正後の膜画像308である。正解画像314は、元画像から別途作成されたものである。膜推定器282の学習過程では、膜推定器282に対して、元画像58とそれに対応する正解画像316,318とが教師データとして入力される。正解画像316は、修正後の膜画像309である。正解画像318は、元画像から別途作成されたものである。
図19及び図20に基づいて、上記第3構成例の動作(特に処理部及び修正部の動作)を説明する。
図19において、S30では、画素単位で、膜尤度マップAと膜尤度マップBとが比較される。比較単位を他の単位としてもよい。2つの膜尤度マップA,Bの比較により差分マップが生成される。S32では、差分マップを構成する複数の差分値がソートされる。すなわち、それらについて順位付けがなされる。S34では、ソート後の差分値列において、上位M個の差分値が特定される。すなわち、最大の差分値を含むM個の差分値が特定される。それらに対応する複数の画素がそれぞれ修正候補となる。S36では、作業対象画像上において、複数の修正候補が識別表示される。例えば、高輝度表示され、あるいは、特定の色相で表示される。
その表示例が図20に模式的に示されている。作業対象画像320上において、局所部分322,324は、複数の修正候補画像が密集している部分である。通常、このように複数の修正候補画素が局所的に密集する。場合によっては、エッジに沿って、複数の修正候補画素が並ぶ。いずれにしても、このような候補表示によれば、ユーザーにおいて、修正を行った方がよい部分、あるいは、2つの膜推定結果に解離が生じた部分を特定し、その部分に対して、必要な補正を施すことが可能となる。これにより修正作業の正確性を高められる。
更に第4構成例として、並列的に演算されたN個の膜尤度マップに基づいて画素単位でばらつき情報を演算し、そのばらつき情報から修正候補を特定して、それを識別表示する態様が考えられる(但しNは3以上の整数である)。具体的には、タイプの異なるN個の膜推定器と、それらから出力されるN個の膜尤度マップに基づいて画素単位で膜尤度の標準偏差を演算する演算器と、画素単位での膜尤度の標準偏差に基づいて画素単位で修正候補か否かを判定する判定器と、修正候補となる画素を識別表示する表示処理器と、を設けるものである。ばらつき情報として標準偏差以外の情報(例えば分散又はそれに相当する情報)を演算するようにしてもよい。この構成は、N個の推定結果が揃わない場合には膜でない可能性が高いのでそれを修正候補として表示するものである。
上記実施形態によれば、作業ウインドウに含まれる深さ選択ツールの操作によって、所望の深さに対応する仮膜画像を作業ウインドウ内に表示し、それに対して必要な修正やラベル付けを行うことが可能である。深さを段階的に変更しながら仮膜画像の修正を繰り返すことが容易であり、組織の連続性を考慮しながら、効率的に修正作業を進めることが可能である。また、仮膜画像の表示に際しては、それに対応する(同じ深さの)元画像が背景画像として表示されるので、元画像と仮膜画像とを対比しながら、つまり推定結果の妥当性を確認しながら、修正作業を行える。
修正作業に際して、ラベリングされた部分の三次元像を観察できるようにすれば、各深さの仮膜画像の修正やラベル付けの適否を判断することも可能である。また、深さの異なる複数の画像の重合表示によれば、例えば2つの領域の不自然な重なり(修正エラー又はラベリングエラー)等を容易に特定することが可能となる。
複数の元画像が透過型電子顕微鏡や光学顕微鏡によって取得されてもよい。細胞膜ではなく、細胞内腔、細胞内小器官(オルガネラ)、その他が推定器における推定対象とされてもよい。上記実施形態では、連続切片SEM法が採用されていたが、FIB-SEM法、SBF-SEM法、その他の手法が採用されてもよい。空間軸上で連なる画像列ではなく、時間軸上で連なる画像列が処理対象とされてもよい。
上記の実施形態において、二次学習過程を経た膜推定器を有する生物組織画像処理装置(又はそれに相当するソフトウエア)がユーザーに対して提供又は納入されてもよい。二次学習過程を経たパラメータセットがインターネット上のクラウド(サーバー)からユーザー側の情報処理装置へ提供されてもよい。
Claims (19)
- 生物組織の観察により得られた空間軸上又は時間軸上で連なる複数の元画像に対して前記生物組織に含まれる注目要素を推定する処理を適用する機械学習型の推定器を含み、前記複数の元画像から複数の注目要素画像を生成する画像生成部と、
前記複数の注目要素画像の中からユーザー選択された空間軸上又は時間軸上の位置に対応する特定の注目要素画像を取り出してそれを作業対象画像として表示し、当該作業対象画像に対するユーザーの修正を前記特定の注目要素画像へ反映させる作業支援部と、
を含む、ことを特徴とする生物組織画像処理装置。 - 請求項1記載の生物組織画像処理装置において、
前記推定器は、前記複数の元画像に基づいて複数の注目要素尤度マップを生成し、
前記画像生成部は、前記複数の注目要素尤度マップに基づいて前記複数の注目要素画像を生成する画像生成器を含む、
ことを特徴とする生物組織画像処理装置。 - 請求項1又は2記載の生物組織画像処理装置において、
前記作業支援部は、前記作業対象画像を含む作業ウインドウを表示し、
前記作業ウインドウには、前記位置を選択する際に操作される位置選択用表示要素が含まれる、
ことを特徴とする生物組織画像処理装置。 - 請求項3記載の生物組織画像処理装置において、
前記作業ウインドウには、更に、前記作業対象画像の内容を追加する際に操作される追加用表示要素と、前記作業対象画像の内容を削除する際に操作される削除用表示要素と、が含まれる、
ことを特徴とする生物組織画像処理装置。 - 請求項4記載の生物組織画像処理装置において、
前記作業ウインドウには、更に、前記作業対象画像に対して所定単位でラベリングを行う際に操作されるラベリング用表示要素が含まれる、
ことを特徴とする生物組織画像処理装置。 - 請求項1乃至5のいずれかに記載の生物組織画像処理装置において、
前記作業支援部は、前記作業対象画像の表示に際し、その背景画像として、前記選択された位置に対応する特定の元画像を同時に表示する機能を有する、
ことを特徴とする生物組織画像処理装置。 - 請求項2乃至5のいずれかに記載の生物組織画像処理装置において、
前記作業支援部は、前記作業対象画像を表示する機能に加えて、前記選択された位置に対応する特定の元画像を表示する機能、及び、前記選択された位置に対応する特定の注目要素尤度マップを表示する機能を有する、
ことを特徴とする生物組織画像処理装置。 - 請求項2乃至5のいずれかに記載の生物組織画像処理装置において、
前記作業支援部は、前記選択された位置に対応する、特定の元画像、特定の注目要素尤度マップ、及び、前記特定の注目要素画像の内のいずれかの画像の表示に際し、当該画像に対して、当該画像と同じ種類の画像であって前記選択された位置とは異なる位置に対応する他の画像を重ねて表示する機能を有する、
ことを特徴とする生物組織画像処理装置。 - 請求項1乃至8のいずれかに記載の生物組織画像処理装置において、
前記作業支援部は、前記複数の注目要素画像に対するラベル付け結果に基づいて、そのラベル付け結果を表す三次元像を作成しその三次元像を表示する三次元像処理部を有し、
前記三次元像を観察しながら前記作業対象画像の修正及びそれに対するラベル付けを行える、
ことを特徴とする生物組織画像処理装置。 - 請求項1乃至9のいずれかに記載の生物組織画像処理装置において、
前記作業支援部は、前記複数の注目要素画像の中における第1の注目要素画像に対するラベル付け結果に基づいて、前記複数の注目要素画像の中における第2の注目要素画像の中から1又は複数のラベル付け候補を選定する候補選定部を有する、
ことを特徴とする生物組織画像処理装置。 - 請求項10記載の生物組織画像処理装置において、
前記候補選定部は、前記第1の注目要素画像においてラベル付けされた部分と、前記第2の注目要素画像に含まれる各ラベル付け候補と、の間における類似度に基づいて、前記各ラベル付け候補の表示態様を変化させる、
ことを特徴とする生物組織画像処理装置。 - 請求項2記載の生物組織画像処理装置において、
前記注目要素は特定の膜であり、前記推定器は第1膜推定器であり、前記複数の注目要素尤度マップは複数の第1膜尤度マップであり、前記複数の注目要素画像は複数の膜画像であり、
前記第1膜推定器とは異なるタイプの機械学習型の第2推定器が設けられ、
前記第2推定器は、前記複数の元画像に対して前記膜を推定する処理を適用し、これにより複数の第2膜尤度マップを生成し、
前記作業支援部は、前記複数の第1膜尤度マップと前記複数の第2膜尤度マップの差分に基づいて前記作業対象画像に含まれる修正候補を識別表示する、
ことを特徴とする生物組織画像処理装置。 - 請求項2記載の生物組織画像処理装置において、
前記推定器を含むN(但しNは3以上の整数)個の注目要素推定器が設けられ、
前記N個の注目要素推定器に前記各元画像が入力され、
前記作業支援部は、前記N個の注目要素推定器から出力されたN個の注目要素尤度マップに基づいて前記作業対象画像に含まれる修正候補を特定しそれを識別表示する、
ことを特徴とする生物組織画像処理装置。 - 請求項2記載の生物組織画像処理装置において、
前記注目要素は細胞膜であり、前記推定器は第1推定器であり、前記複数の注目要素尤度マップは複数の膜尤度マップであり、前記複数の注目要素画像は複数の膜画像であり、
前記第1推定器と一体化又は別体化された推定器であって、前記複数の元画像に対して前記生物組織に含まれるオルガネラを推定する処理を適用し、これにより複数のオルガネラ尤度マップを生成する機械学習型の第2推定器が設けられ、
前記複数のオルガネラ尤度マップに基づいて、前記複数の膜尤度マップを補正する補正部が設けられ、
前記画像生成部は、前記補正部による補正後の複数の膜尤度マップに基づいて、前記複数の膜画像を生成する、
ことを特徴とする生物組織画像処理装置。 - 請求項1乃至14のいずれかに記載の生物組織画像処理装置において、
前記推定器の学習過程には一次学習過程及び二次学習過程が含まれ、
前記二次学習過程では前記作業支援部による修正を経た複数の注目要素画像が前記推定器に与えられる、
ことを特徴とする生物組織画像処理装置。 - 機械学習型の膜推定器に対して、生物組織の顕微鏡観察により得られた複数の深さに対応する複数の元画像を入力し、これにより前記複数の深さに対応する複数の膜尤度マップを得る工程と、
前記複数の膜尤度マップに基づいて、前記複数の深さに対応する複数の膜画像を得る工程と、
前記複数の膜画像の中からユーザーにより選択された深さに対応する特定の膜画像を取り出してそれを作業対象画像として表示し、当該作業対象画像に対するユーザーの修正を前記特定の膜画像へ反映させる工程と、
を含む、ことを特徴とする生物組織画像処理方法。 - 請求項16記載の生物組織画像処理方法において、
前記ユーザーの修正を経た複数の膜画像を利用して前記膜推定器に学習を行わせる工程を含む、
ことを特徴とする生物組織画像処理方法。 - 情報処理装置において生物組織画像を処理するためのプログラムであって、
機械学習型の膜推定器に対して、生物組織の顕微鏡観察により得られた複数の深さに対応する複数の元画像を入力し、これにより前記複数の深さに対応する複数の膜尤度マップを生成する機能と、
前記複数の膜尤度マップに基づいて、前記複数の深さに対応する複数の膜画像を生成する機能と、
前記複数の膜画像の中からユーザーにより選択された深さに対応する特定の膜画像を取り出してそれを作業対象画像として表示し、当該作業対象画像に対するユーザーの修正を前記特定の膜画像へ反映させる機能と、
を含む、ことを特徴とするプログラム。 - 請求項18記載のプログラムにおいて、
前記ユーザーの修正を経た複数の膜画像を利用して前記膜推定器に学習を行わせる機能を含む、
ことを特徴とするプログラム。
Applications Claiming Priority (2)
| Application Number | Priority Date | Filing Date | Title |
|---|---|---|---|
| JP2018-099386 | 2018-05-24 | ||
| JP2018099386A JP7181000B2 (ja) | 2018-05-24 | 2018-05-24 | 生物組織画像処理装置及び方法 |
Publications (1)
| Publication Number | Publication Date |
|---|---|
| WO2019225504A1 true WO2019225504A1 (ja) | 2019-11-28 |
Family
ID=68616674
Family Applications (1)
| Application Number | Title | Priority Date | Filing Date |
|---|---|---|---|
| PCT/JP2019/019739 Ceased WO2019225504A1 (ja) | 2018-05-24 | 2019-05-17 | 生物組織画像処理装置及び方法 |
Country Status (2)
| Country | Link |
|---|---|
| JP (1) | JP7181000B2 (ja) |
| WO (1) | WO2019225504A1 (ja) |
Families Citing this family (1)
| Publication number | Priority date | Publication date | Assignee | Title |
|---|---|---|---|---|
| JPWO2024116503A1 (ja) * | 2022-11-30 | 2024-06-06 |
Citations (6)
| Publication number | Priority date | Publication date | Assignee | Title |
|---|---|---|---|---|
| US20100183217A1 (en) * | 2007-04-24 | 2010-07-22 | Seung H Sebastian | Method and apparatus for image processing |
| JP2012037861A (ja) * | 2010-07-12 | 2012-02-23 | Sony Corp | 顕微鏡制御装置、画像表示装置、画像管理サーバ、合焦位置情報生成方法、画像表示方法、画像管理方法及び顕微鏡画像管理システム |
| JP2013152426A (ja) * | 2011-12-27 | 2013-08-08 | Canon Inc | 画像処理装置、画像処理システム、画像処理方法、およびプログラム |
| WO2016190129A1 (ja) * | 2015-05-22 | 2016-12-01 | コニカミノルタ株式会社 | 画像処理装置、画像処理方法、および画像処理用のプログラム |
| JP2017027138A (ja) * | 2015-07-16 | 2017-02-02 | コニカミノルタ株式会社 | 画像処理装置、画像処理方法、および画像処理用のプログラム |
| JP2018011870A (ja) * | 2016-07-22 | 2018-01-25 | キヤノン株式会社 | 画像処理装置、画像処理システム、画像処理方法、およびプログラム |
-
2018
- 2018-05-24 JP JP2018099386A patent/JP7181000B2/ja active Active
-
2019
- 2019-05-17 WO PCT/JP2019/019739 patent/WO2019225504A1/ja not_active Ceased
Patent Citations (6)
| Publication number | Priority date | Publication date | Assignee | Title |
|---|---|---|---|---|
| US20100183217A1 (en) * | 2007-04-24 | 2010-07-22 | Seung H Sebastian | Method and apparatus for image processing |
| JP2012037861A (ja) * | 2010-07-12 | 2012-02-23 | Sony Corp | 顕微鏡制御装置、画像表示装置、画像管理サーバ、合焦位置情報生成方法、画像表示方法、画像管理方法及び顕微鏡画像管理システム |
| JP2013152426A (ja) * | 2011-12-27 | 2013-08-08 | Canon Inc | 画像処理装置、画像処理システム、画像処理方法、およびプログラム |
| WO2016190129A1 (ja) * | 2015-05-22 | 2016-12-01 | コニカミノルタ株式会社 | 画像処理装置、画像処理方法、および画像処理用のプログラム |
| JP2017027138A (ja) * | 2015-07-16 | 2017-02-02 | コニカミノルタ株式会社 | 画像処理装置、画像処理方法、および画像処理用のプログラム |
| JP2018011870A (ja) * | 2016-07-22 | 2018-01-25 | キヤノン株式会社 | 画像処理装置、画像処理システム、画像処理方法、およびプログラム |
Non-Patent Citations (1)
| Title |
|---|
| UCHIHASHI KENSHI ET AL.: "Neuronal cell membrane segmentation from electron microscopy images using a hostile generation model", PROCEEDINGS OF THE 31ST ANNUAL CONFERENCE OF THE JAPANESE SOCIETY FOR ARTIFICIAL INTELLIGENCE, 2017, pages 1 - 4 * |
Also Published As
| Publication number | Publication date |
|---|---|
| JP7181000B2 (ja) | 2022-11-30 |
| JP2019204312A (ja) | 2019-11-28 |
Similar Documents
| Publication | Publication Date | Title |
|---|---|---|
| US11854201B2 (en) | Biological tissue image processing system, and machine learning method | |
| US11594051B2 (en) | Microscope system and projection unit | |
| Heebner et al. | Deep learning-based segmentation of cryo-electron tomograms | |
| EP3915088A1 (en) | Image analysis system and method of using the image analysis system | |
| US11508045B1 (en) | Microscopy system and method for generating stylized contrast images | |
| CN113744195A (zh) | 一种基于深度学习的hRPE细胞微管自动检测方法 | |
| WO2019180833A1 (ja) | 細胞観察装置 | |
| CN117635523A (zh) | 显微镜系统和生成处理显微镜数据的机器学习模型的方法 | |
| JP6962863B2 (ja) | 荷電粒子線装置 | |
| CN106023121A (zh) | 一种贝叶斯显微成像方法 | |
| WO2017150194A1 (ja) | 画像処理装置、画像処理方法及びプログラム | |
| US20180128734A1 (en) | Image processing apparatus, image processing method, and image processing program | |
| US10955655B2 (en) | Stitching images based on presence of foreign matter | |
| CN115170793A (zh) | 面向工业产品质检的小样本图像分割自我校准方法 | |
| JP7181000B2 (ja) | 生物組織画像処理装置及び方法 | |
| WO2019225506A1 (ja) | 生物組織画像処理システム及び機械学習方法 | |
| JP2017055916A (ja) | 画像生成装置、画像生成方法及びプログラム | |
| CN113052166A (zh) | 病理图像的显示方法及装置 | |
| CN121488283A (zh) | 依次染色且连续的生物图像的配准方法 | |
| JP7181003B2 (ja) | 生物組織画像処理装置及び方法 | |
| CN117456300A (zh) | 一种目标识别与检测的人工智能模型方法 | |
| CN115249287A (zh) | 一种应用于糖尿病足的足部模型构建方法 | |
| CN111833992A (zh) | 一种中期分裂相染色体区域搜寻方法及装置 | |
| US20230245360A1 (en) | Microscopy System and Method for Editing Overview Images | |
| Wiers | Label-efficient segmentation of organoid culture data using diffusion models |
Legal Events
| Date | Code | Title | Description |
|---|---|---|---|
| 121 | Ep: the epo has been informed by wipo that ep was designated in this application |
Ref document number: 19807052 Country of ref document: EP Kind code of ref document: A1 |
|
| NENP | Non-entry into the national phase |
Ref country code: DE |
|
| 122 | Ep: pct application non-entry in european phase |
Ref document number: 19807052 Country of ref document: EP Kind code of ref document: A1 |