WO2019147725A1 - Methods and systems for determining the biological age of samples - Google Patents
Methods and systems for determining the biological age of samples Download PDFInfo
- Publication number
- WO2019147725A1 WO2019147725A1 PCT/US2019/014826 US2019014826W WO2019147725A1 WO 2019147725 A1 WO2019147725 A1 WO 2019147725A1 US 2019014826 W US2019014826 W US 2019014826W WO 2019147725 A1 WO2019147725 A1 WO 2019147725A1
- Authority
- WO
- WIPO (PCT)
- Prior art keywords
- sample
- biological age
- data
- age
- neural network
- Prior art date
Links
Classifications
-
- G—PHYSICS
- G06—COMPUTING; CALCULATING OR COUNTING
- G06V—IMAGE OR VIDEO RECOGNITION OR UNDERSTANDING
- G06V10/00—Arrangements for image or video recognition or understanding
- G06V10/70—Arrangements for image or video recognition or understanding using pattern recognition or machine learning
- G06V10/764—Arrangements for image or video recognition or understanding using pattern recognition or machine learning using classification, e.g. of video objects
-
- C—CHEMISTRY; METALLURGY
- C12—BIOCHEMISTRY; BEER; SPIRITS; WINE; VINEGAR; MICROBIOLOGY; ENZYMOLOGY; MUTATION OR GENETIC ENGINEERING
- C12Q—MEASURING OR TESTING PROCESSES INVOLVING ENZYMES, NUCLEIC ACIDS OR MICROORGANISMS; COMPOSITIONS OR TEST PAPERS THEREFOR; PROCESSES OF PREPARING SUCH COMPOSITIONS; CONDITION-RESPONSIVE CONTROL IN MICROBIOLOGICAL OR ENZYMOLOGICAL PROCESSES
- C12Q1/00—Measuring or testing processes involving enzymes, nucleic acids or microorganisms; Compositions therefor; Processes of preparing such compositions
- C12Q1/02—Measuring or testing processes involving enzymes, nucleic acids or microorganisms; Compositions therefor; Processes of preparing such compositions involving viable microorganisms
- C12Q1/025—Measuring or testing processes involving enzymes, nucleic acids or microorganisms; Compositions therefor; Processes of preparing such compositions involving viable microorganisms for testing or evaluating the effect of chemical or biological compounds, e.g. drugs, cosmetics
-
- G—PHYSICS
- G01—MEASURING; TESTING
- G01N—INVESTIGATING OR ANALYSING MATERIALS BY DETERMINING THEIR CHEMICAL OR PHYSICAL PROPERTIES
- G01N33/00—Investigating or analysing materials by specific methods not covered by groups G01N1/00 - G01N31/00
- G01N33/48—Biological material, e.g. blood, urine; Haemocytometers
- G01N33/50—Chemical analysis of biological material, e.g. blood, urine; Testing involving biospecific ligand binding methods; Immunological testing
- G01N33/68—Chemical analysis of biological material, e.g. blood, urine; Testing involving biospecific ligand binding methods; Immunological testing involving proteins, peptides or amino acids
- G01N33/6803—General methods of protein analysis not limited to specific proteins or families of proteins
- G01N33/6848—Methods of protein analysis involving mass spectrometry
-
- G—PHYSICS
- G06—COMPUTING; CALCULATING OR COUNTING
- G06T—IMAGE DATA PROCESSING OR GENERATION, IN GENERAL
- G06T7/00—Image analysis
- G06T7/0002—Inspection of images, e.g. flaw detection
- G06T7/0012—Biomedical image inspection
-
- G—PHYSICS
- G06—COMPUTING; CALCULATING OR COUNTING
- G06V—IMAGE OR VIDEO RECOGNITION OR UNDERSTANDING
- G06V20/00—Scenes; Scene-specific elements
- G06V20/60—Type of objects
- G06V20/69—Microscopic objects, e.g. biological cells or cellular parts
-
- G—PHYSICS
- G16—INFORMATION AND COMMUNICATION TECHNOLOGY [ICT] SPECIALLY ADAPTED FOR SPECIFIC APPLICATION FIELDS
- G16B—BIOINFORMATICS, i.e. INFORMATION AND COMMUNICATION TECHNOLOGY [ICT] SPECIALLY ADAPTED FOR GENETIC OR PROTEIN-RELATED DATA PROCESSING IN COMPUTATIONAL MOLECULAR BIOLOGY
- G16B20/00—ICT specially adapted for functional genomics or proteomics, e.g. genotype-phenotype associations
- G16B20/40—Population genetics; Linkage disequilibrium
-
- G—PHYSICS
- G16—INFORMATION AND COMMUNICATION TECHNOLOGY [ICT] SPECIALLY ADAPTED FOR SPECIFIC APPLICATION FIELDS
- G16B—BIOINFORMATICS, i.e. INFORMATION AND COMMUNICATION TECHNOLOGY [ICT] SPECIALLY ADAPTED FOR GENETIC OR PROTEIN-RELATED DATA PROCESSING IN COMPUTATIONAL MOLECULAR BIOLOGY
- G16B40/00—ICT specially adapted for biostatistics; ICT specially adapted for bioinformatics-related machine learning or data mining, e.g. knowledge discovery or pattern finding
- G16B40/20—Supervised data analysis
-
- G—PHYSICS
- G01—MEASURING; TESTING
- G01N—INVESTIGATING OR ANALYSING MATERIALS BY DETERMINING THEIR CHEMICAL OR PHYSICAL PROPERTIES
- G01N2500/00—Screening for compounds of potential therapeutic value
-
- G—PHYSICS
- G01—MEASURING; TESTING
- G01N—INVESTIGATING OR ANALYSING MATERIALS BY DETERMINING THEIR CHEMICAL OR PHYSICAL PROPERTIES
- G01N2800/00—Detection or diagnosis of diseases
- G01N2800/70—Mechanisms involved in disease identification
- G01N2800/7042—Aging, e.g. cellular aging
Definitions
- Aging is a large risk factor for disease and a large driver of healthcare spending.
- aging may not be directly treated like most diseases, in part because aging may be assumed to be an unstoppable force. Aging is a complex process and the cause of aging remains unknown. Recently, several attempts have been made to understand the complexities of the aging process. Some studies and evidence may suggest the possibility of factors slowing or reversing cellular aging. While identifying and experimentally validating these factors may lead to a greater understanding of the aging process and the mechanisms involved, such identification and experimental validation can be challenging and require novel computational approaches, especially for the development of effective therapeutics for aging.
- the present disclosure relates to the phenotypic profiling of the biological age of samples using machine learning.
- Methods and systems provided herein can significantly increase accuracy of predicting biological age based on analysis of one sample or a combination of two or more samples.
- Methods and systems provided herein may combine applying machine vision techniques (e.g., machine learning techniques on image data) to sample data (e.g., microscopy image data) to advantageously perform, rapid and low-cost assays for assessing (e.g., predicting) biological age of samples.
- morphological features of cell and/or tissue images to assess biological age of samples may be used as effective screening tools and may be diagnostic for specific disease states (e.g., aging- related diseases).
- Such morphological features may be extracted and computationally assessed with the use of staining techniques and/or epigenetic assays to reveal morphological predictors of biological age.
- the methods disclosed herein can be used for drug discovery, especially in identifying an anti-aging agent.
- the present disclosure provides a method of using a biological age predictor comprising: (a) providing data of a sample to the biological age predictor, wherein the biological age predictor generates a first biological age; (b) treating the sample with a substance, thereby generating a treated sample; and (c) providing data of the treated sample to the biological age predictor, wherein the biological age predictor generates a second biological age.
- the sample is a cell sample.
- the cell sample may be a skin, muscle, blood, liver, heart, spleen, thymus, brain, myoblast, fibroblast, or keratinocyte cell sample.
- the cell sample is a skin cell sample.
- the sample is a tissue sample.
- the tissue sample is a skin, fibroblast, muscle, liver, heart, spleen, thymus, or brain tissue sample.
- the tissue sample is a skin tissue sample.
- the biological age predictor applies machine learning.
- the machine learning comprises a convolutional neural network (CNN).
- the convolutional neural network comprises a deep convolutional neural network (DCNN).
- the biological age predictor is a computer-implemented system, wherein the system has been trained to determine the biological age of the sample.
- the data comprises an image, an epigenetic profile, a proteomic profile, or a metabolomics profile. The data may identify cell morphology, biomarkers, or cellular components.
- the method comprises treating the sample with a substance such as an anti-aging agent.
- the substance may be a new drug entity.
- the method disclosed herein further comprises comparing the first biological age and the second biological age to determine the efficacy of the substance.
- the first biological age or the second biological age of the sample is the specific age of the sample. In another embodiment, the first biological age or the second biological age of the sample is the age range of the sample. In another embodiment, the first biological age and the second biological age of the sample are the relative age of the sample and the treated sample. In some embodiments, the method further comprises staining the sample and the treated sample with a stain. In some embodiments, the method further comprises acquiring a plurality of images of the stained sample to provide the data of the sample, and acquiring a plurality of images of the stained treated sample to provide the data of the treated sample. In some embodiments, the method further comprises processing the plurality of images to determine the first biological age and the second biological age.
- the method further comprises determining the first biological age and the second biological age with an accuracy of at least about 80%. In some embodiments, the method further comprises determining a difference in age between the first biological age and the second biological age. In some embodiments, the method further comprises determining a percentage difference in age between the first biological age and the second biological age. In some embodiments, the method further comprises providing a subject in need thereof with the substance, based at least in part on the first biological age and the second biological age.
- the present disclosure provides a computer-implemented method of determining the effectiveness of a substance by using a biological age predictor comprising:
- the method further comprises providing data of a second sample from the subject subsequent to providing the substance, wherein the biological age predictor applies machine learning to determine the biological age of the second sample. In some embodiments, the biological age predictor applies machine learning.
- the present disclosure provides a computer-implemented method of determining the biological age of a sample using a biological age predictor comprising: (a) providing data of a sample to the biological age predictor, wherein the biological age predictor applies machine learning to generate a biological age, wherein providing data of the sample to the biological age predictor does not involve input by a user to identify a feature.
- the method further comprises determining the biological age with an accuracy of at least about 80%.
- the present disclosure provides a computer-implemented method for determining the biological age of a sample comprising: (a) obtaining a first sample from a first subject; (b) labeling the first sample with a label to generate a labeled sample; (c) performing a first assay on the labeled sample to generate a first sample data; and (d) applying, by a computer comprising a processor configured to execute a computer program including instructions, executable by the processor, to apply a machine learning detection structure to the first sample data, wherein the detection structure employs machine learning to screen locations in the first sample data to: (i) identify a feature and classify the feature to the label; and (ii) determine the biological age of the first sample based at least in part on the identified and classified feature.
- the method further comprises determining the biological age with an accuracy of at least about 80%.
- the first sample is a cell sample.
- the cell sample may be a skin, muscle, blood, liver, heart, spleen, thymus, brain, myoblast, fibroblast, or keratinocyte cell sample.
- the cell sample is a skin cell sample.
- the first sample is a tissue sample.
- the tissue sample may be a fibroblast, skin, muscle, blood, liver, or brain sample.
- the first subject is human.
- the first subject exhibits a symptom associated with Hutchinson-Gilford Progeria Syndrome (HGPS) or Werner Syndrome.
- HGPS Hutchinson-Gilford Progeria Syndrome
- the first subject exhibits an aging symptom.
- the aging symptoms may be selected from the group consisting of muscle wasting (sarcopenia), slower wound healing, skin growths, rough skin, dry skin, loose facial skin, transparent skin, decreased skin elasticity, wrinkling, sagging skin, whitening of hair, and graying of hair.
- the first assay comprises staining the first sample.
- staining the first sample comprises applying a stain to the first sample, wherein the stains are selected from the group consisting of DAPI, H&E, HES (hematoxylin eosin saffron), Luna stain, Herovici stain, Van Gieson (EVG), and stains used to identify lipofuscin, lysosomes, P16, P19, beta-galactosidase, LC3, ubiquitin, mitochondria, DNA damage, distribution of organelles, nuclear lamina, cell activation, CCR2, soma size, neurites, cytoskeletal structure, or membrane ruffling.
- labeling the first sample comprises attributing chronological age, age-related diseases, progression, clinical metadata, or a combination thereof to the first sample.
- labeling the first sample comprises attributing information of the first sample by imaging, morphological profiling, cell painting, mass spectrometry, antibody chips, 2-F Fluorescence Difference Gel Electrophoresis (DIGE), mass spectrometric immunoassay (MSIA), or laser capture microdissection (LCM).
- the first sample data is an image.
- the first sample data is segmented into a plurality of 2D slices
- the detection structure employs the convolutional neural network to screen locations in each of the plurality of 2D slices of the segmented first sample data by a sliding window methodology to identify the feature and classify the feature.
- the method further comprises determining, upon applying the machine learning detection structure to a second sample data obtained from a second assay of a second sample of a second subject, the biological age of the second subject based at least in part on a second feature identified in the second sample data, wherein the feature comprises the second feature.
- the first assay and the second assay are the same type of assays.
- the first assay and the second assay are different types of assays.
- the first sample data and the second sample data are the same type of sample data.
- the first sample data and the second sample data are different types of sample data.
- the first sample data is image data, proteomics data, or metabolomics data.
- the first assay is an epigenetics assay.
- determining the biological age of the first sample comprises determining the specific age of the first sample. In another embodiment, determining the biological age of the first sample comprises determining the age range of the first sample. In another embodiment, determining the biological age of the first sample comprises determining the relative age of the first sample in comparison to the second sample.
- the machine learning detection structure comprises a neural network. In certain embodiments, the neural network comprises a convolutional neural network. In certain embodiments, the convolutional neural network comprises a deep convolutional neural network. In some embodiments, the deep convolutional neural network comprises a cascaded deep convolutional neural network.
- the computer program includes instructions, executable by the processor, to apply to the first sample data a network structure selected from the group consisting of recurrent neural network structure and general adversarial network structure. In some embodiments, results from applying the machine learning detection structure are combined with results from applying the network structure to determine the biological age. In some embodiments, the computer program includes instructions, executable by the processor, to apply to the first sample data a technique selected from the group consisting of gradient boosting, random forests, and support vector machines. In some embodiments, results from applying the machine learning detection structure are combined with results from applying the technique.
- the present disclosure provides a method of using a biological age predictor comprising: (a) receiving initial data comprising a predicted biological age value from the biological age predictor; (b) automatically labeling the initial data with an extraction program, thereby producing labeled data, wherein the extraction program detects and uniquely labels a desired feature with a first label; and (c) processing the labeled data for use in a second biological age predictor, wherein the second biological age predictor is configured to determine the biological age of a sample subject based at least in part on identification of the desired feature.
- the present disclosure provides a computer-implemented system comprising: a digital processing device comprising: (a) a processor; (b) an operating system configured to perform executable instructions; (c) a memory; and (d) a computer program including instructions executable by the digital processing device to create an application applying machine learning detection structures to a plurality of sample data to determine the biological age of a sample, the application comprising: (i) a software module applying a machine learning detection structure to the plurality of sample data, the detection structure employing machine learning to screen locations in the sample to identify a feature and classify the feature; and (ii) a software module automatically generating a report comprising the biological age of a sample from which the sample data was derived.
- the machine learning detection structure comprises a neural network.
- the neural network comprises a convolutional neural network.
- the convolutional neural network comprises a deep
- the deep convolutional neural network comprises a cascaded deep convolutional neural network.
- the application runs in real-time or near-real time and generates a real-time or near real-time report comprising the biological age of the sample.
- the plurality of sample data is obtained by imaging, morphological profiling, cell painting, mass spectrometry, antibody chips, 2-F Fluorescence Difference Gel Electrophoresis (DIGE), mass spectrometric immunoassay (MSIA), or laser capture microdissection (LCM).
- the plurality of sample data is obtained by imaging.
- the application further comprises a software module performing image preprocessing comprising normalization of the plurality of the sample data.
- the normalization comprises normalization of signal noise, sequencing reads, image channel balancing/combination, quality filtering, color balancing, color
- the plurality of sample data comprises image data
- the normalization comprises normalization of image format, image slice spacing, image intensity, image contrast, image saturation, image size, image orientation, or other image data properties of the image data.
- the plurality of sample data is segmented into a plurality of 2D slices, and the detection structure employs the convolutional neural network to screen locations in each of the plurality of 2D slices of the segmented sample data by a sliding window methodology to identify the feature and classify the feature.
- the convolutional neural network has 2 to 64 convolutional layers and 1 to 8 fully connected layers.
- the sliding window comprises a window of less than about 4,000 pixels by less than about 4,000 pixels.
- the sliding window comprises a window of less than about 512 pixels by less than about 512 pixels.
- the convolutional neural network comprises a neural network instance selected randomly from a plurality of neural network instances, and the second convolutional neural network comprises a neural network instance selected randomly from a plurality of neural network instances.
- the application further comprises a software module performing post-processing of a plurality of refined locations.
- the post- processing comprises characterizing centroid location, volume, shape, intensity, density, transparency, regularity, or a combination thereof.
- the report comprises an informational overlay on the sample data.
- the report comprises a sample data heat mapped to indicate confidence level.
- the report comprises a time course generated by applying the application to medical images captured at two or more time points to measure progression of a disease or growth and movement of a tumor over time.
- the machine learning detection structure is trained to identify critical clinical signs of a disease.
- the machine learning detection structure is trained using sample data labeled by a human expert and subjected to preprocessing for normalization.
- the biological age of the sample comprises a specific age of the sample.
- the biological age of the sample comprises an age range of the sample.
- the biological age of the sample comprises a relative age of the sample in comparison to an additional sample.
- the present disclosure provides a non-transitory computer readable storage medium encoded with a computer program including instructions executable by a processor to create an application applying machine learning to a plurality of sample data to determine the biological age of a sample, the application comprising: (a) a software module applying a machine learning detection structure to the plurality of sample data, the detection structure employing machine learning to screen locations in the plurality of sample data to identify a feature and classify the feature; and (b) a software module automatically generating a report comprising the biological age of a sample from which the sample data was derived.
- the machine learning detection structure comprises a neural network.
- the neural network comprises a convolutional neural network.
- the convolutional neural network comprises a deep
- the deep convolutional neural network comprises a cascaded deep convolutional neural network.
- the present disclosure provides a high-throughput method of screening a test compound to identify an anti-aging agent, the method comprising: (a) contacting a biological sample with the test compound, thereby generating a treated sample; (b) providing data of the treated sample to a biological age predictor; (c) determining a biological age of the treated sample using a biological age predictor; and (d) identifying the test compound as an anti aging agent based at least in part on the determined biological age.
- the method further comprises identifying the test compound as an anti-aging agent when the determined biological age is a relative reduction relative to a biological age of the biological sample of at least about 10%.
- FIG. 1 illustrates an example workflow for predicting the biological age of a sample, including sample selection, pre-processing, machine learning, and biological age prediction, according to disclosed embodiments.
- FIG. 2 illustrates a process for creating and training a machine-learning driven predictor for a given sample.
- FIG. 3 illustrates a process for using a machine-learning driven predictor to process a plurality of samples to generate a biological age prediction.
- FIG. 4 illustrates a computer control system that is programmed or otherwise configured to implement methods provided herein.
- FIG. 5A illustrates an un-aggregated per-tile confusion matrix for an example fold of a biological age prediction by analysis of human skin tissue.
- FIG. 5B illustrates a donor- aggregated confusion matrix for an example fold.
- FIGs. 5C-5E illustrate un-aggregated“l-vs.- rest” per-tile ROC (receiver-operating characteristic) curves indicating each age group’s“1 vs rest” classification performance, which represents the likelihood of correctly predicting one correct age group versus all other incorrect age groups combined (“Class Y-vs.-rest”,“Class M- vs.-rest”, and“Class O-vs.-rest” per-tile ROC curves for Y vs. M vs. O classification, respectively).
- FIG. 6A illustrates an un-aggregated per-tile confusion matrix for an example fold of a biological age prediction by analysis of mouse skin tissue.
- FIG. 6B illustrates a donor- aggregated confusion matrix for an example fold.
- FIGs. 6C-6F illustrate un-aggregated“Class 4-vs.-rest”,“Class l2-vs.-rest”,“Class l5-vs.-rest”, and“Class l8-vs.-rest” per-tile ROC curves for 4 vs. 12 vs. 15 vs. 18 classification, respectively.
- FIG. 7A illustrates an well-aggregated per-tile confusion matrix for an example fold of a biological age prediction by analysis of mouse myoblast cells.
- FIG. 7B illustrates a mouse-aggregated confusion matrix for an example fold.
- FIG. 7C illustrates an un-aggregated per-image ROC curve for“Y vs. O” classification.
- FIG. 8A illustrates an well-aggregated confusion matrix for an example fold of a biological age prediction by analysis of human fibroblast cells.
- FIG. 8B illustrates a donor- aggregated confusion matrix for an example fold.
- FIG. 8C illustrates an un-aggregated per- image ROC curve for“Y vs. O” classification.
- FIG. 9A illustrates an well-aggregated confusion matrix for an example fold of a biological age prediction by analysis of human keratinocyte cells.
- FIG. 9B illustrates a donor- aggregated confusion matrix for an example fold.
- FIG. 9C illustrates an un-aggregated per- image ROC curve for“Y vs. O” classification.
- FIG. 10 illustrates an example of a biopsy cutting and slide preparation scheme.
- any figure or number or amount presented herein is approximate, and that any numerical range includes the minimum number and the maximum number defining the range, whether the word“inclusive” or the like is employed or not, unless implicitly or explicitly understood or stated otherwise.
- the term“approximately” or“about” or the symbol in reference to a figure or number or amount includes numbers that fall within a range of ⁇ 5 % of same, unless implicitly or explicitly understood or stated otherwise.
- any heading employed is by way of convenience, not by way of limitation.
- any permissive, open, or open-ended language encompasses any relatively permissive to restrictive language, less open to closed language, or less open-ended to closed-ended language, respectively, unless implicitly or explicitly understood or stated otherwise.
- the word“comprising” may encompass“comprising”,“consisting essentially of’, and/or“consisting of’ type language.
- ranges such as from 1 to 6 should be considered to have specifically disclosed subranges such as from 1 to 3, from 1 to 4, from 1 to 5, from 2 to 4, from 2 to 6, from 3 to 6 etc., as well as individual numbers within that range, for example, 1, 2, 3, 4, 5, and 6. This applies regardless of the breadth of the range.
- ranges include the range endpoints.
- sample generally refers to a biological sample.
- the samples may be taken from tissue or cells or from the environment of tissue or cells.
- the sample may comprise, or be derived from, a tissue biopsy, blood, blood plasma, extracellular fluid, dried blood spots, cultured cells, culture media, discarded tissue, plant matter, synthetic proteins, bacterial and/or viral samples, fungal tissue, archaea, or protozoans.
- the sample may have been isolated from the source prior to collection.
- Samples may comprise forensic evidence. Non-limiting examples include a finger print, saliva, urine, blood, stool, semen, or other bodily fluids isolated from the primary source prior to collection.
- the sample is isolated from its primary source (cells, tissue, bodily fluids such as blood, environmental samples, etc.) during sample preparation.
- the sample may be derived from an extinct species including but not limited to samples derived from fossils.
- the sample may or may not be purified or otherwise enriched from its primary source.
- the primary source is homogenized prior to further processing.
- cells are lysed using a buffer such as RIPA buffer. Denaturing buffers may also be used at this stage.
- the sample may be filtered or centrifuged to remove lipids and particulate matter.
- the sample may also be purified to remove nucleic acids, or may be treated with RNases or DNases.
- the sample may contain tissues or cells that are intact, fragmented, or partially degraded.
- the sample may be taken from a subject with a disease or disorder.
- the disease or disorder may be an infectious disease, an immune disorder or disease, a cancer, a genetic disease, a degenerative disease, a lifestyle disease, an injury, a rare disease or an age related disease.
- the infectious disease may be caused by bacteria, viruses, fungi, and/or parasites.
- Non-limiting examples of cancers include Bladder cancer, Lung cancer, Brain cancer, Melanoma, Breast cancer, Non-Hodgkin lymphoma, Cervical cancer, Ovarian cancer, Colorectal cancer, Pancreatic cancer, Esophageal cancer, Prostate cancer, Kidney cancer, Skin cancer, Leukemia, Thyroid cancer, Liver cancer, and Uterine cancer.
- genetic diseases or disorders include, but are not limited to, age-related disorders (such as Hutchinson-Gilford Progeria Syndrome (HGPS) or Werner Syndrome), cystic fibrosis, Charcot-Marie-Tooth disease, Huntington's disease, Koz-Jeghers syndrome, Down syndrome, Rheumatoid arthritis, and Tay- Sachs disease.
- age-related disorders such as Hutchinson-Gilford Progeria Syndrome (HGPS) or Werner Syndrome
- cystic fibrosis Charcot-Marie-Tooth disease, Huntington's disease, Koz-Jeghers syndrome, Down syndrome, Rheumatoid arthritis, and Tay- Sachs disease.
- lifestyle diseases include obesity, diabetes,
- arteriosclerosis heart disease, stroke, hypertension, liver cirrhosis, nephritis, cancer, chronic obstructive pulmonary disease (COPD), hearing problems, and chronic backache.
- injuries include, but are not limited to, abrasion, brain injuries, bruising, burns, concussions, congestive heart failure, construction injuries, dislocation, flail chest, fracture, hemothorax, herniated disc, hip pointer, hypothermia, lacerations, pinched nerve, pneumothorax, rib fracture, sciatica, spinal cord injury, tendons ligaments fascia injury, traumatic brain injury, and whiplash.
- the sample may be taken before and/or after treatment of a subject with a disease or disorder.
- Samples may be taken before and/or after a treatment. Samples may be taken during a treatment or a treatment regime. Multiple samples may be taken from a subject to monitor the effects of the treatment over time. The sample may be taken from a subject known or suspected of having an infectious disease for which diagnostic antibodies are not available.
- the sample may be taken from a subject suspected of having a disease or a disorder.
- the sample may be taken from a subject experiencing unexplained symptoms, such as fatigue, nausea, weight loss, aches and pains, weakness, or memory loss.
- the sample may be taken from a subject having explained symptoms.
- the sample may be taken from a subject at risk of developing a disease or disorder due to factors such as familial history, age,
- the sample may be taken from an embryo, fetus, or pregnant woman.
- the sample may be isolated from the mother’s blood plasma.
- the sample may comprise circulating fetal cells in the mother’s blood plasma.
- the sample may be taken from a healthy subject.
- samples may be taken longitudinally from the same subject.
- samples acquired longitudinally may be analyzed with the goal of monitoring individual health and early detection of health issues.
- the sample may be collected at a home setting or at a point-of-care setting and subsequently transported by a mail delivery, courier delivery, or other transport method prior to analysis.
- a home user may collect a blood spot sample through a finger prick, which blood spot sample may be dried and subsequently transported by mail delivery prior to analysis.
- samples acquired longitudinally may be used to monitor response to stimuli expected to impact healthy, athletic performance, or cognitive performance. Non-limiting examples include response to medication, dieting, or an exercise regimen.
- the sample may also be a control.
- the sample may be tagged, e.g., with identifiable tags, to allow for multiplexing of samples.
- identifiable tags include: fluorophores, magnetic nanoparticles, or DNA barcoded base linkers.
- Fluorophores used may include fluorescent proteins such as GFP, YFP, RFP, eGFP, mCherry, tdtomato, FITC, Alexa Fluor 350, Alexa Fluor 405, Alexa Fluor 488, Alexa Fluor 532, Alexa Fluor 546, Alexa Fluor 555, Alexa Fluor 568, Alexa Fluor 594, Alexa Fluor 647, Alexa Fluor 680, Alexa Fluor 750, Pacific Blue, Coumarin, BODIPY FL, Pacific Green, Oregon Green, Cy3, Cy5, Pacific Orange, TRITC, Texas Red, Phycoerythrin, Allophcocyanin, or other fluorophores known in the art.
- any number of samples may be multiplexed.
- a multiplexed analysis may contain samples from 2, 3, 4, 5, 6, 7, 8, 9, 10, 11, 12, 13, 14, 15, 16, 17, 18, 19, about 20, about 25, about 30, about 35, about 40, about 45, about 50, about 55, about 60, about 65, about 70, about 75, about 80, about 85, about 90, about 95, about 100, or more than 100 initial samples.
- the identifiable tags may provide a way to interrogate each sample as to its origin, or may direct different samples to segregate to different areas or a solid support.
- samples may be mixed prior to analysis without tagging or multiplexing.
- a multiplexed analysis may contain samples from 2, 3, 4, 5, 6, 7, 8, 9, 10, 11, 12, 13, 14, 15, 16, 17, 18, 19, about 20, about 25, about 30, about 35, about 40, about 45, about 50, about 55, about 60, about 65, about 70, about 75, about 80, about 85, about 90, about 95, about 100, or more than 100 initial samples.
- Samples may be multiplexed without tagging using a combinatorial pooling design in which samples are mixed into pools in a manner that allows signal from individual samples to be resolved from the analyzed pools using
- label generally refers to information that is capable of being analyzed to predict biological age of a sample.
- the label may be a direct signal indicative of the presence or absence of a cell or tissue.
- the label may be an indirect signal indicative of the presence or absence of a call or tissue, such as a fluorescent signal.
- Labeling may comprise attributing information of one or more samples, such as by imaging, morphological profiling, cell painting, mass spectrometry, antibody chips, 2-F Fluorescence Difference Gel
- DIGE Electrophoresis
- MSIA mass spectrometric immunoassay
- sample data may be generated by performing various assays on the sample, or by attributing information (e.g., measurements) of the sample.
- suitable in vitro assays on samples (e.g., cells and tissue cross sections) obtained from subjects, methods and systems disclosed herein can assess the biological age of the samples using machine learning.
- Such assays may combine data from a number of different phenotypic sources, such as images of various cell and/or tissue types, each with multiple different stains that are selected to highlight different phenotypic properties; epigenetic and/or gene expression data; and proteomics analysis.
- assays may highlight certain morphological features, biomarkers (e.g.
- telomere length e.g. DNA methylation patterns, post-transcriptional modification of histones, and chromatin remodeling
- components such as a specific protein, of a sample.
- Machine learning techniques may be pre-trained to combine sample data obtained from these assays and identify complex, interconnected signals used to determine the biological age of the sample.
- Methods and systems described herein may combine applying machine vision techniques (e.g., machine learning techniques on image data) to sample data (e.g., microscopy image data) to advantageously perform, rapid and low-cost assays for assessing (e.g., predicting) biological age of samples.
- machine vision techniques e.g., machine learning techniques on image data
- sample data e.g., microscopy image data
- assays for assessing biological age of samples.
- morphological features of cell and/or tissue images to assess biological age of samples may be used as effective screening tools and may be diagnostic for specific disease states (e.g., aging-related diseases).
- Such morphological features may be extracted and computationally assessed with the use of staining techniques and/or epigenetic assays to reveal morphological predictors of biological age.
- methods and systems described herein may have several advantages over other approaches to assess biological age of samples and for biomarker and screening studies in aging-related research, such as unbiased analysis, broad phenotypic coverage through imaging, measurement of complex features, generative hypotheses, rapid assessment, and wide applicability.
- Methods and systems described herein may feature unbiased analysis.
- the machine learning-driven phenotypic approach is an unbiased method of analyzing many features over large quantities of biological data, thereby reducing the need to begin with specific scientific hypotheses in order discover biomarkers or deploy them for drug screens. This may be a significant advantage in aging research and drug development, where quality biomarkers for drug screening may be elusive
- Methods and systems described herein may feature broad phenotypic coverage through imaging, particularly when combined with high-content imaging.
- High-content imaging can provide“broad phenotypic coverage” by enabling the measurement of many interrelated biological features at once without requiring a priori knowledge of what features to focus on for imaging.
- Such broad phenotypic coverage may be particularly advantageous when compared with more specific biomarkers.
- Methods and systems described herein may feature a machine learning approach that enables the measurement of extremely complex phenotypic features that are either singularly difficult to quantify (e.g., the complicated shape, structure, and relationships of mitochondria in an image) or are combined into complex sets of features (e.g., the combined features of nuclei, mitochondria, and many specific proteins). This may be a significant advantage over other high- content screening techniques that may tend towards focusing on one or two easily measured features such as cell proliferation
- Methods and systems described herein may feature generative hypotheses.
- the unbiased machine learning approach can enable its user to generate hypotheses by allowing the machine to discover correlations, after which models are inspected to understand specific biological changes occurring between populations.
- Methods and systems described herein may feature rapid assessment.
- the machine learning approach can enable biomarker discovery and drug screening analyses to be performed extremely quickly without requiring manual creation of specific biological hypotheses or manual measurement, feature analysis, or analytical coding. These methods can be deployed rapidly, with timeframes from sample acquisition to processing to analysis completed in weeks or less. Once the analysis process is created, future analyses can be performed without requiring customize analytical pipelines, even when experimental parameters like cell types, stains, or compounds are changed.
- Methods and systems described herein may feature wide applicability.
- the machine learning approach can be easily transitioned from one cell type or experimental process to another without requiring new coding or analysis, which are usually needed in other approaches to measure new features or analyze new experimental contexts.
- the present disclosure provides methods and systems of using machine learning to create and train a biological age predictor (e.g., using training datasets). Such biological age predictors may be used to predict the biological age of a given biological sample obtained from a subject.
- FIG. 1 illustrates an example workflow for predicting the biological age of a sample, including sample selection, pre-processing, machine learning, and biological age prediction, according to disclosed embodiments.
- Sample selection may include, for example, preparing cell cultures (e.g., multiple cell types such as skin, muscle, and/or liver obtained from human and/or animal subjects) and/or tissue cross-sections (e.g., multiple tissue types such as skin, muscle, and/or liver obtained from human and/or animal subjects). Samples may be prepared using any number of preparation steps designed to highlight certain features or phenotypic properties that are desired for machine learning detection.
- samples are prepared using a subset of stains designed to highlight specific morphological features and/or certain components of the sample, such as a specific protein. Additionally, the samples are properly labeled for use during machine learning training. These labels may include chronological age as well as other relevant features like age-related diseases, progression, or relevant clinical metadata (in the case of human samples). Certain features may be automatically labeled using a feature extractor which can detect macro features in the dataset for use by the training algorithm.
- the samples may undergo pre-processing in order to generate data using the prepared sample.
- This can involve any number of data generation steps depending on the sample type and machine learning system that will be used, such as imaging, sequencing, -omics measurements (genomics, proteomics, metabolomics, etc.), or any other distillation of digital data or combination thereof taken from the prepared samples.
- This raw data may then be combined with the labels to be fed into the machine learning system. Additionally, combinations of transforms may be applied on this raw data for the purpose of data augmentation which aids in generalization for the machine learning process.
- the pre-processing steps may include, for example, imaging (e.g., by microscopy with specific stain selections and/or automated high- content imaging of cell cultures), epigenetic assays (e.g., gene expression assays), proteomics, and/or metabolomics, thereby generating sample data.
- imaging e.g., by microscopy with specific stain selections and/or automated high- content imaging of cell cultures
- epigenetic assays e.g., gene expression assays
- proteomics e.g., and/or metabolomics
- machine learning techniques e.g., deep learning, machine vision, classical machine learning such as linear regression, and others
- a combination of machine learning techniques may be used to learn from the raw data, such as deep learning,“classical” machine learning (gradient boosting, random forests, support vector machines), and feature engineering to assist those techniques.
- Models may be built that handle each sample type and its associated preparation process well such that the machine learning system can gradually improve itself via repeated experimentation and evaluation until the resulting models, weights, hyperparameters, and feature extractors are capable of successfully predicting biological age for a given sample.
- Different sample types and data generation steps may require different machine learning techniques.
- data produced via imaging may be suitable for machine vision techniques and models to identify correlations and signal in microscopic images.
- Data produced via epigenetic sequencing may be suitable for genomic machine learning techniques and models.
- These approaches share underlying fundamentals (for example, both may use optimization methods such as gradient descent), but the technological approaches used may differ depending on the data type (e.g., images vs. sequencing data).
- the exact model structure may differ depending on the source of the sample (e.g., muscle sample vs. liver sample), and the learned weights of the model may differ depending on many of the processes used during data gathering (e.g., which lab and what sets of equipment and workflows were used to acquire, prepare, and process the samples). Over time, these techniques and models may become more generalized and more and more shareable across multiple sample types and preparation processes.
- a machine learning-based biological age predictor may be trained which is capable of taking input from a specific type of biological sample that went through a specific preparatory process, and generating a prediction of its biological age or biological age-associated features (such as disease progression or other macro biological features).
- the biological age of the sample can be predicted based on a per-sample, in-vitro assessment of biological age using the machine learning outputs.
- FIG. 2 illustrates a process for creating and training a machine-learning driven predictor for a given sample.
- Raw samples e.g., cell cultures, primary cells, and/or tissue cross- sections
- the samples may be processed by sample preparation methods, such as staining (e.g., H & E, immunohistochemistry (IHC), special stains, or combinations thereof).
- the samples may be labeled by manual labeling (e.g., by associating with information such as age, age-related features, or other metadata) or automatic labeling.
- Data may be generated from the prepared and labeled samples, through assays or other measurement techniques such as imaging, sequencing, proteomics, metabolomics, epigenetics, etc.
- Machine learning techniques e.g., deep learning and/or classical machine learning
- a set of features may be extracted from the generated data for machine learning applications.
- the machine-learning driven predictor may be evaluated (e.g., for accurate prediction of biological age) and/or features may be refined, possibly through iterative training and machine learning, to improve or optimize predictor accuracy.
- FIG. 3 illustrates a process for using a machine-learning driven predictor to process a plurality of samples to generate a biological age prediction.
- a plurality of samples e.g., Sample A, Sample B, and Sample C
- subject organisms e.g., mouse, human, monkey, or other animals.
- Each sample in the plurality of samples may be processed for sample preparation and data generation, as described elsewhere herein.
- a machine learning predictor may be created or trained using the sample, and/or applied to the sample.
- the outputs of the machine learning predictors for the plurality of samples may be processed or combined to generate a single biological age prediction and/or certainty for the plurality of samples.
- the plurality of biological ages predicted from the plurality of samples may be averaged together to generate the single biological age prediction.
- one or more mathematical functions may be applied to the plurality of biological ages predicted from the plurality of samples to generate the single biological age prediction.
- the maximum or minimum value among the plurality of biological ages predicted from the plurality of samples may be calculated to generate the single biological age prediction.
- the present disclosure provides a computer-implemented method for determining the biological age of a sample.
- the method for determining the biological age of a sample may comprise obtaining a first sample from a first subject.
- the first sample is a cell sample.
- the cell sample may originate from primary cells or cell lines (e.g., grown cell cultures).
- the cell sample may comprise cells collected from or derived from one or more organs or tissues.
- the cell sample may be a skin, fibroblast, muscle, blood, liver, heart, spleen, thymus, and/or brain cell sample.
- the first sample is a tissue sample (e.g., a tissue cross-section).
- the tissue sample may comprise tissues collected from or derived from one or more organs or tissues.
- the tissue sample may be a fibroblast, skin, muscle, blood, liver, and/or brain tissue sample.
- Samples may be drawn from subjects such as humans or animals.
- Subjects may exhibit an aging symptom.
- aging symptoms include muscle wasting (sarcopenia), slower wound healing, skin growths, rough skin, dry skin, loose facial skin, transparent skin, decreased skin elasticity, wrinkling, sagging skin, whitening of hair, graying of hair, increased susceptibility to infection, greater risk of heat stroke or hypothermia, decrease in height, increased susceptibility to breaking bones, joint changes, stooped posture, osteoarthritis, frailty, slowed movement, limited movement, decrease in energy, constipation, urinary incontinence, impairment of thought, impairment of memory, impairment of thinking, dementia, reduced reflexes, reduced coordination, increased difficulty with balance, decreased visual acuity, diminished peripheral vision, increase risk for developing presbyopia, hearing loss, decreased fertility, menopause, increased susceptibility to developing atherosclerosis, or weight loss.
- aging symptoms such as muscle wasting (sarcopenia), slower wound healing, skin growths, rough skin, dry skin, loose facial skin, transparent skin, decreased skin elasticity, wrinkling, sagging skin, whitening of hair, or graying of hair may be commonly observed in subjects exhibiting aging symptoms.
- Subjects may exhibit a symptom associated with an age- related disorder, such as Hutchinson-Gilford Progeria Syndrome (HGPS) or Werner Syndrome.
- HGPS Hutchinson-Gilford Progeria Syndrome
- Werner Syndrome Werner Syndrome
- the method for determining the biological age of a sample may comprise labeling the first sample with a label to generate a labeled sample. Such labels may be used for training the biological age. Samples may be labeled by attributing a set of one or more characteristics to the sample, such as, chronological age, age- related diseases, progression, clinical metadata, or a combination thereof.
- Samples may be labeled by attributing information (e.g., measurements) of the sample (sample data), which may be obtained by, for example, imaging, morphological profiling, cell painting, mass spectrometry, antibody chips, 2-F Fluorescence Difference Gel Electrophoresis (DIGE), mass spectrometric immunoassay (MSIA), or laser capture microdissection (LCM).
- samples may be labeled by attributing information (e.g., measurements) of the sample (sample data), which may be obtained by, for example, imaging, morphological profiling, cell painting, mass spectrometry, antibody chips, 2-F Fluorescence Difference Gel Electrophoresis (DIGE), mass spectrometric immunoassay (MSIA), or laser capture microdissection (LCM).
- DIGE 2-F Fluorescence Difference Gel Electrophoresis
- MSIA mass spectrometric immunoassay
- LCDM laser capture microdissection
- the method for determining the biological age of a sample may comprise performing a first assay on the labeled sample to generate a first sample data.
- performing the first assay on the labeled sample may comprise staining the first sample.
- stains used to stain samples include DAPI (4', 6- Diamidino-2-phenylindole dihydrochloride), H&E (Haemotoxylin and Eosin), HES (hematoxylin eosin saffron), Luna stain, Herovici stain, Van Gieson (EVG), and stains used to identify cellular or sub-cellular features, proteins, or other characteristics (e.g., lipofuscin, lysosomes, P16, P19, beta-galactosidase, LC3, ubiquitin, mitochondria, DNA damage, distribution of organelles, nuclear lamina, cell activation, CCR2, soma size, neurites, cytoskeletal structure, or membrane ruffling).
- DAPI 6- Diamidino-2-phenylindole dihydrochloride
- H&E Haemotoxylin and Eosin
- HES hematoxylin eosin saffron
- Luna stain
- the sample data may comprise staining information of the sample, such as an image.
- the image data of a sample may be segmented into a plurality of 2D slices, and wherein the detection structure employs the convolutional neural network to screen locations in each of the plurality of 2D slices of the segmented first sample data by a sliding window methodology to identify features and classify the features.
- features may include specific morphological features (e.g.
- features may also include IGF-l, EGF, c-fos, senescence-associated-b- galactosidase (SA-P-GAL), senescence-associated heterochromatin foci (SAHF), promyelocytic leukemia protein nuclear bodies (PML NBs), DNA, RNA, chromosome, annexin A5, and an inflammatory secretome.
- IGF-l IGF-l
- EGF eGF-associated-b- galactosidase
- SA-P-GAL senescence-associated heterochromatin foci
- SAHF senescence-associated heterochromatin foci
- PML NBs promyelocytic leukemia protein nuclear bodies
- the method for determining the biological age of a sample may comprise applying, by a computer comprising a processor configured to execute a computer program including instructions, executable by the processor, to apply a machine learning detection structure to the first sample data.
- the detection structure may employ machine learning to screen locations in the first sample data to identify features and classify the features to the label. Further, the detection structure may employ machine learning to determine the biological age of the first sample based at least in part on the identified and classified features.
- the detection structure may also employ machine learning to determine, upon applying the machine learning detection structure to a second sample data obtained from a second assay of a second sample of a second subject, the biological age of the second subject.
- the biological age of the second subject may be determined based at least in part on a second feature identified in the second sample data.
- the features may comprise the second feature.
- the first assay performed on the first sample of the first subject and the second assay performed on the second sample of the second subject may be the same type of assays. Alternatively, the first assay performed on the first sample of the first subject and the second assay performed on the second sample of the second subject may be different types of assays.
- types of assays performed on samples may include staining or an epigenetic assay.
- the first sample data obtained from the first assay and the second sample data obtained from the second assay may be the same type of sample data (e.g., image data).
- the first sample data obtained from the first assay and the second sample data obtained from the second assay may be different types of sample data.
- types of sample data may include image data, proteomics data, or metabolomics data.
- the method may determine a biological age of the sample by determining a specific age of the sample, for example, about 1, 2, 3, 4, 5, 6, or 7 days; about 1, 2, 3, or 4 weeks; about 1, 2, 3, 4, 5, 6, 7, 8, 9, 10, 11, or 12 months; or about 1, 2, 3, 4, 5, 6, 7, 8, 9, 10, 15, 20, 25, 30, 35, 40, 45, 50, 55, 60, 65, 70, 75, 80, 85, 90, 95, 100, or more than 100 years.
- Determining the specific age of a sample may also include determining an expected mean error for the determined specific age, such as about 1, 2, 3, 4, 5, 6, or 7 days; about 1, 2, 3, or 4 weeks; about 1, 2, 3, 4, 5, 6, 7, 8, 9, 10, 11, or 12 months; or about 1, 2, 3, 4, 5, 6, 7, 8, 9, or 10 years.
- the specific age of a sample may be determined with an expected mean error of no more than about 1, 2, 3, 4, 5, 6, 7, 8, 9, 10, 11, or 12 months; or no more than about 1, 2, 3, 4, 5,
- Determining the specific age of a sample may also include determining a confidence interval for the determined specific age, such as plus or minus about 1, 2, 3, 4, 5, 6, or 7 days; about 1, 2, 3, or 4 weeks; about 1, 2, 3, 4, 5, 6, 7, 8, 9, 10, 11, or 12 months; or about 1, 2, 3, 4, 5, 6, 7, 8, 9, or 10 years.
- the method may determine biological age of the sample by determining an age range of the sample, for example, between about 1-5 years, 5-10 years, 10-15 years, 15-20 years, 20-25 years, 25-30 years, 30-35 years, 35-40 years, 40-45 years, 45-50 years, 50-55 years, 55-60 years, 60-65 years, 65-70 years, 70-75 years, 75-80 years, 80-85 years, 85-90 years, 90-95 years, 95-100 years, 1-10 years, 10-20 years, 20-30 years, 30-40 years, 40-50 years, 50-60 years, 60-70 years, 70-80 years, 80-90 years, or 90-100 years.
- the method may determine biological age of the sample by determining a relative age of the first sample in comparison to the second sample, for example, about 1, 2, 3, 4, 5, 6, 7, 8, 9, 10, 15, 20, 25, 30, 35, 40, 45, 50, 55, 60, 65, 70, 75,
- the method may determine a likelihood of the biological age of the sample falling within the determined age range of the sample, such as at least about 50%, at least about 55%, at least about 60%, at least about 65%, at least about 70%, at least about 75%, at least about 80%, at least about 85%, at least about 90%, at least about 95%, at least about 96%, at least about 97%, at least about 98%, or at least about 99%.
- the method may determine biological age of the sample by classifying the sample into a determined categorical age among a set of two or more categorical ages (e.g., (“young” vs. “old ⁇ , (“young” vs.“middle-aged” vs.“old” ⁇ ).
- the set of two or more categorical ages may comprise about 2, about 3, about 4, about 5, about 6, about 7, about 8, about 9, about 10, or more than about 10 distinct categorical ages.
- the method may determine a likelihood of the biological age of the sample falling within the determined categorical age of the sample, such as at least about 50%, at least about 55%, at least about 60%, at least about 65%, at least about 70%, at least about 75%, at least about 80%, at least about 85%, at least about 90%, at least about 95%, at least about 96%, at least about 97%, at least about 98%, or at least about 99%.
- the method may determine biological age of the sample with an accuracy (e.g., accuracy of classifying the sample into the determined categorical age among a set of two or more categorical ages) of at least about 50%, at least about 55%, at least about 60%, at least about 65%, at least about 70%, at least about 75%, at least about 80%, at least about 85%, at least about 90%, at least about 95%, at least about 96%, at least about 97%, at least about 98%, or at least about 99%.
- accuracy e.g., accuracy of classifying the sample into the determined categorical age among a set of two or more categorical ages
- the method may determine biological age of the sample with a sensitivity (e.g., sensitivity of classifying the sample into the determined categorical age among a set of two or more categorical ages) of at least about 50%, at least about 55%, at least about 60%, at least about 65%, at least about 70%, at least about 75%, at least about 80%, at least about 85%, at least about 90%, at least about 95%, at least about 96%, at least about 97%, at least about 98%, or at least about 99%.
- a sensitivity e.g., sensitivity of classifying the sample into the determined categorical age among a set of two or more categorical ages
- the method may determine biological age of the sample with a specificity (e.g., specificity of classifying the sample into the determined categorical age among a set of two or more categorical ages) of at least about 50%, at least about 55%, at least about 60%, at least about 65%, at least about 70%, at least about 75%, at least about 80%, at least about 85%, at least about 90%, at least about 95%, at least about 96%, at least about 97%, at least about 98%, or at least about 99%.
- a specificity e.g., specificity of classifying the sample into the determined categorical age among a set of two or more categorical ages
- the method may determine biological age of the sample with a specificity (e.g., specificity of classifying the sample into the one categorical age among a set of two or more categorical ages) of at least about 50%, at least about 55%, at least about 60%, at least about 65%, at least about 70%, at least about 75%, at least about 80%, at least about 85%, at least about 90%, at least about 95%, at least about 96%, at least about 97%, at least about 98%, or at least about 99%.
- a specificity e.g., specificity of classifying the sample into the one categorical age among a set of two or more categorical ages
- the method may determine biological age of the sample with a positive predictive value (PPV) (e.g., PPV of classifying the sample into the determined categorical age among a set of two or more categorical ages) of at least about 50%, at least about 55%, at least about 60%, at least about 65%, at least about 70%, at least about 75%, at least about 80%, at least about 85%, at least about 90%, at least about 95%, at least about 96%, at least about 97%, at least about 98%, or at least about 99%.
- PPV positive predictive value
- the method may determine biological age of the sample with a negative predictive value (NPV) (e.g., NPV of classifying the sample into the determined categorical age among a set of two or more categorical ages) of at least about 50%, at least about 55%, at least about 60%, at least about 65%, at least about 70%, at least about 75%, at least about 80%, at least about 85%, at least about 90%, at least about 95%, at least about 96%, at least about 97%, at least about 98%, or at least about 99%.
- NPV negative predictive value
- the method may determine biological age of the sample with an Area Under
- Curve (AUC) of the Receiver Operator Characteristic (ROC) (e.g., AUC of classifying the sample into the determined categorical age among a set of two or more categorical ages) of at least about 0.50, at least about 0.55, at least about 0.60, at least about 0.65, at least about 0.70, at least about 0.75, at least about 0.80, at least about 0.85, at least about 0.90, at least about 0.95, at least about 0.96, at least about 0.97, at least about 0.98, or at least about 0.99.
- ROC Receiver Operator Characteristic
- the machine learning detection structure may comprise a neural network.
- the neural network may comprise a convolutional neural network (CNN).
- the convolutional neural network (CNN) may comprise a deep convolutional neural network (DCNN) (e.g., comprising multiple layers).
- the deep convolutional neural network (DCNN) may comprise a cascaded deep convolutional neural network.
- the CNN may comprise a simplified CNN or a shallow CNN (e.g., comprising one feature layer and/or one hidden layer).
- the biological age predictor may comprise a combination of deep learning architectures and/or other machine learning techniques, cascaded or chained together.
- these cascades of machine learning architectures may be configured to generate intermediate results that are better processed by later parts in the chain or cascade, or to help interpret partial results coming from different parts of the chain or cascade.
- deep learning architectures may comprise any combination of one or multiple convolutional neural networks (CNN), recurrent neural networks, and/or generative adversarial networks.
- machine learning techniques such as gradient boosting, random forests, and/or support vector machines may be incorporated into the biological age predictor.
- the biological age predictor may also be trained using training datasets using suitable methods appropriate for the one or more types of machine learning architectures used in the biological age predictor.
- the computer program may include instructions, executable by the processor, to apply to the first sample data a network structure, such as a recurrent neural network structure or a general adversarial network structure.
- the results obtained from applying the machine learning detection structure may be combined with results obtained from applying the network structure to determine the biological age of the sample.
- the computer program may include instruction, executable by the processor, to apply to the first sample data a machine learning technique, such as gradient boosting, random forests, and support vector machines.
- the results obtained from applying the machine learning detection structure may be combined with results from applying the machine learning technique.
- the present disclosure provides a computer-implemented method of determining the effectiveness of a substance by using a biological age predictor comprising: (a) providing data of a sample to said biological age predictor, wherein said biological age predictor identifies an aging factor; and (b) provide a substance to a subject based on said aging factor.
- the computer-implemented method further comprises providing data of a second sample from said subject subsequent to providing said substance, wherein said biological age predictor applies machine learning to determine the biological age of said second sample.
- the biological age predictor applies machine learning to identify an aging factor.
- the present disclosure provides a computer-implemented method of identifying a druggable factor by using a biological age predictor.
- the method of identifying a druggable factor by using a biological age predictor may comprise providing data of a sample to the biological age predictor, generating a biological age from the biological age predictor, and identifying a druggable factor from the biological age predictor.
- the druggable factor may be a characteristic associated with aging, as described elsewhere herein.
- the method of identifying a druggable factor by using a biological age predictor may further comprise providing an active ingredient based on the identified druggable factor.
- the present disclosure provides a computer-implemented method of determining the biological age of a sample using a biological age predictor.
- the method of determining the biological age of a sample using a biological age predictor may comprise providing data of a sample to the biological age predictor.
- the biological age predictor may generate a biological age.
- the method of determining the biological age of a sample using a biological age predictor may identify a feature without any input data by a user. In other words, the data of the sample provided to the biological age predictor may contain no user input to identify a feature.
- the present disclosure provides a method of using a biological age predictor.
- the method of using a biological age predictor may comprise receiving initial data comprising a predicted biological age value from the biological age predictor.
- the method of using a biological age predictor may comprise automatically labeling the initial data with an extraction program, thereby producing labeled data.
- the extraction program may detect and uniquely label a desired feature with a first label.
- the method of using a biological age predictor may comprise processing the labeled data for use in a second biological age predictor.
- the second biological age predictor may be configured to determine the biological age of a sample subject based at least in part on identification of the desired feature.
- the present disclosure provides a method of using a biological age predictor for drug discovery.
- the method is a computer-implemented method.
- the method of using a biological age predictor for drug discovery may comprise providing data of a sample to the biological age predictor.
- the biological age predictor may generate a first biological age for the sample.
- the biological age predictor applies machine learning to generate a first biological age.
- the method of using a biological age predictor for drug discovery may comprise treating the sample with an active ingredient, thereby generating a treated sample.
- the method of using a biological age predictor for drug discovery may comprise providing data of the treated sample to the biological age predictor.
- the biological age predictor may generate a second biological age for the treated sample.
- the biological age predictor applies machine learning to generate a second biological age.
- the sample is a cell sample.
- the cell sample may originate from primary cells or cell lines (e.g., grown cell cultures).
- the cell sample may comprise cells collected from or derived from one or more organs or tissues.
- the cell sample may be a skin, fibroblast, muscle, blood, liver, heart, spleen, thymus, myobast, keratinocyte, and/or brain cell sample.
- the sample is a tissue sample (e.g., a tissue cross- section).
- the tissue sample may comprise tissues collected from or derived from one or more organs or tissues.
- the tissue sample may be a fibroblast, skin, muscle, blood, liver, myobast, keratinocyte, and/or brain tissue sample.
- the biological age predictor may be a computer-implemented system which is trained to determine the biological age of the sample.
- the data provided to the biological age predictor may comprise an image, an epigenetic profile, a proteomic profile, or a metabolomics profile.
- the data may identify cell morphology, biomarkers, or cellular components.
- the substance to treat the sample, such as an active ingredient may be a drug or potential drug, such as an anti-aging agent, a new drug entity, or an FDA approved drug entity.
- the substance is a new drug entity.
- the active ingredient or candidates for the active ingredient may be identified or evaluated based on, for example, performing searches through tissue or cell samples, such as blood or plasma, for an aging factor or druggable targets (e.g., factors or proteins).
- an aging factor or druggable targets e.g., factors or proteins
- such aging factor or druggable targets or candidates for aging factors or druggable targets may be identified based on studies involving parabiosis, plasma injection, and/or blood transfusion.
- anti-aging compounds include oxytocin, TGFbeta, Wnt3a, Klotho, ALK5 inhibitor II, and PP242.
- the method of using a biological age predictor for drug discovery may further comprise comparing the first biological age and the second biological age.
- the effect of the active ingredient on the biological age of the sample may be assessed. For example, if the second biological age is less than the first biological age, then the effect of the active ingredient was to decrease the biological age of the sample. For example, if the second biological age is more than the first biological age, then the effect of the active ingredient was to increase the biological age of the sample. In some embodiments, the biological age of the second biological age is less than the first biological age.
- the method of using a biological age predictor for drug discovery may determine the first biological age and the second biological age of the sample by determining a specific age of the sample, for example, about 1, 2, 3, 4, 5, 6, or 7 days; about 1, 2, 3, or 4 weeks; about 1, 2, 3, 4, 5, 6, 7, 8, 9, 10, 11, or 12 months; or about 1, 2, 3, 4, 5, 6, 7, 8, 9, 10, 15, 20, 25, 30, 35, 40,
- Determining the specific age of a sample may also include determining an expected mean error for the determined specific age, such as about 1, 2, 3, 4, 5, 6, or 7 days; about 1, 2, 3, or 4 weeks; about 1, 2, 3, 4, 5, 6, 7, 8,
- the specific age of a sample may be determined with an expected mean error of no more than about 1, 2, 3, 4, 5, 6, 7, 8, 9, 10, 11, or 12 months; or no more than about 1, 2, 3, 4, 5, 6, 7, 8, 9, or 10 years.
- the method of using a biological age predictor for drug discovery may determine biological age of the sample by determining an age range of the sample, for example, between about 1-5 years, 5- 10 years, 10-15 years, 15-20 years, 20-25 years, 25-30 years, 30-35 years, 35-40 years, 40-45 years, 45-50 years, 50-55 years, 55-60 years, 60-65 years, 65-70 years, 70-75 years, 75-80 years, 80-85 years, 85-90 years, 90-95 years, 95-100 years, 1-10 years, 10-20 years, 20-30 years, 30-40 years, 40-50 years, 50-60 years, 60-70 years, 70-80 years, 80-90 years, or 90-100 years.
- the method of using a biological age predictor for drug discovery may determine the first biological age and the second biological age of the sample by determining a relative age of the untreated sample in comparison to the treated sample, for example, about 1, 2, 3, 4, 5, 6, 7, 8, 9, 10, 15, 20, 25, 30, 35, 40, 45, 50, 55, 60, 65, 70, 75, 80, 85, 90, 95, 100, or more than 100 years older than the treated sample; or about 1, 2, 3, 4, 5, 6, 7, 8, 9, 10, 15, 20, 25, 30, 35, 40, 45, 50, 55, 60, 65, 70, 75, 80, 85, 90, 95, 100, or more than 100 years younger than the treated sample.
- the present disclosure provides a computer-implemented system comprising: a digital processing device comprising: (a) a processor; (b) an operating system configured to perform executable instructions; (c) a memory; and (d) a computer program including instructions executable by the digital processing device to create an application applying machine learning detection structures to a plurality of sample data to determine the biological age of a sample.
- the application may comprise a software module applying a machine learning detection structure to the plurality of sample data.
- the detection structure may employ machine learning to screen locations in the sample to identify a feature, and classify the feature.
- the application may comprise a software module automatically generating a report.
- the report may contain information including the biological age of the sample from which the sample data was derived.
- the machine learning detection structure may comprise a neural network.
- the neural network may comprise a convolutional neural network (CNN).
- the convolutional neural network (CNN) may comprise a deep convolutional neural network (DCNN) (e.g., comprising multiple layers).
- the deep convolutional neural network (DCNN) may comprise a cascaded deep convolutional neural network.
- the CNN may comprise a simplified CNN or a shallow CNN (e.g., comprising one feature layer and/or one hidden layer).
- the methods described herein comprise DCNN.
- the application of the system may run in real-time or near-real time, and generate a real-time or near real-time report containing information including the biological age of the sample.
- the plurality of sample data may be obtained by imaging, morphological profiling, cell painting, mass spectrometry, antibody chips, 2-F Fluorescence Difference Gel Electrophoresis (DIGE), mass spectrometric immunoassay (MSIA), or laser capture microdissection (LCM).
- the plurality of sample data may comprise image data.
- the application of the system may further comprise a software module performing image preprocessing of the plurality of the sample data.
- the image preprocessing may include, for example, normalization, image enhancement, image correction, contrast enhancement, brightness enhancement, filtering with one or more filters, transformation, increasing image resolution, decreasing image resolution, increasing bit resolution, decreasing bit resolution, increasing image size, decreasing image size, increasing field-of-view, decreasing field-of-view, background subtraction, noise or artifact subtraction, image subtraction, lossy compression, or lossless compression.
- the normalization may include, for example,
- the normalization may include, for example, normalization of image format, image slice spacing, image intensity, image contrast, image saturation, image size, image orientation, or other image data properties of the image data.
- the plurality of sample data may be segmented into a plurality of 2D slices.
- the detection structure may employ the convolutional neural network (CNN) to screen locations in a portion of or each of the plurality of 2D slices of the segmented sample data.
- CNN convolutional neural network
- the convolutional neural network (CNN) may use a sliding window methodology to identify the features and classify the features.
- the convolutional neural network may have 2 to 64 convolutional layers and 1 to 8 fully connected layers.
- the convolutional neural network may have 2, 4, 8, 16, 32, 64, or more convolutional layers and 1, 2, 3, 4, 5, 6, 7, 8, or more fully connected layers.
- the sliding window may have less than about 4,000 pixels by less than about 4,000 pixels, less than about 2,000 pixels by less than about 2,000 pixels, less than about 1,000 pixels by less than about 1,000 pixels, less than about 512 pixels by less than about 512 pixels, less than about 256 pixels by less than about 256 pixels, less than about 128 pixels by less than about 128 pixels, less than about 64 pixels by less than about 64 pixels, less than about 32 pixels by less than about 32 pixels, less than about 16 pixels by less than about 16 pixels, less than about 8 pixels by less than about 8 pixels, or less than about 4 pixels by less than about 4 pixels.
- the sliding window may have a first dimension (e.g., along the x-axis) or less than 100, less than 500, less than 1,000, less than 2,000, less than 3,000, less than 4,000, or less than 5,000 pixels; and may have a second dimension (e.g., along the y-axis) or less than 100, less than 500, less than 1,000, less than 2,000, less than 3,000, less than 4,000, or less than 5,000 pixels.
- the convolutional neural network (CNN) may comprise a neural network instance selected randomly from a plurality of neural network instances.
- the second convolutional neural network (CNN) may comprise a neural network instance selected randomly from a plurality of neural network instances.
- the application of the system may include a software module performing post- processing of one or a plurality of refined locations.
- the post-processing may include characterizing centroid location, volume, shape, intensity, density, transparency, regularity, or a combination thereof.
- the generated report may contain information about the sample data.
- the generated report may contain an informational overlay on the sample data.
- the generated report may contain a sample data heat mapped to indicate confidence level.
- the generated report may contain a time course of a disease or growth and movement of a tumor over time.
- the time course may be generated by applying the application to medical images captured at two or more time points to measure progression of the disease or growth and movement of the tumor over time.
- the machine learning detection structure may be trained to identify disease related outcomes.
- the machine learning detection structure may be trained to identify critical clinical signs of a disease.
- the machine learning detection structure may be trained using supervised learning and labeled training data, such as sample data labeled by a human expert and/or subjected to preprocessing for normalization.
- the application of the system may determine a biological age of the sample by determining a specific age of the sample, for example, about 1, 2, 3, 4, 5, 6, or 7 days; about 1, 2, 3, or 4 weeks; about 1, 2, 3, 4, 5, 6, 7, 8, 9, 10, 11, or 12 months; or about 1, 2, 3, 4, 5, 6, 7, 8, 9, 10, 15, 20, 25, 30, 35, 40, 45, 50, 55, 60, 65, 70, 75, 80, 85, 90, 95, 100, or more than 100 years.
- the application of the system may determine biological age of the sample by determining an age range of the sample, for example, between about 1-5 years, 5-10 years, 10-15 years, 15-20 years, 20-25 years, 25-30 years, 30-35 years, 35-40 years, 40-45 years, 45-50 years, 50-55 years, 55-60 years, 60-65 years, 65-70 years, 70-75 years, 75-80 years, 80-85 years, 85-90 years, 90-95 years, 95-100 years, 1-10 years, 10-20 years, 20-30 years, 30-40 years, 40-50 years, 50-60 years, 60-70 years, 70-80 years, 80-90 years, or 90-100 years.
- the application of the system may determine biological age of the sample by determining a relative age of the sample in comparison to an additional sample, for example, about 1, 2, 3, 4, 5, 6, 7, 8, 9, 10, 15, 20, 25, 30, 35, 40, 45, 50,
- the present disclosure provides a non-transitory computer readable storage medium encoded with a computer program including instructions executable by a processor to create an application applying machine learning to a plurality of sample data to determine the biological age of a sample.
- the application may comprise a software module applying a machine learning detection structure to the plurality of sample data.
- the detection structure may employ machine learning to screen locations in the plurality of sample data to identify a feature and classify the feature.
- the application may comprise a software module automatically generating a report comprising the biological age of a sample from which the sample data was derived.
- the machine learning detection structure may comprise a neural network.
- the neural network may comprise a convolutional neural network (CNN).
- the convolutional neural network (CNN) may comprise a deep convolutional neural network (DCNN) (e.g., comprising multiple layers).
- the deep convolutional neural network (DCNN) may comprise a cascaded deep convolutional neural network.
- the CNN may comprise a simplified CNN or a shallow CNN (e.g., comprising one feature layer and/or one hidden layer).
- the methods disclosed herein comprise DCNN.
- FIG. 4 shows a computer system 401 that is programmed or otherwise configured to: apply a machine learning detection structure to sample data, employ machine learning to screen locations in sample data, identify features, classify features to labels, or determine biological ages of subjects based at least in part on the identified and classified features.
- the computer system 401 can regulate various aspects of methods and systems of the present disclosure, such as, for example, applying a machine learning detection structure to sample data, employing machine learning to screen locations in sample data, identifying features, classifying features to labels, and determining biological ages of subjects based at least in part on the identified and classified features.
- the computer system 401 can be an electronic device of a user or a computer system that is remotely located with respect to the electronic device.
- the electronic device can be a mobile electronic device.
- the computer system 401 includes a central processing unit (CPU, also“processor” and“computer processor” herein) 405, which can be a single core or multi core processor, or a plurality of processors for parallel processing.
- the computer system 401 also includes memory or memory location 410 (e.g., random-access memory, read-only memory, flash memory), electronic storage unit 415 (e.g., hard disk), communication interface 420 (e.g., network adapter) for communicating with one or more other systems, and peripheral devices 425, such as cache, other memory, data storage and/or electronic display adapters.
- the memory 410, storage unit 415, interface 420 and peripheral devices 425 are in communication with the CPU 405 through a communication bus (solid lines), such as a motherboard.
- the storage unit 415 can be a data storage unit (or data repository) for storing data.
- the computer system 401 can be operatively coupled to a computer network (“network”) 430 with the aid of the
- the network 430 can be the Internet, an internet and/or extranet, or an intranet and/or extranet that is in communication with the Internet.
- the network 430 in some cases is a telecommunication and/or data network.
- the network 430 can include one or more computer servers, which can enable distributed computing, such as cloud computing.
- the network 430 in some cases with the aid of the computer system 401, can implement a peer-to- peer network, which may enable devices coupled to the computer system 401 to behave as a client or a server.
- the CPU 405 can execute a sequence of machine-readable instructions, which can be embodied in a program or software.
- the instructions may be stored in a memory location, such as the memory 410.
- the instructions can be directed to the CPU 405, which can
- CPU 405 subsequently program or otherwise configure the CPU 405 to implement methods of the present disclosure.
- operations performed by the CPU 405 can include fetch, decode, execute, and writeback.
- the CPU 405 can be part of a circuit, such as an integrated circuit.
- a circuit such as an integrated circuit.
- One or more other components of the system 401 can be included in the circuit.
- the circuit is an application specific integrated circuit (ASIC).
- ASIC application specific integrated circuit
- the storage unit 415 can store files, such as drivers, libraries and saved programs.
- the storage unit 415 can store user data, e.g., user preferences and user programs.
- the computer system 401 in some cases can include one or more additional data storage units that are external to the computer system 401, such as located on a remote server that is in communication with the computer system 401 through an intranet or the Internet.
- the computer system 401 can communicate with one or more remote computer systems through the network 430.
- the computer system 401 can communicate with a remote computer system of a user.
- remote computer systems include personal computers (e.g., portable PC), slate or tablet PC’s (e.g., Apple® iPad, Samsung® Galaxy Tab), telephones, Smart phones (e.g., Apple® iPhone, Android-enabled device, Blackberry®), or personal digital assistants.
- the user can access the computer system 401 via the network 430.
- Methods as described herein can be implemented by way of machine (e.g., computer processor) executable code stored on an electronic storage location of the computer system 401, such as, for example, on the memory 410 or electronic storage unit 415.
- the machine executable or machine readable code can be provided in the form of software.
- the code can be executed by the processor 405.
- the code can be retrieved from the storage unit 415 and stored on the memory 410 for ready access by the processor 405.
- the electronic storage unit 415 can be precluded, and machine-executable instructions are stored on memory 410.
- the code can be pre-compiled and configured for use with a machine having a processer adapted to execute the code, or can be compiled during runtime.
- the code can be supplied in a programming language that can be selected to enable the code to execute in a pre- compiled or as-compiled fashion.
- Machine-executable code can be stored on an electronic storage unit, such as memory (e.g., read-only memory, random-access memory, flash memory) or a hard disk.
- “Storage” type media can include any or all of the tangible memory of the computers, processors or the like, or associated modules thereof, such as various semiconductor memories, tape drives, disk drives and the like, which may provide non-transitory storage at any time for the software programming. All or portions of the software may at times be communicated through the Internet or various other telecommunication networks. Such communications, for example, may enable loading of the software from one computer or processor into another, for example, from a management server or host computer into the computer platform of an application server.
- another type of media that may bear the software elements includes optical, electrical and electromagnetic waves, such as used across physical interfaces between local devices, through wired and optical landline networks and over various air-links.
- a machine readable medium such as computer-executable code
- a tangible storage medium such as computer-executable code
- Non-volatile storage media include, for example, optical or magnetic disks, such as any of the storage devices in any computer(s) or the like, such as may be used to implement the databases, etc. shown in the drawings.
- Volatile storage media include dynamic memory, such as main memory of such a computer platform.
- Tangible transmission media include coaxial cables; copper wire and fiber optics, including the wires that comprise a bus within a computer system.
- Carrier-wave transmission media may take the form of electric or electromagnetic signals, or acoustic or light waves such as those generated during radio frequency (RF) and infrared (IR) data communications.
- RF radio frequency
- IR infrared
- Common forms of computer-readable media therefore include for example: a floppy disk, a flexible disk, hard disk, magnetic tape, any other magnetic medium, a CD-ROM, DVD or DVD-ROM, any other optical medium, punch cards paper tape, any other physical storage medium with patterns of holes, a RAM, a ROM, a PROM and EPROM, a FLASH-EPROM, any other memory chip or cartridge, a carrier wave transporting data or instructions, cables or links transporting such a carrier wave, or any other medium from which a computer may read programming code and/or data.
- Many of these forms of computer readable media may be involved in carrying one or more sequences of one or more instructions to a processor for execution.
- the computer system 401 can include or be in communication with an electronic display 435 that comprises a user interface (E ⁇ ) 440 for providing, for example, user selection of algorithms, binding measurement data, candidate proteins, and databases.
- E ⁇ user interface
- Examples of ET’s include, without limitation, a graphical user interface (GET) and web-based user interface.
- Methods and systems of the present disclosure can be implemented by way of one or more algorithms.
- An algorithm can be implemented by way of software upon execution by the central processing unit 405.
- the algorithm can, for example, apply a machine learning detection structure to sample data, employ machine learning to screen locations in sample data, identify features, classify features to labels, or determine biological ages of subjects based at least in part on the identified and classified features.
- Example 1 Biological age prediction by analysis of human skin tissue
- Biological age prediction was performed by analysis of human skin tissue. Skin samples were collected from a set of 105 healthy human donors in three different age ranges: 35 donors in a‘young’ age group (18-35 years old, denoted by“Y”), 35 donors in a‘middle-aged’ age group (42-50 years, denoted by“M”), and 35 donors in an‘old’ age group (65-80, denoted by“O”).
- the set of 105 healthy human donors included an uneven mix of female and male subjects (89% female subjects and 11% male subjects). Skin samples were obtained from subjects at bodily locations with reduced sun exposure (e.g., breast, abdomen, and other less exposed areas). No foreskin was obtained for the skin samples.
- Donors having a disease or disorder were excluded from the study. Samples are typically obtained from healthy subjects during aesthetic surgeries, such as abdomen reduction or breast surgery. Only skin phototypes 2 and 3 are included, as defined by the Fitzpatrick skin phototype scale (described by, for example, D’Orazio et ah,“UV Radiation and the Skin,”“Int. J Mol. Sci. 2013, 74(6), 12222-12248, 7 June 2013, which is hereby incorporated by reference in its entirety).
- tissue samples and slides were prepared as follows. Sample acquisition and frozen tissue block preparation were performed by a partner hospital. Specimens were obtained directly from patients during surgery and were frozen down into blocks. The frozen tissue specimens were then sliced with a cryotome at a thickness of 5 microns and placed onto glass slides. At least 3 slides were acquired from each donor, each slide including at least two pieces of tissue from the donor.
- images were acquired as follows. High-resolution full-slide digital images were acquired for all slides using a high-throughput slide scanner. Images were acquired at a magnification of 40X and a resolution of 0.5 microns per pixel. Alternatively, images can be acquired at a magnification of about 2X, 5X, 10X, 20X, 60X, 80X, 100X, 200X, 400X, 600X, 800X, 1000X, or 1500X, and at a resolution of about 1.4, about 1.0, about 0.5, about 0.25, about 0.2, about 0.1, about 0.08, about 0.075, about 0.06, about 0.05, about 0.04, about 0.025, about 0.02, or about 0.01 microns per pixel. The slides were scanned in brightfield.
- the data were prepared as follows. To analyze the biological age of the acquired images, the large high-resolution whole-slide images were first tiled into many smaller square image tiles of 128-, 256-, and 5l2-pixel sizes using a sliding tiling window. This dataset of at least about 6,500 (depending on the pixel sizes chosen) image tiles were partitioned into training and test sets with proportions of 2/3 and 1/3, respectively. The selection was done randomly, but such that any given donor has all of his or her image tiles belonging to either the training set or the test set. Further, all three different partitions or“folds” of the data were tested. Analyses were performed as described below, and the average performance across all three folds is reported, unless otherwise specified.
- the data was analyzed using a machine learning analysis approach as follows. Analyses of the acquired images were performed by first training a deep convolutional neural network. During the training process, images were sampled randomly from the training set using mini-batches of 32 images at a time and inputted to the neural network along with labels representing their true ages. The neural network is configured to calculate a set of predictions for each image, and a ranked probability loss is computed which is indicative of a comparison between the predicted and the true age.
- a standard gradient descent algorithm using an“Adam” optimizer (described by, for example, Kingma et ah,“Adam: A Method for
- the deep convolutional network architecture used may be referred to as“ResNet-
- the first four residual blocks were frozen such that their weights cannot change, and the fifth and final block was unfrozen so as to be able to be updated in the training process described above.
- the ResNet architecture was extended with an additional fully- connected layer that has the same number of outputs as there are classes in the classification structure. That final layer is passed through a softmax activation layer, so as to make the final prediction a probability vector among the classes.
- the training process artificially introduces noise to the training set to help the neural network improve the generalization of its predictive abilities.
- a series of transformation operations were applied at random: a horizontal flip with a probability of 50%, a vertical flip with a probability of 50%, a rotation of 90 degrees with a probability of 25%, a rotation of 180 degrees with a probability of 25%, and a rotation of 270 degrees with a probability of 25%.
- the biological age predictions were produced using a classification system (e.g., predicting age groups) instead of a regression analysis (e.g., predicting numeric age).
- a classification system was selected because the data has a large number of donors in a small number of discrete classes, which makes classification a more suitable study than regression.
- Biological age predictions were validated using the test sets described above in two different manners: prediction of age group of individual image tiles and prediction of age group of donors (by aggregating tile predictions). The final predicted age of a tile was taken as the age group the model assessed with the highest likelihood. The final predicted age of a donor was taken as the certainty-weighted average of all age predictions of its constituent tiles.
- FIGs. 5A-5E The results are illustrated in FIGs. 5A-5E using two approaches.
- FIGs. 5A confusion matrices are shown for all tiles (FIG. 5A, an un-aggregated per-tile confusion matrix for an example fold) and for donors (FIG. 5B, a donor-aggregated confusion matrix) in the validation set.
- These confusion matrices illustrate which age groups were predicted correctly, which were predicted incorrectly, and where the most frequent mistakes were made.
- 5C-5E illustrate un-aggregated“l-vs.-rest” per-tile ROC (receiver-operating characteristic) curves indicating each age group’s“1 vs rest” classification performance, which represents the likelihood of correctly predicting one correct age group versus all other incorrect age groups combined (“Class Y-vs.-rest”,“Class M-vs.-rest”, and“Class O-vs.-rest” per-tile ROC curves for Y vs. M vs. O classification, respectively).
- AUC Average Under the Curve
- Table 1 Accuracy of biological age prediction of human skin tissue samples
- Example 2 Biological age prediction by analysis of mouse skin tissue
- Biological age prediction was performed by analysis of mouse skin tissue. Skin samples were collected from a set of 50 healthy C57BL/6J mice from four separate age groups: 15 mice are 4 months old (denoted by“4”), 10 mice are 12 months old (denoted by“12”), 10 mice are 15 months old (denoted by“15”), and 15 mice are 18 months old (denoted by“18”). Both dorsal and ventral skin samples were collected from each mouse. C57BL/6J mice are typically considered“old” when they reach 18 months old, which roughly correlates to about a 56 to 69-year-old human.
- mice were perfused with normal buffer formalin 10%. Skin samples were obtained and then fixed for 24 to 48 hours after collection in the same buffer, and the samples were shipped in 70% ethanol.
- tissue samples and slides were prepared as follows. Tissues were shipped from a partner lab, which performed sample collection as described in Example 1, to another partner lab that produced paraffin blocks and slides from the samples.
- Tissue samples were prepared in a specific way in order to reduce processing and batching effects on subsequent aging analysis. Each tissue sample was cut into 6 pieces of 5 mm each, and each piece was embedded in an independent paraffin block. This process produced 12 independent paraffin blocks per mouse, 6 from dorsal skin and 6 from ventral skin. Each block was sectioned into slides at a thickness of 5 microns. Each slide contained 6 separate sections of tissues from the same paraffin block, producing a total of 600 slides.
- the slides were stained using HES (hematoxylin eosin saffron) stain. Since the process of staining slides may be able to stain only 20 slides at a time, slides were batched into groups of 20, while ensuring that each batch of slides contained balanced representation of slides across two dimensions of the data: each of the four age groups is represented in each batch at a rate proportional to their presence in the entire dataset (for example, the oldest and youngest groups have more slides in each batch than the middle two groups), and each batch has equal representation of both ventral and dorsal skin samples. This deliberate batching process was performed in order to minimize biases that may be introduced by the per-batch staining process.
- HES hematoxylin eosin saffron
- mice The slides were segmented into smaller square tiles, and each of the mice’s data were partitioned into training and test sets with proportions of 2/3 and 1/3, respectively, while ensuring that no mouse has data appearing in both the training and test sets at the same time.
- FIGs. 6A-6F using confusion matrices (FIGs. 6A-6B, un-aggregated per-tile and donor-aggregated confusion matrices for“4 vs. 12 vs. 15 vs. 18” classification) and ROC plots (FIGs. 6C-6F, un-aggregated“Class 4-vs.-rest”,“Class 12- vs.-rest”,“Class l5-vs.-rest”, and“Class l8-vs.-rest” per-tile ROC curves for 4 vs.
- Example 2 12 vs. 15 vs. 18 classification, respectively), as described in Example 1.
- AUC values of 0.97, 0.85, 0.85, and 0.83 were achieved for the“Class 4-vs.-rest”,“Class l2-vs.-rest”,“Class l5-vs.- rest”, and“Class l8-vs.-rest” classifications, respectively.
- mice show that biological age of mouse skin tissue is predicted with excellent accuracy for both individual tile and mouse predictions, as shown in Table 2. These results for mouse skin tissue shows even higher performance than that for human skin tissue. This observation may be expected, since all below mice are from the same genetic background and raised identically.
- the results for human skin tissue reported in Example 1 are encouraging due to the natural biological variability of humans. This heterogeneity is exacerbated with age. Further, success is reported predicting the biological age of 4-18 month old mice. The machine learning approach may produce even greater accuracy when used to analyze mouse samples of age closer to 24 months.
- Table 2 Accuracy of biological age prediction of mouse skin tissue samples
- a muscle injury model was used which included degeneration of muscle fiber by cardiotoxin: Naja mossambica venom. Under anesthesia, two injections of 5 mL each were performed in the tibialis anterior in the hind leg of each mouse at a concentration of 0.2 mg/mL. Four injections of 10 mL each was also performed in the gastrocnemius at the same
- mice After a sufficient time (about 3 days) to allow the cells to activate and divide but not enough time to fuse into myotubes, the mice were euthanized, and both the tibialis anterior and gastrocnemius of the mice were dissected. The muscle tissues were then incubated in Collagenase type II (250U/mL) at 37°C for 1.5 hours for enzymatic digestion. The muscle was then washed in PBS (phosphate-buffered saline) and mechanically disrupted by triturating and pipetting up and down with a broken end glass Pasteur pipette, thereby dissociating the tissue into muscle fibers.
- PBS phosphate-buffered saline
- the cells were seeded in 384-well matrigel-coated plates at around 3,000 cells per well. Particular attention was made at each step to ensure that any experimenter working with the cells handled both young and old cells at the same time. Again, this step is taken to minimize any experimental bias introduced between young and old samples.
- the plate layout was also specifically designed to minimize experimental bias caused by the well position in the plate (as described in the plate layout section of, for example, Bray et ak,“Cell Painting, a high-content image-based assay for morphological profiling using multiplexed fluorescent dyes,” Nat.
- Desmin antibody, Click IT EdU 647, and counterstain for Hoechst As a first step, before the cells are fixed, the cells were labeled with EdU (5 uM EdU for 30 minutes according to manufacturer’s instructions: Invitrogen catalog #00356). The cells were fixed with 4% PFA in PBS for 20 minutes at room temperature, then permeabilized in a mixture of PBS and 0.3% Triton X-100. The cells were then blocked using Goat Block Buffer at 4°C overnight. The cells were then incubated in Rabbit-anti-Desmin antibody at 1 :200 dilution in Goat Block Buffer at 4°C overnight.
- the cells were then incubated in secondary antibodies and dye for one hour at room temperature using a label mix comprising Cytopainter ER Green (1 : 1000 dilution), Hoechst, and AlexaFluor 568 Gt-a-Rb (1 :500 dilution).
- a label mix comprising Cytopainter ER Green (1 : 1000 dilution), Hoechst, and AlexaFluor 568 Gt-a-Rb (1 :500 dilution).
- the plates were sealed in preparation for imaging.
- a high-throughput automated imager was used to capture 25 non-overlapping fields per well at a magnification of 40X with a separate image captured for each of the 4 stain channels plus brightfield. This image acquisition produced about 30,000 unique non-overlapping field images (2208 pixels wide) per plate (5 channels x 240 wells x 25 fields per well).
- Examples 1 and 2 The cellular image datasets were partitioned into training and test sets with proportions of 2/3 and 1/3, respectively, while ensuring that no mouse has data appearing in both the training and test sets at the same time and that the splits are done in equal proportion among the two age groups. Analyses were performed as described below, and the average performance across three different training and test folds are reported, unless otherwise specified.
- the high-resolution images were also transformed using a standard normalization approach.
- the mean and the standard deviation of the intensity of each image channel was calculated across the entire dataset.
- Each image then had its intensity transformed by subtracting the mean intensity for the whole dataset from each image channel, then having the intensity value divided by the whole dataset’s standard deviation. This created a“zero-mean, unit- variance” dataset across all of the images.
- a single epoch of training for cellular images comprised iterating through all images once. However, because the images are high-resolution and large, they were first down- sampled to half the resolution (1104 pixels wide) and a random 5l2-pixel square crop was first sampled within that field before inputting into the neural network. Hence, only a subset of the data was trained on in a given epoch, but that subset varies with each epoch.
- Duplicate experiments were performed as follows. The above procedure to process the 24 primary myoblast lines was performed twice (including acquiring images, preparing and transforming the data, and analyzing the data using a deep convolutional neural network architecture and the machine learning analysis approach disclosed herein, using two separate collections of 24 primary myoblast lines taken from the original bank of 52 produced as described above. These duplicated experiments produced two separate analyses of the same process for replication purposes.
- FIGs. 7A-7D using confusion matrices (FIGs. 7A-7B, well-aggregated and mouse-aggregated confusion matrices for“Y vs. O” classification) and an ROC plot (FIG. 7C, un-aggregated per- image prediction).
- FIGs. 7A-7D using confusion matrices (FIGs. 7A-7B, well-aggregated and mouse-aggregated confusion matrices for“Y vs. O” classification) and an ROC plot (FIG. 7C, un-aggregated per- image prediction).
- an AUC value of 0.69 was achieved for the“Y vs. O” classification.
- Table 3 Accuracy of biological age prediction of mouse myoblast cell samples
- Example 4 Biological age prediction by analysis of human fibroblast cells
- images were acquired as follows for testing biological age prediction.
- a set of 5 lines of human fibroblasts from young donors and 5 lines of human fibroblasts from old donors were individually cultured, stained, and imaged.
- a high-throughput automated imager was used to capture 100 non-overlapping fields per well (a 10 x 10 matrix) at a magnification of 40X using a Thermo CX7 automated microscope with a separate image captured for each of our 4 stain channels and brightfield. This image acquisition produced about 100,000 unique non-overlapping field images (2208 pixels wide) per plate (5 channels x 200 wells x 100 fields per well).
- the biological age predictions were produced using a classification system (e.g., predicting age groups) in two different manners (using both individual well and aggregated donor predictions).
- the results are illustrated in FIGs. 8A-8C using confusion matrices (FIGs. 8A-8B, well-aggregated and donor- aggregated confusion matrices for“Y vs. O” classification) and an ROC plot (FIG. 8C, un-aggregated per-image prediction).
- an AETC value of 0.98 was achieved for the“Y vs. O” classification.
- Table 4 Accuracy of biological age prediction of human fibroblast cell samples
- Example 5 Biological age prediction by analysis of human keratinocvte cells
- images were acquired as follows for testing biological age prediction.
- a set of 5 lines of human keratinocytes from young donors and 5 lines of human keratinocytes from old donors are individually cultured, stained, and imaged.
- a high-throughput automated imager is used to capture 100 non-overlapping fields per well (a 10 x 10 matrix) at a magnification of 40X using a Thermo CX7 automated microscope with a separate image captured for each of our 4 stain channels and brightfield. This image acquisition produced about 100,000 unique non-overlapping field images (2208 pixels wide) per plate (5 channels x 200 wells x 100 fields per well).
- Example 3 As discussed in Example 4, the biological age predictions were produced using a classification system (e.g., predicting age groups) in two different manners (using both individual well and aggregated donor predictions). The results are illustrated in FIGs. 9A-9C using confusion matrices (FIGs. 9A-9B, well-aggregated and donor- aggregated confusion matrices for“Y vs. O” classification) and an ROC plot (FIG. 9C, un-aggregated per-image prediction). In particular, an AUC value of 0.84 was achieved for the“Y vs. O” classification.
- a classification system e.g., predicting age groups
- Example 6 In vivo tissue-based drug screening of mouse skin tissue
- the machine learning systems and methods for predicting biological age were applied toward accelerating drug screens designed to detect interventions that slow or reverse one or more phenotypes of aging. Such a drug screening approach was tested using proof-of- concept drug screens, including an in vivo drug screening experimental model. This machine learning-based drug screening approach for aging-related therapies is described below.
- the machine learning-based skin tissue aging modeling approach was used to test an in vivo screening system for detecting topical anti-aging interventions on mouse skin.
- mice in a control group were 10 months old (“Control 1”)
- 15 mice in another control group were 14 months old (“Control 2”)
- 15 mice in a third control group were 18 months old (“Control 3”)
- two independent treatment groups comprised 18-month-old mice (“Test Article 1” and“Test Article 2”).
- Each treatment group included 15 mice given a daily topical application for 61 days, as detailed below. All mouse ages are referenced from the start of the experiment.
- mice were shaved as necessary on a weekly basis in order to enable daily topical application on the back of the mice.
- the topical application was applied in a 2 cm x 2 cm square on the back of the mice identified with indelible ink.
- sample slides were prepared as follows. Each block was sectioned into slides at a thickness of 5 microns. Each slide contained 16 separate sections of tissues from the same paraffin block.
- images were acquired as follows. Full-resolution digital slide images were acquired for all slides using a high-throughput slide scanner. Images were acquired at a magnification of 40X and a resolution of 0.25 microns per pixel. The slides were scanned in brightfield.
- mice in the Control 1-3 groups received a control topical application comprising 80% DMSO, 19.9% water, and 0.1% Carbopol 934. Each mouse received 60 pL daily applications of this solution applied over the 2 cm x 2 cm test site.
- Vitamin C (CAS No. 50-81-7) and 1.29 mg of Vitamin E (CAS No. 59-02-9) dissolved in the same solution as the control groups and applied identically as the control groups.
- the data were prepared as follows.
- the images from the control mice comprised the“aging dataset,” while the images from the two test articles comprised the “compound dataset.”
- the data were prepared using a similar process as that described in Example 1.
- each whole slide image was segmented into smaller, non-overlapping square tiles of 512 pixels each, and each of the mice’s data were partitioned into training and test sets with proportions of 2/3 and 1/3, respectively, while ensuring that no mouse has data appearing in both the training and test sets at the same time. This resulted in an aging dataset of about 5,000 images in the aging dataset and a treatment dataset of about 5,000 images. Analyses were performed as described below, and the average performance across three different training and test folds are reported, unless otherwise specified.
- the data was analyzed using a similar deep convolutional neural network architecture and the machine learning analysis approach as that described in Example 1.
- the deep convolutional neural network architecture was trained using the aging dataset and the machine learning analysis approach described in Example 1. Performing this training yields a final set of weights to use with the neural network for the treatment analysis.
- the effects of the treatments were analyzed by applying the generated neural network to the entirety of the treatment dataset. This is subsequently referred to as a“transference” of the aging model to the treatment data.
- Average age predictions for each mouse were produced by predicting the biological age classification for each tile and averaging all tiles’ predictions together. This calculation was performed for all three folds of the data, and those average predictions were then averaged together again. This produced a single numerical biological age prediction for each mouse, which was then averaged into a single numerical biological age prediction for the Control group (averaged across control groups 1-3) and each of the Test Article groups, as shown in
- Table 6 Average predicted age and change relative to control group for the control group and both test article groups
- the machine learning systems and methods for predicting biological age were applied toward accelerating drug screens designed to detect interventions that slow or reverse one or more phenotypes of aging. Such a drug screening approach was tested using proof-of- concept drug screens, including an in vitro drug screening experimental model. This machine learning-based drug screening approach for aging-related therapies is described below.
- the machine learning-based mouse myoblast cellular aging approach was used to test an in vitro screening model for detecting anti-aging molecules for myoblasts.
- the myoblast cell screening was run in parallel with the myoblast biological age prediction described in Example 3, and the same processes for primary cell acquisition, preparation, processing, and image acquisition steps were performed as described in Example 3.
- the plates are handled, processed, and stained in the same way as described in the myoblast biological age prediction described in Example 3. Briefly, these plates were stained for EdU, desmin, ER cytopainter, and counterstained with Hoechst.
- the data was analyzed using a similar deep convolutional neural network architecture and the machine learning analysis approach described in Example 1.
- the deep convolutional neural network architecture was trained using the aging dataset and the machine learning analysis approach described in Example 1. Performing this training yields a final set of weights to use with the neural network for the treatment analysis.
- the effects of the treatments were analyzed by applying the generated neural network to the entirety of the treatment dataset. This is subsequently referred to as a“transference” of the aging model to the treatment data.
- Example 6 average age predictions for each mouse were produced by predicting the biological age classification for each tile and averaging all tiles’ predictions together. This calculation was performed for all three folds of the data, and those average predictions were then averaged together again. This produced a single numerical biological age prediction for each mouse, which was compared to control. [0224] Next, as described in Example 6, p-values were calculated using the
- Example 8 High-throughput in vitro cell-based screening
- Example 7 The myoblast screening results described in Example 7 are deployed as a high- throughput screen (HTS) designed to screen hundreds of thousands of molecules. The approach is quite similar, but the number of cells and wells used to screen those molecules is significantly scaled up.
- HTS high- throughput screen
- a high-throughput screen can be performed using the biological age prediction systems and methods of the present disclosure, by performing the following three steps: making a master bank of cells, validating the original biological aging prediction, and performing the actual screen.
- Primary myoblast cells are chosen as an illustrative example. However, this technology can be deployed using any of many different cell types, including but not limited to the three cell types described in Examples 3-5 and 7 (myoblasts, fibroblasts, and keratinocytes).
- a master bank of cells is produced with enough cells to power a high- throughput screen involving many molecules while trying to maintain a low passage number to avoid losing the markers of aging.
- the cell lines are organized into three distinct populations: (a) 24 separate primary myoblast lines (12 young and 12 old) to be used in reproducing the biological age prediction results (“Individual Young Lines” and“Individual Old Lines”), (b) two mixes, each containing 12 young or old primary cell lines to be used for optional additional machine learning training on each HTS plate (“Young Training Mix” and“Old Training Mix”), and (c) two mixes, each containing 14 primary cell lines to be used for screening molecules (“Young Testing Mix” and“Old Testing Mix”). Each mix is produced with an equal representation of cell counts from each composite cell line.
- the limiting factor for an HTS may be the number of vials of Old Testing Mix, as this is the cell population which is used to test many different molecules.
- the number of vials of Old Testing Mix produced defines the number of molecules available for testing.
- 28 vials Old Testing Mix are produced with 5.3M cells per vial, enabling more than about 60,000 molecules to be tested in an initial screen. This process can and is repeated with more cells (and more cell types) to power further screening.
- the compounds are tested in wells containing Old Testing Mix.
- the Young and Old Training Mixes are included in separate wells on each plate in case it is useful to validate the biological age prediction process on each individual plate.
- the Young Testing Mix is included in separate wells on each plate and includes control molecules used to validate controls’ effects on the young mix.
- Each plate contains about 300 compounds in Old Testing Mix, each in a single well.
- the plate also includes 36 other wells with 12 replicates each of Young Training Mix, Old Training Mix, and Young Testing Mix.
- HTS HTS is split up into multiple runs, each of which produces 12-15 plates following the plan described above.
- One vial of Old Testing Mix is used for each run.
- HTS procedure is applicable to many cell types, culture procedures, and staining protocols. This can enable unbiased high-throughput screening for age-related phenotype reversal in many different situations.
Landscapes
- Engineering & Computer Science (AREA)
- Health & Medical Sciences (AREA)
- Life Sciences & Earth Sciences (AREA)
- Physics & Mathematics (AREA)
- Bioinformatics & Cheminformatics (AREA)
- General Health & Medical Sciences (AREA)
- Theoretical Computer Science (AREA)
- Medical Informatics (AREA)
- Chemical & Material Sciences (AREA)
- Molecular Biology (AREA)
- Biophysics (AREA)
- Biotechnology (AREA)
- Bioinformatics & Computational Biology (AREA)
- Spectroscopy & Molecular Physics (AREA)
- Proteomics, Peptides & Aminoacids (AREA)
- Evolutionary Biology (AREA)
- Computer Vision & Pattern Recognition (AREA)
- General Physics & Mathematics (AREA)
- Genetics & Genomics (AREA)
- Analytical Chemistry (AREA)
- Data Mining & Analysis (AREA)
- Databases & Information Systems (AREA)
- Artificial Intelligence (AREA)
- Software Systems (AREA)
- Evolutionary Computation (AREA)
- Biomedical Technology (AREA)
- Organic Chemistry (AREA)
- Immunology (AREA)
- Multimedia (AREA)
- Public Health (AREA)
- Epidemiology (AREA)
- Bioethics (AREA)
- Microbiology (AREA)
- Hematology (AREA)
- Medicinal Chemistry (AREA)
- Wood Science & Technology (AREA)
- Zoology (AREA)
- Biochemistry (AREA)
- Urology & Nephrology (AREA)
- Computing Systems (AREA)
Abstract
The present disclosure provides systems, media, and methods for applying machine learning to determine the biological age of a sample. A method of using a biological age predictor may comprise: (a) providing data of a sample to the biological age predictor; (b) treating the sample with a substance, thereby generating a treated sample; and (c) providing data of the treated sample to the biological age predictor. The biological age predictor may generate the first biological age and/or the second biological age.
Description
METHODS AND SYSTEMS FOR DETERMINING THE BIOLOGICAL AGE OF
SAMPLES
CROSS-REFERENCE
[0001] This application claims the benefit of U.S. Provisional Application No.
62/621,001, filed on January 23, 2018, which is incorporated herein by reference.
BACKGROUND
[0002] Aging is among one of the greatest known risk factors for most human diseases.
Of the roughly 150,000 people who die each day across the globe, approximately two-thirds die from age-related causes. Aging involves the process of functional deterioration and progressive decline across multiple organs and tissues that arise in part from the progressive accumulation of cellular damage and tissue dysfunction. Such damage and dysfunction to the cells and tissues result in pathophysiological phenotypic transformations.
[0003] Aging is a large risk factor for disease and a large driver of healthcare spending.
Yet, aging may not be directly treated like most diseases, in part because aging may be assumed to be an unstoppable force. Aging is a complex process and the cause of aging remains unknown. Recently, several attempts have been made to understand the complexities of the aging process. Some studies and evidence may suggest the possibility of factors slowing or reversing cellular aging. While identifying and experimentally validating these factors may lead to a greater understanding of the aging process and the mechanisms involved, such identification and experimental validation can be challenging and require novel computational approaches, especially for the development of effective therapeutics for aging.
SUMMARY
[0004] Recognized herein is a need for novel computational approaches to predict the biological age of samples for drug discovery. The present disclosure relates to the phenotypic profiling of the biological age of samples using machine learning. Methods and systems provided herein can significantly increase accuracy of predicting biological age based on analysis of one sample or a combination of two or more samples. Methods and systems provided herein may combine applying machine vision techniques (e.g., machine learning techniques on image data) to sample data (e.g., microscopy image data) to advantageously perform, rapid and low-cost assays for assessing (e.g., predicting) biological age of samples. With increasing evidence that features aging may be visible at the cellular level, applying machine vision to morphological features of cell and/or tissue images to assess biological age of samples may be used as effective screening tools and may be diagnostic for specific disease states (e.g., aging-
related diseases). Such morphological features may be extracted and computationally assessed with the use of staining techniques and/or epigenetic assays to reveal morphological predictors of biological age. The methods disclosed herein can be used for drug discovery, especially in identifying an anti-aging agent.
[0005] In some aspects, the present disclosure provides a method of using a biological age predictor comprising: (a) providing data of a sample to the biological age predictor, wherein the biological age predictor generates a first biological age; (b) treating the sample with a substance, thereby generating a treated sample; and (c) providing data of the treated sample to the biological age predictor, wherein the biological age predictor generates a second biological age.
[0006] In some embodiments, the sample is a cell sample. For example, the cell sample may be a skin, muscle, blood, liver, heart, spleen, thymus, brain, myoblast, fibroblast, or keratinocyte cell sample. In an exemplary embodiment, the cell sample is a skin cell sample. In certain embodiments, the sample is a tissue sample. The tissue sample is a skin, fibroblast, muscle, liver, heart, spleen, thymus, or brain tissue sample. In an exemplary embodiment, the tissue sample is a skin tissue sample.
[0007] In some embodiments, the biological age predictor applies machine learning. In some embodiments, the machine learning comprises a convolutional neural network (CNN). In some embodiments, the convolutional neural network comprises a deep convolutional neural network (DCNN). In an embodiment, the biological age predictor is a computer-implemented system, wherein the system has been trained to determine the biological age of the sample. In certain embodiments, the data comprises an image, an epigenetic profile, a proteomic profile, or a metabolomics profile. The data may identify cell morphology, biomarkers, or cellular components.
[0008] In some embodiments, the method comprises treating the sample with a substance such as an anti-aging agent. The substance may be a new drug entity.
[0009] In some embodiments, the method disclosed herein further comprises comparing the first biological age and the second biological age to determine the efficacy of the substance.
In some embodiments, the first biological age or the second biological age of the sample is the specific age of the sample. In another embodiment, the first biological age or the second biological age of the sample is the age range of the sample. In another embodiment, the first biological age and the second biological age of the sample are the relative age of the sample and the treated sample. In some embodiments, the method further comprises staining the sample and the treated sample with a stain. In some embodiments, the method further comprises acquiring a
plurality of images of the stained sample to provide the data of the sample, and acquiring a plurality of images of the stained treated sample to provide the data of the treated sample. In some embodiments, the method further comprises processing the plurality of images to determine the first biological age and the second biological age. In some embodiments, the method further comprises determining the first biological age and the second biological age with an accuracy of at least about 80%. In some embodiments, the method further comprises determining a difference in age between the first biological age and the second biological age. In some embodiments, the method further comprises determining a percentage difference in age between the first biological age and the second biological age. In some embodiments, the method further comprises providing a subject in need thereof with the substance, based at least in part on the first biological age and the second biological age.
[0010] In some aspects, the present disclosure provides a computer-implemented method of determining the effectiveness of a substance by using a biological age predictor comprising:
(a) providing data of a sample to the biological age predictor, wherein the biological age predictor identifies an aging factor; and (b) providing a substance to a subject based on the aging factor.
[0011] In some embodiments, the method further comprises providing data of a second sample from the subject subsequent to providing the substance, wherein the biological age predictor applies machine learning to determine the biological age of the second sample. In some embodiments, the biological age predictor applies machine learning.
[0012] In some aspects, the present disclosure provides a computer-implemented method of determining the biological age of a sample using a biological age predictor comprising: (a) providing data of a sample to the biological age predictor, wherein the biological age predictor applies machine learning to generate a biological age, wherein providing data of the sample to the biological age predictor does not involve input by a user to identify a feature. In some embodiments, the method further comprises determining the biological age with an accuracy of at least about 80%.
[0013] In some aspects, the present disclosure provides a computer-implemented method for determining the biological age of a sample comprising: (a) obtaining a first sample from a first subject; (b) labeling the first sample with a label to generate a labeled sample; (c) performing a first assay on the labeled sample to generate a first sample data; and (d) applying, by a computer comprising a processor configured to execute a computer program including instructions, executable by the processor, to apply a machine learning detection structure to the first sample data, wherein the detection structure employs machine learning to screen locations
in the first sample data to: (i) identify a feature and classify the feature to the label; and (ii) determine the biological age of the first sample based at least in part on the identified and classified feature.
[0014] In some embodiments, the method further comprises determining the biological age with an accuracy of at least about 80%. In some embodiments, the first sample is a cell sample. The cell sample may be a skin, muscle, blood, liver, heart, spleen, thymus, brain, myoblast, fibroblast, or keratinocyte cell sample. In an exemplary embodiment, the cell sample is a skin cell sample. In some embodiments, the first sample is a tissue sample. The tissue sample may be a fibroblast, skin, muscle, blood, liver, or brain sample. In some embodiments, the first subject is human. In some embodiments, the first subject exhibits a symptom associated with Hutchinson-Gilford Progeria Syndrome (HGPS) or Werner Syndrome. In some embodiments, the first subject exhibits an aging symptom. The aging symptoms may be selected from the group consisting of muscle wasting (sarcopenia), slower wound healing, skin growths, rough skin, dry skin, loose facial skin, transparent skin, decreased skin elasticity, wrinkling, sagging skin, whitening of hair, and graying of hair.
[0015] In some embodiments, the first assay comprises staining the first sample. In some embodiments, staining the first sample comprises applying a stain to the first sample, wherein the stains are selected from the group consisting of DAPI, H&E, HES (hematoxylin eosin saffron), Luna stain, Herovici stain, Van Gieson (EVG), and stains used to identify lipofuscin, lysosomes, P16, P19, beta-galactosidase, LC3, ubiquitin, mitochondria, DNA damage, distribution of organelles, nuclear lamina, cell activation, CCR2, soma size, neurites, cytoskeletal structure, or membrane ruffling. In some embodiments, labeling the first sample comprises attributing chronological age, age-related diseases, progression, clinical metadata, or a combination thereof to the first sample. In some embodiments, labeling the first sample comprises attributing information of the first sample by imaging, morphological profiling, cell painting, mass spectrometry, antibody chips, 2-F Fluorescence Difference Gel Electrophoresis (DIGE), mass spectrometric immunoassay (MSIA), or laser capture microdissection (LCM). In some embodiments, the first sample data is an image. In some embodiments, the first sample data is segmented into a plurality of 2D slices, and the detection structure employs the convolutional neural network to screen locations in each of the plurality of 2D slices of the segmented first sample data by a sliding window methodology to identify the feature and classify the feature.
[0016] In some embodiments, the method further comprises determining, upon applying the machine learning detection structure to a second sample data obtained from a second assay of
a second sample of a second subject, the biological age of the second subject based at least in part on a second feature identified in the second sample data, wherein the feature comprises the second feature. In some embodiments, the first assay and the second assay are the same type of assays. In some embodiments, the first assay and the second assay are different types of assays. In some embodiments, the first sample data and the second sample data are the same type of sample data. In some embodiments, the first sample data and the second sample data are different types of sample data. In some embodiments, the first sample data is image data, proteomics data, or metabolomics data. In some embodiments, the first assay is an epigenetics assay.
[0017] In some embodiments, determining the biological age of the first sample comprises determining the specific age of the first sample. In another embodiment, determining the biological age of the first sample comprises determining the age range of the first sample. In another embodiment, determining the biological age of the first sample comprises determining the relative age of the first sample in comparison to the second sample. In some embodiments, the machine learning detection structure comprises a neural network. In certain embodiments, the neural network comprises a convolutional neural network. In certain embodiments, the convolutional neural network comprises a deep convolutional neural network. In some embodiments, the deep convolutional neural network comprises a cascaded deep convolutional neural network.
[0018] In some embodiments, the computer program includes instructions, executable by the processor, to apply to the first sample data a network structure selected from the group consisting of recurrent neural network structure and general adversarial network structure. In some embodiments, results from applying the machine learning detection structure are combined with results from applying the network structure to determine the biological age. In some embodiments, the computer program includes instructions, executable by the processor, to apply to the first sample data a technique selected from the group consisting of gradient boosting, random forests, and support vector machines. In some embodiments, results from applying the machine learning detection structure are combined with results from applying the technique.
[0019] In some aspects, the present disclosure provides a method of using a biological age predictor comprising: (a) receiving initial data comprising a predicted biological age value from the biological age predictor; (b) automatically labeling the initial data with an extraction program, thereby producing labeled data, wherein the extraction program detects and uniquely labels a desired feature with a first label; and (c) processing the labeled data for use in a second biological age predictor, wherein the second biological age predictor is configured to determine
the biological age of a sample subject based at least in part on identification of the desired feature.
[0020] In some aspects, the present disclosure provides a computer-implemented system comprising: a digital processing device comprising: (a) a processor; (b) an operating system configured to perform executable instructions; (c) a memory; and (d) a computer program including instructions executable by the digital processing device to create an application applying machine learning detection structures to a plurality of sample data to determine the biological age of a sample, the application comprising: (i) a software module applying a machine learning detection structure to the plurality of sample data, the detection structure employing machine learning to screen locations in the sample to identify a feature and classify the feature; and (ii) a software module automatically generating a report comprising the biological age of a sample from which the sample data was derived.
[0021] In some embodiments, the machine learning detection structure comprises a neural network. In some embodiments, the neural network comprises a convolutional neural network. In some embodiments, the convolutional neural network comprises a deep
convolutional neural network. In some embodiments, the deep convolutional neural network comprises a cascaded deep convolutional neural network. In some embodiments, the application runs in real-time or near-real time and generates a real-time or near real-time report comprising the biological age of the sample.
[0022] In some embodiments, the plurality of sample data is obtained by imaging, morphological profiling, cell painting, mass spectrometry, antibody chips, 2-F Fluorescence Difference Gel Electrophoresis (DIGE), mass spectrometric immunoassay (MSIA), or laser capture microdissection (LCM). In some embodiments, the plurality of sample data is obtained by imaging. In some embodiments, the application further comprises a software module performing image preprocessing comprising normalization of the plurality of the sample data. In some embodiments, the normalization comprises normalization of signal noise, sequencing reads, image channel balancing/combination, quality filtering, color balancing, color
normalization, or a combination thereof. In some embodiments, the plurality of sample data comprises image data, and the normalization comprises normalization of image format, image slice spacing, image intensity, image contrast, image saturation, image size, image orientation, or other image data properties of the image data. In some embodiments, the plurality of sample data is segmented into a plurality of 2D slices, and the detection structure employs the convolutional neural network to screen locations in each of the plurality of 2D slices of the
segmented sample data by a sliding window methodology to identify the feature and classify the feature.
[0023] In some embodiments, the convolutional neural network has 2 to 64 convolutional layers and 1 to 8 fully connected layers. In some embodiments, the sliding window comprises a window of less than about 4,000 pixels by less than about 4,000 pixels. In some embodiments, the sliding window comprises a window of less than about 512 pixels by less than about 512 pixels. In some embodiments, the convolutional neural network comprises a neural network instance selected randomly from a plurality of neural network instances, and the second convolutional neural network comprises a neural network instance selected randomly from a plurality of neural network instances.
[0024] In some embodiments, the application further comprises a software module performing post-processing of a plurality of refined locations. In some embodiments, the post- processing comprises characterizing centroid location, volume, shape, intensity, density, transparency, regularity, or a combination thereof. In some embodiments, the report comprises an informational overlay on the sample data. In some embodiments, the report comprises a sample data heat mapped to indicate confidence level. In some embodiments, the report comprises a time course generated by applying the application to medical images captured at two or more time points to measure progression of a disease or growth and movement of a tumor over time. In some embodiments, the machine learning detection structure is trained to identify critical clinical signs of a disease. In some embodiments, the machine learning detection structure is trained using sample data labeled by a human expert and subjected to preprocessing for normalization. In some embodiments, the biological age of the sample comprises a specific age of the sample. In some embodiments, the biological age of the sample comprises an age range of the sample. In some embodiments, the biological age of the sample comprises a relative age of the sample in comparison to an additional sample.
[0025] In another aspect, the present disclosure provides a non-transitory computer readable storage medium encoded with a computer program including instructions executable by a processor to create an application applying machine learning to a plurality of sample data to determine the biological age of a sample, the application comprising: (a) a software module applying a machine learning detection structure to the plurality of sample data, the detection structure employing machine learning to screen locations in the plurality of sample data to identify a feature and classify the feature; and (b) a software module automatically generating a report comprising the biological age of a sample from which the sample data was derived.
[0026] In some embodiments, the machine learning detection structure comprises a neural network. In some embodiments, the neural network comprises a convolutional neural network. In some embodiments, the convolutional neural network comprises a deep
convolutional neural network. In some embodiments, the deep convolutional neural network comprises a cascaded deep convolutional neural network.
[0027] In another aspect, the present disclosure provides a high-throughput method of screening a test compound to identify an anti-aging agent, the method comprising: (a) contacting a biological sample with the test compound, thereby generating a treated sample; (b) providing data of the treated sample to a biological age predictor; (c) determining a biological age of the treated sample using a biological age predictor; and (d) identifying the test compound as an anti aging agent based at least in part on the determined biological age. In some embodiments, the method further comprises identifying the test compound as an anti-aging agent when the determined biological age is a relative reduction relative to a biological age of the biological sample of at least about 10%.
[0028] Additional aspects and advantages of the present disclosure will become readily apparent to those skilled in this art from the following detailed description, wherein only illustrative embodiments of the present disclosure are shown and described. As will be realized, the present disclosure is capable of other and different embodiments, and its several details are capable of modifications in various obvious respects, all without departing from the disclosure. Accordingly, the drawings and description are to be regarded as illustrative in nature, and not as restrictive.
INCORPORATION BY REFERENCE
[0029] All publications, patents, and patent applications mentioned in this specification are herein incorporated by reference to the same extent as if each individual publication, patent, or patent application was specifically and individually indicated to be incorporated by reference. To the extent publications and patents or patent applications incorporated by reference contradict the disclosure contained in the specification, the specification is intended to supersede and/or take precedence over any such contradictory material.
BRIEF DESCRIPTION OF THE DRAWINGS
[0030] The novel features of the invention are set forth with particularity in the appended claims. A better understanding of the features and advantages of the present invention will be obtained by reference to the following detailed description that sets forth illustrative
embodiments, in which the principles of the invention are utilized, and the accompanying drawings (also“Figure” and“FIG.” herein), of which:
[0031] FIG. 1 illustrates an example workflow for predicting the biological age of a sample, including sample selection, pre-processing, machine learning, and biological age prediction, according to disclosed embodiments.
[0032] FIG. 2 illustrates a process for creating and training a machine-learning driven predictor for a given sample.
[0033] FIG. 3 illustrates a process for using a machine-learning driven predictor to process a plurality of samples to generate a biological age prediction.
[0034] FIG. 4 illustrates a computer control system that is programmed or otherwise configured to implement methods provided herein.
[0035] FIG. 5A illustrates an un-aggregated per-tile confusion matrix for an example fold of a biological age prediction by analysis of human skin tissue. FIG. 5B illustrates a donor- aggregated confusion matrix for an example fold. FIGs. 5C-5E illustrate un-aggregated“l-vs.- rest” per-tile ROC (receiver-operating characteristic) curves indicating each age group’s“1 vs rest” classification performance, which represents the likelihood of correctly predicting one correct age group versus all other incorrect age groups combined (“Class Y-vs.-rest”,“Class M- vs.-rest”, and“Class O-vs.-rest” per-tile ROC curves for Y vs. M vs. O classification, respectively).
[0036] FIG. 6A illustrates an un-aggregated per-tile confusion matrix for an example fold of a biological age prediction by analysis of mouse skin tissue. FIG. 6B illustrates a donor- aggregated confusion matrix for an example fold. FIGs. 6C-6F illustrate un-aggregated“Class 4-vs.-rest”,“Class l2-vs.-rest”,“Class l5-vs.-rest”, and“Class l8-vs.-rest” per-tile ROC curves for 4 vs. 12 vs. 15 vs. 18 classification, respectively.
[0037] FIG. 7A illustrates an well-aggregated per-tile confusion matrix for an example fold of a biological age prediction by analysis of mouse myoblast cells. FIG. 7B illustrates a mouse-aggregated confusion matrix for an example fold. FIG. 7C illustrates an un-aggregated per-image ROC curve for“Y vs. O” classification.
[0038] FIG. 8A illustrates an well-aggregated confusion matrix for an example fold of a biological age prediction by analysis of human fibroblast cells. FIG. 8B illustrates a donor- aggregated confusion matrix for an example fold. FIG. 8C illustrates an un-aggregated per- image ROC curve for“Y vs. O” classification.
[0039] FIG. 9A illustrates an well-aggregated confusion matrix for an example fold of a biological age prediction by analysis of human keratinocyte cells. FIG. 9B illustrates a donor- aggregated confusion matrix for an example fold. FIG. 9C illustrates an un-aggregated per- image ROC curve for“Y vs. O” classification.
[0040] FIG. 10 illustrates an example of a biopsy cutting and slide preparation scheme.
DETAILED DESCRIPTION
[0041] Several aspects of the invention are described below with reference to example applications for illustration. It should be understood that numerous specific details,
relationships, and methods are set forth to provide a full understanding of the invention. One having ordinary skill in the relevant art, however, will readily recognize that the invention can be practiced without one or more of the specific details or with other methods. Unless stated otherwise, the present invention is not limited by the illustrated ordering of acts or events, as some acts may occur in different orders and/or concurrently with other acts or events.
Furthermore, not all illustrated acts or events are required to implement a methodology in accordance with the present invention. The concentration of various components in the disclosed compositions is exemplary and not meant to be limited to the recited concentration per se.
[0042] It will be understood that a word appearing herein in the singular encompasses its plural counterpart, and a word appearing herein in the plural encompasses its singular counterpart, unless implicitly or explicitly understood or stated otherwise. Further, it will be understood that for any given component described herein, any of the possible candidates or alternatives listed for that component, may generally be used individually or in any combination with one another, unless implicitly or explicitly understood or stated otherwise. Additionally, it will be understood that any list of such candidates or alternatives, is merely illustrative, not limiting, unless implicitly or explicitly understood or stated otherwise. Still further, it will be understood that any figure or number or amount presented herein is approximate, and that any numerical range includes the minimum number and the maximum number defining the range, whether the word“inclusive” or the like is employed or not, unless implicitly or explicitly understood or stated otherwise. Generally, the term“approximately” or“about” or the symbol in reference to a figure or number or amount includes numbers that fall within a range of ± 5 % of same, unless implicitly or explicitly understood or stated otherwise. Yet further, it will be understood that any heading employed is by way of convenience, not by way of limitation. Additionally, it will be understood that any permissive, open, or open-ended language encompasses any relatively permissive to restrictive language, less open to closed language, or less open-ended to closed-ended language, respectively, unless implicitly or explicitly understood or stated otherwise. Merely by way of example, the word“comprising” may encompass“comprising”,“consisting essentially of’, and/or“consisting of’ type language.
[0043] As used herein, unless otherwise indicated, some inventive embodiments herein contemplate numerical ranges. A variety of aspects of this invention can be presented in a range
format. It should be understood that the description in range format is merely for convenience and brevity and should not be construed as an inflexible limitation on the scope of the invention. Accordingly, the description of a range should be considered to have specifically disclosed all the possible subranges as well as individual numerical values within that range as if explicitly written out. For example, description of a range such as from 1 to 6 should be considered to have specifically disclosed subranges such as from 1 to 3, from 1 to 4, from 1 to 5, from 2 to 4, from 2 to 6, from 3 to 6 etc., as well as individual numbers within that range, for example, 1, 2, 3, 4, 5, and 6. This applies regardless of the breadth of the range. When ranges are present, the ranges include the range endpoints.
[0044] Definitions
[0045] The term“sample,” as used herein, generally refers to a biological sample. The samples may be taken from tissue or cells or from the environment of tissue or cells. In some examples, the sample may comprise, or be derived from, a tissue biopsy, blood, blood plasma, extracellular fluid, dried blood spots, cultured cells, culture media, discarded tissue, plant matter, synthetic proteins, bacterial and/or viral samples, fungal tissue, archaea, or protozoans. The sample may have been isolated from the source prior to collection. Samples may comprise forensic evidence. Non-limiting examples include a finger print, saliva, urine, blood, stool, semen, or other bodily fluids isolated from the primary source prior to collection. In some examples, the sample is isolated from its primary source (cells, tissue, bodily fluids such as blood, environmental samples, etc.) during sample preparation. The sample may be derived from an extinct species including but not limited to samples derived from fossils. The sample may or may not be purified or otherwise enriched from its primary source. In some cases the primary source is homogenized prior to further processing. In some cases, cells are lysed using a buffer such as RIPA buffer. Denaturing buffers may also be used at this stage. The sample may be filtered or centrifuged to remove lipids and particulate matter. The sample may also be purified to remove nucleic acids, or may be treated with RNases or DNases. The sample may contain tissues or cells that are intact, fragmented, or partially degraded.
[0046] The sample may be taken from a subject with a disease or disorder. The disease or disorder may be an infectious disease, an immune disorder or disease, a cancer, a genetic disease, a degenerative disease, a lifestyle disease, an injury, a rare disease or an age related disease. The infectious disease may be caused by bacteria, viruses, fungi, and/or parasites. Non-limiting examples of cancers include Bladder cancer, Lung cancer, Brain cancer, Melanoma, Breast cancer, Non-Hodgkin lymphoma, Cervical cancer, Ovarian cancer, Colorectal cancer, Pancreatic cancer, Esophageal cancer, Prostate cancer, Kidney cancer, Skin cancer, Leukemia, Thyroid
cancer, Liver cancer, and Uterine cancer. Some examples of genetic diseases or disorders include, but are not limited to, age-related disorders (such as Hutchinson-Gilford Progeria Syndrome (HGPS) or Werner Syndrome), cystic fibrosis, Charcot-Marie-Tooth disease, Huntington's disease, Peutz-Jeghers syndrome, Down syndrome, Rheumatoid arthritis, and Tay- Sachs disease. Non-limiting examples of lifestyle diseases include obesity, diabetes,
arteriosclerosis, heart disease, stroke, hypertension, liver cirrhosis, nephritis, cancer, chronic obstructive pulmonary disease (COPD), hearing problems, and chronic backache. Some examples of injuries include, but are not limited to, abrasion, brain injuries, bruising, burns, concussions, congestive heart failure, construction injuries, dislocation, flail chest, fracture, hemothorax, herniated disc, hip pointer, hypothermia, lacerations, pinched nerve, pneumothorax, rib fracture, sciatica, spinal cord injury, tendons ligaments fascia injury, traumatic brain injury, and whiplash. The sample may be taken before and/or after treatment of a subject with a disease or disorder. Samples may be taken before and/or after a treatment. Samples may be taken during a treatment or a treatment regime. Multiple samples may be taken from a subject to monitor the effects of the treatment over time. The sample may be taken from a subject known or suspected of having an infectious disease for which diagnostic antibodies are not available.
[0047] The sample may be taken from a subject suspected of having a disease or a disorder. The sample may be taken from a subject experiencing unexplained symptoms, such as fatigue, nausea, weight loss, aches and pains, weakness, or memory loss. The sample may be taken from a subject having explained symptoms. The sample may be taken from a subject at risk of developing a disease or disorder due to factors such as familial history, age,
environmental exposure, lifestyle risk factors, or presence of other known risk factors.
[0048] The sample may be taken from an embryo, fetus, or pregnant woman. In some examples, the sample may be isolated from the mother’s blood plasma. In some examples, the sample may comprise circulating fetal cells in the mother’s blood plasma.
[0049] The sample may be taken from a healthy subject. In some cases, samples may be taken longitudinally from the same subject. In some cases, samples acquired longitudinally may be analyzed with the goal of monitoring individual health and early detection of health issues. In some embodiments, the sample may be collected at a home setting or at a point-of-care setting and subsequently transported by a mail delivery, courier delivery, or other transport method prior to analysis. For example, a home user may collect a blood spot sample through a finger prick, which blood spot sample may be dried and subsequently transported by mail delivery prior to analysis. In some cases, samples acquired longitudinally may be used to monitor response to stimuli expected to impact healthy, athletic performance, or cognitive performance. Non-limiting
examples include response to medication, dieting, or an exercise regimen. The sample may also be a control.
[0050] The sample may be tagged, e.g., with identifiable tags, to allow for multiplexing of samples. Some non-limiting examples of identifiable tags include: fluorophores, magnetic nanoparticles, or DNA barcoded base linkers. Fluorophores used may include fluorescent proteins such as GFP, YFP, RFP, eGFP, mCherry, tdtomato, FITC, Alexa Fluor 350, Alexa Fluor 405, Alexa Fluor 488, Alexa Fluor 532, Alexa Fluor 546, Alexa Fluor 555, Alexa Fluor 568, Alexa Fluor 594, Alexa Fluor 647, Alexa Fluor 680, Alexa Fluor 750, Pacific Blue, Coumarin, BODIPY FL, Pacific Green, Oregon Green, Cy3, Cy5, Pacific Orange, TRITC, Texas Red, Phycoerythrin, Allophcocyanin, or other fluorophores known in the art.
[0051] Any number of samples may be multiplexed. For example, a multiplexed analysis may contain samples from 2, 3, 4, 5, 6, 7, 8, 9, 10, 11, 12, 13, 14, 15, 16, 17, 18, 19, about 20, about 25, about 30, about 35, about 40, about 45, about 50, about 55, about 60, about 65, about 70, about 75, about 80, about 85, about 90, about 95, about 100, or more than 100 initial samples. The identifiable tags may provide a way to interrogate each sample as to its origin, or may direct different samples to segregate to different areas or a solid support.
[0052] Any number of samples may be mixed prior to analysis without tagging or multiplexing. For example, a multiplexed analysis may contain samples from 2, 3, 4, 5, 6, 7, 8, 9, 10, 11, 12, 13, 14, 15, 16, 17, 18, 19, about 20, about 25, about 30, about 35, about 40, about 45, about 50, about 55, about 60, about 65, about 70, about 75, about 80, about 85, about 90, about 95, about 100, or more than 100 initial samples. Samples may be multiplexed without tagging using a combinatorial pooling design in which samples are mixed into pools in a manner that allows signal from individual samples to be resolved from the analyzed pools using
computational demultiplexing.
[0053] The term“label,” as used herein, generally refers to information that is capable of being analyzed to predict biological age of a sample. The label may be a direct signal indicative of the presence or absence of a cell or tissue. The label may be an indirect signal indicative of the presence or absence of a call or tissue, such as a fluorescent signal. Labeling may comprise attributing information of one or more samples, such as by imaging, morphological profiling, cell painting, mass spectrometry, antibody chips, 2-F Fluorescence Difference Gel
Electrophoresis (DIGE), mass spectrometric immunoassay (MSIA), laser capture
microdissection (LCM), or a combination thereof.
[0054] Introduction
[0055] Aging is a significant problem and represents the major risk factor for most human pathologies including diabetes, cardiovascular diseases, neurological disorders, and cancer. Scientific discoveries over the past two decades have sought to identify molecular mechanisms which play important roles in determining longevity. Such a feat has been challenging since aging is a complex process that involves a number of factors. The present disclosure addresses the need to identify and evaluate such factors across sample types through a machine-learning-driven predictor by determining the biological age of the sample, as well as related features, and thus provide a platform for drug discovery.
[0056] The nature of measuring biological age can be very complex and may not be well suited for measuring a single pathway or biomarker. This can pose challenges and difficulties in measuring and quantifying biological aging, especially through in vitro assays that may not be able to measure the functional performance of the subject organism.
[0057] For each sample obtained from a subject, sample data may be generated by performing various assays on the sample, or by attributing information (e.g., measurements) of the sample. By performing suitable in vitro assays on samples (e.g., cells and tissue cross sections) obtained from subjects, methods and systems disclosed herein can assess the biological age of the samples using machine learning. Such assays may combine data from a number of different phenotypic sources, such as images of various cell and/or tissue types, each with multiple different stains that are selected to highlight different phenotypic properties; epigenetic and/or gene expression data; and proteomics analysis. For example, such assays may highlight certain morphological features, biomarkers (e.g. telomere length), epigenetic alterations (e.g. DNA methylation patterns, post-transcriptional modification of histones, and chromatin remodeling) and/or components, such as a specific protein, of a sample. Machine learning techniques may be pre-trained to combine sample data obtained from these assays and identify complex, interconnected signals used to determine the biological age of the sample.
[0058] Methods and systems described herein may combine applying machine vision techniques (e.g., machine learning techniques on image data) to sample data (e.g., microscopy image data) to advantageously perform, rapid and low-cost assays for assessing (e.g., predicting) biological age of samples. With increasing evidence that aging features may be visible at the cellular level, applying machine vision to morphological features of cell and/or tissue images to assess biological age of samples may be used as effective screening tools and may be diagnostic for specific disease states (e.g., aging-related diseases). Such morphological features may be
extracted and computationally assessed with the use of staining techniques and/or epigenetic assays to reveal morphological predictors of biological age.
[0059] In particular, methods and systems described herein may have several advantages over other approaches to assess biological age of samples and for biomarker and screening studies in aging-related research, such as unbiased analysis, broad phenotypic coverage through imaging, measurement of complex features, generative hypotheses, rapid assessment, and wide applicability.
[0060] Methods and systems described herein may feature unbiased analysis. The machine learning-driven phenotypic approach is an unbiased method of analyzing many features over large quantities of biological data, thereby reducing the need to begin with specific scientific hypotheses in order discover biomarkers or deploy them for drug screens. This may be a significant advantage in aging research and drug development, where quality biomarkers for drug screening may be elusive
[0061] Methods and systems described herein may feature broad phenotypic coverage through imaging, particularly when combined with high-content imaging. High-content imaging can provide“broad phenotypic coverage” by enabling the measurement of many interrelated biological features at once without requiring a priori knowledge of what features to focus on for imaging. Such broad phenotypic coverage may be particularly advantageous when compared with more specific biomarkers.
[0062] Methods and systems described herein may feature a machine learning approach that enables the measurement of extremely complex phenotypic features that are either singularly difficult to quantify (e.g., the complicated shape, structure, and relationships of mitochondria in an image) or are combined into complex sets of features (e.g., the combined features of nuclei, mitochondria, and many specific proteins). This may be a significant advantage over other high- content screening techniques that may tend towards focusing on one or two easily measured features such as cell proliferation
[0063] Methods and systems described herein may feature generative hypotheses. The unbiased machine learning approach can enable its user to generate hypotheses by allowing the machine to discover correlations, after which models are inspected to understand specific biological changes occurring between populations.
[0064] Methods and systems described herein may feature rapid assessment. The machine learning approach can enable biomarker discovery and drug screening analyses to be performed extremely quickly without requiring manual creation of specific biological hypotheses or manual measurement, feature analysis, or analytical coding. These methods can be deployed
rapidly, with timeframes from sample acquisition to processing to analysis completed in weeks or less. Once the analysis process is created, future analyses can be performed without requiring customize analytical pipelines, even when experimental parameters like cell types, stains, or compounds are changed.
[0065] Methods and systems described herein may feature wide applicability. The machine learning approach can be easily transitioned from one cell type or experimental process to another without requiring new coding or analysis, which are usually needed in other approaches to measure new features or analyze new experimental contexts.
[0066] Biological age predictor
[0067] The present disclosure provides methods and systems of using machine learning to create and train a biological age predictor (e.g., using training datasets). Such biological age predictors may be used to predict the biological age of a given biological sample obtained from a subject.
[0068] FIG. 1 illustrates an example workflow for predicting the biological age of a sample, including sample selection, pre-processing, machine learning, and biological age prediction, according to disclosed embodiments. Sample selection may include, for example, preparing cell cultures (e.g., multiple cell types such as skin, muscle, and/or liver obtained from human and/or animal subjects) and/or tissue cross-sections (e.g., multiple tissue types such as skin, muscle, and/or liver obtained from human and/or animal subjects). Samples may be prepared using any number of preparation steps designed to highlight certain features or phenotypic properties that are desired for machine learning detection. For example, in the case of imaging data, samples are prepared using a subset of stains designed to highlight specific morphological features and/or certain components of the sample, such as a specific protein. Additionally, the samples are properly labeled for use during machine learning training. These labels may include chronological age as well as other relevant features like age-related diseases, progression, or relevant clinical metadata (in the case of human samples). Certain features may be automatically labeled using a feature extractor which can detect macro features in the dataset for use by the training algorithm.
[0069] Next, the samples may undergo pre-processing in order to generate data using the prepared sample. This can involve any number of data generation steps depending on the sample type and machine learning system that will be used, such as imaging, sequencing, -omics measurements (genomics, proteomics, metabolomics, etc.), or any other distillation of digital data or combination thereof taken from the prepared samples. This raw data may then be combined with the labels to be fed into the machine learning system. Additionally, combinations
of transforms may be applied on this raw data for the purpose of data augmentation which aids in generalization for the machine learning process. The pre-processing steps may include, for example, imaging (e.g., by microscopy with specific stain selections and/or automated high- content imaging of cell cultures), epigenetic assays (e.g., gene expression assays), proteomics, and/or metabolomics, thereby generating sample data.
[0070] Next, machine learning techniques (e.g., deep learning, machine vision, classical machine learning such as linear regression, and others) may be applied to the generated sample data to combine each sample’s multiple data sources. A combination of machine learning techniques may be used to learn from the raw data, such as deep learning,“classical” machine learning (gradient boosting, random forests, support vector machines), and feature engineering to assist those techniques. Models may be built that handle each sample type and its associated preparation process well such that the machine learning system can gradually improve itself via repeated experimentation and evaluation until the resulting models, weights, hyperparameters, and feature extractors are capable of successfully predicting biological age for a given sample. Different sample types and data generation steps may require different machine learning techniques. For example, data produced via imaging may be suitable for machine vision techniques and models to identify correlations and signal in microscopic images. Data produced via epigenetic sequencing may be suitable for genomic machine learning techniques and models. These approaches share underlying fundamentals (for example, both may use optimization methods such as gradient descent), but the technological approaches used may differ depending on the data type (e.g., images vs. sequencing data). Similarly, the exact model structure may differ depending on the source of the sample (e.g., muscle sample vs. liver sample), and the learned weights of the model may differ depending on many of the processes used during data gathering (e.g., which lab and what sets of equipment and workflows were used to acquire, prepare, and process the samples). Over time, these techniques and models may become more generalized and more and more shareable across multiple sample types and preparation processes.
[0071] Finally, a machine learning-based biological age predictor may be trained which is capable of taking input from a specific type of biological sample that went through a specific preparatory process, and generating a prediction of its biological age or biological age-associated features (such as disease progression or other macro biological features). The biological age of the sample can be predicted based on a per-sample, in-vitro assessment of biological age using the machine learning outputs.
[0072] FIG. 2 illustrates a process for creating and training a machine-learning driven predictor for a given sample. Raw samples (e.g., cell cultures, primary cells, and/or tissue cross- sections) may be obtained. The samples may be processed by sample preparation methods, such as staining (e.g., H & E, immunohistochemistry (IHC), special stains, or combinations thereof). The samples may be labeled by manual labeling (e.g., by associating with information such as age, age-related features, or other metadata) or automatic labeling. Data may be generated from the prepared and labeled samples, through assays or other measurement techniques such as imaging, sequencing, proteomics, metabolomics, epigenetics, etc. Machine learning techniques (e.g., deep learning and/or classical machine learning) may be applied to the generated data to create and/or train the machine-learning driven age predictor. For example, a set of features (e.g., found through feature engineering) may be extracted from the generated data for machine learning applications. The machine-learning driven predictor may be evaluated (e.g., for accurate prediction of biological age) and/or features may be refined, possibly through iterative training and machine learning, to improve or optimize predictor accuracy.
[0073] FIG. 3 illustrates a process for using a machine-learning driven predictor to process a plurality of samples to generate a biological age prediction. A plurality of samples (e.g., Sample A, Sample B, and Sample C) may be obtained from one or more subject organisms (e.g., mouse, human, monkey, or other animals). Each sample in the plurality of samples may be processed for sample preparation and data generation, as described elsewhere herein. For each sample in the plurality of samples, a machine learning predictor may be created or trained using the sample, and/or applied to the sample. The outputs of the machine learning predictors for the plurality of samples may be processed or combined to generate a single biological age prediction and/or certainty for the plurality of samples. For example, the plurality of biological ages predicted from the plurality of samples may be averaged together to generate the single biological age prediction. As another example, one or more mathematical functions may be applied to the plurality of biological ages predicted from the plurality of samples to generate the single biological age prediction. For example, the maximum or minimum value among the plurality of biological ages predicted from the plurality of samples may be calculated to generate the single biological age prediction.
[0074] In an aspect, the present disclosure provides a computer-implemented method for determining the biological age of a sample. The method for determining the biological age of a sample may comprise obtaining a first sample from a first subject. In some embodiments, the first sample is a cell sample. The cell sample may originate from primary cells or cell lines (e.g., grown cell cultures). The cell sample may comprise cells collected from or derived from one or
more organs or tissues. For example, the cell sample may be a skin, fibroblast, muscle, blood, liver, heart, spleen, thymus, and/or brain cell sample. In some embodiments, the first sample is a tissue sample (e.g., a tissue cross-section). The tissue sample may comprise tissues collected from or derived from one or more organs or tissues. For example, the tissue sample may be a fibroblast, skin, muscle, blood, liver, and/or brain tissue sample.
[0075] Samples may be drawn from subjects such as humans or animals. Subjects may exhibit an aging symptom. Examples of aging symptoms include muscle wasting (sarcopenia), slower wound healing, skin growths, rough skin, dry skin, loose facial skin, transparent skin, decreased skin elasticity, wrinkling, sagging skin, whitening of hair, graying of hair, increased susceptibility to infection, greater risk of heat stroke or hypothermia, decrease in height, increased susceptibility to breaking bones, joint changes, stooped posture, osteoarthritis, frailty, slowed movement, limited movement, decrease in energy, constipation, urinary incontinence, impairment of thought, impairment of memory, impairment of thinking, dementia, reduced reflexes, reduced coordination, increased difficulty with balance, decreased visual acuity, diminished peripheral vision, increase risk for developing presbyopia, hearing loss, decreased fertility, menopause, increased susceptibility to developing atherosclerosis, or weight loss. In particular, aging symptoms such as muscle wasting (sarcopenia), slower wound healing, skin growths, rough skin, dry skin, loose facial skin, transparent skin, decreased skin elasticity, wrinkling, sagging skin, whitening of hair, or graying of hair may be commonly observed in subjects exhibiting aging symptoms. Subjects may exhibit a symptom associated with an age- related disorder, such as Hutchinson-Gilford Progeria Syndrome (HGPS) or Werner Syndrome.
[0076] After obtaining the sample from the subject, the method for determining the biological age of a sample may comprise labeling the first sample with a label to generate a labeled sample. Such labels may be used for training the biological age. Samples may be labeled by attributing a set of one or more characteristics to the sample, such as, chronological age, age- related diseases, progression, clinical metadata, or a combination thereof. Samples may be labeled by attributing information (e.g., measurements) of the sample (sample data), which may be obtained by, for example, imaging, morphological profiling, cell painting, mass spectrometry, antibody chips, 2-F Fluorescence Difference Gel Electrophoresis (DIGE), mass spectrometric immunoassay (MSIA), or laser capture microdissection (LCM).
[0077] After generating the labeled sample, the method for determining the biological age of a sample may comprise performing a first assay on the labeled sample to generate a first sample data. For example, performing the first assay on the labeled sample may comprise staining the first sample. Examples of stains used to stain samples include DAPI (4', 6-
Diamidino-2-phenylindole dihydrochloride), H&E (Haemotoxylin and Eosin), HES (hematoxylin eosin saffron), Luna stain, Herovici stain, Van Gieson (EVG), and stains used to identify cellular or sub-cellular features, proteins, or other characteristics (e.g., lipofuscin, lysosomes, P16, P19, beta-galactosidase, LC3, ubiquitin, mitochondria, DNA damage, distribution of organelles, nuclear lamina, cell activation, CCR2, soma size, neurites, cytoskeletal structure, or membrane ruffling). Therefore, the sample data (e.g., the first sample data) may comprise staining information of the sample, such as an image. The image data of a sample may be segmented into a plurality of 2D slices, and wherein the detection structure employs the convolutional neural network to screen locations in each of the plurality of 2D slices of the segmented first sample data by a sliding window methodology to identify features and classify the features. As described herein, features may include specific morphological features (e.g. shape, appearance, cell size, nuclear size, nucleolar size, number of multinucleated cells, prominent Golgi apparati, number of vacuoles in the endoplasmic reticulum and cytoplasm, number of cytoplasmic microfilaments, and/or size of lysosomal bodies), or the presence or absence of certain components of the sample, such as a specific protein. In addition to morphology, features may also include IGF-l, EGF, c-fos, senescence-associated-b- galactosidase (SA-P-GAL), senescence-associated heterochromatin foci (SAHF), promyelocytic leukemia protein nuclear bodies (PML NBs), DNA, RNA, chromosome, annexin A5, and an inflammatory secretome.
[0078] After generating the first sample data, the method for determining the biological age of a sample may comprise applying, by a computer comprising a processor configured to execute a computer program including instructions, executable by the processor, to apply a machine learning detection structure to the first sample data. The detection structure may employ machine learning to screen locations in the first sample data to identify features and classify the features to the label. Further, the detection structure may employ machine learning to determine the biological age of the first sample based at least in part on the identified and classified features.
[0079] In some embodiments, the detection structure may also employ machine learning to determine, upon applying the machine learning detection structure to a second sample data obtained from a second assay of a second sample of a second subject, the biological age of the second subject. The biological age of the second subject may be determined based at least in part on a second feature identified in the second sample data. The features may comprise the second feature. The first assay performed on the first sample of the first subject and the second assay performed on the second sample of the second subject may be the same type of assays.
Alternatively, the first assay performed on the first sample of the first subject and the second assay performed on the second sample of the second subject may be different types of assays.
For examples, types of assays performed on samples may include staining or an epigenetic assay. The first sample data obtained from the first assay and the second sample data obtained from the second assay may be the same type of sample data (e.g., image data). Alternatively, the first sample data obtained from the first assay and the second sample data obtained from the second assay may be different types of sample data. For example, types of sample data may include image data, proteomics data, or metabolomics data.
[0080] The method may determine a biological age of the sample by determining a specific age of the sample, for example, about 1, 2, 3, 4, 5, 6, or 7 days; about 1, 2, 3, or 4 weeks; about 1, 2, 3, 4, 5, 6, 7, 8, 9, 10, 11, or 12 months; or about 1, 2, 3, 4, 5, 6, 7, 8, 9, 10, 15, 20, 25, 30, 35, 40, 45, 50, 55, 60, 65, 70, 75, 80, 85, 90, 95, 100, or more than 100 years. Determining the specific age of a sample may also include determining an expected mean error for the determined specific age, such as about 1, 2, 3, 4, 5, 6, or 7 days; about 1, 2, 3, or 4 weeks; about 1, 2, 3, 4, 5, 6, 7, 8, 9, 10, 11, or 12 months; or about 1, 2, 3, 4, 5, 6, 7, 8, 9, or 10 years. For example, the specific age of a sample may be determined with an expected mean error of no more than about 1, 2, 3, 4, 5, 6, 7, 8, 9, 10, 11, or 12 months; or no more than about 1, 2, 3, 4, 5,
6, 7, 8, 9, or 10 years. Determining the specific age of a sample may also include determining a confidence interval for the determined specific age, such as plus or minus about 1, 2, 3, 4, 5, 6, or 7 days; about 1, 2, 3, or 4 weeks; about 1, 2, 3, 4, 5, 6, 7, 8, 9, 10, 11, or 12 months; or about 1, 2, 3, 4, 5, 6, 7, 8, 9, or 10 years.
[0081] The method may determine biological age of the sample by determining an age range of the sample, for example, between about 1-5 years, 5-10 years, 10-15 years, 15-20 years, 20-25 years, 25-30 years, 30-35 years, 35-40 years, 40-45 years, 45-50 years, 50-55 years, 55-60 years, 60-65 years, 65-70 years, 70-75 years, 75-80 years, 80-85 years, 85-90 years, 90-95 years, 95-100 years, 1-10 years, 10-20 years, 20-30 years, 30-40 years, 40-50 years, 50-60 years, 60-70 years, 70-80 years, 80-90 years, or 90-100 years. The method may determine biological age of the sample by determining a relative age of the first sample in comparison to the second sample, for example, about 1, 2, 3, 4, 5, 6, 7, 8, 9, 10, 15, 20, 25, 30, 35, 40, 45, 50, 55, 60, 65, 70, 75,
80, 85, 90, 95, 100, or more than 100 years older than the second sample; or about 1, 2, 3, 4, 5, 6,
7, 8, 9, 10, 15, 20, 25, 30, 35, 40, 45, 50, 55, 60, 65, 70, 75, 80, 85, 90, 95, 100, or more than 100 years younger than the second sample.
[0082] The method may determine a likelihood of the biological age of the sample falling within the determined age range of the sample, such as at least about 50%, at least about 55%, at
least about 60%, at least about 65%, at least about 70%, at least about 75%, at least about 80%, at least about 85%, at least about 90%, at least about 95%, at least about 96%, at least about 97%, at least about 98%, or at least about 99%.
[0083] The method may determine biological age of the sample by classifying the sample into a determined categorical age among a set of two or more categorical ages (e.g., (“young” vs. “old}, (“young” vs.“middle-aged” vs.“old”}). The set of two or more categorical ages may comprise about 2, about 3, about 4, about 5, about 6, about 7, about 8, about 9, about 10, or more than about 10 distinct categorical ages.
[0084] The method may determine a likelihood of the biological age of the sample falling within the determined categorical age of the sample, such as at least about 50%, at least about 55%, at least about 60%, at least about 65%, at least about 70%, at least about 75%, at least about 80%, at least about 85%, at least about 90%, at least about 95%, at least about 96%, at least about 97%, at least about 98%, or at least about 99%.
[0085] The method may determine biological age of the sample with an accuracy (e.g., accuracy of classifying the sample into the determined categorical age among a set of two or more categorical ages) of at least about 50%, at least about 55%, at least about 60%, at least about 65%, at least about 70%, at least about 75%, at least about 80%, at least about 85%, at least about 90%, at least about 95%, at least about 96%, at least about 97%, at least about 98%, or at least about 99%.
[0086] The method may determine biological age of the sample with a sensitivity (e.g., sensitivity of classifying the sample into the determined categorical age among a set of two or more categorical ages) of at least about 50%, at least about 55%, at least about 60%, at least about 65%, at least about 70%, at least about 75%, at least about 80%, at least about 85%, at least about 90%, at least about 95%, at least about 96%, at least about 97%, at least about 98%, or at least about 99%.
[0087] The method may determine biological age of the sample with a specificity (e.g., specificity of classifying the sample into the determined categorical age among a set of two or more categorical ages) of at least about 50%, at least about 55%, at least about 60%, at least about 65%, at least about 70%, at least about 75%, at least about 80%, at least about 85%, at least about 90%, at least about 95%, at least about 96%, at least about 97%, at least about 98%, or at least about 99%. The method may determine biological age of the sample with a specificity (e.g., specificity of classifying the sample into the one categorical age among a set of two or more categorical ages) of at least about 50%, at least about 55%, at least about 60%, at least about 65%, at least about 70%, at least about 75%, at least about 80%, at least about 85%, at
least about 90%, at least about 95%, at least about 96%, at least about 97%, at least about 98%, or at least about 99%.
[0088] The method may determine biological age of the sample with a positive predictive value (PPV) (e.g., PPV of classifying the sample into the determined categorical age among a set of two or more categorical ages) of at least about 50%, at least about 55%, at least about 60%, at least about 65%, at least about 70%, at least about 75%, at least about 80%, at least about 85%, at least about 90%, at least about 95%, at least about 96%, at least about 97%, at least about 98%, or at least about 99%.
[0089] The method may determine biological age of the sample with a negative predictive value (NPV) (e.g., NPV of classifying the sample into the determined categorical age among a set of two or more categorical ages) of at least about 50%, at least about 55%, at least about 60%, at least about 65%, at least about 70%, at least about 75%, at least about 80%, at least about 85%, at least about 90%, at least about 95%, at least about 96%, at least about 97%, at least about 98%, or at least about 99%.
[0090] The method may determine biological age of the sample with an Area Under
Curve (AUC) of the Receiver Operator Characteristic (ROC) (e.g., AUC of classifying the sample into the determined categorical age among a set of two or more categorical ages) of at least about 0.50, at least about 0.55, at least about 0.60, at least about 0.65, at least about 0.70, at least about 0.75, at least about 0.80, at least about 0.85, at least about 0.90, at least about 0.95, at least about 0.96, at least about 0.97, at least about 0.98, or at least about 0.99.
[0091] The machine learning detection structure may comprise a neural network. The neural network may comprise a convolutional neural network (CNN). The convolutional neural network (CNN) may comprise a deep convolutional neural network (DCNN) (e.g., comprising multiple layers). The deep convolutional neural network (DCNN) may comprise a cascaded deep convolutional neural network. Alternatively, the CNN may comprise a simplified CNN or a shallow CNN (e.g., comprising one feature layer and/or one hidden layer). The biological age predictor may comprise a combination of deep learning architectures and/or other machine learning techniques, cascaded or chained together. For example, these cascades of machine learning architectures may be configured to generate intermediate results that are better processed by later parts in the chain or cascade, or to help interpret partial results coming from different parts of the chain or cascade. For example, deep learning architectures may comprise any combination of one or multiple convolutional neural networks (CNN), recurrent neural networks, and/or generative adversarial networks. In addition, machine learning techniques such as gradient boosting, random forests, and/or support vector machines may be incorporated into
the biological age predictor. The biological age predictor may also be trained using training datasets using suitable methods appropriate for the one or more types of machine learning architectures used in the biological age predictor.
[0092] The computer program may include instructions, executable by the processor, to apply to the first sample data a network structure, such as a recurrent neural network structure or a general adversarial network structure. The results obtained from applying the machine learning detection structure may be combined with results obtained from applying the network structure to determine the biological age of the sample. The computer program may include instruction, executable by the processor, to apply to the first sample data a machine learning technique, such as gradient boosting, random forests, and support vector machines. The results obtained from applying the machine learning detection structure may be combined with results from applying the machine learning technique.
[0093] In some aspects, the present disclosure provides a computer-implemented method of determining the effectiveness of a substance by using a biological age predictor comprising: (a) providing data of a sample to said biological age predictor, wherein said biological age predictor identifies an aging factor; and (b) provide a substance to a subject based on said aging factor. In some embodiments, the computer-implemented method further comprises providing data of a second sample from said subject subsequent to providing said substance, wherein said biological age predictor applies machine learning to determine the biological age of said second sample. In an exemplary embodiment, the biological age predictor applies machine learning to identify an aging factor.
[0094] In another aspect, the present disclosure provides a computer-implemented method of identifying a druggable factor by using a biological age predictor. The method of identifying a druggable factor by using a biological age predictor may comprise providing data of a sample to the biological age predictor, generating a biological age from the biological age predictor, and identifying a druggable factor from the biological age predictor. The druggable factor may be a characteristic associated with aging, as described elsewhere herein. The method of identifying a druggable factor by using a biological age predictor may further comprise providing an active ingredient based on the identified druggable factor.
[0095] In another aspect, the present disclosure provides a computer-implemented method of determining the biological age of a sample using a biological age predictor. The method of determining the biological age of a sample using a biological age predictor may comprise providing data of a sample to the biological age predictor. The biological age predictor may generate a biological age. The method of determining the biological age of a sample using a
biological age predictor may identify a feature without any input data by a user. In other words, the data of the sample provided to the biological age predictor may contain no user input to identify a feature.
[0096] In another aspect, the present disclosure provides a method of using a biological age predictor. The method of using a biological age predictor may comprise receiving initial data comprising a predicted biological age value from the biological age predictor. The method of using a biological age predictor may comprise automatically labeling the initial data with an extraction program, thereby producing labeled data. The extraction program may detect and uniquely label a desired feature with a first label. The method of using a biological age predictor may comprise processing the labeled data for use in a second biological age predictor. The second biological age predictor may be configured to determine the biological age of a sample subject based at least in part on identification of the desired feature.
[0097] Application to Drug Discovery
[0098] In another aspect, the present disclosure provides a method of using a biological age predictor for drug discovery. In some embodiments, the method is a computer-implemented method. The method of using a biological age predictor for drug discovery may comprise providing data of a sample to the biological age predictor. The biological age predictor may generate a first biological age for the sample. In some embodiments, the biological age predictor applies machine learning to generate a first biological age. After generating a first biological age for the sample, the method of using a biological age predictor for drug discovery may comprise treating the sample with an active ingredient, thereby generating a treated sample. After generating the treated sample, the method of using a biological age predictor for drug discovery may comprise providing data of the treated sample to the biological age predictor. The biological age predictor may generate a second biological age for the treated sample. In some
embodiments, the biological age predictor applies machine learning to generate a second biological age.
[0099] In some embodiments, the sample is a cell sample. The cell sample may originate from primary cells or cell lines (e.g., grown cell cultures). The cell sample may comprise cells collected from or derived from one or more organs or tissues. For example, the cell sample may be a skin, fibroblast, muscle, blood, liver, heart, spleen, thymus, myobast, keratinocyte, and/or brain cell sample. In some embodiments, the sample is a tissue sample (e.g., a tissue cross- section). The tissue sample may comprise tissues collected from or derived from one or more organs or tissues. For example, the tissue sample may be a fibroblast, skin, muscle, blood, liver, myobast, keratinocyte, and/or brain tissue sample.
[0100] The biological age predictor may be a computer-implemented system which is trained to determine the biological age of the sample. The data provided to the biological age predictor may comprise an image, an epigenetic profile, a proteomic profile, or a metabolomics profile. The data may identify cell morphology, biomarkers, or cellular components. The substance to treat the sample, such as an active ingredient, may be a drug or potential drug, such as an anti-aging agent, a new drug entity, or an FDA approved drug entity. In some
embodiments, the substance is a new drug entity. The active ingredient or candidates for the active ingredient may be identified or evaluated based on, for example, performing searches through tissue or cell samples, such as blood or plasma, for an aging factor or druggable targets (e.g., factors or proteins). For example, such aging factor or druggable targets or candidates for aging factors or druggable targets may be identified based on studies involving parabiosis, plasma injection, and/or blood transfusion. Examples of anti-aging compounds include oxytocin, TGFbeta, Wnt3a, Klotho, ALK5 inhibitor II, and PP242.
[0101] The method of using a biological age predictor for drug discovery may further comprise comparing the first biological age and the second biological age. By comparing the first biological age for the (untreated) sample and the second biological age for the treated sample, the effect of the active ingredient on the biological age of the sample may be assessed. For example, if the second biological age is less than the first biological age, then the effect of the active ingredient was to decrease the biological age of the sample. For example, if the second biological age is more than the first biological age, then the effect of the active ingredient was to increase the biological age of the sample. In some embodiments, the biological age of the second biological age is less than the first biological age.
[0102] The method of using a biological age predictor for drug discovery may determine the first biological age and the second biological age of the sample by determining a specific age of the sample, for example, about 1, 2, 3, 4, 5, 6, or 7 days; about 1, 2, 3, or 4 weeks; about 1, 2, 3, 4, 5, 6, 7, 8, 9, 10, 11, or 12 months; or about 1, 2, 3, 4, 5, 6, 7, 8, 9, 10, 15, 20, 25, 30, 35, 40,
45, 50, 55, 60, 65, 70, 75, 80, 85, 90, 95, 100, or more than 100 years. Determining the specific age of a sample may also include determining an expected mean error for the determined specific age, such as about 1, 2, 3, 4, 5, 6, or 7 days; about 1, 2, 3, or 4 weeks; about 1, 2, 3, 4, 5, 6, 7, 8,
9, 10, 11, or 12 months; or about 1, 2, 3, 4, 5, 6, 7, 8, 9, or 10 years. For example, the specific age of a sample may be determined with an expected mean error of no more than about 1, 2, 3, 4, 5, 6, 7, 8, 9, 10, 11, or 12 months; or no more than about 1, 2, 3, 4, 5, 6, 7, 8, 9, or 10 years. The method of using a biological age predictor for drug discovery may determine biological age of the sample by determining an age range of the sample, for example, between about 1-5 years, 5-
10 years, 10-15 years, 15-20 years, 20-25 years, 25-30 years, 30-35 years, 35-40 years, 40-45 years, 45-50 years, 50-55 years, 55-60 years, 60-65 years, 65-70 years, 70-75 years, 75-80 years, 80-85 years, 85-90 years, 90-95 years, 95-100 years, 1-10 years, 10-20 years, 20-30 years, 30-40 years, 40-50 years, 50-60 years, 60-70 years, 70-80 years, 80-90 years, or 90-100 years. The method of using a biological age predictor for drug discovery may determine the first biological age and the second biological age of the sample by determining a relative age of the untreated sample in comparison to the treated sample, for example, about 1, 2, 3, 4, 5, 6, 7, 8, 9, 10, 15, 20, 25, 30, 35, 40, 45, 50, 55, 60, 65, 70, 75, 80, 85, 90, 95, 100, or more than 100 years older than the treated sample; or about 1, 2, 3, 4, 5, 6, 7, 8, 9, 10, 15, 20, 25, 30, 35, 40, 45, 50, 55, 60, 65, 70, 75, 80, 85, 90, 95, 100, or more than 100 years younger than the treated sample.
[0103] System for Biological Age Prediction
[0104] In another aspect, the present disclosure provides a computer-implemented system comprising: a digital processing device comprising: (a) a processor; (b) an operating system configured to perform executable instructions; (c) a memory; and (d) a computer program including instructions executable by the digital processing device to create an application applying machine learning detection structures to a plurality of sample data to determine the biological age of a sample. The application may comprise a software module applying a machine learning detection structure to the plurality of sample data. The detection structure may employ machine learning to screen locations in the sample to identify a feature, and classify the feature. The application may comprise a software module automatically generating a report. The report may contain information including the biological age of the sample from which the sample data was derived.
[0105] The machine learning detection structure may comprise a neural network. The neural network may comprise a convolutional neural network (CNN). The convolutional neural network (CNN) may comprise a deep convolutional neural network (DCNN) (e.g., comprising multiple layers). The deep convolutional neural network (DCNN) may comprise a cascaded deep convolutional neural network. Alternatively, the CNN may comprise a simplified CNN or a shallow CNN (e.g., comprising one feature layer and/or one hidden layer). In an exemplary embodiment, the methods described herein comprise DCNN.
[0106] The application of the system may run in real-time or near-real time, and generate a real-time or near real-time report containing information including the biological age of the sample. The plurality of sample data may be obtained by imaging, morphological profiling, cell painting, mass spectrometry, antibody chips, 2-F Fluorescence Difference Gel Electrophoresis
(DIGE), mass spectrometric immunoassay (MSIA), or laser capture microdissection (LCM). The plurality of sample data may comprise image data.
[0107] The application of the system may further comprise a software module performing image preprocessing of the plurality of the sample data. The image preprocessing may include, for example, normalization, image enhancement, image correction, contrast enhancement, brightness enhancement, filtering with one or more filters, transformation, increasing image resolution, decreasing image resolution, increasing bit resolution, decreasing bit resolution, increasing image size, decreasing image size, increasing field-of-view, decreasing field-of-view, background subtraction, noise or artifact subtraction, image subtraction, lossy compression, or lossless compression. The normalization may include, for example,
normalization of signal noise, sequencing reads, image channel balancing/combination, quality filtering, color balancing, color normalization, or a combination thereof. The normalization may include, for example, normalization of image format, image slice spacing, image intensity, image contrast, image saturation, image size, image orientation, or other image data properties of the image data. The plurality of sample data may be segmented into a plurality of 2D slices. The detection structure may employ the convolutional neural network (CNN) to screen locations in a portion of or each of the plurality of 2D slices of the segmented sample data. For example, the convolutional neural network (CNN) may use a sliding window methodology to identify the features and classify the features.
[0108] The convolutional neural network (CNN) may have 2 to 64 convolutional layers and 1 to 8 fully connected layers. For example, the convolutional neural network (CNN) may have 2, 4, 8, 16, 32, 64, or more convolutional layers and 1, 2, 3, 4, 5, 6, 7, 8, or more fully connected layers. The sliding window may have less than about 4,000 pixels by less than about 4,000 pixels, less than about 2,000 pixels by less than about 2,000 pixels, less than about 1,000 pixels by less than about 1,000 pixels, less than about 512 pixels by less than about 512 pixels, less than about 256 pixels by less than about 256 pixels, less than about 128 pixels by less than about 128 pixels, less than about 64 pixels by less than about 64 pixels, less than about 32 pixels by less than about 32 pixels, less than about 16 pixels by less than about 16 pixels, less than about 8 pixels by less than about 8 pixels, or less than about 4 pixels by less than about 4 pixels. For example, the sliding window may have a first dimension (e.g., along the x-axis) or less than 100, less than 500, less than 1,000, less than 2,000, less than 3,000, less than 4,000, or less than 5,000 pixels; and may have a second dimension (e.g., along the y-axis) or less than 100, less than 500, less than 1,000, less than 2,000, less than 3,000, less than 4,000, or less than 5,000 pixels. The convolutional neural network (CNN) may comprise a neural network instance selected
randomly from a plurality of neural network instances. The second convolutional neural network (CNN) may comprise a neural network instance selected randomly from a plurality of neural network instances.
[0109] The application of the system may include a software module performing post- processing of one or a plurality of refined locations. For example, the post-processing may include characterizing centroid location, volume, shape, intensity, density, transparency, regularity, or a combination thereof.
[0110] The generated report may contain information about the sample data. For example, the generated report may contain an informational overlay on the sample data. As another example, the generated report may contain a sample data heat mapped to indicate confidence level. As another example, the generated report may contain a time course of a disease or growth and movement of a tumor over time. For example, the time course may be generated by applying the application to medical images captured at two or more time points to measure progression of the disease or growth and movement of the tumor over time.
[0111] The machine learning detection structure may be trained to identify disease related outcomes. For example, the machine learning detection structure may be trained to identify critical clinical signs of a disease. The machine learning detection structure may be trained using supervised learning and labeled training data, such as sample data labeled by a human expert and/or subjected to preprocessing for normalization.
[0112] The application of the system may determine a biological age of the sample by determining a specific age of the sample, for example, about 1, 2, 3, 4, 5, 6, or 7 days; about 1, 2, 3, or 4 weeks; about 1, 2, 3, 4, 5, 6, 7, 8, 9, 10, 11, or 12 months; or about 1, 2, 3, 4, 5, 6, 7, 8, 9, 10, 15, 20, 25, 30, 35, 40, 45, 50, 55, 60, 65, 70, 75, 80, 85, 90, 95, 100, or more than 100 years. The application of the system may determine biological age of the sample by determining an age range of the sample, for example, between about 1-5 years, 5-10 years, 10-15 years, 15-20 years, 20-25 years, 25-30 years, 30-35 years, 35-40 years, 40-45 years, 45-50 years, 50-55 years, 55-60 years, 60-65 years, 65-70 years, 70-75 years, 75-80 years, 80-85 years, 85-90 years, 90-95 years, 95-100 years, 1-10 years, 10-20 years, 20-30 years, 30-40 years, 40-50 years, 50-60 years, 60-70 years, 70-80 years, 80-90 years, or 90-100 years. The application of the system may determine biological age of the sample by determining a relative age of the sample in comparison to an additional sample, for example, about 1, 2, 3, 4, 5, 6, 7, 8, 9, 10, 15, 20, 25, 30, 35, 40, 45, 50,
55, 60, 65, 70, 75, 80, 85, 90, 95, 100, or more than 100 years older than the additional sample; or about 1, 2, 3, 4, 5, 6, 7, 8, 9, 10, 15, 20, 25, 30, 35, 40, 45, 50, 55, 60, 65, 70, 75, 80, 85, 90, 95, 100, or more than 100 years younger than the additional sample.
[0113] In another aspect, the present disclosure provides a non-transitory computer readable storage medium encoded with a computer program including instructions executable by a processor to create an application applying machine learning to a plurality of sample data to determine the biological age of a sample. The application may comprise a software module applying a machine learning detection structure to the plurality of sample data. The detection structure may employ machine learning to screen locations in the plurality of sample data to identify a feature and classify the feature. The application may comprise a software module automatically generating a report comprising the biological age of a sample from which the sample data was derived.
[0114] The machine learning detection structure may comprise a neural network. The neural network may comprise a convolutional neural network (CNN). The convolutional neural network (CNN) may comprise a deep convolutional neural network (DCNN) (e.g., comprising multiple layers). The deep convolutional neural network (DCNN) may comprise a cascaded deep convolutional neural network. Alternatively, the CNN may comprise a simplified CNN or a shallow CNN (e.g., comprising one feature layer and/or one hidden layer). In an exemplary embodiment, the methods disclosed herein comprise DCNN.
[0115] Computer systems
[0116] The present disclosure provides computer systems that are programmed to implement methods of the disclosure. FIG. 4 shows a computer system 401 that is programmed or otherwise configured to: apply a machine learning detection structure to sample data, employ machine learning to screen locations in sample data, identify features, classify features to labels, or determine biological ages of subjects based at least in part on the identified and classified features.
[0117] The computer system 401 can regulate various aspects of methods and systems of the present disclosure, such as, for example, applying a machine learning detection structure to sample data, employing machine learning to screen locations in sample data, identifying features, classifying features to labels, and determining biological ages of subjects based at least in part on the identified and classified features.
[0118] The computer system 401 can be an electronic device of a user or a computer system that is remotely located with respect to the electronic device. The electronic device can be a mobile electronic device. The computer system 401 includes a central processing unit (CPU, also“processor” and“computer processor” herein) 405, which can be a single core or multi core processor, or a plurality of processors for parallel processing. The computer system 401 also includes memory or memory location 410 (e.g., random-access memory, read-only memory,
flash memory), electronic storage unit 415 (e.g., hard disk), communication interface 420 (e.g., network adapter) for communicating with one or more other systems, and peripheral devices 425, such as cache, other memory, data storage and/or electronic display adapters. The memory 410, storage unit 415, interface 420 and peripheral devices 425 are in communication with the CPU 405 through a communication bus (solid lines), such as a motherboard. The storage unit 415 can be a data storage unit (or data repository) for storing data. The computer system 401 can be operatively coupled to a computer network (“network”) 430 with the aid of the
communication interface 420. The network 430 can be the Internet, an internet and/or extranet, or an intranet and/or extranet that is in communication with the Internet. The network 430 in some cases is a telecommunication and/or data network. The network 430 can include one or more computer servers, which can enable distributed computing, such as cloud computing. The network 430, in some cases with the aid of the computer system 401, can implement a peer-to- peer network, which may enable devices coupled to the computer system 401 to behave as a client or a server.
[0119] The CPU 405 can execute a sequence of machine-readable instructions, which can be embodied in a program or software. The instructions may be stored in a memory location, such as the memory 410. The instructions can be directed to the CPU 405, which can
subsequently program or otherwise configure the CPU 405 to implement methods of the present disclosure. Examples of operations performed by the CPU 405 can include fetch, decode, execute, and writeback.
[0120] The CPU 405 can be part of a circuit, such as an integrated circuit. One or more other components of the system 401 can be included in the circuit. In some cases, the circuit is an application specific integrated circuit (ASIC).
[0121] The storage unit 415 can store files, such as drivers, libraries and saved programs.
The storage unit 415 can store user data, e.g., user preferences and user programs. The computer system 401 in some cases can include one or more additional data storage units that are external to the computer system 401, such as located on a remote server that is in communication with the computer system 401 through an intranet or the Internet.
[0122] The computer system 401 can communicate with one or more remote computer systems through the network 430. For instance, the computer system 401 can communicate with a remote computer system of a user. Examples of remote computer systems include personal computers (e.g., portable PC), slate or tablet PC’s (e.g., Apple® iPad, Samsung® Galaxy Tab), telephones, Smart phones (e.g., Apple® iPhone, Android-enabled device, Blackberry®), or personal digital assistants. The user can access the computer system 401 via the network 430.
[0123] Methods as described herein can be implemented by way of machine (e.g., computer processor) executable code stored on an electronic storage location of the computer system 401, such as, for example, on the memory 410 or electronic storage unit 415. The machine executable or machine readable code can be provided in the form of software. During use, the code can be executed by the processor 405. In some cases, the code can be retrieved from the storage unit 415 and stored on the memory 410 for ready access by the processor 405.
In some situations, the electronic storage unit 415 can be precluded, and machine-executable instructions are stored on memory 410.
[0124] The code can be pre-compiled and configured for use with a machine having a processer adapted to execute the code, or can be compiled during runtime. The code can be supplied in a programming language that can be selected to enable the code to execute in a pre- compiled or as-compiled fashion.
[0125] Aspects of the systems and methods provided herein, such as the computer system
401, can be embodied in programming. Various aspects of the technology may be thought of as “products” or“articles of manufacture” typically in the form of machine (or processor) executable code and/or associated data that is carried on or embodied in a type of machine readable medium. Machine-executable code can be stored on an electronic storage unit, such as memory (e.g., read-only memory, random-access memory, flash memory) or a hard disk.
“Storage” type media can include any or all of the tangible memory of the computers, processors or the like, or associated modules thereof, such as various semiconductor memories, tape drives, disk drives and the like, which may provide non-transitory storage at any time for the software programming. All or portions of the software may at times be communicated through the Internet or various other telecommunication networks. Such communications, for example, may enable loading of the software from one computer or processor into another, for example, from a management server or host computer into the computer platform of an application server. Thus, another type of media that may bear the software elements includes optical, electrical and electromagnetic waves, such as used across physical interfaces between local devices, through wired and optical landline networks and over various air-links. The physical elements that carry such waves, such as wired or wireless links, optical links or the like, also may be considered as media bearing the software. As used herein, unless restricted to non-transitory, tangible“storage” media, terms such as computer or machine“readable medium” refer to any medium that participates in providing instructions to a processor for execution.
[0126] Hence, a machine readable medium, such as computer-executable code, may take many forms, including but not limited to, a tangible storage medium, a carrier wave medium or
physical transmission medium. Non-volatile storage media include, for example, optical or magnetic disks, such as any of the storage devices in any computer(s) or the like, such as may be used to implement the databases, etc. shown in the drawings. Volatile storage media include dynamic memory, such as main memory of such a computer platform. Tangible transmission media include coaxial cables; copper wire and fiber optics, including the wires that comprise a bus within a computer system. Carrier-wave transmission media may take the form of electric or electromagnetic signals, or acoustic or light waves such as those generated during radio frequency (RF) and infrared (IR) data communications. Common forms of computer-readable media therefore include for example: a floppy disk, a flexible disk, hard disk, magnetic tape, any other magnetic medium, a CD-ROM, DVD or DVD-ROM, any other optical medium, punch cards paper tape, any other physical storage medium with patterns of holes, a RAM, a ROM, a PROM and EPROM, a FLASH-EPROM, any other memory chip or cartridge, a carrier wave transporting data or instructions, cables or links transporting such a carrier wave, or any other medium from which a computer may read programming code and/or data. Many of these forms of computer readable media may be involved in carrying one or more sequences of one or more instructions to a processor for execution.
[0127] The computer system 401 can include or be in communication with an electronic display 435 that comprises a user interface (EΊ) 440 for providing, for example, user selection of algorithms, binding measurement data, candidate proteins, and databases. Examples of ET’s include, without limitation, a graphical user interface (GET) and web-based user interface.
[0128] Methods and systems of the present disclosure can be implemented by way of one or more algorithms. An algorithm can be implemented by way of software upon execution by the central processing unit 405. The algorithm can, for example, apply a machine learning detection structure to sample data, employ machine learning to screen locations in sample data, identify features, classify features to labels, or determine biological ages of subjects based at least in part on the identified and classified features.
EXAMPLES
Example 1 - Biological age prediction by analysis of human skin tissue
[0129] Biological age prediction was performed by analysis of human skin tissue. Skin samples were collected from a set of 105 healthy human donors in three different age ranges: 35 donors in a‘young’ age group (18-35 years old, denoted by“Y”), 35 donors in a‘middle-aged’ age group (42-50 years, denoted by“M”), and 35 donors in an‘old’ age group (65-80, denoted by“O”). The set of 105 healthy human donors included an uneven mix of female and male subjects (89% female subjects and 11% male subjects). Skin samples were obtained from
subjects at bodily locations with reduced sun exposure (e.g., breast, abdomen, and other less exposed areas). No foreskin was obtained for the skin samples. Donors having a disease or disorder (e.g., severe obesity, acute illness such as cancer, or chronic illness such as diabetes) were excluded from the study. Samples are typically obtained from healthy subjects during aesthetic surgeries, such as abdomen reduction or breast surgery. Only skin phototypes 2 and 3 are included, as defined by the Fitzpatrick skin phototype scale (described by, for example, D’Orazio et ah,“UV Radiation and the Skin,”“Int. J Mol. Sci. 2013, 74(6), 12222-12248, 7 June 2013, which is hereby incorporated by reference in its entirety).
[0130] Next, tissue samples and slides were prepared as follows. Sample acquisition and frozen tissue block preparation were performed by a partner hospital. Specimens were obtained directly from patients during surgery and were frozen down into blocks. The frozen tissue specimens were then sliced with a cryotome at a thickness of 5 microns and placed onto glass slides. At least 3 slides were acquired from each donor, each slide including at least two pieces of tissue from the donor.
[0131] Next, three different immunohistochemistry stains were performed on each donor’s sample by staining each individual slide with one of three histological stains: (1) HES (hematoxylin eosin saffron) stain, (2) Luna stain, and (3) Herovici stain, while ensuring that at least one of each donor’s slides is stained with all three immunohistochemistry stains. Since the process of staining slides may be able to stain only 20 slides at a time, slides were batched into groups of 20 during staining, while ensuring that each batch of slides contained equal representation across all three donor age groups.
[0132] Next, images were acquired as follows. High-resolution full-slide digital images were acquired for all slides using a high-throughput slide scanner. Images were acquired at a magnification of 40X and a resolution of 0.5 microns per pixel. Alternatively, images can be acquired at a magnification of about 2X, 5X, 10X, 20X, 60X, 80X, 100X, 200X, 400X, 600X, 800X, 1000X, or 1500X, and at a resolution of about 1.4, about 1.0, about 0.5, about 0.25, about 0.2, about 0.1, about 0.08, about 0.075, about 0.06, about 0.05, about 0.04, about 0.025, about 0.02, or about 0.01 microns per pixel. The slides were scanned in brightfield.
[0133] Next, the data were prepared as follows. To analyze the biological age of the acquired images, the large high-resolution whole-slide images were first tiled into many smaller square image tiles of 128-, 256-, and 5l2-pixel sizes using a sliding tiling window. This dataset of at least about 6,500 (depending on the pixel sizes chosen) image tiles were partitioned into training and test sets with proportions of 2/3 and 1/3, respectively. The selection was done randomly, but such that any given donor has all of his or her image tiles belonging to either the
training set or the test set. Further, all three different partitions or“folds” of the data were tested. Analyses were performed as described below, and the average performance across all three folds is reported, unless otherwise specified.
[0134] Next, the data was analyzed using a machine learning analysis approach as follows. Analyses of the acquired images were performed by first training a deep convolutional neural network. During the training process, images were sampled randomly from the training set using mini-batches of 32 images at a time and inputted to the neural network along with labels representing their true ages. The neural network is configured to calculate a set of predictions for each image, and a ranked probability loss is computed which is indicative of a comparison between the predicted and the true age. A standard gradient descent algorithm using an“Adam” optimizer (described by, for example, Kingma et ah,“Adam: A Method for
Stochastic Optimization,” arXiv.org, 30 Jan. 2017, which is hereby incorporated by reference in its entirety) (with a learning rate of 0.0001, a betal value of 0.9, and a beta2 value of -0.999) was then applied to adjust a set of parameters (e.g., weights) of the neural network in response to this loss so as to improve its predictive abilities as more training images are fed in. A single pass through the entire training set was considered a single epoch, and training proceeded until the ranked probability loss of the entire validation set does not improve over 4 consecutive epochs.
[0135] The deep convolutional network architecture used may be referred to as“ResNet-
50”, and employs a very deep neural network composed of several“residual blocks” (described by, for example, He et ah,“Deep Residual Learning for Image Recognition,” arXiv.org, 10 Dec. 2015, which is hereby incorporated by reference in its entirety). Because training these large networks often presents challenges, in the training process, the network was first initialized using weights that were optimized for general object recognition on the ImageNet dataset (described by, for example, Deng et ah,“ImageNet: A Large-Scale Hierarchical Image Database,”
Conference on Computer Vision and Pattern Recognition , 2009, which is hereby incorporated by reference in its entirety). The first four residual blocks were frozen such that their weights cannot change, and the fifth and final block was unfrozen so as to be able to be updated in the training process described above. Further, the ResNet architecture was extended with an additional fully- connected layer that has the same number of outputs as there are classes in the classification structure. That final layer is passed through a softmax activation layer, so as to make the final prediction a probability vector among the classes.
[0136] Finally, because the model has significant capacity to learn extremely complex functions, the training process artificially introduces noise to the training set to help the neural network improve the generalization of its predictive abilities. Notably, each time an image is
sampled from the training set, a series of transformation operations were applied at random: a horizontal flip with a probability of 50%, a vertical flip with a probability of 50%, a rotation of 90 degrees with a probability of 25%, a rotation of 180 degrees with a probability of 25%, and a rotation of 270 degrees with a probability of 25%.
[0137] The biological age predictions were produced using a classification system (e.g., predicting age groups) instead of a regression analysis (e.g., predicting numeric age). A classification system was selected because the data has a large number of donors in a small number of discrete classes, which makes classification a more suitable study than regression.
[0138] Biological age predictions were validated using the test sets described above in two different manners: prediction of age group of individual image tiles and prediction of age group of donors (by aggregating tile predictions). The final predicted age of a tile was taken as the age group the model assessed with the highest likelihood. The final predicted age of a donor was taken as the certainty-weighted average of all age predictions of its constituent tiles.
[0139] The results are illustrated in FIGs. 5A-5E using two approaches. First, confusion matrices are shown for all tiles (FIG. 5A, an un-aggregated per-tile confusion matrix for an example fold) and for donors (FIG. 5B, a donor-aggregated confusion matrix) in the validation set. These confusion matrices illustrate which age groups were predicted correctly, which were predicted incorrectly, and where the most frequent mistakes were made. Second, FIGs. 5C-5E illustrate un-aggregated“l-vs.-rest” per-tile ROC (receiver-operating characteristic) curves indicating each age group’s“1 vs rest” classification performance, which represents the likelihood of correctly predicting one correct age group versus all other incorrect age groups combined (“Class Y-vs.-rest”,“Class M-vs.-rest”, and“Class O-vs.-rest” per-tile ROC curves for Y vs. M vs. O classification, respectively). In particular, AUC (Area Under the Curve) values of 0.83, 0.77, and 0.83 were achieved for the“Class Y-vs.-rest”,“Class M-vs.-rest”, and“Class O- vs.-rest” classifications, respectively.
[0140] Using the above assessments, the biological age of human skin tissue samples were predicted with excellent accuracy for both individual tile and donor predictions, as shown in Table 1.

[0141] Table 1: Accuracy of biological age prediction of human skin tissue samples
Example 2 - Biological age prediction by analysis of mouse skin tissue
[0142] Biological age prediction was performed by analysis of mouse skin tissue. Skin samples were collected from a set of 50 healthy C57BL/6J mice from four separate age groups: 15 mice are 4 months old (denoted by“4”), 10 mice are 12 months old (denoted by“12”), 10 mice are 15 months old (denoted by“15”), and 15 mice are 18 months old (denoted by“18”). Both dorsal and ventral skin samples were collected from each mouse. C57BL/6J mice are typically considered“old” when they reach 18 months old, which roughly correlates to about a 56 to 69-year-old human. At this age, this type of mouse shows senescent changes, and at 24+ months (“very old”), survivorship drops off rapidly (as described by, for example, Jackson Labs and Flurkey et ah,“The mouse in biomedical research” in James G. Fox (ed.), American College of Laboratory Animal Medicine series, 2007, which is hereby incorporated by reference in its entirety).
[0143] At termination, the mice were perfused with normal buffer formalin 10%. Skin samples were obtained and then fixed for 24 to 48 hours after collection in the same buffer, and the samples were shipped in 70% ethanol.
[0144] Next, tissue samples and slides were prepared as follows. Tissues were shipped from a partner lab, which performed sample collection as described in Example 1, to another partner lab that produced paraffin blocks and slides from the samples.
[0145] Tissue samples were prepared in a specific way in order to reduce processing and batching effects on subsequent aging analysis. Each tissue sample was cut into 6 pieces of 5 mm each, and each piece was embedded in an independent paraffin block. This process produced 12 independent paraffin blocks per mouse, 6 from dorsal skin and 6 from ventral skin. Each block was sectioned into slides at a thickness of 5 microns. Each slide contained 6 separate sections of tissues from the same paraffin block, producing a total of 600 slides.
[0146] Next, the slides were stained using HES (hematoxylin eosin saffron) stain. Since the process of staining slides may be able to stain only 20 slides at a time, slides were batched into groups of 20, while ensuring that each batch of slides contained balanced representation of slides across two dimensions of the data: each of the four age groups is represented in each batch at a rate proportional to their presence in the entire dataset (for example, the oldest and youngest groups have more slides in each batch than the middle two groups), and each batch has equal representation of both ventral and dorsal skin samples. This deliberate batching process was performed in order to minimize biases that may be introduced by the per-batch staining process.
[0147] Next, images were acquired as follows. Full-resolution digital slide images were acquired for all slides using a high-throughput slide scanner. Images were acquired at a
magnification of 40X and a resolution of 0.25 microns per pixel. The slides were scanned in brightfield.
[0148] Next, the data were prepared using a similar process as that described in Example
1. The slides were segmented into smaller square tiles, and each of the mice’s data were partitioned into training and test sets with proportions of 2/3 and 1/3, respectively, while ensuring that no mouse has data appearing in both the training and test sets at the same time.
This resulted in a full dataset of more than about 55,000 images. Analyses were performed as described below, and the average performance across three different training and test folds are reported, unless otherwise specified.
[0149] Next, the data was analyzed using a similar deep convolutional neural network architecture and the machine learning analysis approach described in Example 1. The final network layer is changed so that the number of outputs corresponds to the number of classes in the problem structure, but all other hyper-parameters of the approach are unchanged.
[0150] As discussed in Example 1, the biological age predictions were produced using a classification system (e.g., predicting age groups) in two different manners (using both tile and donor predictions). The results are illustrated in FIGs. 6A-6F using confusion matrices (FIGs. 6A-6B, un-aggregated per-tile and donor-aggregated confusion matrices for“4 vs. 12 vs. 15 vs. 18” classification) and ROC plots (FIGs. 6C-6F, un-aggregated“Class 4-vs.-rest”,“Class 12- vs.-rest”,“Class l5-vs.-rest”, and“Class l8-vs.-rest” per-tile ROC curves for 4 vs. 12 vs. 15 vs. 18 classification, respectively), as described in Example 1. In particular, AUC values of 0.97, 0.85, 0.85, and 0.83 were achieved for the“Class 4-vs.-rest”,“Class l2-vs.-rest”,“Class l5-vs.- rest”, and“Class l8-vs.-rest” classifications, respectively.
[0151] The results for biological age prediction by analysis of mouse skin tissue show that biological age of mouse skin tissue is predicted with excellent accuracy for both individual tile and mouse predictions, as shown in Table 2. These results for mouse skin tissue shows even higher performance than that for human skin tissue. This observation may be expected, since all below mice are from the same genetic background and raised identically. The results for human skin tissue reported in Example 1 are encouraging due to the natural biological variability of humans. This heterogeneity is exacerbated with age. Further, success is reported predicting the biological age of 4-18 month old mice. The machine learning approach may produce even greater accuracy when used to analyze mouse samples of age closer to 24 months.

[0152] Table 2: Accuracy of biological age prediction of mouse skin tissue samples
Example 3 - Biological age prediction by analysis of mouse myoblast cells
[0153] Biological age prediction was performed by analysis of mouse myoblast cells.
[0154] Cell samples were acquired and prepared as follows. To build a cell bank for analyses disclosed herein, skeletal muscle myoblasts were isolated from 52 healthy male C57BL/6J mice in two different age ranges: 20 mice were 4 months old (“young” or“Y”) and 32 mice were 18 months old (“old” or“O”).
[0155] Before isolation of the cells, in order to increase the number of myoblasts isolated, a muscle injury model was used which included degeneration of muscle fiber by cardiotoxin: Naja mossambica venom. Under anesthesia, two injections of 5 mL each were performed in the tibialis anterior in the hind leg of each mouse at a concentration of 0.2 mg/mL. Four injections of 10 mL each was also performed in the gastrocnemius at the same
concentration. A 28-gauge needle was used, and all injections were performed at the same time.
[0156] After a sufficient time (about 3 days) to allow the cells to activate and divide but not enough time to fuse into myotubes, the mice were euthanized, and both the tibialis anterior and gastrocnemius of the mice were dissected. The muscle tissues were then incubated in Collagenase type II (250U/mL) at 37°C for 1.5 hours for enzymatic digestion. The muscle was then washed in PBS (phosphate-buffered saline) and mechanically disrupted by triturating and pipetting up and down with a broken end glass Pasteur pipette, thereby dissociating the tissue into muscle fibers.
[0157] Next, a second digestion of the muscle fibers was performed to release the cells from the fiber. This digestion was performed using Collagenase type II (40U/mL) / Dispase (2U/mL) at 37°C for 1 hour. After 2 rounds of washing and centrifugation, the cells were resuspended in 10-20 mL of Ham’s F10 supplemented with 10% horse serum. Cells were then pre-plated onto non-coated tissue culture dishes. This step of pre-plating was used to reduce the number of fibroblasts and to enrich myoblasts. After 30 minutes, the cell suspension was collected, the cells were centrifuged, and the cells are resuspended in Ham’s F10 basal medium with 20% BGS (bovine growth serum) and 5 ng/mL of basic FBF (fibroblast growth factor). Next, the cells were plated onto matrigel-coated dishes. Finally, the cells were cultured for 2 days, fed every day with the previous media, and then frozen down in cryostor cslO media.
[0158] Because all the mice cannot be isolated at once, 6 separate isolation runs were performed as described above, and each isolation run always included a representative split of young and old mice. This process generated 52 different primary myoblast lines at passage 1 to be used below.
[0159] Next, images were acquired as follows for testing biological age prediction. A set of 12 young primary myoblast lines and 12 old primary myoblast lines were individually cultured, stained, and imaged. All 24 primary myoblasts (12 young and 12 old) were thawed on matrigel coated dishes at a density of 20,000 cells/cm2 in myoblast growth media (Ham’s F10 basal medium with 20% BGS (bovine growth serum) and 5 ng/mL of basic FGF (fibroblast growth factor)). The cells were fed daily due to the FGF’s heat liability (causing rapid degradation). After 48 hours, the cells were lifted from the plate using DPBS (Dulbecco
Phosphate Buffer Saline) without Ca2+, Mg2+.
[0160] The cells were seeded in 384-well matrigel-coated plates at around 3,000 cells per well. Particular attention was made at each step to ensure that any experimenter working with the cells handled both young and old cells at the same time. Again, this step is taken to minimize any experimental bias introduced between young and old samples. The plate layout was also specifically designed to minimize experimental bias caused by the well position in the plate (as described in the plate layout section of, for example, Bray et ak,“Cell Painting, a high-content image-based assay for morphological profiling using multiplexed fluorescent dyes,” Nat.
Protoc., 25 Aug. 2016, which is hereby incorporated by reference in its entirety). In addition, only 240 wells are used in the 384-well plate layout in order to limit edge effects from the wells on the edge of the plate. Each of the 24 primary myoblast lines were plated in 10 replicate wells, covering all 240 used wells.
[0161] After plating (e.g., at 24 hours post-plating), the cells were fed with myoblast growth media. At 48 hours post-plating, the cells were stained for Cytopainter ER Green,
Desmin antibody, Click IT EdU 647, and counterstain for Hoechst. As a first step, before the cells are fixed, the cells were labeled with EdU (5 uM EdU for 30 minutes according to manufacturer’s instructions: Invitrogen catalog #00356). The cells were fixed with 4% PFA in PBS for 20 minutes at room temperature, then permeabilized in a mixture of PBS and 0.3% Triton X-100. The cells were then blocked using Goat Block Buffer at 4°C overnight. The cells were then incubated in Rabbit-anti-Desmin antibody at 1 :200 dilution in Goat Block Buffer at 4°C overnight. The cells were then incubated in secondary antibodies and dye for one hour at room temperature using a label mix comprising Cytopainter ER Green (1 : 1000 dilution),
Hoechst, and AlexaFluor 568 Gt-a-Rb (1 :500 dilution). The plates were sealed in preparation for imaging.
[0162] A high-throughput automated imager was used to capture 25 non-overlapping fields per well at a magnification of 40X with a separate image captured for each of the 4 stain channels plus brightfield. This image acquisition produced about 30,000 unique non-overlapping field images (2208 pixels wide) per plate (5 channels x 240 wells x 25 fields per well).
[0163] Next, the data were prepared using a similar process as that described in
Examples 1 and 2. The cellular image datasets were partitioned into training and test sets with proportions of 2/3 and 1/3, respectively, while ensuring that no mouse has data appearing in both the training and test sets at the same time and that the splits are done in equal proportion among the two age groups. Analyses were performed as described below, and the average performance across three different training and test folds are reported, unless otherwise specified.
[0164] For the analyses below, all combinations of the microscopy cell stains used were tested, and the stain combination identified as being the most predictive of biological age was chosen.
[0165] The high-resolution images were also transformed using a standard normalization approach. First, the mean and the standard deviation of the intensity of each image channel was calculated across the entire dataset. Each image then had its intensity transformed by subtracting the mean intensity for the whole dataset from each image channel, then having the intensity value divided by the whole dataset’s standard deviation. This created a“zero-mean, unit- variance” dataset across all of the images.
[0166] Next, the data was analyzed using a similar deep convolutional neural network architecture and the machine learning analysis approach described in Examples 1 and 2. Again, the output layer was altered so that the number of output layers corresponds to the number of classes in the problem structure, which in this case is two.
[0167] A single epoch of training for cellular images comprised iterating through all images once. However, because the images are high-resolution and large, they were first down- sampled to half the resolution (1104 pixels wide) and a random 5l2-pixel square crop was first sampled within that field before inputting into the neural network. Hence, only a subset of the data was trained on in a given epoch, but that subset varies with each epoch.
[0168] Duplicate experiments were performed as follows. The above procedure to process the 24 primary myoblast lines was performed twice (including acquiring images, preparing and transforming the data, and analyzing the data using a deep convolutional neural network architecture and the machine learning analysis approach disclosed herein, using two
separate collections of 24 primary myoblast lines taken from the original bank of 52 produced as described above. These duplicated experiments produced two separate analyses of the same process for replication purposes.
[0169] As discussed in Examples 1 and 2, the biological age predictions were produced using a classification system (e.g., predicting age groups) in two different manners (this time using both individual well and aggregated mouse predictions). The results are illustrated in FIGs. 7A-7D using confusion matrices (FIGs. 7A-7B, well-aggregated and mouse-aggregated confusion matrices for“Y vs. O” classification) and an ROC plot (FIG. 7C, un-aggregated per- image prediction). In particular, an AUC value of 0.69 was achieved for the“Y vs. O” classification.
[0170] Overall, the biological age of mouse myoblast cells was predicted with excellent results for both individual well and mouse predictions, as shown in Table 3.

[0171] Table 3: Accuracy of biological age prediction of mouse myoblast cell samples
[0172] Due to the significant biological differences between cell types, culture conditions, and especially different organisms, it may be difficult and not appropriate to directly compare biological age prediction performances between myoblasts and different cell types (e.g., myoblasts vs. fibroblasts vs. keratinocytes). While excellent biological age prediction power was observed for all cell types reported here, due to their natural biological variability it may be expected to find variation in prediction accuracies across cell types.
Example 4 - Biological age prediction by analysis of human fibroblast cells
[0173] Biological age prediction was performed by analysis of human fibroblast cells.
[0174] Cell samples were acquired and prepared as follows. Human dermal fibroblasts from 10 subjects participating in the Baltimore Longitudinal Study of Aging were procured from the Coriell Institute for Medical Research’s Biobank repository: 5 young (“Y”) samples (age 22 to 28 years old, ID#: AG11747, AG07804, AG09860, AG06310, AG09559) and 5 old (“O”) samples (Age 81, ID#: AG09149, AG07802, AG09156, AG13218, AG04055).
[0175] Next, images were acquired as follows for testing biological age prediction. A set of 5 lines of human fibroblasts from young donors and 5 lines of human fibroblasts from old donors were individually cultured, stained, and imaged.
[0176] All 10 human fibroblast lines were received live in flask in Eagle's MEM with
Hank’s BSS, with 26 mM Hepes; ambient C02 with 2mM L-glutamine. At reception, the cells
were switched to DMEM 10% Fetal Bovine Serum (FBS) and cultured until they reached 80 % confluency. The cells were then passaged using trypsin and plated in new flasks for another passage in DMEM 10% FBS. At the next passage, the cells were plated in 384-well plates at a density of 1,000 cells per well. Particular attention was made at each step to ensure that any experimenter working with the cells handled both young and old cells at the same time. Again, this step is taken to minimize any experimental bias introduced between young and old samples. The plate layout was also specifically designed to minimize experimental bias caused by the well position in the plate, as described in Example 3. In addition, only 200 wells were used in the 384-well plate layout in order to limit edge effects from the wells on the edge of the plate. Each of the 10 human fibroblast lines were plated in 20 replicate wells, covering all 200 used wells.
[0177] At 48 hours post plating, the cells were fixed and stained with Concanavalin A-
AF488 (1 : 10), Mitotracker-Red (250 nM) and Phalloidin-AF647 (1 :25) and counterstained with Hoechst 33342 (1 : 1000).
[0178] A high-throughput automated imager was used to capture 100 non-overlapping fields per well (a 10 x 10 matrix) at a magnification of 40X using a Thermo CX7 automated microscope with a separate image captured for each of our 4 stain channels and brightfield. This image acquisition produced about 100,000 unique non-overlapping field images (2208 pixels wide) per plate (5 channels x 200 wells x 100 fields per well).
[0179] Next, the image data were analyzed according to the approach described in
Example 3.
[0180] As discussed in Example 3, the biological age predictions were produced using a classification system (e.g., predicting age groups) in two different manners (using both individual well and aggregated donor predictions). The results are illustrated in FIGs. 8A-8C using confusion matrices (FIGs. 8A-8B, well-aggregated and donor- aggregated confusion matrices for“Y vs. O” classification) and an ROC plot (FIG. 8C, un-aggregated per-image prediction). In particular, an AETC value of 0.98 was achieved for the“Y vs. O” classification.
[0181] Overall, the biological age of human fibroblast cells was predicted with excellent results for both individual well and donor predictions, as shown in Table 4.

[0182] Table 4: Accuracy of biological age prediction of human fibroblast cell samples
[0183] Due to the significant biological differences between cell types, culture conditions, and especially different organisms, it may be difficult and not appropriate to directly
compare biological age prediction performances between fibroblasts and different cell types (e.g., myoblasts vs. fibroblasts vs. keratinocytes). While excellent biological age prediction power was observed for all cell types reported here, due to their natural biological variability it may be expected to find significant variations in prediction accuracies across cell types.
Example 5 - Biological age prediction by analysis of human keratinocvte cells
[0184] Biological age prediction was performed by analysis of human keratinocyte cells.
[0185] Cell samples were acquired and prepared as follows.
[0186] Ten human keratinocyte lines were purchased from Lonza (Catalog No. 192627).
Five young (“Y) keratinocyte samples ranging from 20 to 37 years of age (Lot Nos. 530069, 540810, 549412, 552653, and 577922) and five old (“O”) keratinocyte samples ranging from 60 to 88 years of age (Lot Nos. 34015, 30214, 29598, 29549, and 34014) were used.
[0187] Next, images were acquired as follows for testing biological age prediction. A set of 5 lines of human keratinocytes from young donors and 5 lines of human keratinocytes from old donors are individually cultured, stained, and imaged.
[0188] All 10 keratinocyte lines were received frozen. The cells were thawed and cultured in Gibco defined K-SFM media (Thermo-Fisher Catalog No. 10744019). The cells were passaged using trypsin and plated in 384-well plates at a density of 2500 cells per well. Particular attention was made at each step to ensure that any experimenter working with the cells handled both young and old cells at the same time. Again, this step is taken to minimize any experimental bias introduced between young and old samples. The plate layout was also specifically designed to minimize experimental bias caused by the well position in the plate, as described Example 3. In addition, only 200 wells are used in the 384-well plate layout in order to limit edge effects from the wells on the edge of the plate. Each of the 10 human keratinocyte lines were plated in 20 replicate wells, covering all 200 used wells.
[0189] At 72 hours post plating, the cells were fixed and stained with Concanavalin A-
AF488 (1 : 10), Mitotracker-Red (250 nM) and Phalloidin-AF647 (1 :25) and counterstained with Hoechst 33342 (1 : 1000).
[0190] A high-throughput automated imager is used to capture 100 non-overlapping fields per well (a 10 x 10 matrix) at a magnification of 40X using a Thermo CX7 automated microscope with a separate image captured for each of our 4 stain channels and brightfield. This image acquisition produced about 100,000 unique non-overlapping field images (2208 pixels wide) per plate (5 channels x 200 wells x 100 fields per well).
[0191] Next, the image data were analyzed according to the approach described in
Example 3.
[0192] As discussed in Example 4, the biological age predictions were produced using a classification system (e.g., predicting age groups) in two different manners (using both individual well and aggregated donor predictions). The results are illustrated in FIGs. 9A-9C using confusion matrices (FIGs. 9A-9B, well-aggregated and donor- aggregated confusion matrices for“Y vs. O” classification) and an ROC plot (FIG. 9C, un-aggregated per-image prediction). In particular, an AUC value of 0.84 was achieved for the“Y vs. O” classification.
[0193] Overall, the biological age of human keratinocyte cells was predicted with excellent results for both individual well and donor predictions, as shown in Table 5.
[0194] Biological age of human keratinocyte cells are predicted with promising results for both individual well and donor predictions.

[0195] Table 5: Accuracy of biological age prediction of human keratinocyte cell samples
[0196] Due to the significant biological differences between cell types, culture conditions, and especially different organisms, it may be difficult and not appropriate to directly compare biological age prediction performances between keratinocytes and different cell types (e.g., myoblasts vs. fibroblasts vs. keratinocytes). While excellent biological age prediction power was observed for all cell types reported here, due to their natural biological variability it may be expected to find significant variations in prediction accuracies across cell types.
Example 6 - In vivo tissue-based drug screening of mouse skin tissue
[0197] The machine learning systems and methods for predicting biological age were applied toward accelerating drug screens designed to detect interventions that slow or reverse one or more phenotypes of aging. Such a drug screening approach was tested using proof-of- concept drug screens, including an in vivo drug screening experimental model. This machine learning-based drug screening approach for aging-related therapies is described below. The machine learning-based skin tissue aging modeling approach was used to test an in vivo screening system for detecting topical anti-aging interventions on mouse skin.
[0198] Mouse skin tissue samples were acquired and prepared as follows. Skin samples were collected from 75 healthy C57BL/6J mice in five separate groups: 15 mice in a control group were 10 months old (“Control 1”), 15 mice in another control group were 14 months old (“Control 2”), 15 mice in a third control group were 18 months old (“Control 3”), and two independent treatment groups comprised 18-month-old mice (“Test Article 1” and“Test Article
2”). Each treatment group included 15 mice given a daily topical application for 61 days, as detailed below. All mouse ages are referenced from the start of the experiment.
[0199] The mice were shaved as necessary on a weekly basis in order to enable daily topical application on the back of the mice. The topical application was applied in a 2 cm x 2 cm square on the back of the mice identified with indelible ink.
[0200] At day 61, four individual 5-mm diameter punch biopsies were collected from the backs of each mouse in a grid in the test article treated area. Biopsies were fixed for 24 to 48 hours in normal buffer formalin 10%. Each biopsy was then cut into two halves, and all eight biopsy pieces were then mounted into a single paraffin block, as illustrated by the biopsy cutting and slide preparation scheme shown in FIG. 10.
[0201] Next, sample slides were prepared as follows. Each block was sectioned into slides at a thickness of 5 microns. Each slide contained 16 separate sections of tissues from the same paraffin block.
[0202] One slide for each mouse was stained using HES (hematoxylin eosin saffron).
Since the process of staining slides may be able to stain only 20 slides at a time, slides were batched into groups of 20, while ensuring that each batch of slides contained balanced representation of slides across all five groups (Controls 1-3 and Test Articles 1-2). This deliberate batching process was performed in order to minimize biases introduced by the per- batch staining process.
[0203] Next, images were acquired as follows. Full-resolution digital slide images were acquired for all slides using a high-throughput slide scanner. Images were acquired at a magnification of 40X and a resolution of 0.25 microns per pixel. The slides were scanned in brightfield.
[0204] All mice in the Control 1-3 groups received a control topical application comprising 80% DMSO, 19.9% water, and 0.1% Carbopol 934. Each mouse received 60 pL daily applications of this solution applied over the 2 cm x 2 cm test site.
[0205] Animals in Test Article 1 received a daily dose of 16.2 pg of All Trans Retinoic
Acid (ATRA) (CAS No. 302-79-4) dissolved in the same solution as the control groups and applied identically as the control groups.
[0206] Animals in Test Article 2 receive a daily dose of a combination of 5.18 mg of
Vitamin C (CAS No. 50-81-7) and 1.29 mg of Vitamin E (CAS No. 59-02-9) dissolved in the same solution as the control groups and applied identically as the control groups.
[0207] Next, the data were prepared as follows. The images from the control mice comprised the“aging dataset,” while the images from the two test articles comprised the
“compound dataset.” Next, the data were prepared using a similar process as that described in Example 1. First, each whole slide image was segmented into smaller, non-overlapping square tiles of 512 pixels each, and each of the mice’s data were partitioned into training and test sets with proportions of 2/3 and 1/3, respectively, while ensuring that no mouse has data appearing in both the training and test sets at the same time. This resulted in an aging dataset of about 5,000 images in the aging dataset and a treatment dataset of about 5,000 images. Analyses were performed as described below, and the average performance across three different training and test folds are reported, unless otherwise specified.
[0208] Next, the data was analyzed using a similar deep convolutional neural network architecture and the machine learning analysis approach as that described in Example 1. First, the deep convolutional neural network architecture was trained using the aging dataset and the machine learning analysis approach described in Example 1. Performing this training yields a final set of weights to use with the neural network for the treatment analysis. Second, the effects of the treatments were analyzed by applying the generated neural network to the entirety of the treatment dataset. This is subsequently referred to as a“transference” of the aging model to the treatment data.
[0209] Average age predictions for each mouse were produced by predicting the biological age classification for each tile and averaging all tiles’ predictions together. This calculation was performed for all three folds of the data, and those average predictions were then averaged together again. This produced a single numerical biological age prediction for each mouse, which was then averaged into a single numerical biological age prediction for the Control group (averaged across control groups 1-3) and each of the Test Article groups, as shown in
Table 6
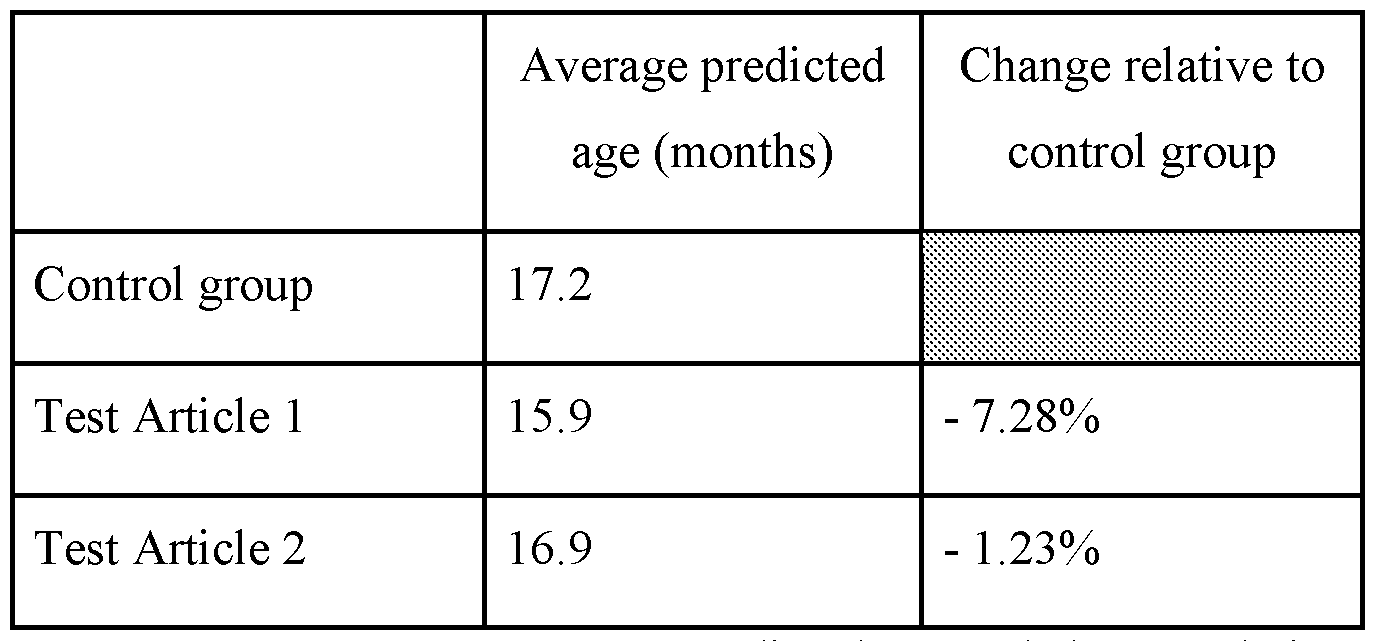
[0210] Table 6: Average predicted age and change relative to control group for the control group and both test article groups
[0211] Next, p-values were calculated using the Kolmogorov- Smirnov test to assess the statistical difference of the distributions of age predictions for Test Article groups versus the
Control Group. One p-value was calculated for each fold of the machine learning analysis. All three folds were found to be statistically significant for Test Article 1, and two of the three folds were found to be statistically significant for Test Article 2, as shown in Table 7.

[0212] Table 7: p-values for each of three folds for both test article groups
Example 7 - In vitro cell-based drug screening of mouse myoblast cells
[0213] The machine learning systems and methods for predicting biological age were applied toward accelerating drug screens designed to detect interventions that slow or reverse one or more phenotypes of aging. Such a drug screening approach was tested using proof-of- concept drug screens, including an in vitro drug screening experimental model. This machine learning-based drug screening approach for aging-related therapies is described below. The machine learning-based mouse myoblast cellular aging approach was used to test an in vitro screening model for detecting anti-aging molecules for myoblasts.
[0214] The myoblast cell screening was run in parallel with the myoblast biological age prediction described in Example 3, and the same processes for primary cell acquisition, preparation, processing, and image acquisition steps were performed as described in Example 3.
[0215] For myoblast screening, replicate 384-well plates were dedicated to testing compound treatments (Treatment Plates) and were seeded with primary myoblasts, replicating the same plate layout as the myoblast age prediction experiment described in Example 3.
[0216] For the Treatment Plates, after the cells adhere to the plate (around 2 hours post plating) the media was changed. For each set of 10 replicate wells from each primary myoblast line, 4 of the wells received media supplemented with vehicle control, 3 wells received media supplemented with one test compound, and 3 wells received media supplemented with another test compound. In this manner, each Treatment Plate was used to test two different compounds, and three Treatment Plates were used in total to test six different compounds.
[0217] Six different compounds were tested, as shown in Table 8.

[0218] Table 8: Compounds tested using mouse myoblast cells
[0219] All Treatment Plates were fed 24 hours post-plating with myoblast growth media supplemented with drugs or their respective vehicle control.
[0220] As mentioned, the plates are handled, processed, and stained in the same way as described in the myoblast biological age prediction described in Example 3. Briefly, these plates were stained for EdU, desmin, ER cytopainter, and counterstained with Hoechst.
[0221] Next, the data were prepared using a similar process as that described in Example
3. This created a treatment dataset that was analyzed using a previously generated aging model, which was trained on the aging dataset that was generated as described in Example 3.
[0222] Next, the data was analyzed using a similar deep convolutional neural network architecture and the machine learning analysis approach described in Example 1. First, the deep convolutional neural network architecture was trained using the aging dataset and the machine learning analysis approach described in Example 1. Performing this training yields a final set of weights to use with the neural network for the treatment analysis. Second, the effects of the treatments were analyzed by applying the generated neural network to the entirety of the treatment dataset. This is subsequently referred to as a“transference” of the aging model to the treatment data.
[0223] Next, as described in Example 6, average age predictions for each mouse were produced by predicting the biological age classification for each tile and averaging all tiles’ predictions together. This calculation was performed for all three folds of the data, and those average predictions were then averaged together again. This produced a single numerical biological age prediction for each mouse, which was compared to control.
[0224] Next, as described in Example 6, p-values were calculated using the
Kolmogorov- Smirnov test to assess the statistical difference of the distributions of age predictions for each compound versus control. Note that in this case, because there are multiple plates being tested, each with different test compounds, each compound is compared only to the control wells on its own plate, thereby resulting in different control values for each compound, as shown in Table 9.

[0225] Table 9: Average predicted age of treatment and control groups for each compound
[0226] Four of the six compounds tested were detected as causing statistically significant reductions in biological age prediction as reported by the machine learning model. These molecules were identified as interesting possible“hits” for further follow-up analysis related to their effect on biological age, thereby validating this approach as a useful in vitro screen that can be deployed for high-throughput detection of promising anti-aging compounds.
Example 8 - High-throughput in vitro cell-based screening
[0227] The myoblast screening results described in Example 7 are deployed as a high- throughput screen (HTS) designed to screen hundreds of thousands of molecules. The approach is quite similar, but the number of cells and wells used to screen those molecules is significantly scaled up.
[0228] There may be challenges to overcome when deploying this approach as a high- throughput screen, many of which are related to producing a large enough cell bank of primary
cell lines without passaging the cells to an excessive extent such that detected signals of aging are lost.
[0229] A high-throughput screen can be performed using the biological age prediction systems and methods of the present disclosure, by performing the following three steps: making a master bank of cells, validating the original biological aging prediction, and performing the actual screen.
[0230] Primary myoblast cells are chosen as an illustrative example. However, this technology can be deployed using any of many different cell types, including but not limited to the three cell types described in Examples 3-5 and 7 (myoblasts, fibroblasts, and keratinocytes).
[0231] First, a master bank of cells is produced with enough cells to power a high- throughput screen involving many molecules while trying to maintain a low passage number to avoid losing the markers of aging.
[0232] Primary myoblast cells are isolated from 49 C57BL/6J mice using the same process as described in Example 3. The vials of cells at passage 1 are thawed and plated at 15,000 cells/cm2 on matrigel-coated flasks, cultured for 63 hours in myoblast growth media, and frozen down at passage 2 into the three populations described below.
[0233] Note that care is taken during any freeze or thaw to make sure that all cell lines are frozen and/or thawed at the same time. As described in previous examples, particular attention is made at each step to ensure that any experimenter working with the cells handles both young and old cells at the same time. These steps are taken to minimize any experimental bias introduced between young and old samples.
[0234] The cell lines are organized into three distinct populations: (a) 24 separate primary myoblast lines (12 young and 12 old) to be used in reproducing the biological age prediction results (“Individual Young Lines” and“Individual Old Lines”), (b) two mixes, each containing 12 young or old primary cell lines to be used for optional additional machine learning training on each HTS plate (“Young Training Mix” and“Old Training Mix”), and (c) two mixes, each containing 14 primary cell lines to be used for screening molecules (“Young Testing Mix” and“Old Testing Mix”). Each mix is produced with an equal representation of cell counts from each composite cell line.
[0235] The limiting factor for an HTS may be the number of vials of Old Testing Mix, as this is the cell population which is used to test many different molecules. The number of vials of Old Testing Mix produced defines the number of molecules available for testing. At the end of this process, 28 vials Old Testing Mix are produced with 5.3M cells per vial, enabling more than
about 60,000 molecules to be tested in an initial screen. This process can and is repeated with more cells (and more cell types) to power further screening.
[0236] Next, after producing a new master bank of cells to power an HTS, it is important to re-validate the machine learning-powered biological aging prediction process using these cells. This validation is important when testing any new population of cells that have undergone new lab procedures in order to reduce the likelihood that unexpected experimental bias has been introduced.
[0237] To perform such validation, all of the Individual Lines and Training Mixes frozen at passage 2 are thawed and plated at 15,000 cells/cm2 on matrigel-coated flasks for 63 hours in myoblast growth media. Then the cells are detached and plated (at passage 3) following the same experimental bias-reducing plate layouts from the myoblast age prediction described in Example 3.
[0238] The rest of the culturing, fixation, image acquisition, and analysis process follow the procedures from the myoblast age prediction described in Example 3. To validate the results, the machine learning approach is used on this newly produced population of cells and observed to be at least as successful in predicting biological age when compared to the previous experiments.
[0239] Next, the HTS is performed. To run the screen, both the Training Mixes and the
Testing Mixes are used. The compounds are tested in wells containing Old Testing Mix. The Young and Old Training Mixes are included in separate wells on each plate in case it is useful to validate the biological age prediction process on each individual plate. The Young Testing Mix is included in separate wells on each plate and includes control molecules used to validate controls’ effects on the young mix.
[0240] Each plate contains about 300 compounds in Old Testing Mix, each in a single well. The plate also includes 36 other wells with 12 replicates each of Young Training Mix, Old Training Mix, and Young Testing Mix.
[0241] All cells are plated in myoblast growth media, and 2 hours later the media is changed as described in the myoblast in vitro screening of Example 7. Each well receives either vehicle control (DMSO) or a screening compound.
[0242] In order to screen more than about 60,000 compounds, the HTS is split up into multiple runs, each of which produces 12-15 plates following the plan described above. One vial of Old Testing Mix is used for each run.
[0243] Next, image acquisition and analysis are performed. The image acquisition is performed in the same manner described in the myoblast in vitro experiment of Example 7.
Analysis and hit detection are also performed in the same manner described in the myoblast in vitro experiment of Example 7.
[0244] Next, follow-up is performed after the primary screen. After primary HTS screening, enough vials are maintained to perform standard HTS follow-up experiments:
reproducing hits, dose response analysis, etc.
[0245] The above HTS procedure is applicable to many cell types, culture procedures, and staining protocols. This can enable unbiased high-throughput screening for age-related phenotype reversal in many different situations.
[0246] While preferred embodiments of the present invention have been shown and described herein, it will be obvious to those skilled in the art that such embodiments are provided by way of example only. Numerous variations, changes, and substitutions will now occur to those skilled in the art without departing from the invention. It should be understood that various alternatives to the embodiments of the invention described herein may be employed in practicing the invention. It is intended that the following claims define the scope of the invention and that methods and structures within the scope of these claims and their equivalents be covered thereby.
Claims
1. A method of using a biological age predictor comprising:
(a) providing data of a sample to said biological age predictor, wherein said biological age predictor generates a first biological age;
(b) treating said sample with a substance, thereby generating a treated sample; and
(c) providing data of said treated sample to said biological age predictor, wherein said biological age predictor generates a second biological age.
2. The method of claim 1, wherein said sample is a cell sample.
3. The method of claim 2, wherein said cell sample is a skin, muscle, blood, liver, heart, spleen, thymus, brain, myoblast, fibroblast, or keratinocyte cell sample.
4. The method of claim 2, wherein said cell sample is a skin cell sample.
5. The method of claim 1, wherein said sample is a tissue sample.
6. The method of claim 5, wherein said tissue sample is a skin, fibroblast, muscle, liver, heart, spleen, thymus, or brain tissue sample.
7. The method of claim 5, wherein said tissue sample is a skin tissue sample.
8. The method of any one of claims 1 to 7, wherein said biological age predictor applies machine learning.
9. The method of claim 8, wherein said machine learning comprises a convolutional neural network (CNN).
10. The method of claim 9, wherein said convolutional neural network comprises a deep convolutional neural network (DCNN).
11. The method of any one of claims 1 to 7, wherein said biological age predictor is a computer-implemented system, wherein said system has been trained to determine said biological age of said sample.
12. The method of any one of claims 1 to 11, wherein said data comprises an image, an epigenetic profile, a proteomic profile, or a metabolomics profile.
13. The method of any one of claims 1 to 12, wherein said data identifies cell morphology, biomarkers, or cellular components.
14. The method of any one of claims 1 to 13, wherein said substance is anti-aging agent.
15. The method of any one of claims 1 to 13, wherein said substance is a new drug entity.
16. The method of any one of claims 1 to 15, further comprising comparing said first biological age and said second biological age to determine the efficacy of said substance.
17. The method of any one of claims 1 to 16, wherein said first biological age or said second biological age of the sample is the specific age of the sample.
18. The method of any one of claims 1 to 16, wherein said first biological age or said second biological age of the sample is the age range of the sample.
19. The method of any one of claims 1 to 16, wherein said first biological age and said second biological age of the sample are the relative age of said sample and said treated sample.
20. The method of any one of claims 1 to 19, further comprising staining said sample and said treated sample with a stain.
21. The method of claim 20, further comprising acquiring a plurality of images of said stained sample to provide said data of said sample, and acquiring a plurality of images of said stained treated sample to provide said data of said treated sample.
22. The method of claim 21, further comprising processing said plurality of images to determine said first biological age and said second biological age.
23. The method of any of claims 1-22, further comprising determining said first biological age and said second biological age with an accuracy of at least about 80%.
24. The method of any of claims 1-22, further comprising determining a difference in age between said first biological age and said second biological age.
25. The method of any of claims 1-22, further comprising determining a percentage difference in age between said first biological age and said second biological age.
26. The method of any of claims 1-22, further comprising providing a subject in need thereof with said substance, based at least in part on said first biological age and said second biological age.
27. A computer-implemented method of determining the effectiveness of a substance by using a biological age predictor comprising:
(a) providing data of a sample to said biological age predictor, wherein said biological age predictor identifies an aging factor; and
(b) provide a substance to a subject based on said aging factor.
28. The method of claim 27, further comprising providing data of a second sample from said subject subsequent to providing said substance, wherein said biological age predictor applies machine learning to determine the biological age of said second sample.
29. The method of claim 27 or 28, wherein said biological age predictor applies machine learning.
30. A computer-implemented method of determining the biological age of a sample using a biological age predictor comprising:
(a) providing data of a sample to said biological age predictor, wherein said biological age predictor applies machine learning to generate a biological age,
wherein providing data of said sample to said biological age predictor does not involve input by a user to identify a feature.
31. The method of claim 30, further comprising determining said biological age with an accuracy of at least about 80%.
32. A computer-implemented method for determining the biological age of a sample comprising:
(a) obtaining a first sample from a first subject;
(b) labeling said first sample with a label to generate a labeled sample;
(c) performing a first assay on said labeled sample to generate a first sample data; and
(d) applying, by a computer comprising a processor configured to execute a computer program including instructions, executable by said processor, to apply a machine learning detection structure to said first sample data, wherein said detection structure employs machine learning to screen locations in said first sample data to:
(i) identify a feature and classify said feature to said label; and
(ii) determine the biological age of said first sample based at least in part on said identified and classified feature.
33. The method of claim 32, further comprising determining said biological age with an accuracy of at least about 80%.
34. The method of claim 32, wherein said first sample is a cell sample.
35. The method of claim 34, wherein said cell sample is a skin, muscle, blood, liver, heart, spleen, thymus, brain, myoblast, fibroblast, or keratinocyte cell sample.
36. The method of claim 34, wherein said cell sample is a skin cell sample.
37. The method of claim 32, wherein said first sample is a tissue sample.
38. The method of claim 37, wherein said tissue sample is a skin, fibroblast, muscle, blood, liver, heart, spleen, thymus, or brain tissue sample.
39. The method of claim 37, wherein said tissue sample is a skin tissue sample.
40. The method of any one of claims 32 to 39, wherein said first subject is human.
41. The method of any one of claims 32 to 40, wherein said first subject exhibits a symptom associated with Hutchinson-Gilford Progeria Syndrome (HGPS) or Werner Syndrome.
42. The method of any one of claims 32 to 41, wherein said first subject exhibits an aging symptom.
43. The method of claim 42, wherein said aging symptoms are selected from the group consisting of muscle wasting (sarcopenia), slower wound healing, skin growths, rough skin, dry skin, loose facial skin, transparent skin, decreased skin elasticity, wrinkling, sagging skin, whitening of hair, and graying of hair.
44. The method of any one of claims 32 to 43, wherein said first assay comprises staining said first sample.
45. The method of claim 44, wherein staining said first sample comprises applying a stain to said first sample, wherein said stains are selected from the group consisting of DAP I, H&E, HES (hematoxylin eosin saffron), Luna stain, Herovici stain, Van Gieson (EVG), and stains used to identify lipofuscin, lysosomes, P16, P19, beta-galactosidase, LC3, ubiquitin, mitochondria, DNA damage, distribution of organelles, nuclear lamina, cell activation, CCR2, soma size, neurites, cytoskeletal structure, or membrane ruffling.
46. The method of any one of claims 32 to 45, wherein labeling said first sample comprises attributing chronological age, age-related diseases, progression, clinical metadata, or a combination thereof to said first sample.
47. The method of any one of claims 32 to 46, wherein labeling said first sample comprises attributing information of said first sample by imaging, morphological profiling, cell painting, mass spectrometry, antibody chips, 2-F Fluorescence Difference Gel Electrophoresis (DIGE), mass spectrometric immunoassay (MSIA), or laser capture microdissection (LCM).
48. The method of any one of claims 32 to 47, wherein said first sample data is an image.
49. The method of any one of claims 32 to 48, wherein said first sample data is segmented into a plurality of 2D slices, and wherein said detection structure employs said convolutional neural network to screen locations in each of said plurality of 2D slices of said segmented first sample data by a sliding window methodology to identify said feature and classify said feature.
50. The method of any one of claims 32 to 49, further comprising determining, upon applying the machine learning detection structure to a second sample data obtained from a second assay of a second sample of a second subject, the biological age of said second subject
based at least in part on a second feature identified in said second sample data, wherein said feature comprises said second feature.
51. The method of claim 50, wherein said first assay and said second assay are the same type of assays.
52. The method of claim 50, wherein said first assay and said second assay are different types of assays.
53. The method of claim 50, wherein said first sample data and said second sample data are the same type of sample data.
54. The method of claim 50, wherein said first sample data and said second sample data are different types of sample data.
55. The method of claim 50, wherein said first sample data is image data, proteomics data, or metabolomics data.
56. The method of claim 50, wherein said first assay is an epigenetics assay.
57. The method of any one of claims 32 to 56, wherein determining the biological age of the first sample comprises determining the specific age of the first sample.
58. The method of any one of claims 32 to 56, wherein determining the biological age of the first sample comprises determining the age range of the first sample.
59. The method of any one of claims 32 to 56, wherein determining the biological age of the first sample comprises determining the relative age of the first sample in comparison to the second sample.
60. The method of any one of claims 32 to 59, wherein the machine learning detection structure comprises a neural network.
61. The method of claim 60, wherein the neural network comprises a convolutional neural network.
62. The method of claim 61, wherein the convolutional neural network comprises a deep convolutional neural network.
63. The method of claim 62, wherein the deep convolutional neural network comprises a cascaded deep convolutional neural network.
64. The method of any one of claims 32 to 63, wherein said computer program includes instructions, executable by said processor, to apply to said first sample data a network structure selected from the group consisting of recurrent neural network structure and general adversarial network structure.
65. The method of claim 64, wherein results from applying said machine learning detection structure are combined with results from applying said network structure to determine said biological age.
66. The method of any one of claims 32 to 65, wherein said computer program includes instructions, executable by said processor, to apply to said first sample data a technique selected from the group consisting of gradient boosting, random forests, and support vector machines.
67. The method of claim 66, wherein results from applying said machine learning detection structure are combined with results from applying said technique.
68. A method of using a biological age predictor comprising:
(a) receiving initial data comprising a predicted biological age value from said biological age predictor;
(b) automatically labeling said initial data with an extraction program, thereby producing labeled data, wherein said extraction program detects and uniquely labels a desired feature with a first label; and
(c) processing said labeled data for use in a second biological age predictor, wherein said second biological age predictor is configured to determine the biological age of a sample subject based at least in part on identification of said desired feature.
69. A computer-implemented system comprising: a digital processing device comprising:
(a) a processor;
(b) an operating system configured to perform executable instructions;
(c) a memory; and
(d) a computer program including instructions executable by the digital processing device to create an application applying machine learning detection structures to a plurality of sample data to determine the biological age of a sample, the application comprising:
(i) a software module applying a machine learning detection structure to said plurality of sample data, the detection structure employing machine learning to screen locations in said sample to identify a feature and classify said feature; and
(ii) a software module automatically generating a report comprising said biological age of a sample from which said sample data was derived.
70. The system of claim 69, wherein the machine learning detection structure comprises a neural network.
71. The system of claim 70, wherein the neural network comprises a convolutional neural network.
72. The system of claim 71, wherein the convolutional neural network comprises a deep convolutional neural network.
73. The system of claim 72, wherein the deep convolutional neural network comprises a cascaded deep convolutional neural network.
74. The system of any one of claims 69 to 73, wherein said application runs in real- time or near-real time and generates a real-time or near real-time report comprising said biological age of said sample.
75. The system of any one of claims 69 to 74, wherein said plurality of sample data is obtained by imaging, morphological profiling, cell painting, mass spectrometry, antibody chips, 2-F Fluorescence Difference Gel Electrophoresis (DIGE), mass spectrometric immunoassay (MSIA), or laser capture microdissection (LCM).
76. The system of claim 75, wherein said plurality of sample data is obtained by imaging.
77. The system of any one of claims 69 to 76, wherein said application further comprises a software module performing image preprocessing comprising normalization of said plurality of said sample data.
78. The system of any one of claims 69 to 77, wherein said normalization comprises normalization of signal noise, sequencing reads, image channel balancing/combination, quality filtering, color balancing, color normalization, or a combination thereof.
79. The system of any one of claims 69 to 77, wherein said plurality of sample data comprises image data, and wherein said normalization comprises normalization of image format, image slice spacing, image intensity, image contrast, image saturation, image size, image orientation, or other image data properties of said image data.
80. The system of any one of claims 69 to 77, wherein said plurality of sample data is segmented into a plurality of 2D slices, and wherein said detection structure employs the convolutional neural network to screen locations in each of said plurality of 2D slices of said segmented sample data by a sliding window methodology to identify said feature and classify said feature.
81. The system of any one of claims 71 to 80, wherein said convolutional neural network has 2 to 64 convolutional layers and 1 to 8 fully connected layers.
82. The system of claim 80 or 81, wherein said sliding window comprises a window of less than about 4,000 pixels by less than about 4,000 pixels.
83. The system of claim 82, wherein said sliding window comprises a window of less than about 512 pixels by less than about 512 pixels.
84. The system of any one of claims 71 to 80, wherein said convolutional neural network comprises a neural network instance selected randomly from a plurality of neural network instances, and wherein said second convolutional neural network comprises a neural network instance selected randomly from a plurality of neural network instances.
85. The system of any one of claims 69 to 84, wherein said application further comprises a software module performing post-processing of a plurality of refined locations.
86. The system of claim 85, wherein said post-processing comprises characterizing centroid location, volume, shape, intensity, density, transparency, regularity, or a combination thereof.
87. The system of any one of claims 69 to 86, wherein said report comprises an informational overlay on said sample data.
88. The system of any one of claims 69 to 86, wherein said report comprises a sample data heat mapped to indicate confidence level.
89. The system of any one of claims 69 to 86, wherein said report comprises a time course generated by applying the application to medical images captured at two or more time points to measure progression of a disease or growth and movement of a tumor over time.
90. The system of any one of claims 69 to 89, wherein said machine learning detection structure is trained to identify critical clinical signs of a disease.
91. The system of any one of claims 69 to 89, wherein said machine learning detection structure is trained using sample data labeled by a human expert and subjected to preprocessing for normalization.
92. The system of any one of claims 69 to 91, wherein the biological age of the sample comprises a specific age of the sample.
93. The system of any one of claims 69 to 91, wherein the biological age of the sample comprises an age range of the sample.
94. The system of any one of claims 69 to 91, wherein the biological age of the sample comprises a relative age of the sample in comparison to an additional sample.
95. A non-transitory computer readable storage medium encoded with a computer program including instructions executable by a processor to create an application applying machine learning to a plurality of sample data to determine the biological age of a sample, the application comprising:
(a) a software module applying a machine learning detection structure to said plurality of sample data, the detection structure employing machine learning to screen locations in said plurality of sample data to identify a feature and classify said feature; and
(b) a software module automatically generating a report comprising said biological age of a sample from which said sample data was derived.
96. The non-transitory computer readable storage medium of claim 95, wherein the machine learning detection structure comprises a neural network.
97. The non-transitory computer readable storage medium of claim 96, wherein the neural network comprises a convolutional neural network.
98. The non-transitory computer readable storage medium of claim 97, wherein the convolutional neural network comprises a deep convolutional neural network.
99. The non-transitory computer readable storage medium of claim 98, wherein the deep convolutional neural network comprises a cascaded deep convolutional neural network.
100. A high-throughput method of screening a test compound to identify an anti-aging agent, the method comprising:
(a) contacting a biological sample with said test compound, thereby generating a treated sample;
(b) providing data of said treated sample to a biological age predictor;
(c) determining a biological age of said treated sample using a biological age predictor; and
(d) identifying said test compound as an anti-aging agent based at least in part on said determined biological age.
101. The method of claim 100, further comprising identifying said test compound as an anti-aging agent when said determined biological age is a relative reduction relative to a biological age of said biological sample of at least about 10%.
Priority Applications (1)
| Application Number | Priority Date | Filing Date | Title |
|---|---|---|---|
| EP19744297.3A EP3747013A4 (en) | 2018-01-23 | 2019-01-23 | Methods and systems for determining the biological age of samples |
Applications Claiming Priority (2)
| Application Number | Priority Date | Filing Date | Title |
|---|---|---|---|
| US201862621001P | 2018-01-23 | 2018-01-23 | |
| US62/621,001 | 2018-01-23 |
Publications (1)
| Publication Number | Publication Date |
|---|---|
| WO2019147725A1 true WO2019147725A1 (en) | 2019-08-01 |
Family
ID=67299560
Family Applications (1)
| Application Number | Title | Priority Date | Filing Date |
|---|---|---|---|
| PCT/US2019/014826 WO2019147725A1 (en) | 2018-01-23 | 2019-01-23 | Methods and systems for determining the biological age of samples |
Country Status (3)
| Country | Link |
|---|---|
| US (1) | US10886008B2 (en) |
| EP (1) | EP3747013A4 (en) |
| WO (1) | WO2019147725A1 (en) |
Cited By (2)
| Publication number | Priority date | Publication date | Assignee | Title |
|---|---|---|---|---|
| US11033516B1 (en) | 2020-09-18 | 2021-06-15 | Spring Discovery, Inc. | Combination therapies with disulfiram |
| WO2021138548A1 (en) * | 2020-01-02 | 2021-07-08 | Spring Discovery, Inc. | Methods, systems, and tools for longevity-related applications |
Families Citing this family (18)
| Publication number | Priority date | Publication date | Assignee | Title |
|---|---|---|---|---|
| CN111062952B (en) * | 2018-10-16 | 2022-09-30 | 腾讯科技(深圳)有限公司 | Lung image segmentation apparatus, method and storage medium |
| WO2021035097A1 (en) * | 2019-08-21 | 2021-02-25 | Fountain Therapeutics, Inc. | Cell age classification and drug screening |
| CN110974177B (en) * | 2019-12-23 | 2022-09-09 | 南昌五元生物科技有限公司 | Biological age calculation method and system based on telomere length |
| CN111178285A (en) * | 2019-12-31 | 2020-05-19 | 上海昌投网络科技有限公司 | Natural scene user head portrait age prediction method based on deep learning framework |
| AU2020421604A1 (en) * | 2020-01-06 | 2022-08-25 | PAIGE.AI, Inc. | Systems and methods for processing electronic images for computational assessment of disease |
| TWM600433U (en) * | 2020-02-12 | 2020-08-21 | 大江生醫股份有限公司 | Cell age detection system |
| US20230419480A1 (en) * | 2020-05-14 | 2023-12-28 | New York Stem Cell Foundation, Inc. | Method and system for predicting cellular aging |
| JP2021183994A (en) * | 2020-05-20 | 2021-12-02 | オリンパス株式会社 | Microscope system, control method, and program |
| JP2021183993A (en) | 2020-05-20 | 2021-12-02 | オリンパス株式会社 | Microscope system, control method, and program |
| CN112201310B (en) * | 2020-10-22 | 2022-01-28 | 华中科技大学 | Labeling method for C, H, O element in simulated coal and biomass co-pyrolysis system |
| CN112183677B (en) * | 2020-11-25 | 2021-02-23 | 湖北第二师范学院 | Mass spectrum imaging classification method based on multichannel convolutional neural network |
| WO2022120219A1 (en) * | 2020-12-04 | 2022-06-09 | Sanford Burnham Prebys Medical Discovery Institute | Microscopic imaging and analyses of epigenetic landscape |
| US11139064B1 (en) * | 2020-12-29 | 2021-10-05 | Kpn Innovations, Llc. | Systems and methods for generating a body degradation reduction program |
| CN112712900A (en) * | 2021-01-08 | 2021-04-27 | 昆山杜克大学 | Physiological age prediction model based on machine learning and establishment method thereof |
| CN112967780A (en) * | 2021-01-27 | 2021-06-15 | 安徽华米健康科技有限公司 | Physical ability age prediction method, device, equipment and storage medium based on PAI |
| EP4329592A1 (en) * | 2021-04-30 | 2024-03-06 | L'oreal | Predicting efficacies and improving skincare treatment outcomes based on responder/non-responder information |
| WO2023135650A1 (en) * | 2022-01-11 | 2023-07-20 | Heartseed株式会社 | Program, screening method, method for identifying optimum concentration, method for manufacturing drug, method for generating model, information processing method, and information processing apparatus |
| CN114903443B (en) * | 2022-07-15 | 2022-12-13 | 北京大学第三医院(北京大学第三临床医学院) | Method, system, device and storage medium for apparent biological analysis for characterizing aging |
Citations (6)
| Publication number | Priority date | Publication date | Assignee | Title |
|---|---|---|---|---|
| US20110196616A1 (en) * | 2009-12-02 | 2011-08-11 | Conopco, Inc., D/B/A Unilever | Apparatus for and method of measuring perceived age |
| WO2012164525A2 (en) * | 2011-06-01 | 2012-12-06 | Ecole Polytechnique Federale De Lausanne (Epfl) | Aging biomarkers |
| WO2014175542A1 (en) * | 2013-04-22 | 2014-10-30 | 주식회사 바이오에이지 | Bioage prediction apparatus and method |
| US20160292380A1 (en) * | 2013-11-22 | 2016-10-06 | Amorepacific Corporation | Device and method for predicting skin age by using quantifying means |
| WO2017049103A1 (en) * | 2015-09-17 | 2017-03-23 | Prodermiq, Inc. | Predicting skin age based on the analysis of skin flora and lifestyle data |
| US20170342496A1 (en) * | 2016-05-31 | 2017-11-30 | The Regents Of The University Of California | Methods for evaluating, monitoring, and modulating aging process |
Family Cites Families (3)
| Publication number | Priority date | Publication date | Assignee | Title |
|---|---|---|---|---|
| US6501982B1 (en) * | 1999-01-22 | 2002-12-31 | Sensys Medical, Inc. | System for the noninvasive estimation of relative age |
| US20050181354A1 (en) * | 2004-02-18 | 2005-08-18 | Estep Preston W.Iii | Methods of assaying physiological states |
| US10325673B2 (en) * | 2017-07-25 | 2019-06-18 | Insilico Medicine, Inc. | Deep transcriptomic markers of human biological aging and methods of determining a biological aging clock |
-
2019
- 2019-01-23 EP EP19744297.3A patent/EP3747013A4/en active Pending
- 2019-01-23 WO PCT/US2019/014826 patent/WO2019147725A1/en unknown
- 2019-01-23 US US16/255,366 patent/US10886008B2/en active Active
Patent Citations (6)
| Publication number | Priority date | Publication date | Assignee | Title |
|---|---|---|---|---|
| US20110196616A1 (en) * | 2009-12-02 | 2011-08-11 | Conopco, Inc., D/B/A Unilever | Apparatus for and method of measuring perceived age |
| WO2012164525A2 (en) * | 2011-06-01 | 2012-12-06 | Ecole Polytechnique Federale De Lausanne (Epfl) | Aging biomarkers |
| WO2014175542A1 (en) * | 2013-04-22 | 2014-10-30 | 주식회사 바이오에이지 | Bioage prediction apparatus and method |
| US20160292380A1 (en) * | 2013-11-22 | 2016-10-06 | Amorepacific Corporation | Device and method for predicting skin age by using quantifying means |
| WO2017049103A1 (en) * | 2015-09-17 | 2017-03-23 | Prodermiq, Inc. | Predicting skin age based on the analysis of skin flora and lifestyle data |
| US20170342496A1 (en) * | 2016-05-31 | 2017-11-30 | The Regents Of The University Of California | Methods for evaluating, monitoring, and modulating aging process |
Non-Patent Citations (1)
| Title |
|---|
| See also references of EP3747013A4 * |
Cited By (4)
| Publication number | Priority date | Publication date | Assignee | Title |
|---|---|---|---|---|
| WO2021138548A1 (en) * | 2020-01-02 | 2021-07-08 | Spring Discovery, Inc. | Methods, systems, and tools for longevity-related applications |
| US11033516B1 (en) | 2020-09-18 | 2021-06-15 | Spring Discovery, Inc. | Combination therapies with disulfiram |
| US11065214B1 (en) | 2020-09-18 | 2021-07-20 | Spring Discovery, Inc. | Combination therapies with disulfiram |
| US11612575B2 (en) | 2020-09-18 | 2023-03-28 | Spring Discovery, Inc. | Combination therapies with disulfiram |
Also Published As
| Publication number | Publication date |
|---|---|
| EP3747013A4 (en) | 2021-09-29 |
| EP3747013A1 (en) | 2020-12-09 |
| US10886008B2 (en) | 2021-01-05 |
| US20190228840A1 (en) | 2019-07-25 |
Similar Documents
| Publication | Publication Date | Title |
|---|---|---|
| US10886008B2 (en) | Methods and systems for determining the biological age of samples | |
| Carlson et al. | Phenotypic screening with human iPS cell–derived cardiomyocytes: HTS-compatible assays for interrogating cardiac hypertrophy | |
| McDonnell et al. | Mass spectrometry image correlation: quantifying colocalization | |
| Loo et al. | An approach for extensibly profiling the molecular states of cellular subpopulations | |
| Mund et al. | AI-driven Deep Visual Proteomics defines cell identity and heterogeneity | |
| JP6756339B2 (en) | Image processing device and image processing method | |
| Acar et al. | Coupled analysis of in vitro and histology tissue samples to quantify structure-function relationship | |
| Padmanabhan et al. | An active learning approach for rapid characterization of endothelial cells in human tumors | |
| Webster et al. | Quantifying histological features of cancer biospecimens for biobanking quality assurance using automated morphometric pattern recognition image analysis algorithms | |
| Ishikawa et al. | Morphology-based analysis of myoblasts for prediction of myotube formation | |
| Rozova et al. | Machine learning reveals mesenchymal breast carcinoma cell adaptation in response to matrix stiffness | |
| Woloshuk et al. | In situ classification of cell types in human kidney tissue using 3D nuclear staining | |
| Iuga et al. | Automated mapping and N-Staging of thoracic lymph nodes in contrast-enhanced CT scans of the chest using a fully convolutional neural network | |
| Rakha et al. | Digital technology in diagnostic breast pathology and immunohistochemistry | |
| Sauvat et al. | High-throughput label-free detection of DNA-to-RNA transcription inhibition using brightfield microscopy and deep neural networks | |
| Mosqueira et al. | High-throughput phenotyping toolkit for characterizing cellular models of hypertrophic cardiomyopathy in vitro | |
| Van Buren et al. | Artificial intelligence and deep learning to map immune cell types in inflamed human tissue | |
| WO2006031273A2 (en) | Cellular phenotype | |
| IL301425A (en) | Methods and systems for predicting neurodegenerative disease state | |
| Zhang et al. | Deep learning-based methods for classification of microsatellite instability in endometrial cancer from HE-stained pathological images | |
| Lloyd et al. | Image analysis in surgical pathology | |
| Mehta et al. | Cardiovascular Imaging Databases: Building Machine Learning Algorithms for Regenerative Medicine | |
| Schauer et al. | A novel organelle map framework for high-content cell morphology analysis in high throughput | |
| Natsume-Kitatani et al. | Data-driven patient stratification and drug target discovery by using medical information and serum proteome data of idiopathic pulmonary fibrosis patients | |
| US11978538B2 (en) | Systems and methods for associating compounds with properties using clique analysis of cell-based data |
Legal Events
| Date | Code | Title | Description |
|---|---|---|---|
| NENP | Non-entry into the national phase |
Ref country code: DE |
|
| ENP | Entry into the national phase |
Ref document number: 2019744297 Country of ref document: EP Effective date: 20200824 |