WO2018169486A1 - Optical imaging device and method for imaging - Google Patents
Optical imaging device and method for imaging Download PDFInfo
- Publication number
- WO2018169486A1 WO2018169486A1 PCT/SG2018/050061 SG2018050061W WO2018169486A1 WO 2018169486 A1 WO2018169486 A1 WO 2018169486A1 SG 2018050061 W SG2018050061 W SG 2018050061W WO 2018169486 A1 WO2018169486 A1 WO 2018169486A1
- Authority
- WO
- WIPO (PCT)
- Prior art keywords
- light
- sample
- light beams
- imaging device
- coherent light
- Prior art date
- Legal status (The legal status is an assumption and is not a legal conclusion. Google has not performed a legal analysis and makes no representation as to the accuracy of the status listed.)
- Ceased
Links
Classifications
-
- G—PHYSICS
- G02—OPTICS
- G02B—OPTICAL ELEMENTS, SYSTEMS OR APPARATUS
- G02B21/00—Microscopes
- G02B21/0004—Microscopes specially adapted for specific applications
- G02B21/002—Scanning microscopes
- G02B21/0024—Confocal scanning microscopes (CSOMs) or confocal "macroscopes"; Accessories which are not restricted to use with CSOMs, e.g. sample holders
- G02B21/0052—Optical details of the image generation
- G02B21/0056—Optical details of the image generation based on optical coherence, e.g. phase-contrast arrangements, interference arrangements
-
- G—PHYSICS
- G01—MEASURING; TESTING
- G01B—MEASURING LENGTH, THICKNESS OR SIMILAR LINEAR DIMENSIONS; MEASURING ANGLES; MEASURING AREAS; MEASURING IRREGULARITIES OF SURFACES OR CONTOURS
- G01B9/00—Measuring instruments characterised by the use of optical techniques
- G01B9/02—Interferometers
- G01B9/02015—Interferometers characterised by the beam path configuration
- G01B9/02027—Two or more interferometric channels or interferometers
- G01B9/02028—Two or more reference or object arms in one interferometer
-
- G—PHYSICS
- G01—MEASURING; TESTING
- G01B—MEASURING LENGTH, THICKNESS OR SIMILAR LINEAR DIMENSIONS; MEASURING ANGLES; MEASURING AREAS; MEASURING IRREGULARITIES OF SURFACES OR CONTOURS
- G01B9/00—Measuring instruments characterised by the use of optical techniques
- G01B9/02—Interferometers
- G01B9/02041—Interferometers characterised by particular imaging or detection techniques
- G01B9/02042—Confocal imaging
-
- G—PHYSICS
- G01—MEASURING; TESTING
- G01B—MEASURING LENGTH, THICKNESS OR SIMILAR LINEAR DIMENSIONS; MEASURING ANGLES; MEASURING AREAS; MEASURING IRREGULARITIES OF SURFACES OR CONTOURS
- G01B9/00—Measuring instruments characterised by the use of optical techniques
- G01B9/02—Interferometers
- G01B9/02055—Reduction or prevention of errors; Testing; Calibration
- G01B9/02075—Reduction or prevention of errors; Testing; Calibration of particular errors
-
- G—PHYSICS
- G01—MEASURING; TESTING
- G01B—MEASURING LENGTH, THICKNESS OR SIMILAR LINEAR DIMENSIONS; MEASURING ANGLES; MEASURING AREAS; MEASURING IRREGULARITIES OF SURFACES OR CONTOURS
- G01B9/00—Measuring instruments characterised by the use of optical techniques
- G01B9/02—Interferometers
- G01B9/02083—Interferometers characterised by particular signal processing and presentation
- G01B9/02087—Combining two or more images of the same region
-
- G—PHYSICS
- G01—MEASURING; TESTING
- G01B—MEASURING LENGTH, THICKNESS OR SIMILAR LINEAR DIMENSIONS; MEASURING ANGLES; MEASURING AREAS; MEASURING IRREGULARITIES OF SURFACES OR CONTOURS
- G01B9/00—Measuring instruments characterised by the use of optical techniques
- G01B9/02—Interferometers
- G01B9/0209—Low-coherence interferometers
- G01B9/02091—Tomographic interferometers, e.g. based on optical coherence
Definitions
- Various embodiments relate to an optical imaging device and a method for imaging.
- OCT Optical Coherence Tomography
- OCT is a non-invasive, non-ionizing interferometric laser scanning based imaging technique. Without requiring any exogenous contrast agents, OCT is able to provide cross-sectional images of biological tissues with micrometer-level spatial resolution and millimeter-level penetration depth. It has been widely applied in biomedical fields since it was first introduced for retinal imaging.
- OCT can be viewed as a combination of the low coherence interferometric technique and the Reflectance Confocal Microscopy.
- the working principle of OCT is based upon low coherence interferometry, wherein the refractive index difference profiles of the sample along the depth direction are recorded by the interferometric signals.
- OCT optics is identical to the reflectance confocal microscopy, in which confocal detection pinhole acquires a small volumetric signal of the sample by rejecting out-of-focus back-scattered light.
- Axial resolution and lateral resolution are two factors that determine the performances of an OCT system.
- the lateral resolution, ⁇ is regarded as the diffraction limited spot size of the focused beam, and is defined as the beam waist diameter with Gaussian input beam assumed.
- DOF depth-of-focus
- Excitation light in OCT systems is normally delivered by a sample arm fiber to the sample through a series of collimation, scanning and focusing optics, and this optical path is known as the illumination path.
- the fiber tip in the OCT sample arm serves physically as a confocal pinhole which creates a confocal volume in the sample space and rejects back-reflected and/or back-scattered photons from out of focus region(s).
- the light backreflected or backscattered from the confocal volume inside the sample goes through the same optical path length as the above-mentioned illumination path, and this path is known as the detection path.
- Light signal backreflected or backscattered from each confocal volume corresponds to an axial line (depth profile) in an OCT image.
- the lateral resolution is inversely proportional to the NA of the objective lens
- the depth-of-focus is proportional to the square of the lateral resolution. Consequently, a trade-off exists between the lateral resolution and the depth-of-focus: a higher lateral resolution results in a shorter depth-of-focus, and vice versa. Therefore, there is limitation on the depth-of-focus
- various approaches have been proposed in the past decade.
- Bessel beam suffers from signal loss and sidelobe artifacts, which is due to inherent spherical aberration and cannot be tolerated
- Phase or amplitude apodization suffers from significant signal loss and sidelobe artifacts due to destructive interference
- Adaptive optics needs indispensable phase stabilizing setup, while interferometric synthetic microscopy (ISAM) suffers from heavy computation cost extra phase stabilization setups
- SD refocusing approach has drawn great research interest since it requires minute hardware changes to known Fourier-domain (FD) OCT.
- Wavefront distortion is caused by heterogeneous refractive index distribution in the sample space or the optical aberrations of the imaging system. Wavefront distortion degrades the OCT transverse resolution. For example, when OCT uses human eye optics to focus the sample arm beam to the posterior segment of the eye, the transverse spot size is normally larger than 15 micrometers due to optical aberrations of the human cornea and lens. Improving the transverse resolution requires wavefront distortion corrections caused by human eye. Summary
- an optical imaging device may include an optics arrangement having a focusing optics, the optics arrangement configured to generate a plurality of coherent light beams incident on the focusing optics to be focused to a common focus point to illuminate a section of a sample, wherein the plurality of coherent light beams define respective discrete apertures at respective different positions on the focusing optics, and wherein the optics arrangement is further configured to receive, from the section of the sample, return lights for generation of at least one image representing the section of the sample.
- a method for imaging may include generating a plurality of coherent light beams incident on a focusing optics to be focused to a common focus point to illuminate a section of a sample, wherein the plurality of coherent light beams define respective discrete apertures at respective different positions on the focusing optics, and receiving, from the section of the sample, return lights for generation of at least one image representing the section of the sample.
- FIG. 1A shows a schematic view of an optical imaging device, according to various embodiments.
- FIG. IB shows a flow chart illustrating a method for imaging, according to various embodiments.
- FIGS. 2A and 2B show schematic views of an optical imaging device, according to various embodiments.
- FIG. 2C shows a schematic view of five apertures generated using the optical imaging device of FIGS. 2A and 2B
- FIG. 2D shows a schematic exploded view of the focusing beams of the five apertures of FIG. 2C
- FIG. 2E shows a schematic view illustrating the optical axes of the focusing beams of the five apertures of FIG. 2C.
- FIGS. 3A to 3C show schematic views of an optical imaging device, according to various embodiments.
- FIGS. 4A to 4C show schematic views of an optical imaging device, according to various embodiments.
- FIGS. 5A to 5D show schematic views of an optical imaging device, according to various embodiments.
- FIG. 6 shows a schematic view illustrating a defocused wavefront.
- FIG. 8 shows a schematic view of an optical imaging device, according to various embodiments.
- FIG. 9 shows flowcharts illustrating the procedures to generate multiple aperture interferometric refocusing in optical coherence tomography (MAIR OCT) images and known OCT images.
- MAIR OCT optical coherence tomography
- FIG. 10A shows a stepwise image sequence in linear scale: image (a) is the unprocessed image, image (b) is the dispersion-compensated image; images (c) and (d) are the resultant images in the first and second steps of multiple aperture interferometric refocusing, respectively. Images (a') - (d') show the enlarged views of two calibration beads indicated in images (a) - (d) respectively.
- FIG. 10B shows a plot of lateral full width at half maximum (FWHMs) of 50 calibration beads at variable depths.
- FIGS. 11A and 11B show, for B-scans of fresh grape samples, respectively the dispersion-compensated B-scan (intensity in logarithmic grayscale) captured from one of five apertures, and the digitally refocused B-scan via MAS (multiple aperture synthesis).
- FIG. 11C shows parts of the B-scan of FIG. 1 1A at the two indicated boxed areas, magnified by a factor of two, and the associated transverse profiles indicated by the dashed lines in FIG. 1 1C.
- FIG. 1 ID shows parts of the B-scan of FIG. 1 IB at the two indicated boxed areas, magnified by a factor of two, and the associated transverse profiles indicated by the dashed lines in FIG. 1 ID.
- FIG. HE shows a plot of image anisotropy ratio of the digitally refocused B-scan to the dispersion-compensated B-scan.
- FIGS. 12A and 12B show, for B-scans of rat adipocyte samples, respectively the dispersion-compensated B-scan (intensity in logarithmic grayscale) captured from one of five apertures, and the digitally refocused B-scan via MAS (multiple aperture synthesis).
- FIG. 12C shows parts of the B-scan of FIG. 12A at the two indicated boxed areas, magnified by a factor of four, and the associated transverse profiles indicated by the dashed lines in FIG. 12C.
- FIG. 12D shows parts of the B-scan of FIG. 12B at the two indicated boxed areas, magnified by a factor of four, and the associated transverse profiles indicated by the dashed lines in FIG. 12D.
- FIG. 12E shows a plot of image anisotropy ratio of the digitally refocused B-scan to the dispersion-compensated B-scan.
- FIG. 13 shows a schematic cross-sectional view of the phase differences between five adjacent frames with distinctive apertures as illustrated for a micro-cylindrical lens (MCL).
- MCL micro-cylindrical lens
- FIGS. 14A to 14D show schematic views of an optical imaging device, according to various embodiments.
- FIG. 15 shows the results of numerical simulation.
- FIGS. 16A to 16D show the results of numerical simulation. Detailed Description
- the phrase “at least substantially” may include “exactly” and a reasonable variance.
- phrase of the form of "at least one of A or B” may include A or B or both A and B.
- phrase of the form of "at least one of A or B or C", or including further listed items may include any and all combinations of one or more of the associated listed items.
- Various embodiments may provide one or more of the following : (i) multiple aperture scanning or synthesis for imaging; (ii) multiple aperture interferometric refocusing (MAIR) in optical coherence tomography (OCT); (iii) depth-of-focus (DOF) extension in optical coherence tomography via multiple aperture synthesis; (iv) multiple aperture synthesis (MAS) technique to achieve a digital refocusing function with minimal or without signal loss or sidelobe artifacts.
- MAIR multiple aperture interferometric refocusing
- OCT optical coherence tomography
- DOF depth-of-focus
- MAS multiple aperture synthesis
- Various embodiments may provide one or more optical designs or arrangements that may achieve fast or instantaneous multiple-aperture scanning in the illumination or detection path of an OCT system.
- Various embodiments may also provide a signal processing method to achieve coherent synthesis of interference signals acquired from multiple apertures.
- Various embodiments may provide one or more methods and/or apparatuses to implement multiple aperture interferometric refocusing in optical coherence tomography imaging systems to realize at least one of: depth-of-focus extension, lateral beam scanning, or wave-front distortion correction.
- Embodiments may provide one or more of the following over known methods, (i) Embodiments may be able to correct wavefront distortions including DOF caused by optical aberrations of the OCT system with minimal or without signal loss caused by numerical aperture mismatching in optical coupling, (ii) Embodiments may be able to correct wavefront distortions including DOF caused by optical aberrations of the OCT system with minimal or without the requirement of phase stability during data acquisition, (iii) Embodiments may be able to correct wavefront distortions including DOF caused by optical aberrations of the OCT system or the sample.
- MAIR OCT may enable us to visualize imperceptible changes with cellular and sub- cellular resolutions, and/or evaluate the cytological alteration of gastrointestinal tracts at an early stage by charactering one or more of the cell type, cellularity, cell polarity, cell viability and nucleus morphology.
- FIG. 1A shows a schematic cross-sectional view of an optical imaging device 100, according to various embodiments.
- the optical imaging device 100 includes an optics arrangement 102 including a focusing optics 104, the optics arrangement 102 configured to generate a plurality of coherent light beams (e.g., two coherent light beams are shown and represented as 106a, 106b) incident on the focusing optics 104 to be focused to a common focus point 108 to illuminate a section of a sample 110, wherein the plurality of coherent light beams 106a, 106b define respective discrete apertures (e.g., illustrated by 107a, 107b) at respective different positions on the focusing optics 104, and wherein the optics arrangement 102 is further configured to receive, from the section of the sample 110, return lights (e.g., represented by dashed arrows 112a, 1 12b) for generation of at least one image representing the section of the sample 110.
- return lights e.g., represented by dashed arrow
- an optical device 100 for imaging a sample 110 may be provided.
- the optical imaging device 100 may include an optics arrangement 102, meaning an arrangement of one or more optical elements or devices.
- the optics arrangement 102 may also include one or more non-optical elements.
- the optics arrangement 102 may include a focusing optics 104, for example, including a focus lens or an objective lens.
- the optics arrangement 102 may receive an input light, which may be a source light originating from a coherent light source, or light derived from the source light. From the input light received, the optics arrangement 102 may generate (or provide) a plurality of (parallel) coherent light (or optical) beams 106a, 106b.
- the plurality of coherent light beams 106a, 106b may be discrete light beams.
- the coherent light beams 106a, 106b may impinge on the focusing optics 104 where each light beam 106a, 106b defines an associated discrete (optical) aperture 107a, 107b at a corresponding position on the focusing optics 104.
- the respective discrete apertures 107a, 107b may be shifted from one another in the transverse (or lateral) direction of the focusing optics 104, e.g., in the direction at least substantially perpendicular to the optical axis of the focusing optics 104.
- the coherent light beams 106a, 106b may be shifted from relative to one another in the transverse (or lateral) direction. Adjacent respective discrete apertures 107a, 107b may overlap partially with one another or may be completely spaced apart from one another.
- apertures of the coherent light beams may refer to different light beams incident on different positions of the focusing optics 104.
- Light beams from physical apertures may be separated by the optical path difference (OPD), for example, in an OCT interferogram.
- OPD optical path difference
- the focusing optics 104 may receive the coherent light beams 106a, 106b, where the light beams 106a, 106b may be transmitted through the focusing optics 104.
- the coherent light beams 106a, 106b incident on the focusing optics 104 are focused by it to a single (or the same) focus point 108 to illuminate a sample 110 that is to be imaged.
- the coherent light beams 106a, 106b may be at least substantially parallel to each other to be focused by the focusing optics 104 to the common focus point 108. It should be appreciated that the focus point 108 may have a spatial extent.
- the coherent light beams 106a, 106b may be focused by the focusing optics 104 onto the section of the sample 110.
- This may mean that the focusing optics 104 may define a focal length that extends to the section of the sample 110, with the focus point 108 incident on the sample 110.
- the section of the sample 110 may be any location of the sample 110, including a surface thereof or an interior portion of the sample 110.
- the term "section" in relation to a sample may include a point on the sample.
- the optics arrangement 102 is further configured to receive, from the sample section that is illuminated, return lights 112a, 112b which may be used for generation (e.g., by a detector, e.g., an image detector) of at least one image that is representative of the section of the sample that is illuminated.
- a detector e.g., an image detector
- One image may be generated corresponding to one return light 112a, 112b.
- the return light 112a, 112b may be induced or generated from the section of the sample 110, resulting from the interaction between one of the coherent light beams 106a, 106b and the sample section. This may mean that each return light 112a, 112b may originate from the section of the sample 110 that is illuminated. Each return light 112a, 112b may include light reflected and/or backscattered from the sample section. It should be appreciated that each respective return light 112a, 112b may include information associated with or corresponding to the sample section.
- the return lights 112a, 112b may travel through or along substantially similar or identical optical paths as for the plurality of coherent light beams 106a, 106b, but in an opposite direction.
- the plurality of coherent light beams 106a, 106b may travel along illumination paths for illumination of the section of the sample 110, while the return lights 112a, 112b may travel along detection paths for generation of the at least one image.
- the illumination paths and the detection paths may correspond to each other except for the opposite directions of light propagation.
- the coherent light beams 106a, 106b may travel or propagate along respective different optical paths. As the plurality of coherent light beams 106a, 106b define respective discrete apertures at respective different positions on the focusing optics 104, the light beams 106a, 106b may, relative to each other, follow respective different path lengths to the common focus point 108.
- a respective light beam of the plurality of coherent light beams 106a, 106b may travel to the common focus point 108 through or along an optical path with an optical path difference as compared to another optical path travelled by another light beam of the coherent light beams 106a, 106b.
- the return lights 1 12a, 1 12b, in propagating along the optical paths of the plurality of coherent light beams 106a, 106b, may, relative to each other, travel or propagate through different optical path lengths.
- a return light (e.g., 1 12a or 112b) resulting from a respective light beam (e.g., 106a) illuminating the section of the sample 110 may return via the same optical path of the respective light beam (e.g., 106a), or via the optical path of another light beam (e.g., 106b).
- the respective return lights 112a, 1 12b, or the images resulting from the respective return lights 112a, 112b may be employed in a post-imaging process for correcting wave-front distortion, which may lead to a depth of focus (DOF) extension.
- DOE depth of focus
- the plurality of coherent light beams 106a, 106b may be generated from light provided by one (coherent) light source, or from a single light beam or radiation.
- any number of coherent light beams (and the number of associated apertures) of at least two may be provided, including three, four, five, or any higher number.
- the optical imaging device 100 may employ multiple aperture scanning (or synthesis), e.g., in the illumination and/or detection paths. Multiple apertures are employed to correct wave front distortion. For example, after digitally adjusting each phase term, images from multiple apertures may be combined to an optimal image.
- the optics arrangement 102 may further include an optical element arranged to receive an input light, and an actuator arranged to move (or drive) the optical element for generating the plurality of coherent light beams 106a, 106b from the input light.
- the optical element may be transmissive or reflective.
- the coherent light beams 106a, 106b may be generated at different times resulting from the movement of the movable optical element. This may mean that the light beams 106a, 106b may be separated in time.
- a respective light beam 106a or 106b may be generated to define a respective aperture 107a or 107b at the focusing optics 104 in response to a (single) movement as the movable optical element is relatively moved to a different orientation or position.
- the optical element may include at least one of a cylindrical lens (CL) having a curved face (e.g., a cylindrical surface) arranged to face the input light, or a mirror (e.g., a scanning mirror).
- the mirror may be movable in a rotational motion.
- the cylindrical lens may be used to tilt the input or incident light (e.g., outputted from a fiber) so that the beams 106a, 106b may be shifted in parallel prior to reaching the focusing optics 104.
- the cylindrical lens may be preferred as it is stable and flexible.
- the curved face of the cylindrical lens may be arranged as the input face or the input side of the cylindrical lens. This may mean that the cylindrical lens may have a curvature which the input light first encounters and enters the cylindrical lens. The cylindrical lens may then transmit the input light.
- the cylindrical lens may be movable in a linear motion, for example, in a direction along a plane perpendicular to the (optical axis of the) input light, e.g., in a lateral (or transverse) direction.
- the cylindrical lens may be driven by a linear actuator, e.g., a piezoelectric transducer (PZT) motor.
- PZT piezoelectric transducer
- the input light may encounter different parts of the curved face of the cylindrical lens to be refracted along different path lengths through the cylindrical lens, where each light refracted may define one of the plurality of coherent light beams 106a, 106b.
- the optics arrangement 102 may further include a beamsplitter (BS) configured to receive an input light and to split the input light to generate the plurality of coherent light beams 106a, 106b.
- the beamsplitter may include at least two (parallel) reflective surfaces for generating the plurality of coherent light beams 106a, 106b.
- the at least two reflective surfaces may be arranged angled or slanted to the (optical axis of the) input light.
- the reflective surfaces may be arranged on opposite sides of the beamsplitter, the reflective surfaces being arranged to face the input light.
- One of the reflective surfaces may have a higher reflectivity compared to another of the reflective surfaces.
- one reflective surface may be totally reflective (e.g., 100% reflectivity) and another of the reflective surfaces may be partially reflective (meaning that light may also be transmitted through this reflective surface).
- the reflective surfaces may be reflective films provided or coated on the beamsplitter.
- the optics arrangement 102 may further include a reflective optical element configured to receive an input light, the reflective optical element having at least two (parallel) reflective surfaces configured to reflect the input light to generate the plurality of coherent light beams.
- the reflective optical element may include or may be a mirror.
- the reflective surfaces may be arranged on opposite sides of the reflective optical element, the reflective surfaces being arranged to face the input light. Additionally or alternatively, the reflective surfaces may be arranged on one side of the reflective optical element, the reflective surfaces being arranged (completely) spaced apart from each other to face the input light.
- One of the reflective surfaces may have a higher reflectivity compared to another of the reflective surfaces.
- one reflective surfaces may be totally reflective (e.g., 100% reflectivity) and another of the reflective surfaces may be partially reflective (meaning that light may also be transmitted through this reflective surface).
- the reflective surfaces may be reflective films provided or coated on the reflective optical element.
- the optics arrangement 102 may further include a birefringent material (or element) configured to receive an input light and to generate, from the input light received, a plurality of polarized lights of different polarization directions (or orientations) as the plurality of coherent light beams 106a, 106b.
- the input light may be provided such that the optical axis of the input light may be at least substantially perpendicular to the input facet or face of the birefringent material (e.g., see FIG. 5 A), or the optical axis of the input light may be angled (e.g., at an acute angle) to the input facet or face of the birefringent material (e.g., see FIGS.
- the birefringent material may receive the input light (which may be unpolarized or may be polarized) and split the input light into two polarized light beams in the form of an ordinary ray (or beam) and an extraordinary ray (or beam) as the input light travels in or within the birefringent material.
- a polarized light of a polarization direction oriented along the fast axis of the birefringent material may define the ordinary ray (o-ray), while a polarized light of a polarization direction oriented along the slow axis of the birefringent material may define the extraordinary ray (e-ray).
- the birefringent material may include a uniaxial crystal, including but not limited to calcite (CaC0 3 ), Si0 2 (quartz), Ti0 2 (rutile) and YVO 4 (yttrium orthovanadate).
- the optics arrangement 102 may further include a half-wavelength plate at an output side of the birefringent material.
- the half-wavelength ( ⁇ /2) plate may be arranged to receive the plurality of polarized lights and to change an orientation of the polarization directions of the plurality of polarized lights. For example, after passing through the half- wavelength plate, the polarization directions of the plurality of polarized lights may be oriented or aligned to the optical axis of the half-wavelength plate.
- the optical axis of the half-wavelength plate may be arranged at about 45° with respect to the fast axis and the slow axis of the birefringent material.
- the focusing optics 104 may include a gradient index (GRIN) lens.
- the GRIN lens may be arranged at an output side of the birefringent material and the half-wavelength plate.
- At least one of the optical element e.g., cylindrical lens
- the beamsplitter, the reflective optical element, or the birefringent material may be positioned in a sample arm of the optics arrangement 102 or the optical imaging device 100.
- the optics arrangement 102 may be further configured, for each return light of the return lights 112a, 112b, to form an interference signal from the return light 112a, 112b and a reference light for generation of the at least one image representing the section of the sample 110.
- Each return light 112a, 112b and the reference light may interfere with each other or may be combined to form an interference signal or spectrum.
- the interference signal may be captured or detected by a detector.
- the optics arrangement 102 may further include a reference arm having a reference mirror (RM). Part of the input light may be directed to the reference mirror which may reflect it to generate the (return) reference light.
- the path lengths of the reference light and the respective return lights 112a, 112b originating from the section of the sample 110 may, relative to a common reference point, be at least substantially similar to one another. In other words, the path lengths between the sample and reference arms of the optics arrangement 102 may be at least substantially matched to each other.
- the optical imaging device 100 may further include a single (coherent) light source configured to supply an input light for generation of the plurality of coherent light beams 106a, 106b.
- a single (coherent) light source configured to supply an input light for generation of the plurality of coherent light beams 106a, 106b.
- any light source capable of providing a broadband spectrum ranging from about 600 nm to about 900 nm may be used.
- the optics arrangement 102 may further include a collimation lens configured to provide an input light in collimated form for generation of the plurality of coherent light beams 106a, 106b.
- the collimation lens may receive and collimate the input light to produce a collimated light.
- the collimation lens may be arranged at an output side of the optical element (e.g., cylindrical lens, mirror) described above.
- the collimation lens may be arranged at an input side of any one of the following as described above: the beamsplitter, the reflective optical element, or the birefringent material.
- the focusing optics 104 may be arranged at an output side of any one of the following as described above: the optical element (e.g., cylindrical lens, mirror), the beamsplitter, the reflective optical element, or the birefringent material.
- the optical element e.g., cylindrical lens, mirror
- the beamsplitter e.g., the beamsplitter
- the reflective optical element e.g., the reflective optical element
- birefringent material e.g., birefringent material
- the optics arrangement 102 may receive an input light, either in the form originating from the light source (whether directly from the light source or after having passed through one or more optical elements, e.g., an optical fiber, a shaping optics to shape the light, etc.), or in the form of a collimated beam as generated by the collimation lens described above.
- an optical element e.g., an optical fiber, a shaping optics to shape the light, etc.
- the optical imaging device 100 may further include a detector (e.g., an image detector) for generating the at least one image representing the section of the sample 1 10.
- the detector may receive the respective return lights 112a, 1 12b to generate the at least one image (for a non-interferometric imaging device) or the interference signal to generate the at least one image (for an interferometric imaging device, for example, for optical coherence tomography (OCT) applications).
- the detector may include a spectrometer, which may include at least one of a diffraction grating, a camera lens or a (single-line) CCD (charge-coupled device) camera.
- the optical imaging device 100 as described may be used for non-interferometric imaging.
- the optical imaging device 100 may not include a reference path or arm.
- the optical imaging device 100 may be used as a non-interferometric imaging device in circumstances where the image of or from each aperture 107a, 107b may be apart from each other in space and/or in time. Nevertheless, the optical imaging device 100 may also be used for interferometric imaging, to form one or more interference signals from the return light(s) and a reference light from a reference path or arm.
- the optical imaging device 100 may provide multiple aperture interferometric refocusing (MAIR), e.g., in OCT.
- MAIR multiple aperture interferometric refocusing
- the optical imaging device 100 may enable depth of focus (DOF) extension.
- DOE depth of focus
- the axial direction may mean the direction along the optical axis of a light beam, while a direction along a plane perpendicular to the axial direction may refer to the lateral direction or the transverse direction, where the lateral direction and the transverse direction may refer to the same direction.
- lateral and transverse may be interchangeably used.
- lateral shifting and “transverse shifting” may be interchangeably used.
- the optics arrangement may include a focusing optics, wherein the optics arrangement may be configured to generate (or provide) (e.g., from an input light received by the optics arrangement) a plurality of (parallel) coherent light beams incident on the focusing optics to be focused to a common (single) focus point to illuminate a section of a sample, wherein the plurality of coherent light beams may define respective discrete apertures at respective different positions on the focusing optics, and wherein the optics arrangement may be further configured to receive respective return lights from the section of the sample.
- the respective return lights may travel or propagate along the optical paths of the plurality of coherent light beams.
- the return lights may be employed for generation of at least one image representing the section of the sample.
- the optics arrangement may be used in or as part of an optical imaging device (e.g., 100, FIG. 1A).
- FIG. IB shows a flow chart 120 illustrating a method for imaging, according to various embodiments.
- a plurality of coherent light beams are generated (e.g., from an input light) and are incident on a focusing optics to be focused to a common focus point to illuminate a section of a sample, wherein the plurality of coherent light beams define respective discrete apertures at respective different positions on the focusing optics.
- return lights, from the section of the sample are received for generation of at least one image representing the section of the sample.
- an input light may be supplied to an optical element, and the optical element may be moved for generating the plurality of coherent light beams from the input light.
- an input light may be split by a beamsplitter to generate the plurality of coherent light beams.
- an input light may be reflected by at least two reflective surfaces to generate the plurality of coherent light beams.
- an input light may be transmitted through a birefnngent material to generate a plurality of polarized lights of different polarization directions as the plurality of coherent light beams.
- the method may further include changing an orientation of the polarization directions of the plurality of polarized lights.
- the plurality of coherent light beams may be generated from an input light provided in collimated form.
- the method may further include, for each return light of the return lights, forming an interference signal from the return light and a reference light for generation of the at least one image representing the section of the sample.
- the method may further include generating the at least one image representing the section of the sample, e.g., using the respective return lights themselves or the interference signals from the respective return lights and the reference light, depending on the mode or type of imaging.
- optical imaging device 100 may correspondingly be applicable in relation to the method for imaging described in the context of the flow chart 120.
- the working principles of multiple aperture synthesis (MAS) or multiple aperture interferometric refocusing (MAIR) arrangement of various embodiments will now be described in details by way of the following non-limiting examples.
- the MAS technique may extend the DOF in a spectral domain OCT (SD-OCT), which is analogous to synthetic aperture radar (SAR).
- SD-OCT spectral domain OCT
- SAR synthetic aperture radar
- FIGS. 2A and 2B show schematic views of an optical imaging device 200, according to various embodiments.
- the optical imaging device 200 may include a (micro)cylindrical lens (CL) 230 that may receive an input light propagated through a single mode fiber (SMF) 232. SMF 232 may act as a fiber pinhole.
- CL single mode fiber
- SMF single mode fiber
- L2 focusing optics
- the focusing lens 204 focuses the collimated beam to a focus point 208 on a sample 210. Return lights from the sample 210 may then travel towards L2 204 for collection and detection for generation of images.
- FIG. 2A shows the operation of the optical imaging device 200 where the input light or optical beam (e.g., a Gaussian beam) is centered (e.g., at CL 230) (or, in other words, CL 230 is centered at the fiber pinhole), while FIG. 2B shows the operation of the optical imaging device 200 where the input light or optical beam (e.g., a Gaussian beam) is laterally steered by shifting of the CL 230 (e.g., CL 230 is laterally (or transversely) shifted by a step size of AL.).
- the input light or optical beam e.g., a Gaussian beam
- FIG. 2B shows the operation of the optical imaging device 200 where the input light or optical beam (e.g., a Gaussian beam) is laterally steered by shifting of the CL 230 (e.g., CL 230 is laterally (or transversely) shifted by a step size of AL.).
- the CL 230 may be steered bi-directionally laterally relative to the SMF 232. As shown in FIGS. 2A and 2B, a plurality of coherent light beams 206a, 206b may be generated, with the associated apertures (represented as white dashed lines 207a, 207b) on L2 204. The corresponding local wavefront (LWF) 236a, 236b are illustrated in FIGS. 2A and 2B. Additional coherent light beam(s), with the corresponding aperture(s), may be generated by moving the CL 230 laterally to different positions.
- LWF local wavefront
- FIGS. 2A and 2B illustrate the optical design to achieve far- field fast multiple-aperture scanning by use of near-field beam steering.
- it may be used in either illumination or detection path of the sample arm in an Optical Coherence Tomography (OCT) system.
- OCT Optical Coherence Tomography
- near-field refers to the light field near the single mode fiber (SMF) core (i.e., SMF 232)
- far- field refers to the light field between LI 234 and L2 204 that is collimated by LI 234.
- the near-field beam steering element (the cylindrical lens 230) may be positioned at the tip of the sample fiber (SMF core) 232 (e.g., approximately 10 ⁇ m away from the tip) with an axisymmetric configuration along the optical axis, with the curved face of the CL 230 facing the fiber 232.
- the curvature radius of the cylindrical surface is much larger than the mode field diameter of the SMF 232 such that the cylindrical surface may be equivalent to a flat surface in the near-field.
- the cylindrical lens 230 may be driven by a (linear) actuator 231 (shown in FIG.
- the sample beam to illuminate the sample 210 may be steered by the changing curvature of the cylindrical lens surface according to the law of refraction (see FIG. 2B).
- the beam steering in the near field may introduce parallel shift to the collimated beam 206a, 206b in the far-field.
- Such an effect may be equivalent to scanning the collimated beam 206a, 206b across multiple apertures 207a, 207b in the pupil plane of the objective lens (L2) 204.
- the corresponding far field beam orientation may be parallel to the optical axis of the SMF output. Therefore, light beams of all the near field angles may intersect at the focal point 208 of the objective lens 204 with a constant phase.
- All light paths of the spatial (angular) frequencies originating from the fiber pinhole may be refracted sequentially by CL 230, LI 234, and L2 204, and they intersect at the focal point 208 of L2 204 with a substantially uniform phase or optical path length. Under such a condition, a maximal constructive interference may occur at this focal point 208, which may result in a diffraction-limited transverse point spread function (PSF).
- PSF transverse point spread function
- the spatial or angular frequency of the sample beam with respect to the full aperture of the focusing lens L2 204 may be swept as the incidence angle at the curved surface of CL 230 changes.
- the aberration caused by the cylindrical lens 23 may not be noticeable and the resolution in the x and y transverse dimensions may be the same.
- FIG. 2C shows, as a non-limiting example, five apertures generated by the optical imaging device 200, illustrating the effective optical apertures in or at the pupil plane (or focal plane) of the objective lens (L2) 204.
- the five apertures may be generated by lateral shifting (or transverse shifting) of CL 230, and are labelled “1" - "5" (the respective apertures are traced by dashed white circles in FIG. 2C).
- the term “AL” refers to the lateral shifting step size of the cylindrical lens 230.
- FIG. 2D shows a schematic view of the focusing beams corresponding to the five apertures "1" - "5", illustrating the spatial or angular frequency of the focused beams.
- an axial-line (A-line) may be acquired at each of the five equally spaced spatial frequencies and the five apertures may be synthesised together as shown in FIG. 2E.
- the term "LF” refers to low spatial frequency
- the term "HF” refers to high spatial frequency.
- more high spatial frequency light signals of the sample reflectivity may be coherently synthesized, which may generate a larger aperture and an extended DOF.
- OPD optical path difference
- a spectrometer exposure may be executed to acquire one A-line (axial line) for each beam steering position.
- the number of beam steering positions within each beam steering cycle may be configured, e.g., 5 positions in a cycle. Therefore, 5 A-lines may be obtained, with distinctive apertures at the pupil plane of the objective lens 204.
- OCT interference signals from the focal point 208 acquired at different near field beam steering angles may add up constructively, whereas signals arising from a sample point other than the focal point 208 of the objective lens 204 may add up destructively.
- the effective detection numerical aperture (NA) which corresponds to the multiple apertures 207a, 207b at the pupil plane of the objective lens (L2) 204, may be augmented by summing up those interference signals acquired at multiple steering angles.
- the lateral resolution may also be improved since the effective numerical aperture may be improved.
- OCT interference signals from a particular defocused sample point acquired through multiple distinct apertures 207a, 207b may be summed up constructively. That is how this system may digitally correct the wavefront distortion and obtain a brand-new image with nearly constant lateral resolution over an extended depth-of-focus (DOF).
- Defocus-induced wavefront distortion may mean wavefront distortion caused by the defocus effect (see FIG. 6).
- signals from a defocused sample point may refer to interested (or desired) signals from the sample above and/or below the focal plane.
- a closed-loop PZT with four embedded strain gauges and a travel range of about 15.7 m ⁇ may be used for the actuator 231.
- the desired radius of CL 230 may be about 60 - 70 ⁇ m, which is based on the travel range of the PZT 231 and the fiber NA. CL 230 may be precisely grinded from a coreless silica termination fiber.
- the cross sectional width of CL 230 may be about 1 10 ⁇ m.
- the PZT 231 may be mounted on a two-axis goniometer and a three- axis compact stage.
- FIGS. 3A to 3C show schematic views of an optical imaging device 300 and its related operations, according to various embodiments.
- the optical imaging device 300 may include a collimation lens (LI) 334 that may receive an input light propagated through a single mode fiber (SMF) 332 so as to output a collimated beam.
- a reflective optical element may be provided, e.g., a coated mirror (CM) 338, which is a custom-built mirror with reflective films 340a, 340b coated on the front and back surfaces.
- the CM 338 may reflect the collimated beam via the reflective films 340a, 340b to generate a plurality of coherent light beams or optical beams (representatively illustrated with the double-headed arrows 306a, 306b).
- the generation of the light beams 306a, 306b from the input light is traced by white arrows illustrated in FIG. 3A.
- the input light (traced by a white solid arrow) is reflected by the coated mirror 338 to generate a first coherent light beam 306a (traced by white dashed arrows) and a second coherent light beam 306b (traced by white dotted arrows) towards a sample 310.
- the parameter, ⁇ d is the transverse distance between the adjacent illumination beams 306a, 306b.
- the coherent light beams 306a, 306b may be directed to a focusing optics, e.g., a focusing lens or objective lens (L2) 304, which define the corresponding (optical) apertures Al, A2 (represented by the boxes 307a, 307b) on L2 304 generated by the CM 338 (see also FIG. 3B showing a front view of L2 304).
- L2 304 may then focus the beams 306a, 306b to a focus point 308 on the sample 310.
- Return lights from the sample 310 may then travel towards L2 304 for collection and detection for generation of images, for example through apertures Al 307a and/or A2 307b.
- apertures Al 307a and/or A2 307b may act as illumination apertures and detection apertures of the two optical beams 306a, 306b and the return lights.
- FIGS. 3A to 3C illustrate the principle of Fourier multiple aperture synthesis (FMAS) based on the use of a mirror, providing an optical design to achieve FMAS.
- a custom-built coated mirror (CM) 338 may be employed, for example, placed into the sample arm of an interferometric imaging device (e.g., for OCT).
- the front surface of the CM 338 may be coated with a 40% reflective film 340a (i.e., light may be transmitted through), and the back surface may be coated with a 100% reflective film 340b.
- Multiple reflections on the front and back surfaces of the CM 338 may produce two illumination beams 306a, 306b as shown in FIG. 3A.
- the ratio of intensity between the apertures A1:A2 is about 40%:36%. All higher-order illumination beams are not considered, because they are relatively weaker and only contain about 24% intensity. As illustrated in FIG. 3B, the beams 306a, 306b define the two distinctive apertures Al 307a, A2 307b in the objective lens (L2) pupil plane.
- the light back-reflected or back-scattered by the sample 310 may be divided into four parts by the illumination apertures and detection apertures, respectively.
- FIG. 3C shows the four possible round-trip light paths based on the illumination apertures and detection apertures (Al 307a, A2 307b). The four round-trip light paths are as follows:
- optical path difference between two adjacent beams (e.g., 306a, 306b) may be denoted as which is about 1.334 mm. If the small extra OPD
- ⁇ z ⁇ zCM + ⁇ zW D -
- B-scan cross-sectional scan
- FIGS. 4A to 4C show schematic views of an optical imaging device 400 and its related operations, according to various embodiments.
- the optical imaging device 400 may include a collimation lens (LI) 434 that may receive an input light propagated through a single mode fiber (SMF) 432 so as to output a colhmated beam.
- a beamsplitter (BS) 438 may be provided in the optical path of the collimated beam.
- the BS 438 may have reflective films 440a, 440b coated respectively on the first and second surfaces, SI and S2.
- the BS 438 may split the collimated beam to generate a plurality of coherent light beams or optical beams (representatively illustrated with the double- headed arrows 406a, 406b).
- the generation of the light beams 406a, 406b from the input light is traced by white arrows illustrated in FIG. 4A.
- the input light (traced by a white solid arrow) may be reflected by the reflective films 440a, 440b so that the input light is split to generate a first coherent light beam 406a (traced by a white dashed arrow) and a second coherent light beam 406b (traced by white dotted arrows) towards a sample 410.
- the parameter, Ad is the transverse distance between the adjacent illumination beams 406a, 406b.
- the coherent light beams 406a, 406b may be directed to a focusing optics, e.g., a focusing lens or objective lens (L2) 404, which define the corresponding (optical) apertures Al, A2 (represented by the boxes 407a, 407b) on L2 404 generated by the BS 438 (see also FIG. 4B showing a front view of L2 404).
- L2 404 may then focus the beams 406a, 406b to a focus point 408 on the sample 410.
- Return lights from the sample 410 may then travel towards L2 404 for collection and detection for generation of images, for example through apertures Al 407a and/or A2 407b.
- apertures Al 407a and/or A2 407b may act as illumination apertures and detection apertures of the two optical beams 406a, 406b and the return lights.
- FIGS. 4A to 4C illustrate the principle of Fourier multiple aperture synthesis (FMAS) based on the use of a beamsplitter, providing an optical design to achieve FMAS.
- a beam splitter (BS) 438 may be employed, for example, placed into the sample arm of an interferometric imaging device (e.g., for OCT).
- the BS 438 is a custom-built cube of which the first surface, SI, may be coated with a 50% reflective film 440a (i.e., light may be transmitted through), and the second surface, S2, may be coated with a 100% reflective film 440b.
- Multiple reflections on the first and second surfaces, SI and S2, of the BS 438 may produce two illumination beams 406a, 406b as shown in FIG. 4A.
- the ratio of intensity of the two illumination beams 406a, 406b is about 50%:50%.
- the beams 406a, 406b define the two distinctive apertures Al 407a, A2 407b in the objective lens (L2) pupil plane.
- the light back-reflected or back-scattered by the sample 410 may be divided into four parts by the illumination apertures and detection apertures, respectively.
- FIG. 4C shows the four possible round-trip light paths based on the illumination apertures and detection apertures (Al 407a, A2 407b). The four round-trip light paths are as follows:
- the round trip light path where the illumination light 406a travels via the illumination aperture Al 407a towards the sample 410 and the return light returns (scattered) along the same illumination aperture Al 407a (or detection aperture for the return light) but in the opposite direction away from the sample 410 is called the A1A1- path.
- the round trip light path where the illumination light 406b travels via the illumination aperture A2 407b towards the sample 410 and the return light returns (scattered) along the same illumination aperture A2 407b (or detection aperture for the return light) but in the opposite direction away from the sample 410 is called the A2A2- path.
- the transverse distance between two adjacent beams may be defined as ⁇ dss-
- OPDs including 0, ⁇ z and 2 ⁇ z, and three sub-images may equally align along the depth dimension in one B-scan.
- FIGS. 5A to 5D show schematic views of an optical imaging device 500 and its related operations, according to various embodiments.
- the optical imaging device 500 may include a collimation lens (LI) 534 that may receive an input light propagated through a single mode fiber (SMF) 532 so as to output a collimated beam.
- a birefringent material for example a calcite spacer (CS) 538, may be provided in the optical path of the collimated beam.
- the CS 538 may split the collimated beam to generate a plurality of coherent light beams or optical beams (representatively illustrated with the double - headed arrows 506a, 506b).
- the generation of the light beams 506a, 506b from the input light is traced by white arrows illustrated in FIG. 5A.
- the input light (traced by a white solid arrow) may be refracted by the CS 538, where different components of the input light may travel along different optical paths so as to generate a first coherent light beam 506a (traced by white dashed arrows), in the form of an extraordinary ray, and a second coherent light beam 506b (traced by a white dotted arrow), in the form of an ordinary ray, towards a sample 510. See also FIG.
- FIG. 5B shows a cross-sectional view of the calcite spacer 538 illustrating the fast axis and slow axis of the calcite spacer 538 and the optical axis (OA) of the calcite spacer (CS) 538.
- the coherent light beams or rays 506a, 506b may be directed to a focusing optics, e.g., a focusing lens or objective lens (L2) 504, which define the corresponding (optical) apertures Al , A2 (represented by the boxes 507a, 507b) on L2 504 (see also FIG. 5C showing a front view of L2 504).
- L2 504 may then focus the beams 506a, 506b to a focus point 508 on the sample 510.
- Return lights from the sample 510 may then travel towards L2 504 for collection and detection for generation of images, for example through apertures Al 507a and/or A2 507b.
- apertures Al 507a and/or A2 507b may act as illumination apertures and detection apertures of the two optical beams 506a, 506b and the return lights.
- FIG. 5A the apertures 507a, 507b are shown shifted out of plane relative to each other for clarity and ease of understanding purposes to illustrate the extent of the distinct, but partially overlapping, apertures 507a, 507b.
- the notation "o” refers to the ordinary ray ("o- ray") 506b while the notation “e” refers to the extraordinary ray ("e-ray”) 506a.
- the notation “PS” refers to principle section.
- the notation “OA” refers to the optical axis of the calcite spacer 538 in the plane of the paper.
- the notation “FA” refers to the fast axis of the calcite spacer 538.
- the parameter, d is the physical length of the calcite spacer 538.
- the parameter, Ad is the transverse distance that the o-ray 506b and the e-my 506a are separated.
- the parameter, is the angle that the o-ray 506b and the e-ray 506a are separated in the CS 538.
- the parameter, ⁇ is the angle between the optical axis of the collimated light (o-ray 506b) and the optical axis (OA) of the CS 538.
- the parameter, ⁇ is the angle between the e-ray 506a and the optical axis (OA) of the CS 538.
- FIGS. 5A to 5D illustrate the principle of Fourier multiple aperture synthesis (FMAS) based on the use of a birefringent material.
- a birefringent calcite (or calcite spacer) 538 may be employed, for example, placed into the sample arm of an interferometric imaging device (e.g., for OCT).
- the fast axis (FA) of the calcite spacer 538 is parallel to the interface plane 542 between air and the calcite spacer 538.
- the light output from the single mode fiber (SMF) 532 undergoes refraction at the interface plane 542.
- the part or portion of the light from the SMF 532 with the polarization direction along the fast axis of the CS 538 may travel in the CS 538 as the o- ray") 506b; the rest of the SMF light with the polarization direction perpendicular to the fast axis of the CS 538 may travel in the CS 538 as the e-ray 506a.
- the e-ray 506a and the o-ray 506b are separated by ⁇ in the CS 538 and Ad in the direction parallel to the slow axis.
- the apertures 507a, 507b occupied by the e-ray 506a and the o-ray 506b may be different, forming two distinct apertures.
- the optical axis of the collimated light 506a, 506b may be angled with respect to the optical axis of the CS 538.
- the refractive index, n, of the CS 538 is about 1.6474 and 1.4813 respectively for the o-ray 506b and the e-ray 506a at 850 nm.
- a polarization analyzer (not shown), e.g., a half wavelength plate, may be placed at the output side of the CS 538.
- the optical axis of the polarization analyzer may be at about 45° with respect to the fast and slow axis of the CS 538. Both the o-ray 506b and the e-ray 506a may travel through the polarization analyzer after passing through the calcite spacer 538.
- the analyzer may rotate the polarization direction of the o-ray 506b and the e-ray 506a by 45° in the illumination paths of the the o-ray 506b and the e-ray 506a, so that after passing through the polarization analyzer, the polarization directions of both the o-ray 506b and the e-ray 506a may be the same as the optical axis of the polarization analyzer.
- the illumination light including the the o-ray 506b and the e-ray 506a, may be back-reflected or back-scattered by the sample (e.g., tissue) 510.
- the sample e.g., tissue
- the light back-reflected or back-scattered by the sample 510 may be divided into four parts by the illumination paths (o-ray 506b and e-ray 506a) and detection paths (o-ray 506b and e-ray 506a), respectively.
- the four possible round-trip light paths based on the illumination apertures and detection apertures are as follows:
- the single-trip optical path difference (OPD) between the o-ray 506b and the e- ray 506a may be defined as ⁇ z. So, the round-trip optical path length (OPL) of the ee- light is 2 ⁇ z longer than that of the oo-light, and the round-trip OPL of the oe-light and the eo-light is ⁇ z longer than that of the oo-light.
- OPDs There may be three kinds of OPDs, including 0, ⁇ z and 2 ⁇ z, and three sub-images may equally align along the depth dimension in one cross-sectional scan (B-scan).
- ⁇ z w is caused by the difference between the two local wavefronts (LWFs) corresponding to the two distinctive apertures 507a, 507b occupied by the e-ray 506a and the o-ray 506b, respectively
- d is the physical length of the CS 538
- n a and n e are the respective refractive index of the CS 538 for the o-ray 506b and the e-ray 506a
- n a is the refractive index of air
- Ad is the transverse distance that the o-ray 506b and the e-ray 506a are separated, which may be given by
- ⁇ may be set optimally to 45° or another acute angle.
- the detected interference signal, I(k z ), in k z - space including a direct-current (DC) term, a cross-correlation (CC) term, and an auto- correlation (AC) term, may be represented by the following simplified formulation: where is the CC term, S(k z ) is the spectral distribution of the light source, and F(k z ) and F(k z ) are the respective electric field reflectivity from the reference arm and the sample arm at the depth of z.
- the DC term is a pathlength- independent bias, and its amplitude is proportional to the sum of the power from the reference and sample arms.
- the AC term is generally composed of the interference signals between different sample tissue depths, and may serve as artifacts in OCT images.
- a theoretical model for Fourier multiple aperture synthesis may be formulated following the classical optics. Based on the physical basis of Fourier-domain OCT, the OT-th depth-encoded signal in FMAS may be expressed as
- DC m and AC m may be omitted for the sake that only the complex field amplitude, is considered in the next step,
- A-scan axial depth scan
- B-scan cross-sectional x— z image
- an in-focus image of the B-scan image may be computationally reconstructed following the recovery procedure as described below.
- Step 1 Step 1 :
- the propagation factor is where n o is the refractive index of the sample and k x is the spatial frequency in x-dimension.
- Equation (5) may be used for the image:
- the accurate phase oscillation term may be refined coherently summing m
- Equation (5) may be rewritten as
- the digitally synthesied image not only refocuses the defocused sample and preserve the diffraction-limited transverse resolution over a multiple-time extended DOF, but also increases the total backscattered intensity.
- MAS may achieve optimal constructive interference at the center of the scatter and destructive interference away from the center, which not only may increase the total backscattered intensity but may also preserve the diffraction-limited transverse resolution over a DOF extended multiple times.
- CTF coherence transfer function
- PSF effective point spread function
- PF pupil function
- ⁇ represents the wavelength of the illumination light.
- the PSFs are the Fourier transform of the CTFs in two transverse directions and may be calculated as
- x and y denote the variables on the plane perpendicular to the optical axis and z is the axial variable.
- FIGS. 15, and 16A to 16D show the results of the numerical simulations. In FIG.
- images (a) - (c) respectively show the PFs of a full aperture, an annular apodized aperture and an MAS
- images (d) - (f) respectively show the two-dimensional (2D) coherent transfer functions (CTFs) of a full aperture, an annular apodized aperture, and an MAS in the focal plane as a function over the transverse (m and n) spatial frequencies
- images (g) - (i) respectively show the 2D CTFs of a full aperture, an annular apodized aperture, and an MAS as a function over the transverse spatial frequency (m) and axial (z) dimensions
- images (j) - (1) respectively show the 2D PSFs of a full aperture, an apodization, and an MAS as a function over the transverse (x) and axial (z) dimensions.
- the intensities in FIGS. 15, and 16A to 16D are normalized by their maximum values.
- the radius of the full aperture was defined as 1 (Image (a), FIG. 15) and the radius of the annularly apodized aperture was defined as 0.7 (Image (b), FIG. 15).
- the CTFs (FIG. 15, images (d) - (f)) corresponding to the full aperture, annular apodized aperture, and MAS (FIG. 15, images (a) - (c)) were obtained by convolving the PFs of the illumination and detection aperture.
- the 2D CTFs (FIG.
- images (d) - (f)) show that although the annular apodized aperture produces the largest frequency range, the cutoff spatial frequency of the MAS and full aperture is much greater than that of the apodization.
- the apodized aperture produces the largest DOF but the worst sidelobes (-17.5 dB; FIG.
- FIG. 8 shows a schematic view of an optical imaging device 850, according to various embodiments.
- the optical imaging device 850 may be an optical coherence tomography (OCT) device or system (e.g., SD-OCT (spectral domain optical coherence tomography)).
- OCT optical coherence tomography
- SD-OCT spectral domain optical coherence tomography
- the optical imaging device 850 may include a light source 852, for example, a superluminescent diode (SLD) array capable of providing a broadband spectrum ranging from about 600 nm to about 900 nm.
- the SLD light source 852 may provide a full width at half maximum (FWHM) bandwidth of about 165 nm centered at about 850 nm.
- Light from the SLD 852 (whose total output power may be about 18.0 mW) may be split by a wideband fiber-optic coupler, e.g., a 2x2 (e.g., 90: 10) wavelength-flattened fiber-optic coupler (OCl) 854.
- a wideband fiber-optic coupler e.g., a 2x2 (e.g., 90: 10) wavelength-flattened fiber-optic coupler (OCl) 854.
- Light from the SLD 852 may be split by OCl 854 into a sample light beam and a reference light beam with a splitting ratio of 90: 10.
- the sample light beam may be provided into a sample arm 856a via a polarization controller element (PC2) 858a
- the reference light beam may be provided into a reference arm 856b via a polarization controller element (PCI) 858b.
- PCI 858b and PC2 858a may be optional.
- the light beam may be collimated by a (collimating) lens (LI) 860 to transmit through a neutral density filter (NDF) 861, and then focused by a (focusing) lens (L2) 862 onto a reference mirror (RM) 863. Light may then be reflected by the RM 863 towards the OCl 854. The reflected light may define a reference light for interference. L2 862 and RM 863 may be moved, either individually or together, to match the path length between the sample arm 856a and the reference arm 856b.
- LI in the reference arm 856b
- L2 862 and RM 863 may be moved, either individually or together, to match the path length between the sample arm 856a and the reference arm 856b.
- the light beam may be transmitted through a (micro)cylindrical lens (CL1) 830, which may then be collimated by a (collimating) lens (L3) 865 to project, via a beamsplitter (BS1) 866, onto a galvo scanner (GS) 867, and subsequently may be focused by an objective (or focusing) lens (L5) 804 to a focus point 808 on a sample 810.
- a fiber 859 may transmit the sample light beam to CL1 830.
- the mode field diameter (MFD) of the fiber 859 may be about 5.0 ⁇ 0.5 ⁇ m (defined by the lie field) at 850 nm.
- CL1 830 may be moved or driven by a closed-loop piezoelectric transducer (PZT) 831. CL1 830 may be moved in a direction perpendicular to the optical axis of the light in the sample arm 856a.
- BSl 866 may be inserted in the sample arm 856a to build up a dark-field apparatus.
- the galvo scanner 867 may be movable to scan the illumination light across the sample 810.
- the return light or backscattered light from the sample 810 may travel along a similar optical path back through L5 804, GS 867 and BSl 866.
- the return light may be directed towards a (collimating) lens (L4) 868 to be collimated and/or focused by the lens (L4) 868 and guided to another wideband fiber-optic coupler (OC2) 855, e.g., a 2 x 2 fiber-optic coupler with a splitting ratio of 90: 10.
- the light from the two arms 856a, 856b (e.g., the reference light and the return light) may then be directed into a spectrometer 870 via the coupler 855.
- the light beams from the two arms 856a, 856b may be combined in the coupler 855, which may facilitate interference between the reference light and the return light to form an interference signal to be received by the spectrometer 870 acting as a detector.
- a polarization controller may be provided in the optical path between L4 868 and OC2 855.
- optical imaging device 850 may employ a plurality of coherent light beams and the corresponding apertures, as described above. Further, it should be appreciated that, in addition to or alternative to the CLl 830, other (optical) elements or devices as described herein for various embodiments may be employed in the sample arm 856a. It should also be appreciated that propagation of light between optical elements may be by means of an optical fiber.
- the sample (illumination) beam may be steered by changing the curvature of the cylindrical lens (CLl) surface, which may be placed at the tip of the sample fiber 859 and driven by a PZT 831 laterally.
- Multiple spectrometer exposures may be executed during each beam steering cycle to acquire multiple A-lines with distinctive apertures at the pupil plane of the objective lens (L5) 804. Images captured through the multiple distinctive apertures may be encoded in multiple distinct depths in B-scan. By correcting the optical path difference and defocus- induced wavefront curvature, images with distinct apertures may be coherently summed together, which may enable the system to synthetize multiple apertures and extend the depth of focus (DOF).
- DOE depth of focus
- the spectrometer 870 may include a (collimating) lens (L6) 871 (which may be achromatic), a transmission diffraction grating (G) 872 (e.g., a 1765 line/mm diffraction grating), a camera lens (L7) 873 (e.g., 85 mm, f/1.4), and a camera (e.g., a single-line charge-coupled device (CCD) camera; a 4096-pixel CCD camera) 874.
- the spectrometer efficiency may include the grating diffraction efficiency, the camera lens efficiency and the CCD quantum efficiency.
- the detected spectrum may be digitized (e.g., at 12-bit resolution) and transferred to a workstation (WS) (or a computer) 877 via an image acquisition board (IMAQ) 876 and two camera link cables.
- WS workstation
- IMAQ image acquisition board
- Two-directional transverse scanning may be implemented by two galvanometer- mounted mirrors driven (in GS 867) with sawtooth pulses, which may be generated by an analog voltage driver including a data acquisition (DAQ) board (not shown) (e.g., which may provide a 16-bit analog output) and a shielded connector block (not shown).
- the spectrum acquisition trigger may be generated by the workstation 877, or an external trigger from a DAQ digital output may be provided, which may be used to synchronize the camera 874 for image capture and the scanning device 867 for two-directional transverse scanning.
- a discrete Fourier transform may be performed on each frame of the 1024 A-lines obtained by the CCD 874 to produce an axial depth profile of the sample 810.
- FIG. 9 compares the OCT image retrieval process using the MAIR method (see flowchart 990) of various embodiments with that using the known FFT method (see flowchart 998).
- the MAIR method 990 has three distinguishing steps.
- the first distinguishing step 991 all images are axially shifted, and then the optical path difference between multiple OCT images captured by distinctive apertures is corrected by multiplexing an additional phase term according to the Fourier shift theorem.
- the second distinguishing step 992 all images are laterally shifted to eliminate the lateral position differences between multiple OCT images caused by the curvature of the cylindrical lens.
- the phase correction aims to correct the wave-front curvature induced by defocusing.
- An assessment standard may be set for optimal MAIR performance in 994.
- multiple OCT images are synthetized into one MAIR OCT image, in which the lateral resolution may be preserved along a larger depth-of-focus.
- polystyrene calibration microbeads or microparticles sample.
- a phantom of polystyrene calibration microparticles was constructed by mixing agarose solution with polystyrene microparticles. This mixture was stored in a vial and placed in an ultrasonic bath for 10 minutes to remove residual clusters. A sample (about 10 g) was poured into a cell culture dish, cured for 30 minutes at 100°C and then cured for 24 hours at room temperature.
- SE-OCT may provide complete sidelobe suppression in the depth point-spread function, further improving the image quality. It is evident from image (b) that the cross-sectional scans suffered from defocusing beyond the focus.
- the process of MAS or MAIR includes two steps: axial-shift and phase-correction.
- the results of axial-shift, which is the first step of MAS, and phase-correction (or defocusing correction), which is the second step of MAS, are shown in images (c) and (d) respectively of FIG. 10A.
- images (a') - (d') show the enlarged views of two calibration beads located in the dashed boxes (indicated by arrows for clarity) in images (a) - (d) respectively.
- the mode field diameter (MFD) (defined by 1/e field) is about 5.0 ⁇ 0.5 ⁇ m
- the theoretical lateral full width at half maximum (FWHM) of the point spread function (PSF) at focus is estimated to be about 2.92 ⁇ m, together with a DOF of about 16.01 ⁇ m at a center wavelength of about 850 nm.
- the lateral FWHMs of 50 random microbeads were measured at different depths corresponding to images (b) and (d) of FIG. 10A, and, then, a 10-order polynomial-fitting of such measured values was performed. The results are shown in FIG. 10B.
- the finest lateral FWHM of the refocused microbeads is about 9.06 ⁇ m, which means that the finest nominal lateral FWHM of the PSF is 3.06 ⁇ m (the FWHM of the PSF is equal to the FWHM of the refocused microbeads (9.06 ⁇ m ) minus the real microbeads size (6 ⁇ m )) with a DOF of about 17.30 ⁇ m.
- the DOF is estimated to be within the depth range of approximately 910-927 ⁇ m , where the two fitted lines in FIG. 10B cross or intersect each other.
- the defocused maximum, averaged, and minimum lateral FWHMs of the microbeads are about 39.34 ⁇ m , about 20.16 ⁇ m and about 9.26 ⁇ m, respectively, so, the maximum, averaged, and minimum lateral FWHMs of the PFSs are about 33.34 ⁇ m , about 14.16 ⁇ m and about 3.26 ⁇ m .
- the refocused maximum, averaged, and minimum lateral FWHMs of the microbeads are about 39.34 ⁇ m , about 20.16 ⁇ m and about 9.26 ⁇ m, respectively, so, the maximum, averaged, and minimum lateral FWHMs of the PFSs are about 33.34 ⁇ m , about 14.16 ⁇ m and about 3.26 ⁇ m .
- the refocused maximum, averaged, and minimum lateral FWHMs of the microbeads are about 39.34 ⁇ m , about 20.16 ⁇ m and about 9.26 ⁇ m, respectively, so
- the MAIR-OCT system may achieve constructive interference in the center and destructive interference on the edge part of the focus spot, and thus, may preserve the diffraction-limited lateral resolution over the full axial depth, and obtain a DOF extension of -10 times, consistent with the results of the numerical simulation described above.
- FIGS. 11A to HE show the resultant images for the fresh grape sample for purposes of verifying the DOF extension performance, where FIG. 1 1A shows the dispersion-compensated B-scan while FIG. 1 1B shows the digitally refocused B-scan, with a size of about 1747 ⁇ m (transverse) x 1069 ⁇ m (axial).
- FIGS. 11A and 11B two local areas at depths of about 329 ⁇ m and about 760 ⁇ m from the focus (represented by the dashed line in FIG. 11 A) were selected and magnified by a factor of two and the results are shown in FIGS. 1 1C and 1 ID.
- FIG. 11C shows parts of the B-scan of FIG. 11A and the associated transverse profiles indicated by the dashed lines in FIG. 11C.
- the upper image and the upper transverse profile of FIG. 11C correspond to the part of the B-scan of FIG. 11 A located in the dashed box (indicated by a dashed arrow for clarity) in FIG. 11A at about 760 ⁇ m from the focus, while the lower image and the lower transverse profile of FIG. 11C correspond to the part of the B-scan of FIG. 11 A located in the dotted box (indicated by a dotted arrow for clarity) in FIG. 11A at about 329 ⁇ m from the focus.
- FIG. 11D shows parts of the B-scan of FIG. 11B and the associated transverse profiles indicated by the dashed lines in FIG. 11D.
- the upper image and the upper transverse profile of FIG. 1 ID correspond to the part of the B-scan of FIG. 1 IB located in the dashed box (indicated by a dashed arrow for clarity) in FIG. 11B at about 760 ⁇ m from the focus
- the lower image and the lower transverse profile of FIG. 11D correspond to the part of the B-scan of FIG. 1 IB located in the dotted box (indicated by a dotted arrow for clarity) in FIG. 1 IB at about 329 ⁇ m from the focus.
- Anisotropy is an effective indicator of image sharpness, and may increase as the blur diminishes.
- the anisotropy ratio of the digitally refocused B-scan to the dispersion- compensated B-scan was calculated over the whole depth range, and the results are shown in FIG. HE. Over the depth range from about 130 ⁇ m to 920 ⁇ m, the anisotropy ratio is greater than 1 and fluctuates around 1.2, which means that the transverse resolution is dramatically improved. Over the depth range from 1 ⁇ m to 130 ⁇ m, the anisotropy ratio is less than 1 due to strong reflection on the tissue surface.
- FIGS. 12A and 12B two local areas at depths of about 382 ⁇ m and about 415 ⁇ m from the focus (represented by the dashed line in FIG. 12A) were selected and magnified four times and the results are shown in FIGS. 12C and 12D.
- FIG. 12C shows parts of the B-scan of FIG. 12A and the associated transverse profiles indicated by the dashed lines in FIG. 12C.
- the upper image and the upper transverse profile of FIG. 12C correspond to the part of the B-scan of FIG. 12A located in the dashed box (indicated by a dashed arrow for clarity) in FIG. 12A at about 415 ⁇ m from the focus, while the lower image and the lower transverse profile of FIG. 12C correspond to the part of the B-scan of FIG. 12A located in the dotted box (indicated by a dotted arrow for clarity) in FIG. 12A at about 382 ⁇ m from the focus.
- FIG. 12D shows parts of the B-scan of FIG. 12B and the associated transverse profiles indicated by the dashed lines in FIG. 12D.
- the upper image and the upper transverse profile of FIG. 12D correspond to the part of the B-scan of FIG. 12B located in the dashed box (indicated by a dashed arrow for clarity) in FIG. 12B at about 415 ⁇ m from the focus, while the lower image and the lower transverse profile of FIG. 12D correspond to the part of the B-scan of FIG. 12B located in the dotted box (indicated by a dotted arrow for clarity) in FIG. 12B at about 382 ⁇ m from the focus.
- the transverse profiles in the zoom-in area corresponding to the positions indicated by the respective dashed lines show that the cell boundaries' widths were sharpened from about 15.3 ⁇ and about 27.2 ⁇ to about 8.5 ⁇ m and about 9.2 ⁇ , respectively.
- the transverse profiles obtained show that the defocused cell boundary was well digitally refocused.
- the anisotropy ratio of the digitally refocused B-scan to the dispersion- compensated B-scan was also calculated over the whole depth range, and the results are shown in FIG. 12E. Over the whole depth range, the anisotropy ratio is almost always greater than 1 and fluctuates around 1.05, indicating a transverse resolution improvement. Several valleys of the anisotropy ratio are generated due to artifacts induced by strong reflection at cell junctions. The results obtained demonstrate that MAS may achieve good DOF extension performance, as shown above when imaging the rat adipocyte sample.
- a central image may be merged with other adjacent frames, for example, four adjacent frames, to generate one DOF extended frame.
- FIG. 13 shows a schematic cross-sectional view of the phase differences between five adjacent frames with distinctive apertures. As illustrated, there may be five sample beams with distinctive apertures (as respectively represented by five arrowed lines "1" to "5") when the micro- cylindrical lens (MCL) 980 is transversely shifted.
- MCL micro- cylindrical lens
- This phase interpolation scheme may increase the imaging speed by five times, enabling MAIR SD-OCT to have the same imaging speed as a standard OCT.
- FIG. 14A shows a non-limiting example of a polarization encoded probe 1400, which may include a Ferrule 1480 with a single mode fiber (SMF) 1432, a calcite spacer 1438, a polarization analyzer (e.g., a half wavelength plate) 1482, a GRIN lens 1484, a beamsplitter (BS) 1486 and a mirror (M) 1488.
- the polarization analyzer 1482 may be positioned between the calcite spacer 1438 and the GRIN lens 1484.
- BS 1486 and M 1488 may be optional.
- the Ferrule 1480 may be optional or replaced with another element.
- Light from the SMF 1432 may be split into an ordinary ray (o-ray) and an extraordinary ray (e-ray) while propagating through the calcite spacer 1438, which then travel through the BS 1486 to be split and directed to the mirror 1488 to be reflected, and to be focused to a focus point 1408 on a sample 1410.
- the double headed solid arrows trace the extraordinary optical path for the e-ray, while the double headed dashed arrows trace the ordinary optical path for the o-ray.
- the spacer 1438 may be made of birefringent calcite and the SMF material may be non-birefringent fused silica.
- the interface plane 1481 between the SMF 1432 and the calcite spacer 1438 may be angled with respect to the optical axis of the SMF 1432. Such an arrangement may help to minimise or avoid the reflection at the interface plane 1481.
- the angle between the optical axis of the SMF 1432 and the interface plane 1481 is a, which may be set to 45° optimally, or another acute angle.
- the refractive index of fused silica is about 1.46 at 800 nm.
- the refractive index of calcite is about 1.46 and 1.65 for ordinary ray and extraordinary ray at 800 nm, respectively.
- the fast axis of the calcite spacer 1438 is parallel to the interface plane 1481 between the SMF 1432 and the calcite spacer 1438.
- the optical axis of the polarization analyzer 1482 is about 45° with respect to the fast axis and the slow axis of the calcite spacer 1438.
- FIGS. 14B to 14D show, in greater details, the optical imaging device 1400 and its related operations, illustrating the principle of polarization-based multiple aperture division and synthesis.
- FIG. 14B shows the generation and focusing of the e-ray 1406a and the o-ray 1406b. It should be appreciated that some elements illustrated in FIG. 14A are omitted in FIG. 14B for ease of understanding and clarity purposes.
- FIG. 14C shows a cross-sectional view of the probe 1400 showing the fast axis of the calcite spacer 1438 and the optical axis of the analyzer 1482.
- the light output 1440 from the SMF 1432 may undergo refraction at the interface plane 1481 between the fused silica SMF 1432 and the calcite spacer 1438.
- the part of the light 1440 from the SMF 1432 with a polarization direction along the fast axis of calcite spacer 1438 may travel in the calcite spacer 1438 as the ordinary ray 1406b, while the rest of the SMF light 1440 with a polarization direction perpendicular to the fast axis of calcite spacer 1438 may travel in the calcite spacer 1438 as the extraordinary ray 1406a.
- the ordinary ray 1406b and the extraordinary ray 1406a may be separated by about five degrees in the calcite spacer 1438.
- the apertures occupied by the ordinary and extraordinary rays 1406a, 1496b are different, forming two distinct apertures.
- the ordinary ray 1406b and the extraordinary ray 1406a may go through the polarization analyzer 1482 after passing through the calcite spacer 1438.
- the analyzer 1482 may rotate the respective polarization direction of the ordinary ray 1406b and the extraordinary ray 1406a by about 45° in the illumination paths of the ordinary ray 1406b and the extraordinary ray 1406a, so that after passing through the polarization analyzer 1482, the polarization directions of both the ordinary ray 1406b and the extraordinary ray 1406a may be the same as the optical axis of the polarization analyzer 1482.
- the ordinary ray 1406b and the extraordinary ray 1406a may be directed by the GRIN lens 1484 onto a common spot 1408 on the sample 1410.
- the illumination light, including the ordinary ray 1406b and the extraordinary ray 1406a may be back- reflected or back-scattered by the sample 1410.
- the light back-reflected or back-scattered by the sample 1410 may be divided into four parts by the illumination paths (ordinary and extraordinary rays) and detection paths (ordinary and extraordinary rays).
- FIG. 14D shows the four possible round-trip light paths based on the illumination paths and detection paths.
- Light signals from all four light paths may be coupled back into the SMF 1432 and directed to and be detected by a photodetector (not shown). Due to the difference in the refractive index of calcite between the ordinary and extraordinary rays 1406a, 1406b, the round trip path length of the ee-light is approximately 2*d*( 1.65- 1.46) longer than that of the oo-light, and the round trip path length of the oe-light and the eo-light is approximately d*( 1.65- 1.46) longer than that of the oo-light, where d is the physical length of the calcite spacer 1438.
- This path length difference makes it possible to encode the light signal from different paths by use of path length and realize path length division detection. This ability to detect the light signals separately in path length domain may facilitate multiple aperture synthesis described herein above.
- the light paths of the coherent light beams may be separated or shifted in the lateral or transverse direction. This may help with the correction of wavefront distortion in the post-processing stage. Further, the light beams from all of the apertures may be focused on the same point. Also, wavefront distortions may be corrected to realize more than 10-fold DOF extension via multiple apertures synthesis.
- correction of wavefront distortion may be carried out in a post-processing stage, for example, using a processor or a computer.
- DOF extension may result from the set-up of the optical imaging device and/or the post-processing distortion correction method.
- the various embodiments may be classified as multiple aperture synthesis (MAS). The difference between them may include how to separate the multiple apertures and there may be challenges in terms of the scanning rate for the optical imaging device 200 (FIGS. 2A and 2B) while the optical imaging devices 300 (FIG. 3A), 400 (FIG. 4A), 500 (FIG. 5A) may require a much larger imaging depth. Nevertheless, various embodiments may share the same or similar physical theory and data post-possessing.
- the various embodiments may include a similar optical design with different types of optical beam separation elements.
- the optical imaging device 300 (FIG. 3A) may be applied to a hand-held system for flexible detection, and optical imaging devices 400 (FIGF. 4A), 500 (FIG. 5A) may have the potential to realize DOF extension in a probe design that may be suitable for various endoscopic imaging applications.
- various embodiments may provide a technique to address or overcome the depth-of-focus (DOF) limitation in optical coherence tomography (OCT).
- DOF depth-of-focus
- OCT optical coherence tomography
- the illumination beam may be scanned across the under-filled objective lens pupil plane by steering the beam at the pinhole (fiber) using a microcylindrical lens.
- the detected interferometric signals from multiple distinctive apertures may be digitally refocused, which may be analogous to synthetic aperture radar (SAR).
- SAR synthetic aperture radar
- Numerical simulations and imaging experiments show that this technique may be able to maintain a diffraction-limited transverse resolution along a DOF that is aprroximately ⁇ 10 times larger than the confocal parameter.
- the ability to extend the DOF without or with minimal signal loss and sidelobe artifacts may address or overcome the DOF limitation in high-resolution OCT.
- the MAS technique of various embodiments may address the problem of limited DOF in high transverse resolution FD-OCT.
- MAS may be free from signal loss and sidelobe artifacts, which may be caused by a sub-optimal coherence transfer function (CTF) and inherent in known methods.
- CTF sub-optimal coherence transfer function
- transverse priority scanning may be susceptible to motion artifacts. This may be resolved by changing to angular frequency priority scanning.
- the example of the implementation of MAS as described herein may be at the cost of scanning speed, where five A-scans with five distinctive apertures together were coherently summed to obtain one DOF extended A-line, which decreases the imaging speed by five times. This may be mitigated by the use of faster spectrometers or an ultrahigh-speed swept source.
- a phase ramp may be digitally created along the fast scanning direction in the PF to achieve digital transverse scanning.
- the MAS technique of various embodiments may address or overcome the inherent tradeoff between DOF extension and signal loss/sidelobe artifacts and may address or overcome the DOF limitation in high-resolution OCT.
- the optical imaging device or apparatus of various embodiments may be applicable to desktop OCT imaging systems for DOF extension, as well as a miniaturized optical design for endoscopic and intravascular applications. Further, various embodiments may be extended to the development of a faster scanning MAS method for in vivo applications.
Landscapes
- Physics & Mathematics (AREA)
- General Physics & Mathematics (AREA)
- Health & Medical Sciences (AREA)
- General Health & Medical Sciences (AREA)
- Nuclear Medicine, Radiotherapy & Molecular Imaging (AREA)
- Radiology & Medical Imaging (AREA)
- Engineering & Computer Science (AREA)
- Signal Processing (AREA)
- Chemical & Material Sciences (AREA)
- Analytical Chemistry (AREA)
- Optics & Photonics (AREA)
- Investigating Or Analysing Materials By Optical Means (AREA)
Abstract
According to embodiments of the present invention, an optical imaging device is provided. The optical imaging device includes an optics arrangement having a focusing optics, the optics arrangement configured to generate a plurality of coherent light beams incident on the focusing optics to be focused to a common focus point to illuminate a section of a sample, wherein the plurality of coherent light beams define respective discrete apertures at respective different positions on the focusing optics, and wherein the optics arrangement is further configured to receive, from the section of the sample, return lights for generation of at least one image representing the section of the sample. According to further embodiments of the present invention, a method for imaging is also provided.
Description
OPTICAL IMAGING DEVICE AND METHOD FOR IMAGING
Cross-Reference To Related Application [0001] This application claims the benefit of priority of Singapore patent application No. 10201702101T, filed 15 March 2017, the content of it being hereby incorporated by reference in its entirety for all purposes.
Technical Field
[0002] Various embodiments relate to an optical imaging device and a method for imaging.
Background
[0003] Optical Coherence Tomography (OCT) is a non-invasive, non-ionizing interferometric laser scanning based imaging technique. Without requiring any exogenous contrast agents, OCT is able to provide cross-sectional images of biological tissues with micrometer-level spatial resolution and millimeter-level penetration depth. It has been widely applied in biomedical fields since it was first introduced for retinal imaging.
[0004] Technically, OCT can be viewed as a combination of the low coherence interferometric technique and the Reflectance Confocal Microscopy. In the axial direction, the working principle of OCT is based upon low coherence interferometry, wherein the refractive index difference profiles of the sample along the depth direction are recorded by the interferometric signals. In the transverse direction, OCT optics is identical to the reflectance confocal microscopy, in which confocal detection pinhole acquires a small volumetric signal of the sample by rejecting out-of-focus back-scattered light.
[0005] Axial resolution and lateral resolution are two factors that determine the performances of an OCT system. The axial resolution, Δζ, is determined by the central
wavelength, λc, and the bandwidth, Αλ, at full-width-half-maximum of the light source, and is given by Δz = 2\n(2)λc 2/π(Αλ)2. Hence, for an OCT with a given light source, its axial resolution remains constant over the full imaging depth. The lateral resolution, Δχ, is regarded as the diffraction limited spot size of the focused beam, and is defined as the beam waist diameter with Gaussian input beam assumed. Δχ is determined by three factors: the wavelength, A, of the light source, the focal length, , of the objective lens, and the diameter, d, of the beam passing through the objective lens, and it may be expressed as Δχ = 2/ϊ/πΝΑ, where NA = d/2f is the numerical aperture (NA) of the objective lens. It is approximately maintained only within the depth-of-focus (DOF), which is an axial distance that is twice the Rayleigh range and may be expressed as z = 2ZR = 4λ/π(ΝΑ)2, with ZR = π(Δx)2/2λ being the Rayleigh range.
[0006] There are laser scanning confocal optics in OCT systems. Excitation light in OCT systems is normally delivered by a sample arm fiber to the sample through a series of collimation, scanning and focusing optics, and this optical path is known as the illumination path. The fiber tip in the OCT sample arm serves physically as a confocal pinhole which creates a confocal volume in the sample space and rejects back-reflected and/or back-scattered photons from out of focus region(s). The light backreflected or backscattered from the confocal volume inside the sample goes through the same optical path length as the above-mentioned illumination path, and this path is known as the detection path. Light signal backreflected or backscattered from each confocal volume corresponds to an axial line (depth profile) in an OCT image. By laterally scanning the beam or confocal volume across the sample, cross-sectional images can be obtained.
[0007] There are a number of issues with the current OCT systems, in particular, limitation on the depth-of-focus, and wavefront distortion.
[0008] According to the definitions for lateral resolution and depth-of-focus as stated above, the lateral resolution is inversely proportional to the NA of the objective lens, and the depth-of-focus is proportional to the square of the lateral resolution. Consequently, a trade-off exists between the lateral resolution and the depth-of-focus: a higher lateral resolution results in a shorter depth-of-focus, and vice versa. Therefore, there is limitation on the depth-of-focus To achieve a high lateral resolution over an extended depth-of- focus, various approaches have been proposed in the past decade. Generally, these
methods can be classified into different categories such as the following, and each has its own disadvantages, (i) Bessel beam suffers from signal loss and sidelobe artifacts, which is due to inherent spherical aberration and cannot be tolerated, (ii) Phase or amplitude apodization suffers from significant signal loss and sidelobe artifacts due to destructive interference, (iii) Adaptive optics needs indispensable phase stabilizing setup, while interferometric synthetic microscopy (ISAM) suffers from heavy computation cost extra phase stabilization setups, (iv) Digital refocusing approach has drawn great research interest since it requires minute hardware changes to known Fourier-domain (FD) OCT. Recently, an approach known as depth-encoded synthetic aperture was proposed to extend the depth-of-focus by synthetizing aperture and correct wavefront curvature with defocus effect. This approach is of low computation cost, and is compatible with known FD-OCT without any phase stabilization setups. However, this method still suffers from signal loss due to numerical aperture mismatch between the illumination and detection optics. In addition, this method is not scalable since increasing the number of apertures will dramatically increase the signal loss.
[0009] There is also an issue with wavefront distortion in known OCT systems. Wavefront distortion is caused by heterogeneous refractive index distribution in the sample space or the optical aberrations of the imaging system. Wavefront distortion degrades the OCT transverse resolution. For example, when OCT uses human eye optics to focus the sample arm beam to the posterior segment of the eye, the transverse spot size is normally larger than 15 micrometers due to optical aberrations of the human cornea and lens. Improving the transverse resolution requires wavefront distortion corrections caused by human eye. Summary
[0010] The invention is defined in the independent claims. Further embodiments of the invention are defined in the dependent claims.
[0011] According to an embodiment, an optical imaging device is provided. The optical imaging device may include an optics arrangement having a focusing optics, the optics arrangement configured to generate a plurality of coherent light beams incident on the
focusing optics to be focused to a common focus point to illuminate a section of a sample, wherein the plurality of coherent light beams define respective discrete apertures at respective different positions on the focusing optics, and wherein the optics arrangement is further configured to receive, from the section of the sample, return lights for generation of at least one image representing the section of the sample.
[0012] According to an embodiment, a method for imaging is provided. The method may include generating a plurality of coherent light beams incident on a focusing optics to be focused to a common focus point to illuminate a section of a sample, wherein the plurality of coherent light beams define respective discrete apertures at respective different positions on the focusing optics, and receiving, from the section of the sample, return lights for generation of at least one image representing the section of the sample.
Brief Description of the Drawings [0013] In the drawings, like reference characters generally refer to like parts throughout the different views. The drawings are not necessarily to scale, emphasis instead generally being placed upon illustrating the principles of the invention. In the following description, various embodiments of the invention are described with reference to the following drawings, in which:
[0014] FIG. 1A shows a schematic view of an optical imaging device, according to various embodiments.
[0015] FIG. IB shows a flow chart illustrating a method for imaging, according to various embodiments.
[0016] FIGS. 2A and 2B show schematic views of an optical imaging device, according to various embodiments. FIG. 2C shows a schematic view of five apertures generated using the optical imaging device of FIGS. 2A and 2B, FIG. 2D shows a schematic exploded view of the focusing beams of the five apertures of FIG. 2C, and FIG. 2E shows a schematic view illustrating the optical axes of the focusing beams of the five apertures of FIG. 2C.
[0017] FIGS. 3A to 3C show schematic views of an optical imaging device, according to various embodiments.
[0018] FIGS. 4A to 4C show schematic views of an optical imaging device, according to various embodiments.
[0019] FIGS. 5A to 5D show schematic views of an optical imaging device, according to various embodiments.
[0020] FIG. 6 shows a schematic view illustrating a defocused wavefront.
[0021] FIG. 7 shows a schematic representation of geometry of scalar diffraction from the plane zi to the focal plane z = 0.
[0022] FIG. 8 shows a schematic view of an optical imaging device, according to various embodiments.
[0023] FIG. 9 shows flowcharts illustrating the procedures to generate multiple aperture interferometric refocusing in optical coherence tomography (MAIR OCT) images and known OCT images.
[0024] FIG. 10A shows a stepwise image sequence in linear scale: image (a) is the unprocessed image, image (b) is the dispersion-compensated image; images (c) and (d) are the resultant images in the first and second steps of multiple aperture interferometric refocusing, respectively. Images (a') - (d') show the enlarged views of two calibration beads indicated in images (a) - (d) respectively.
[0025] FIG. 10B shows a plot of lateral full width at half maximum (FWHMs) of 50 calibration beads at variable depths.
[0026] FIGS. 11A and 11B show, for B-scans of fresh grape samples, respectively the dispersion-compensated B-scan (intensity in logarithmic grayscale) captured from one of five apertures, and the digitally refocused B-scan via MAS (multiple aperture synthesis).
[0027] FIG. 11C shows parts of the B-scan of FIG. 1 1A at the two indicated boxed areas, magnified by a factor of two, and the associated transverse profiles indicated by the dashed lines in FIG. 1 1C.
[0028] FIG. 1 ID shows parts of the B-scan of FIG. 1 IB at the two indicated boxed areas, magnified by a factor of two, and the associated transverse profiles indicated by the dashed lines in FIG. 1 ID.
[0029] FIG. HE shows a plot of image anisotropy ratio of the digitally refocused B-scan to the dispersion-compensated B-scan.
[0030] FIGS. 12A and 12B show, for B-scans of rat adipocyte samples, respectively the dispersion-compensated B-scan (intensity in logarithmic grayscale) captured from one of five apertures, and the digitally refocused B-scan via MAS (multiple aperture synthesis).
[0031] FIG. 12C shows parts of the B-scan of FIG. 12A at the two indicated boxed areas, magnified by a factor of four, and the associated transverse profiles indicated by the dashed lines in FIG. 12C.
[0032] FIG. 12D shows parts of the B-scan of FIG. 12B at the two indicated boxed areas, magnified by a factor of four, and the associated transverse profiles indicated by the dashed lines in FIG. 12D.
[0033] FIG. 12E shows a plot of image anisotropy ratio of the digitally refocused B-scan to the dispersion-compensated B-scan.
[0034] FIG. 13 shows a schematic cross-sectional view of the phase differences between five adjacent frames with distinctive apertures as illustrated for a micro-cylindrical lens (MCL).
[0035] FIGS. 14A to 14D show schematic views of an optical imaging device, according to various embodiments.
[0036] FIG. 15 shows the results of numerical simulation.
[0037] FIGS. 16A to 16D show the results of numerical simulation. Detailed Description
[0038] The following detailed description refers to the accompanying drawings that show, by way of illustration, specific details and embodiments in which the invention may be practiced. These embodiments are described in sufficient detail to enable those skilled in the art to practice the invention. Other embodiments may be utilized and structural, logical, and electrical changes may be made without departing from the scope of the invention. The various embodiments are not necessarily mutually exclusive, as some embodiments can be combined with one or more other embodiments to form new embodiments.
[0039] Embodiments described in the context of one of the methods or devices are analogously valid for the other methods or devices. Similarly, embodiments described in the context of a method are analogously valid for a device, and vice versa.
[0040] Features that are described in the context of an embodiment may correspondingly be applicable to the same or similar features in the other embodiments. Features that are described in the context of an embodiment may correspondingly be applicable to the other embodiments, even if not explicitly described in these other embodiments. Furthermore, additions and/or combinations and/or alternatives as described for a feature in the context of an embodiment may correspondingly be applicable to the same or similar feature in the other embodiments.
[0041] In the context of various embodiments, the articles "a", "an" and "the" as used with regard to a feature or element include a reference to one or more of the features or elements.
[0042] In the context of various embodiments, the phrase "at least substantially" may include "exactly" and a reasonable variance.
[0043] In the context of various embodiments, the term "about" or "approximately" as applied to a numeric value encompasses the exact value and a reasonable variance.
[0044] As used herein, the term "and/or" includes any and all combinations of one or more of the associated listed items.
[0045] As used herein, the phrase of the form of "at least one of A or B" may include A or B or both A and B. Correspondingly, the phrase of the form of "at least one of A or B or C", or including further listed items, may include any and all combinations of one or more of the associated listed items.
[0046] Various embodiments may provide one or more of the following : (i) multiple aperture scanning or synthesis for imaging; (ii) multiple aperture interferometric refocusing (MAIR) in optical coherence tomography (OCT); (iii) depth-of-focus (DOF) extension in optical coherence tomography via multiple aperture synthesis; (iv) multiple aperture synthesis (MAS) technique to achieve a digital refocusing function with minimal or without signal loss or sidelobe artifacts.
[0047] Various embodiments may provide one or more optical designs or arrangements that may achieve fast or instantaneous multiple-aperture scanning in the illumination or
detection path of an OCT system. Various embodiments may also provide a signal processing method to achieve coherent synthesis of interference signals acquired from multiple apertures.
[0048] Various embodiments may provide one or more methods and/or apparatuses to implement multiple aperture interferometric refocusing in optical coherence tomography imaging systems to realize at least one of: depth-of-focus extension, lateral beam scanning, or wave-front distortion correction.
[0049] Various embodiments may provide one or more of the following over known methods, (i) Embodiments may be able to correct wavefront distortions including DOF caused by optical aberrations of the OCT system with minimal or without signal loss caused by numerical aperture mismatching in optical coupling, (ii) Embodiments may be able to correct wavefront distortions including DOF caused by optical aberrations of the OCT system with minimal or without the requirement of phase stability during data acquisition, (iii) Embodiments may be able to correct wavefront distortions including DOF caused by optical aberrations of the OCT system or the sample.
[0050] Various embodiments may be used for a variety of applications, including, for example, for clinical diagnosis and treatment, such as for posterior segment ocular imaging. By synthesizing multiple apertures to address or overcome the DOF limitation, MAIR OCT may enable us to visualize imperceptible changes with cellular and sub- cellular resolutions, and/or evaluate the cytological alteration of gastrointestinal tracts at an early stage by charactering one or more of the cell type, cellularity, cell polarity, cell viability and nucleus morphology.
[0051] FIG. 1A shows a schematic cross-sectional view of an optical imaging device 100, according to various embodiments. The optical imaging device 100 includes an optics arrangement 102 including a focusing optics 104, the optics arrangement 102 configured to generate a plurality of coherent light beams (e.g., two coherent light beams are shown and represented as 106a, 106b) incident on the focusing optics 104 to be focused to a common focus point 108 to illuminate a section of a sample 110, wherein the plurality of coherent light beams 106a, 106b define respective discrete apertures (e.g., illustrated by 107a, 107b) at respective different positions on the focusing optics 104, and wherein the optics arrangement 102 is further configured to receive, from
the section of the sample 110, return lights (e.g., represented by dashed arrows 112a, 1 12b) for generation of at least one image representing the section of the sample 110.
[0052] In other words, an optical device 100 for imaging a sample 110 may be provided. The optical imaging device 100 may include an optics arrangement 102, meaning an arrangement of one or more optical elements or devices. The optics arrangement 102 may also include one or more non-optical elements.
[0053] The optics arrangement 102 may include a focusing optics 104, for example, including a focus lens or an objective lens. The optics arrangement 102 may receive an input light, which may be a source light originating from a coherent light source, or light derived from the source light. From the input light received, the optics arrangement 102 may generate (or provide) a plurality of (parallel) coherent light (or optical) beams 106a, 106b. The plurality of coherent light beams 106a, 106b may be discrete light beams.
[0054] The coherent light beams 106a, 106b may impinge on the focusing optics 104 where each light beam 106a, 106b defines an associated discrete (optical) aperture 107a, 107b at a corresponding position on the focusing optics 104. The respective discrete apertures 107a, 107b may be shifted from one another in the transverse (or lateral) direction of the focusing optics 104, e.g., in the direction at least substantially perpendicular to the optical axis of the focusing optics 104. Correspondingly, the coherent light beams 106a, 106b may be shifted from relative to one another in the transverse (or lateral) direction. Adjacent respective discrete apertures 107a, 107b may overlap partially with one another or may be completely spaced apart from one another.
[0055] In the context of various embodiments, "apertures" of the coherent light beams may refer to different light beams incident on different positions of the focusing optics 104. Light beams from physical apertures may be separated by the optical path difference (OPD), for example, in an OCT interferogram.
[0056] The focusing optics 104 may receive the coherent light beams 106a, 106b, where the light beams 106a, 106b may be transmitted through the focusing optics 104. The coherent light beams 106a, 106b incident on the focusing optics 104 are focused by it to a single (or the same) focus point 108 to illuminate a sample 110 that is to be imaged. The coherent light beams 106a, 106b may be at least substantially parallel to each other to be
focused by the focusing optics 104 to the common focus point 108. It should be appreciated that the focus point 108 may have a spatial extent.
[0057] The coherent light beams 106a, 106b may be focused by the focusing optics 104 onto the section of the sample 110. This may mean that the focusing optics 104 may define a focal length that extends to the section of the sample 110, with the focus point 108 incident on the sample 110. It should be appreciated that the section of the sample 110 may be any location of the sample 110, including a surface thereof or an interior portion of the sample 110. In the context of various embodiments, it should be appreciated that the term "section" in relation to a sample may include a point on the sample.
[0058] The optics arrangement 102 is further configured to receive, from the sample section that is illuminated, return lights 112a, 112b which may be used for generation (e.g., by a detector, e.g., an image detector) of at least one image that is representative of the section of the sample that is illuminated. One image may be generated corresponding to one return light 112a, 112b.
[0059] In the context of various embodiments, the return light 112a, 112b may be induced or generated from the section of the sample 110, resulting from the interaction between one of the coherent light beams 106a, 106b and the sample section. This may mean that each return light 112a, 112b may originate from the section of the sample 110 that is illuminated. Each return light 112a, 112b may include light reflected and/or backscattered from the sample section. It should be appreciated that each respective return light 112a, 112b may include information associated with or corresponding to the sample section.
[0060] In various embodiments, the return lights 112a, 112b may travel through or along substantially similar or identical optical paths as for the plurality of coherent light beams 106a, 106b, but in an opposite direction.
[0061] In various embodiments, the plurality of coherent light beams 106a, 106b may travel along illumination paths for illumination of the section of the sample 110, while the return lights 112a, 112b may travel along detection paths for generation of the at least one image. The illumination paths and the detection paths may correspond to each other except for the opposite directions of light propagation.
[0062] The coherent light beams 106a, 106b may travel or propagate along respective different optical paths. As the plurality of coherent light beams 106a, 106b define respective discrete apertures at respective different positions on the focusing optics 104, the light beams 106a, 106b may, relative to each other, follow respective different path lengths to the common focus point 108. Therefore, a respective light beam of the plurality of coherent light beams 106a, 106b may travel to the common focus point 108 through or along an optical path with an optical path difference as compared to another optical path travelled by another light beam of the coherent light beams 106a, 106b. The return lights 1 12a, 1 12b, in propagating along the optical paths of the plurality of coherent light beams 106a, 106b, may, relative to each other, travel or propagate through different optical path lengths.
[0063] In various embodiments, a return light (e.g., 1 12a or 112b) resulting from a respective light beam (e.g., 106a) illuminating the section of the sample 110 may return via the same optical path of the respective light beam (e.g., 106a), or via the optical path of another light beam (e.g., 106b).
[0064] In the context of various embodiments, the respective return lights 112a, 1 12b, or the images resulting from the respective return lights 112a, 112b may be employed in a post-imaging process for correcting wave-front distortion, which may lead to a depth of focus (DOF) extension.
[0065] In the context of various embodiments, the plurality of coherent light beams 106a, 106b may be generated from light provided by one (coherent) light source, or from a single light beam or radiation.
[0066] In the context of various embodiments, while two coherent light beams 106a, 106b are shown and described, it should be appreciated any number of coherent light beams (and the number of associated apertures) of at least two may be provided, including three, four, five, or any higher number.
[0067] In the context of various embodiments, while two return lights 112a, 112b are shown and described, it should be appreciated that there may be any number of return lights, including one, three, four, five, or any higher number, depending on the configuration of the optics arrangement 102 and/or the number of coherent light beams 106a, 106b.
[0068] In the context of various embodiments, by defining a plurality of apertures 107a, 107b, the optical imaging device 100 may employ multiple aperture scanning (or synthesis), e.g., in the illumination and/or detection paths. Multiple apertures are employed to correct wave front distortion. For example, after digitally adjusting each phase term, images from multiple apertures may be combined to an optimal image.
[0069] In various embodiments, the optics arrangement 102 may further include an optical element arranged to receive an input light, and an actuator arranged to move (or drive) the optical element for generating the plurality of coherent light beams 106a, 106b from the input light. The optical element may be transmissive or reflective. The coherent light beams 106a, 106b may be generated at different times resulting from the movement of the movable optical element. This may mean that the light beams 106a, 106b may be separated in time. A respective light beam 106a or 106b may be generated to define a respective aperture 107a or 107b at the focusing optics 104 in response to a (single) movement as the movable optical element is relatively moved to a different orientation or position.
[0070] In various embodiments, the optical element may include at least one of a cylindrical lens (CL) having a curved face (e.g., a cylindrical surface) arranged to face the input light, or a mirror (e.g., a scanning mirror). The mirror may be movable in a rotational motion. The cylindrical lens may be used to tilt the input or incident light (e.g., outputted from a fiber) so that the beams 106a, 106b may be shifted in parallel prior to reaching the focusing optics 104. The cylindrical lens may be preferred as it is stable and flexible.
[0071] The curved face of the cylindrical lens may be arranged as the input face or the input side of the cylindrical lens. This may mean that the cylindrical lens may have a curvature which the input light first encounters and enters the cylindrical lens. The cylindrical lens may then transmit the input light. The cylindrical lens may be movable in a linear motion, for example, in a direction along a plane perpendicular to the (optical axis of the) input light, e.g., in a lateral (or transverse) direction. The cylindrical lens may be driven by a linear actuator, e.g., a piezoelectric transducer (PZT) motor.
[0072] In various embodiments, as the cylindrical lens is moved, the input light may encounter different parts of the curved face of the cylindrical lens to be refracted along
different path lengths through the cylindrical lens, where each light refracted may define one of the plurality of coherent light beams 106a, 106b.
[0073] In various embodiments, the optics arrangement 102 may further include a beamsplitter (BS) configured to receive an input light and to split the input light to generate the plurality of coherent light beams 106a, 106b. The beamsplitter may include at least two (parallel) reflective surfaces for generating the plurality of coherent light beams 106a, 106b. The at least two reflective surfaces may be arranged angled or slanted to the (optical axis of the) input light. The reflective surfaces may be arranged on opposite sides of the beamsplitter, the reflective surfaces being arranged to face the input light. One of the reflective surfaces may have a higher reflectivity compared to another of the reflective surfaces. For example, one reflective surface may be totally reflective (e.g., 100% reflectivity) and another of the reflective surfaces may be partially reflective (meaning that light may also be transmitted through this reflective surface). In various embodiments, the reflective surfaces may be reflective films provided or coated on the beamsplitter.
[0074] In various embodiments, the optics arrangement 102 may further include a reflective optical element configured to receive an input light, the reflective optical element having at least two (parallel) reflective surfaces configured to reflect the input light to generate the plurality of coherent light beams. The reflective optical element may include or may be a mirror. The reflective surfaces may be arranged on opposite sides of the reflective optical element, the reflective surfaces being arranged to face the input light. Additionally or alternatively, the reflective surfaces may be arranged on one side of the reflective optical element, the reflective surfaces being arranged (completely) spaced apart from each other to face the input light. One of the reflective surfaces may have a higher reflectivity compared to another of the reflective surfaces. For example, one reflective surfaces may be totally reflective (e.g., 100% reflectivity) and another of the reflective surfaces may be partially reflective (meaning that light may also be transmitted through this reflective surface). In various embodiments, the reflective surfaces may be reflective films provided or coated on the reflective optical element.
[0075] In various embodiments, the optics arrangement 102 may further include a birefringent material (or element) configured to receive an input light and to generate,
from the input light received, a plurality of polarized lights of different polarization directions (or orientations) as the plurality of coherent light beams 106a, 106b. The input light may be provided such that the optical axis of the input light may be at least substantially perpendicular to the input facet or face of the birefringent material (e.g., see FIG. 5 A), or the optical axis of the input light may be angled (e.g., at an acute angle) to the input facet or face of the birefringent material (e.g., see FIGS. 14A and 14B) to minimize or avoid reflection at the input facet. The birefringent material may receive the input light (which may be unpolarized or may be polarized) and split the input light into two polarized light beams in the form of an ordinary ray (or beam) and an extraordinary ray (or beam) as the input light travels in or within the birefringent material. A polarized light of a polarization direction oriented along the fast axis of the birefringent material may define the ordinary ray (o-ray), while a polarized light of a polarization direction oriented along the slow axis of the birefringent material may define the extraordinary ray (e-ray). The ordinary ray and the extraordinary ray may then propagate through the birefringent material. As a non-limiting example, the birefringent material may include a uniaxial crystal, including but not limited to calcite (CaC03), Si02 (quartz), Ti02 (rutile) and YVO4 (yttrium orthovanadate).
[0076] The optics arrangement 102 may further include a half-wavelength plate at an output side of the birefringent material. The half-wavelength (λ/2) plate may be arranged to receive the plurality of polarized lights and to change an orientation of the polarization directions of the plurality of polarized lights. For example, after passing through the half- wavelength plate, the polarization directions of the plurality of polarized lights may be oriented or aligned to the optical axis of the half-wavelength plate. As a non-limiting example, the optical axis of the half-wavelength plate may be arranged at about 45° with respect to the fast axis and the slow axis of the birefringent material.
[0077] In various embodiments, the focusing optics 104 may include a gradient index (GRIN) lens. The GRIN lens may be arranged at an output side of the birefringent material and the half-wavelength plate.
[0078] In the context of various embodiments, at least one of the optical element (e.g., cylindrical lens), the beamsplitter, the reflective optical element, or the birefringent
material may be positioned in a sample arm of the optics arrangement 102 or the optical imaging device 100.
[0079] In various embodiments, the optics arrangement 102 may be further configured, for each return light of the return lights 112a, 112b, to form an interference signal from the return light 112a, 112b and a reference light for generation of the at least one image representing the section of the sample 110. Each return light 112a, 112b and the reference light may interfere with each other or may be combined to form an interference signal or spectrum. The interference signal may be captured or detected by a detector.
[0080] In various embodiments, for forming the interference signal, the optics arrangement 102 may further include a reference arm having a reference mirror (RM). Part of the input light may be directed to the reference mirror which may reflect it to generate the (return) reference light. The path lengths of the reference light and the respective return lights 112a, 112b originating from the section of the sample 110 may, relative to a common reference point, be at least substantially similar to one another. In other words, the path lengths between the sample and reference arms of the optics arrangement 102 may be at least substantially matched to each other.
[0081] In various embodiments, the optical imaging device 100 may further include a single (coherent) light source configured to supply an input light for generation of the plurality of coherent light beams 106a, 106b. As a non-limiting example, any light source capable of providing a broadband spectrum ranging from about 600 nm to about 900 nm may be used.
[0082] In various embodiments, the optics arrangement 102 may further include a collimation lens configured to provide an input light in collimated form for generation of the plurality of coherent light beams 106a, 106b. The collimation lens may receive and collimate the input light to produce a collimated light. As a non-limiting example, the collimation lens may be arranged at an output side of the optical element (e.g., cylindrical lens, mirror) described above. As a further non-limiting example, the collimation lens may be arranged at an input side of any one of the following as described above: the beamsplitter, the reflective optical element, or the birefringent material.
[0083] In various embodiments, the focusing optics 104 may be arranged at an output side of any one of the following as described above: the optical element (e.g., cylindrical lens, mirror), the beamsplitter, the reflective optical element, or the birefringent material.
[0084] In the context of various embodiments, it should be appreciated that the optics arrangement 102, or any optical element of the optics arrangement 102, may receive an input light, either in the form originating from the light source (whether directly from the light source or after having passed through one or more optical elements, e.g., an optical fiber, a shaping optics to shape the light, etc.), or in the form of a collimated beam as generated by the collimation lens described above.
[0085] In various embodiments, the optical imaging device 100 may further include a detector (e.g., an image detector) for generating the at least one image representing the section of the sample 1 10. The detector may receive the respective return lights 112a, 1 12b to generate the at least one image (for a non-interferometric imaging device) or the interference signal to generate the at least one image (for an interferometric imaging device, for example, for optical coherence tomography (OCT) applications). The detector may include a spectrometer, which may include at least one of a diffraction grating, a camera lens or a (single-line) CCD (charge-coupled device) camera.
[0086] In the context of various embodiments, the optical imaging device 100 as described may be used for non-interferometric imaging. For example, the optical imaging device 100 may not include a reference path or arm. The optical imaging device 100 may be used as a non-interferometric imaging device in circumstances where the image of or from each aperture 107a, 107b may be apart from each other in space and/or in time. Nevertheless, the optical imaging device 100 may also be used for interferometric imaging, to form one or more interference signals from the return light(s) and a reference light from a reference path or arm.
[0087] In the context of various embodiments, the optical imaging device 100 may provide multiple aperture interferometric refocusing (MAIR), e.g., in OCT.
[0088] In the context of various embodiments, the optical imaging device 100 may enable depth of focus (DOF) extension.
[0089] In the context of various embodiments, the axial direction may mean the direction along the optical axis of a light beam, while a direction along a plane perpendicular to the
axial direction may refer to the lateral direction or the transverse direction, where the lateral direction and the transverse direction may refer to the same direction. It should be appreciated that the term "lateral" and "transverse" may be interchangeably used. As an example, "lateral shifting" and "transverse shifting" may be interchangeably used.
[0090] Various embodiments may further provide an optics arrangement for imaging. The optics arrangement may include a focusing optics, wherein the optics arrangement may be configured to generate (or provide) (e.g., from an input light received by the optics arrangement) a plurality of (parallel) coherent light beams incident on the focusing optics to be focused to a common (single) focus point to illuminate a section of a sample, wherein the plurality of coherent light beams may define respective discrete apertures at respective different positions on the focusing optics, and wherein the optics arrangement may be further configured to receive respective return lights from the section of the sample. The respective return lights may travel or propagate along the optical paths of the plurality of coherent light beams. The return lights may be employed for generation of at least one image representing the section of the sample. In various embodiments, the optics arrangement may be used in or as part of an optical imaging device (e.g., 100, FIG. 1A).
[0091] FIG. IB shows a flow chart 120 illustrating a method for imaging, according to various embodiments.
[0092] At 122, a plurality of coherent light beams are generated (e.g., from an input light) and are incident on a focusing optics to be focused to a common focus point to illuminate a section of a sample, wherein the plurality of coherent light beams define respective discrete apertures at respective different positions on the focusing optics.
[0093] At 124, return lights, from the section of the sample, are received for generation of at least one image representing the section of the sample.
[0094] In various embodiments, at 122, an input light may be supplied to an optical element, and the optical element may be moved for generating the plurality of coherent light beams from the input light.
[0095] In various embodiments, at 122, an input light may be split by a beamsplitter to generate the plurality of coherent light beams.
[0096] In various embodiments, at 122, an input light may be reflected by at least two reflective surfaces to generate the plurality of coherent light beams.
[0097] In various embodiments, at 122, an input light may be transmitted through a birefnngent material to generate a plurality of polarized lights of different polarization directions as the plurality of coherent light beams. The method may further include changing an orientation of the polarization directions of the plurality of polarized lights.
[0098] In various embodiments, at 122, the plurality of coherent light beams may be generated from an input light provided in collimated form.
[0099] In various embodiments, the method may further include, for each return light of the return lights, forming an interference signal from the return light and a reference light for generation of the at least one image representing the section of the sample.
[0100] In various embodiments, the method may further include generating the at least one image representing the section of the sample, e.g., using the respective return lights themselves or the interference signals from the respective return lights and the reference light, depending on the mode or type of imaging.
[0101] It should be appreciated that descriptions in the context of the optical imaging device 100 may correspondingly be applicable in relation to the method for imaging described in the context of the flow chart 120.
[0102] The working principles of multiple aperture synthesis (MAS) or multiple aperture interferometric refocusing (MAIR) arrangement of various embodiments will now be described in details by way of the following non-limiting examples. The MAS technique may extend the DOF in a spectral domain OCT (SD-OCT), which is analogous to synthetic aperture radar (SAR).
[0103] FIGS. 2A and 2B show schematic views of an optical imaging device 200, according to various embodiments. The optical imaging device 200 may include a (micro)cylindrical lens (CL) 230 that may receive an input light propagated through a single mode fiber (SMF) 232. SMF 232 may act as a fiber pinhole. Light transmitted through the CL 230 may be received by a collimating lens (LI) 234 to provide an output collimated beam, which may then be received by a focusing optics, e.g., a focusing lens (L2) 204. The focusing lens 204 focuses the collimated beam to a focus point 208 on
a sample 210. Return lights from the sample 210 may then travel towards L2 204 for collection and detection for generation of images.
[0104] FIG. 2A shows the operation of the optical imaging device 200 where the input light or optical beam (e.g., a Gaussian beam) is centered (e.g., at CL 230) (or, in other words, CL 230 is centered at the fiber pinhole), while FIG. 2B shows the operation of the optical imaging device 200 where the input light or optical beam (e.g., a Gaussian beam) is laterally steered by shifting of the CL 230 (e.g., CL 230 is laterally (or transversely) shifted by a step size of AL.). Magnified views of the respective optical beam at CL 230 and the output of SMF 232 are also shown. The CL 230 may be steered bi-directionally laterally relative to the SMF 232. As shown in FIGS. 2A and 2B, a plurality of coherent light beams 206a, 206b may be generated, with the associated apertures (represented as white dashed lines 207a, 207b) on L2 204. The corresponding local wavefront (LWF) 236a, 236b are illustrated in FIGS. 2A and 2B. Additional coherent light beam(s), with the corresponding aperture(s), may be generated by moving the CL 230 laterally to different positions.
[0105] In greater details, FIGS. 2A and 2B illustrate the optical design to achieve far- field fast multiple-aperture scanning by use of near-field beam steering. As a non-limiting example, it may be used in either illumination or detection path of the sample arm in an Optical Coherence Tomography (OCT) system. It should be appreciated that near-field refers to the light field near the single mode fiber (SMF) core (i.e., SMF 232), while far- field refers to the light field between LI 234 and L2 204 that is collimated by LI 234.
[0106] As illustrated in FIG. 2A, the near-field beam steering element (the cylindrical lens 230) may be positioned at the tip of the sample fiber (SMF core) 232 (e.g., approximately 10 μ m away from the tip) with an axisymmetric configuration along the optical axis, with the curved face of the CL 230 facing the fiber 232. The curvature radius of the cylindrical surface is much larger than the mode field diameter of the SMF 232 such that the cylindrical surface may be equivalent to a flat surface in the near-field. The cylindrical lens 230 may be driven by a (linear) actuator 231 (shown in FIG. 2B), for example, a piezoelectric transducer (PZT) motor, so that it may be translated laterally along a direction that is perpendicular to the optical axis of the SMF 232. By translating the cylindrical lens 230 laterally, the sample beam to illuminate the sample 210 may be
steered by the changing curvature of the cylindrical lens surface according to the law of refraction (see FIG. 2B).
[0107] Since the light incident point on the cylindrical surface is at the back focal point of the collimation lens (LI) 234, the beam steering in the near field may introduce parallel shift to the collimated beam 206a, 206b in the far-field. Such an effect may be equivalent to scanning the collimated beam 206a, 206b across multiple apertures 207a, 207b in the pupil plane of the objective lens (L2) 204. For any beam steering angle in the near field, the corresponding far field beam orientation may be parallel to the optical axis of the SMF output. Therefore, light beams of all the near field angles may intersect at the focal point 208 of the objective lens 204 with a constant phase.
[0108] All light paths of the spatial (angular) frequencies originating from the fiber pinhole may be refracted sequentially by CL 230, LI 234, and L2 204, and they intersect at the focal point 208 of L2 204 with a substantially uniform phase or optical path length. Under such a condition, a maximal constructive interference may occur at this focal point 208, which may result in a diffraction-limited transverse point spread function (PSF). When CL 230 is linearly shifted along a lateral direction (or transverse direction) perpendicular to the cylindrical axis (of CL 230) by the actuator 231, the spatial or angular frequency of the sample beam with respect to the full aperture of the focusing lens L2 204 may be swept as the incidence angle at the curved surface of CL 230 changes. The aberration caused by the cylindrical lens 23 may not be noticeable and the resolution in the x and y transverse dimensions may be the same.
[0109] FIG. 2C shows, as a non-limiting example, five apertures generated by the optical imaging device 200, illustrating the effective optical apertures in or at the pupil plane (or focal plane) of the objective lens (L2) 204. The five apertures may be generated by lateral shifting (or transverse shifting) of CL 230, and are labelled "1" - "5" (the respective apertures are traced by dashed white circles in FIG. 2C). The term "AL" refers to the lateral shifting step size of the cylindrical lens 230. FIG. 2D shows a schematic view of the focusing beams corresponding to the five apertures "1" - "5", illustrating the spatial or angular frequency of the focused beams.
[0110] During image acquisition, an axial-line (A-line) may be acquired at each of the five equally spaced spatial frequencies and the five apertures may be synthesised together
as shown in FIG. 2E. In FIG. 2E, the term "LF" refers to low spatial frequency, while the term "HF" refers to high spatial frequency. Compared with known SD-OCTs, more high spatial frequency light signals of the sample reflectivity may be coherently synthesized, which may generate a larger aperture and an extended DOF.
[0111] The total optical path difference (OPD) between A-lines acquired in FIGS. 2A and 2B may be defined as Δz = Δzs + Δzc and composed of two components: Δzs, which may be induced by the lateral shift of CL 230, and Δzc, which is the defocusing term with Δzc = 0 at the focus of L2 204. For a scatter located away from the focal point 208, when these OPDs are corrected to 0, the A-lines with distinctive apertures may be coherently summed together to form a digitally synthesized aperture.
[0112] In details, during a beam steering cycle, a spectrometer exposure may be executed to acquire one A-line (axial line) for each beam steering position. The number of beam steering positions within each beam steering cycle may be configured, e.g., 5 positions in a cycle. Therefore, 5 A-lines may be obtained, with distinctive apertures at the pupil plane of the objective lens 204. For OCT, OCT interference signals from the focal point 208 acquired at different near field beam steering angles may add up constructively, whereas signals arising from a sample point other than the focal point 208 of the objective lens 204 may add up destructively. In this way, the effective detection numerical aperture (NA), which corresponds to the multiple apertures 207a, 207b at the pupil plane of the objective lens (L2) 204, may be augmented by summing up those interference signals acquired at multiple steering angles. The lateral resolution may also be improved since the effective numerical aperture may be improved.
[0113] By correcting the defocus-induced wavefront distortion, OCT interference signals from a particular defocused sample point acquired through multiple distinct apertures 207a, 207b may be summed up constructively. That is how this system may digitally correct the wavefront distortion and obtain a brand-new image with nearly constant lateral resolution over an extended depth-of-focus (DOF). Defocus-induced wavefront distortion may mean wavefront distortion caused by the defocus effect (see FIG. 6). Further, signals from a defocused sample point may refer to interested (or desired) signals from the sample above and/or below the focal plane.
[0114] As non-limiting examples, a closed-loop PZT with four embedded strain gauges and a travel range of about 15.7 m ι may be used for the actuator 231. The output diverging beam of the sample fiber 232 may have a full angular range (defined by the l/e power) of about 7.45 (= 4λ/πΔχ) deg, which may be determined by the spot diameter Δχ of the focused beam. The desired radius of CL 230 may be about 60 - 70 μm, which is based on the travel range of the PZT 231 and the fiber NA. CL 230 may be precisely grinded from a coreless silica termination fiber. The cross sectional width of CL 230 may be about 1 10 μm. The PZT 231 may be mounted on a two-axis goniometer and a three- axis compact stage.
[0115] FIGS. 3A to 3C show schematic views of an optical imaging device 300 and its related operations, according to various embodiments. The optical imaging device 300 may include a collimation lens (LI) 334 that may receive an input light propagated through a single mode fiber (SMF) 332 so as to output a collimated beam. A reflective optical element may be provided, e.g., a coated mirror (CM) 338, which is a custom-built mirror with reflective films 340a, 340b coated on the front and back surfaces. The CM 338 may reflect the collimated beam via the reflective films 340a, 340b to generate a plurality of coherent light beams or optical beams (representatively illustrated with the double-headed arrows 306a, 306b). The generation of the light beams 306a, 306b from the input light is traced by white arrows illustrated in FIG. 3A. As may be seen, the input light (traced by a white solid arrow) is reflected by the coated mirror 338 to generate a first coherent light beam 306a (traced by white dashed arrows) and a second coherent light beam 306b (traced by white dotted arrows) towards a sample 310. The parameter, Δd, is the transverse distance between the adjacent illumination beams 306a, 306b.
[0116] The coherent light beams 306a, 306b may be directed to a focusing optics, e.g., a focusing lens or objective lens (L2) 304, which define the corresponding (optical) apertures Al, A2 (represented by the boxes 307a, 307b) on L2 304 generated by the CM 338 (see also FIG. 3B showing a front view of L2 304). L2 304 may then focus the beams 306a, 306b to a focus point 308 on the sample 310. Return lights from the sample 310 may then travel towards L2 304 for collection and detection for generation of images, for example through apertures Al 307a and/or A2 307b. Accordingly, apertures
Al 307a and/or A2 307b may act as illumination apertures and detection apertures of the two optical beams 306a, 306b and the return lights.
[0117] In greater details, FIGS. 3A to 3C illustrate the principle of Fourier multiple aperture synthesis (FMAS) based on the use of a mirror, providing an optical design to achieve FMAS. In order to extend the DOF, a custom-built coated mirror (CM) 338 may be employed, for example, placed into the sample arm of an interferometric imaging device (e.g., for OCT). As non-limiting examples, the front surface of the CM 338 may be coated with a 40% reflective film 340a (i.e., light may be transmitted through), and the back surface may be coated with a 100% reflective film 340b. Multiple reflections on the front and back surfaces of the CM 338 may produce two illumination beams 306a, 306b as shown in FIG. 3A. The ratio of intensity between the apertures A1:A2 is about 40%:36%. All higher-order illumination beams are not considered, because they are relatively weaker and only contain about 24% intensity. As illustrated in FIG. 3B, the beams 306a, 306b define the two distinctive apertures Al 307a, A2 307b in the objective lens (L2) pupil plane.
[0118] The light back-reflected or back-scattered by the sample 310 may be divided into four parts by the illumination apertures and detection apertures, respectively. FIG. 3C shows the four possible round-trip light paths based on the illumination apertures and detection apertures (Al 307a, A2 307b). The four round-trip light paths are as follows:
[0119] (1) The round trip light path where the illumination light 306a travels via the illumination aperture Al 307a towards the sample 310 and the return light returns (scattered) along the same illumination aperture Al 307a (or detection aperture for the return light) but in the opposite direction away from the sample 310 is called the A1A1- path.
[0120] (2) The round trip light path where the illumination light 306b travels via the illumination aperture A2 307b towards the sample 310 and the return light returns (scattered) along the same illumination aperture A2 307b (or detection aperture for the return light) but in the opposite direction away from the sample 310 is called the A2A2- path.
[0121] (3) The round trip light path where the illumination light 306a travels via the illumination aperture Al 307a towards the sample 310 and the return light returns
(scattered) along the illumination aperture A2 307b (or detection aperture for the return light) but in the opposite direction away from the sample 310 is called the AlA2-path.
[0122] (4) The round trip light path where the illumination light 306b travels via the illumination aperture A2 307b towards the sample 310 and the return light returns (scattered) along the illumination aperture Al 307a (or detection aperture for the return light) but in the opposite direction away from the sample 310 is called the A2Al-path.
[0123] The transverse distance, Ad, between two adjacent beams (e.g., 306a, 306b) may be determined by the geometrical thickness (e.g., t = 0.5 mm), the refractive index (n = 1.5 @ 800 nm) and the inclination angle ( θ = 45°) of the CM 338 as Adcm =
, which is about


arising due to the defocus-induced local wavefront distortion (WD) is defined as ΔzWD, then, the single pass (either illumination or detection) OPD between two adjacent beams is Δz = ΔzCM + ΔzWD- There may be three kinds of OPDs, including 0, Δz and 2Δζ, and three sub-images may equally align along the depth dimension in one cross-sectional scan (B-scan).
[0124] FIGS. 4A to 4C show schematic views of an optical imaging device 400 and its related operations, according to various embodiments. The optical imaging device 400 may include a collimation lens (LI) 434 that may receive an input light propagated through a single mode fiber (SMF) 432 so as to output a colhmated beam. A beamsplitter (BS) 438 may be provided in the optical path of the collimated beam. The BS 438 may have reflective films 440a, 440b coated respectively on the first and second surfaces, SI and S2. The BS 438 may split the collimated beam to generate a plurality of coherent light beams or optical beams (representatively illustrated with the double- headed arrows 406a, 406b). The generation of the light beams 406a, 406b from the input light is traced by white arrows illustrated in FIG. 4A. As may be seen, the input light (traced by a white solid arrow) may be reflected by the reflective films 440a, 440b so that the input light is split to generate a first coherent light beam 406a (traced by a white dashed arrow) and a second coherent light beam 406b (traced by white dotted arrows)
towards a sample 410. The parameter, Ad, is the transverse distance between the adjacent illumination beams 406a, 406b.
[0125] The coherent light beams 406a, 406b may be directed to a focusing optics, e.g., a focusing lens or objective lens (L2) 404, which define the corresponding (optical) apertures Al, A2 (represented by the boxes 407a, 407b) on L2 404 generated by the BS 438 (see also FIG. 4B showing a front view of L2 404). L2 404 may then focus the beams 406a, 406b to a focus point 408 on the sample 410. Return lights from the sample 410 may then travel towards L2 404 for collection and detection for generation of images, for example through apertures Al 407a and/or A2 407b. Accordingly, apertures Al 407a and/or A2 407b may act as illumination apertures and detection apertures of the two optical beams 406a, 406b and the return lights.
[0126] In greater details, FIGS. 4A to 4C illustrate the principle of Fourier multiple aperture synthesis (FMAS) based on the use of a beamsplitter, providing an optical design to achieve FMAS. A beam splitter (BS) 438 may be employed, for example, placed into the sample arm of an interferometric imaging device (e.g., for OCT). The BS 438 is a custom-built cube of which the first surface, SI, may be coated with a 50% reflective film 440a (i.e., light may be transmitted through), and the second surface, S2, may be coated with a 100% reflective film 440b. Multiple reflections on the first and second surfaces, SI and S2, of the BS 438 may produce two illumination beams 406a, 406b as shown in FIG. 4A. The ratio of intensity of the two illumination beams 406a, 406b is about 50%:50%. As illustrated in FIG. 4B, the beams 406a, 406b define the two distinctive apertures Al 407a, A2 407b in the objective lens (L2) pupil plane.
[0127] The light back-reflected or back-scattered by the sample 410 may be divided into four parts by the illumination apertures and detection apertures, respectively. FIG. 4C shows the four possible round-trip light paths based on the illumination apertures and detection apertures (Al 407a, A2 407b). The four round-trip light paths are as follows:
[0128] (1) The round trip light path where the illumination light 406a travels via the illumination aperture Al 407a towards the sample 410 and the return light returns (scattered) along the same illumination aperture Al 407a (or detection aperture for the return light) but in the opposite direction away from the sample 410 is called the A1A1- path.
[0129] (2) The round trip light path where the illumination light 406b travels via the illumination aperture A2 407b towards the sample 410 and the return light returns (scattered) along the same illumination aperture A2 407b (or detection aperture for the return light) but in the opposite direction away from the sample 410 is called the A2A2- path.
[0130] (3) The round trip light path where the illumination light 406a travels via the illumination aperture Al 407a towards the sample 410 and the return light returns (scattered) along the illumination aperture A2 407b (or detection aperture for the return light) but in the opposite direction away from the sample 410 is called the AlA2-path.
[0131] (4) The round trip light path where the illumination light 406b travels via the illumination aperture A2 407b towards the sample 410 and the return light returns (scattered) along the illumination aperture Al 407a (or detection aperture for the return light) but in the opposite direction away from the sample 410 is called the A2Al-path.
[0132] The transverse distance between two adjacent beams (e.g., 406a, 406b) may be defined as Δdss- The refractive index of the BS 438 may be n = 1.5 @ 800 nm, and the inclination angle of the first coating surface, SI , of the BS 438 may be denoted as Θ. The single pass optical path difference (OPD) between two adjacent beams (e.g., 406a, 406b) may be defined as ΔzBS = n (ΔdBS/sin2 θ + ΔdBS/tan θ). If the small extra OPD arising due to the defocus-induced local wavefront distortion (WD) is defined as ΔzWD, then, the single pass OPD between two adjacent beams is Δz = ΔzBS + ΔzWD- There may be three kinds of OPDs, including 0, Δz and 2Δz, and three sub-images may equally align along the depth dimension in one B-scan.
[0133] FIGS. 5A to 5D show schematic views of an optical imaging device 500 and its related operations, according to various embodiments. The optical imaging device 500 may include a collimation lens (LI) 534 that may receive an input light propagated through a single mode fiber (SMF) 532 so as to output a collimated beam. A birefringent material, for example a calcite spacer (CS) 538, may be provided in the optical path of the collimated beam. The CS 538 may split the collimated beam to generate a plurality of coherent light beams or optical beams (representatively illustrated with the double - headed arrows 506a, 506b). The generation of the light beams 506a, 506b from the input light is traced by white arrows illustrated in FIG. 5A. As may be seen, the input light
(traced by a white solid arrow) may be refracted by the CS 538, where different components of the input light may travel along different optical paths so as to generate a first coherent light beam 506a (traced by white dashed arrows), in the form of an extraordinary ray, and a second coherent light beam 506b (traced by a white dotted arrow), in the form of an ordinary ray, towards a sample 510. See also FIG. 5B illustrating, in greater details, the generation of light beams 506a, 506b by the CS 538 from an input or incident light 540. FIG. 5B shows a cross-sectional view of the calcite spacer 538 illustrating the fast axis and slow axis of the calcite spacer 538 and the optical axis (OA) of the calcite spacer (CS) 538.
[0134] The coherent light beams or rays 506a, 506b may be directed to a focusing optics, e.g., a focusing lens or objective lens (L2) 504, which define the corresponding (optical) apertures Al , A2 (represented by the boxes 507a, 507b) on L2 504 (see also FIG. 5C showing a front view of L2 504). L2 504 may then focus the beams 506a, 506b to a focus point 508 on the sample 510. Return lights from the sample 510 may then travel towards L2 504 for collection and detection for generation of images, for example through apertures Al 507a and/or A2 507b. Accordingly, apertures Al 507a and/or A2 507b may act as illumination apertures and detection apertures of the two optical beams 506a, 506b and the return lights. In FIG. 5A, the apertures 507a, 507b are shown shifted out of plane relative to each other for clarity and ease of understanding purposes to illustrate the extent of the distinct, but partially overlapping, apertures 507a, 507b.
[0135] Referring to FIGS. 5A and 5B, the notation "o" refers to the ordinary ray ("o- ray") 506b while the notation "e" refers to the extraordinary ray ("e-ray") 506a. The notation "PS" refers to principle section. The notation "OA" refers to the optical axis of the calcite spacer 538 in the plane of the paper. The notation "FA" refers to the fast axis of the calcite spacer 538. The parameter, d, is the physical length of the calcite spacer 538. The parameter, Ad, is the transverse distance that the o-ray 506b and the e-my 506a are separated. The parameter, , is the angle that the o-ray 506b and the e-ray 506a are separated in the CS 538. The parameter, φ, is the angle between the optical axis of the collimated light (o-ray 506b) and the optical axis (OA) of the CS 538. The parameter, Θ, is the angle between the e-ray 506a and the optical axis (OA) of the CS 538.
[0136] In greater details, FIGS. 5A to 5D illustrate the principle of Fourier multiple aperture synthesis (FMAS) based on the use of a birefringent material. A birefringent calcite (or calcite spacer) 538 may be employed, for example, placed into the sample arm of an interferometric imaging device (e.g., for OCT). The fast axis (FA) of the calcite spacer 538 is parallel to the interface plane 542 between air and the calcite spacer 538. The light output from the single mode fiber (SMF) 532 undergoes refraction at the interface plane 542. The part or portion of the light from the SMF 532 with the polarization direction along the fast axis of the CS 538 may travel in the CS 538 as the o- ray") 506b; the rest of the SMF light with the polarization direction perpendicular to the fast axis of the CS 538 may travel in the CS 538 as the e-ray 506a. The e-ray 506a and the o-ray 506b are separated by Φ in the CS 538 and Ad in the direction parallel to the slow axis. In the pupil plane of the focusing lens (L2) 504, the apertures 507a, 507b occupied by the e-ray 506a and the o-ray 506b may be different, forming two distinct apertures. Referring to FIG. 5B illustrating the principle of birefringence in greater detail, the optical axis of the collimated light 506a, 506b may be angled with respect to the optical axis of the CS 538. The refractive index, n, of the CS 538 is about 1.6474 and 1.4813 respectively for the o-ray 506b and the e-ray 506a at 850 nm.
[0137] A polarization analyzer (not shown), e.g., a half wavelength plate, may be placed at the output side of the CS 538. The optical axis of the polarization analyzer may be at about 45° with respect to the fast and slow axis of the CS 538. Both the o-ray 506b and the e-ray 506a may travel through the polarization analyzer after passing through the calcite spacer 538. The analyzer may rotate the polarization direction of the o-ray 506b and the e-ray 506a by 45° in the illumination paths of the the o-ray 506b and the e-ray 506a, so that after passing through the polarization analyzer, the polarization directions of both the o-ray 506b and the e-ray 506a may be the same as the optical axis of the polarization analyzer.
[0138] The illumination light, including the the o-ray 506b and the e-ray 506a, may be back-reflected or back-scattered by the sample (e.g., tissue) 510. Referring to FIG. 5D, the light back-reflected or back-scattered by the sample 510 may be divided into four parts by the illumination paths (o-ray 506b and e-ray 506a) and detection paths (o-ray
506b and e-ray 506a), respectively. The four possible round-trip light paths based on the illumination apertures and detection apertures (Al 407a, A2 407b) are as follows:
[0139] (1) The round trip light path where the light follows the illumination path of the o- ray 506b (via the aperture A2 407b) towards the sample 510 and the return light returns (scattered) along the same illumination path of the o-ray 506b (via the aperture A2 407b) but in the opposite direction away from the sample 510 is called the oo-path, with the light known as the oo-light.
[0140] (2) The round trip light path where the light follows the illumination path of the e- ray 506a (via the aperture Al 407a) towards the sample 510 and the return light returns (scattered) along the same illumination path of the e-ray 506a (via the aperture Al 407a) but in the opposite direction away from the sample 510 is called the ee-path, with the light known as the ee-light.
[0141] (3) The round trip light path where the light follows the illumination path of the o- ray 506b (via the aperture A2 407b) towards the sample 510 and the return light returns (scattered) along the illumination path of the e-ray 506a (via the aperture Al 407a) but in the opposite direction away from the sample 510 is called the oe-path, with the light known as the oe-light.
[0142] (4) The round trip light path where the light follows the illumination path of the e- ray 506a (via the aperture Al 407a) towards the sample 510 and the return light returns (scattered) along the illumination path of the o-ray 506b (via the aperture A2 407b) but in the opposite direction away from the sample 510 is called the eo-path, with the light known as the eo-light.
[0143] The single-trip optical path difference (OPD) between the o-ray 506b and the e- ray 506a may be defined as Δz. So, the round-trip optical path length (OPL) of the ee- light is 2Δz longer than that of the oo-light, and the round-trip OPL of the oe-light and the eo-light is Δz longer than that of the oo-light. There may be three kinds of OPDs, including 0, Δz and 2Δz, and three sub-images may equally align along the depth dimension in one cross-sectional scan (B-scan). Δz may be defined as Δz = Δz1 + Δz2 +

the OPD in the focal light of the focusing lens (L2) 504, Δzw is caused by the difference
between the two local wavefronts (LWFs) corresponding to the two distinctive apertures 507a, 507b occupied by the e-ray 506a and the o-ray 506b, respectively, d is the physical length of the CS 538, na and ne are the respective refractive index of the CS 538 for the o-ray 506b and the e-ray 506a, na is the refractive index of air, is the angle that the o-ray 506b and the e-ray 506a are separated in the CS 538, /is the focal length of the lens L2 504, Ad is the transverse distance that the o-ray 506b and the e-ray 506a are separated, which may be given by

the ang\e between the optical axis of the collimated light

and the optical axis of the CS 538, where ^ may be set optimally to 45° or another acute angle.
[0144] It should be appreciated that various embodiments as described herein may be combined with one another to form an optics arrangement or an optical imaging device.
[0145] Further, it should be appreciated that description provided in the context of an optics arrangement or an optical imaging device of one embodiment may correspondingly be applicable to that of another embodiment.
[0146] Methods to correct wavefront distortion
[0147] In the classical theory of FD-OCT, the detected interference signal, I(kz), in kz- space, including a direct-current (DC) term, a cross-correlation (CC) term, and an auto- correlation (AC) term, may be represented by the following simplified formulation:
 where
where
 is the CC term, S(kz) is the spectral distribution of the light source, and F(kz) and F(kz) are the respective electric field reflectivity from the reference arm and the sample arm at the depth of z. The DC term is a pathlength- independent bias, and its amplitude is proportional to the sum of the power from the reference and sample arms. The AC term is generally composed of the interference signals between different sample tissue depths, and may serve as artifacts in OCT images.
[0148] A theoretical model for Fourier multiple aperture synthesis (FMAS) may be formulated following the classical optics. Based on the physical basis of Fourier-domain OCT, the OT-th depth-encoded signal in FMAS may be expressed as
is the CC term, S(kz) is the spectral distribution of the light source, and F(kz) and F(kz) are the respective electric field reflectivity from the reference arm and the sample arm at the depth of z. The DC term is a pathlength- independent bias, and its amplitude is proportional to the sum of the power from the reference and sample arms. The AC term is generally composed of the interference signals between different sample tissue depths, and may serve as artifacts in OCT images.
[0148] A theoretical model for Fourier multiple aperture synthesis (FMAS) may be formulated following the classical optics. Based on the physical basis of Fourier-domain OCT, the OT-th depth-encoded signal in FMAS may be expressed as

where is the spectral distribution of the light source, and fm(kz) and
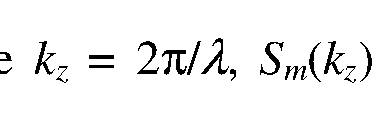
are the respective backscattering intensity from the reference arm and the sample

arm at the depth of z.
[0149]
 DCm and ACm may be omitted for the sake that only the complex field amplitude, is considered in the next step,


[0150] Inverting Equation (3) using one-dimensional inverse Fourier transform
 yields

That is the signal from a single axial depth scan (A-scan), and a cross-sectional x— z image (B-scan) may be achieved by laterally combining a series of these

axial depth scans. Based on m collected out-of-focus intensity images, an in-focus image of the B-scan image may be computationally reconstructed following the recovery procedure as described below.
[0151] Step 1 :
[0152] To recover the phase error for the detected signal from each aperture, the sample plane in the near field zi may first be calculated based on the Fresnel diffraction equation and geometry of scalar diffraction (see FIG. 7), and Zi takes positive values on the right- hand-side of the focal plane (z = 0). At the distance zi of a given transverse line from the focus plane, the propagation factor is
 where no is the refractive index of the sample and kx is the spatial frequency in x-dimension.
[0153] Equation (5) may be used for the image:

where
 is the distance from the focus plane z = 0, which may be calculated as being the axial pixel number, rax being the axial

resolution and no being the estimated refractive index of the sample, which is assumed to be at least substantially uniform, k is the spatial frequency, and kx is the spatial frequency in x-dimension. It should be noted that
 here is the image propagated from

[0154] So the initial recovered term in step 1, is operated in the kx

space and the reconstructed image is After a coarse estimate of

the defocus displacement zi from the focal plane is calculated the accurate phase oscillation term may be refined coherently summing m

sub-images located at different axial depths into one single image, and Equation (5) may be rewritten as

where
 js restricted in the phase set

[0155] Step 2:
[0156] When the criterion
 reaches its maximum value,
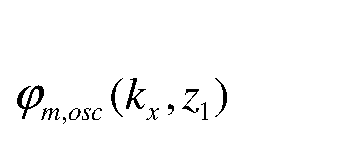 achieves its optimal value
 Then, the resultant image with m distinctive apertures synthesized may be given by

[0157] The digitally synthesied image not only refocuses the defocused sample and preserve the diffraction-limited transverse resolution over a multiple-time extended DOF, but also increases the total backscattered intensity.
[0158] In other words, MAS may achieve optimal constructive interference at the center of the scatter and destructive interference away from the center, which not only may increase the total backscattered intensity but may also preserve the diffraction-limited transverse resolution over a DOF extended multiple times.
[0159] Numerical analysis
[0160] The image formation in an OCT system may be described by a coherence transfer function (CTF), which is the Fourier transform of the effective point spread function (PSF). p(m; n) may be defined as the pupil function (PF) of the objective lens (e.g., used for focusing light beams onto the sample), where m and n are the corresponding radial spatial frequencies in two transverse directions. Because the light passes the objective lens twice, the 2D CTF may be obtained by convolving PFs of the illumination and detection aperture as

where represents the 2D convolution operation, /represents the focal length of the

objective lens and λ represents the wavelength of the illumination light.
[0161] The PSFs are the Fourier transform of the CTFs in two transverse directions and may be calculated as

where x and y denote the variables on the plane perpendicular to the optical axis and z is the axial variable.
[0162] Numerical simulations were performed using MATLAB software to characterize the PFs, PSFs, and CTFs of the MAS technique with respect to known methods. Three aperture types in the illumination and detection paths were considered: full aperture, annular apodized aperture, and MAS. FIGS. 15, and 16A to 16D show the results of the numerical simulations. In FIG. 15, images (a) - (c) respectively show the PFs of a full aperture, an annular apodized aperture and an MAS, images (d) - (f) respectively show the two-dimensional (2D) coherent transfer functions (CTFs) of a full aperture, an annular apodized aperture, and an MAS in the focal plane as a function over the transverse (m and n) spatial frequencies, images (g) - (i) respectively show the 2D CTFs
of a full aperture, an annular apodized aperture, and an MAS as a function over the transverse spatial frequency (m) and axial (z) dimensions, and images (j) - (1) respectively show the 2D PSFs of a full aperture, an apodization, and an MAS as a function over the transverse (x) and axial (z) dimensions. FIGS. 16A and 16B show the transverse CTFs in the focal plane and at an out-of-focus plane of z = b (where b is the confocal parameter), respectively. FIGS. 16C and 16D show the transverse PSFs in the focal plane and at an out-of-focus plane of z = b and z = 10b. The intensities in FIGS. 15, and 16A to 16D are normalized by their maximum values.
[0163] The radius of the full aperture was defined as 1 (Image (a), FIG. 15) and the radius of the annularly apodized aperture was defined as 0.7 (Image (b), FIG. 15). In the case of MAS, five apertures were equally spaced with a lateral spacing of 0.25 as indicated by the numbers "1" - "5" (Image (c), FIG. 15). Under the condition of Gaussian illumination, the CTFs (FIG. 15, images (d) - (f)) corresponding to the full aperture, annular apodized aperture, and MAS (FIG. 15, images (a) - (c)) were obtained by convolving the PFs of the illumination and detection aperture. The 2D CTFs (FIG. 15, images (d) - (f)) show that although the annular apodized aperture produces the largest frequency range, the cutoff spatial frequency of the MAS and full aperture is much greater than that of the apodization. The MAS technique has a better transverse CTF than the full aperture in the focal plane (see FIG. 16A), and even has a similar transverse CTF as the full aperture at an out-of-focus plane of z = b (see FIG. 16B), where b is the confocal parameter. It is possible to obtain 2D PSFs (FIG. 15, images (j) - (1)) via the Fourier transform of CTFs in two transverse directions. The apodized aperture produces the largest DOF but the worst sidelobes (-17.5 dB; FIG. 15, image (k)). Both transverse PSFs of the full aperture (FIG. 15, image (j)) and MAS (FIG. 15, image (1)) have insignificant sidelobes (<— 61.9 dB and -46.4 dB, respectively), compared with the sidelobe of -20 dB for a known technique. However, the DOF of the MAS (FIG. 15, image (1)) is much greater than that of the full aperture (FIG. 15, image (j)). The FWHM transverse spot size of the full aperture doubles at depth b, whereas that of the apodized aperture and MAS are expanded by 13.9% and 73.0% (FIG. 16D) at depth 10b, respectively. These results indicate that the MAS technique may extend the DOF by a value that is more than 10 times that of the full aperture.
[0164] MAS or MAIR OCT imaging system design
[0165] FIG. 8 shows a schematic view of an optical imaging device 850, according to various embodiments. The optical imaging device 850 may be an optical coherence tomography (OCT) device or system (e.g., SD-OCT (spectral domain optical coherence tomography)).
[0166] The optical imaging device 850 may include a light source 852, for example, a superluminescent diode (SLD) array capable of providing a broadband spectrum ranging from about 600 nm to about 900 nm. The SLD light source 852 may provide a full width at half maximum (FWHM) bandwidth of about 165 nm centered at about 850 nm. Light from the SLD 852 (whose total output power may be about 18.0 mW) may be split by a wideband fiber-optic coupler, e.g., a 2x2 (e.g., 90: 10) wavelength-flattened fiber-optic coupler (OCl) 854. Light from the SLD 852 may be split by OCl 854 into a sample light beam and a reference light beam with a splitting ratio of 90: 10. The sample light beam may be provided into a sample arm 856a via a polarization controller element (PC2) 858a, and the reference light beam may be provided into a reference arm 856b via a polarization controller element (PCI) 858b. PCI 858b and PC2 858a may be optional.
[0167] In the reference arm 856b, the light beam may be collimated by a (collimating) lens (LI) 860 to transmit through a neutral density filter (NDF) 861, and then focused by a (focusing) lens (L2) 862 onto a reference mirror (RM) 863. Light may then be reflected by the RM 863 towards the OCl 854. The reflected light may define a reference light for interference. L2 862 and RM 863 may be moved, either individually or together, to match the path length between the sample arm 856a and the reference arm 856b.
[0168] In the sample arm 856a, the light beam may be transmitted through a (micro)cylindrical lens (CL1) 830, which may then be collimated by a (collimating) lens (L3) 865 to project, via a beamsplitter (BS1) 866, onto a galvo scanner (GS) 867, and subsequently may be focused by an objective (or focusing) lens (L5) 804 to a focus point 808 on a sample 810. From OCl 854, a fiber 859 may transmit the sample light beam to CL1 830. The mode field diameter (MFD) of the fiber 859 may be about 5.0 ± 0.5 μ m (defined by the lie field) at 850 nm. CL1 830 may be moved or driven by a closed-loop piezoelectric transducer (PZT) 831. CL1 830 may be moved in a direction
perpendicular to the optical axis of the light in the sample arm 856a. BSl 866 may be inserted in the sample arm 856a to build up a dark-field apparatus. The galvo scanner 867 may be movable to scan the illumination light across the sample 810.
[0169] The return light or backscattered light from the sample 810 may travel along a similar optical path back through L5 804, GS 867 and BSl 866. At BSl, the return light may be directed towards a (collimating) lens (L4) 868 to be collimated and/or focused by the lens (L4) 868 and guided to another wideband fiber-optic coupler (OC2) 855, e.g., a 2 x 2 fiber-optic coupler with a splitting ratio of 90: 10. The light from the two arms 856a, 856b (e.g., the reference light and the return light) may then be directed into a spectrometer 870 via the coupler 855. The light beams from the two arms 856a, 856b may be combined in the coupler 855, which may facilitate interference between the reference light and the return light to form an interference signal to be received by the spectrometer 870 acting as a detector. Optionally, a polarization controller may be provided in the optical path between L4 868 and OC2 855.
[0170] While not shown, it should be appreciated that, a plurality of coherent light beams and the corresponding apertures, as described above, may be employed in the optical imaging device 850. Further, it should be appreciated that, in addition to or alternative to the CLl 830, other (optical) elements or devices as described herein for various embodiments may be employed in the sample arm 856a. It should also be appreciated that propagation of light between optical elements may be by means of an optical fiber.
[0171] In operation, in order to extend the focal depth, the sample (illumination) beam may be steered by changing the curvature of the cylindrical lens (CLl) surface, which may be placed at the tip of the sample fiber 859 and driven by a PZT 831 laterally. Multiple spectrometer exposures may be executed during each beam steering cycle to acquire multiple A-lines with distinctive apertures at the pupil plane of the objective lens (L5) 804. Images captured through the multiple distinctive apertures may be encoded in multiple distinct depths in B-scan. By correcting the optical path difference and defocus- induced wavefront curvature, images with distinct apertures may be coherently summed together, which may enable the system to synthetize multiple apertures and extend the depth of focus (DOF).
[0172] The spectrometer 870 may include a (collimating) lens (L6) 871 (which may be achromatic), a transmission diffraction grating (G) 872 (e.g., a 1765 line/mm diffraction grating), a camera lens (L7) 873 (e.g., 85 mm, f/1.4), and a camera (e.g., a single-line charge-coupled device (CCD) camera; a 4096-pixel CCD camera) 874. The spectrometer efficiency may include the grating diffraction efficiency, the camera lens efficiency and the CCD quantum efficiency. The detected spectrum may be digitized (e.g., at 12-bit resolution) and transferred to a workstation (WS) (or a computer) 877 via an image acquisition board (IMAQ) 876 and two camera link cables.
[0173] Two-directional transverse scanning may be implemented by two galvanometer- mounted mirrors driven (in GS 867) with sawtooth pulses, which may be generated by an analog voltage driver including a data acquisition (DAQ) board (not shown) (e.g., which may provide a 16-bit analog output) and a shielded connector block (not shown). The spectrum acquisition trigger may be generated by the workstation 877, or an external trigger from a DAQ digital output may be provided, which may be used to synchronize the camera 874 for image capture and the scanning device 867 for two-directional transverse scanning. A discrete Fourier transform may be performed on each frame of the 1024 A-lines obtained by the CCD 874 to produce an axial depth profile of the sample 810. [0174] Signal processing methods to generate MAIR OCT images
[0175] FIG. 9 compares the OCT image retrieval process using the MAIR method (see flowchart 990) of various embodiments with that using the known FFT method (see flowchart 998). Compared with the FFT method 998, the MAIR method 990 has three distinguishing steps. In the first distinguishing step 991, all images are axially shifted, and then the optical path difference between multiple OCT images captured by distinctive apertures is corrected by multiplexing an additional phase term according to the Fourier shift theorem. In the second distinguishing step 992, all images are laterally shifted to eliminate the lateral position differences between multiple OCT images caused by the curvature of the cylindrical lens. In the third distinguishing step 993, the phase correction aims to correct the wave-front curvature induced by defocusing. An assessment standard may be set for optimal MAIR performance in 994. Finally, multiple OCT images are
synthetized into one MAIR OCT image, in which the lateral resolution may be preserved along a larger depth-of-focus.
[0176] Results of MAIR OCT to improve lateral resolution
[0177] To demonstrate the DOF extension of the MAIR OCT, imaging was conducted using polystyrene calibration microbeads (or microparticles) sample. A phantom of polystyrene calibration microparticles was constructed by mixing agarose solution with polystyrene microparticles. This mixture was stored in a vial and placed in an ultrasonic bath for 10 minutes to remove residual clusters. A sample (about 10 g) was poured into a cell culture dish, cured for 30 minutes at 100°C and then cured for 24 hours at room temperature.
[0178] Five cross-sectional scans or B-scans (m = 5), which corresponded to five lateral shifts of the micro-cylindrical lens with five distinctive apertures, were acquired using the MAIR OCT system of various embodiments. One of them is shown in image (a) of FIG. 10A. Image (b) of FIG. 10A is the obtained cross-section scan using dispersion- compensation algorithm. This algorithm employs the autoregressive spectral estimation (SE) technique instead of the inverse Fourier transform to analyze the spectral interferograms, which may improve the axial resolution. SE-OCT addresses or breaks the coherence length limitation and improves the axial resolution. Furthermore, SE-OCT may provide complete sidelobe suppression in the depth point-spread function, further improving the image quality. It is evident from image (b) that the cross-sectional scans suffered from defocusing beyond the focus. The process of MAS or MAIR includes two steps: axial-shift and phase-correction. The results of axial-shift, which is the first step of MAS, and phase-correction (or defocusing correction), which is the second step of MAS, are shown in images (c) and (d) respectively of FIG. 10A. In FIG. 10A, images (a') - (d') show the enlarged views of two calibration beads located in the dashed boxes (indicated by arrows for clarity) in images (a) - (d) respectively.
[0179] As the mode field diameter (MFD) (defined by 1/e field) is about 5.0±0.5 μ m, the theoretical lateral full width at half maximum (FWHM) of the point spread function (PSF) at focus is estimated to be about 2.92 μ m, together with a DOF of about 16.01 μ m at a center wavelength of about 850 nm. The lateral FWHMs of 50 random microbeads
were measured at different depths corresponding to images (b) and (d) of FIG. 10A, and, then, a 10-order polynomial-fitting of such measured values was performed. The results are shown in FIG. 10B. The finest lateral FWHM of the refocused microbeads is about 9.06 μ m, which means that the finest nominal lateral FWHM of the PSF is 3.06 μ m (the FWHM of the PSF is equal to the FWHM of the refocused microbeads (9.06 μm ) minus the real microbeads size (6 μm )) with a DOF of about 17.30 μ m. Such measurement results agree substantially well with theoretical results. The DOF is estimated to be within the depth range of approximately 910-927 μm , where the two fitted lines in FIG. 10B cross or intersect each other. Over the full axial depth range of about 1030 μm (n = 1.33), the defocused maximum, averaged, and minimum lateral FWHMs of the microbeads (corresponding to image (b) of FIG. 10A) are about 39.34 μm , about 20.16 μm and about 9.26 μ m, respectively, so, the maximum, averaged, and minimum lateral FWHMs of the PFSs are about 33.34 μm , about 14.16 μ m and about 3.26 μm . In contrast, the refocused maximum, averaged, and minimum lateral FWHMs of the microbeads (corresponding to image (d) of FIG. 10A) are about 13.64 μm , about 11.21 μm and about 9.06 μm , so the maximum, averaged, and minimum lateral PFSs are about 7.64 μm , about 5.21 μm and about 3.06 μ m, respectively. Therefore, the MAIR-OCT system may achieve constructive interference in the center and destructive interference on the edge part of the focus spot, and thus, may preserve the diffraction-limited lateral resolution over the full axial depth, and obtain a DOF extension of -10 times, consistent with the results of the numerical simulation described above.
[0180] In order to demonstrate the DOF extension performance in biological tissues, two imaging experiments were conducted on fresh grapes and rat adipocytes ex vivo.
[0181] FIGS. 11A to HE show the resultant images for the fresh grape sample for purposes of verifying the DOF extension performance, where FIG. 1 1A shows the dispersion-compensated B-scan while FIG. 1 1B shows the digitally refocused B-scan, with a size of about 1747 μm (transverse) x 1069 μm (axial). As indicated in FIGS. 11A and 11B, two local areas at depths of about 329 μm and about 760 μm from the focus (represented by the dashed line in FIG. 11 A) were selected and magnified by a factor of two and the results are shown in FIGS. 1 1C and 1 ID.
[0182] FIG. l lC shows parts of the B-scan of FIG. 11A and the associated transverse profiles indicated by the dashed lines in FIG. 11C. The upper image and the upper transverse profile of FIG. 11C correspond to the part of the B-scan of FIG. 11 A located in the dashed box (indicated by a dashed arrow for clarity) in FIG. 11A at about 760 μ m from the focus, while the lower image and the lower transverse profile of FIG. 11C correspond to the part of the B-scan of FIG. 11 A located in the dotted box (indicated by a dotted arrow for clarity) in FIG. 11A at about 329 μ m from the focus.
[0183] FIG. 11D shows parts of the B-scan of FIG. 11B and the associated transverse profiles indicated by the dashed lines in FIG. 11D. The upper image and the upper transverse profile of FIG. 1 ID correspond to the part of the B-scan of FIG. 1 IB located in the dashed box (indicated by a dashed arrow for clarity) in FIG. 11B at about 760 μ m from the focus, while the lower image and the lower transverse profile of FIG. 11D correspond to the part of the B-scan of FIG. 1 IB located in the dotted box (indicated by a dotted arrow for clarity) in FIG. 1 IB at about 329 μ m from the focus.
[0184] After MAS was applied (see FIG. 11B), the blurred cell walls were digitally refocused and became sharper and brighter. The transverse profiles corresponding to the positions indicated by the respective dashed lines show that the cell-wall widths were sharpened from about 27.7 μ m and about 21.3 μ m to about 5.7 μ m and about 7.4 μηι, respectively. The transverse profiles obtained show that the defocused cell wall was well digitally refocused.
[0185] Anisotropy is an effective indicator of image sharpness, and may increase as the blur diminishes. In order to quantitatively determine the image quality and assess its improvement, the anisotropy ratio of the digitally refocused B-scan to the dispersion- compensated B-scan was calculated over the whole depth range, and the results are shown in FIG. HE. Over the depth range from about 130 μ m to 920 μ m, the anisotropy ratio is greater than 1 and fluctuates around 1.2, which means that the transverse resolution is dramatically improved. Over the depth range from 1 μ m to 130 μ m, the anisotropy ratio is less than 1 due to strong reflection on the tissue surface. Two valleys of the anisotropy ratio at depths of about 930 μ m and 980 μ m are generated due to visible line artifacts in the transverse direction and limited image intensity. Over the whole depth
range from about 30 μ m to 1069 μ m, it may be observed that MAS demonstrates a dramatic refocusing performance.
[0186] To further demonstrate this DOF advantage and to verify the DOF extension performance, imaging was conducted on a rat adipocyte sample with variable refractive index ex vivo. The resultant B-scan of application of MAS to the rat adipocyte tissue with a size of about 1747 μηι (transverse) x 684 μ m (axial) is shown in FIG. 12B. Over most of the depth range, the transverse resolution was improved, as may be observed by cell boundaries becoming sharper and brighter, and detailed features were clearly reconstructed compared with the features in the original dispersion-compensated B-scan as shown in FIG. 12A. Intact features of the adipocyte cell structures at the bottom of the B -scans were difficult to recover because of the limited laser power.
[0187] As indicated in FIGS. 12A and 12B, two local areas at depths of about 382 μ m and about 415 μ m from the focus (represented by the dashed line in FIG. 12A) were selected and magnified four times and the results are shown in FIGS. 12C and 12D.
[0188] FIG. 12C shows parts of the B-scan of FIG. 12A and the associated transverse profiles indicated by the dashed lines in FIG. 12C. The upper image and the upper transverse profile of FIG. 12C correspond to the part of the B-scan of FIG. 12A located in the dashed box (indicated by a dashed arrow for clarity) in FIG. 12A at about 415 μ m from the focus, while the lower image and the lower transverse profile of FIG. 12C correspond to the part of the B-scan of FIG. 12A located in the dotted box (indicated by a dotted arrow for clarity) in FIG. 12A at about 382 μ m from the focus.
[0189] FIG. 12D shows parts of the B-scan of FIG. 12B and the associated transverse profiles indicated by the dashed lines in FIG. 12D. The upper image and the upper transverse profile of FIG. 12D correspond to the part of the B-scan of FIG. 12B located in the dashed box (indicated by a dashed arrow for clarity) in FIG. 12B at about 415 μ m from the focus, while the lower image and the lower transverse profile of FIG. 12D correspond to the part of the B-scan of FIG. 12B located in the dotted box (indicated by a dotted arrow for clarity) in FIG. 12B at about 382 μ m from the focus.
[0190] As may be observed, the transverse profiles in the zoom-in area corresponding to the positions indicated by the respective dashed lines show that the cell boundaries' widths were sharpened from about 15.3 μηι and about 27.2 μηι to about 8.5 μ m and about
9.2 μηι, respectively. The transverse profiles obtained show that the defocused cell boundary was well digitally refocused.
[0191] The anisotropy ratio of the digitally refocused B-scan to the dispersion- compensated B-scan was also calculated over the whole depth range, and the results are shown in FIG. 12E. Over the whole depth range, the anisotropy ratio is almost always greater than 1 and fluctuates around 1.05, indicating a transverse resolution improvement. Several valleys of the anisotropy ratio are generated due to artifacts induced by strong reflection at cell junctions. The results obtained demonstrate that MAS may achieve good DOF extension performance, as shown above when imaging the rat adipocyte sample.
[0192] Phase interpolation scheme to increase imaging speed
[0193] In various embodiments, a central image may be merged with other adjacent frames, for example, four adjacent frames, to generate one DOF extended frame. However, such a process may decrease the imaging speed by about 80%. FIG. 13 shows a schematic cross-sectional view of the phase differences between five adjacent frames with distinctive apertures. As illustrated, there may be five sample beams with distinctive apertures (as respectively represented by five arrowed lines "1" to "5") when the micro- cylindrical lens (MCL) 980 is transversely shifted.
[0194] If the phase differences between the five adjacent images with the refocused image are measured as shown in FIG. 13, and indicated as Δθt (t = 1-5), taking the axial- delayed phase Δz1 + Δz2 and Δzc into account, which may be caused by the transverse shift of the micro-cylindrical lens 980 and the defocus-induced local wavefront (LWF) curvature, respectively, then one refocused image may generate four other adjacent images by simply multiplying a phase difference Δθt. This phase interpolation scheme may increase the imaging speed by five times, enabling MAIR SD-OCT to have the same imaging speed as a standard OCT.
[0195] Polarization encoded MAIR endoscopic probe
[0196] Various embodiments may provide a polarization encoded multiple aperture synthesis probe which may be suitable for endoscopic imaging applications. FIG. 14A shows a non-limiting example of a polarization encoded probe 1400, which may include
a Ferrule 1480 with a single mode fiber (SMF) 1432, a calcite spacer 1438, a polarization analyzer (e.g., a half wavelength plate) 1482, a GRIN lens 1484, a beamsplitter (BS) 1486 and a mirror (M) 1488. As shown, the polarization analyzer 1482 may be positioned between the calcite spacer 1438 and the GRIN lens 1484. It should be appreciated that BS 1486 and M 1488 may be optional. In some embodiments, the Ferrule 1480 may be optional or replaced with another element.
[0197] Light from the SMF 1432 may be split into an ordinary ray (o-ray) and an extraordinary ray (e-ray) while propagating through the calcite spacer 1438, which then travel through the BS 1486 to be split and directed to the mirror 1488 to be reflected, and to be focused to a focus point 1408 on a sample 1410. The double headed solid arrows trace the extraordinary optical path for the e-ray, while the double headed dashed arrows trace the ordinary optical path for the o-ray.
[0198] The spacer 1438 may be made of birefringent calcite and the SMF material may be non-birefringent fused silica. The interface plane 1481 between the SMF 1432 and the calcite spacer 1438 may be angled with respect to the optical axis of the SMF 1432. Such an arrangement may help to minimise or avoid the reflection at the interface plane 1481. The angle between the optical axis of the SMF 1432 and the interface plane 1481 is a, which may be set to 45° optimally, or another acute angle. The refractive index of fused silica is about 1.46 at 800 nm. The refractive index of calcite is about 1.46 and 1.65 for ordinary ray and extraordinary ray at 800 nm, respectively. The fast axis of the calcite spacer 1438 is parallel to the interface plane 1481 between the SMF 1432 and the calcite spacer 1438. The optical axis of the polarization analyzer 1482 is about 45° with respect to the fast axis and the slow axis of the calcite spacer 1438.
[0199] FIGS. 14B to 14D show, in greater details, the optical imaging device 1400 and its related operations, illustrating the principle of polarization-based multiple aperture division and synthesis. FIG. 14B shows the generation and focusing of the e-ray 1406a and the o-ray 1406b. It should be appreciated that some elements illustrated in FIG. 14A are omitted in FIG. 14B for ease of understanding and clarity purposes. FIG. 14C shows a cross-sectional view of the probe 1400 showing the fast axis of the calcite spacer 1438 and the optical axis of the analyzer 1482.
[0200] The light output 1440 from the SMF 1432 may undergo refraction at the interface plane 1481 between the fused silica SMF 1432 and the calcite spacer 1438. The part of the light 1440 from the SMF 1432 with a polarization direction along the fast axis of calcite spacer 1438 may travel in the calcite spacer 1438 as the ordinary ray 1406b, while the rest of the SMF light 1440 with a polarization direction perpendicular to the fast axis of calcite spacer 1438 may travel in the calcite spacer 1438 as the extraordinary ray 1406a. The ordinary ray 1406b and the extraordinary ray 1406a may be separated by about five degrees in the calcite spacer 1438. In the GRIN lens pupil plane, the apertures occupied by the ordinary and extraordinary rays 1406a, 1496b are different, forming two distinct apertures.
[0201] The ordinary ray 1406b and the extraordinary ray 1406a may go through the polarization analyzer 1482 after passing through the calcite spacer 1438. The analyzer 1482 may rotate the respective polarization direction of the ordinary ray 1406b and the extraordinary ray 1406a by about 45° in the illumination paths of the ordinary ray 1406b and the extraordinary ray 1406a, so that after passing through the polarization analyzer 1482, the polarization directions of both the ordinary ray 1406b and the extraordinary ray 1406a may be the same as the optical axis of the polarization analyzer 1482. The ordinary ray 1406b and the extraordinary ray 1406a may be directed by the GRIN lens 1484 onto a common spot 1408 on the sample 1410. The illumination light, including the ordinary ray 1406b and the extraordinary ray 1406a, may be back- reflected or back-scattered by the sample 1410.
[0202] The light back-reflected or back-scattered by the sample 1410 may be divided into four parts by the illumination paths (ordinary and extraordinary rays) and detection paths (ordinary and extraordinary rays). FIG. 14D shows the four possible round-trip light paths based on the illumination paths and detection paths.
[0203] (1) The light travelling along the illumination path of the ordinary ray 1406b and returning (scattered) along the same illumination path of the ordinary ray 1406b but in the opposite direction is called the oo-light, and the round trip light path of the oo-light is called the oo-path.
[0204] (2) The light travelling along the illumination path of the ordinary ray 1406b and returning (scattered) along the illumination path of the extraordinary ray 1406a but in the
opposite direction is called the oe-light, and the round trip light path of the oe-light is called the oe-path.
[0205] (3) The light travelling along the illumination path of the extraordinary ray 1406a and returning (scattered) along the same illumination path of the extraordinary ray 1406a but in the opposite direction is called the ee-light, and the round trip light path of the ee- light is called the ee-path.
[0206] (4) The light travelling along the illumination path of the extraordinary ray 1406a and returning (scattered) along the illumination path of the ordinary ray 1406b but in the opposite direction is called the eo-light, and the round trip light path of the eo-light is called the eo-path.
[0207] Light signals from all four light paths may be coupled back into the SMF 1432 and directed to and be detected by a photodetector (not shown). Due to the difference in the refractive index of calcite between the ordinary and extraordinary rays 1406a, 1406b, the round trip path length of the ee-light is approximately 2*d*( 1.65- 1.46) longer than that of the oo-light, and the round trip path length of the oe-light and the eo-light is approximately d*( 1.65- 1.46) longer than that of the oo-light, where d is the physical length of the calcite spacer 1438. This path length difference makes it possible to encode the light signal from different paths by use of path length and realize path length division detection. This ability to detect the light signals separately in path length domain may facilitate multiple aperture synthesis described herein above.
[0208] In various embodiments, the light paths of the coherent light beams may be separated or shifted in the lateral or transverse direction. This may help with the correction of wavefront distortion in the post-processing stage. Further, the light beams from all of the apertures may be focused on the same point. Also, wavefront distortions may be corrected to realize more than 10-fold DOF extension via multiple apertures synthesis.
[0209] In various embodiments, correction of wavefront distortion may be carried out in a post-processing stage, for example, using a processor or a computer. In various embodiments, DOF extension may result from the set-up of the optical imaging device and/or the post-processing distortion correction method.
[0210] The various embodiments may be classified as multiple aperture synthesis (MAS). The difference between them may include how to separate the multiple apertures and there may be challenges in terms of the scanning rate for the optical imaging device 200 (FIGS. 2A and 2B) while the optical imaging devices 300 (FIG. 3A), 400 (FIG. 4A), 500 (FIG. 5A) may require a much larger imaging depth. Nevertheless, various embodiments may share the same or similar physical theory and data post-possessing. The various embodiments may include a similar optical design with different types of optical beam separation elements. Further, the optical imaging device 300 (FIG. 3A) may be applied to a hand-held system for flexible detection, and optical imaging devices 400 (FIGF. 4A), 500 (FIG. 5A) may have the potential to realize DOF extension in a probe design that may be suitable for various endoscopic imaging applications.
[0211] As described above, various embodiments may provide a technique to address or overcome the depth-of-focus (DOF) limitation in optical coherence tomography (OCT). In various embodiments, using confocal optics on a sample arm, the illumination beam may be scanned across the under-filled objective lens pupil plane by steering the beam at the pinhole (fiber) using a microcylindrical lens. The detected interferometric signals from multiple distinctive apertures may be digitally refocused, which may be analogous to synthetic aperture radar (SAR). Numerical simulations and imaging experiments show that this technique may be able to maintain a diffraction-limited transverse resolution along a DOF that is aprroximately ~10 times larger than the confocal parameter. The ability to extend the DOF without or with minimal signal loss and sidelobe artifacts may address or overcome the DOF limitation in high-resolution OCT.
[0212] As also descrived above, the MAS technique of various embodiments may address the problem of limited DOF in high transverse resolution FD-OCT. MAS may be free from signal loss and sidelobe artifacts, which may be caused by a sub-optimal coherence transfer function (CTF) and inherent in known methods. These features of the MAS method have been demonstrated theoretically and experimentally as described herein. Therefore, the MAS technique may have the potential to provide a sufficient DOF to stably acquire subcellular resolution images in vivo. Moreover, the ability to manipulate the complex pupil function (PF) makes MAS a tool that may minimise or eliminate various types of optical aberrations beyond the defocus induced by the sample
or focusing optics, such as aberrations induced by human eye optics. However, transverse priority scanning, as described herein, may be susceptible to motion artifacts. This may be resolved by changing to angular frequency priority scanning. Further, the example of the implementation of MAS as described herein may be at the cost of scanning speed, where five A-scans with five distinctive apertures together were coherently summed to obtain one DOF extended A-line, which decreases the imaging speed by five times. This may be mitigated by the use of faster spectrometers or an ultrahigh-speed swept source. Moreover, a phase ramp may be digitally created along the fast scanning direction in the PF to achieve digital transverse scanning.
[0213] The MAS technique of various embodiments may address or overcome the inherent tradeoff between DOF extension and signal loss/sidelobe artifacts and may address or overcome the DOF limitation in high-resolution OCT. The optical imaging device or apparatus of various embodiments may be applicable to desktop OCT imaging systems for DOF extension, as well as a miniaturized optical design for endoscopic and intravascular applications. Further, various embodiments may be extended to the development of a faster scanning MAS method for in vivo applications.
[0214] While the invention has been particularly shown and described with reference to specific embodiments, it should be understood by those skilled in the art that various changes in form and detail may be made therein without departing from the spirit and scope of the invention as defined by the appended claims. The scope of the invention is thus indicated by the appended claims and all changes which come within the meaning and range of equivalency of the claims are therefore intended to be embraced.
Claims
1. An optical imaging device comprising:
an optics arrangement comprising a focusing optics, the optics arrangement configured to generate a plurality of coherent light beams incident on the focusing optics to be focused to a common focus point to illuminate a section of a sample, wherein the plurality of coherent light beams define respective discrete apertures at respective different positions on the focusing optics, and
wherein the optics arrangement is further configured to receive, from the section of the sample, return lights for generation of at least one image representing the section of the sample.
2. The optical imaging device as claimed in claim 1, wherein the optics arrangement further comprises:
an optical element arranged to receive an input light; and
an actuator arranged to move the optical element for generating the plurality of coherent light beams from the input light.
3. The optical imaging device as claimed in claim 2, wherein the optical element comprises at least one of a cylindrical lens having a curved face arranged to face the input light, or a mirror.
4. The optical imaging device as claimed in claim 1, wherein the optics arrangement further comprises a beamsplitter configured to receive an input light and to split the input light to generate the plurality of coherent light beams.
5. The optical imaging device as claimed in claim 1, wherein the optics arrangement further comprises a reflective optical element configured to receive an input light, the reflective optical element having at least two reflective surfaces configured to reflect the input light to generate the plurality of coherent light beams.
6. The optical imaging device as claimed in claim 1, wherein the optics arrangement further comprises a birefringent material configured to receive an input light and to generate, from the input light received, a plurality of polarized lights of different polarization directions as the plurality of coherent light beams.
7. The optical imaging device as claimed in claim 6, wherein the optics arrangement further comprises a half-wavelength plate at an output side of the birefringent material.
8. The optical imaging device as claimed in claim 6 or 7, wherein the focusing optics comprises a gradient index lens.
9. The optical imaging device as claimed in any one of claims 1 to 8, wherein the optics arrangement is further configured, for each return light of the return lights, to form an interference signal from the return light and a reference light for generation of the at least one image representing the section of the sample.
10. The optical imaging device as claimed in any one of claims 1 to 9, further comprising a single light source configured to supply an input light for generation of the plurality of coherent light beams.
11. The optical imaging device as claimed in any one of claims 1 to 10, wherein the optics arrangement further comprises a collimation lens configured to provide an input light in collimated form for generation of the plurality of coherent light beams.
12. The optical imaging device as claimed in any one of claims 1 to 11, further comprising a detector for generating the at least one image representing the section of the sample.
13. A method for imaging comprising:
generating a plurality of coherent light beams incident on a focusing optics to be focused to a common focus point to illuminate a section of a sample, wherein the
plurality of coherent light beams define respective discrete apertures at respective different positions on the focusing optics, and
receiving, from the section of the sample, return lights for generation of at least one image representing the section of the sample.
14. The method as claimed in claim 13, wherein generating a plurality of coherent light beams comprises:
supplying an input light to an optical element; and
moving the optical element for generating the plurality of coherent light beams from the input light.
15. The method as claimed in claim 13, wherein generating a plurality of coherent light beams comprises:
splitting an input light by a beamsplitter to generate the plurality of coherent light beams.
16. The method as claimed in claim 13, wherein generating a plurality of coherent light beams comprises:
reflecting an input light by at least two reflective surfaces to generate the plurality of coherent light beams.
17. The method as claimed in claim 13, wherein generating a plurality of coherent light beams comprises:
transmitting an input light through a birefringent material to generate a plurality of polarized lights of different polarization directions as the plurality of coherent light beams.
18. The method as claimed in claim 17, further comprising changing an orientation of the polarization directions of the plurality of polarized lights.
19. The method as claimed in any one of claims 13 to 18, wherein generating a plurality of coherent light beams comprises:
generating, from an input light in collimated form, the plurality of coherent light beams.
20. The method as claimed in any one of claims 13 to 19, further comprising, for each return light of the return lights, forming an interference signal from the return light and a reference light for generation of the at least one image representing the section of the sample.
Applications Claiming Priority (2)
| Application Number | Priority Date | Filing Date | Title |
|---|---|---|---|
| SG10201702101T | 2017-03-15 | ||
| SG10201702101T | 2017-03-15 |
Publications (1)
| Publication Number | Publication Date |
|---|---|
| WO2018169486A1 true WO2018169486A1 (en) | 2018-09-20 |
Family
ID=63522507
Family Applications (1)
| Application Number | Title | Priority Date | Filing Date |
|---|---|---|---|
| PCT/SG2018/050061 Ceased WO2018169486A1 (en) | 2017-03-15 | 2018-02-12 | Optical imaging device and method for imaging |
Country Status (1)
| Country | Link |
|---|---|
| WO (1) | WO2018169486A1 (en) |
Cited By (4)
| Publication number | Priority date | Publication date | Assignee | Title |
|---|---|---|---|---|
| RU191908U1 (en) * | 2019-03-12 | 2019-08-28 | Российская Федерация, от имени которой выступает Государственная корпорация по атомной энергии "Росатом" (Госкорпорация "Росатом") | DEVICE FOR FORMING DIVIDED TIME-APODIZED LASER BEAMS |
| CN116439639A (en) * | 2023-03-14 | 2023-07-18 | 之江实验室 | Endoscopic imaging system |
| CN116736532A (en) * | 2023-08-01 | 2023-09-12 | 中国科学院长春光学精密机械与物理研究所 | Bessel two-photon microscope illumination light path non-conjugate aberration correction method and system |
| CN120595466A (en) * | 2025-08-06 | 2025-09-05 | 长春通视光电技术股份有限公司 | Airborne optoelectronic pod optical window thermal deformation compensation device and compensation method |
Citations (3)
| Publication number | Priority date | Publication date | Assignee | Title |
|---|---|---|---|---|
| US5760901A (en) * | 1997-01-28 | 1998-06-02 | Zetetic Institute | Method and apparatus for confocal interference microscopy with background amplitude reduction and compensation |
| CN101071057A (en) * | 2007-06-15 | 2007-11-14 | 浙江大学 | Interference measuring instrument based on multimode waveguide light field transverse mode |
| US20140320816A1 (en) * | 2013-04-30 | 2014-10-30 | IDx, LLC | Snapshot spectral domain optical coherence tomographer |
-
2018
- 2018-02-12 WO PCT/SG2018/050061 patent/WO2018169486A1/en not_active Ceased
Patent Citations (3)
| Publication number | Priority date | Publication date | Assignee | Title |
|---|---|---|---|---|
| US5760901A (en) * | 1997-01-28 | 1998-06-02 | Zetetic Institute | Method and apparatus for confocal interference microscopy with background amplitude reduction and compensation |
| CN101071057A (en) * | 2007-06-15 | 2007-11-14 | 浙江大学 | Interference measuring instrument based on multimode waveguide light field transverse mode |
| US20140320816A1 (en) * | 2013-04-30 | 2014-10-30 | IDx, LLC | Snapshot spectral domain optical coherence tomographer |
Non-Patent Citations (4)
| Title |
|---|
| BO E. ET AL.: "Depth-of-focus extension in optical coherence tomography via multiple aperture synthesis", OPTICA, vol. 4, no. 7, 22 June 2017 (2017-06-22), pages 701 - 706, XP055510984, [retrieved on 20180523] * |
| BO E. ET AL.: "Multiple aperture synthetic optical coherence tomography for biological tissue imaging", OPTICS EXPRESS, vol. 26, no. 2, 22 January 2018 (2018-01-22), pages 772 - 780, XP055546668, [retrieved on 20180523] * |
| CHENG C-J. ET AL.: "Superresolution imaging in synthetic aperture digital holographic microscopy", IEEE 4TH INTERNATIONAL CONFERENCE ON PHOTONICS (ICP), 30 October 2013 (2013-10-30), pages 215 - 217, XP055546661, [retrieved on 20180523] * |
| MO J. ET AL.: "Focus-extension by depth-encoded synthetic aperture in Optical Coherence Tomography", OPTICS EXPRESS, vol. 21, no. 8, 15 April 2013 (2013-04-15), pages 10048 - 10061, XP055546658, [retrieved on 20180523] * |
Cited By (6)
| Publication number | Priority date | Publication date | Assignee | Title |
|---|---|---|---|---|
| RU191908U1 (en) * | 2019-03-12 | 2019-08-28 | Российская Федерация, от имени которой выступает Государственная корпорация по атомной энергии "Росатом" (Госкорпорация "Росатом") | DEVICE FOR FORMING DIVIDED TIME-APODIZED LASER BEAMS |
| CN116439639A (en) * | 2023-03-14 | 2023-07-18 | 之江实验室 | Endoscopic imaging system |
| CN116439639B (en) * | 2023-03-14 | 2024-01-09 | 之江实验室 | endoscopic imaging system |
| CN116736532A (en) * | 2023-08-01 | 2023-09-12 | 中国科学院长春光学精密机械与物理研究所 | Bessel two-photon microscope illumination light path non-conjugate aberration correction method and system |
| CN116736532B (en) * | 2023-08-01 | 2023-10-20 | 中国科学院长春光学精密机械与物理研究所 | Bessel two-photon microscope illumination light path unconjugated aberration correction method and system |
| CN120595466A (en) * | 2025-08-06 | 2025-09-05 | 长春通视光电技术股份有限公司 | Airborne optoelectronic pod optical window thermal deformation compensation device and compensation method |
Similar Documents
| Publication | Publication Date | Title |
|---|---|---|
| JP7258082B2 (en) | High resolution 3D spectral domain optical imaging apparatus and method | |
| JP6924197B2 (en) | Systems and methods for improved OCT measurements | |
| JP5448353B2 (en) | Image forming method using optical coherence tomography and optical coherence tomography apparatus | |
| US7633631B2 (en) | Three-dimensional microscope and method for obtaining three-dimensional image | |
| US9411140B2 (en) | Method and system for calibrating a spatial optical modulator in an optical microscope | |
| KR102804233B1 (en) | Methods and systems for noninvasive optical characterization of heterogeneous media | |
| EP2572157B1 (en) | Method and device for high resolution full field interference microscopy | |
| JP2017522066A (en) | Imaging system and method with improved frequency domain interferometry | |
| JP7588150B2 (en) | Observation device and observation method | |
| Adie et al. | Guide-star-based computational adaptive optics for broadband interferometric tomography | |
| WO2017049085A1 (en) | Apparatus and methods for mirror tunnel imaging device and for providing pseudo-bessel beams in a miniaturized optical system for imaging | |
| CN111386439B (en) | Interference imaging device and application thereof | |
| US10646114B2 (en) | Ophthalmic imaging apparatus and method of controlling the same | |
| JP2016035402A (en) | Optical coherence tomography correction method and device therefor | |
| JP7339447B2 (en) | Apparatus and method for line scanning microscopy | |
| JP5784100B2 (en) | Image forming apparatus and image forming method | |
| RU187692U1 (en) | Device for endoscopic optical coherence tomography with wavefront correction | |
| Hillmann | Holoscopy | |
| Marks et al. | High numerical aperture full-field optical coherence tomography with space-invariant resolution without scanning the focus | |
| Kamal | Reflective optics-based line-scanning spectral domain optical coherence tomography system | |
| Liu et al. | Full-field optical coherence tomography using a spatial filter | |
| Moiseev et al. | Interferometric synthetic aperture microscopy with automated parameter evaluation and phase equalization preprocessing |
Legal Events
| Date | Code | Title | Description |
|---|---|---|---|
| 121 | Ep: the epo has been informed by wipo that ep was designated in this application |
Ref document number: 18767989 Country of ref document: EP Kind code of ref document: A1 |
|
| NENP | Non-entry into the national phase |
Ref country code: DE |
|
| 122 | Ep: pct application non-entry in european phase |
Ref document number: 18767989 Country of ref document: EP Kind code of ref document: A1 |