WO2018124362A1 - 확률론적 분석 방법을 이용한 건축물 전과정 지속가능성 평가 장치, 방법 및 그 방법을 기록한 기록매체 - Google Patents
확률론적 분석 방법을 이용한 건축물 전과정 지속가능성 평가 장치, 방법 및 그 방법을 기록한 기록매체 Download PDFInfo
- Publication number
- WO2018124362A1 WO2018124362A1 PCT/KR2017/000344 KR2017000344W WO2018124362A1 WO 2018124362 A1 WO2018124362 A1 WO 2018124362A1 KR 2017000344 W KR2017000344 W KR 2017000344W WO 2018124362 A1 WO2018124362 A1 WO 2018124362A1
- Authority
- WO
- WIPO (PCT)
- Prior art keywords
- probability distribution
- building
- environmental impact
- cost
- life cycle
- Prior art date
- Legal status (The legal status is an assumption and is not a legal conclusion. Google has not performed a legal analysis and makes no representation as to the accuracy of the status listed.)
- Ceased
Links
Images




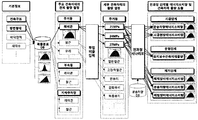
Classifications
-
- G—PHYSICS
- G06—COMPUTING OR CALCULATING; COUNTING
- G06F—ELECTRIC DIGITAL DATA PROCESSING
- G06F30/00—Computer-aided design [CAD]
- G06F30/10—Geometric CAD
- G06F30/17—Mechanical parametric or variational design
-
- G—PHYSICS
- G06—COMPUTING OR CALCULATING; COUNTING
- G06Q—INFORMATION AND COMMUNICATION TECHNOLOGY [ICT] SPECIALLY ADAPTED FOR ADMINISTRATIVE, COMMERCIAL, FINANCIAL, MANAGERIAL OR SUPERVISORY PURPOSES; SYSTEMS OR METHODS SPECIALLY ADAPTED FOR ADMINISTRATIVE, COMMERCIAL, FINANCIAL, MANAGERIAL OR SUPERVISORY PURPOSES, NOT OTHERWISE PROVIDED FOR
- G06Q50/00—Information and communication technology [ICT] specially adapted for implementation of business processes of specific business sectors, e.g. utilities or tourism
- G06Q50/08—Construction
-
- G—PHYSICS
- G06—COMPUTING OR CALCULATING; COUNTING
- G06F—ELECTRIC DIGITAL DATA PROCESSING
- G06F17/00—Digital computing or data processing equipment or methods, specially adapted for specific functions
- G06F17/10—Complex mathematical operations
- G06F17/18—Complex mathematical operations for evaluating statistical data, e.g. average values, frequency distributions, probability functions, regression analysis
-
- G—PHYSICS
- G06—COMPUTING OR CALCULATING; COUNTING
- G06F—ELECTRIC DIGITAL DATA PROCESSING
- G06F30/00—Computer-aided design [CAD]
- G06F30/10—Geometric CAD
- G06F30/13—Architectural design, e.g. computer-aided architectural design [CAAD] related to design of buildings, bridges, landscapes, production plants or roads
-
- G—PHYSICS
- G06—COMPUTING OR CALCULATING; COUNTING
- G06F—ELECTRIC DIGITAL DATA PROCESSING
- G06F30/00—Computer-aided design [CAD]
- G06F30/20—Design optimisation, verification or simulation
-
- G—PHYSICS
- G06—COMPUTING OR CALCULATING; COUNTING
- G06N—COMPUTING ARRANGEMENTS BASED ON SPECIFIC COMPUTATIONAL MODELS
- G06N7/00—Computing arrangements based on specific mathematical models
- G06N7/01—Probabilistic graphical models, e.g. probabilistic networks
-
- G—PHYSICS
- G06—COMPUTING OR CALCULATING; COUNTING
- G06Q—INFORMATION AND COMMUNICATION TECHNOLOGY [ICT] SPECIALLY ADAPTED FOR ADMINISTRATIVE, COMMERCIAL, FINANCIAL, MANAGERIAL OR SUPERVISORY PURPOSES; SYSTEMS OR METHODS SPECIALLY ADAPTED FOR ADMINISTRATIVE, COMMERCIAL, FINANCIAL, MANAGERIAL OR SUPERVISORY PURPOSES, NOT OTHERWISE PROVIDED FOR
- G06Q10/00—Administration; Management
- G06Q10/06—Resources, workflows, human or project management; Enterprise or organisation planning; Enterprise or organisation modelling
- G06Q10/063—Operations research, analysis or management
- G06Q10/0637—Strategic management or analysis, e.g. setting a goal or target of an organisation; Planning actions based on goals; Analysis or evaluation of effectiveness of goals
-
- G—PHYSICS
- G06—COMPUTING OR CALCULATING; COUNTING
- G06Q—INFORMATION AND COMMUNICATION TECHNOLOGY [ICT] SPECIALLY ADAPTED FOR ADMINISTRATIVE, COMMERCIAL, FINANCIAL, MANAGERIAL OR SUPERVISORY PURPOSES; SYSTEMS OR METHODS SPECIALLY ADAPTED FOR ADMINISTRATIVE, COMMERCIAL, FINANCIAL, MANAGERIAL OR SUPERVISORY PURPOSES, NOT OTHERWISE PROVIDED FOR
- G06Q10/00—Administration; Management
- G06Q10/08—Logistics, e.g. warehousing, loading or distribution; Inventory or stock management
- G06Q10/087—Inventory or stock management, e.g. order filling, procurement or balancing against orders
- G06Q10/0875—Itemisation or classification of parts, supplies or services, e.g. bill of materials
-
- G—PHYSICS
- G06—COMPUTING OR CALCULATING; COUNTING
- G06F—ELECTRIC DIGITAL DATA PROCESSING
- G06F2111/00—Details relating to CAD techniques
- G06F2111/08—Probabilistic or stochastic CAD
-
- G—PHYSICS
- G06—COMPUTING OR CALCULATING; COUNTING
- G06F—ELECTRIC DIGITAL DATA PROCESSING
- G06F2119/00—Details relating to the type or aim of the analysis or the optimisation
- G06F2119/04—Ageing analysis or optimisation against ageing
-
- G—PHYSICS
- G06—COMPUTING OR CALCULATING; COUNTING
- G06F—ELECTRIC DIGITAL DATA PROCESSING
- G06F2119/00—Details relating to the type or aim of the analysis or the optimisation
- G06F2119/06—Power analysis or power optimisation
-
- Y—GENERAL TAGGING OF NEW TECHNOLOGICAL DEVELOPMENTS; GENERAL TAGGING OF CROSS-SECTIONAL TECHNOLOGIES SPANNING OVER SEVERAL SECTIONS OF THE IPC; TECHNICAL SUBJECTS COVERED BY FORMER USPC CROSS-REFERENCE ART COLLECTIONS [XRACs] AND DIGESTS
- Y02—TECHNOLOGIES OR APPLICATIONS FOR MITIGATION OR ADAPTATION AGAINST CLIMATE CHANGE
- Y02P—CLIMATE CHANGE MITIGATION TECHNOLOGIES IN THE PRODUCTION OR PROCESSING OF GOODS
- Y02P90/00—Enabling technologies with a potential contribution to greenhouse gas [GHG] emissions mitigation
- Y02P90/90—Financial instruments for climate change mitigation, e.g. environmental taxes, subsidies or financing
Definitions
- the present invention relates to an apparatus, method, and a recording medium recording the whole life cycle sustainability evaluation method using a stochastic analysis method.
- the present invention relates to an apparatus, a method, and a recording medium recording the entire life cycle sustainability evaluation method using a theoretical analysis method.
- the construction of buildings causes side effects such as depletion of natural resources, destruction of ecosystems, pollution of air and water, and generation of garbage.
- many design elements of buildings affect the environment. However, even in the case of designing in consideration of the environment, it is difficult for a designer to correctly understand various information about a general environment and proceed with the design accordingly.
- the selection of building materials based on environmental impacts is possible by analyzing them through a life cycle assessment (LCA).
- the whole process means all processes such as material collection process, material supply process, material transportation process, building process, use process, and disposal process, and life cycle evaluation means material balance (input) through the aforementioned process. Material, energy, and emissions) to quantify and assess the overall impact on the environment.
- the conventional life cycle evaluation method for buildings although uncertainty analysis on the environmental impact, cost, and social impact evaluation results of the building is important, it is used as a deterministic analysis method, so the uncertainty of the construction project is reflected in the evaluation result. Not only is it difficult to do, but there is a problem in that the expected value for the analysis result cannot be calculated.
- the conventional life-cycle evaluation method for the building there is a problem that contains a mathematical limit that can occur the average trap in reflecting the variable of the asymmetrical structure.
- the present invention provides a probabilistic analysis method that can more objectively evaluate the sustainability of the building and quantify the uncertainty so as to minimize the risk of decision making in the early stage of the building project.
- the purpose of the present invention is to provide an apparatus, method, and recording medium recording the entire life cycle sustainability evaluation method.
- the present invention uses the stochastic analysis method that enables the useful life cycle sustainability evaluation in the early stages of the construction project, since the most frequent value can be identified from the stochastic perspective by reflecting the characteristics of the building during the life cycle sustainability assessment.
- the purpose of the present invention is to provide an apparatus, method, and a recording medium recording the entire life cycle sustainability evaluation method.
- the present invention provides decision makers with more useful information by simultaneously providing expected values that are not calculated in the conventional deterministic evaluation model and probabilistically corrected average values, minimum values, and maximum values in life cycle sustainability evaluation.
- the purpose of the present invention is to provide an apparatus, method, and a recording medium recording the whole life cycle sustainability evaluation method of buildings using probabilistic analysis method that can effectively support decision making.
- the present invention can provide a probabilistically corrected average value based on repeated evaluation results through Monte Carlo simulation, which is more than an evaluation result in terms of the average value applied mainly in the conventional deterministic evaluation model.
- the purpose of the present invention is to provide an apparatus, method, and a recording medium recording the whole life cycle sustainability evaluation method of buildings using probabilistic analysis method that can provide meaningful evaluation results.
- an embodiment of the present invention provides a reference environmental impact evaluation value for a reference building, a first environmental impact coefficient set that quantifies the environmental impact per unit input of a plurality of building materials, and a plurality of energy
- a first storage unit for storing a second set of environmental impact coefficients quantifying the degree of environmental impact per unit of consumption of a circle
- An input unit configured to receive area information of a building, a plurality of building material inputs, and a plurality of energy source consumptions; Storing a set value of the probability distribution form of building materials and energy sources according to the area information of the building, and the probability of a plurality of building materials input amount according to the set value for the plurality of building materials input amount and the plurality of energy source consumption
- a probability distribution calculator for deriving a distribution of probability and a plurality of energy source consumptions;
- a probability distribution of the second environmental impact evaluation value by the energy source is calculated by using a probability distribution and the second environmental impact coefficient set, and the probability distribution of the first environmental impact evaluation value and the probability of the second environmental impact evaluation value.
- a first calculating unit calculating a probability distribution of the life cycle environmental impact evaluation values by summing the distributions; And deriving the probability distribution of the probability distribution of the environmental impact index by dividing the reference environmental impact evaluation value stored in the first storage unit by the probability distribution of the life cycle environmental impact evaluation value calculated by the first calculating unit. It includes a first output unit for outputting the probability distribution of the exponent.
- the reference cost evaluation value for the reference building, the first cost coefficient set and the plurality of energy quantifying the degree of cost per unit of input of a plurality of building materials
- the reference social impact evaluation value for the reference building the first to store the social impact coefficient set that quantifies the degree of social impact per unit input of a plurality of building materials 3 storage;
- a third calculation unit calculating a probability distribution of life cycle social impact evaluation values by using a probability distribution of the plurality of building materials inputs and the social impact coefficient set by Monte Carlo simulation; And deriving a probability distribution of the social impact index by dividing the probability distribution of the life cycle social impact evaluation value calculated by the third calculating unit by the reference social impact evaluation value stored in the third storage unit, and calculating the probability of the derived social impact index.
- the apparatus may further include a third output unit configured to output the distribution.
- P-SBI is the probability distribution of the sustainable building index
- P-EI is the probability distribution of the environmental impact index
- P-CI is the probability distribution of the cost index
- P-SI is the probability distribution of the social impact index
- the method may further include a probability distribution output unit for deriving a probability distribution of the sustainable building index and outputting the derived probability distribution of the sustainable building index.
- the reference environmental impact evaluation value for the reference building, the first environmental impact coefficient set and a plurality of environmental impact per unit of input of a plurality of building materials Storing a second set of environmental impact coefficients quantifying the degree of environmental impact per consumption unit of the three energy sources;
- Monte Carlo simulation the probability distribution of the first environmental impact evaluation value by building materials is calculated using the probability distribution of the plurality of building materials inputs and the first set of environmental impact coefficients, and the probability of the plurality of energy source consumption
- the reference cost evaluation value for the reference building the first cost coefficient set to quantify the degree of cost per input unit of a plurality of building materials and a plurality of energy
- the probability distribution of the first cost evaluation value by building materials is calculated using the probability distribution of the plurality of building materials inputs and the first cost coefficient set, and the probability distribution of the plurality of energy source consumptions and Calculate the probability distribution of the second cost evaluation value by the energy source using the second set of cost coefficients, add the probability distribution of the first cost evaluation value and the probability distribution of the second cost evaluation value to evaluate the life cycle cost
- the reference social impact evaluation value for the reference building the social impact coefficient set that quantifies the degree of social impact per unit of input of a plurality of building materials stored 9 steps;
- a probabilistic distribution of the social impact index by dividing the probability distribution of the life cycle social impact evaluation value calculated in the tenth step by the reference social impact evaluation value, and outputting the probability distribution of the derived social impact index. It may further comprise a step.
- P-SBI is the probability distribution of the sustainable building index
- P-EI is the probability distribution of the environmental impact index
- P-CI is the probability distribution of the cost index
- P-SI is the probability distribution of the social impact index
- the method may further include a twelfth step of deriving a probability distribution of the sustainable building index and outputting the derived probability distribution of the sustainable building index.
- another embodiment of the present invention can provide a computer-readable recording medium recording a program for executing a building life cycle sustainability evaluation method using a probabilistic analysis method.
- the sustainability of the building can be more objectively assessed and the uncertainty can be quantified, thereby minimizing the risk of decision making at an early stage of the building project.
- the present invention by reflecting the characteristics of the building during the life cycle sustainability evaluation can determine the mode having the highest frequency from a probabilistic point of view, there is an effect that can provide a useful evaluation results in the early stage of the building business.
- the present invention provides decision makers with more useful information by simultaneously providing expected values that are not calculated in the conventional deterministic evaluation model and probabilistically corrected average values, minimum values, and maximum values in life cycle sustainability evaluation. It can work.
- the present invention can provide a probabilistically corrected average value based on repeated evaluation results through Monte Carlo simulation, which is more than an evaluation result in terms of the average value applied mainly in the conventional deterministic evaluation model. There is an effect that can provide a significant evaluation results.
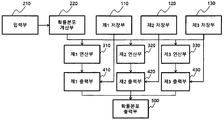
- FIG. 1 is a block diagram of a building life cycle sustainability evaluation apparatus using a probabilistic analysis method according to an embodiment of the present invention.
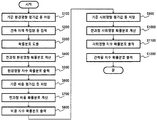
- FIG. 2 is an operation flowchart of a building life cycle sustainability evaluation method using a probabilistic analysis method according to an embodiment of the present invention.
- FIG. 3 is a view illustrating an environmental impact evaluation operation of a building life cycle sustainability evaluation apparatus using a probabilistic analysis method according to an embodiment of the present invention.
- FIG. 4 is a view showing the operation of the building life cycle sustainability evaluation apparatus using the probabilistic analysis method of the present invention.
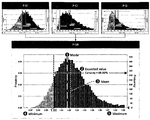
- FIG. 5 is a view showing the evaluation structure of the building life cycle sustainability evaluation apparatus using the probabilistic analysis method of the present invention.
- Figure 6 is a graph showing the life cycle environmental impact assessment results for the sample multi-family housing complex.
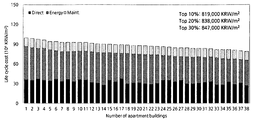
- Figure 7 is a graph showing the life cycle cost evaluation results for the sample multi-family housing complex.
- FIG. 9 is a diagram illustrating a life cycle scenario of a building life cycle sustainability evaluation apparatus using a probabilistic analysis method according to an embodiment of the present invention.
- first and second are intended to distinguish one component from another component, and the scope of rights should not be limited by these terms.
- first component may be named a second component, and similarly, the second component may also be named a first component.
- FIG. 1 is a block diagram of a building life cycle sustainability evaluation apparatus using a probabilistic analysis method according to an embodiment of the present invention
- Figure 4 shows the operation of the building life cycle sustainability evaluation apparatus using a stochastic analysis method of the present invention
- the building life cycle sustainability evaluation apparatus using the probabilistic analysis method of the present invention the first storage unit 110, the second storage unit 120, the third storage unit 130, the input unit 210, probability The distribution calculator 220, the first calculator 310, the second calculator 320, the third calculator 330, the first output 410, the second output 420, and the third output 430
- a probability distribution output unit 500 is a probability distribution output unit 500.
- the first storage unit 110, the reference environmental impact evaluation value for the reference building, the first environmental impact coefficient set to quantify the degree of environmental impact per input unit of a plurality of building materials and environmental impact per consumption unit of a plurality of energy sources A second set of environmental impact coefficients quantified to a degree, outputs the stored first set of environmental impact coefficients and the second set of environmental impact coefficients to the first calculator 310, and outputs the stored reference environmental impact evaluation values to the first output unit And output to 410.
- the first environmental impact coefficient and the second environmental impact coefficient are preferably quantified based on environmental impact categories.
- the environmental impact category is a scientific breakdown of the potential global environmental change caused by environmental impacts. This includes Global Warming Potential (GWP), Acidification Potential (AP), Eutrophication Potential (EP), Ozone Layer Depletion Potential (ODP), Photochemical Oxidation Potential (POCP), Includes Abiotic Depletion Potential (ADP), and creates environmental impacts on a global, regional and local scale across a variety of safety categories and safety guards.
- GWP Global Warming Potential
- AP Acidification Potential
- EP Eutrophication Potential
- ODP Ozone Layer Depletion Potential
- POCP Photochemical Oxidation Potential
- ADP Abiotic Depletion Potential
- GWP is an extreme weather phenomenon in which the average temperature of the earth's surface rises as the greenhouse gases generated by the burning of fossil fuel absorb the infrared rays emitted from the earth.
- CO 2 carbon dioxide
- CH 4 methane
- N 2 O nitrogen dioxide
- the reference substance is CO 2 .
- AP is an environmental problem on a local scale that increases the concentration of hydrogen ions in the oceans and soils due to acid rain caused by the circulation of air pollutants (reduces pH), which threatens the survival of organisms such as fish, plants and animals due to the leaching of heavy metals. do.
- the environmental effects of acidification are 36 such as sulfur dioxide (SO 2 ), nitrogen oxides (NOx), hydrogen sulfide (H 2 S), hydrogen fluoride (HF) and the reference material is SO 2 .
- EP is an environmental problem on a local scale that causes an abnormal increase in the amount of nutrients due to the introduction of chemical fertilizers or sewage, which adversely affects the marine environment.
- Numerous environmental effects of eutrophication include phosphate (PO 4 3- ), ammonia (NH 3 ), nitrogen oxides (NOx), and the reference material is PO 4 3- .
- ODP is a phenomenon in which ozone of the ozone layer in the stratosphere 15 to 30km above ground is destroyed and its density decreases, causing skin diseases (skin cancer, conjunctivitis, etc.) due to increased ultraviolet rays.
- the environmental impacts of ozone depletion are 23, including chlorofluorocarbon 11 (CFC-11), tribromethane bromide (Halon-1301) and chlorofluorocarbon 114, and the reference substance is CFC-11.
- POCP is a reaction that pollutants in the air react with sunlight to produce chemical compounds such as ozone (O 3 ), causing smog, and loss of ecosystems such as human health and suppressing crop growth.
- the environmental effects of photochemical oxide production are 128 such as ethylene (C 2 H 4 ), non-methane hydrocarbon (NMVOC), ethanol (C 2 H 5 OH) and the reference material is C 2 H 4 .
- the ADP is a category that represents the environmental impact on the resources input from nature to technology in order to produce a product.
- the ADP evaluates the destruction of ecosystem balance and environmental pollution due to excessive collection and consumption of resources.
- Resource consumption considers 89 natural resources including crude oil, natural gas and uranium (U).
- the reference material is antimony (Sb).
- the second storage unit 120 is a reference cost evaluation value for the reference building, the first cost coefficient set to quantify the degree of cost per input unit of the plurality of building materials and the degree of cost per unit of consumption of the plurality of energy sources Stores the digitized second cost coefficient set, outputs the stored first cost coefficient set and the second cost coefficient set to the second calculator 320, and outputs the stored reference environmental impact evaluation value to the second output unit 420. can do.
- the first cost coefficient and the second cost coefficient not only reflects all costs directly input during the entire process period, such as the production and use stages of the product system, but also additionally consider one or more external costs. It can reflect private costs, which mean traditional life cycle costs, and external costs for environmental impact.
- the third storage unit 130 stores a set of social impact coefficients quantifying the degree of social impact per input unit of a plurality of building materials, the reference social impact evaluation value for the reference building, and stores the stored social impact coefficient sets in the third calculation unit.
- the stored reference environmental impact evaluation value may be output to the third output unit 430.
- the social impact coefficient is a value that quantifies the degree of social impact related to the social issue, and according to the "Guidelines for Social Life Cycle Assessment of Products", the social issues of the S-LCA are a total of five stakeholder categories and many Are divided into social topics. It is primarily a measure of the degree of social impact that a particular company, organization or business producing and providing a product system has on their stakeholders (workers, consumers, communities, society, value chains). The contents are as follows.
- Child labor means that a company or organization deprives a child of its potential and dignity and impedes physical and mental growth by involving the child in labor.
- the form of child labor consists of enslave children, expose them to serious risks and diseases, and separate children from their families.
- Fair salary means that a company or organization pays a worker at least the minimum wage prescribed by the national minimum wage law, the association and the industry standard wage for the normal working hours of the worker. At this time, the level of wages should be sufficient for the worker and his / her family to maintain a decent living standard based on the workers who have worked in standard working hours.
- Working hours means that a company or organization gives workers appropriate working hours in consideration of legal working hours, public holidays and industry standard working hours. In Korea, the legal working hours are 40 hours per week (excluding overtime hours) and at least one day off of seven days must be provided. In addition, overtime work must be carried out within 12 hours per week in a voluntary working environment and atmosphere, and overtime pay provided by legal or trade unions.
- Forced labor refers to labor compelled by a threat or penalty from someone, rather than voluntarily participating in a job within a company or organization. Forced labor includes debt bondage, indentured servants, human trafficking, and so on. Workers should be able to travel freely to and from the workplace without restrictions of managers' interference and intimidation, and freedom from time outside of work should be guaranteed.
- Equal opportunities & discrimination means that a company or organization recognizes the human diversity of its workers and pays equal pay for equal work values regardless of religion, gender, race or age.
- Health and safety means that a company or organization improves and maintains the level of physical, mental and social well-being of all workers. At this time, the working environment should not be harmful to the health of workers and should protect workers from risk factors. In addition, the workplace should be located where it does not adversely affect the physiological and psychological functions of workers, and work arrangements should be made in consideration of the gender and job suitability of workers.
- Social benefits means that companies or organizations comply with all applicable laws related to social welfare, as well as paying workers wages. Social benefits are usually paid based on the employee's work record (annual salary or income) and include severance pay, disability benefits, dependent benefits and survivor benefits.
- the social issue of the local community is that access to material resources is the property or infrastructure (such as water, land, minerals and biological resources) and infrastructure (roads) held by the community in the enterprise or organization. , Sanitation, schools, etc.). This includes the rights of land owned by indigenous and includes a system of mutual sharing with local communities for the use of physical resources and the protection and fortification of infrastructure. In addition, the use of physical resources should ultimately be a positive factor in the long-term economic development of the community.
- Safe & healthy living conditions means working for the safety, health and public health of community members in a business or organization.
- indiscriminate use and development of businesses or organizations' business sites in local communities can cause natural disasters such as landslides, and the discharge of unclean wastewater and the rapid influx of workers promote the spread of infectious diseases in local communities. Because you can.
- Community engagement refers to whether or not to include members of the community as stakeholders in the business or organization's decision making process.
- the community (individual or community as a whole) must be included in stakeholders.
- Local employment refers to the direct role (job creation, revenue generation, vocational education, etc.) played by a company or organization in the employment of its members living in the community. This will promote open communication and ties with members of the community and contribute to the development of the community.
- the input unit 210 receives the area information of the building, a plurality of building materials input amounts and a plurality of energy source consumptions, and outputs the input plurality of building materials inputs or the plurality of energy source consumptions to the probability distribution calculation unit 220. . That is, the input unit 210 receives an input amount for 10 kinds of main building materials (remixture, reinforcing bar, glass, concrete brick, insulation, gypsum board, window, stone, tile, paint) based on the quantity calculation statement, and energy
- the annual operating energy consumption assessed by the simulation tool can be input separately by energy source.
- the energy simulation tool may include, but is not limited to, DOE-2 developed by the Lawrence Berkely Laboratory (LBL), BLAST developed by the US Army, etc. with the support of the US Department of Energy, a tool that can calculate the annual energy consumption.
- the input unit 210 receives the level of the reference environmental impact evaluation value, the reference cost evaluation value, and the reference social impact evaluation value for the reference material, and stores the first storage unit 110, the second storage unit 120, and the third storage unit. It can be stored in the unit 130, based on the architectural design book can receive the building area information including the total area, floor area, dedicated area of the evaluation building.
- the probability distribution calculation unit 220 stores a set value of the probability distribution form of the building material and the energy source according to the area information of the building, and stores the set value of the building material input and the plurality of energy source consumptions provided from the input unit 210.
- a probability distribution of a plurality of building materials inputs and a plurality of energy source consumptions are derived according to previously stored set values, and a probability distribution of the derived plurality of building materials inputs and a probability distribution of a plurality of energy source consumptions are obtained.
- residential building has 8 characteristics consisting of structural type, planar shape, main building, ground floor, building area, exclusive area, floor area, and number of households as variables
- accessory building has two variables: ground floor number and floor area.
- the underground parking lot sets three characteristics of the number of basement, total floor area, and number of households as variables.
- the bivariate correlation coefficient analysis function of the statistical program derives the Pearson correlation coefficient between the above-mentioned variables and the quantity of the main building materials.
- the Pearson correlation coefficient is a measure used to determine the relationship between two variables, and the value between the two variables has a value of -1 ⁇ R ⁇ 1, and the correlation of the correlation coefficient can be confirmed according to the value.
- the Pearson correlation coefficient is 0.0 ⁇ 0.1, there is no correlation between them, 0.1 ⁇ 0.2 is a weak positive correlation, 0.2 ⁇ 0.4 is a normal positive correlation, and 0.4 ⁇ 0.6 is a relatively strong positive correlation.
- 0.6 ⁇ 0.8 shows strong positive correlation, 0.8 ⁇ 1.0 shows very positive positive correlation.
- the residential building includes all 10 major building materials mentioned above, and the annex and underground parking lot can only target the most influential ready-mixed concrete and reinforcing bars.
- Tables 1 to 3 show correlation coefficient tables for residential dongs, affiliated dongs, and underground parking lots, respectively.
- the quantity of main building materials put into residential buildings is analyzed to have the highest correlation with the dedicated area of residential buildings.
- the ready-mixed concrete and reinforcing bars were found to have a high correlation with the structural form and the planar shape of the residential building, and the amount of concrete bricks and gypsum boards differed according to the planar shape of the residential building.
- both ready-mixed concrete and reinforcing bars in annex are analyzed to have a high correlation with the floor area (see Table 2), and the amount of ready-mixed concrete and reinforcing bars for underground parking lot has a high correlation with underground total floor area. See Table 3).
- a matrix consisting of probability distributions for 30 major building materials is constructed as shown in Table 4.
- the best probability distribution can be determined for each major building material.
- the goodness-of-fit test of the probability distribution is generally a chi-square test ( ⁇ 2 test, Chi-square test), Kolmogorov-Smirnov test (KS test, Kolmogorov-Smirnov test), and Anderson-Darling test (AD). Assay, Anderson-Darling test).
- the probability distribution can be determined based on the fit statistics of the AD test, which is most commonly used in the field.
- the AD test is a method of testing the suitability of the performance data and the distribution form. Generally, when the AD statistic is derived below 1.50, the suitability of the distribution is relatively high. The statistics were analyzed below 1.50, and the significance of the probability distribution can be confirmed mathematically.
- the most important point in the process of selecting the probability distribution for the main building materials is the selected probability distribution.
- the accuracy of the evaluation results is determined by the similarity between the shape of the probability distribution and the actual situation. Therefore, the probability distribution can be determined by using the crystal ball as a distribution fitting tool and calculating the fit statistics according to the fitness test provided by this tool.
- the quantity of main building materials can be assumed to be an independent variable that is not dependent on the quantity of other major building materials.
- Tables 5 to 10 show the types of probability distributions of the analyzed main building materials set in the probability distribution calculator 220.
- Similar to the method of deriving the shape of the probability distribution of the building materials described above it is possible to derive the shape of the probability distribution of the energy source, but the description is omitted for convenience.
- the first calculation unit 310 uses a probability distribution of a plurality of building materials inputs provided by the probability distribution calculation unit 220 and a first set of environmental impact coefficients provided by the first storage unit 110 by Monte Carlo simulation. Calculate the probability distribution of the first environmental impact evaluation value by the building material, the probability distribution of the plurality of energy source consumption provided by the probability distribution calculation unit 220 and the second environment provided by the first storage unit 110 Calculate the probability distribution of the second environmental impact assessment value by the energy source using the set of influence coefficients, and add the probability distribution of the first environmental impact assessment value and the probability distribution of the second environmental impact assessment value Probability distribution of may be calculated, and the probability distribution of the calculated life-cycle environmental impact evaluation value may be output to the first output unit 410.
- Monte Carlo Simulation is a probabilistic analysis method based on a stochastic system that supports effective decision making through simulation using probabilistic models of variables under uncertain circumstances.
- the core of Monte Carlo simulation is the experiments on the probabilistic elements of the model, which are performed using tools that generate stochastic or right links. This tool is used to generate right link families by random sampling based on the probability distribution assumed in the model. It generates N random numbers from 0 to 1 through N simulations and extracts random number-based inputs from the probability distribution model.
- it is a structure that derives and saves the result of applying the input value and calculates the result value based on descriptive statistics.
- the first calculation unit 310 is an EAM (Environmental) method for quantitatively evaluating the life cycle environmental impact of buildings at an early stage of the construction project based on the Environmental Life Cycle Assessment (ELCA) technique published in the ISO 14040 series.
- EAM Environmental Life Cycle Assessment
- the calculation formula based on the impact assessment method, the probability distribution of the input of building materials, and the probability distribution of the consumption of energy sources can be substituted as inputs to the Monte Carlo simulation.
- the major environmental impact categories for evaluating the environmental impact of the building are selected, and the first environmental impact coefficient and the first environmental impact coefficient for the building materials and the energy source in the first storage unit 110 are determined. 2 Environmental impact coefficients corresponding to environmental impact coefficients can be constructed.
- the first operation unit 310 derives major building materials having a high rate of environmental impact in order to establish a life cycle inventory analysis (LCI) method of the building, and based on the construction stage, operation of the building Life cycle scenarios including phases and disposal phases can be established and used to calculate environmental impact assessments.
- the first operation unit 310 may use KOLID, a Korean damage calculation LCIA method proposed by the Ministry of Environment, as a method for life cycle environmental impact assessment (LCIA).
- the first calculating unit 310 may quantitatively calculate the environmental impact for all the environmental impact categories, but may perform calculation on a pre-selected major environmental impact category for the efficiency of the calculation. For example, it analyzes the environmental impact categories applied by the international standards (ISO) and guidelines related to the life cycle environmental impact assessment of buildings, green building certification system and the life cycle environmental impact assessment tool. A category may be selected, and the main environmental impact categories selected in this way may be a total of six types including global warming, acidification, eutrophication, ozone layer destruction, photochemical oxide generation, and resource depletion.
- ISO international standards
- a category may be selected, and the main environmental impact categories selected in this way may be a total of six types including global warming, acidification, eutrophication, ozone layer destruction, photochemical oxide generation, and resource depletion.
- the first storage unit 110 stores the environmental impact unit corresponding to the first and second environmental impact coefficients, the environmental impact unit is the LCI DB (Functional Unit of the product system) built for each product Environmental impacts based on the amount of resources input into the product system (including resources taken from the environment, energy and minerals), and the emissions (air, water) and waste generated in the environment and data on the preliminary inventory. Refers to a quantified value of environmental impact by category.
- the first storage unit 110 may store the environmental impact unit of building materials and energy sources for six environmental impact categories previously derived as the main environmental impact categories of the building.
- the unit of environmental impact corresponding to the first environmental impact coefficient for building materials can be calculated through a life cycle impact assessment (LCIA) (classification, characterization) of a previously established LCI DB.
- LCI DB for building materials is the National LCI DB (Korea LCI DB) established by the Ministry of Environment and the Ministry of Trade, Industry and Energy, and the National D / B for Environmental Information of Building Products (Ministry of Land, Infrastructure and Transport).
- the LCI DB can be selected in the order of regional correlation, temporal correlation, and technical correlation in accordance with ELCA's LCI DB selection principle proposed in ISO 14040. Equation 1 below shows the calculation formula of the environmental impact unit for building materials using LCI DB of building materials.
- EIC1 i, j represents the environmental impact unit of environmental impact categories (j) for the functional units of building materials (i)
- E i, k represents the building materials ( Emissions of Substance (k) per functional unit in i)
- IF j, k refer to the Impact factor of the influence substance (k) for the Environmental Impact Category (j).
- GWP global warming
- AP acidification
- EP side effects
- ODP ozone layer destruction
- POCP photochemical oxides
- ADP resource depletion
- the classification of the data consists of the classification and aggregation of influencers according to environmental impact categories.
- the reference materials and influencers of global warming by IPCC guidelines are carbon dioxide (CO 2 ), CFC-11, CFC-114, CFC-12, etc., as shown in Table 11, and ready-mixed concrete using national LCI DB.
- Classification of 25-240-15 (Ready mixed concrete 25-240-15) is 4.20E + 02 kg-CO 2 / m3, 2.05E-09 kg-CFC-11 / m3, 2.10E-09 kg- CFC-114 / m 3, 4.40E-10 kg-CFC-12 / m 3.
- Table 12 below shows the breakdown of LCI DB of building materials such as ready-mixed concrete 25-240-15, electric steel deformed bars, paint_water type, plate glass, and the like.
- the environmental impact unit of building materials can be quantitatively calculated by multiplying the emission index of the influence material and the impact index for each environmental impact category and summing all of them.
- the impact index of global warming CO 2 and CFC-11, CFC-114 and CFC-13 are 1.00E + 00 kg-CO 2 / kg-CO 2 and 4.00E + 03, respectively.
- the environmental impacts associated with the production of the energy source and the environmental impacts from combustion must be considered at the same time.
- the national LCI DB is selected as the LCI DB for the production stage of the energy source, and the energy source environmental impact unit corresponding to the second environmental impact factor can be calculated through the classification and characterization of the LCI DB as the building materials. Can be.
- Environmental impact unit for the energy source can be calculated by the following equation (2).
- EIC2 i, j represents the environmental impact unit of environmental impact category (j) for the functional unit (FU) of the energy source (i)
- PE i, k is the effect per functional unit resulting from the production of the energy source (i)
- Emission of substance (k) IF j, k is the index of influence of the influence substance (k) on the environmental impact category (j) as listed in Table 11
- CE i, k is the function of combustion of the energy source (i) Represents the emissions of the affected substance (k) per unit.
- EIC2 environmental impact unit
- Units of environmental impact coefficients for each of the environmental impact categories of Global Warming (GWP), Acidification (AP), Side Effects (EP), Ozone Depletion (ODP), Photochemical Oxide (POCP) and Resource Depletion (ADP) Is the weight in kilograms of reference material per functional unit, as shown in Table 13.
- the first calculation unit 310 is a unit of environmental impact on the building material, which is a numerical value corresponding to a probability distribution of input amounts of a plurality of building materials and a first set of environmental impact coefficients stored in the first storage unit 110 using Monte Carlo simulation.
- the probability distribution of the first environmental impact evaluation value can be calculated using the above equation.
- An example of a calculation equation input to the Monte Carlo simulation is shown in Equation 3 below.
- EIR j represents the evaluation result of the environmental impact category (j) of the building
- Q k is the quantity of building materials (k)
- U k is the unit conversion factor between the quantity of building materials and the environmental impact unit
- EIC1 j, k Denotes the unit of environmental impact for the environmental impact category (j) of building materials (k).
- the unit conversion coefficient is a coefficient that adjusts to correspond to the functional unit of the environmental impact unit when the quantity of building materials is coded and input. For example, when 1 ton of cement is input, the environmental impact having the functional unit of kg In order to correspond to the raw unit, a unit conversion coefficient having a value of 1000 is substituted into the above equation (3).
- the first calculation unit 310 replaces the quantity of building materials of Formula 3, that is, the input amount with the consumption amount of the energy source, and replaces the unit of environmental impact on the building material with respect to the probability distribution of the second environmental impact evaluation value.
- Environmental impact on can be calculated by inputting into Monte Carlo simulation by substituting by unit, but is not limited thereto.
- the first operation unit 310 may evaluate the life cycle environmental impact through a pre-built life cycle scenario, and for this purpose, the value for the life cycle environmental impact assessment is a set of the first and second environmental impact coefficients. Can be reflected in.
- the life cycle stage of a building is divided into production stage, construction stage, operation stage, and disposal stage, and scenarios for life cycle environmental impact assessment are established at construction stage, operation stage, and disposal stage except production stage. Can be.
- the construction stage can be divided into transportation process and construction process.
- the transport process evaluates the environmental impact of the process of transporting building materials to the construction site.
- ready-mixed concrete trucks may be used for transporting ready-mixed concrete
- 20-ton trucks may be used for transporting reinforcing steel and section steel.
- other building materials can be used 8ton trucks and all building materials can be set to be procured from the building materials companies within 30km.
- the construction process evaluates the environmental impact of the use of equipment and the operation of the field office during the construction of the building.
- energy consumption in construction process research data indirectly deriving energy consumption in the construction process of multi-unit housing based on the budget statement and the first cost of each district (29 construction works, 22 civil engineering works, 22 landscape engineering works, 22 power consumption) 36 cases) and the recently completed construction site (five apartments), the power consumption measurement and construction daily report can be analyzed.
- the energy consumption of construction equipment can be analyzed by applying the equipment usage status specified in the construction daily report and 8 hours of daily working hours of the Labor Standards Act, and analyzing the total usage time of construction equipment, and applying the fuel efficiency of construction equipment by construction equipment.
- Energy consumption can be calculated. Table 15 below shows the energy consumption of the construction process of the apartment house used in the scenario-based environmental impact assessment by the first calculation unit 310.
- the operational stage can be divided into energy use process and maintenance process.
- the Korean corporate tax law is required to evaluate the environmental impacts of buildings and to compare the results.
- the scenario can be constructed by applying the same 40-year legal life span.
- the maintenance process evaluates the environmental impact of new building materials for building renovation. Therefore, the environmental impact assessment method based on the repair cycle and the repair rate for each building material proposed by the Housing Act can be applied.
- the disposal stage may be classified into a dismantling process of a building, a transportation process of waste construction materials, and a landfill process of waste construction materials.
- the decommissioning process assesses the environmental impact due to the equipment used to dismantle the building.
- the amount of waste building materials is calculated during the dismantling process.
- the amount of waste building materials and the quantity of building materials put in the production stage can be set to be the same.
- the dismantling equipment can be set to Backhoe (1.0m3) + Giant Breaker (0.7m3) which is generally used in the dismantling process according to the results of the existing research.
- the transport process assesses the environmental impact of transporting the generated waste to the treatment plant.
- the transport vehicle is applied to the 15ton truck according to the standard construction of construction, the transport distance can be set to 30km the same as the transportation process of the construction stage.
- the landfill process the environmental impacts of landfill waste materials are evaluated.
- the environmental impact of the recycling process of recycled building materials can be applied only to the cut-off method that the recycling company bears, and only the environmental impact of the landfill process for the non-recycled waste building materials can be considered.
- the landfill equipment can be set as Dozer (D8N, 15 PL, 6 PL) + Compactor (32 ton).
- the waste disposal status by building materials is investigated. Can be set to be embedded.
- the glass can be set to 80% recycled and 20% landfilled.
- gypsum board can be set to 10% recycling and 90% landfill.
- Table 16 shows the energy consumption of the dismantling and landfill equipment stored in the first storage unit 110 for the evaluation of the first calculating unit 310.
- the first operation unit 310 may apply a KOLID (KOrean Life cycle Impact assessment method based on a Damage oriented modeling), which is a damage calculation model developed by the Ministry of Environment, to assess the scenario-based life cycle environmental impact.
- KOLID has six environmental impact categories such as global warming, acidification, side effects, ozone layer destruction, photochemical oxide, and resource depletion, including cancer, infectious diseases, cataracts, malnutrition, land loss, and agricultural production. Quantitatively calculate the damages to the eggplant endpoints and evaluate them as four safety guards for human health, social assets, biodiversity, and primary production, and derive a single final evaluation result as monetary value.
- KOLID the human health of KOLID is DALY, which means the period of dying or disease that does not lead to death, and the indicator of damage, and social assets include crops, fishery resources, forest resources, mineral resources, fossil fuel suppression and exhaustion.
- the economic cost of Korean won (KRW) is taken as the damage indicator.
- EINES an expectation for endangered species of related plants and aquatic organisms
- primary production assesses the amount of organic matter (kg / m2 ⁇ yr) due to photosynthesis of terrestrial plants and marine plankton.
- NPP is the damage indicator.
- the first operation unit 300 may reflect the environmental impact of the entire system through an integration process according to Equation 4 below.
- TI is the environmental impact of the entire system through integration
- Dk is the magnitude of the impact of all the list items classified as protected k
- IFk is the integration factor of protected k
- Loadi, j is classified as impact category i.
- the environmental load of list item j, DFk, i, j, is the damage factor of list item j categorized as impact category i to the protected object k
- Ik represents the environmental impact of the protected object k.
- Table 17 shows the damage coefficients (DFk, i, j) for each reference substance in the environmental impact category, and Table 18 shows the economic value costs (IFk) for each KOLID protected object.
- the damage factor to human health that is protected for the global warming environmental impact category is 1.23 ⁇ 10 -7 DALY / kg-CO 2
- the value cost integration factor is 2.82E + 7
- the environmental impact assessment result of multiplying the damage factor and the integration factor is about 3.47 won / kg-CO 2
- the society protected for the global warming environmental impact category is 2.72 won / kg-CO 2
- the integration factor which is the economic value cost of social assets, is 1.00E + 0, so the environmental impact assessment results for the social assets derived by multiplying the damage factor and the integration factor are 2.72 won / kg-CO 2 will be.
- 6.19 won / kg-CO 2 is the environmental impact for the integration (see Figure 3).
- the first operation unit 310 may derive the environmental impact evaluation value reflecting the scenario by multiplying the environmental impact evaluation value derived by Equation 3 with the environmental impact value for the integration derived by Equation 4. Therefore, the first environmental impact coefficient set and the second environmental impact coefficient set stored in the first storage unit 110 preferably include not only the environmental impact unit but also environmental impact values for integration.
- the second calculating unit 320 uses a probability distribution of a plurality of building materials inputs provided from the probability distribution calculating unit 220 and a first cost coefficient set provided from the second storage unit 120 by Monte Carlo simulation.
- the probability distribution of the first cost evaluation value by the building material is calculated, and the probability distribution of the plurality of energy source consumptions provided from the probability distribution calculation unit 220 and the second cost coefficient set provided from the second storage unit 120 are provided.
- Calculate the probability distribution of the second cost estimate by the energy source calculate the probability distribution of the life cycle cost estimate by summing the probability distribution of the first cost estimate and the probability distribution of the second cost estimate,
- the calculated life cycle cost evaluation value may be output to the second output unit 420.
- the second operation unit 320 is a method for evaluating the life cycle cost of a building in consideration of environmental external costs in the initial stage of a construction project based on the environmental life cycle costing (ELCC) technique proposed by SETAC.
- the Cost Assessment Method can be entered into a Monte Carlo simulation to calculate the probability distribution of life cycle cost estimates.
- the second storage unit 120 stores the building material unit cost and the energy source unit price corresponding to the first cost factor and the second cost factor, at least the unit price per functional unit of the building material included in Table 13, that is, the price Is stored as the material cost factor.
- the energy source cost database stores at least the cost per functional unit for the energy sources included in Table 14 as energy source cost coefficients.
- the cost categories of life cycle perspectives related to the private cost of the building are examined and Major cost categories can be selected that have a significant impact on stakeholder decision making.
- the second operation unit 320 derives major building materials having a high input ratio of direct construction cost for efficient calculation, and based on a present worth method.
- a life-cycle cost formula that consists of the building's private and external costs is available.
- private costs are the costs that are invested in buildings, and are classified into initial investment costs, operating costs, demolition costs, and other costs, and in detail, planning and design costs, direct construction costs, operating energy costs, and maintenance costs. It can be divided into repair cost, general management cost, and demolition cost.
- the second operation unit 320 without being dependent on the physical aspect of the building of the various life cycle cost categories, and can be calculated after excluding the planning, design costs, general management costs, subsidies related to the construction project or building management from the main cost category. It is not limited to this.
- the cost of demolition is a cost category that depends on the physical aspects of the building, but there are many constraints on the prediction and estimation of costs in the early stages of the construction project.
- a major cost category that has a significant impact on stakeholder decision-making at the initial stage of the project, direct construction costs (material costs + labor costs + security costs), operating energy costs, and maintenance costs that depend on the physical aspects of the building can be selected.
- the second operation unit 320 is a direct cost of construction cost for the building material, which is a value corresponding to the probability distribution of the input amount of the plurality of building materials and the first set of cost coefficients stored in the second storage unit 120 by Monte Carlo simulation.
- the probability distribution of the first cost evaluation value may be calculated using the following equation. An example of a calculation equation input to the Monte Carlo simulation is shown in Equation 5 below.
- CR represents the evaluation result of the direct construction cost of the building
- Q k is the quantity of building materials (k)
- U k is the unit conversion factor between the quantity of building materials and the unit cost of direct construction
- CC k is the building materials (k) Indicates the unit price for direct construction cost.
- the second calculation unit 320 replaces the quantity of building materials of Equation 5, that is, the input amount with the consumption amount of the energy source, and replaces the unit cost of the direct construction cost for the building material with respect to the probability distribution of the second cost evaluation value. It may be calculated by substituting the unit price for, but is not limited thereto.
- the second calculator 320 may be calculated in consideration of the economic impact of the building life cycle and the passage of time.
- life cycle cost assessment is to select economically advantageous design alternatives by calculating the total cost of various design alternatives in the early stages of the construction project, so it is necessary to consider the economic impact over time. Future costs should be calculated at the same point in time by appropriate techniques. Such conversion methods may be classified into present value methods and annualized methods.
- the present value analysis method is a method of converting all current and future costs into present values by applying a discount rate
- the annual value analysis method is a method of converting all alternative costs into annual costs. Therefore, the present value analysis method is generally used when the total costing period of an alternative is constant, and the annual value analysis method is used when the alternative costing periods are different.
- the second operation unit 320 may set the life of the building to 40 years, which is a legal life prescribed by the domestic tax law, and may apply a suspension analysis method.
- the cost of the present method is divided into initial cost, recurring cost, and nonrecurring cost.
- the initial cost is the initial cost of the business
- the recurring cost is the same incurred annually during the life of the product system
- the non-recurring cost is the cost incurred intermittently during the life of the product system.
- the direct cost material cost + labor cost + cost
- energy cost, and maintenance cost selected when selecting the main cost categories
- the direct cost is the initial cost
- the energy cost in the operation stage is the recurring cost
- the maintenance cost is the non-repeating cost.
- a discount rate for converting costs and benefits generated at different points on the same basis may be applied to a real interest rate that represents a real change in the value of money by combining market interest rates and inflation rates.
- the second calculator 320 may additionally consider one or more external costs in addition to the private cost, which is an evaluation target of the general LCC, when calculating the probability distribution of the life cycle cost evaluation value. Therefore, the second operation unit 320 is a production step and construction calculated as a result of the environmental life cycle evaluation (ELCA) using KOLID together with the private costs of direct construction costs, energy costs, and maintenance costs selected as the main cost categories. Probability distribution of the life cycle cost evaluation value may be calculated by inputting the following Equation 6 to Monte Carlo simulation by including the external costs of the step and the operation step (including the maintenance process) in each item.
- ELCA environmental life cycle evaluation
- PC C and EC C are the private costs of direct construction and external costs during the production phase
- PC E and EC E are the private and external costs of annual energy consumption
- PC M and EC M are the maintenance costs of building materials.
- I is the real interest rate
- n is the life span of the building
- k is the number of repairs of building materials for 40 years
- a is the repair cycle of building materials.
- the direct construction cost can be calculated by multiplying the input cost and unit price for 10 major building materials, which account for 90 ⁇ 99% of the total direct construction cost.
- the energy cost is the annual energy consumption, unit price, and maintenance cost. This can be estimated by multiplying the input, the repair rate of the building materials, and the unit cost. Equations 7 to 9 show equations for private costs for direct construction costs, annual energy costs, and maintenance costs, respectively.
- the second operation unit 320 may use the WTP (Willing to pay) method and the end point-level damage cost method as a method of considering the external cost of the environmental life cycle cost evaluation (ELCC).
- WTP Warning to pay
- ELCC environmental life cycle cost evaluation
- Can be The willingness to pay is a method that reflects the price that consumers are willing to pay when making a virtual market that consumes a certain group of goods, and the damage estimation method at the endpoint level is based on the theory of economic valuation of environmental impact established in environmental economics. It is a method of converting into cost by integrating with Life Cycle Impact Assessment (LCIA).
- LCIA Life Cycle Impact Assessment
- the second calculation unit 320 limits the value of the protection target (human health, social assets, biodiversity, primary production) based on the damage estimation method at the endpoint level.
- KOLID's economic value cost which is analyzed as a doctor's expense, can be applied as an external cost. That is, the external cost may be calculated by multiplying the damage size for each protection target and the economic value cost quantitatively evaluated by Equation 4 described above. Therefore, the external cost may be calculated based on the environmental impact evaluation results of the production stage, the construction stage, and the operation stage (including the maintenance management process) calculated by the first calculating unit 310, and may be reflected in the life cycle cost evaluation value. Equations 10 to 12 represent calculation formulas of external costs for direct construction costs, annual energy costs, and maintenance costs, respectively.
- EC C and EC E are direct construction costs and external costs of annual energy consumption
- Q m, i and Q e, i are inputs of major building materials (i) and annual consumption of energy sources (i)
- I m, i And I e, i are the unit of damages by protection target according to the environmental impact of the main building materials (i) and energy sources (i)
- F ec is the cost of KOLID's economic value (see Table 118)
- R i is the main building material ( i) means repair rate.
- the second calculation unit 320 prevents double counting of the sustainable building index. This can be excluded from the probability distribution calculation of life cycle cost estimates.
- the third calculating unit 330 performs a whole process by using a probability distribution of a plurality of building materials inputs provided by the probability distribution calculating unit 220 and a social impact coefficient set provided by the third storage unit 130 by Monte Carlo simulation.
- the probability distribution of the social impact evaluation value may be calculated, and the calculated probability distribution of the life cycle social impact evaluation value may be output to the third output unit 430.
- the third calculating unit 330 is a method of evaluating the social impact of buildings at the initial stage of the construction project based on the social life cycle assessment (S-LCA) technique proposed by UNEP / SETAC.
- S-LCA social life cycle assessment
- the Assessment Method can be entered into the Monke Carlo simulation to calculate the probability distribution of life cycle social impact assessment values.
- the third storage unit 130 stores the unit of social impact corresponding to the social impact coefficient.
- the main storage unit may select and store the main unit of social impact from the above-mentioned social issues.
- Life cycle A social impact is a collective term for all or part of a social phenomenon that is harmful or beneficial resulting from the life cycle of a product or service. This impacts on the categories of workers, consumers, local communities, societies, and value chains (processes of generating added value in corporate activities) that are related to the product system, as described above. Can be specified and quantified through social topics that categorize social and interests into detailed categories.
- the social thesis can select the main social issues that meet the evaluation targets and objectives for the calculation of social impact assessment values. Analyze the social issues presented by the Nations Environment Program (WBCSD), World Business Council for Sustainable Development (WBCSD), Global Reporting Initiative (GRI), Global Social Compliance Program (GSCP), and the international standard ISO 26000 (Guidance on social responsibility). Select key social issues.
- the third storage unit 130 may store the social impact unit for only the worker category in which the evaluation method is specifically presented among the various stakeholder categories, and the freedom of collective bargaining and collective bargaining in the worker category, child labor, and fairness.
- Units of social impacts can be stored, including 11 issues, including wages, working hours, forced labor, equal opportunity and discrimination, health and safety, social benefits, training and education, employment relations, and job satisfaction. It is not limited.
- the third calculating unit 330 may calculate the probability distribution of the entire life cycle social impact evaluation value by the following equation 13 by using Monte Carlo simulation, using the probability distribution of the input amount of the main building material and the unit of social impact of the building material. It is not limited to this.
- ten building materials such as concrete, reinforcing bar, glass, concrete brick, insulation, gypsum board, windows, stone, tile, and paint that can be deduced as the main building materials for the environmental and economic aspects of MDUs are the main building materials. It can be selected and set as the object of social impact assessment for the whole life cycle of the building.
- the life cycle assessment of social impacts from the perspective of the building (whether it is greater than or equal to zero) can be useful in determining the social positive or negative impact of the building and its level.
- SIR can represent the life-cycle social impact evaluation value of the building
- Q k is the input of the main building material (k)
- U k is the unit conversion factor between the main building material input and the social impact unit
- SIC k is the main building material ( k) indicates the unit of social impact.
- the third storage unit 130 stores the unit of social impact corresponding to the social impact coefficient for the building material to be put into the building.
- the method of deriving the social impact unit for ready-mixed concrete is as follows.
- site specific data may be preferentially applied, and when it is difficult to apply the site data, generic data based on international or domestic statistical data may be applied.
- generic data based on international or domestic statistical data
- shipments and labor relations of the ready-mixed concrete workplace represent all the characteristics of the domestic ready-mixed concrete workplace.
- evaluation criteria for social topics are expressed as qualitative evaluation criteria
- an analysis method based on Interval Scale can be applied to quantitatively build the unit of social impact of Remicon through evaluation of social topics.
- the isometric scale-based analysis method is to measure the flow of degree coming from various situations and contexts in society from an arbitrary reference point, and the score given to the evaluation object may not necessarily be proportional to the performance of the evaluation object.
- the scores for each social topic are based on the minimum level of welfare and benefits from the social and ethical point of view, or '0' which means the industry average, and the maximum '+2 point' for additional positive impact. At the same time, a minimum '-2' can be given for negative impact.
- the weighted average of the evaluation scores for each social topic can be calculated using the annual shipments of the ready-mixed concrete workplace, and the basic unit of social impact based on this can be constructed.
- Equation 14 shows a weighted average calculation formula for an evaluation score of a workplace.
- WA i is the weighted average of the evaluation criteria (i)
- Q i, j is the score of the ready-mixed workplace (j) to the evaluation criteria (i)
- Q j is the annual shipments of ready-mixed concrete workplace (j).
- Tables 20 to 23 below show the results of the social thesis analysis of the worker category for ready-mixed concrete.
- workers 'rights to freedom of association and collective bargaining include the establishment of labor unions to exercise workers' rights and whether the company is barred from collective bargaining, whether workers 'collective bargaining and negotiations are reflected, and whether workers' representatives are disciplined. Can be evaluated.
- workplace C there are trade unions and some collective bargaining activities, but there are no regular activities to communicate the opinions of workers.
- workplace D collective bargaining activities are actively carried out, and labor-management councils that guarantee workers' voice are regularly operated.
- Child labor can be assessed through the management and compliance system of child labor prevention and the existence of documents that can prove the age of the worker.
- UNICEF The United Nations International Children's Emergency Fund
- Both C and D can be given a '+2' point, and the weighted average based on shipments can also be applied as a '+2.00' point.
- Fair wages can be assessed by paying legal minimum wages and by paying additional living expenses.
- Workplace A is a typical SME that pays all workers the minimum legal wage but no additional living expenses.
- B, C, and D workplaces belong to large corporations or large corporate group companies, and pay not only the minimum wage for all workers but also various living expenses such as factory allowances, qualification allowances, communication expenses, and financial aid.
- workplace A was given a '0' point, while sites B, C, and D were given a '+2' point, and the weighted average based on shipment volume can be calculated as a point of '+1.70'.
- Working hours are evaluated based on compliance with legal standards of working hours and the payment of overtime pay.
- Workplace A has a 40-hour workweek, but due to the nature of the industry, it works from dawn until late in the normal working week, and most of them work on Sundays and other legal holidays. Similar to A, B, C, and D workplaces were introduced with a 40-hour workweek, but work on holidays depending on the operation of the plant. However, when working on holidays, the company operates a large leave or biweekly leave system in consideration of the conditions of the workplace. Therefore, the A-placement was given a '-2' point, and the B, C, and D workplaces were given a '-1' point.
- Forced labor is assessed by the company's forced attribution to a worker's documents (passport, residence permit, etc.) or salary, as well as reasonable working conditions that include the employee's right to leave the company early.
- forced labor is not being conducted at all domestic workplaces. All directly related suppliers strive to prevent forced labor by complying with trade union and labor relations coordination laws. Therefore, the ready-mixed workplaces A, B, C, and D can all be given a '+2' point, and a weighted average based on shipment volume can also be applied as a '+2.00' point.
- Equal opportunities and discrimination can be assessed through the operation of an appeal system related to discrimination and by the payment of equal remuneration for business value equivalent to that of discrimination.
- an appeal system related to discrimination and by the payment of equal remuneration for business value equivalent to that of discrimination.
- the ready-mixed workplaces A, B, C, and D are all +2 Points, and the weighted average based on shipments can be applied as a '+2.00' point.
- Health and safety can be assessed through the provision of health and safety education and the definition of a responsible work system for health and safety.
- all A, B, C, and D workplaces carry out regular safety and health as prescribed by Ordinance of Employment and Labor, and appoint a safety and health manager, supervisor and safety manager who manage the health and safety of workers. do.
- no additional points will be given due to the difficulty in determining whether workers participate in the design, development and review of health and safety training programs, and whether or not to establish and manage disaster levels and reduction targets at the workplace. Therefore, the ready-mixed workplaces A, B, C, and D can all be assigned a '0' point, and a weighted average based on the shipment volume can be applied as a '0.00' point.
- Social benefits can be assessed by granting social benefits, such as severance pay, disability benefits, dependent benefits, survivor benefits, and other additional social benefits.
- Workplace A grants workers only the social benefits set out in the Labor Standards Act, but few other benefits are available.
- workplaces B, C, and D provide all workers with benefits such as factory allowances, position allowances, qualification allowances, and financial aid in addition to the social benefits specified by law. Therefore, the A-placement can be given a '0' point, the B, C, and D-sites a '+2' point, and the weighted average based on the shipment volume can be calculated as a '+1.70' point.
- Training and education can be assessed through the training and training of workers.
- workplace A the company's own education system is not established, and only the minimum statutory training specified in KS regulations is provided.
- B, C, and D workplaces on-line and off-line training related to the job is operated periodically according to the position.
- education credit system is operated to provide education on various cultures and languages as well as education on jobs. Therefore, the A-placement gives '-1' points, and the B, C, and D sites give '+2' points, and the weighted average based on shipments is calculated as '+1.54' points.
- Employment relations can be assessed through the preparation of a labor contract and the type of employment of the employee. All of A, B, C, and D workplaces prepare labor contracts for all workers according to the Labor Standards Act, and the ratio of regular employees is more than 25%. Therefore, the ready-mixed workplaces A, B, C, and D can all be given a '+2' point, and a weighted average based on shipment volume can also be applied as a '+2.00' point.
- Job satisfaction can be assessed by employee turnover.
- the annual turnover rate at workplace A is 15-20%, and at workplace B 8.3-15%.
- C and D workplaces have long service lives of 15 to 20 years and turnover rates are very low. Therefore, A and B sites can receive '-1' points, B and 0 sites, and C and D sites, respectively, with a '+2' point, and the weighted average based on shipments can be calculated as '+0.84' points. .
- the unit of social impact of the building materials stored in the third storage unit 130 may be calculated by dividing the total sum of the major social topics for the worker category by the total score of the distribution, as shown in Equation 15 below. At this time, if the unit of social impact of building materials exceeds 0, it indicates that the building material has a positive social impact, if less than 0, it means that it has a negative impact.
- SIC i represents the unit of social impact on building material (i) corresponding to the social impact coefficient
- ST i, j means the score of the social issue (j) on building material (i).
- the total score and the unit of social impact were calculated as 12.27 points and 0.56, respectively, according to Equation (14) and (15), and ready-mixed concrete had a positive effect on social aspects. It can be analyzed to include building materials.
- the functional unit of the ready-mixed concrete can be expressed as a cubic meter (cubic meter, m3), so the unit of the social impact unit can be defined as a score per cubic meter (point / m3).
- the third storage unit 130 may store the social impact unit value calculated by Equation 16 for not only the worker category but other social issues.
- SIC i is the unit of social impact for building materials (i)
- a i is the weighting factor of building materials (i) taking into account the functional units for each building material
- ST i, j is workers for building materials (i)
- WF j is the weight of the social category of worker category (j)
- n is the number of branches of social issue per stakeholder category
- ST i, k is the consumer of building materials (i).
- WF k is the weight of the consumer category's social issue (k)
- ⁇ , ⁇ is the weight of the stakeholder category, and social impact on the community, society and value chain. It can be extended in the same way.
- the first output unit 410 divides the reference environmental impact evaluation value stored in the first storage unit 110 by the probability distribution of the life cycle environmental impact evaluation value calculated by the first calculation unit 310 to divide the probability distribution of the environmental impact index. Derivation, and output the probability distribution of the derived environmental impact index to the user display means and the probability distribution output unit 500.
- the second output unit 420 may derive a probability distribution of the cost index by dividing the reference cost evaluation value stored in the second storage unit 120 by the probability distribution of the life cycle cost evaluation value calculated by the second operation unit 320, The probability distribution of the derived cost index may be output to the user display means and the probability distribution output unit 500.
- the third output unit 430 divides the probability distribution of the life cycle social impact evaluation value calculated by the third calculating unit 330 by the reference environmental impact evaluation value stored in the third storage unit 130 to divide the probability distribution of the social impact index. Derived and output the derived probability distribution of the social impact index to the user display means and the probability distribution output unit 500.
- Probability distribution output unit 500 by Monte Carlo simulation, probability distribution (P-EI) of the environmental impact index provided by the first output unit 410, the probability of the cost index provided by the second output unit 420
- Probability distribution (P-SBI) of sustainable building index is derived by substituting P-SI and P-SI of social impact index provided from third output unit 430 into Equation 17 below.
- the probability distribution of the derived sustainable building index may be output to a user display means.
- the probability distribution of the environmental impact index, the probability distribution of the cost index, the probability distribution of the social impact index, and the probability distribution of the sustainable building index are preferably derived together by a single Monte Carlo simulation analysis, but are not limited thereto.
- ⁇ , ⁇ , and ⁇ denote weights of P-EI, P-CI, and P-SI, respectively.
- the weights on the environmental, economic, and social aspects can be applied to different environmental, economic and social aspects, depending on the object and purpose of sustainability assessment.
- the average value of the weight may be set to 0.319, 0.339, 0.342 according to the environmental, economic and social aspects, but the weight may be adjusted according to the characteristics of the building to be evaluated and the propensity of the building subject is not limited thereto.
- Building life cycle sustainability evaluation device of the present invention based on EAM, CAM, SAM and Life Cycle Sustainability Assessment (LCSA) technique, stochastic building life cycle sustainability evaluation model that can be used in the early stages of construction projects
- the Probabilistic Sustainability Assessment Model (PSA Model) can be used to derive the probability distribution of the sustainable building index.
- the reference cost evaluation value and the reference social impact evaluation value stored in the first storage unit 110, the second storage unit 120 and the third storage unit 130 can be selected by performing life cycle environmental impact assessment, life cycle cost assessment, and life cycle social impact assessment for 38 apartment complexes constructed in Korea.
- the probability distribution of the environmental impact index, the probability distribution of the cost index, and the probability distribution of the social impact index are derived by the first output unit 410, the second output unit 420, and the third output unit 430.
- the environmental impact evaluation value and the life cycle cost evaluation value in the probability distribution calculated by the first calculation unit 310 and the second calculation unit 320 show better performance as the number is smaller. Therefore, in the environmental impact index and the cost index, the probability distribution, which is the evaluation result of the life cycle environmental impact evaluation value and the life cycle cost evaluation value of the evaluation building, was placed in the denominator, and the reference environmental impact evaluation value and the reference cost evaluation value of the reference building were located in the numerator. I was.
- the life cycle social impact evaluation value calculated by the third calculation unit 330 indicates the social performance of the building, the magnitude of the life cycle social impact evaluation value within the probability distribution and the social performance of the building shows a tendency of proportionality. Therefore, the probability distribution of life cycle social impact assessment values for the evaluation building was placed in the numerator, and the standard social impact assessment values were placed in the denominator. As shown in FIG. 5, the area of the part located in the area where the probability distribution of P-EI, P-CI, and P-SI exceeds 1 based on 1 is the reference building for the environmental, economic, and social level of the evaluation building. The higher the probability, the less the area of the area indicates the lower probability.
- the area of the P-SBI located in the area above 1 means the probability that the level of sustainability of the evaluation building will be higher than that of the standard building, and the area of the area below 1 is less likely to be lower. Indicates.
- the probabilistic evaluation results of the life cycle environmental impact and life cycle costs are calculated based on the ratio scale, so that P-EI and P-CI perform the performance of the evaluation building compared to the reference building.
- P-SI is the result of the life cycle social impact evaluation based on the Interval scale. It does not mean the absolute ratio of the performance of the evaluation building and the reference building.
- P-EI, P-CI, and P-SI represent the stochastic environmental impact index, the stochastic cost index, and the stochastic social impact index of the building, respectively, and R EAM, R , R CAM, R , R SAM, R
- the results of evaluation of the reference building using EAM, CAM, and SAM, respectively, and PR EAM, E , PR CAM, E , PR SAM, E are based on the probability distribution and Monte Carlo simulation of the main building materials. It means the results of probabilistic evaluation of calculated evaluation buildings.
- the reference building for setting the reference environmental impact evaluation value, the reference cost evaluation value, and the reference social impact evaluation value stored in the first storage unit 110, the second storage unit 120, and the third storage unit 130 is continuous.
- Various criteria can be set depending on the purpose of evaluating the possibilities. Therefore, the life cycle environmental impact, life cycle cost, and life cycle social impact of 38 apartment complexes designed and constructed in Korea from 2005 to 2014 are evaluated to suggest various standard building levels.
- AM0091 Electronicgy efficiency technologies and fuel switching in new and existing buildings
- UNFCCC as a methodology of Masdar city's Clean Development Mechanism (CDM) project
- the 20% evaluation result and the top 10% and 30% evaluation result can also be set as the reference building.
- Table 24 below shows an example of the configuration of the multi-family housing complex evaluated as the reference building.
- the BQs which are sampled for evaluating life cycle environmental impacts, life cycle costs, and life cycle social impacts, can be obtained from each construction company.
- the quantity of 10 kinds of materials can be derived. Through this, it is possible to evaluate the inherent environmental impacts, direct construction and maintenance costs, and life cycle social impacts on the production, construction, and disposal stages of buildings.
- the energy consumption characteristics are analyzed by the statistical method, and the data shown in Table 25 below are used as primary energy consumption and secondary energy consumption per unit area. It can be applied to assess the environmental impact and operational energy costs for the operational stage.
- the households constituting the apartment complex are divided into 46m2, more than 46m2, less than 59m2, and 84m2 or more, and apply primary energy consumption units of 46m2, 59m2 and 84m2 respectively. can do.
- Figure 6 shows the life cycle environmental impact assessment results for the sample multi-family housing complex.
- the life cycle environmental impact of the sample building (the monetary value of the environmental impact using KOLID) is calculated from a minimum of 13.8 thousand won / m2 to a maximum of 18.18 million won / m2 per unit dedicated area.
- the life cycle environmental impact assessment results of the top 10%, 20%, and 30% of the sample multi-family complexes were derived 14.20,000 won / m2, 14.7 million won / m2, and 150,000 won / m2, respectively, per unit area. It can be set as the standard environmental impact evaluation value (R EAM, R ) of.
- the life cycle cost of the sample building is calculated from a minimum of KRW 79,000 per square meter to a maximum of 99.6 thousand KRW / m2.
- the baseline cost evaluation value of the building was based on the 81.9 million won / m2, 83.80,000 won / m2, and 84.70,000 won / m2 of unit life, which is the result of the life cycle cost evaluation of the top 10%, 20%, and 30% of the sample apartment complexes. (R CAM, R ).
- FIG. 8 shows the results of the life cycle social impact assessment for the sample multi-family housing complex.
- the life cycle social impact of the sample building is calculated from a minimum of 0.39 points / m2 to a maximum of 0.77 points / m2.
- the life cycle social impact assessment results of the top 10%, 20% and 30% of the sample multi-family complexes were derived as 0.66 points / m2, 0.62 points / m2 and 0.60 points / m2 per unit dedicated area.
- R SAM standard social impact assessment value
- FIG. 4 is a diagram illustrating a system of a building life cycle sustainability evaluation device using the stochastic analysis method of the present invention.
- the overall operation of the building life cycle sustainability evaluation device using the stochastic analysis method of the present invention will be described as follows. .
- the input step is to set the level of environmental, economic and social aspects of the reference building and input the information required for the life cycle sustainability evaluation of the evaluation building.
- the annual architectural energy consumption including the total floor area, floor area, and dedicated area of the evaluated building and the energy simulation tool are inputted.
- probability distributions for 10 kinds of building materials are derived from the information of the building obtained in the input step.
- the probability distribution of the input of building materials per dedicated area is derived according to the structure type of the wall structure, the ramen structure, and the flat plate structure, and the plate type, the tower type, and the complex type of residential building. Glass, concrete bricks, insulation, gypsum boards, windows, stone, tiles and paints are also calculated in the same way as for the ready-mixed concrete and rebar.
- the probability distribution of ready-mixed concrete and reinforcing bars in the main building can be derived according to the floor area of the main building, and the probability distribution of input of building materials per dedicated area is determined according to the total number of households in the apartment complex. do.
- the probability distribution of the input of the detailed building materials derived as described above is used as quantity information for evaluating the production stage of the building, and the construction stage, the disposal stage, and the like are evaluated through the established life cycle scenario as shown in FIG.
- the energy consumption for the building and the quantity of building materials will be derived in the form of probability distribution.
- the life cycle environmental impact, life cycle cost, and life cycle social impact of the building are sequentially evaluated. Finally, the Monte Carlo simulation is used as a tool.
- the production stage evaluates the environmental impact of building materials production through the probability distribution of six major building materials and the environmental impact of building materials (see Equation 3).
- the construction stage calculates the probability distribution of energy consumption for transportation vehicles and buildings for the transportation of six major building materials through the life cycle scenario established in this study, and evaluates the environmental impact using the environmental impact unit of energy source. do.
- the energy consumption of the transportation process is based on the input of six major building materials and fuel economy information for each vehicle.
- the energy consumption of the construction process is calculated based on the total floor area of the evaluation building, but it may be calculated based on the dedicated area. It is not limited.
- the operation stage evaluates the environmental energy consumption of the building's operating energy consumption and the major building materials put into the maintenance process. At this time, the probability distribution of the operating energy consumption is evaluated through the annual operating energy consumption inputted at the input stage, the life of the building for 40 years, and the unit of environmental impact of the energy source.
- the environmental impact of the maintenance process is calculated by calculating the probability distribution of newly inputted building materials through the repair cycle and the repair rate of major building materials, and assessing them using the unit of environmental impact of building materials.
- the disposal phase calculates the probability distribution of the energy consumption of the equipment used in the process of dismantling the building, transporting the waste building materials, and landfilling the waste building materials through life cycle scenarios, and assessing the environmental impact through the unit of environmental impact of the energy source. do.
- the probability distribution of energy consumption during the dismantling process is the total weight of six main building materials (the amount of waste building materials is set equal to the quantity of building materials put in production) and the backhoe (1.0m3) ) Calculate using fuel economy of Giant Breaker (0.7m3).
- the probability distribution of energy consumption in the transportation process is calculated from the total weight of the construction materials and the fuel economy of the 15-ton truck.
- the energy consumption of the landfill process is calculated through the recycling rate of major building materials and the fuel efficiency of Dozer (D8N, 15 PL, 6 PL) + Compactor (32ton).
- the life cycle cost is assessed using the probability distribution of inputs for the ten major building materials entered at the input stage and the probability distribution of annual operating energy consumption.
- direct construction costs are evaluated based on the probability distribution of 10 major building materials and the cost of direct construction for each building material.
- the operation stage evaluates the operating energy costs based on the probability distribution of the building's operating energy consumption and the maintenance costs based on the main building materials input during the building maintenance process.
- the operating energy cost is evaluated using the probability distribution of the annual operating energy consumption, 40 years of the life of the building, and the unit price information and the real discount rate of the energy source.
- the maintenance cost is calculated by calculating the probability distribution of the quantity of building materials input through the repair cycle and the repair rate of the main building materials, and assessing them through the information on the direct cost of building materials.
- the life cycle social impact of the building is evaluated using the probability distribution of the ready-mixed concrete input at the input stage using Equation 15 and the unit of social impact of the ready-mixed concrete constructed in this study.
- the probabilistic life cycle environmental impact the stochastic life cycle cost
- the stochastic life cycle social impact evaluation result of the evaluation building calculated in the calculation stage using Equations 17 to 20, and the reference building set in advance in the input stage Based on the level, the P-EI, P-CI, and P-SI of the evaluation building are calculated, and the P-SBI is output.
- FIG. 2 is a flowchart illustrating a method for evaluating the sustainability of a building life cycle using a probabilistic analysis method of the present invention. Referring to FIGS. 1 to 2, the method for evaluating the sustainability of a building life cycle of the present invention is as follows.
- a reference environmental impact evaluation value for a reference building a first set of environmental impact coefficients that quantify the environmental impacts per unit of input of a plurality of building materials, and a second environment that quantifies the environmental impacts per unit of consumption of a plurality of energy sources
- the set of influence coefficients is stored in the first storage unit 110 (S100).
- the area information of the building, a plurality of building materials input amounts, and a plurality of energy source consumptions are input through the input unit 210 (S200).
- the probability distribution calculation unit 220 the plurality of building materials in accordance with the pre-stored setting values for the probability distribution form of the building materials and energy sources according to the area information of the building for the plurality of building materials input amount and the plurality of energy source consumption amount
- a probability distribution of material inputs and a probability distribution of a plurality of energy source consumptions are derived (S300).
- the first calculating unit 310 uses a Monte Carlo simulation to calculate a probability distribution of a plurality of building materials inputs through the probability distribution calculating unit 220 and the first environmental impact stored in the first storage unit 110. Calculate the probability distribution of the first environmental impact assessment value by building materials using the coefficient set, and the second environmental impact assessment value by energy source using the probability distribution of the plurality of energy source consumptions and the second set of environmental impact coefficients. Calculate the probability distribution of, calculate the probability distribution of the life cycle environmental impact evaluation value by summing the probability distribution of the first environmental impact assessment value and the probability distribution of the second environmental impact assessment value (S400).
- the probability distribution output unit 500 derives the probability distribution of the environmental impact index by dividing the reference environmental impact evaluation value stored in the first storage unit 110 by the probability distribution of the life cycle environmental impact evaluation value calculated above.
- the probability distribution of the environmental impact index is output (S500).
- the first set of cost coefficients quantifying the reference cost evaluation value for the reference building, the degree of cost per unit input of the plurality of building materials, and the second set of cost coefficients quantifying the degree of cost per consumption unit of the plurality of energy sources It may be stored in the second storage unit 120 (S600).
- the second calculator 320 uses a Monte Carlo simulation to calculate a probability distribution of a plurality of building materials inputs through the probability distribution calculator 220 and a first cost factor stored in the second storage 120. Calculate the probability distribution of the first cost estimate by building materials using the set, and use the probability distribution of the plurality of energy source consumptions and the probability distribution of the second cost estimate by the energy source using the second set of cost coefficients.
- the probability distribution of the life cycle cost evaluation value may be calculated by adding the probability distribution of the first cost evaluation value and the probability distribution of the second cost evaluation value (S700).
- the second output unit 420 may derive the probability distribution of the cost index by dividing the reference cost evaluation value stored in the second storage unit 120 by the probability distribution of the life cycle cost evaluation value calculated previously, The probability distribution may be output (S800).
- the set of social impact coefficients quantifying the degree of social impact per input unit of the plurality of building materials and the reference social impact evaluation value for the reference building may be stored in the third storage unit 130 (S900).
- the third calculating unit 330 uses a Monte Carlo simulation to determine the probability distribution of the plurality of building materials inputted through the probability distribution calculating unit 220 and the set of social impact coefficients stored in the third storage unit 130. Probability distribution of the life cycle social impact assessment value can be calculated using (S1000).
- the third output unit 430 derives the probability distribution of the social impact index by dividing the probability distribution of the life cycle social impact evaluation value calculated above by the reference social impact evaluation value stored in the third storage unit 130, and the derived society.
- the probability distribution of the influence index may be output (S1100).
- Probability distribution output unit 500 using Monte Carlo simulation, the probability distribution (P-EI) of the environmental impact index provided from the first output unit 410, the cost index provided from the second output unit 420
- the probability distribution of the sustainable building index (P-SBI) by substituting the probability distribution (P-SI) of the social impact index provided by the probability distribution (P-CI) and the third output unit 430 into Equation 17 described above.
- the probability distribution of the derived sustainable building index may be output to the user display means.
- the entire life cycle sustainability evaluation method using the stochastic analysis method according to the present invention is implemented as a program to be stored in a computer-readable recording medium (CD-ROM, RAM, ROM, floppy disk, hard disk, magneto-optical disk, etc.) Can be.
- a computer-readable recording medium CD-ROM, RAM, ROM, floppy disk, hard disk, magneto-optical disk, etc.
Landscapes
- Engineering & Computer Science (AREA)
- Physics & Mathematics (AREA)
- General Physics & Mathematics (AREA)
- Theoretical Computer Science (AREA)
- Business, Economics & Management (AREA)
- Geometry (AREA)
- Data Mining & Analysis (AREA)
- Computational Mathematics (AREA)
- Mathematical Analysis (AREA)
- Mathematical Optimization (AREA)
- Pure & Applied Mathematics (AREA)
- General Engineering & Computer Science (AREA)
- Mathematical Physics (AREA)
- Evolutionary Computation (AREA)
- Computer Hardware Design (AREA)
- Human Resources & Organizations (AREA)
- Economics (AREA)
- Operations Research (AREA)
- Strategic Management (AREA)
- Probability & Statistics with Applications (AREA)
- Software Systems (AREA)
- Algebra (AREA)
- Marketing (AREA)
- Entrepreneurship & Innovation (AREA)
- General Business, Economics & Management (AREA)
- Tourism & Hospitality (AREA)
- Bioinformatics & Cheminformatics (AREA)
- Bioinformatics & Computational Biology (AREA)
- Evolutionary Biology (AREA)
- Databases & Information Systems (AREA)
- Life Sciences & Earth Sciences (AREA)
- Development Economics (AREA)
- Quality & Reliability (AREA)
- Educational Administration (AREA)
- Health & Medical Sciences (AREA)
- Architecture (AREA)
- General Health & Medical Sciences (AREA)
- Primary Health Care (AREA)
- Structural Engineering (AREA)
- Finance (AREA)
Abstract
본 발명은 건축 사업 초기 단계에서 건축물의 전과정 지속가능성을 확률로 평가 및 예측하는 확률론적 분석 방법을 이용한 건축물 전과정 지속가능성 평가 장치, 방법 및 그 방법을 기록한 기록매체에 관한 것으로, 기준 건축물에 대한 기준 환경영향 평가값, 복수개의 건축자재의 투입 단위 당 환경영향 정도를 수치화한 제1 환경영향계수 집합 및 복수개의 에너지원의 소비 단위 당 환경영향 정도를 수치화한 제2 환경영향계수 집합을 저장하는 제1 저장부; 건축물의 면적 정보, 복수개의 건축자재 투입량 및 복수개의 에너지원 소비량을 입력받는 입력부; 상기 건축물의 면적 정보에 따른 건축자재 및 에너지원의 확률분포 형태의 설정값을 저장하고, 상기 복수개의 건축자재 투입량 및 상기 복수개의 에너지원 소비량에 대하여 상기 설정값에 따라 복수개의 건축자재 투입량의 확률분포 및 복수개의 에너지원 소비량의 확률분포를 도출하는 확률분포 계산부; 몬테카를로 시뮬레이션에 의하여, 상기 복수개의 건축자재 투입량의 확률분포 및 상기 제1 환경영향계수 집합을 이용하여 의해 건축자재에 의한 제1 환경영향 평가값의 확률분포를 계산하고, 상기 복수개의 에너지원 소비량의 확률분포 및 상기 제2 환경영향계수 집합을 이용하여 에너지원에 의한 제2 환경영향 평가값의 확률분포를 계산하며, 상기 제1 환경영향 평가값의 확률분포 및 상기 제2 환경영향 평가값의 확률분포를 합산하여 전과정 환경영향 평가값의 확률분포를 계산하는 제1 연산부; 및 상기 제1 저장부에 저장된 기준 환경영향 평가값을 상기 제1 연산부에서 계산된 상기 전과정 환경영향 평가값의 확률분포로 나누어 환경영향 지수의 확률분포의 확률분포를 도출하고, 도출된 상기 환경영향 지수의 확률분포를 출력하는 제1 출력부를 포함한다.
Description
본 발명은 확률론적 분석 방법을 이용한 건축물 전과정 지속가능성 평가 장치, 방법 및 그 방법을 기록한 기록매체에 관한 것으로서, 특히 상세하게는 건축 사업 초기 단계에서 건축물의 전과정 지속가능성을 확률로 평가 및 예측하는 확률론적 분석 방법을 이용한 건축물 전과정 지속가능성 평가 장치, 방법 및 그 방법을 기록한 기록매체에 관한 것이다.
건축물은 여러 가지 측면에서 지구에 영향을 주게 된다. 건축물을 시공함에 따라 천연 자원의 고갈, 생태계 파괴, 대기 및 수질의 오염, 쓰레기 발생 등 부작용이 발생한다. 또한, 건축물의 많은 설계 요소는 환경에 영향을 미친다. 그러나, 환경을 고려하여 설계를 수행하려는 경우에도, 설계자가 일반적인 환경에 대한 다양한 정보를 바르게 이해하고 이에 따라 설계를 진행하는 것은 어려운 것이 현실이다.
환경영향에 기초한 건축자재의 선정은 전과정 평가(Life-Cycle Assessment, LCA)를 통하여 분석함으로써 가능하다. 이때, 전과정이라 함은, 자재 채취 과정, 자재 공급 과정, 자재 수송 과정, 건축 과정, 사용 과정, 폐기 과정 등 모든 과정을 의미하며, 전과정 평가라 함은, 앞서 언급한 과정에 걸친 물질 수지(투입 물질, 에너지, 배출 물질)를 정량화하고 환경에 미치는 전체 영향을 평가하는 것을 의미한다.
그러나, 종래의 건축물에 대한 전과정 평가 방법에서는, 건축물의 환경영향, 비용 및 사회영향 평가 결과에 대한 불확실성 분석이 중요함에도 불구하고 결정론적 분석 방법으로 이용하므로, 평가 결과에 건축 사업의 불확실한 조건을 반영하기 어려울 뿐만 아니라 분석 결과에 대한 기댓값을 산출할 수 없는 문제점이 있다. 또한, 종래의 건축물에 대한 전과정 평가 방법은, 비대칭 구조의 변수를 반영함에 있어 평균의 함정이 발생할 수 있는 수학적인 한계를 내포하고 있는 문제점이 있다.
[선행기술문헌] 대한민국등록특허공보 제1390237호
본 발명은 상기와 같은 제반 문제점을 해결하기 위하여, 건축 사업 초기 단계에서 의사 결정에 따른 위험부담을 최소화할 수 있도록 건축물의 지속가능성을 보다 객관적으로 평가하고 불확실성을 정량화할 수 있는 확률론적 분석 방법을 이용한 건축물 전과정 지속가능성 평가 장치, 방법 및 그 방법을 기록한 기록매체를 제공하는데 그 목적이 있다.
또한, 본 발명은, 전과정 지속가능성 평가 시 건축물의 특성을 반영하여 확률론적인 관점에서 빈도수가 가장 높은 최빈값을 확인할 수 있으므로 건축사업 초기단계에서 유용한 전과정 지속가능성 평가를 가능하게 하는 확률론적 분석 방법을 이용한 건축물 전과정 지속가능성 평가 장치, 방법 및 그 방법을 기록한 기록매체를 제공하는데 그 목적이 있다.
한편, 본 발명은, 전과정 지속가능성 평가 시 종래의 결정론적 방식의 평가모델에서 산출되지 않았던 기댓값과 확률론적으로 보정된 평균값, 최소값 및 최대값을 동시에 제공함에 따라 의사결정자로 하여금 보다 유용한 정보를 제공하고 의사결정을 효과적으로 지원할 수 있는 확률론적 분석 방법을 이용한 건축물 전과정 지속가능성 평가 장치, 방법 및 그 방법을 기록한 기록매체를 제공하는데 그 목적이 있다.
또한, 본 발명은, 몬테카를로 시뮬레이션을 통해 반복 시행된 평가결과를 바탕으로 하여 확률론적으로 보정된 평균값을 제공할 수 있는 바, 종래의 결정론적 방식의 평가모델에서 주로 적용되었던 평균값 관점의 평가결과보다 유의미한 평가결과를 제공할 수 있는 확률론적 분석 방법을 이용한 건축물 전과정 지속가능성 평가 장치, 방법 및 그 방법을 기록한 기록매체를 제공하는데 그 목적이 있다.
상기와 같은 목적을 달성하기 위하여 본 발명의 일 실시예는, 기준 건축물에 대한 기준 환경영향 평가값, 복수개의 건축자재의 투입 단위 당 환경영향 정도를 수치화한 제1 환경영향계수 집합 및 복수개의 에너지원의 소비 단위 당 환경영향 정도를 수치화한 제2 환경영향계수 집합을 저장하는 제1 저장부; 건축물의 면적 정보, 복수개의 건축자재 투입량 및 복수개의 에너지원 소비량을 입력받는 입력부; 상기 건축물의 면적 정보에 따른 건축자재 및 에너지원의 확률분포 형태의 설정값을 저장하고, 상기 복수개의 건축자재 투입량 및 상기 복수개의 에너지원 소비량에 대하여 상기 설정값에 따라 복수개의 건축자재 투입량의 확률분포 및 복수개의 에너지원 소비량의 확률분포를 도출하는 확률분포 계산부; 몬테카를로 시뮬레이션에 의하여, 상기 복수개의 건축자재 투입량의 확률분포 및 상기 제1 환경영향계수 집합을 이용하여 의해 건축자재에 의한 제1 환경영향 평가값의 확률분포를 계산하고, 상기 복수개의 에너지원 소비량의 확률분포 및 상기 제2 환경영향계수 집합을 이용하여 에너지원에 의한 제2 환경영향 평가값의 확률분포를 계산하며, 상기 제1 환경영향 평가값의 확률분포 및 상기 제2 환경영향 평가값의 확률분포를 합산하여 전과정 환경영향 평가값의 확률분포를 계산하는 제1 연산부; 및 상기 제1 저장부에 저장된 기준 환경영향 평가값을 상기 제1 연산부에서 계산된 상기 전과정 환경영향 평가값의 확률분포로 나누어 환경영향 지수의 확률분포의 확률분포를 도출하고, 도출된 상기 환경영향 지수의 확률분포를 출력하는 제1 출력부를 포함한다.
또한, 상기와 같은 목적을 달성하기 위하여 본 발명의 일 실시예는, 기준 건축물에 대한 기준 비용 평가값, 복수개의 건축자재의 투입 단위 당 비용 소요 정도를 수치화한 제1 비용계수 집합 및 복수개의 에너지원의 소비 단위 당 비용 소요 정도를 수치화한 제2 비용계수 집합을 저장하는 제2 저장부; 몬테카를로 시뮬레이션에 의하여, 상기 복수개의 건축자재 투입량의 확률분포 및 상기 제1 비용계수 집합을 이용하여 건축자재에 의한 제1 비용 평가값의 확률분포를 계산하고, 상기 복수개의 에너지원 소비량의 확률분포 및 상기 제2 비용계수 집합을 이용하여 에너지원에 의한 제2 비용 평가값의 확률분포를 계산하며, 상기 제1 비용 평가값의 확률분포 및 상기 제2 비용 평가값의 확률분포를 합산하여 전과정 비용 평가값의 확률분포를 계산하는 제2 연산부; 및 상기 제2 저장부에 저장된 기준 비용 평가값을 상기 제2 연산부에서 계산된 상기 전과정 비용 평가값의 확률분포로 나누어 비용 지수의 확률분포를 도출하고, 도출된 상기 비용 지수의 확률분포를 출력하는 제2 출력부를 더 포함할 수 있다.
한편, 상기와 같은 목적을 달성하기 위하여 본 발명의 일 실시예는, 기준 건축물에 대한 기준 사회영향 평가값, 복수개의 건축자재의 투입 단위 당 사회영향 정도를 수치화한 사회영향계수 집합을 저장하는 제3 저장부; 몬테카를로 시뮬레이션에 의하여, 상기 복수개의 건축자재 투입량의 확률분포 및 상기 사회영향계수 집합을 이용하여 전과정 사회영향 평가값의 확률분포를 계산하는 제3 연산부; 및 상기 제3 연산부에서 계산된 상기 전과정 사회영향 평가값의 확률분포를 상기 제3 저장부에 저장된 기준 사회영향 평가값으로 나누어 사회영향 지수의 확률분포를 도출하고, 도출된 상기 사회영향 지수의 확률분포를 출력하는 제3 출력부를 더 포함할 수 있다.
또한, 상기와 같은 목적을 달성하기 위하여 본 발명의 일 실시예는, 몬테카를로 시뮬레이션 및

- 여기서, P-SBI는 지속가능 건축물 지수의 확률분포, P-EI는 환경영향 지수의 확률분포, P-CI는 비용 지수의 확률분포, P-SI는 사회영향 지수의 확률분포, α, β, γ는, 1=α+β+ γ 인 가중치 설정 계수임 -
에 의해 지속가능 건축물 지수의 확률분포를 도출하고, 도출된 상기 지속가능 건축물 지수의 확률분포를 출력하는 확률분포 출력부를 더 포함할 수 있다.
한편, 상기와 같은 목적을 달성하기 위하여 본 발명의 다른 실시예는, 기준 건축물에 대한 기준 환경영향 평가값, 복수개의 건축자재의 투입 단위 당 환경영향 정도를 수치화한 제1 환경영향계수 집합 및 복수개의 에너지원의 소비 단위 당 환경영향 정도를 수치화한 제2 환경영향계수 집합을 저장하는 제1 단계; 건축물의 면적 정보, 복수개의 건축자재 투입량 및 복수개의 에너지원 소비량을 입력받는 제2 단계; 상기 복수개의 건축자재 투입량 및 상기 복수개의 에너지원 소비량에 대하여 상기 건축물의 면적 정보에 따른 건축자재 및 에너지원의 확률분포 형태에 관해 미리 저장된 설정값에 따라 복수개의 건축자재 투입량의 확률분포 및 복수개의 에너지원 소비량의 확률분포를 도출하는 제3 단계; 몬테카를로 시뮬레이션에 의해, 상기 복수개의 건축자재 투입량의 확률분포 및 상기 제1 환경영향계수 집합을 이용하여 건축자재에 의한 제1 환경영향 평가값의 확률분포를 계산하고, 상기 복수개의 에너지원 소비량의 확률분포 및 상기 제2 환경영향계수 집합을 이용하여 에너지원에 의한 제2 환경영향 평가값의 확률분포를 계산하며, 상기 제1 환경영향 평가값의 확률분포 및 상기 제2 환경영향 평가값의 확률분포를 합산하여 전과정 환경영향 평가값의 확률분포를 계산하는 제4 단계; 및 상기 기준 환경영향 평가값을 상기 제4 단계에서 계산된 상기 전과정 환경영향 평가값의 확률분포로 나누어 환경영향 지수의 확률분포를 도출하고, 도출된 상기 환경영향 지수의 확률분포를 출력하는 제5 단계를 포함한다.
또한, 상기와 같은 목적을 달성하기 위하여 본 발명의 다른 실시예는, 기준 건축물에 대한 기준 비용 평가값, 복수개의 건축자재의 투입 단위 당 비용 소요 정도를 수치화한 제1 비용계수 집합 및 복수개의 에너지원의 소비 단위 당 비용 소요 정도를 수치화한 제2 비용계수 집합을 저장하는 제6 단계; 몬테카를로 시뮬레이션에 의해, 상기 복수개의 건축자재 투입량의 확률분포 및 상기 제1 비용계수 집합을 이용하여 건축자재에 의한 제1 비용 평가값의 확률분포를 계산하고, 상기 복수개의 에너지원 소비량의 확률분포 및 상기 제2 비용계수 집합을 이용하여 에너지원에 의한 제2 비용 평가값의 확률분포를 계산하며, 상기 제1 비용 평가값의 확률분포 및 상기 제2 비용 평가값의 확률분포를 합산하여 전과정 비용 평가값의 확률분포를 계산하는 제7 단계; 및 상기 기준 비용 평가값을 상기 제7 단계에서 계산된 상기 전과정 비용 평가값의 확률분포로 나누어 비용 지수의 확률분포를 도출하고, 도출된 상기 비용 지수의 확률분포를 출력하는 제8 단계를 더 포함할 수 있다.
한편, 상기와 같은 목적을 달성하기 위하여 본 발명의 다른 실시예는, 기준 건축물에 대한 기준 사회영향 평가값, 복수개의 건축자재의 투입 단위 당 사회영향 정도를 수치화한 사회영향계수 집합을 저장하는 제9 단계; 몬테카를로 시뮬레이션에 의해, 상기 복수개의 건축자재 투입량의 확률분포 및 상기 사회영향계수 집합을 이용하여 전과정 사회영향 평가값의 확률분포를 계산하는 제10 단계; 및 상기 제10 단계에서 계산된 상기 전과정 사회영향 평가값의 확률분포를 상기 기준 사회영향 평가값으로 나누어 사회영향 지수의 확률분포를 도출하고, 도출된 상기 사회영향 지수의 확률분포를 출력하는 제11 단계를 더 포함할 수 있다.
또한, 상기와 같은 목적을 달성하기 위하여 본 발명의 다른 실시예는, 몬테카를로 시뮬레이션 및

- 여기서, P-SBI는 지속가능 건축물 지수의 확률분포, P-EI는 환경영향 지수의 확률분포, P-CI는 비용 지수의 확률분포, P-SI는 사회영향 지수의 확률분포, α, β, γ는, 1=α+β+γ인 가중치 설정 계수임 -
에 의해 지속가능 건축물 지수의 확률분포를 도출하고, 도출된 상기 지속가능 건축물 지수의 확률분포를 출력하는 제12 단계를 더 포함할 수 있다.
또한, 상기와 같은 목적을 달성하기 위하여 본 발명의 또 다른 실시예는, 확률론적 분석 방법을 이용한 건축물 전과정 지속가능성 평가 방법을 실행하는 프로그램을 기록한 컴퓨터 판독 가능한 기록매체를 제공할 수 있다.
전술한 본 발명에 따르면, 건축물의 지속가능성을 보다 객관적으로 평가하고 불확실성을 정량화할 수 있으므로, 건축 사업 초기 단계에서 의사 결정에 따른 위험부담을 최소화할 수 있는 효과가 있다.
또한, 본 발명은, 전과정 지속가능성 평가 시 건축물의 특성을 반영하여 확률론적인 관점에서 빈도수가 가장 높은 최빈값을 확인할 수 있으므로 건축사업 초기단계에서 유용한 평가 결과를 제공할 수 있는 효과가 있다.
한편, 본 발명은, 전과정 지속가능성 평가 시 종래의 결정론적 방식의 평가모델에서 산출되지 않았던 기댓값과 확률론적으로 보정된 평균값, 최소값 및 최대값을 동시에 제공함에 따라 의사결정자로 하여금 보다 유용한 정보를 제공할 수 있는 효과가 있다.
또한, 본 발명은, 몬테카를로 시뮬레이션을 통해 반복 시행된 평가결과를 바탕으로 하여 확률론적으로 보정된 평균값을 제공할 수 있는 바, 종래의 결정론적 방식의 평가모델에서 주로 적용되었던 평균값 관점의 평가결과보다 유의미한 평가결과를 제공할 수 있는 효과가 있다.
도 1은 본 발명의 일 실시예에 의한 확률론적 분석 방법을 이용한 건축물 전과정 지속가능성 평가 장치의 블록도이다.
도 2는 본 발명의 일 실시예에 의한 확률론적 분석 방법을 이용한 건축물 전과정 지속가능성 평가 방법의 동작 흐름도이다.
도 3은 본 발명의 일 실시예에 의한 확률론적 분석 방법을 이용한 건축물 전과정 지속가능성 평가 장치의 환경영향 평가 동작을 설명하는 도면이다.
도 4는 본 발명의 확률론적 분석 방법을 이용한 건축물 전과정 지속가능성 평가 장치의 동작을 나타낸 도면이다.
도 5는 본 발명의 확률론적 분석 방법을 이용한 건축물 전과정 지속가능성 평가 장치의 평가 구조를 나타낸 도면이다.
도 6은 표본 공동주택 단지에 대한 전과정 환경영향 평가결과를 나타낸 그래프이다.
도 7은 표본 공동주택 단지에 대한 전과정 비용 평가결과를 나타낸 그래프이다.
도 8은 표본 공동주택 단지에 대한 전과정 사회영향 평가결과를 나타낸 그래프이다.
도 9에 본 발명의 일 실시예에 의한 확률론적 분석 방법을 이용한 건축물 전과정 지속가능성 평가 장치의 전과정 시나리오를 도시한 도면이다.
[부호의 설명]
110: 제1 저장부
120: 제2 저장부
130: 제3 저장부
210: 입력부
220: 확률분포 계산부
310: 제1 연산부
320: 제2 연산부
330: 제3 연산부
410: 제1 출력부
420: 제2 출력부
430: 제3 출력부
500: 확률분포 출력부
이하, 첨부된 도면을 참조하여 본 발명의 바람직한 실시예를 설명한다. 그러나 본 발명의 실시형태는 여러 가지의 다른 형태로 변형될 수 있으며, 본 발명의 범위가 이하 설명하는 실시형태로만 한정되는 것은 아니다. 도면에서의 요소들의 형상 및 크기 등은 보다 명확한 설명을 위해 과장될 수 있으며, 도면상의 동일한 부호로 표시되는 요소는 동일한 요소이다.
한편, 본 출원에서 서술되는 용어의 의미는 다음과 같이 이해되어야 할 것이다.
"제1", "제2" 등의 용어는 하나의 구성요소를 다른 구성요소로부터 구별하기 위한 것으로 이들 용어들에 의해 권리범위가 한정되어서는 아니 된다. 예를 들어, 제1 구성요소는 제2 구성요소로 명명될 수 있고, 유사하게 제2 구성요소도 제1 구성요소로 명명될 수 있다.
그리고 명세서 전체에서, 어떤 부분이 다른 부분과 "연결"되어 있다고 할 때 이는 "직접적으로 연결"되어 있는 경우뿐만 아니라 그 중간에 다른 소자를 사이에 두고 "전기적으로 연결"되어 있는 경우도 포함한다. 또한, 어떤 부분이 어떤 구성요소를 "포함" 또는 "구비"한다고 할 때, 이는 특별히 반대되는 기재가 없는 한 다른 구성요소를 제외하는 것이 아니라 다른 구성요소를 더 포함하거나 구비할 수 있는 것을 의미 한다.
도 1은 본 발명의 일 실시예에 의한 확률론적 분석 방법을 이용한 건축물 전과정 지속가능성 평가 장치의 블록도이고, 도 4는 본 발명의 확률론적 분석 방법을 이용한 건축물 전과정 지속가능성 평가 장치의 동작을 나타낸 도면이며, 본 발명의 확률론적 분석 방법을 이용한 건축물 전과정 지속가능성 평가 장치는, 제1 저장부(110), 제2 저장부(120), 제3 저장부(130), 입력부(210), 확률분포 계산부(220), 제1 연산부(310), 제2 연산부(320), 제3 연산부(330), 제1 출력부(410), 제2 출력부(420), 제3 출력부(430) 및 확률분포 출력부(500)를 포함할 수 있다.
제1 저장부(110)는, 기준 건축물에 대한 기준 환경영향 평가값, 복수개의 건축자재의 투입 단위 당 환경영향 정도를 수치화한 제1 환경영향계수 집합 및 복수개의 에너지원의 소비 단위 당 환경영향 정도를 수치화한 제2 환경영향계수 집합을 저장하고, 저장된 제1 환경영향계수 집합 및 제2 환경영향계수 집합을 제1 연산부(310)로 출력하며, 저장된 기준 환경영향 평가값을 제1 출력부(410)로 출력할 수 있다.
이때, 제1 환경영향계수 및 제2 환경영향계수는 환경영향 범주(Environmental impact categories)를 기준으로 수치화되는 것이 바람직하다. 환경영향 범주는 환경영향 물질이 야기하는 잠재적인 지구의 환경 변화를 과학적인 접근을 통해 세분화한 개념이다. 이는 지구온난화(GWP, Global Warming Potential), 산성화(AP, Acidification Potential), 부영양화(EP, Eutrophication Potential), 오존층 파괴(ODP, Ozone Layer Depletion Potential), 광화학적 산화물 생성(POCP, Photochemical Oxidation Potential), 자원소모(ADP, Abiotic Depletion Potential) 등을 포함하며, 다양한 환경보호 범주(Safety category) 및 보호대상(Safety guard)에 걸쳐 지구규모, 지역적 규모, 국지적 규모의 환경영향을 발생시킨다.
여기서, GWP는 화석연료의 연소 등으로 인해 발생되는 온실가스가 지구로부터 복사되는 적외선을 흡수함에 따라 지구 표면의 평균온도가 상승하는 기상이변 현상으로서 토양이나 수계에서 생태계가 변화하거나 해수면이 상승하는 환경문제를 야기한다. 지구온난화의 환경영향 물질은 이산화탄소(CO2) 메탄(CH4), 이산화질소(N2O) 등 총 42가지이며, 기준물질은 CO2이다.
AP는 대기 오염물질의 순환에 의해 발생된 산성비로 인해 해양과 토양의 수소이온농도가 증가(pH 감소)되는 지역적 규모의 환경문제로서 중금속의 용출로 인해 어류, 식물, 동물 등 생물의 생존을 위협한다. 산성화의 환경영향 물질은 이산화황(SO2), 질소산화물(NOx), 황화수소(H2S), 플루오린화수소(HF) 등 36가지이고 기준물질은 SO2이다.
EP는 화학 비료나 오수의 유입 등으로 인해 영양 물질의 양이 비정상적으로 증가하여 해양환경에 악영향을 미치는 국지적 규모의 환경문제이다. 부영양화의 환경영향 물질은 인산염(PO4
3-), 암모니아(NH3), 질소산화물(NOx) 등 총 39가지이며, 기준물질은 PO4
3-이다.
ODP는 지상으로부터 15~30km 높이의 성층권에 있는 오존층의 오존이 파괴되어 그 밀도가 낮아지는 현상으로 자외선 증가로 인한 피부성 질환(피부암, 결막염 등)을 유발시킨다. 오존층파괴에 대한 환경영향 물질은 염화불화탄소 11(CFC-11), 브롬화삼불화메탄(Halon-1301), 염화불화탄소 114 등 23가지이고 기준물질은 CFC-11이다.
POCP는 공기 중의 오염물질이 태양빛과 반응하여 오존(O3)과 같은 화학적 화합물을 생성하는 반응으로 스모그 현상을 유발하며, 인체건강 및 농작물 발육 억제 등 생태계의 손실을 야기한다. 광화학적 산화물 생성의 환경영향 물질은 에틸렌(C2H4), 비메탄계 탄화수소(NMVOC), 에탄올(C2H5OH) 등 128가지이고 기준물질은 C2H4이다.
ADP는 제품을 생산하기 위해 자연계에서 기술계로 투입되는 자원에 대한 환경적인 영향을 나타내는 범주로써 지나친 자원의 채집과 소비에 따른 생태계의 균형 파괴와 환경오염을 평가한다. 자원소모는 원유[Crude oil], 천연가스[Natural gas], 우라늄(U) 등을 포함한 89가지의 천연자원을 고려하며, 기준물질은 안티몬(Sb)이다.
제2 저장부(120)는, 기준 건축물에 대한 기준 비용 평가값, 복수개의 건축자재의 투입 단위 당 비용 소요 정도를 수치화한 제1 비용계수 집합 및 복수개의 에너지원의 소비 단위 당 비용 소요 정도를 수치화한 제2 비용계수 집합을 저장하고, 저장된 제1 비용계수 집합 및 제2 비용계수 집합을 제2 연산부(320)로 출력하며, 저장된 기준 환경영향 평가값을 제2 출력부(420)로 출력할 수 있다.
여기서, 제1 비용계수 및 제2 비용계수는, 제품 시스템의 생산단계와 사용단계 등 전과정 기간 동안 직접적으로 투입된 모든 비용을 반영할 뿐 아니라, 하나 이상의 외부비용(External cost)을 추가적으로 고려하는 방법으로써 기존의 전과정 비용을 의미하는 사적비용(Private cost)과 환경영향에 대한 외부비용을 반영할 수 있다.
제3 저장부(130)는, 기준 건축물에 대한 기준 사회영향 평가값, 복수개의 건축자재의 투입 단위 당 사회영향 정도를 수치화한 사회영향계수 집합을 저장하고, 저장된 사회영향계수 집합을 제3 연산부(330)로 출력하며, 저장된 기준 환경영향 평가값을 제3 출력부(430)로 출력할 수 있다.
여기서, 사회영향계수는, 사회적 논제에 관련한 사회영향 정도를 수치화한 값으로, "Guidelines for Social Life Cycle Assessment of Products"에 따르면 S-LCA의 사회적 논제는 총 5개의 이해관계자 범주와 이를 구성하는 다수의 사회적 논제로 구분된다. 이는 주로 제품 시스템을 생산 및 제공하는 특정 기업, 조직 또는 사업이 그들의 이해관계자(근로자, 소비자, 지역사회, 사회, 가치사슬)에게 미치는 사회적인 영향의 정도를 판단하는 기준으로써 대표적인 사회적 논제에 대한 정의와 그 내용은 아래와 같다.
근로자(Worker)에 관한 사회적 논제는, 인권 협회와 단체 교섭의 자유(Freedom of association and collective bargaining)는 기업 또는 조직이 근로자 각자의 이익을 증진하고 이를 보호하기 위해 노동조합(Union)의 창설과 노동조합에 가입할 수 있는 자유와 권리를 부여하는 것을 의미한다. 이때, 근로자는 자유롭게 노동조합에 가입할 수 있어야 하며, 이에 대한 외부의 개입과 차별이 없어야 한다. 또한, 노동조합은 근로자의 파업, 노동조합장의 선출, 노동조합의 활동과 프로그램의 공식화 등에 대한 자유와 권리를 가져야 한다.
아동 노동(Child labour)은 기업 또는 조직이 아동을 노동에 참여시킴으로써 아동의 잠재력과 존엄성을 박탈하고 신체와 정신적인 성장을 저해하는 것을 의미한다. 아동 노동의 형태는 아동을 노예화하고 심각한 위험과 질병에 노출시키는 것, 아동을 그들의 가족과 이별시키는 것 등으로 이뤄진다.
공정임금(Fair salary)은 기업 또는 조직이 근로자의 정상 근로시간에 대해 적어도 국가의 최저임금법, 협회 및 업계 표준임금 등에서 규정한 최저 임금 이상을 근로자에게 지급하는 것을 의미한다. 이때, 임금의 수준은 표준 근로시간을 근무한 근로자를 기준으로 근로자와 그 가족이 온당한 생활수준을 영위함에 있어 충분한 수준이 되어야 한다.
근로시간(Working hours)은 기업 또는 조직이 근로자에게 법적 근로시간과 공휴일, 업계의 표준 근로시간 등을 고려하여 적절한 근로시간을 부여하는 것을 의미한다. 국내의 경우 법적 근로시간은 한 주당 40시간(초과 근로시간 제외)이며, 7일 중 적어도 하루 이상의 휴일이 제공되어야 한다. 또한, 초과 근로는 한 주당 12시간 이내에서 자발적인 근무 환경과 분위기에서 이뤄져야 하며, 법적 또는 노동조합에서 규정한 초과 근무수당이 지급되어야 한다.
강제노동(Forced labour)은 기업 또는 조직 내에서 근로자가 업무에 자발적으로 참여하는 것이 아니라 누군가로 인한 위협과 불이익(Penalty)으로 인해 강요되는 노동을 의미한다. 강제노동은 채무적 압박(Debt bondage), 계약노예(Indentured servant), 인신매매(Human trafficking) 등을 포함한다. 근로자는 관리자의 간섭(Interference)과 위협(Intimidation)에 따른 제약 없이 자유롭게 작업장을 왕래할 수 있어야 하며, 업무 이외의 시간에 대한 자유가 보장되어야 한다.
균등기회 및 차별(Equal opportunities & discrimination)은 기업 또는 조직이 근로자의 인적 다양성을 인정하고 종교, 성별, 인종, 나이 등에 관계없이 동등한 업무적 가치에 대해 동등한 보수를 지급하는 것을 의미한다.
건강과 안전(Health and safety)은 기업 또는 조직이 모든 근로자의 신체적, 정신적, 사회적 안녕(Well-being)의 수준을 향상시키고 이를 유지하는 것을 의미한다. 이때, 작업환경은 근로자의 건강에 유해하지 않아야 하고, 위험 요소로부터 근로자를 보호해야 한다. 또한, 작업장은 근로자의 생리적, 심리적 기능에 악영향을 끼치지 않는 곳에 위치해야 하며, 근로자의 성별과 직무적합도 등을 고려한 업무 배치가 이뤄져야 한다.
사회적 혜택(Social benefits)은 기업 또는 조직이 근로자에게 임금의 지불뿐만 아니라, 사회복지와 관련된 모든 관련 법률을 준수하는 것을 의미한다. 사회적 혜택은 일반적으로 근로자의 근무 기록(연봉 또는 수입)에 기초하여 지급되며, 퇴직금(Severance pay), 장애수당, 부양가족 수당, 유족 급여 등을 포함한다.
소비자(Consumer)에 관한 사회적 논제는, 건강과 안전(Health and safety)은 기업 또는 조직이 생산한 제품을 소비자가 사용할 때 그 제품이 의도된 기능(Intended functions)을 충분히 수행하고, 소비자의 건강과 안전을 해치지 않는 것을 의미한다. 또한, 제품은 최종 소비자(End-users)의 건강과 안전에 미칠 수 있는 위험요소와 긍정적인 효과를 모두 고려해야 한다.
지역사회(Local community)에 관한 사회적 논제는, 물적 자원에 대한 접근(Access to material resources)은 기업 또는 조직에서 지역사회가 보유한 물적 자원(물, 토지, 광물 및 생물자원 등)과 기반시설(도로, 위생시설, 학교 등)에 대해 존중하고 이를 보호하는 것을 의미한다. 이는 원주민(Indigenous)이 보유한 토지의 권리를 포함하며, 물적 자원의 사용과 기반시설의 보호 및 강화를 위한 지역 커뮤니티와의 상호 공유 체계를 포함한다. 또한, 물적 자원에 대한 사용은 궁극적으로 지역사회의 장기적인 경제 발전에 긍정적인 요소로 작용해야 한다.
안전하고 건강한 생활환경(Safe & healthy living conditions)은 기업 또는 조직에서 지역사회 구성원의 안전과 건강, 그리고 공중보건 등을 위해 노력하는 것을 의미한다. 즉, 지역사회 내 위치한 기업 또는 조직의 사업부지에 대한 무분별한 이용과 개발은 산사태 등의 자연재해를 야기할 수 있으며, 정화되지 않은 폐수의 배출과 근로자의 급격한 유입은 지역 커뮤니티 내 전염병의 확산을 촉진할 수 있기 때문이다.
지역사회 참여(Community engagement)는 기업 또는 조직의 의사결정 과정에서 지역사회의 구성원을 이해관계자로 포함시키는지에 대한 여부를 의미한다. 특히, 지역사회의 환경과 그 구성원의 건강 및 안녕에 관련된 의사결정 및 사업 정책의 실현 과정에서는 반드시 지역사회(개인 또는 지역사회 전체)를 이해관계자에 포함시켜야 한다.
지역고용(Local employment)은 지역사회에 거주하고 있는 구성원의 고용과 관련하여 기업 또는 조직이 주관하는 직접적인 역할(직업 창출, 수익 창출, 직업 교육 등)을 의미한다. 이를 통해 지역사회의 구성원과 개방적인 의사소통 및 유대관계를 도모할 수 있으며, 지역사회의 발전에 기여할 수 있다.
입력부(210)는, 건축물의 면적 정보, 복수개의 건축자재 투입량 및 복수개의 에너지원 소비량을 입력받고, 입력된 복수개의 건축자재 투입량 또는 복수개의 에너지원 소비량을 확률분포 계산부(220)로 출력한다. 즉, 입력부(210)는, 물량산출서에 기초하여 주요 건축자재 10종(레미콘, 철근, 유리, 콘크리트벽돌, 단열재, 석고보드, 창호, 석재, 타일, 페인트)에 대한 투입량을 입력받고, 에너지 시뮬레이션 도구 등을 통해 평가된 연간 운영 에너지소비량을 에너지원별로 구분하여 입력받을 수 있다. 에너지 시뮬레이션 도구로는, 연간 에너지 소비량을 산출할 수 있는 도구인 미국 에너지성의 지원 하에 LBL(Lawrence Berkely Laboratory)에서 개발된 DOE-2, 미국 육군성이 개발한 BLAST 등이 사용될 수 있으나 이에 한정되지 않는다.
입력부(210)는, 기준물에 대한 기준 환경영향 평가값, 기준 비용 평가값 및 기준 사회영향 평가값의 수준을 입력받아 제1 저장부(110), 제2 저장부(120) 및 제3 저장부(130)에 저장할 수 있으며, 건축 설계도서를 바탕으로 평가 건축물의 연면적, 바닥면적, 전용면적 등을 포함한 건축물의 면적 정보를 입력받을 수 있다.
확률분포 계산부(220)는, 건축물의 면적 정보에 따른 건축자재 및 에너지원의 확률분포 형태의 설정값을 저장하고, 입력부(210)로부터 제공받은 복수개의 건축자재 투입량 및 복수개의 에너지원 소비량에 대하여 기 저장된 설정값에 따라 복수개의 건축자재 투입량의 확률분포 및 복수개의 에너지원 소비량의 확률분포를 도출하며, 도출된 복수개의 건축자재 투입량의 확률분포 및 복수개의 에너지원 소비량의 확률분포를 제1 연산부(310), 제2 연산부(320) 또는 제3 연산부(330)에 출력한다.
확률분포 계산부(220)에 저장된 건축자재 및 에너지원의 확률분포 형태의 설정값 및 확률분포를 도출하는 동작에 대하여 상술하면 아래와 같다.
먼저, 국내에서 최근 10년간 설계되어 건설된 38개의 공동주택 단지(하기 표 24 참조)를 표본으로 설정하고 건축물의 특징과 주요 건축자재에 대한 상관관계를 분석하여 주요 변수를 도출한다. 또한, 주요 변수와 주요 건축자재의 물량 정보를 이용하여 분포 적합(Fit distribution)과 적합도 검정을 통해 주요 건축자재에 대한 확률분포를 분석할 수 있다.
건축물 특징에 따른 주요 건축자재의 확률분포를 분석하기 위해서는 이들이 갖는 상관관계를 분석하고 이에 적합한 변수를 설정해야 하는데, 앞서 표본으로 설정한 38개 공동주택 단지의 기본정보와 주요 건축자재의 물량 정보를 수집하여 데이터베이스로 구축하고, 피어슨(Pearson) 상관계수를 이용하여 이들의 상관관계를 분석한다.
이때, 38개의 공동주택 단지는 이를 구성하는 건축물의 기능에 따라 443개의 주거동, 88개의 부속동, 38개의 지하주차장으로 세분화하고 건축사업 초기단계에서 결정되는 설계변수를 중심으로 상관관계 분석을 위한 변수를 도출한다. 즉, 주거동은 구조형식, 평면형태, 주호조합, 지상층수, 건축면적, 전용면적, 바닥면적, 세대수로 구성되는 총 8가지의 특징을 변수로 설정하고 부속동은 지상층수와 바닥면적의 2가지 변수, 그리고 지하주차장은 지하층수, 지하연면적, 세대수의 총 3가지 특징을 변수로 설정한다.
통계 프로그램의 이변량 상관계수 분석 기능을 통해 상술한 변수와 주요 건축자재의 물량간의 피어슨 상관계수를 도출한다. 여기서 피어슨 상관계수는 두 변수간의 관계성을 판별하기 위해 사용되는 척도로써 두 변수 간의 값이 -1≤R≤1의 값을 가지며, 그 값에 따라 상관계수의 상관성을 확인할 수 있다. 즉, 피어슨 상관계수가 0.0~0.1이면 이들의 상관관계가 없음을 의미하고 0.1~0.2는 약한 양의 상관관계, 0.2~0.4는 보통의 양의 상관관계, 0.4~0.6은 비교적 강한 양의 상관관계, 0.6~0.8은 강한 양의 상관관계, 0.8~1.0은 매우 강한 양의 상관관계를 나타낸다.
상관계수를 분석함에 있어 주거동은 상술한 10종의 주요 건축자재를 모두 포함하여 분석하고 부속동과 지하주차장은 주요 건축자재 중 가장 영향력이 높은 레미콘과 철근만을 대상으로 할 수 있다. 하기 표 1 내지 표 3은 각각 주거동, 부속동, 지하주차장에 대한 상관계수표를 나타낸다.
[표 1]
[규칙 제91조에 의한 정정 09.02.2017]
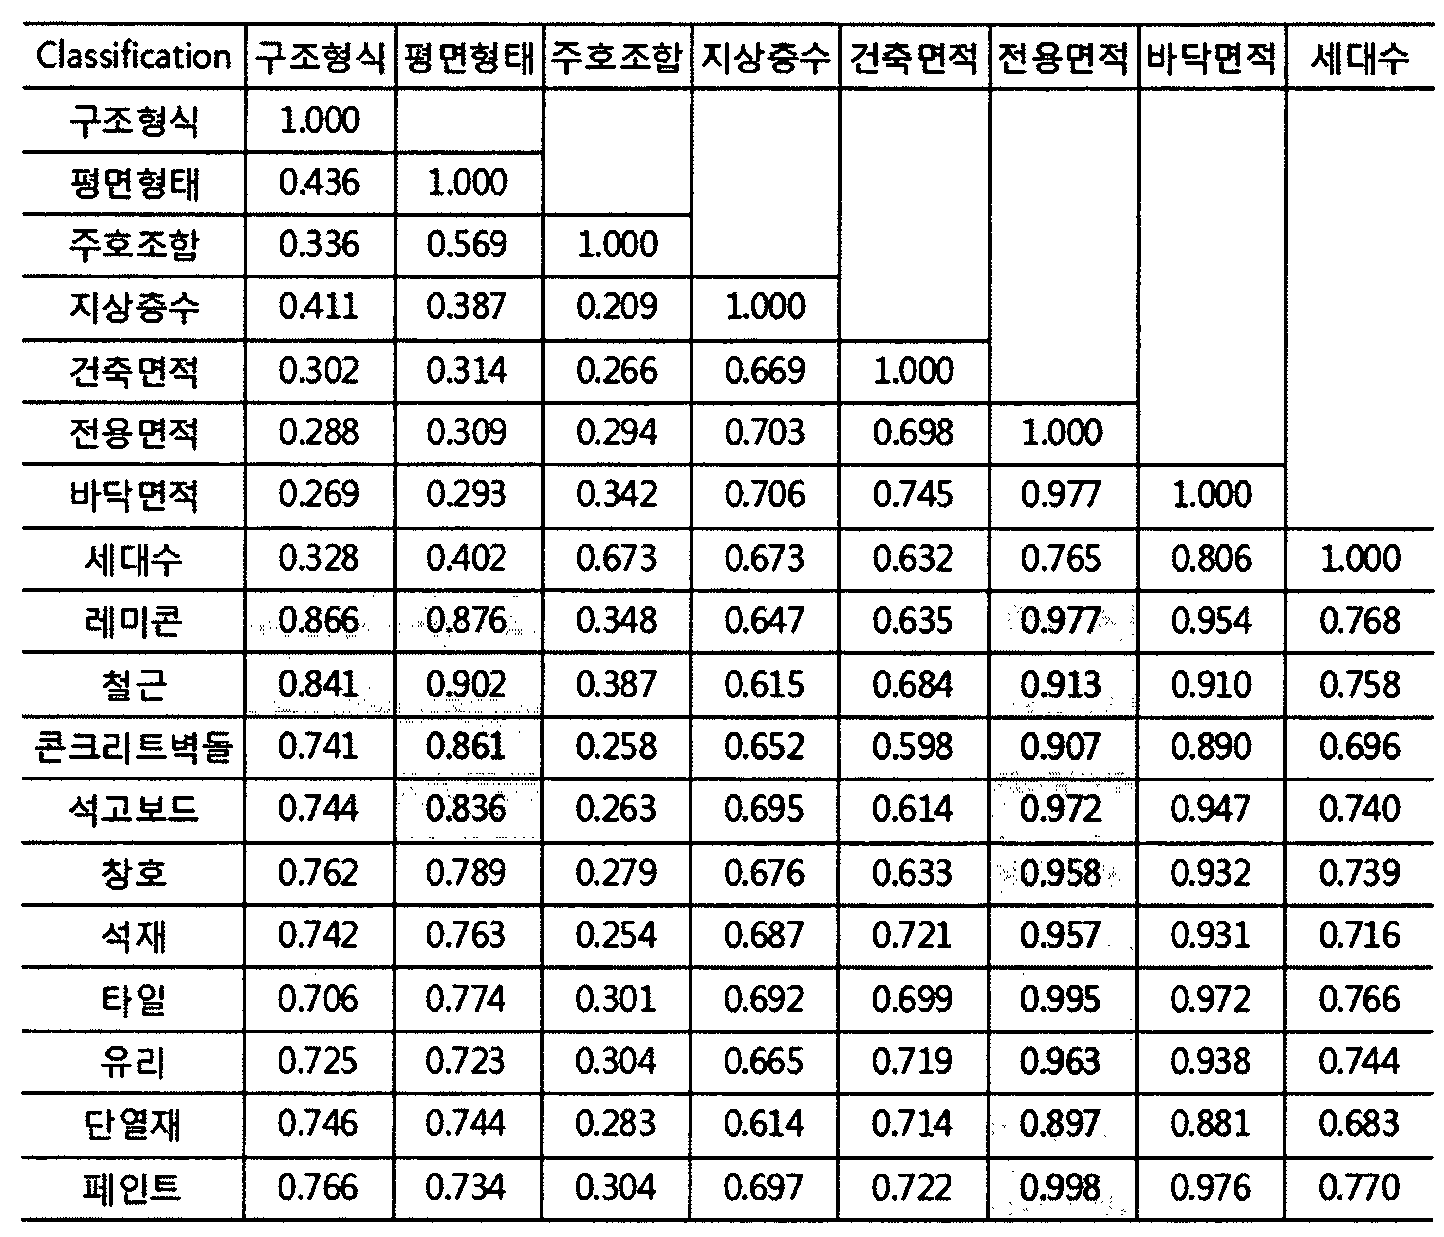
[표 2]
[규칙 제91조에 의한 정정 09.02.2017]

[표 3]
[규칙 제91조에 의한 정정 09.02.2017]

표 1에 의하면 주거동에 투입되는 주요 건축자재의 물량은 주거동의 전용면적과 그 상관관계가 가장 높은 것으로 분석된다. 또한, 레미콘과 철근은 그 구조형식과 주거동의 평면형태과도 상관관계가 높은 것을 확인할 수 있으며, 콘크리트벽돌과 석고보드는 주거동의 평면형태에 따라 그 물량이 달라지는 것으로 분석된다.
한편, 부속동에 투입되는 레미콘과 철근은 모두 바닥면적과 그 상관관계가 높은 것으로 분석되고(표 2 참조), 지하주차장에 대한 레미콘과 철근의 물량은 지하 연면적과 높은 상관관계를 갖는 것으로 분석된다(표 3 참조).
상술한 공동주택 단지의 특성과 주요 건축자재간의 상관계수를 이용하여 총 30가지의 주요 건축자재에 대한 확률분포로 구성되는 행렬(Matrix)을 표 4와 같이 구축하고 분포 적합(Fit distribution)을 통해 주요 건축자재별로 가장 적합한 확률분포를 결정할 수 있다. 이때, 확률분포의 적합도 검정 방법으로는 일반적으로 카이제곱 검정(χ2 검정, Chi-square test), 콜모고로프-스미르노프 검정(K-S 검정, Kolmogorov-Smirnov test), 앤더슨-달링 검정(A-D 검정, Anderson-Darling test)이 사용된다. 상술한 검정 방법 중 현업에서 가장 많이 사용되는 A-D 검정의 적합 통계량을 기준으로 확률분포를 결정할 수 있다. 여기서 A-D 검정은 실적자료와 분포형태의 적합여부를 검정하는 방법으로써 일반적으로 A-D 통계량이 1.50 이하로 도출되면 분포의 적합성이 비교적 높은 수준을 의미하는데, 상술한 주요 건축자재의 확률분포는 모두 A-D 검정 통계량 1.50 이하로 분석되었으며, 이를 통해 확률분포에 대한 유의성을 수학적으로 확인할 수 있다.
[표 4]
[규칙 제91조에 의한 정정 09.02.2017]

주요 건축자재에 대한 확률분포의 선정과정에서 가장 중요한 사항은 선정된 확률분포로써 확률분포의 형태와 실제 상황 간의 유사정도에 따라 평가결과의 정확성이 결정된다. 따라서 분포 적합 도구로써 크리스탈 볼(Crystal Ball)을 활용하고 본 도구에서 제공하는 적합도 검정에 따른 적합 통계량의 산출 결과를 통해 확률분포를 결정할 수 있다. 또한, 주요 건축자재의 물량은 다른 주요 건축자재의 물량에 종속되지 않는 독립변수로 가정할 수 있다. 표 5 내지 표 10은 확률분포 계산부(220)에 설정된 분석한 주요 건축자재의 확률분포의 형태를 나타낸다. 또한, 상술한 건축자재의 확률분포의 형태를 도출하는 방식과 유사하게 에너지원의 확률분포의 형태를 도출하는 것도 가능하나, 편의상 설명을 생략한다.
[표 5]
[규칙 제91조에 의한 정정 09.02.2017]
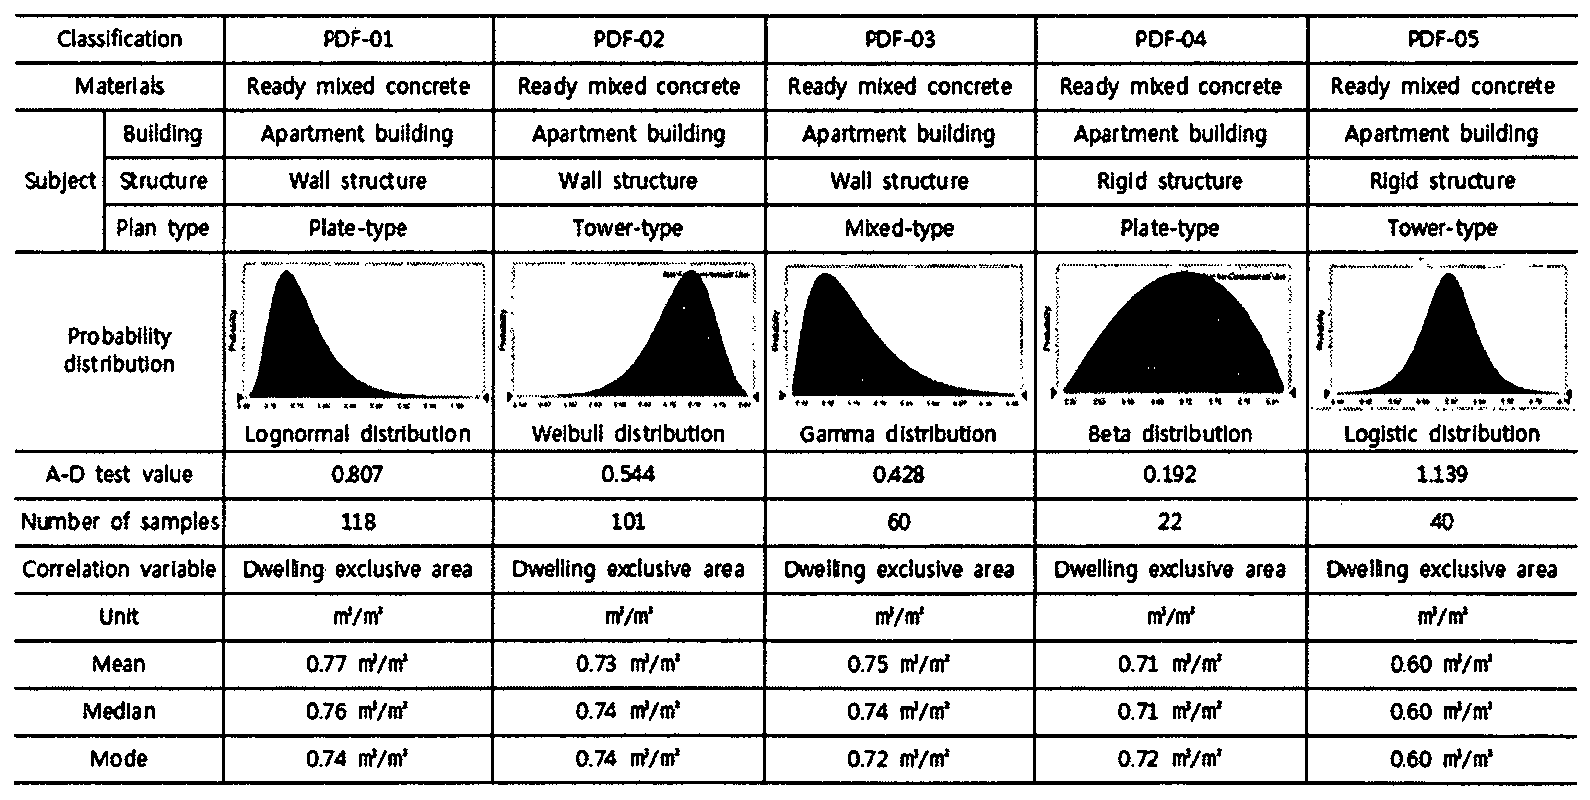
[표 6]
[규칙 제91조에 의한 정정 09.02.2017]
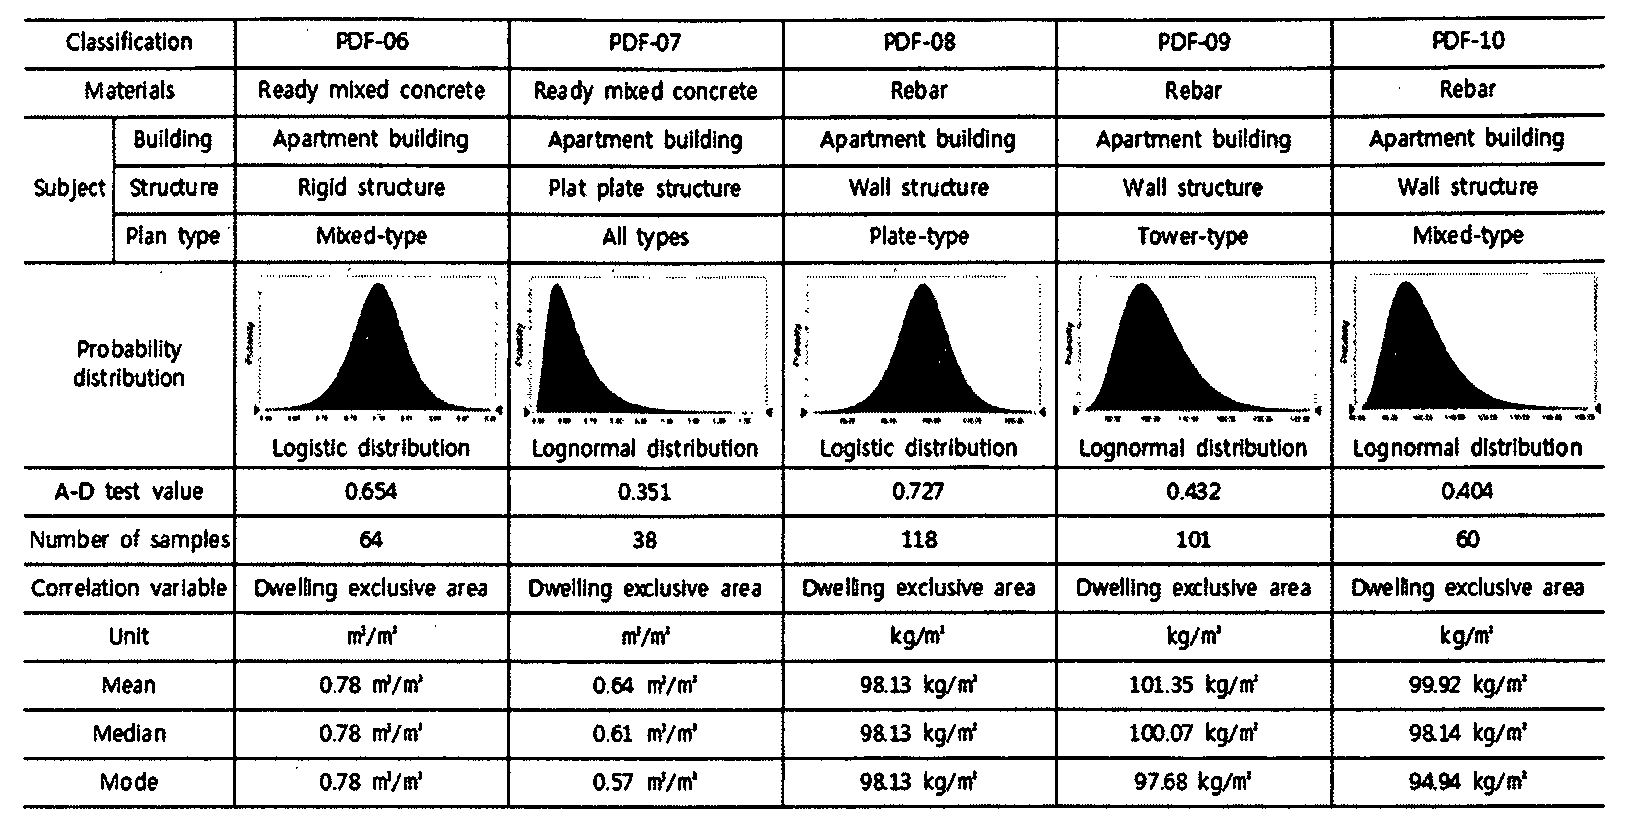
[표 7]
[규칙 제91조에 의한 정정 09.02.2017]

[표 8]
[규칙 제91조에 의한 정정 09.02.2017]

[표 9]
[규칙 제91조에 의한 정정 09.02.2017]
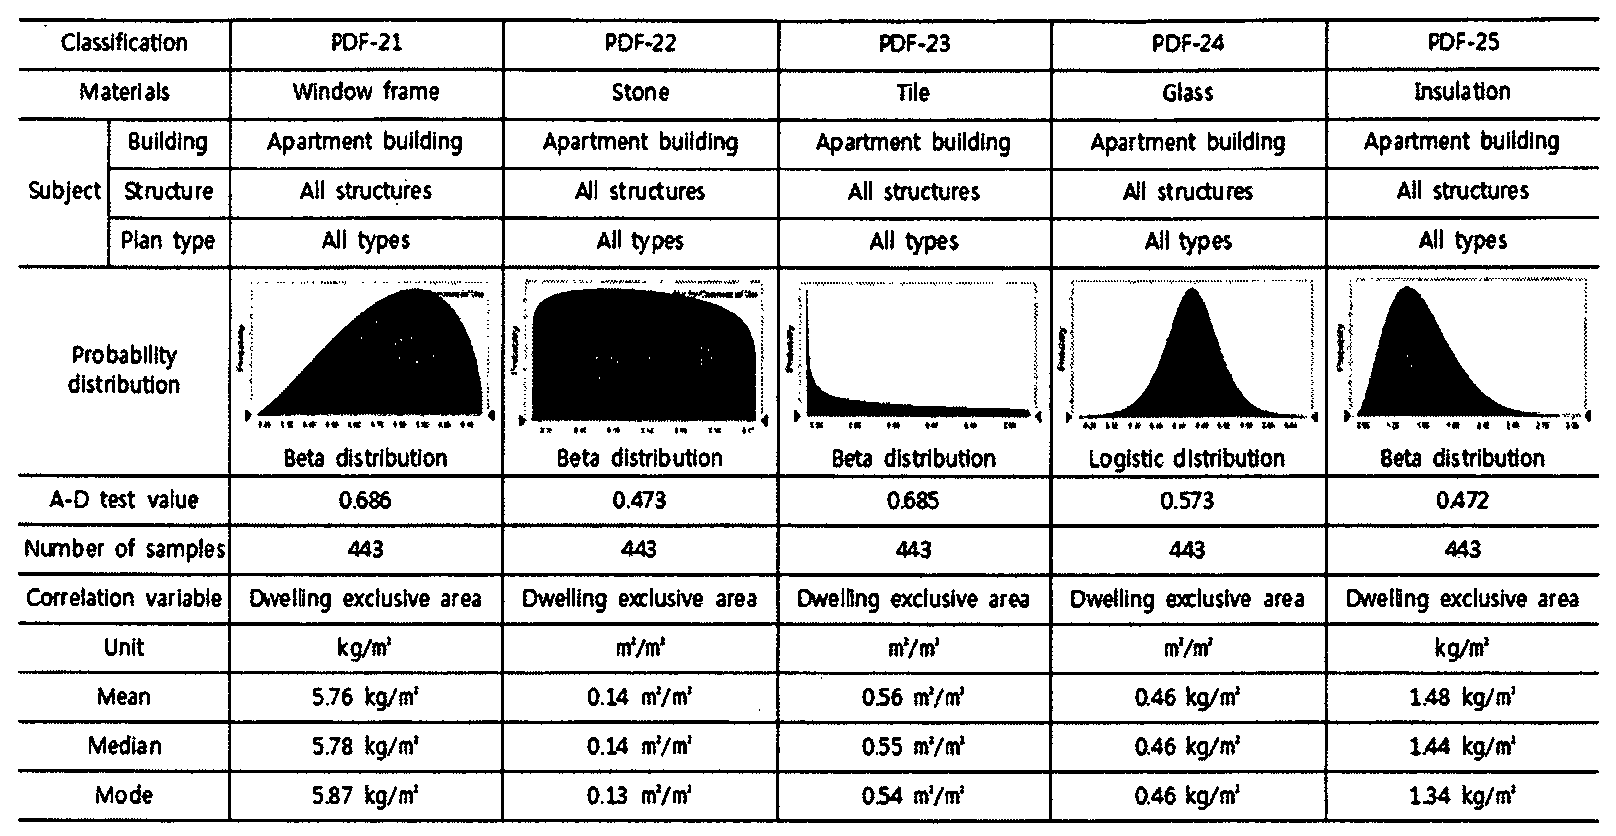
[표 10]
[규칙 제91조에 의한 정정 09.02.2017]

제1 연산부(310)는, 몬테카를로 시뮬레이션에 의하여, 확률분포 계산부(220)에서 제공받은 복수개의 건축자재 투입량의 확률분포 및 제1 저장부(110)에서 제공받은 제1 환경영향계수 집합을 이용하여 건축자재에 의한 제1 환경영향 평가값의 확률분포를 계산하고, 확률분포 계산부(220)에서 제공받은 복수개의 에너지원 소비량의 확률분포 및 제1 저장부(110)에서 제공받은 제2 환경영향계수 집합을 이용하여 에너지원에 의한 제2 환경영향 평가값의 확률분포를 계산하며, 제1 환경영향 평가값의 확률분포 및 제2 환경영향 평가값의 확률분포를 합산하여 전과정 환경영향 평가값의 확률분포를 계산하고, 계산된 전과정 환경영향 평가값의 확률분포를 제1 출력부(410)로 출력할 수 있다.
여기서, 몬테카를로 시뮬레이션(MCS, Monte Carlo Simulation)은 확률론적 분석 방법 중 대표적인 기법으로써 불확실한 상황 하에서 변수들의 확률론적 모형을 이용한 모의실험을 통해 효과적인 의사결정을 지원하는 확률적 시스템을 기반으로 한다. 몬테카를로 시뮬레이션의 핵심은 모형의 확률요소들에 대한 실험이며, 이는 확률적 또는 우연결과를 발생시켜 주는 도구를 이용하여 수행된다. 이 도구는 모형에서 가정한 확률분포에 따라 무작위 표본추출에 의해서 우연결과를 발생시켜 주는데 이용된다. 이는 N번의 시뮬레이션을 통해 0에서 1사이의 무작위 난수를 생성하고 확률분포 모델로부터 난수 기반의 입력값을 추출한다. 또한, 입력값을 적용한 결과를 도출하여 저장하고 기술 통계량 기반의 결과값을 산출하는 구조로 이뤄진다
제1 연산부(310)는, ISO 14040 시리즈로 공표된 환경적 전과정 평가(ELCA, Environmental Life Cycle Assessment) 기법에 근간하여 건축사업 초기단계에서 건축물의 전과정 환경영향을 정량적으로 평가하는 방법인 EAM(Environmental impact Assessment Method)에 의한 계산식, 건축자재의 투입량의 확률분포 및 에너지원의 소비량의 확률분포를 몬테카를로 시뮬레이션의 입력값으로 대입할 수 있다.
이에 따라, 상술한 바와 같이 건축물의 환경영향을 평가하기 위한 주요 환경영향 범주(Major environmental impact categories)를 선정하고 제1 저장부(110) 내에 건축자재와 에너지원에 대한 제1 환경영향계수 및 제2 환경영향계수에 대응하는 환경영향 원단위(Environmental impact coefficient)를 구축할 수 있다.
아울러, 제1 연산부(310)는, 건축물의 전과정 목록분석(LCI) 방법을 정립하기 위해 환경영향의 발생 비율이 높은 주요 건축자재(Major building materials)를 도출하였고 이에 기초하여 건축물의 시공단계, 운영단계, 폐기단계를 포함하는 전과정 시나리오(Life cycle scenario)를 구축하여 환경영향 평가값 계산 시 사용할 수 있다. 이때, 제1 연산부(310)는, 전과정 환경영향 평가(LCIA)에 대한 방법으로 환경부에서 제안된 한국형 피해산정형 LCIA 방법인 KOLID를 사용할 수 있다.
즉, 제1 연산부(310)는, 모든 환경영향 범주에 대해서 환경영향을 정량적으로 계산할 수도 있으나, 계산의 효율화를 위하여 미리 선정된 주요 환경영향범주에 관한 계산을 수행할 수 있다. 예를 들면, 건축물의 전과정 환경영향 평가와 관련된 국제 표준(ISO)과 지침, 녹색건축물 인증제와 건축물 전과정 환경영향 평가 도구(Tool)에서 적용하고 있는 환경영향 범주를 분석하여 건축물 관점에서의 주요 환경영향 범주를 선정할 수 있으며, 이와 같이 선정된 주요 환경영향 범주는 앞서 상술한 지구온난화, 산성화, 부영양화, 오존층 파괴, 광화학적 산화물 생성 및 자원고갈을 포함하는 총 6가지일 수 있다.
제1 저장부(110)는, 제1 환경영향계수 및 제2 환경영향계수에 대응하는 환경영향 원단위를 저장하는데, 환경영향 원단위는 제품별로 구축된 LCI DB(제품 시스템의 기능단위(Functional Unit)에 따라 제품 시스템으로 투입되는 자원의 양(환경에서 채취한 자원, 에너지, 광물 포함)과 환경으로 버려지는 배출물(대기, 수계)과 폐기물의 발생량을 사전에 목록화한 데이터)에 기초하여 환경영향 범주에 따른 환경영향을 사전에 정량화한 값을 의미한다. 제1 저장부(110)는, 앞서 건축물의 주요 환경영향 범주로 도출된 6가지의 환경영향 범주를 대상으로 건축자재와 에너지원의 환경영향 원단위를 저장할 수 있다.
먼저, 건축자재에 관한 제1 환경영향계수에 대응하는 환경영향 원단위는 사전에 구축된 LCI DB의 전과정 영향평가(LCIA)(분류화, 특성화)를 통해 산출할 수 있다. 예를 들면, 건축자재의 LCI DB로써 환경부 및 산업통상자원부에서 구축한 국가 LCI DB(Korea LCI DB)와 국토교통부에서 구축한 건축자재 환경성 정보 국가 DB(National D/B for Environmental Information of Building Products)를 이용할 수 있으며, ISO 14040에서 제시한 ELCA의 LCI DB 선정 원칙에 따라 지역적 상관성(Regional correlation), 시간적 상관성(Temporal correlation), 기술적 상관성(Technical correlation)의 순서로 LCI DB를 선정할 수 있다. 하기 수학식 1은 건축자재의 LCI DB를 이용한 건축자재에 관한 환경영향 원단위의 산출식을 나타낸다.
[수학식 1]

여기서 EIC1i,j는 건축자재(Building materials) (i)의 기능단위(Functional Unit)에 대한 환경영향 범주(Environmental impact categories) (j)의 환경영향 원단위를 나타내며, Ei,k는 건축자재 (i)의 기능단위당 영향물질(Substance) (k)의 배출량, IFj,k는 환경영향 범주 (j)에 대한 영향물질 (k)의 영향지수(Impact factor)를 의미한다.
또한, 6종의 환경영향 범주, 즉, 지구온난화(GWP), 산성화(AP), 부영향화(EP), 오존층파괴(ODP), 광화학적산화물(POCP) 및 자원고갈(ADP)에 대한 기준 물질(이산화탄소 등) 및 영향 지수(IF)의 일례는 하기 표 11과 같다.
[표 11]
[규칙 제91조에 의한 정정 09.02.2017]

데이터의 분류화는 환경영향 범주에 따라 영향물질들을 분류 및 취합하는 과정으로 이루어진다. 예를 들면, IPCC 가이드라인에 의한 지구온난화의 기준물질과 영향물질은 표 11에 나타난 바와 같이 Carbon dioxide(CO2), CFC-11, CFC-114, CFC-12 등이고, 국가 LCI DB를 이용한 레미콘 25-240-15(Ready mixed concrete 25-240-15)의 분류화 내역은 각각 4.20E+02 kg-CO2/㎥, 2.05E-09 kg-CFC-11/㎥, 2.10E-09 kg-CFC-114/㎥, 4.40E-10 kg-CFC-12/㎥이 된다. 하기 표 12는 레미콘 25-240-15, 전기로제강_철근(Electric steel deformed bars), 도료_수용성수계(Paint_water type), 판유리(Plate glass) 등 건축자재의 LCI DB를 이용한 분류화 내역을 나타낸다.
[표 12]

한편, 수학식 1에 표시한 바와 같이 영향물질의 배출량과 환경영향 범주별 영향지수를 곱한 후 이를 모두 합산하는 특성화를 통해 건축자재의 환경영향 원단위를 정량적으로 산출할 수 있다. 예를 들면, 지구온난화의 기준물질인 CO2와 영향물질인 CFC-11, CFC-114, CFC-13의 영향지수는 각각 1.00E+00 kg-CO2/kg-CO2, 4.00E+03 kg-CO2/kg-CFC-11, 9.30E+03 kg-CO2/kg-CFC-114, 8.50E+03 kg-CO2/kg-CFC-13이며, 이를 레미콘(25-240-15)의 분류화 내역(4.20E+02 kg-CO2/㎥, 2.05E-09 kg-CFC-11/㎥, 2.10E-09 kg-CFC-114/㎥, 4.40E-10 kg-CFC-12/㎥)과 곱한 후 모두 합산하면 레미콘(25-240-15)에 대한 지구온난화의 원단위(4.09E+02 kg-CO2eq/㎥)을 산출할 수 있다. 상술한 수학식 1을 이용하여 앞서 언급한 국가 LCI DB(A) 또는 환경성 정보 국가 DB(B)를 데이터 소스(Source)로 하여 산출한 건축자재에 관한 환경영향 원단위(EIC1)의 일례는 하기 표 13과 같다.
[표 13]
[규칙 제91조에 의한 정정 09.02.2017]
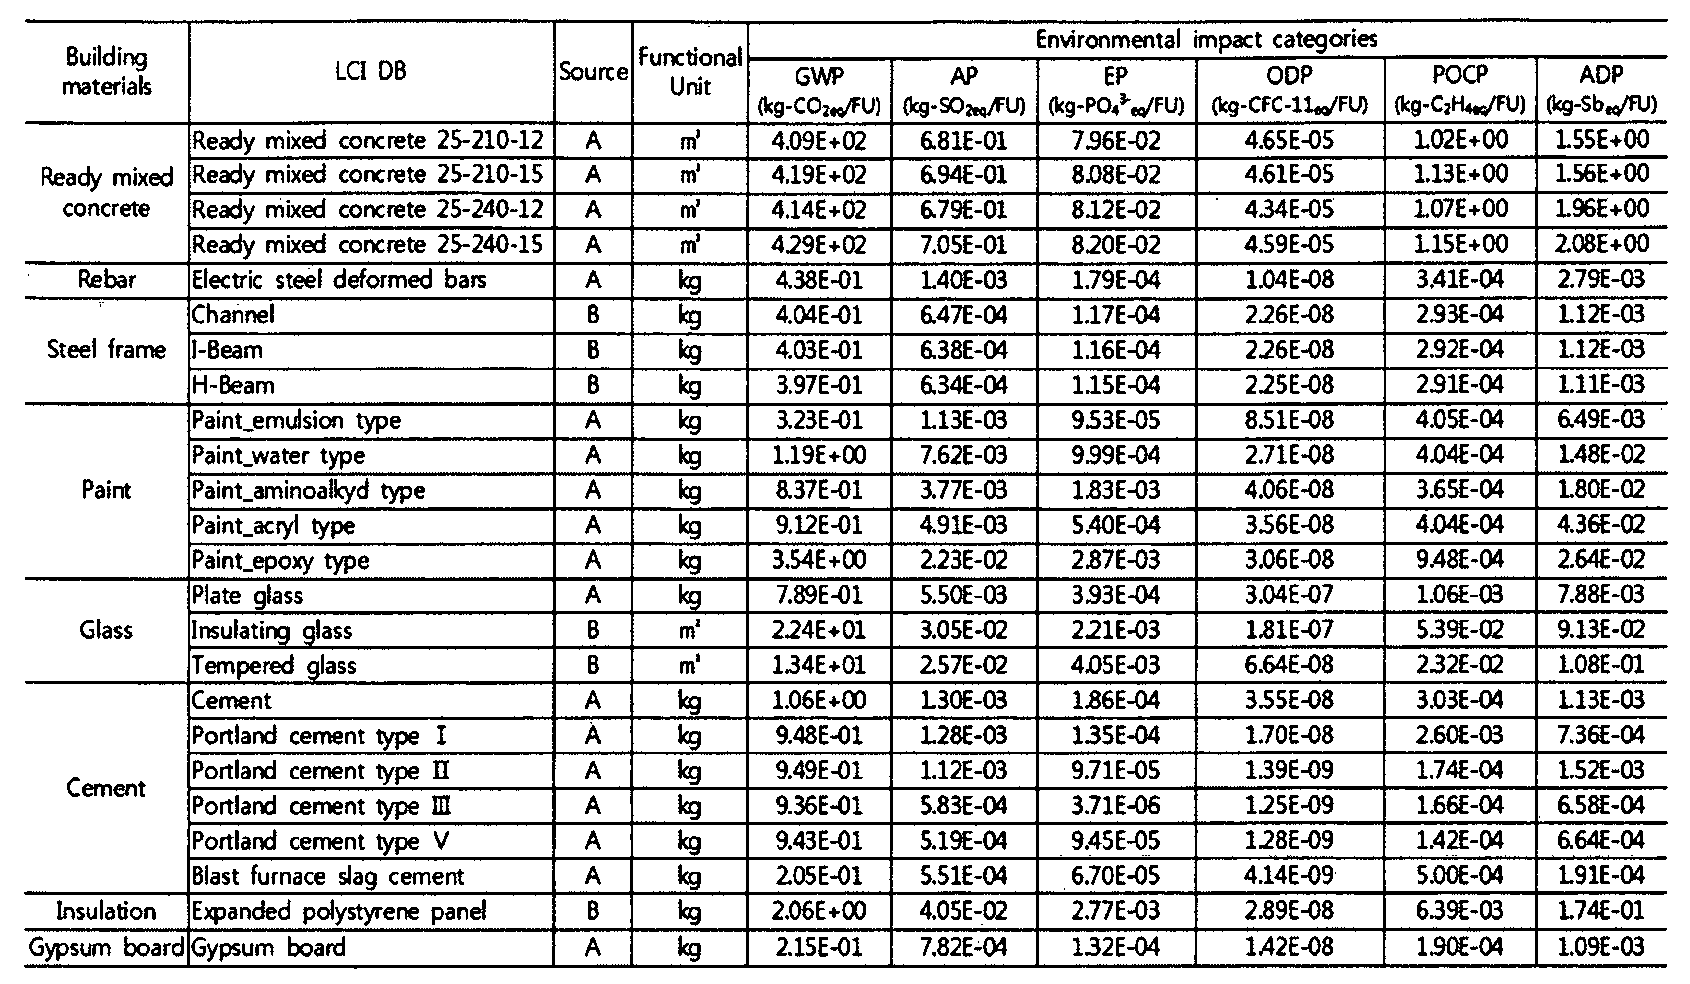
에너지원에 대한 제2 환경영향 계수를 산출하기 위해서는 에너지원의 생산에 관련된 환경영향과 연소에 의한 환경영향을 동시에 고려해야 한다. 예를 들면, 에너지원의 생산단계에 대한 LCI DB로써 국가 LCI DB를 선정하고 건축자재와 동일하게 LCI DB의 분류화 및 특성화를 통하여 제2 환경영향계수에 대응하는 에너지원 환경영향 원단위를 산출할 수 있다.
에너지원에 대한 환경영향 원단위는 하기 수학식 2에 의하여 산출될 수 있다.
[수학식 2]
[규칙 제91조에 의한 정정 09.02.2017]
 d
d
여기서, EIC2i,j는 에너지원 (i)의 기능단위(FU)에 대한 환경영향 범주 (j)의 환경영향 원단위를 나타내며, PEi,k는 에너지원 (i)의 생산에 따른 기능단위당 영향물질 (k)의 배출량, IFj,k는 표 11에 기재된 바와 같은 환경영향 범주 (j)에 대한 영향물질 (k)의 영향지수, CEi,k는 에너지원 (i)의 연소에 따른 기능단위당 영향물질 (k)의 배출량을 나타낸다.
상술한 수학식 2를 이용하여 앞서 언급한 국가 LCI DB(A) 또는 환경성 정보 국가 DB(B)를 데이터 소스(Source)로 하여 산출한 에너지원에 관한 환경영향 원단위(EIC2)의 일례는 하기 표 14와 같다.
[표 14]

위 표 14에서 지구온난화(GWP), 산성화(AP), 부영향화(EP), 오존층파괴(ODP), 광화학적산화물(POCP) 및 자원고갈(ADP)의 각 환경영향 범주별 환경영향 계수의 단위는 표 13에 개시된 바와 같이, 기능단위 당 기준물질의 중량(kg)이다.
제1 연산부(310)는, 몬테카를로 시뮬레이션을 이용하여 복수개의 건축자재의 투입량의 확률분포 및 제1 저장부(110) 내에 저장된 제1 환경영향계수 집합에 대응되는 수치인 건축자재에 관한 환경영향 원단위를 이용하여 제1 환경영향 평가값의 확률분포를 계산할 수 있는데, 몬테카를로 시뮬레이션에 입력되는 계산식의 일례는 하기 수학식 3과 같다.
[수학식 3]

여기서, EIRj는 건축물의 환경영향 범주 (j)에 대한 평가결과를 나타내며, Qk는 건축자재 (k)의 수량, Uk는 건축자재 수량과 환경영향 원단위 간의 단위환산계수, EIC1j,k는 건축자재 (k)의 환경영향 범주 (j)에 대한 환경영향 원단위를 나타낸다. 여기서, 단위환산계수는, 건축자재의 수량이 코드화되어 입력되는 경우에 환경영향 원단위의 기능 단위와 대응되도록 조정하는 계수로서, 예를 들어 1ton의 시멘트가 입력되는 경우 kg의 기능 단위를 갖는 환경영향 원단위에 대응시키기 위하여 1000의 값을 갖는 단위환산계수가 상술한 수학식 3에 대입된다.
제1 연산부(310)는, 제2 환경영향평가값의 확률분포에 대해서도 수학식 3의 건축자재의 수량, 즉, 투입량을 에너지원의 소비량으로 치환하고, 건축자재에 관한 환경영향 원단위를 에너지원에 관한 환경영향 원단위로 치환하여 몬테카를로 시뮬레이션에 입력하여 계산할 수 있으나 이에 한정되지 않는다.
또한, 제1 연산부(310)는, 미리 구축된 전과정 시나리오를 통하여 전과정 환경영향을 평가할 수 있으며, 이를 위하여 전과정 환경영향 평가를 위한 값이 제1 환경영향계수의 집합 및 제2 환경영향계수의 집합에 반영될 수 있다.
즉, ISO 21931-1에 따르면 건축물의 전과정 단계는 생산단계, 시공단계, 운영단계, 폐기단계로 구분되며, 생산단계를 제외한 시공단계, 운영단계, 폐기단계에서 전과정 환경영향 평가를 위한 시나리오가 설정될 수 있다.
먼저, 시공단계는 운송과정과 시공과정으로 구분될 수 있다. 운송과정은 건축물에 투입되는 건축자재를 시공현장까지 운송하는 과정에 대한 환경영향을 평가한다. 건축자재별로 주로 사용되는 운송차량의 종류의 일례로, 레미콘 수송에 레미콘 믹스트럭이 사용되고 철근과 형강 수송에 20ton 트럭이 주로 사용될 수 있다. 또한, 그 외의 건축자재는 8ton 트럭이 사용될 수 있고 모든 건축자재는 30km 이내의 건축자재 업체에서 조달받는 것으로 설정할 수 있다.
시공 과정은 건축물의 시공과정에서 장비의 사용과 현장사무소의 운영 등으로 인한 환경영향을 평가한다. 시공과정의 에너지소비량 도출을 위해 지구별 예산내역서와 일위대가에 근거하여 공동주택 시공과정의 에너지소비량을 간접적으로 도출한 연구 자료(건축공종 29건, 토목공종 22건, 조경공종 22건, 전력소비량 36건)와 최근 준공된 공사현장(공동주택 5건)의 전력소비 실측량과 공사일보를 분석할 수 있다. 특히, 건설장비의 에너지소비량은 공사일보에 명시된 장비 사용현황과 근로기준법의 일일 근로시간인 8시간을 적용하여 건설장비별 총 사용시간을 분석할 수 있고, 건축표준품셈의 건설장비별 연비를 적용하여 에너지소비량을 산출할 수 있다. 하기 표 15는 제1 연산부(310)에 의한 시나리오 기반 환경영향 평가에 사용되는 공동주택 시공과정의 에너지소비량을 나타낸다.
[표 15]

운영단계는 에너지의 사용과정과 유지관리과정으로 구분될 수 있다. 공동주택의 운영단계에서 발생되는 환경영향을 평가하기 위해서는 건축물 수명(Service life)의 설정이 필요한데, 건축사업 초기단계에서 건축물의 환경영향을 평가하고 그 결과를 비교하기 위한 방안으로 국내 법인세법에서 규정하고 있는 법적 수명인 40년을 동일하게 적용하는 것으로 시나리오를 구축할 수 있다.
또한, 유지관리과정에서는 건축물의 개보수를 위해 신규로 투입되는 건축자재에 대한 환경영향을 평가한다. 이에 주택법에서 제시하는 건축자재별 수선주기와 수선율에 기초한 환경영향 평가 방법을 적용할 수 있다.
폐기 단계는, 건축물의 해체과정, 폐건축자재의 운송과정, 폐건축자재의 매립과정으로 분류될 수 있다. 해체과정에서는 건축물의 해체작업에 투입되는 장비에 기인한 환경영향을 평가한다. 이때, 해체과정에서는 폐건축자재의 양이 산출되는데 폐건축자재의 양과 생산단계에서 투입된 건축자재의 수량이 동일하다고 설정할 수 있다. 또한, 해체장비는 기존 연구의 결과에 따라 해체과정에서 일반적으로 사용되는 Backhoe (1.0㎥) + Giant Breaker (0.7㎥)로 설정할 수 있다.
운송 과정은, 발생된 폐기물을 처리장까지 운송하는 과정에서의 환경영향을 평가한다. 이때, 운송차량은 건설표준품셈에 따라 15ton 트럭을 적용하고, 운송거리는 시공단계의 운송과정과 동일하게 30km로 설정할 수 있다.
매립 과정에서는, 폐건축자재를 매립하는 과정에서 발생되는 환경영향을 평가한다. 폐건축자재 재활용과정의 환경영향은 재활용업체에서 부담하는 Cut-off method를 적용하고 재활용되지 못한 폐건축자재에 대한 매립과정에서의 환경영향만을 고려할 수 있다. 이때, 매립장비는 Dozer (D8N, 15 PL, 6 PL) + Compactor (32ton)로 설정할 수 있고 폐기물통계연감에 따라 건축자재별 폐기물 처리현황을 조사한 결과에 의해, 레미콘은 70%가 재활용되고 30%가 매립되는 것으로 설정할 수 있다. 유리는 80%가 재활용되고 20%는 매립되는 것으로 설정할 수 있다. 또한, 석고보드는 10%의 재활용이 이뤄지고 90%는 매립되는 것으로 설정할 수 있다. 한편, 철근, 형강은 모두 재활용되고 콘크리트벽돌과 단열재는 모두 매립되는 것으로 설정할 수 있다. 하기 표 16은 제1 연산부(310)의 평가를 위하여 제1 저장부(110)에 저장된 해체 및 매립장비의 에너지소비량을 나타낸다.
[표 16]

제1 연산부(310)는, 시나리오 기반 전과정 환경영향 평가를 위하여 내 환경부에서 개발된 피해산정형 모델인 KOLID(KOrean Life cycle Impact assessment method based on a Damage oriented modeling)를 적용할 수 있다. KOLID는 도 3에 도시된 바와 같이 지구온난화, 산성화, 부영향화, 오존층파괴, 광화학적산화물, 자원고갈의 6가지 환경영향 범주를 통해 암, 감염증, 백내장, 영양부족, 토지유실, 농업생산 등 16가지 종말점에 대한 피해를 정량적으로 산출하고 이를 인체건강, 사회자산, 생물다양성, 1차 생산의 4가지 보호대상(Safety guard)으로 평가하며, 화폐가치로써 단일의 최종 평가결과를 도출한다. 이때, KOLID의 인체건강에서는 사망 또는 사망에 이르지 않는 장애와 질환의 기간(Year)을 의미하는 DALY를 피해지표로하고 사회자산은 농작물, 수산자원, 삼림자원, 광물자원, 화석연료 억제 및 고갈에 대한 경제적인 비용(원)을 피해지표로 한다. 또한, 생물다양성은 유관속식물과 수생생물의 멸종종수에 대한 기대치인 EINES를 피해지표로 평가하며, 1차 생산은 육상식물과 해양 플랑크톤의 광합성에 의한 유기물의 양(kg/㎡·yr)을 평가하는 NPP를 피해지표로 한다.
또한, 제1 연산부(300)는 하기 수학식 4에 따라 통합화 과정을 통해 시스템 전체의 환경영향을 반영할 수 있다.
[수학식 4]
[규칙 제91조에 의한 정정 09.02.2017]

여기서 TI는 통합화를 통한 시스템 전체의 환경영향, Dk는 보호대상 k로 분류된 모든 목록항목들이 해당 보호대상에 미치는 영향크기, IFk는 보호대상 k의 통합화 계수, Loadi,j는 영향범주 i로 분류된 목록항목 j의 환경부하량, DFk,i,j는 영향범주 i로 분류된 목록항목 j가 보호대상 k에 미치는 피해계수, Ik는 보호대상 k의 환경영향을 나타낸다.
표 17는 환경영향 범주의 기준물질별 피해계수(DFk,i,j)를 나타내고, 표 18은 KOLID의 보호대상별 경제가치 비용(IFk)을 나타낸다.
[표 17]
[규칙 제91조에 의한 정정 09.02.2017]

[표 18]
[규칙 제91조에 의한 정정 09.02.2017]
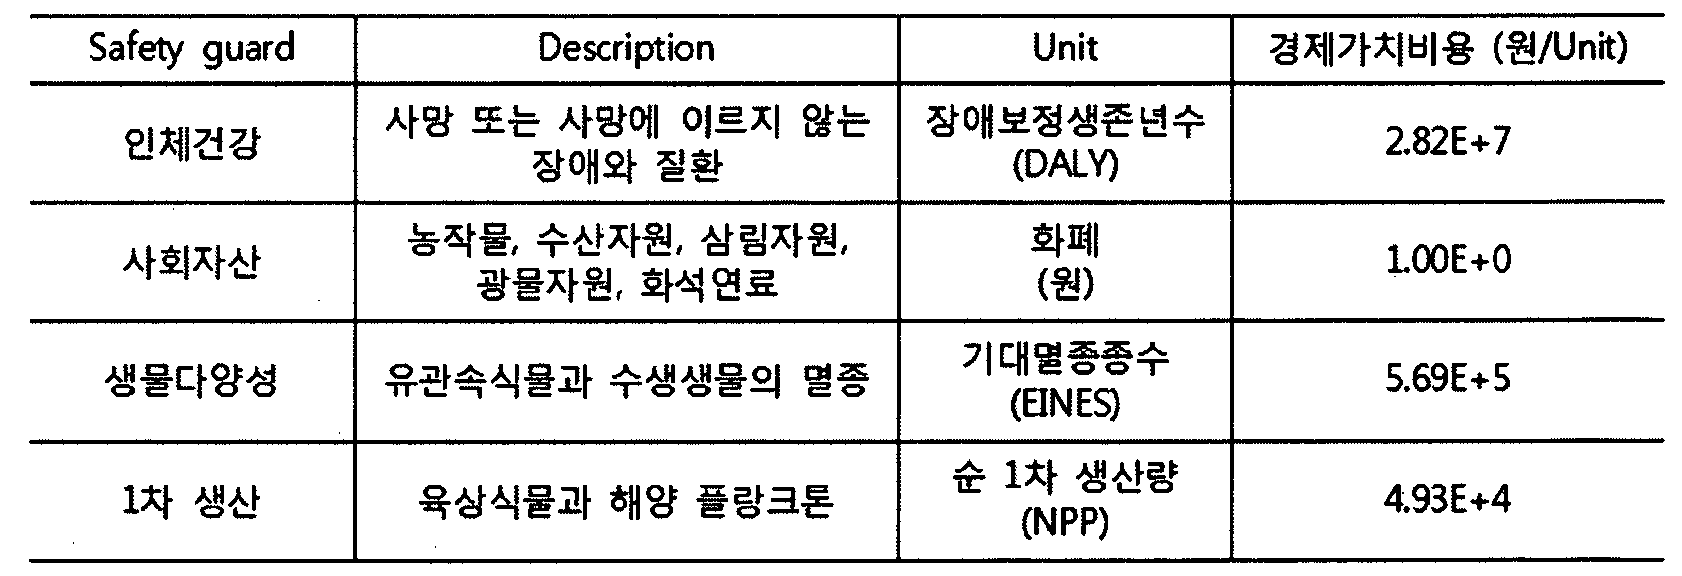
표 17 및 표 18에 제시된 값을 수학식 4에 적용해보면, 지구온난화 환경영향 범주에 대하여 보호대상인 인체 건강에 대한 피해 계수는 1.23×10⁻⁷ DALY/kg-CO2이고, 인체 건강에 대한 경제가치비용인 통합화 계수는 2.82E+7이므로, 피해 계수와 통합화 계수를 곱하여 도출된 인체 건강에 대한 환경영향 평가 결과는 약 3.47원/kg-CO2이고, 지구온난화 환경영향 범주에 대하여 보호대상인 사회 자산에 대한 피해 계수는 2.72원/kg-CO2이며, 사회 자산에 대한 경제가치비용인 통합화 계수는 1.00E+0이므로, 피해계수와 통합화 계수를 곱하여 도출된 사회 자산에 대한 환경영향 평가 결과는 2.72원/kg-CO2이 된다. 결국, 지구온난화 환경영향 범주에 대해서는 인체 건강 및 사회 자산이 보호 대상이므로 이를 더하여 6.19원/kg-CO2이 통합화를 위한 환경영향이 된다(도 3 참조).
즉, 제1 연산부(310)는, 수학식 3에 의해 도출된 환경영향 평가값에 수학식 4에 의해 도출된 통합화를 위한 환경영향값을 곱하여 시나리오가 반영된 환경영향 평가값을 도출할 수 있다. 따라서, 제1 저장부(110) 내에 저장된 제1 환경영향계수 집합 및 제2 환경영향계수 집합은 환경영향 원단위 뿐만 아니라 통합화를 위한 환경영향값을 포함하는 것이 바람직하나 이에 한정되지 않는다. 예를 들면, 제1 연산부(310)는, 제1 저장부(110)에 저장된 레미콘에 관한 지구온난화 범주의 환경영향 원단위가 4.09E+02원kg-CO2/㎥이고(표 13 참조), 지구온난화 범주의 통합화를 위한 환경영향을 계산한 결과가 상술한 바와 같이 6.19원/kg-CO2임에 따라 1㎥당 기능 단위별 금액을 409×9.16=2532원으로 설정하여 제1 환경영향계수로 사용할 수 있다. 이 경우, 레미콘의 투입량이 10㎥라면 환경영향 평가값은 25320원이 된다. 이와 같은 방식으로 제1 연산부(110)는, 모든 환경 범주 및 모든 보호 대상에 대하여 몬테카를로 시뮬레이션을 이용한 계산을 수행하고 시나리오가 반영된 환경영향 평가값의 확률분포를 도출할 수 있다.
제2 연산부(320)는, 몬테카를로 시뮬레이션에 의하여, 확률분포 계산부(220)로부터 제공받은 복수개의 건축자재 투입량의 확률분포 및 제2 저장부(120)로부터 제공받은 제1 비용계수 집합을 이용하여 건축자재에 의한 제1 비용 평가값의 확률분포를 계산하고, 확률분포 계산부(220)로부터 제공받은 복수개의 에너지원 소비량의 확률분포 및 제2 저장부(120)로부터 제공받은 제2 비용계수 집합을 이용하여 에너지원에 의한 제2 비용 평가값의 확률분포를 계산하며, 제1 비용 평가값의 확률분포 및 제2 비용 평가값의 확률분포를 합산하여 전과정 비용 평가값의 확률분포를 계산하고, 계산된 전과정 비용 평가값을 제2 출력부(420)에 출력할 수 있다.
제2 연산부(320)는, SETAC에서 제시된 환경적 전과정 비용 평가(ELCC, Environmental Life Cycle Costing) 기법에 근간하여 건축사업 초기단계에서 환경적 외부비용을 고려하여 건축물의 전과정 비용을 평가하는 방법인 CAM(Cost Assessment Method)을 몬테카를로 시뮬레이션에 입력하여 전과정 비용 평가값의 확률 분포를 계산할 수 있다.
제2 저장부(120)는, 제1 비용계수 및 제2 비용계수에 대응하는 건축자재 단가 및 에너지원 단가를 저장하는데, 적어도 표 13에 포함된 건축자재에 대한 기능 단위 당 단가, 즉, 가격을 자재 단가 계수로서 저장한다. 에너지원 단가 데이터 베이스는, 적어도 표 14에 포함된 에너지원에 대한 기능 단위 당 단가를 에너지원 단가 계수로서 저장한다.
상술한 바와 같이 제2 저장부(120) 내에 제1 비용계수 집합 및 제2 비용계수 집합을 구축하기 위하여 건축물의 사적비용(Private cost)과 관련된 전과정 관점의 비용 범주를 조사하고 건축사업 초기단계에서 이해관계자들의 의사결정에 중요한 영향을 미치는 주요 비용 범주(Major cost categories)를 선정할 수 있다.
또한, 제2 연산부(320)는, 계산의 효율화를 위하여 직접공사비(Direct construction cost)의 투입 비율이 높은 주요 건축자재(Major building materials)를 도출하고, 현가 분석방법(Present worth method)에 기초하여 건축물의 사적비용과 외부비용(External cost)으로 구성되는 전과정 비용 산출식을 이용할 수 있다.
건축사업 초기단계는 전과정 비용에 대한 감축 잠재력이 가장 높은 단계로써 건축물에 투입되는 비용을 예측하는 것은 사업 전체의 성패를 결정하는 매우 중요한 요소이므로, 건축사업 초기단계에서 전과정 비용을 효율적으로 평가하기 위해서 의사결정에 중요한 영향을 미치는 주요 비용 범주를 선정하여 평가에 요구되는 정보를 간소화하는 것이 매우 중요하다.
한편, 일반적으로 전과정 비용 평가값 도출 시 사적비용은 건축물에 투입되는 비용으로써 초기투자비용, 운영비용, 철거비용, 기타비용으로 분류되며, 세부적으로는 기획·설계비, 직접공사비, 운영 에너지 비용, 유지보수비용, 일반관리비용, 철거비용 등으로 구분될 수 있다. 여기서, 제2 연산부(320)는, 다양한 전과정 비용 범주 중 건축물의 물리적 측면에 종속되지 않고 건축사업 또는 건축물 관리와 관계되는 기획·설계비, 일반 관리비용, 지원금은 주요 비용범주에서 제외한 후 계산할 수 있으나 이에 한정되지 않는다.
한편, 철거비용은 건축물의 물리적 측면에 종속되는 비용범주이나 이는 건축사업 초기단계에서 비용에 대한 예측과 추정에 많은 제약요소들이 존재하며, 건축물의 전과정 비용 관점에서도 그 기여도가 상대적으로 낮은 바, 건축사업 초기단계에서 이해관계자의 의사결정에 중요한 영향을 미치는 주요 비용범주로써 건축물의 물리적인 측면에 종속되어 있는 직접공사비(재료비+노무비+경비), 운영 에너지 비용, 유지보수비용을 선정할 수 있다.
또한, 제2 연산부(320)는, 몬테카를로 시뮬레이션에 의하여 복수개의 건축자재의 투입량의 확률분포 및 제2 저장부(120) 내에 저장된 제1 비용계수 집합에 대응되는 수치인 건축자재에 관한 직접공사비 단가를 이용하여 제1 비용 평가값의 확률분포를 계산할 수 있는데, 몬테카를로 시뮬레이션에 입력되는 계산식의 일례는 하기 수학식 5와 같다.
[수학식 5]

여기서, CR는 건축물의 직접공사비에 대한 평가결과를 나타내며, Qk는 건축자재 (k)의 수량, Uk는 건축자재의 수량과 직접공사비 단가간의 단위환산계수, CCk는 건축자재 (k)의 직접공사비에 대한 단가를 나타낸다.
제2 연산부(320)는, 제2 비용 평가값의 확률분포에 대해서도 수학식 5의 건축자재의 수량, 즉, 투입량을 에너지원의 소비량으로 치환하고, 건축자재에 관한 직접공사비의 단가를 에너지원에 관한 단가로 치환하여 계산할 수 있으나 이에 한정되지 않는다.
또한, 제2 연산부(320)는, 전과정 비용 평가값의 확률분포를 계산하는 데 있어서, 건축물 전과정 및 시간의 경과에 따른 경제적 영향을 고려하여 계산할 수 있다.
즉, 전과정 비용 평가의 주된 목적은 건축사업 초기단계에서 여러 가지 설계 대안에 대한 총 비용을 산정하여 경제적으로 유리한 설계 대안을 선정하는 것이므로, 시간의 경과에 따른 경제적 영향을 고려해야 하며, 현재의 비용과 미래의 비용을 적절한 기법에 의해 동일시점으로 환산하여 산출해야 한다. 이러한 환산 방법은 현가 분석방법(Present worth method)과 연가 분석방법(Annualized method)으로 구분될 수 있다.
여기서, 현가 분석방법은 할인율을 적용하여 현재와 미래의 모든 비용을 현재의 가치로 환산하는 방법이고 연가 분석방법은 대안의 모든 비용을 매년의 비용으로 변환하는 방법이다. 따라서 현가 분석방법은 일반적으로 대안의 총 비용 산정기간이 일정할 때 사용되고 연가분석 방법은 대안의 비용 산정기간이 서로 상이할 경우 사용된다. 제2 연산부(320)는, 건축물의 수명을 국내 세법에서 규정하고 있는 법적 수명인 40년으로 설정할 수 있고 현가 분석방법을 적용할 수 있다.
현가 분석방법의 비용은 초기비용, 반복비용, 비반복비용으로 구분된다. 초기비용은 사업초기에 투입되는 비용이고 반복비용은 제품 시스템의 사용기간 중 매년 동일하게 발생하는 비용이며, 비반복비용은 제품 시스템의 사용기간 중 간헐적으로 발생되는 비용이다. 상술한 주요 비용 범주 선정 시 선정한 직접공사비(재료비+노무비+경비), 에너지 비용, 유지보수 비용만을 평가함에 따라 직접공사비는 초기비용, 운영단계의 에너지 비용은 반복비용, 유지보수비용은 비반복비용으로 설정할 수 있다. 또한, 서로 다른 시점에서 발생하는 비용과 효용에 대해 동일 기준으로 환산하기 위한 할인율은 시장의 금리와 물가상승률을 조합하여 실질적인 화폐의 가치변화를 나타내는 실질이자율(Real interest rate)을 적용할 수 있다.
제2 연산부(320)는, 전과정 비용 평가값의 확률분포 계산 시 일반적인 전과정 평가기법(Conventional LCC)의 평가대상인 사적비용(Private cost)과 더불어 하나 이상의 외부비용(External cost)을 추가적으로 고려할 수 있다. 따라서, 제2 연산부(320)는, 앞서 주요 비용 범주로 선정된 직접공사비, 에너지 비용, 유지보수 비용의 사적비용과 함께 KOLID를 이용한 환경적 전과정 평가(ELCA)의 결과로 산출되는 생산단계, 시공단계, 운영단계(유지관리과정 포함)의 외부비용을 각각의 비목에 포함하여 하기 수학식 6을 몬테카를로 시뮬레이션에 입력함으로써 전과정 비용 평가값의 확률 분포를 산출할 수도 있다.
[수학식 6]

여기서, PCC와 ECC은 직접공사비의 사적비용과 생산단계의 외부비용, PCE와 ECE는 연간 에너지소비량에 대한 사적비용과 외부비용, PCM과 ECM은 건축자재의 유지보수비용을 의미하며, i는 실질이자율, n은 건축물의 수명, k는 건축물 수명 40년 동안의 건축자재의 수선 횟수, a는 건축자재의 수선주기를 나타낸다.
사적비용(Private cost)을 평가하기 위해서는 직접공사비, 에너지 비용, 유지보수 비용을 산출해야 한다. 이때, 직접공사비는 전체 직접공사비에서 90~99%를 차지하는 10가지의 주요 건축자재에 대한 투입량과 단가의 곱을 통해 산출할 수 있으며, 에너지 비용은 연간 에너지 소비량과 단가, 유지보수비용은 건축자재의 투입량과 건축자재의 수선율 그리고 단가의 곱을 통해 평가할 수 있다. 하기 수학식 7 내지 수학식 9는 각각 직접공사비, 연간 에너지 비용, 유지보수 비용에 대한 사적비용의 산출식을 나타낸다.
[수학식 7]

[수학식 8]

[수학식 9]

여기서, PCC와 PCE는 직접공사비와 연간 에너지소비량의 사적비용, Qm,i와 Uc,i는 주요 건축자재 (i)의 물량과 직접공사 단가, Qe,i와 Ue,i는 에너지원 (i)의 연간 소비량과 에너지원 (i)의 단가, Ri는 주요 건축자재 (i)의 수선율을 의미한다.
또한, 제2 연산부(320)는, 환경적 전과정 비용 평가(ELCC)의 외부비용을 고려하는 방법으로 지불의사비용(WTP, Willing to pay) 방법과 종말점수준의 피해산정(Damage cost) 방법을 사용할 수 있다. 여기서 지불의사비용은 특정 집단재를 소비하는 가상의 시장을 만들어 소비자가 이를 소비할 때 지불하고자 하는 가격을 반영한 방법이며, 종말점 수준의 피해산정 방법은 환경경제학에서 정립된 환경영향의 경제 가치화 이론을 전과정 영향평가(LCIA)에 접목하여 비용으로 환산하는 방법을 의미한다.
제2 연산부(320)는, 전과정 비용 평가값의 확률분포의 도출에 있어서, 종말점 수준의 피해산정 방법에 기초하여 보호대상(인체건강, 사회자산, 생물다양성, 1차 생산)에 대한 가치를 한계지불의사비용으로 분석한 KOLID의 경제가치비용을 외부비용으로 적용할 수 있다. 즉, 외부비용은 상술한 수학식 4에 의하여 정량적으로 평가되는 보호대상별 피해규모와 경제가치 비용의 곱을 통해 산출될 수 있다. 따라서 제1 연산부(310)에서 산출된 생산단계, 시공단계, 운영단계(유지관리과정 포함)의 환경영향 평가결과를 토대로 외부비용을 산출할 수 있으며, 이를 전과정 비용 평가값에 반영할 수 있다. 수학식 10 내지 수학식 12는 각각 직접공사비, 연간 에너지 비용, 유지보수 비용에 대한 외부비용의 산출식을 나타낸다.
[수학식 10]

[수학식 11]

[수학식 12]

여기서, ECC와 ECE는 직접공사비와 연간 에너지소비량의 외부비용, Qm,i와 Qe,i는 주요 건축자재 (i)의 투입량과 에너지원 (i)의 연간 소비량, Im,i와 Ie,i는 주요 건축자재 (i)와 에너지원 (i)의 환경영향에 따른 보호대상별 피해규모 원단위, Fec는 KOLID의 경제가치 비용(표 118 참고), Ri는 주요 건축자재 (i)의 수선율을 의미한다.
다만, 제2 연산부(320)는, 상술한 바와 같은 외부 비용이 제1 연산부(310)에 의하여 계산된 전과정 환경영향 평가값의 확률분포에 이미 반영되어 있으므로, 지속가능 건축물 지수에 중복 산입을 방지하기 위하여 전과정 비용 평가값의 확률분포 계산에서 제외할 수 있다.
제3 연산부(330)는, 몬테카를로 시뮬레이션에 의해, 확률분포 계산부(220)에서 제공받은 복수개의 건축자재 투입량의 확률분포 및 제3 저장부(130)에서 제공받은 사회영향계수 집합을 이용하여 전과정 사회영향 평가값의 확률분포를 계산하고, 계산된 전과정 사회영향 평가값의 확률분포를 제3 출력부(430)에 출력할 수 있다.
제3 연산부(330)는, UNEP/SETAC에서 제시한 사회적 전과정 평가(S-LCA, Social Life Cycle Assessment) 기법에 근간하여 건축사업 초기단계에서 건축물의 전과정 사회적 영향을 평가하는 방법인 SAM(Social impact Assessment Method)을 몬케카를로 시뮬레이션에 입력하여 전과정 사회영향 평가값의 확률분포를 계산할 수 있다.
제3 저장부(130)는, 사회영향계수에 대응하는 사회영향 원단위를 저장하는데, 이를 위하여 상술한 사회적 논제 중 주요 사회적 논제를 선별하여 그에 관한 사회영향 원단위를 저장할 수 있다.
전과정 사회영향(Social impact)은 제품 또는 서비스의 전과정으로부터 야기되는 유해 또는 유익한 전체 또는 부분적인 사회적 현상을 총칭한다. 이는 상술한 바와 같이 제품 시스템과 관련된 이해관계자인 근로자(Worker), 소비자(Consumer), 지역사회(Local community), 사회(Society), 가치사슬(기업 활동에서 부가가치가 생성되는 과정) 범주에 미치는 영향과 사회적 관심(Interest)을 세부적인 항목으로 분류한 사회적 논제(Social topics)를 통해 구체화되고 정량화될 수 있다.
한편, 사회적 논제는 다수의 이해관계자별로 수많은 이슈(Issue)가 존재함에 따라 사회영향 평가값 계산의 수행을 위해서 평가대상과 평가 목적에 부합되는 주요 사회적 논제를 선정할 수 있고, 국제적 기관인 UNEP(United Nations Environment Programme), WBCSD(World Business Council for Sustainable Development), GRI(Global Reporting Initiative), GSCP(Global Social Compliance Programme)와 국제표준인 ISO 26000(Guidance on social responsibility) 등에서 제시하고 있는 사회적 논제를 분석하고 주요 사회적 논제를 선정할 수 있다.
즉, 제3 저장부(130)는, 다양한 이해관계자 범주 중 평가방법이 구체적으로 제시된 근로자 범주만을 대상으로 사회영향 원단위를 저장할 수 있으며, 근로자범주 내 인원 협회와 단체 교섭의 자유, 아동노동, 공정임금, 근로시간, 강제노동, 균등기회 및 차별, 건강 및 안전, 사회적 혜택, 훈련 및 교육, 고용관계, 직업 만족도를 포함하는 총 11가지 논제를 주요 사회적 논제로 하는 사회영향 원단위를 저장할 수 있으나 이에 한정되지 않는다.
제3 연산부(330)는, 몬테카를로 시뮬레이션에 의하여, 주요 건축자재의 투입량의 확률분포와 건축자재의 사회영향 원단위를 이용하여 건축물 전과정 사회영향 평가값의 확률분포를 하기 수학식 13에 의하여 계산할 수 있으나 이에 한정되지 않는다. 이때, 공동주택의 환경적, 경제적 측면의 주요 건축자재로 도출될 수 있는 콘크리트, 철근, 유리, 콘크리트벽돌, 단열재, 석고보드, 창호, 석재, 타일, 페인트의 10가지 건축자재를 주요 건축자재로 선정하고 이를 건축물 전과정 사회영향 평가의 대상으로 설정할 수 있다. 건축물 관점의 전과정 사회영향 평가값(0의 초과 여부 및 그 정도)을 통해 건축물이 내포하는 사회적인 긍정 또는 부정적인 영향과 그 수준을 유용하게 판단할 수 있다.
[수학식 13]

여기서 SIR은 건축물의 전과정 사회영향 평가값을 나타낼 수 있으며, Qk는 주요 건축자재 (k)의 투입량, Uk는 주요 건축자재 투입량과 사회영향 원단위간의 단위환산계수, SICk는 주요 건축자재 (k)의 사회영향 원단위를 나타낸다.
제3 저장부(130)는, 건축물에 투입될 건축자재에 대한 사회영향계수에 대응하는 사회영향 원단위를 저장한다. 예를 들면, 레미콘에 대한 사회영향 원단위를 도출하는 방법은 아래와 같다.
이때, S-LCA의 원칙에 따라 현장데이터(Site specific data)를 우선적으로 적용하고, 현장데이터의 적용이 어려운 경우 국제 또는 국내의 통계자료에 기초한 일반 데이터(Generic data)를 적용할 수 있다. 특히, 표 19의 4가지 레미콘사업장을 대상으로 조사한 레미콘사업장의 운영형태별 노사관계의 특징을 재분석하여 현장데이터로 적용할 수 있다. 또한, 레미콘사업장의 출하량과 노사관계 등은 국내 레미콘사업장의 특징을 모두 대표하는 것으로 가정할 수 있다.
[표 19]

사회적 논제에 대한 평가기준은 정성적인 평가기준으로 표현되고 있으므로 사회적 논제의 평가를 통해 레미콘의 사회영향 원단위를 정량적으로 구축하기 위한 방법으로 등간척도(Interval Scale) 기반의 분석방법을 적용할 수 있다. 여기서, 등간척도 기반의 분석방법은 사회 내 다양한 상황과 맥락 속에서 들어나는 정도의 흐름을 임의의 기준점으로부터 척도화하는 방법으로써 평가 대상에 부여된 점수가 반드시 그 평가 대상의 성능과 비례하지 않을 수 있다는 한계점이 있지만 일정한 기준에 따라 성능의 고저 판단이 가능하고 그 수준을 다른 대상과 간접적으로 비교 할 수 있다는 특징을 갖는다.
여기서, 사회적 논제별 점수는 사회 및 윤리적 관점에서 최소의 복지와 혜택의 수준 또는 산업의 평균을 의미하는 '0'을 기준으로 하며, 추가적인 긍정적인 영향(Positive impact)에 대해 최대 '+2점', 부정적인 영향(Negative impact)에 대한 최소 '-2'점을 부여할 수 있다. 또한, 레미콘사업장에 따라 생산되는 레미콘의 수량이 상이함에 따라 레미콘사업장별 연간 출하량을 이용하여 사회적 논제별 평가점수의 가중평균(Weighted average)을 산출하고 이에 기초한 사회영향 원단위를 구축할 수 있다. 즉, 사회적 논제별 평가결과가 하나의 지표로써 취합된 가중평균 또는 사회영향 원단위가 0 이상일 경우 이는 긍정적인 사회영향을 갖는 것으로 판단할 수 있으며, 0 이하일 경우에는 부정적인 사회영향을 갖는 것으로 판단할 수 있다. 수학식 14는 사업장의 평가점수에 대한 가중평균 산출식을 나타낸다.
[수학식 14]

여기서, WAi는 평가기준 (i)에 대한 가중평균, Qi,j는 평가기준 (i)에 대한 레미콘사업장 (j)의 점수, Qj는 레미콘사업장 (j)의 연간 출하량을 의미한다.
하기 표 20 내지 표 23은 레미콘에 대한 근로자 범주의 사회적 논제 분석 결과를 나타낸다.
즉, 근로자의 인권 협회와 단체 교섭의 자유는 근로자의 권리를 행사하기 위한 노동조합의 설립 및 단체교섭에 대한 회사의 저해 여부, 근로자의 단체교섭과 협상에 대한 반영 여부, 근로자 대표의 징계 여부 등을 통해 평가할 수 있다. A, B사업장은 근로자의 권리를 행사하기 위한 노동조합이 부재하고 C, D사업장만 노동조합이 존재한다. 이에 A, B사업장은 근로자의 이익을 대표하는 조직이 존재하지 않으며, 단체교섭도 이뤄지고 있지 않은 실정이다. C사업장은 노동조합이 존재하고 단체교섭 활동도 일부 이뤄지고 있으나 근로자의 의견을 전달하는 정기적인 활동은 이뤄지고 있지 않다. 반면, D사업장은 노동조합을 통한 단체교섭 활동이 활발하게 이뤄지며, 근로자의 발언권이 보장되는 노사협의회가 정기적으로 운영되고 있다. 따라서 A, B사업장은 '-2'점, C사업장은 '0'점, D사업장은 '+2'점을 부여하였으며, 출하량을 기준으로 한 가중평균(Weighted average)은 수학식 14에 의하여 '-0.36'점으로 산출될 수 있다.
아동노동은 아동노동 방지에 대한 관리 및 준수 체계의 운영 여부와 근로자의 나이를 증명할 수 있는 문서의 보관 여부 등을 통해 평가할 수 있다. 2013년 UNICEF(The United Nations International Children's Emergency Fund)에서 전 세계 104개국을 대상으로 아동노동의 실태를 발표한 보고서에 따라 국내 모든 사업장에서 아동노동이 행해지고 있지 않는 것으로 적용하면, 레미콘 사업장 A, B, C, D 모두 '+2'점을 부여할 수 있고 출하량 기준의 가중평균도 '+2.00'점으로 적용할 수 있다.
공정임금은 법적 최소기준의 임금 지급 여부와 추가적인 생활비의 지급 여부 등을 통해 평가할 수 있다. A사업장은 전형적인 중소기업으로써 모든 근로자에게 법적 최소기준의 임금은 지급하나, 추가적인 생활비 지급은 전무하다. 한편, B, C, D사업장은 대기업 또는 대기업 그룹사 소속으로써 모든 근로자를 대상으로 법적 최소기준의 임금을 지급할 뿐만 아니라 공장수당, 자격수당, 통신비, 학자금 지원 등 다양한 생활비를 지급한다. 따라서 A사업장은 '0'점, B, C, D사업장은 '+2'점을 부여하였으며, 출하량을 기준으로 한 가중평균은 '+1.70'점으로 산출될 수 있다.
근로시간은 법적 기준의 근로시간에 대한 준수 여부와 초과 근무수당의 지급 여부 등을 통해 평가한다. A사업장은 주 40시간 근무제가 도입되었으나 산업의 특성상 정상 근무 주에도 새벽부터 저녁 늦게까지 근무하고 일요일과 기타 법정 공휴일에도 대부분 출근한다. B, C, D사업장도 A사업장과 유사하게 주 40시간 근무제가 도입되었으나 공장의 가동상황에 따라 휴일에도 근무한다. 다만, 휴일 근무 시에는 사업장의 여건을 감안하여 대휴제도 또는 격주 휴무 제도를 운영하고 있다. 따라서 A사업장은 '-2'점, B, C, D사업장은 '-1'점을 부여하였고 출하량을 기준으로 한 가중평균은 '-1.15'점으로 산출할 수 있다.
강제노동은 근로자의 서류(여권, 거주허가증 등) 또는 임금(Salary)에 대한 회사의 강제 귀속 여부와 근로자의 조기 퇴사 권리가 포함된 합리적인 근로조건 여부 등을 통해 평가한다. 2011년 미국의 노동부(U.S. DOL, United States Department of Labor)에서 조사한 한국의 노동권 보고서(Republic of Korea Labor Rights Report)에 나와 있듯이 국내 모든 사업장에서 강제노동이 행해지고 있지 않고, 고용주/고용기관 및 제품과 직접 관련된 공급업체는 모두 노동조합 및 노동관계조정법을 준수하여 강제노동 방지를 위해 노력한다. 따라서 레미콘 사업장 A, B, C, D 모두 '+2'점을 부여하고 출하량 기준의 가중평균도 '+2.00'점으로 적용할 수 있다.
균등기회 및 차별은 차별과 관련된 이의 신청제도의 운영 여부와 동등한 업무적 가치에 대해 동등한 보수 지급 여부 등을 통해 평가할 수 있다. 2011년 미국의 노동부(U.S. DOL)의 한국 노동권 보고서(Republic of Korea Labor Rights Report)에 의하면 국내 모든 사업장에서 근로자에 대한 차별이 행해지고 있지 않으므로, 레미콘 사업장 A, B, C, D 모두 '+2'점을 부여하고 출하량 기준의 가중평균도 '+2.00'점으로 적용할 수 있다.
건강 및 안전은 건강과 안전에 관한 교육의 제공 여부, 건강과 안전을 위한 책임 직무 체계의 정의 여부 등을 통해 평가할 수 있다. 국내의 산업안전보건법에 따라 A, B, C, D사업장 모두 고용노동부령으로 정하는 정기적인 안전·보건을 실시하고 근로자의 건강과 안전을 관리하는 안전보건관리책임자, 관리감독자, 안전관리자 등을 선임한다. 다만, 건강과 안전에 대한 교육 프로그램의 설계, 개발, 검토에 근로자가 참여하거나 사업장의 재해 수준과 저감 목표의 수립 및 관리 여부는 판단하기 어려움에 따라 추가적인 배점은 부여하지 않는다. 따라서 레미콘 사업장 A, B, C, D 모두 '0'점을 부여하고 출하량 기준의 가중평균도 '0.00'점으로 적용할 수 있다.
사회적 혜택은 퇴직금(Severance pay), 장애수당, 부양가족 수당, 유족 급여 등 근로기준법에 명시된 사회적 혜택의 부여 여부와 그 외 추가적인 사회적 혜택에 대한 부여 여부 등을 통해 평가할 수 있다. A사업장은 근로자에게 근로기준법에 제시된 사회적 혜택만을 부여할 뿐 기타 복리 후생제도는 거의 전무하다. 반면, B, C, D사업장에서는 모든 근로자에게 법으로 명시된 사회적 혜택 이외에도 공장수당, 직책수당, 자격수당, 학자금 지원 등의 혜택을 부여한다. 따라서 A사업장은 '0'점, B, C, D사업장은 '+2'점을 부여하고, 출하량을 기준으로 한 가중평균은 '+1.70'점으로 산출할 수 있다.
훈련 및 교육은 근로자를 대상으로 한 훈련과 교육의 시행 여부 등을 통해 평가할 수 있다. A사업장은 회사 자체의 교육체계가 구축되지 않았으며, KS 규정에 명시된 최소의 법정 교육만 실시한다. 반면, B, C, D사업장에서는 직급에 따라 직무와 관련된 온라인 교육 및 오프라인 교육을 주기적으로 운영한다. 또한, 교육학점제를 운영하여 직무에 대한 교육뿐만 아니라 다양한 교양 및 어학에 대한 교육 등을 실시하고 있다. 따라서 A사업장은 '-1'점, B, C, D사업장은 '+2'점을 부여하고, 출하량을 기준으로 한 가중평균은 '+1.54'점으로 산출한다.
고용관계는 근로계약서의 작성 여부와 근로자의 채용 형태를 통해 평가할 수 있다. A, B, C, D사업장 모두 근로기준법에 따라 모든 근로자를 대상으로 근로계약서를 작성하고 있으며, 정규직의 고용 비율도 25% 이상이다. 따라서 레미콘 사업장 A, B, C, D 모두 '+2'점을 부여하고 출하량 기준의 가중평균도 '+2.00'점으로 적용할 수 있다.
직업 만족도는 근로자의 이직률을 통해 평가할 수 있다. A사업장의 연간 이직률은 15~20%이며, B사업장은 8.3~15%이다. 반면, C, D사업장은 근로자의 근속년수가 15~20년으로 매우 길며, 이직률은 매우 낮다. 따라서 A사업장은 '-1'점, B사업장은 '0'점, C, D사업장은 '+2'점을 부여하고, 출하량을 기준으로 한 가중평균은 '+0.84'점으로 산출될 수 있다.
[표 20]
[규칙 제91조에 의한 정정 09.02.2017]

[표 21]
[규칙 제91조에 의한 정정 09.02.2017]

[표 22]
[규칙 제91조에 의한 정정 09.02.2017]

[표 23]
[규칙 제91조에 의한 정정 09.02.2017]
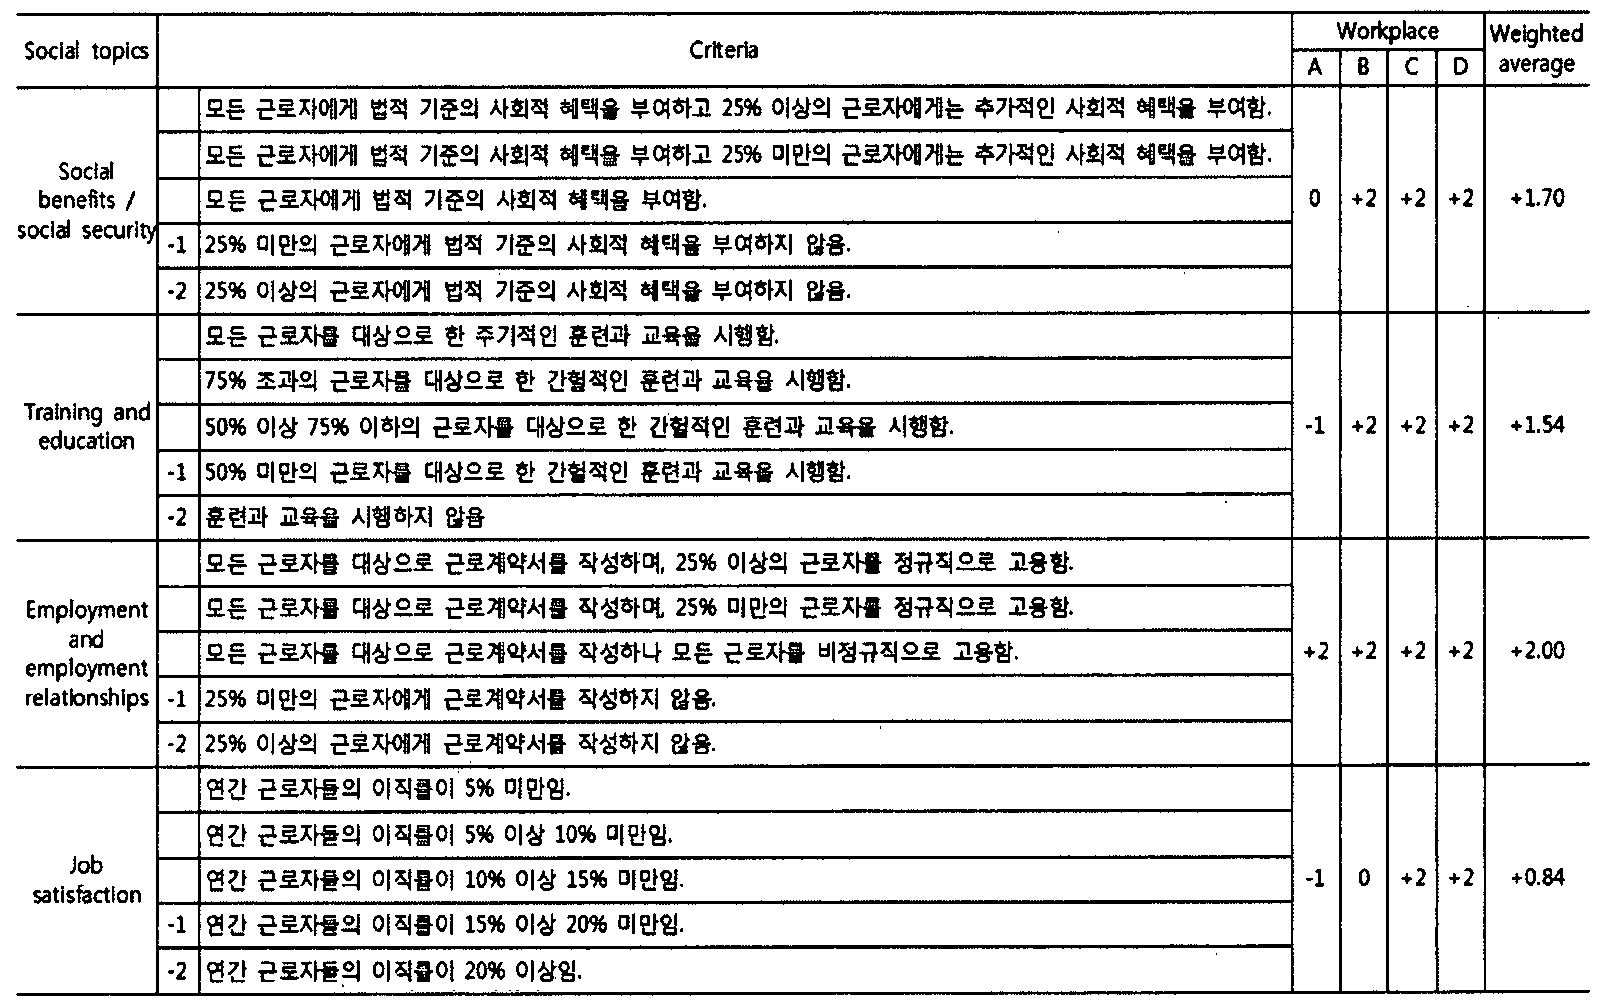
제3 저장부(130)에 저장된 건축자재의 사회영향 원단위는, 하기 수학식 15와 같이 근로자 범주에 대한 주요 사회적 논제의 점수 총합을 배점의 총점과 나누어 줌으로써 산출할 수 있다. 이때, 건축자재의 사회영향 원단위가 0을 초과한 경우, 해당 건축자재는 사회적으로 긍정적인 영향을 갖는 것을 나타내며, 0 미만인 경우, 부정적인 영향을 갖는 것을 의미한다.
[수학식 15]

여기서 SICi는 사회영향계수에 대응하는 건축자재 (i)에 대한 사회영향 원단위를 나타내며, STi,j는 건축자재 (i)에 대한 사회적 논제 (j)의 점수를 의미한다.
이때, 앞서 언급된 레미콘에 대한 사회적 논제에 있어서는, 수학식 14 및 수학식 15에 따라 사회적 논제의 총점과 사회영향 원단위가 각각 12.27점, 0.56으로 산출되고, 레미콘은 사회적 측면에서 긍정적인 영향을 내포함 건축자재로 분석될 수 있다. 이때, 레미콘의 기능단위는 입방 미터(Cubic meter, ㎥)로 표현됨에 따라 본 사회영향 원단위의 단위는 입방 미터 당 점수(점/㎥)로 정의할 수 있다.
또한, 제3 저장부(130)는, 근로자 범주 뿐 아니라 그 외 사회적 논제에 대해서도 하기 수학식 16에 의해 계산된 사회영향 원단위 값을 저장할 수 있다.
[수학식 16]

여기서 SICi는 건축자재 (i)에 대한 사회영향 원단위, Ai는 건축자재별 기능단위를 고려한 건축자재 (i)의 가중치(Weighting factor), STi,j는 건축자재 (i)에 대한 근로자 범주의 사회적 논제 (j)의 점수, WFj는 근로자 범주의 사회적 논제 (j)에 대한 가중치, n은 이해관계자 범주별 사회적 논제의 가지 수, STi,k는 건축자재 (i)에 대한 소비자 범주의 사회적 논제 (k)의 점수, WFk는 소비자 범주의 사회적 논제 (k)에 대한 가중치, α, β는 이해관계자 범주의 가중치를 의미하며, 지역사회, 사회, 가치사슬에 대한 사회영향도 같은 방법으로 확장하여 구축될 수 있다.
제1 출력부(410)는, 제1 저장부(110)에 저장된 기준 환경영향 평가값을 제1 연산부(310)에서 계산된 전과정 환경영향 평가값의 확률분포로 나누어 환경영향 지수의 확률분포를 도출하고, 도출된 환경영향 지수의 확률분포를 사용자 표시 수단 및 확률분포 출력부(500)로 출력할 수 있다.
제2 출력부(420)는, 제2 저장부(120)에 저장된 기준 비용 평가값을 제2 연산부(320)에서 계산된 전과정 비용 평가값의 확률분포로 나누어 비용 지수의 확률분포를 도출하고, 도출된 비용 지수의 확률분포를 사용자 표시 수단 및 확률분포 출력부(500)로 출력할 수 있다.
제3 출력부(430)는, 제3 연산부(330)에서 계산된 전과정 사회영향 평가값의 확률분포를 제3 저장부(130)에 저장된 기준 환경영향 평가값으로 나누어 사회영향 지수의 확률분포를 도출하고, 도출된 상기 사회영향 지수의 확률분포를 사용자 표시 수단 및 확률분포 출력부(500)로 출력할 수 있다.
확률분포 출력부(500)는, 몬테카를로 시뮬레이션에 의해, 제1 출력부(410)에서 제공받은 환경영향 지수의 확률분포(P-EI), 제2 출력부(420)에서 제공받은 비용 지수의 확률분포(P-CI) 및 제3 출력부(430)에서 제공받은 사회영향 지수의 확률분포(P-SI)를 하기 수학식 17에 대입하여 지속가능 건축물 지수의 확률분포(P-SBI)를 도출하고, 도출된 지속가능 건축물 지수의 확률분포를 사용자 표시 수단 등으로 출력할 수 있다. 여기서, 환경영향 지수의 확률분포, 비용 지수의 확률분포, 사회영향 지수의 확률분포 및 지속가능 건축물 지수의 확률분포는 단일의 몬테카를로 시뮬레이션 분석에 의해 함께 도출되는 것이 바람직하나 이에 한정되지 않는다.
[수학식 17]

여기서 α, β, γ는 각각 P-EI, P-CI, P-SI의 가중치를 나타낸다. 가중치 α, β, γ는 건축물의 전과정 환경영향, 전과정 비용, 전과정 사회영향에 대한 균형을 유지하기 위해 각각 1/3으로 설정(α=β=γ=1/3)할 수 있으나, 평가대상 건축물의 특성과 건축주체의 성향에 따라 조정될 수 있다. 단, α, β, γ의 총 합은 1(α+β+γ=1)로 고정되어야 한다.
지속가능 건축물 지수의 확률분포를 구성하는 환경영향 지수의 확률분포, 비용 지수의 확률분포, 사회영향 지수의 확률분포를 하나의 확률분포로 표현하기 위해 환경적, 경제적, 사회적 측면에 대한 가중치를 보면, 가중치는 지속가능성 평가의 대상과 목적에 따라 환경적, 경제적, 사회적 측면별로 상이한 가중치를 적용할 수 있다. 한편, 가중치의 평균값은 환경적, 경제적, 사회적 측면에 따라 0.319, 0.339, 0.342로 설정될 수 있으나, 가중치는 평가대상 건축물의 특성과 건축주체의 성향에 따라 조정 될 수 있으며 이에 한정되지 않는다.
본 발명의 건축물 전과정 지속가능성 평가 장치는, EAM, CAM, SAM과 전과정 지속가능성 평가(LCSA, Life Cycle Sustainability Assessment) 기법에 근간하여 건축사업 초기단계에서 활용 가능한 확률론적 방식의 건축물 전과정 지속가능성 평가모델(PSA Model, Probabilistic Sustainability Assessment Model)을 사용하여 지속가능 건축물 지수의 확률분포를 도출할 수 있다.
또한, 제1 저장부(110), 제2 저장부(120) 및 제3 저장부(130)에 저장된 기준 환경영향 평가값, 기준 비용 평가값 및 기준 사회영향 평가값을 설정하기 위한 기준 건축물로, 국내에서 건설된 38개의 공동주택 단지를 대상으로 전과정 환경영향 평가, 전과정 비용 평가, 전과정 사회영향 평가를 수행하여 상위 10%, 20%, 30%에 해당되는 건축물을 선정할 수 있다.
제1 출력부(410), 제2 출력부(420) 및 제3 출력부(430)에 의해 도출되는 환경영향 지수의 확률분포, 비용 지수의 확률분포, 사회영향 지수의 확률분포는 상대적 효율성 방식을 도입하여 기준 건축물(Reference building)의 전과정 환경영향, 전과정 비용, 전과정 사회영향과 EAM, CAM, SAM에서 산출되는 평가 건축물의 전과정 환경영향, 전과정 비용, 전과정 사회영향 평가결과를 비교할 수 있도록 하기 수학식 18 내지 수학식 20에 의해 계산될 수 있다.
이때, 제1 연산부(310) 및 제2 연산부(320)를 통해 산출되는 확률분포 내 환경영향 평가값과 전과정 비용 평가값은, 그 수치가 작을수록 좋은 성능을 나타낸다. 따라서, 환경영향 지수와 비용 지수에서 평가 건축물의 전과정 환경영향 평가값, 전과정 비용 평가값의 평가결과인 확률분포를 분모에 위치시켰고 기준 건축물의 기준 환경영향 평가값 및 기준 비용 평가값은 분자에 위치시켰다.
한편, 제3 연산부(330)를 통해 산출되는 확률분포 내 전과정 사회영향 평가값은 건축물의 사회적 성능을 나타내며, 확률분포 내 전과정 사회영향 평가값의 크기와 건축물의 사회적 성능이 비례의 경향을 나타낸다. 따라서, 평가 건축물에 대한 전과정 사회영향 평가값의 확률분포를 분자에 위치시켰고 기준 사회영향 평가값은 분모에 위치시켰다. 도 5에 도시된 바와 같이 P-EI, P-CI, P-SI의 확률분포가 각각 1을 기준으로 이를 초과한 영역에 위치한 부분의 면적은 평가 건축물의 환경적, 경제적, 사회적 수준이 기준 건축물 보다 높을 확률을 의미하며, 1 미만에 위치한 부분의 면적은 그 수준이 낮을 확률을 나타낸다. 이러한 관점에서 P-SBI도 1을 초과한 영역에 위치한 부분의 면적은 평가 건축물에 대한 지속가능성의 수준이 표준 건축물 보다 높을 확률을 의미하며, 1 미만에 위치한 부분의 면적은 그 수준이 낮을 확률을 나타낸다. 단, 여기서도 전과정 환경영향과 전과정 비용에 대한 평가 건축물과 기준 건축물의 확률론적 평가결과는 모두 비율척도(Ratio scale) 기반으로 산출됨에 따라 P-EI, P-CI는 기준 건축물 대비 평가 건축물에 대한 성능의 비율(Ratio)을 의미하지만 P-SI는 등간척도(Interval scale)에 기반한 전과정 사회영향의 평가결과로써 평가 건축물과 기준 건축물의 성능에 대한 절대적 비율을 의미하지 않고 성능의 상대적인 높고 낮음을 나타낸다.
[수학식 18]

[수학식 19]

[수학식 20]

여기서, P-EI, P-CI, P-SI는 각각 건축물의 확률론적 환경영향 지수, 확률론적 비용 지수, 확률론적 사회영향 지수를 나타내며, REAM,R, RCAM,R, RSAM,R는 각각 EAM, CAM, SAM을 이용한 기준 건축물의 평가결과, PREAM,E, PRCAM,E, PRSAM,E는 각각 주요 건축자재의 확률분포와 몬테카를로 시뮬레이션을 활용하여 EAM, CAM, SAM을 통해 산출한 평가 건축물에 대한 확률론적 방식의 평가결과를 의미한다.
제1 저장부(110), 제2 저장부(120) 및 제3 저장부(130)에 저장된 기준 환경영향 평가값, 기준 비용 평가값 및 기준 사회영향 평가값을 설정하기 위한 기준 건축물은, 지속가능성을 평가하는 목적에 따라 다양한 기준이 설정될 수 있다. 따라서 다양한 기준 건축물의 수준을 제안하기 위해 지난 2005년부터 2014년까지 국내에서 설계되어 건설된 38개의 공동주택 단지에 대한 전과정 환경영향, 전과정 비용, 전과정 사회영향을 평가한다. 또한, 마스다르시티(Masdar city)의 청정개발체제(CDM, Clean Development Mechanism) 사업의 방법론으로 UNFCCC에 등록된 AM0091(Energy efficiency technologies and fuel switching in new and existing buildings)의 베이스라인 산정 기준에 따라 상위 20%에 해당하는 평가결과와 추가적으로 상위 10%와 30%에 해당되는 평가결과도 기준 건축물로 설정할 수 있다. 하기 표 24는 기준 건축물로 평가한 공동주택 단지의 구성의 일례를 나타낸다.
[표 24]

38개 공동주택 단지에 대한 전과정 환경영향, 전과정 비용, 전과정 사회영향을 평가를 위해 표본으로 설정한 공동주택 단지의 물량산출서(BOQ)를 각각의 건설사로부터 입수할 수 있으며, 이를 분석하여 주요 건축자재 10종의 물량을 도출할 수 있다. 이를 통해 건축물의 생산단계, 시공단계, 폐기단계에 대한 내재 환경영향, 직접공사비 및 유지보수비용, 전과정 사회영향을 평가할 수 있다. 한편, 공동주택을 구성하는 세대의 면적(46㎡, 59㎡, 84㎡)에 따라 에너지의 소비 특성을 통계적 방법으로 분석하여 단위면적당 1차 에너지소비량과 2차 에너지소비량으로 하기 표 25의 데이터를 적용하여 운영단계에 대한 환경영향, 운영 에너지 비용을 평가할 수 있다. 이때, 공동주택 단지를 구성하는 세대의 전용면적을 46㎡ 이하, 46㎡ 초과 및 59㎡ 미만, 84㎡ 이상으로 구분하여 각각 전용면적 46㎡, 59㎡, 84㎡의 1차 에너지소비량 원단위를 적용할 수 있다.
[표 25]

도 6은 표본 공동주택 단지에 대한 전과정 환경영향 평가결과를 나타낸다. 도 6에 따르면 표본 건축물의 전과정 환경영향(KOLID를 이용한 환경영향의 화폐가치화)은 단위 전용면적 당 최소 13.8만원/㎡에서 최대 18.1만원/㎡까지 산출된다. 이때, 표본 공동주택 단지 중 상위 10%, 20%, 30%에 해당되는 전과정 환경영향 평가결과는 각각 단위 전용면적 당 14.2만원/㎡, 14.7만원/㎡, 15.0만원/㎡이 도출되고 이를 기준 건축물의 기준 환경영향 평가값(REAM,R)으로 설정할 수 있다.
도 7은 표본 공동주택 단지에 대한 전과정 비용 평가결과를 나타낸다. 도 7에 따르면 표본 건축물의 전과정 비용은 단위 전용면적 당 최소 78.9만원/㎡에서 최대 99.6만원/㎡까지 산출된다. 이때, 표본 공동주택 단지 중 상위 10%, 20%, 30%에 해당되는 전과정 비용 평가결과인 단위 전용면적 당 81.9만원/㎡, 83.8만원/㎡, 84.7만원/㎡을 기준 건축물의 기준 비용 평가값(RCAM,R)으로 설정하였다.
도 8은 표본 공동주택 단지에 대한 전과정 사회영향 평가결과를 나타낸다. 도 8에 따르면 표본 건축물의 전과정 사회영향은 최소 0.39점/㎡에서 최대 0.77점/㎡까지 산출된다. 이때, 표본 공동주택 단지 중 상위 10%, 20%, 30%에 해당되는 전과정 사회영향 평가결과는 단위 전용면적 당 0.66점/㎡, 0.62점/㎡, 0.60점/㎡으로 도출되고 이를 기준 건축물의 기준 사회영향 평가값(RSAM,R)으로 설정한다.
도 4는 본 발명의 확률론적 분석 방법을 이용한 건축물 전과정 지속가능성 평가 장치의 체계를 나타낸 것으로 이를 통하여 본 발명의 확률론적 분석 방법을 이용한 건축물 전과정 지속가능성 평가 장치의 전반적인 동작에 대하여 설명하면 다음과 같다.
입력단계는 기준 건축물에 대한 환경적, 경제적, 사회적 측면의 수준을 설정하고 평가 건축물의 전과정 지속가능성 평가를 위해 요구되는 정보를 입력하는 단계이다. 이때, 건축 설계도서를 바탕으로 평가 건축물의 연면적, 바닥면적, 전용면적 등을 포함한 건축개요와 에너지 시뮬레이션 도구를 통해 평가된 연간 운영 에너지소비량을 에너지원별로 구분하여 입력한다.
연산단계에서는 상기 입력단계에서 확보한 건축물의 정보를 통해 주요 건축자재 10종(레미콘, 철근, 유리, 콘크리트벽돌, 단열재, 석고보드, 창호, 석재, 타일, 페인트)에 대한 확률분포를 도출한다.
이때, 주거동의 레미콘과 철근은 벽식구조, 라멘구조, 무량판구조의 구조형식과 판상형, 탑상형, 복합형의 건축물 형태에 따라 전용면적당 건축자재 투입량의 확률분포가 도출된다. 유리, 콘크리트벽돌, 단열재, 석고보드, 창호, 석재 ,타일, 페인트도 전술한 레미콘 및 철근과 동일한 방식으로 연산된다. 또한, 부속동의 레미콘과 철근 투입량은 부속동의 바닥면적에 따라 그 확률분포를 도출할 수 있으며, 지하주차장의 레미콘과 철근은 공동주택 단지에 대한 총 세대수에 따라 전용면적당 건축자재 투입량의 확률분포가 결정된다.
이와 같이 도출된 세부 건축자재의 투입량에 대한 확률분포는 건축물의 생산단계를 평가하기 위한 물량 정보로 활용되며, 도 9에 도시된 바와 같은 구축된 전과정 시나리오를 통해 시공단계, 폐기단계 등을 평가하기 위한 에너지소비량과 건축자재의 물량을 확률분포 형태로 도출하게 된다. 이렇게 도출된 건축자재의 물량과 에너지소비량 정보에 기초하여 건축물의 전과정 환경영향, 전과정 비용, 전과정 사회영향을 순차적으로 평가하며, 최종적으로 몬테카를로 시뮬레이션을 도구로 이용한 평가를 수행하게 된다.
생산단계는 주요 건축자재 6종의 물량의 확률분포와 건축자재의 환경영향 원단위를 통해 건축자재 생산에 따른 환경영향을 평가한다(수학식 3 참조).
시공단계는 본 연구에서 구축된 전과정 시나리오를 통해 주요 건축자재 6종을 운송하기 위한 운송차량과 건축물의 시공을 위한 에너지소비량의 확률분포를 산출하고 에너지원의 환경영향 원단위를 이용하여 환경영향을 평가한다. 이때, 운송과정의 에너지소비량은 주요 건축자재 6종의 투입량과 운송차량별 연비 정보에 기초하며, 시공과정의 에너지소비량은 평가 건축물의 연면적을 기준으로 산출되나 전용면적을 기준으로 산출될 수도 있으며 이에 한정되지 않는다.
운영단계는 건축물의 운영 에너지소비량과 유지보수과정에서 투입되는 주요 건축자재의 환경영향을 평가한다. 이때, 운영 에너지소비량의 확률분포는 입력단계에서 입력된 연간 운영 에너지소비량과 건축물의 수명인 40년, 그리고 에너지원의 환경영향 원단위를 통해 환경영향을 평가한다. 유지보수과정의 환경영향은 주요 건축자재의 수선주기와 수선율을 통해 새롭게 투입되는 건축자재의 물량의 확률분포를 산출하고 건축자재의 환경영향 원단위를 이용하여 평가한다.
폐기단계는 전과정 시나리오를 통해 건축물의 해체과정, 폐건축자재의 운송과정, 폐건축자재의 매립과정에서 사용된 장비의 에너지소비량 대한 확률분포를 산출하고 에너지원의 환경영향 원단위를 통해 환경영향을 평가한다. 이때, 해체과정의 에너지소비량의 확률분포은 주요 건축자재 6종의 투입량에 대한 총 중량(폐건축자재의 양은 생산단계에서 투입된 건축자재의 수량과 동일하다고 설정함.)과 해체장비인 Backhoe (1.0㎥) + Giant Breaker (0.7㎥)의 연비를 이용하여 산출한다. 운송과정의 에너지소비량의 확률분포는 폐건축자재의 총 중량과 15ton 트럭의 연비를 통해 산출한다. 매립과정의 에너지소비량은 주요 건축자재별 재활용율과 매립장비인 Dozer (D8N, 15 PL, 6 PL) + Compactor (32ton)의 연비를 통해 산출한다.
입력단계에서 입력된 주요 건축자재 10종에 대한 투입량의 확률분포와 연간 운영 에너지소비량의 확률분포를 이용하여 전과정 비용을 평가한다.
생산단계와 시공단계는 주요 건축자재 10종의 물량의 확률분포와 건축자재별 직접공사비의 단가를 통해 직접공사비를 평가한다.
운영단계는 건축물의 운영 에너지소비량의 확률분포에 기초한 운영 에너지 비용과 건축물의 유지보수과정에서 투입되는 주요 건축자재에 기초한 유지보수비용을 평가한다. 이때, 운영 에너지 비용은 앞서 입력된 연간 운영 에너지소비량의 확률분포와 건축물의 수명인 40년, 그리고 에너지원의 단가정보와 실질할인율을 이용하여 평가한다. 유지보수비용은 주요 건축자재의 수선주기와 수선율을 통해 투입되는 건축자재의 물량의 확률분포를 산출하고 건축자재의 직접공사비 단가 정보를 통해 평가한다.
건축물의 전과정 사회영향은 수학식 15를 이용하여 입력단계에서 입력된 레미콘의 물량의 확률분포와 본 연구에서 구축된 레미콘의 사회영향 원단위를 통해 평가한다.
출력단계에서는 수학식 17 내지 수학식 20을 이용하여 연산단계에서 산출된 평가 건축물의 확률론적 전과정 환경영향, 확률론적 전과정 비용, 확률론적 전과정 사회영향 평가결과와 입력단계에서 사전에 설정한 기준 건축물의 수준에 근거하여 평가 건축물의 P-EI, P-CI, P-SI를 산출하며, 이를 종합한 P-SBI를 출력한다.
도 2는 본 발명의 확률론적 분석 방법을 이용한 건축물 전과정 지속가능성 평가 방법을 나타낸 동작흐름도로서, 본 발명의 건축물 전과정 지속가능성 평가 방법에 대하여 도 1 내지 도 2를 참조하여 설명하면 다음과 같다.
먼저, 기준 건축물에 대한 기준 환경영향 평가값, 복수개의 건축자재의 투입 단위 당 환경영향 정도를 수치화한 제1 환경영향계수 집합 및 복수개의 에너지원의 소비 단위 당 환경영향 정도를 수치화한 제2 환경영향계수 집합을 제1 저장부(110)에 저장한다(S100).
다음에, 입력부(210)를 통하여 건축물의 면적정보, 복수개의 건축자재 투입량 및 복수개의 에너지원 소비량을 입력받는다(S200).
여기서, 확률분포 계산부(220)는, 복수개의 건축자재 투입량 및 복수개의 에너지원 소비량에 대하여 건축물의 면적 정보에 따른 건축자재 및 에너지원의 확률분포 형태에 관해 미리 저장된 설정값에 따라 복수개의 건축자재 투입량의 확률분포 및 복수개의 에너지원 소비량의 확률분포를 도출한다(S300)
이후에, 제1 연산부(310)는, 몬테카를로 시뮬레이션을 이용하여, 확률분포 계산부(220)를 통하여 입력된 복수개의 건축자재 투입량의 확률분포 및 제1 저장부(110)에 저장된 제1 환경영향계수 집합을 이용하여 건축자재에 의한 제1 환경영향 평가값의 확률분포를 계산하고, 복수개의 에너지원 소비량의 확률분포 및 제2 환경영향계수 집합을 이용하여 에너지원에 의한 제2 환경영향 평가값의 확률분포를 계산하며, 제1 환경영향 평가값의 확률분포 및 제2 환경영향 평가값의 확률분포를 합산하여 전과정 환경영향 평가값의 확률분포를 계산한다(S400)
확률분포 출력부(500)는, 제1 저장부(110)에 저장된 기준 환경영향 평가값을 앞서 계산된 전과정 환경영향 평가값의 확률분포로 나누어 환경영향 지수의 확률분포를 도출하고, 도출된 상기 환경영향 지수의 확률분포를 출력한다(S500).
또한, 기준 건축물에 대한 기준 비용 평가값, 복수개의 건축자재의 투입 단위 당 비용 소요 정도를 수치화한 제1 비용계수 집합 및 복수개의 에너지원의 소비 단위 당 비용 소요 정도를 수치화한 제2 비용계수 집합을 제2 저장부(120)에 저장할 수 있다(S600).
이후에, 제2 연산부(320)는, 몬테카를로 시뮬레이션을 이용하여, 확률분포 계산부(220)를 통하여 입력된 복수개의 건축자재 투입량의 확률분포 및 제2 저장부(120)에 저장된 제1 비용계수 집합을 이용하여 건축자재에 의한 제1 비용 평가값의 확률분포를 계산하고, 복수개의 에너지원 소비량의 확률분포 및 제2 비용계수 집합을 이용하여 에너지원에 의한 제2 비용 평가값의 확률분포를 계산하며, 제1 비용 평가값의 확률분포 및 제2 비용 평가값의 확률분포를 합산하여 전과정 비용 평가값의 확률분포를 계산할 수 있다(S700).
제2 출력부(420)는, 제2 저장부(120)에 저장된 기준 비용 평가값을 앞서 계산된 전과정 비용 평가값의 확률분포로 나누어 비용 지수의 확률분포를 도출하고, 도출된 상기 비용 지수의 확률분포를 출력할 수 있다(S800).
한편, 기준 건축물에 대한 기준 사회영향 평가값, 복수개의 건축자재의 투입 단위 당 사회영향 정도를 수치화한 사회영향계수 집합을 제3 저장부(130)에 저장할 수 있다(S900).
다음에, 제3 연산부(330)는, 몬테카를로 시뮬레이션을 이용하여, 확률분포 계산부(220)를 통하여 입력된 복수개의 건축자재 투입량의 확률분포 및 제3 저장부(130)에 저장된 사회영향계수 집합을 이용하여 전과정 사회영향 평가값의 확률분포를 계산할 수 있다(S1000).
제3 출력부(430)는, 앞서 계산된 전과정 사회영향 평가값의 확률분포를 제3 저장부(130)에 저장된 기준 사회영향 평가값으로 나누어 사회영향 지수의 확률분포를 도출하고, 도출된 사회영향 지수의 확률분포를 출력할 수 있다(S1100).
확률분포 출력부(500)는, 몬테카를로 시뮬레이션을 이용하여, 제1 출력부(410)에서 제공받은 환경영향 지수의 확률분포(P-EI), 제2 출력부(420)에서 제공받은 비용 지수의 확률분포(P-CI) 및 제3 출력부(430)에서 제공받은 사회영향 지수의 확률분포(P-SI)를 상술한 수학식 17에 대입하여 지속가능 건축물 지수의 확률분포(P-SBI)를 도출하고, 도출된 지속가능 건축물 지수의 확률분포를 사용자 표시 수단 등으로 출력할 수 있다(S1200).
이러한 본 발명에 의한 확률론적 분석 방법을 이용한 건축물 전과정 지속가능성 평가 방법은 프로그램으로 구현되어 컴퓨터로 읽을 수 있는 기록매체(씨디롬, 램, 롬, 플로피 디스크, 하드 디스크, 광자기 디스크 등)에 저장될 수 있다.
이상에서 설명한 본 발명은 전술한 실시예 및 도면에 한정되는 것이 아니고, 본 발명의 기술적 사상을 벗어나지 않는 범위 내에서 얼마든지, 치환, 변경 및 변형이 가능하다는 것은 본 발명이 속하는 분야에서 통상의 지식을 가진 자에게 있어서 명백할 것이다.
Claims (9)
- 기준 건축물에 대한 기준 환경영향 평가값, 복수개의 건축자재의 투입 단위 당 환경영향 정도를 수치화한 제1 환경영향계수 집합 및 복수개의 에너지원의 소비 단위 당 환경영향 정도를 수치화한 제2 환경영향계수 집합을 저장하는 제1 저장부;건축물의 면적 정보, 복수개의 건축자재 투입량 및 복수개의 에너지원 소비량을 입력받는 입력부;상기 건축물의 면적 정보에 따른 건축자재 및 에너지원의 확률분포 형태의 설정값을 저장하고, 상기 복수개의 건축자재 투입량 및 상기 복수개의 에너지원 소비량에 대하여 상기 설정값에 따라 복수개의 건축자재 투입량의 확률분포 및 복수개의 에너지원 소비량의 확률분포를 도출하는 확률분포 계산부;몬테카를로 시뮬레이션에 의하여, 상기 복수개의 건축자재 투입량의 확률분포 및 상기 제1 환경영향계수 집합을 이용하여 의해 건축자재에 의한 제1 환경영향 평가값의 확률분포를 계산하고, 상기 복수개의 에너지원 소비량의 확률분포 및 상기 제2 환경영향계수 집합을 이용하여 에너지원에 의한 제2 환경영향 평가값의 확률분포를 계산하며, 상기 제1 환경영향 평가값의 확률분포 및 상기 제2 환경영향 평가값의 확률분포를 합산하여 전과정 환경영향 평가값의 확률분포를 계산하는 제1 연산부; 및상기 제1 저장부에 저장된 기준 환경영향 평가값을 상기 제1 연산부에서 계산된 상기 전과정 환경영향 평가값의 확률분포로 나누어 환경영향 지수의 확률분포의 확률분포를 도출하고, 도출된 상기 환경영향 지수의 확률분포를 출력하는 제1 출력부를 포함하는 확률론적 분석 방법을 이용한 건축물 전과정 지속가능성 평가 장치.
- 청구항 1에 있어서,기준 건축물에 대한 기준 비용 평가값, 복수개의 건축자재의 투입 단위 당 비용 소요 정도를 수치화한 제1 비용계수 집합 및 복수개의 에너지원의 소비 단위 당 비용 소요 정도를 수치화한 제2 비용계수 집합을 저장하는 제2 저장부;몬테카를로 시뮬레이션에 의하여, 상기 복수개의 건축자재 투입량의 확률분포 및 상기 제1 비용계수 집합을 이용하여 건축자재에 의한 제1 비용 평가값의 확률분포를 계산하고, 상기 복수개의 에너지원 소비량의 확률분포 및 상기 제2 비용계수 집합을 이용하여 에너지원에 의한 제2 비용 평가값의 확률분포를 계산하며, 상기 제1 비용 평가값의 확률분포 및 상기 제2 비용 평가값의 확률분포를 합산하여 전과정 비용 평가값의 확률분포를 계산하는 제2 연산부; 및상기 제2 저장부에 저장된 기준 비용 평가값을 상기 제2 연산부에서 계산된 상기 전과정 비용 평가값의 확률분포로 나누어 비용 지수의 확률분포를 도출하고, 도출된 상기 비용 지수의 확률분포를 출력하는 제2 출력부를 더 포함하는 확률론적 분석 방법을 이용한 건축물 전과정 지속가능성 평가 장치.
- 청구항 2에 있어서,기준 건축물에 대한 기준 사회영향 평가값, 복수개의 건축자재의 투입 단위 당 사회영향 정도를 수치화한 사회영향계수 집합을 저장하는 제3 저장부;몬테카를로 시뮬레이션에 의하여, 상기 복수개의 건축자재 투입량의 확률분포 및 상기 사회영향계수 집합을 이용하여 전과정 사회영향 평가값의 확률분포를 계산하는 제3 연산부; 및상기 제3 연산부에서 계산된 상기 전과정 사회영향 평가값의 확률분포를 상기 제3 저장부에 저장된 기준 사회영향 평가값으로 나누어 사회영향 지수의 확률분포를 도출하고, 도출된 상기 사회영향 지수의 확률분포를 출력하는 제3 출력부를 더 포함하는 확률론적 분석 방법을 이용한 건축물 전과정 지속가능성 평가 장치.
- 청구항 3에 있어서,몬테카를로 시뮬레이션 및
 - 여기서, P-SBI는 지속가능 건축물 지수의 확률분포, P-EI는 환경영향 지수의 확률분포, P-CI는 비용 지수의 확률분포, P-SI는 사회영향 지수의 확률분포, α, β, γ는,인 가중치 설정 계수임 -
 에 의해 지속가능 건축물 지수의 확률분포를 도출하고, 도출된 상기 지속가능 건축물 지수의 확률분포를 출력하는 확률분포 출력부를 더 포함하는 확률론적 분석 방법을 이용한 건축물 전과정 지속가능성 평가 장치.
 - 기준 건축물에 대한 기준 환경영향 평가값, 복수개의 건축자재의 투입 단위 당 환경영향 정도를 수치화한 제1 환경영향계수 집합 및 복수개의 에너지원의 소비 단위 당 환경영향 정도를 수치화한 제2 환경영향계수 집합을 저장하는 제1 단계;건축물의 면적 정보, 복수개의 건축자재 투입량 및 복수개의 에너지원 소비량을 입력받는 제2 단계;상기 복수개의 건축자재 투입량 및 상기 복수개의 에너지원 소비량에 대하여 상기 건축물의 면적 정보에 따른 건축자재 및 에너지원의 확률분포 형태에 관해 미리 저장된 설정값에 따라 복수개의 건축자재 투입량의 확률분포 및 복수개의 에너지원 소비량의 확률분포를 도출하는 제3 단계;몬테카를로 시뮬레이션에 의해, 상기 복수개의 건축자재 투입량의 확률분포 및 상기 제1 환경영향계수 집합을 이용하여 건축자재에 의한 제1 환경영향 평가값의 확률분포를 계산하고, 상기 복수개의 에너지원 소비량의 확률분포 및 상기 제2 환경영향계수 집합을 이용하여 에너지원에 의한 제2 환경영향 평가값의 확률분포를 계산하며, 상기 제1 환경영향 평가값의 확률분포 및 상기 제2 환경영향 평가값의 확률분포를 합산하여 전과정 환경영향 평가값의 확률분포를 계산하는 제4 단계; 및상기 기준 환경영향 평가값을 상기 제4 단계에서 계산된 상기 전과정 환경영향 평가값의 확률분포로 나누어 환경영향 지수의 확률분포를 도출하고, 도출된 상기 환경영향 지수의 확률분포를 출력하는 제5 단계를 포함하는 확률론적 분석 방법을 이용한 건축물 전과정 지속가능성 평가 방법.
- 청구항 5에 있어서,기준 건축물에 대한 기준 비용 평가값, 복수개의 건축자재의 투입 단위 당 비용 소요 정도를 수치화한 제1 비용계수 집합 및 복수개의 에너지원의 소비 단위 당 비용 소요 정도를 수치화한 제2 비용계수 집합을 저장하는 제6 단계;몬테카를로 시뮬레이션에 의해, 상기 복수개의 건축자재 투입량의 확률분포 및 상기 제1 비용계수 집합을 이용하여 건축자재에 의한 제1 비용 평가값의 확률분포를 계산하고, 상기 복수개의 에너지원 소비량의 확률분포 및 상기 제2 비용계수 집합을 이용하여 에너지원에 의한 제2 비용 평가값의 확률분포를 계산하며, 상기 제1 비용 평가값의 확률분포 및 상기 제2 비용 평가값의 확률분포를 합산하여 전과정 비용 평가값의 확률분포를 계산하는 제7 단계; 및상기 기준 비용 평가값을 상기 제7 단계에서 계산된 상기 전과정 비용 평가값의 확률분포로 나누어 비용 지수의 확률분포를 도출하고, 도출된 상기 비용 지수의 확률분포를 출력하는 제8 단계를 더 포함하는 확률론적 분석 방법을 이용한 건축물 전과정 지속가능성 평가 방법.
- 청구항 6에 있어서,기준 건축물에 대한 기준 사회영향 평가값, 복수개의 건축자재의 투입 단위 당 사회영향 정도를 수치화한 사회영향계수 집합을 저장하는 제9 단계;몬테카를로 시뮬레이션에 의해, 상기 복수개의 건축자재 투입량의 확률분포 및 상기 사회영향계수 집합을 이용하여 전과정 사회영향 평가값의 확률분포를 계산하는 제10 단계; 및상기 제10 단계에서 계산된 상기 전과정 사회영향 평가값의 확률분포를 상기 기준 사회영향 평가값으로 나누어 사회영향 지수의 확률분포를 도출하고, 도출된 상기 사회영향 지수의 확률분포를 출력하는 제11 단계를 더 포함하는 확률론적 분석 방법을 이용한 건축물 전과정 지속가능성 평가 방법.
- 청구항 7에 있어서,몬테카를로 시뮬레이션 및
 - 여기서, P-SBI는 지속가능 건축물 지수의 확률분포, P-EI는 환경영향 지수의 확률분포, P-CI는 비용 지수의 확률분포, P-SI는 사회영향 지수의 확률분포, α, β, γ는,인 가중치 설정 계수임 -
 에 의해 지속가능 건축물 지수의 확률분포를 도출하고, 도출된 상기 지속가능 건축물 지수의 확률분포를 출력하는 제12 단계를 더 포함하는 확률론적 분석 방법을 이용한 건축물 전과정 지속가능성 평가 방법.
 - 청구항 5 내지 청구항 8 중 어느 한 항에 기재된 확률론적 분석 방법을 이용한 건축물 전과정 지속가능성 평가 방법을 실행하는 프로그램을 기록한 컴퓨터 판독 가능한 기록매체.
Priority Applications (1)
| Application Number | Priority Date | Filing Date | Title |
|---|---|---|---|
| US16/306,138 US11531793B2 (en) | 2017-01-02 | 2017-01-10 | Device and method for building life cycle sustainability assessment using probabilistic analysis method, and recording medium storing the method |
Applications Claiming Priority (2)
| Application Number | Priority Date | Filing Date | Title |
|---|---|---|---|
| KR10-2017-0000150 | 2017-01-02 | ||
| KR1020170000150A KR101814124B1 (ko) | 2017-01-02 | 2017-01-02 | 확률론적 분석 방법을 이용한 건축물 전과정 지속가능성 평가 장치, 방법 및 그 방법을 기록한 기록매체 |
Publications (1)
| Publication Number | Publication Date |
|---|---|
| WO2018124362A1 true WO2018124362A1 (ko) | 2018-07-05 |
Family
ID=61070323
Family Applications (1)
| Application Number | Title | Priority Date | Filing Date |
|---|---|---|---|
| PCT/KR2017/000344 Ceased WO2018124362A1 (ko) | 2017-01-02 | 2017-01-10 | 확률론적 분석 방법을 이용한 건축물 전과정 지속가능성 평가 장치, 방법 및 그 방법을 기록한 기록매체 |
Country Status (3)
| Country | Link |
|---|---|
| US (1) | US11531793B2 (ko) |
| KR (1) | KR101814124B1 (ko) |
| WO (1) | WO2018124362A1 (ko) |
Cited By (1)
| Publication number | Priority date | Publication date | Assignee | Title |
|---|---|---|---|---|
| CN115222053A (zh) * | 2022-09-20 | 2022-10-21 | 中国石油大学(华东) | 一种基于蒙特卡罗方法的地层可压性概率分析方法 |
Families Citing this family (19)
| Publication number | Priority date | Publication date | Assignee | Title |
|---|---|---|---|---|
| JP7058254B2 (ja) * | 2019-10-11 | 2022-04-21 | 京セラ株式会社 | 情報処理装置、情報処理方法、及びプログラム |
| KR20210048217A (ko) * | 2019-10-23 | 2021-05-03 | 주식회사 주택 | 자재별 노무비 계상 시스템 및 방법 |
| US11757890B1 (en) | 2020-02-03 | 2023-09-12 | Wells Fargo Bank, N.A. | Apparatuses and methods for regulated access management |
| KR102336679B1 (ko) * | 2020-06-25 | 2021-12-09 | 켐아이넷(주) | 모델선정지표 정규화 기반의 확률분포 선정 방법 |
| WO2022006221A1 (en) * | 2020-06-30 | 2022-01-06 | University Of Florida Research Foundation | Exergy-based life cycle assessment of buildings |
| GB2602617A (en) * | 2020-11-04 | 2022-07-13 | Firstplanit Ltd | Method and system for evaluating the environmental, community, health and economic benefits of selecting materials and products |
| CN112883568B (zh) * | 2021-02-04 | 2022-11-15 | 中国地质调查局武汉地质调查中心 | 炼钢月产量估算模型构建方法、装置、设备及存储介质 |
| KR102572085B1 (ko) * | 2021-02-24 | 2023-08-30 | 한국가스공사 | 확률론적 분석방법을 이용한 천연가스 공급 안정성 평가방법 |
| CN112926948B (zh) * | 2021-03-18 | 2022-08-12 | 福州大学 | 低温液化气体移动罐柜绿色制造过程的定量评估方法 |
| US20240242156A1 (en) * | 2021-05-07 | 2024-07-18 | Smarter Dharma Sustainable Solutions | Systems and methods for handling sustainability level in physical infrastructure |
| CN113283101B (zh) * | 2021-06-08 | 2022-08-30 | 陕西合友网络科技有限公司 | 基于健康监测数据的建筑性能评估方法、系统及介质 |
| CN113537425A (zh) * | 2021-07-20 | 2021-10-22 | 思藤(深圳)科技咨询有限公司 | 一种农业产品的环境足迹评估方法及系统 |
| CN114276850B (zh) * | 2021-12-24 | 2023-02-07 | 安徽工业大学 | 一种氟掺杂石墨烯负载Pb复合材料及其制备方法和应用 |
| US20230334187A1 (en) * | 2022-04-14 | 2023-10-19 | Trax.Gd Corp. | Simulating sustainability metric of modeled built environment |
| CN115907302B (zh) * | 2022-12-16 | 2025-08-15 | 西安理工大学 | 一种高寒地区泄水建筑物的寿命评估方法 |
| WO2024172757A1 (en) * | 2023-02-17 | 2024-08-22 | Hitachi, Ltd. | System and method for assessing green facility performance |
| CN116542425B (zh) * | 2023-05-23 | 2024-07-12 | 北京建工环境修复股份有限公司 | 绿色生态修复技术产业链碳核算与碳中和评价方法及系统 |
| US20240403505A1 (en) * | 2023-05-24 | 2024-12-05 | Adaptis Technologies Inc. | Comprehensive optimization systems and methods for whole lifecycle carbon management and circularity planning of existing and new buildings through multi-criteria simulations and analyses |
| CN119273007B (zh) * | 2024-11-25 | 2025-09-16 | 哈尔滨工业大学 | 基于蒙特卡洛模拟电催化膜环境影响核算的不确定性分析方法 |
Citations (4)
| Publication number | Priority date | Publication date | Assignee | Title |
|---|---|---|---|---|
| KR101390237B1 (ko) * | 2013-07-22 | 2014-04-30 | 한양대학교 에리카산학협력단 | 주요 자재를 이용한 건축물의 전과정 환경영향 평가방법 |
| KR101414282B1 (ko) * | 2012-10-02 | 2014-07-01 | 성균관대학교산학협력단 | 건축물 리모델링 사업에 있어서 에너지 성능의 경제성 평가 방법 |
| KR101472461B1 (ko) * | 2013-01-18 | 2014-12-15 | 한양대학교 에리카산학협력단 | 건축물 평가를 위한 bim 라이브러리 구축 시스템 |
| KR101642225B1 (ko) * | 2015-05-21 | 2016-08-01 | 성균관대학교산학협력단 | 에너지 성능 개선을 위한 건축물 리모델링 설계 방법 및 컴퓨터 프로그램 |
Family Cites Families (4)
| Publication number | Priority date | Publication date | Assignee | Title |
|---|---|---|---|---|
| US8694292B2 (en) * | 2008-08-29 | 2014-04-08 | Disney Enterprises, Inc. | Method and system for estimating building performance |
| US20100223081A1 (en) | 2009-09-24 | 2010-09-02 | Espino Jr Mario A | Virtual business model for specific building energy and sustainability audits |
| KR20120108463A (ko) | 2011-03-24 | 2012-10-05 | 연세대학교 산학협력단 | 건축물에 대한 lcc 및 lcco2 분석 시스템 및 그 방법 |
| WO2014205496A1 (en) * | 2013-06-26 | 2014-12-31 | Climate Risk Pty Ltd | Computer implemented frameworks and methodologies for enabling risk analysis for a system comprising physical assets |
-
2017
- 2017-01-02 KR KR1020170000150A patent/KR101814124B1/ko active Active
- 2017-01-10 WO PCT/KR2017/000344 patent/WO2018124362A1/ko not_active Ceased
- 2017-01-10 US US16/306,138 patent/US11531793B2/en active Active
Patent Citations (4)
| Publication number | Priority date | Publication date | Assignee | Title |
|---|---|---|---|---|
| KR101414282B1 (ko) * | 2012-10-02 | 2014-07-01 | 성균관대학교산학협력단 | 건축물 리모델링 사업에 있어서 에너지 성능의 경제성 평가 방법 |
| KR101472461B1 (ko) * | 2013-01-18 | 2014-12-15 | 한양대학교 에리카산학협력단 | 건축물 평가를 위한 bim 라이브러리 구축 시스템 |
| KR101390237B1 (ko) * | 2013-07-22 | 2014-04-30 | 한양대학교 에리카산학협력단 | 주요 자재를 이용한 건축물의 전과정 환경영향 평가방법 |
| KR101642225B1 (ko) * | 2015-05-21 | 2016-08-01 | 성균관대학교산학협력단 | 에너지 성능 개선을 위한 건축물 리모델링 설계 방법 및 컴퓨터 프로그램 |
Non-Patent Citations (1)
| Title |
|---|
| HONG. TAE-HUN ET AL.: "Environmental Impact Assessment of Buildings Based on L ife Cycle Assessment (LCA) Methodology", KOREAN JOURNAL OF CONSTRUCTION ENGINEERING AND MANAGEMENT, vol. 13, no. 5, 30 September 2012 (2012-09-30), pages 84 - 93 * |
Cited By (1)
| Publication number | Priority date | Publication date | Assignee | Title |
|---|---|---|---|---|
| CN115222053A (zh) * | 2022-09-20 | 2022-10-21 | 中国石油大学(华东) | 一种基于蒙特卡罗方法的地层可压性概率分析方法 |
Also Published As
| Publication number | Publication date |
|---|---|
| US20200380179A1 (en) | 2020-12-03 |
| US11531793B2 (en) | 2022-12-20 |
| KR101814124B1 (ko) | 2018-01-30 |
Similar Documents
| Publication | Publication Date | Title |
|---|---|---|
| US11531793B2 (en) | Device and method for building life cycle sustainability assessment using probabilistic analysis method, and recording medium storing the method | |
| Ismaeel et al. | An environmental management plan for construction waste management | |
| KR101830104B1 (ko) | 지수를 이용한 건축물 전과정 지속가능성 평가 장치, 방법 및 그 방법을 기록한 기록매체 | |
| Rabl et al. | Uncertainty of Air Pollution Cost Estimates: to what extent does it matter? | |
| Tafesse | Material waste minimization techniques in building construction projects | |
| Georgopoulou et al. | BEAsT: a decision-support tool for assessing the environmental benefits and the economic attractiveness of best available techniques in industry | |
| Wang et al. | Environmental assessment tools | |
| Nezhaddehghan et al. | An optimized hybrid decision support system for waste management in construction projects based on gray data: a case study in high-rise buildings | |
| Singh | Safety in Indian construction | |
| Yip | New directions of environmental management in construction: accepted levels of pollution | |
| Tam et al. | Review on waste management systems in the Hong Kong construction industry: use of spectral and bispectral methods | |
| Shin | Basic Monitoring Concept for Revised Unit Load on NPS | |
| DREGAN et al. | Risk at work: assessment in a Romanian precast concrete elements manufacturing company | |
| Cremeans | Conceptual Amd Statistical Issues In Developing Environmental Measures‐Recent US Experience | |
| Ortiz Rodríguez | Sustainability assessment within the residential building sector: a practical life cycle method applied in a developed and a developing country | |
| Agyekum et al. | COVID-19 and the Ghanaian construction industry: Current state of impact and mitigation measures | |
| Narindri | Life cycle cost planning of government building in Gunung Kidul Regency, Indonesia | |
| Prabhakar et al. | Comparative Analysis Of Major Green Building Rating Systems And Development Of Green Building Checklist | |
| O'Riordan | Industrial pollution control in the UK | |
| Boros et al. | Characteristics of green public procurement in Hungary | |
| Millan | Green Buildings and Plugging the Gaps in Environmental Laws | |
| Thompson et al. | Integrating green rating systems: A case study for ferry terminals | |
| Emmanuel et al. | Analysis of the Opportunities and Challenges of Construction and Demolition Waste Management Methods Using PESTEL Analytical Tool | |
| Usmen et al. | Safety program guidelines for public school facility construction and operations | |
| Edirisinghe et al. | THE APPLICABILITY OF REGULATIONS FOR THE DISPOSAL OF CONSTRUCTION AND DEMOLITION WASTE IN SRI LANKA |
Legal Events
| Date | Code | Title | Description |
|---|---|---|---|
| 121 | Ep: the epo has been informed by wipo that ep was designated in this application |
Ref document number: 17888508 Country of ref document: EP Kind code of ref document: A1 |
|
| NENP | Non-entry into the national phase |
Ref country code: DE |
|
| 122 | Ep: pct application non-entry in european phase |
Ref document number: 17888508 Country of ref document: EP Kind code of ref document: A1 |