WO2018016233A1 - Ultrasound image capture device and computation method thereof - Google Patents
Ultrasound image capture device and computation method thereof Download PDFInfo
- Publication number
- WO2018016233A1 WO2018016233A1 PCT/JP2017/021781 JP2017021781W WO2018016233A1 WO 2018016233 A1 WO2018016233 A1 WO 2018016233A1 JP 2017021781 W JP2017021781 W JP 2017021781W WO 2018016233 A1 WO2018016233 A1 WO 2018016233A1
- Authority
- WO
- WIPO (PCT)
- Prior art keywords
- blood flow
- flow velocity
- velocity gradient
- wall surface
- blood vessel
- Prior art date
Links
Images

Classifications
-
- A—HUMAN NECESSITIES
- A61—MEDICAL OR VETERINARY SCIENCE; HYGIENE
- A61B—DIAGNOSIS; SURGERY; IDENTIFICATION
- A61B8/00—Diagnosis using ultrasonic, sonic or infrasonic waves
- A61B8/06—Measuring blood flow
-
- A—HUMAN NECESSITIES
- A61—MEDICAL OR VETERINARY SCIENCE; HYGIENE
- A61B—DIAGNOSIS; SURGERY; IDENTIFICATION
- A61B8/00—Diagnosis using ultrasonic, sonic or infrasonic waves
- A61B8/13—Tomography
- A61B8/14—Echo-tomography
-
- A—HUMAN NECESSITIES
- A61—MEDICAL OR VETERINARY SCIENCE; HYGIENE
- A61B—DIAGNOSIS; SURGERY; IDENTIFICATION
- A61B8/00—Diagnosis using ultrasonic, sonic or infrasonic waves
- A61B8/46—Ultrasonic, sonic or infrasonic diagnostic devices with special arrangements for interfacing with the operator or the patient
- A61B8/461—Displaying means of special interest
- A61B8/463—Displaying means of special interest characterised by displaying multiple images or images and diagnostic data on one display
-
- A—HUMAN NECESSITIES
- A61—MEDICAL OR VETERINARY SCIENCE; HYGIENE
- A61B—DIAGNOSIS; SURGERY; IDENTIFICATION
- A61B8/00—Diagnosis using ultrasonic, sonic or infrasonic waves
- A61B8/48—Diagnostic techniques
- A61B8/485—Diagnostic techniques involving measuring strain or elastic properties
-
- A—HUMAN NECESSITIES
- A61—MEDICAL OR VETERINARY SCIENCE; HYGIENE
- A61B—DIAGNOSIS; SURGERY; IDENTIFICATION
- A61B8/00—Diagnosis using ultrasonic, sonic or infrasonic waves
- A61B8/48—Diagnostic techniques
- A61B8/488—Diagnostic techniques involving Doppler signals
-
- A—HUMAN NECESSITIES
- A61—MEDICAL OR VETERINARY SCIENCE; HYGIENE
- A61B—DIAGNOSIS; SURGERY; IDENTIFICATION
- A61B8/00—Diagnosis using ultrasonic, sonic or infrasonic waves
- A61B8/52—Devices using data or image processing specially adapted for diagnosis using ultrasonic, sonic or infrasonic waves
- A61B8/5215—Devices using data or image processing specially adapted for diagnosis using ultrasonic, sonic or infrasonic waves involving processing of medical diagnostic data
- A61B8/5223—Devices using data or image processing specially adapted for diagnosis using ultrasonic, sonic or infrasonic waves involving processing of medical diagnostic data for extracting a diagnostic or physiological parameter from medical diagnostic data
-
- A—HUMAN NECESSITIES
- A61—MEDICAL OR VETERINARY SCIENCE; HYGIENE
- A61B—DIAGNOSIS; SURGERY; IDENTIFICATION
- A61B8/00—Diagnosis using ultrasonic, sonic or infrasonic waves
- A61B8/52—Devices using data or image processing specially adapted for diagnosis using ultrasonic, sonic or infrasonic waves
- A61B8/5269—Devices using data or image processing specially adapted for diagnosis using ultrasonic, sonic or infrasonic waves involving detection or reduction of artifacts
-
- A—HUMAN NECESSITIES
- A61—MEDICAL OR VETERINARY SCIENCE; HYGIENE
- A61B—DIAGNOSIS; SURGERY; IDENTIFICATION
- A61B8/00—Diagnosis using ultrasonic, sonic or infrasonic waves
- A61B8/52—Devices using data or image processing specially adapted for diagnosis using ultrasonic, sonic or infrasonic waves
- A61B8/5292—Devices using data or image processing specially adapted for diagnosis using ultrasonic, sonic or infrasonic waves using additional data, e.g. patient information, image labeling, acquisition parameters
-
- G—PHYSICS
- G16—INFORMATION AND COMMUNICATION TECHNOLOGY [ICT] SPECIALLY ADAPTED FOR SPECIFIC APPLICATION FIELDS
- G16H—HEALTHCARE INFORMATICS, i.e. INFORMATION AND COMMUNICATION TECHNOLOGY [ICT] SPECIALLY ADAPTED FOR THE HANDLING OR PROCESSING OF MEDICAL OR HEALTHCARE DATA
- G16H50/00—ICT specially adapted for medical diagnosis, medical simulation or medical data mining; ICT specially adapted for detecting, monitoring or modelling epidemics or pandemics
- G16H50/30—ICT specially adapted for medical diagnosis, medical simulation or medical data mining; ICT specially adapted for detecting, monitoring or modelling epidemics or pandemics for calculating health indices; for individual health risk assessment
Definitions
- the present invention relates to a medical ultrasonic imaging apparatus and relates to a technique for obtaining a blood flow velocity gradient in the vicinity of a blood vessel wall surface.
- arteriosclerosis One of the leading causes of death in developed countries is cardiovascular disease such as heart failure, and many of them are related to arteriosclerosis. It has been pointed out that the progression rate of arteriosclerosis changes depending on the magnitude of stimulation from the blood flow to the blood vessel wall surface. For this reason, wall shear stress acting on the blood vessel wall surface has attracted attention as a diagnostic index for early arteriosclerosis.
- One method for calculating the wall shear stress is to use an ultrasonic imaging device to calculate based on the blood flow velocity distribution measured by the ultrasonic Doppler method. This method requires that a blood flow velocity gradient, which is a spatial differential of the blood flow velocity distribution, be obtained with high accuracy near the blood vessel wall surface.
- the moving speed information of the reflector can be obtained from the echo signal using the Doppler effect, but the reflector includes not only erythrocytes in the bloodstream but also surrounding tissues such as vascular membranes and muscles.
- the blood flow in the vicinity of the blood vessel wall becomes slow as much as the movement of the surrounding tissue due to friction with the blood vessel wall surface, so the echo signal of the blood flow is buried in a signal outside the detection target such as the surrounding tissue, The measurement accuracy of blood flow velocity is reduced. Therefore, simply differentiating the blood flow velocity distribution measured by the ultrasonic imaging device does not provide a high blood flow velocity gradient in the vicinity of the blood vessel wall surface, and clinical diagnosis of arteriosclerosis is possible clinically. Accuracy is not realized.
- Non-Patent Document 1 There is a technique described in Non-Patent Document 1 as an ultrasonic imaging method for the purpose of improving blood flow velocity gradient measurement accuracy.
- This document includes "In.the first step the two regions that extend for about 5-10% of the diameter from the wall positions towards thewards" B. Velocity reconstruction and WSR measurement “in” II. MATERIALS AND METHODS " vessel lumen are located. The profile measured in these regions is substituted by a line that starts at the wall with velocity 0 and ramps up to join the remaining -measured- profile.
- the blood flow velocity distribution from the blood vessel wall to the region 5-10% away from the blood vessel diameter is rejected, interpolation is performed for the rejected region, and then the blood flow velocity gradient near the blood vessel wall is estimated. ing.
- Non-Patent Document 1 a method of determining a region in which a blood flow measurement value is rejected based on a blood vessel diameter is applied, and verification is performed by a simulation using a carotid artery as a model.
- the method of determining the rejection region based only on the blood vessel diameter Depending on the conditions, there may be a case where the measurement value of the blood flow velocity buried in the signal outside the detection target is not sufficiently rejected. As a result, there is a possibility that the blood flow velocity measurement value with low reliability is used for estimating the blood flow velocity gradient in the vicinity of the blood vessel wall surface.
- the present invention relates to an ultrasonic imaging apparatus for accurately estimating a blood flow velocity gradient in the vicinity of a blood vessel wall surface even under various blood flow conditions with different blood vessel shapes, flexibility, vascular endothelium properties, pulsations, and the like.
- An object is to provide a calculation method.
- the present invention includes a receiving unit that receives an echo signal reflected by an inspection target, and a signal processing unit that processes the echo signal received by the receiving unit, and the signal processing
- the blood flow velocity gradient from the value of the blood flow velocity in the direction along the blood vessel wall surface calculated from the echo signal at a plurality of measurement points arranged in the radial direction from the blood vessel wall surface to be examined to the blood vessel center.
- a velocity gradient distribution calculation unit for calculating a distribution for calculating a distribution
- a range specifying calculation unit for calculating a predetermined range in the blood flow velocity gradient distribution and blood flow velocity and blood flow velocity gradient values at measurement points in the predetermined range
- An ultrasonic imaging apparatus comprising: a wall surface velocity gradient calculation unit that calculates an estimated value of a blood flow velocity gradient on a blood vessel wall surface.
- a calculation method in an ultrasonic imaging apparatus wherein a blood flow velocity component in an ultrasonic irradiation direction in a blood vessel of the inspection target is calculated from an echo signal reflected by the inspection target.
- the blood flow velocity gradient near the blood vessel wall surface can be estimated with high accuracy under various blood flow conditions.
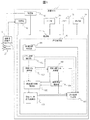
- FIG. 1 is a block diagram illustrating a configuration example of an ultrasonic imaging apparatus according to Embodiment 1.
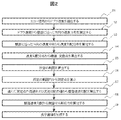
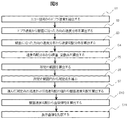
- FIG. The figure which shows the calculation processing flow which shows embodiment of the operation
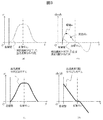
- FIG. The figure which shows the example of a blood flow velocity distribution, and the example of a blood flow velocity gradient distribution.
- FIG. 1 The figure which shows an example of the display image of the time-sequential change of the wall surface shear stress formed in a display image formation part.
- FIG. 1 is a block diagram illustrating a configuration example of an ultrasonic imaging apparatus having a wall shear stress measurement function according to the first embodiment.
- Wall shear stress is a blood flow stimulus that causes changes in vascular endothelial cells, and is a parameter that is attracting attention in clinical research as a diagnostic indicator in early diagnosis of arteriosclerosis.
- the magnitude of the wall shear stress has an effect on plaque failure caused by advanced arteriosclerosis and is closely related to the risk prediction of plaque failure.
- the apparatus main body 1 generates an ultrasonic image while controlling the ultrasonic probe 2, and includes an input unit 10, a control unit 11, a transmission unit 12 that transmits an ultrasonic signal, and a reception unit 13 that receives an echo signal. , A display unit 14, a signal processing unit 15, and a memory 16.
- the ultrasound probe 2 is in contact with the living body 3 of the subject, irradiates the blood vessel 30 in the living body 3 according to the signal generated by the transmitting unit 12, and the receiving unit 13 echoes the blood vessel 30. Receive.
- the ultrasonic probe 2 generates a continuous wave or a pulse wave according to the scanning method. Further, a two-dimensional imaging method for imaging a two-dimensional section or a three-dimensional imaging method for imaging a three-dimensional region may be appropriately selected depending on the scanning method of the ultrasonic probe 2.
- the input unit 10 includes a keyboard and a pointing device in which a doctor or an engineer (hereinafter collectively referred to as an examiner) who operates the ultrasonic imaging apparatus sets operating conditions of the ultrasonic imaging apparatus with respect to the control unit 11.
- an examiner a doctor or an engineer who operates the ultrasonic imaging apparatus sets operating conditions of the ultrasonic imaging apparatus with respect to the control unit 11.
- an external device such as an electrocardiogram
- a function of capturing information from the external device is also provided.
- the control unit 11 controls the transmission unit 12, the reception unit 13, the display unit 14, and the signal processing unit 15 based on the operating conditions of the ultrasonic imaging apparatus set by the input unit 10. Processing Unit).
- the transmission unit 12 includes an oscillator that generates a signal having a predetermined frequency, and sends a drive signal to the ultrasonic probe 2.
- the receiving unit 13 includes a receiving circuit and an A / D (Analog-to-Digital) converter whose sampling frequency is usually 10 MHz to 50 MHz, and in addition, an echo received by the ultrasound probe 2.
- Signal processing such as phasing addition, detection, and amplification is performed on the signal.
- This processing includes a filter (hereinafter referred to as a wall filter) that eliminates a low-speed velocity component provided in a general ultrasonic imaging apparatus.
- the A / D converter may be provided in front of the signal processing unit 15 instead of the reception unit 13, and in this case, the signal processing unit 15 performs signal processing such as phasing addition, detection, amplification, and wall filter.
- the reception unit 13 may include a reception data memory that temporarily stores an echo signal for each reception element of the ultrasound probe 2 or for each opening part in which the elements are bundled. .
- the signal processing unit 15 includes, as main elements, a tomographic image forming unit 151, a Doppler velocity extraction unit 152, a velocity distribution calculation unit 158, a velocity gradient distribution calculation unit 153, a range specification calculation unit 154, a wall surface velocity gradient calculation unit 155, a wall surface A shear stress calculation unit 156 and a display image forming unit 157 are provided as programs, and the CPU reads and executes the programs, thereby realizing functions to be described later.
- the tomographic image forming unit 151 uses a two-dimensional tissue tomographic image of the irradiation region to be examined, or a two-dimensional array probe or a mechanical probe from the echo signal output from the receiving unit 13. A tomographic image of a three-dimensional tissue is formed.
- the Doppler velocity extraction unit 152 extracts a blood flow velocity component (hereinafter referred to as “Doppler velocity”) in the ultrasonic irradiation direction from the echo signal output from the reception unit 13. At that time, the Doppler velocity is obtained as a two-dimensional spatial distribution by using a planar imaging method or as a three-dimensional spatial distribution by using a stereoscopic imaging method.
- the velocity distribution calculation unit 158 performs blood flow velocity in the direction along the wall surface of the blood vessel 30 with respect to the Doppler velocity output from the Doppler velocity extraction unit 152 (hereinafter, unless otherwise indicated, the blood flow velocity is the wall surface of the blood vessel 30.
- the blood flow velocity distribution in a direction along the blood vessel 30 is calculated, and blood flow velocity distributions at a plurality of measurement points arranged in the radial direction from the wall surface of the blood vessel 30 to the blood vessel center are calculated.
- the velocity gradient distribution calculation unit 153 calculates a blood flow velocity gradient distribution by differential calculation from the blood flow velocity distribution calculated by the velocity distribution calculation unit 158.
- the range specifying calculation unit 154 calculates a predetermined range for the blood flow velocity gradient distribution output from the velocity gradient distribution calculation unit 153.
- the wall surface velocity gradient calculation unit 155 uses the blood flow velocity distribution at the measurement points within the predetermined range calculated by the range specifying calculation unit 154 and the value of the blood flow velocity gradient distribution to calculate the blood flow velocity gradient (hereinafter, Wall surface velocity gradient).
- the wall shear stress calculation unit 156 constitutes a diagnostic index calculation unit that calculates information serving as a diagnostic index to be inspected. For example, a predetermined value, a value input from the input unit 10, or a value calculated from an echo signal is used for the wall surface velocity gradient value calculated by the wall surface velocity gradient calculation unit 155.
- the wall shear stress acting on the blood vessel wall surface is calculated by multiplying the viscosity coefficient of blood given as follows.
- the display image forming unit 157 includes a scan converter and forms a display image displayed on the display unit 14.
- Display images to be formed include a tomographic image formed by the tomographic image forming unit 151, a Doppler velocity extracted by the Doppler velocity extracting unit 152, a blood flow velocity distribution calculated by the velocity distribution calculating unit 158, and a velocity gradient distribution calculating unit 153.
- Information such as blood flow velocity gradient distribution calculated in step 1, predetermined range calculated in range specifying calculation unit 154, wall velocity gradient calculated in wall velocity gradient calculation unit 155, wall shear stress calculated in wall shear stress calculation unit 156, and the like. is there.
- the functions of some or all of the constituent elements of the signal processing unit 15 are realized by software executed by the same CPU as that constituting the control unit 11 or by a different CPU, as well as by ASIC (Application Specific Integrated Circuit) It may be realized by hardware such as FPGA (Field-Programmable Gate Array) or GPU (Graphics Processing Unit).
- FPGA Field-Programmable Gate Array
- GPU Graphics Processing Unit
- the memory 16 stores an echo signal, information necessary for calculation in the signal processing unit 15 (information instructed by the examiner through the input unit 10), and processing results of the signal processing unit 15 (tomographic image, Doppler velocity, blood flow velocity distribution). , Blood flow velocity gradient distribution, predetermined range in blood flow velocity gradient distribution, wall surface velocity gradient, wall surface shear stress, display image, etc.) are stored.
- the Doppler velocity extraction unit 152 After receiving the echo signal output from the reception unit 13, the Doppler velocity extraction unit 152 applies a wall filter to extract blood flow information, and extracts the Doppler velocity from the echo signal using a color Doppler method. At that time, a blood flow velocity measuring method such as a pulse wave Doppler method may be used. Further, for example, various filters such as a low-pass filter, a band-pass filter, and a smoothing filter may be applied to the extracted spatial distribution and temporal change of the Doppler velocity to obtain a desired distribution and temporal change.
- a blood flow velocity measuring method such as a pulse wave Doppler method
- filters such as a low-pass filter, a band-pass filter, and a smoothing filter may be applied to the extracted spatial distribution and temporal change of the Doppler velocity to obtain a desired distribution and temporal change.
- the velocity distribution calculation unit 158 calculates the blood flow velocity in the direction along the wall surface of the blood vessel 30. At that time, first, a velocity vector of blood flow is calculated using a vector Doppler method for calculating a velocity vector from Doppler velocity obtained at two or more angles, and then the direction of the velocity vector along the wall surface of the blood vessel 30 is calculated. Find the velocity component of.
- the method for obtaining the blood flow velocity in the direction along the blood vessel wall is not limited to the vector Doppler method.
- the blood flow velocity is estimated by considering the ultrasonic irradiation angle or the blood flow direction in the extracted Doppler velocity. May be.
- the blood flow velocity distribution at a plurality of measurement points arranged in the radial direction from the wall surface of the blood vessel 30 to the blood vessel center is calculated from the calculated blood flow velocity.
- the radial direction of the blood vessel 30 may be automatically calculated from a tomographic image such as a B-mode image formed by the tomographic image forming unit 151 and stored in the memory 16, May be.
- the velocity gradient distribution calculator 153 calculates the blood flow velocity gradient distribution by differential calculation. At this time, a desired distribution may be obtained by applying various filters such as a low-pass filter, a band-pass filter, and a smoothing filter to the calculated blood flow velocity gradient distribution.
- Step S4> After receiving the blood flow velocity gradient distribution calculated by the velocity gradient distribution calculation unit 153, the range specifying calculation unit 154 first calculates at least one of an extreme value and an inflection point of the blood flow velocity gradient distribution. The basis for determining the region where the blood flow velocity gradient distribution is rejected using at least one of the coordinates of the extreme value and the inflection point of the blood flow velocity gradient distribution will be described with reference to FIG.
- FIG. 3A is a distribution diagram showing measured values of blood flow velocity at a plurality of measurement points arranged in the radial direction (y direction) from the blood vessel wall surface to the blood vessel center, and FIG. It represents the blood flow velocity gradient distribution calculated by differentiating the blood flow velocity distribution of (a).
- the dotted line in the figure represents the position of the blood vessel wall surface, and the alternate long and short dash line represents the blood vessel center.
- the distribution diagrams of FIGS. 3A and 3B are affected by the wall filter.
- FIG. 3C shows an example of an approximate model of blood flow velocity distribution
- FIG. 3D shows an example of an approximate model of blood flow velocity gradient distribution.
- u represents the blood flow velocity
- R represents the blood vessel radius
- x represents the distance in the flow direction
- r represents the distance in the radial direction from the blood vessel center.
- Dp is a change amount of the pressure p in two minute sections dx in the flow direction
- ⁇ is a viscosity coefficient of blood.
- the blood flow velocity gradient distribution can be calculated as a spatial differential of the blood flow velocity distribution
- the blood flow velocity gradient distribution of the circular tube is expressed by a linear line from the equation shown in Equation (2).
- the blood flow velocity distribution near the blood vessel wall surface is approximated by a quadratic curve, and the blood flow velocity gradient distribution near the blood vessel wall surface is approximated by a linear straight line.
- the velocity gradient distribution is modeled as convex downward and slowly converges to zero.
- the approximation model of the blood flow velocity distribution is not limited to the quadratic curve, and can be approximated by other functions such as a polynomial function and an exponential function.
- the wall filter is a filter for excluding movement of surrounding tissues such as vascular membranes and muscles, which is slower than blood flow. Therefore, due to the characteristics, the blood flow velocity signal near the blood vessel wall surface that has become low speed due to the frictional force received from the blood vessel wall surface is weakened, and as a result, the blood flow velocity is measured too low. Therefore, the blood flow velocity gradient distribution obtained by differentiating the blood flow velocity distribution after applying the wall filter is monotonically increased from monotonically decreasing toward the blood vessel wall surface as shown in FIG. 3B. And the blood flow velocity gradient on the blood vessel wall surface tends to converge to zero.
- the blood flow velocity gradient distribution shown in FIG. 3 (b) at least from the point where monotonous increase to monotonic decrease from the blood vessel wall surface toward the blood vessel center (hereinafter referred to as extreme value a) to the blood vessel wall surface.
- extreme value a the blood flow velocity and the blood flow velocity gradient are underestimated.
- the blood flow velocity gradient distribution is an approximation model shown in FIG. It becomes an index that shows that the shape is suitable. Therefore, the extreme value a and the inflection point b of the blood flow velocity gradient distribution are not detected in the region where the blood flow velocity is underestimated due to the influence of the wall filter under various blood flow conditions, that is, the surrounding tissues and the like are not detected.
- the range specifying calculation unit 154 determines a region where the blood flow velocity gradient distribution is rejected based on at least one of the extreme value a and the inflection point b, and excludes the rejection region from the blood flow velocity gradient distribution.
- a range that is, a predetermined range using a distribution value for estimating the blood flow velocity gradient in the wall surface of the blood vessel 30 is calculated.
- the extreme value a is a predetermined range boundary, a value on the distribution of measurement points close to the wall surface can be used for estimation of the wall surface velocity gradient.
- the inflection point b to the blood vessel wall surface may be regarded as an underestimated region due to the influence of the wall filter, and the inflection point b may be set as a boundary of a predetermined range. Further, a point different from these coordinates set by the examiner on the basis of these coordinates may be set as the boundary of the predetermined range.
- the calculated range may be defined from the focused blood vessel wall surface to the blood vessel center, or may be defined from the blood vessel wall surface to the opposite blood vessel wall surface through the blood vessel center.
- the wall surface velocity gradient calculation unit 155 includes a blood flow velocity distribution calculated from the velocity distribution calculation unit 158, a blood flow velocity gradient distribution calculated from the velocity gradient distribution calculation unit 153, and a predetermined range calculated from the range specifying calculation unit 154. First, a measurement point used for calculating the wall velocity gradient is selected from a predetermined range.
- the measurement point to be selected may be one point or a plurality of points according to a method of wall surface velocity gradient calculation described later.
- two measurement points, the extreme value a and the inflection point b may be selected for the following reason.
- the extreme value a the values of the blood flow velocity and blood flow velocity gradient at the measurement point closest to the wall surface within a predetermined range can be used, and further, by selecting the inflection point b, blood
- the wall surface velocity gradient calculation unit 155 calculates the estimated value of the wall surface velocity gradient using the blood flow velocity and the blood flow velocity gradient value at the selected measurement point.
- the extreme value a is one of the boundaries
- the other boundary is the blood vessel center
- the range from the extreme value a to the blood vessel center is a predetermined range.
- the inside of the predetermined range includes the boundary.
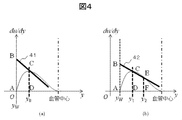
- FIG. 4A shows the case where the number of measurement points is one
- FIG. 1 and FIG. 2 show the case where the blood flow velocity gradient distribution from the selected measurement point to the blood vessel wall surface is approximated by the primary straight line 41.
- a tomographic image such as a B-mode image formed by the tomographic image forming unit 151 and stored in the memory 16
- u 0 represents the blood flow velocity at the measurement point y 0 and du / dy represents the blood flow velocity gradient.
- an approximate model (primary straight line) is applied to the blood flow velocity gradient distribution in the vicinity of the blood vessel wall surface, and the blood flow at the measurement point where the definite integral of the blood flow velocity gradient distribution from the blood vessel wall surface to the selected measurement point is selected. Based on the relationship equal to the velocity, the estimated value of the wall velocity gradient can be calculated from the blood flow velocity and the blood velocity gradient at the selected measurement point.
- FIG. 4B shows the case where there are two measurement points, and the blood flow velocity gradient distribution from each measurement point to the blood vessel wall surface is approximated by a primary line 42. At that time, the position of the blood vessel wall surface is not necessarily specified.
- the relationship between the blood flow velocity and the blood flow velocity gradient at the measurement points y 1 and y 2 , where the coordinate y w of the blood vessel wall surface is an unknown, is described by equation (5) from trapezoid ABCD and trapezoid ABEF.
- ⁇ Step S8> After receiving the value of the wall surface velocity gradient from the wall surface velocity gradient calculating unit 155, the wall surface shear stress calculating unit 156 calculates the wall surface shear stress.
- the wall shear stress ⁇ is given by Equation (6).
- ⁇ is the viscosity coefficient of blood.
- the display image forming unit 157 receives the tomographic image of the blood vessel 30 from the tomographic image forming unit, the Doppler velocity extracting unit 152 from the Doppler velocity, and the velocity distribution calculating unit 158 from the blood flow velocity distribution and velocity gradient distribution in the direction along the wall surface of the blood vessel 30.
- All or part of the information is formed as a display image in accordance with a predetermined format or an instruction input from the input unit 10.
- the display unit 14 displays the blood flow velocity distribution calculated by the velocity distribution calculation unit 158 and the blood flow velocity gradient distribution calculated by the velocity gradient distribution calculation unit 153, and the range specifying calculation unit 154 displays the blood flow velocity distribution.
- the calculated predetermined range may be displayed superimposed on the blood flow velocity distribution or the blood flow velocity gradient distribution.
- the blood flow velocity distribution or the blood flow velocity gradient distribution in the direction along the blood vessel wall surface is colored within or outside the predetermined ranges 51 and 52.
- a display image that simply displays the coordinates of the boundaries of the predetermined ranges 51 and 52 as numerical values is formed.
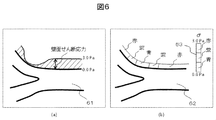
- the wall velocity gradient or wall shear stress spatial distribution information calculated for a plurality of points is presented to the examiner as perceptual information together with the tomographic images 61 and 62 of the blood vessel. . That is, the tomographic image of the blood vessel to be inspected formed by the tomographic image forming unit 151 and the information serving as the diagnostic index of the inspection object such as the wall surface velocity gradient or the spatial distribution information of the wall shear stress are superimposed and displayed as a spatial distribution diagram. .
- the perceptual information may be displayed by the width of the wall shear stress as shown in FIG. 6A, or the wall shear using the color bar 63 as shown in FIG. 6B.
- the magnitude of the stress may be displayed in different colors.
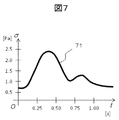
- wall speed gradient or wall shear stress time-series change information 71 may be presented to the examiner.
- the horizontal axis represents time (s), and the vertical axis represents wall shear stress (Pa).
- displaying time-series change information together with the heartbeat signal helps the examiner understand the correlation between the time-series change in wall shear stress and pulsation. That is, an instruction is given to input heartbeat signal information to be examined from the input unit 10, and the display unit 14 displays information such as wall shear stress that is a diagnostic index of the examination target along with the input heartbeat signal information in a time series change. To do.
- at least one of the statistical values of the spatial distribution information of the wall shear stress and the time series change information for example, the maximum value, the minimum value, the average value, the median value, etc. may be presented to the examiner.
- Example 1 although the structure provided with the wall surface shear stress calculating part which calculates a wall surface shear stress using the estimated value of a wall surface velocity gradient as a diagnostic index calculating part which calculates the information used as the diagnostic index of a test object was demonstrated.
- the wall velocity gradient is also used for calculation of the vascular elasticity measurement method based on the pressure difference.
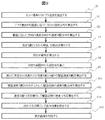
- Example 2 an example of an ultrasonic imaging apparatus having a vascular elasticity calculation unit as a diagnostic index calculation unit for calculating information serving as a diagnostic index of a test object is mainly focused on differences from the ultrasonic imaging apparatus of Example 1. explain. Since the calculation processing flow is different after step S8, FIG. 8 shows a flowchart in which steps S10 and S11 are inserted instead of steps S8 and S9 in FIG.
- Step S10> the wall surface shear stress calculation unit 156 received the output of the wall surface velocity gradient calculation unit 155 and calculated the wall surface shear stress.
- a vascular elasticity calculation unit is provided instead of the wall surface shear stress calculation unit 156, and the vascular elasticity calculation unit receives the output of the wall surface velocity gradient calculation unit 155 of FIG. 1 and calculates the vascular elasticity. To do.
- the calculated vascular elasticity is stored in the memory 16.
- the vascular elasticity E is given by equation (7).
- the display image forming unit 157 receives the tomographic image of the blood vessel 30 from the tomographic image forming unit 151, the Doppler velocity from the Doppler velocity extracting unit 152, and the blood flow in the direction along the wall surface of the blood vessel 30 from the velocity distribution calculating unit 158.
- Example 3 is an example of an ultrasonic imaging apparatus having a blood flow rate calculation unit as a diagnostic index calculation unit for calculating information serving as a diagnostic index to be examined.
- the configuration of the third embodiment will be described focusing on differences from the ultrasonic imaging apparatus of the first embodiment.
- a flow rate calculation unit is provided instead of the wall surface shear stress calculation unit 156 of the apparatus configuration shown in FIG.
- the flow rate calculation unit receives the output of the wall surface velocity gradient calculation unit 155 and calculates the blood flow rate. Specifically, using the value of the wall surface velocity gradient calculated by the wall surface velocity gradient calculating unit 155, the flow rate calculating unit calculates the blood flow velocity distribution in the range from the blood vessel wall surface to the measurement point y1 using the above approximate model (secondary curve). ), And the blood flow rate is calculated by integrating the flow velocity distribution after the replacement.
- FIG. 9 shows a flowchart in which steps S12, S13, S14, and S15 are inserted instead of steps S8 and S9 in FIG.
- a flow rate calculation unit (not shown) calculates the blood flow rate after receiving the numerical value of the wall surface velocity gradient.
- Equation (9) an approximate model of blood flow velocity distribution is given by Equation (9).
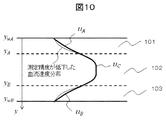
- FIG. 10 is a diagram for explaining the integration range of blood flow calculation in the configuration of the third embodiment, where 101 and 103 are areas where the modeled blood flow velocity distribution is integrated, and 102 is the measured blood flow velocity distribution. Indicates the region to be integrated.
- u A is an approximate model of the blood flow velocity distribution in the vicinity of the blood vessel wall surface A in the region 101 where the modeled blood flow velocity distribution is integrated, and blood vessels in the region 103 where the modeled blood flow velocity distribution is integrated.
- the blood flow rate is obtained by the following equation. .
- the display image forming unit 157 includes the tomographic image of the blood vessel 30 from the tomographic image forming unit 151, the Doppler velocity from the Doppler velocity extracting unit 152, and the blood flow in the direction along the wall surface of the blood vessel 30 from the velocity distribution calculating unit 158.
- the ultrasonic imaging apparatus of the present invention is not limited to the above-described embodiment, and elements can be added or deleted as appropriate.
- each embodiment was provided with a wall surface shear stress calculation unit, a vascular elasticity calculation unit, or a blood flow rate calculation unit as a diagnostic index calculation unit for calculating information serving as a diagnostic index of a test object.
- a configuration including a combination of three it is possible to have a configuration including a combination of three.
- Example 1 demonstrated the early diagnosis of arteriosclerosis as an example, this does not limit the application object of this invention to an artery, It applies also to the blood-flow velocity gradient measurement in veins, such as a leg vein. Is possible.
- the lower limb vein is a site where thrombi and varicose veins are likely to occur, and the present invention may also be applied to these diagnoses.
Abstract
The purpose of the present invention is to provide a technology which estimates with high precision a blood flow velocity gradient in the vicinity of a blood vessel wall surface under a variety of blood flow conditions. Provided are an ultrasound image capture device and computation method thereof which, from an echo signal which an examination subject reflects, compute an estimated value of a blood flow velocity gradient in a wall surface within a blood vessel of the examination subject. With said ultrasound image capture device and computation method thereof: a blood flow velocity gradient distribution is computed from a blood flow velocity which is computed from an echo signal and at a plurality of measurement points which are taken in the radial direction from the blood vessel wall surface to the blood vessel center and which is in a direction in line with a blood vessel wall surface; a prescribed range is computed with respect to the computed blood flow velocity gradient distribution; and an estimated value of a blood flow velocity gradient in the blood vessel wall surface is computed from the blood flow velocity and the blood flow velocity gradient at the measurement points within the computed prescribed range.
Description
本発明は、医療用の超音波撮像装置に関し、血管壁面近傍における血流速度勾配を求める技術に関する。
The present invention relates to a medical ultrasonic imaging apparatus and relates to a technique for obtaining a blood flow velocity gradient in the vicinity of a blood vessel wall surface.
先進国における主要な死因の一つは、心不全などの心血管疾患であり、その多くに動脈硬化が関わる。動脈硬化は、血管壁面に対する血流からの刺激の大小により進行速度が変わることが指摘されている。そのため、血管壁面に作用する壁面せん断応力は、動脈硬化早期の診断指標として注目されている。
One of the leading causes of death in developed countries is cardiovascular disease such as heart failure, and many of them are related to arteriosclerosis. It has been pointed out that the progression rate of arteriosclerosis changes depending on the magnitude of stimulation from the blood flow to the blood vessel wall surface. For this reason, wall shear stress acting on the blood vessel wall surface has attracted attention as a diagnostic index for early arteriosclerosis.
壁面せん断応力を算出する方法の一つに、超音波撮像装置を用いて、超音波ドプラ法により測定した血流速度分布に基づいて算出する方法がある。この方法では、血流速度分布の空間微分である血流速度勾配を、血管壁面近傍で高精度に求めることが要求される。
One method for calculating the wall shear stress is to use an ultrasonic imaging device to calculate based on the blood flow velocity distribution measured by the ultrasonic Doppler method. This method requires that a blood flow velocity gradient, which is a spatial differential of the blood flow velocity distribution, be obtained with high accuracy near the blood vessel wall surface.
超音波ドプラ法では、ドプラ効果を用いてエコー信号から反射体の移動速度情報が得られるが、反射体には血流中の赤血球だけでなく、血管膜や筋肉などの周辺組織も含まれる。血管壁面近傍における血流は、血管壁面との摩擦により周辺組織の動きと同程度に低速となるため、血流のエコー信号が周辺組織等の検出対象外の信号に埋もれてしまい、血管壁面近傍における血流速度の測定精度は低下する。このことから、超音波撮像装置で測定した血流速度分布を単純に微分することでは、血管壁面近傍で血流速度勾配が高精度に得られず、臨床的に動脈硬化の早期診断が可能な精度は実現されていない。
In the ultrasonic Doppler method, the moving speed information of the reflector can be obtained from the echo signal using the Doppler effect, but the reflector includes not only erythrocytes in the bloodstream but also surrounding tissues such as vascular membranes and muscles. The blood flow in the vicinity of the blood vessel wall becomes slow as much as the movement of the surrounding tissue due to friction with the blood vessel wall surface, so the echo signal of the blood flow is buried in a signal outside the detection target such as the surrounding tissue, The measurement accuracy of blood flow velocity is reduced. Therefore, simply differentiating the blood flow velocity distribution measured by the ultrasonic imaging device does not provide a high blood flow velocity gradient in the vicinity of the blood vessel wall surface, and clinical diagnosis of arteriosclerosis is possible clinically. Accuracy is not realized.
血流速度勾配の測定精度向上を目的とした超音波撮像方法には、非特許文献1に記載の技術がある。この文献には、「II. MATERIALS AND METHODS」の「B. Velocity reconstruction and WSR measurement」中に、「In the first step the two regions that extend for about 5-10% of the diameter from the wall positions towards the vessel lumen are located. The profile measured in these regions is substituted by a line that starts at the wall with velocity 0 and ramps up to join the remaining -measured- profile.」という記載がある。この方法では、血管壁面から血管径の5-10%離れた領域までの血流速度分布を棄却し、棄却した領域に対して補間を行った後、血管壁面近傍の血流速度勾配を推定している。
There is a technique described in Non-Patent Document 1 as an ultrasonic imaging method for the purpose of improving blood flow velocity gradient measurement accuracy. This document includes "In.the first step the two regions that extend for about 5-10% of the diameter from the wall positions towards thewards" B. Velocity reconstruction and WSR measurement "in" II. MATERIALS AND METHODS " vessel lumen are located. The profile measured in these regions is substituted by a line that starts at the wall with velocity 0 and ramps up to join the remaining -measured- profile. In this method, the blood flow velocity distribution from the blood vessel wall to the region 5-10% away from the blood vessel diameter is rejected, interpolation is performed for the rejected region, and then the blood flow velocity gradient near the blood vessel wall is estimated. ing.
非特許文献1では、血管径を基準として血流の測定値を棄却する領域を決定する方法を適用しており、頸動脈をモデルとしたシミュレーションで検証している。しかし、実測した血流速度分布は、検査対象の血管の形状や柔軟性、血管内皮の性状、拍動などにより様々に異なるため、血管径のみを基準として棄却領域を決定する方法では、血流条件次第で、検出対象外の信号に埋もれた血流速度の測定値が十分に棄却されない場合が生じる。その結果、血管壁面近傍の血流速度勾配の推定に信頼性の低い血流速度の測定値を用いる可能性がある。
In Non-Patent Document 1, a method of determining a region in which a blood flow measurement value is rejected based on a blood vessel diameter is applied, and verification is performed by a simulation using a carotid artery as a model. However, since the measured blood flow velocity distribution varies depending on the shape and flexibility of the blood vessel to be examined, the properties of the vascular endothelium, pulsation, etc., the method of determining the rejection region based only on the blood vessel diameter Depending on the conditions, there may be a case where the measurement value of the blood flow velocity buried in the signal outside the detection target is not sufficiently rejected. As a result, there is a possibility that the blood flow velocity measurement value with low reliability is used for estimating the blood flow velocity gradient in the vicinity of the blood vessel wall surface.
本発明は、血管の形状、柔軟性、血管内皮の性状、拍動などが異なる様々な血流条件下においても、血管壁面近傍の血流速度勾配を高精度に推定する超音波撮像装置およびその演算方法を提供することを目的とする。
The present invention relates to an ultrasonic imaging apparatus for accurately estimating a blood flow velocity gradient in the vicinity of a blood vessel wall surface even under various blood flow conditions with different blood vessel shapes, flexibility, vascular endothelium properties, pulsations, and the like. An object is to provide a calculation method.
上記課題を解決するため、本発明においては、検査対象が反射するエコー信号を受信する受信部と、前記受信部により受信された前記エコー信号を処理する信号処理部と、を備え、前記信号処理部は、前記検査対象の血管壁面から血管中心へ径方向に並んだ複数の測定点における、前記エコー信号から算出される前記血管壁面に沿った方向の血流速度の値から、血流速度勾配分布を算出する速度勾配分布演算部と、前記血流速度勾配分布において所定の範囲を算出する範囲特定演算部と、前記所定の範囲内の測定点における血流速度および血流速度勾配の値から、血管壁面における血流速度勾配の推定値を算出する壁面速度勾配演算部と、を備えることを特徴とする超音波撮像装置を提供する。
In order to solve the above-described problem, the present invention includes a receiving unit that receives an echo signal reflected by an inspection target, and a signal processing unit that processes the echo signal received by the receiving unit, and the signal processing The blood flow velocity gradient from the value of the blood flow velocity in the direction along the blood vessel wall surface calculated from the echo signal at a plurality of measurement points arranged in the radial direction from the blood vessel wall surface to be examined to the blood vessel center. A velocity gradient distribution calculation unit for calculating a distribution, a range specifying calculation unit for calculating a predetermined range in the blood flow velocity gradient distribution, and blood flow velocity and blood flow velocity gradient values at measurement points in the predetermined range An ultrasonic imaging apparatus comprising: a wall surface velocity gradient calculation unit that calculates an estimated value of a blood flow velocity gradient on a blood vessel wall surface.
また、上記課題を解決するため、本発明においては、超音波撮像装置における演算方法であって、検査対象が反射するエコー信号から前記検査対象の血管内における超音波照射方向の血流速度成分を抽出する工程と、前記血流速度成分に基づいて、前記血管壁面から前記血管中心へ径方向に並んだ複数の測定点における、血管壁面に沿った方向の血流速度分布を算出する工程と、微分演算により前記血流速度分布から血流速度勾配分布を算出する工程と、前記血流速度勾配分布において所定の範囲を算出する工程と、前記所定の範囲内の測定点から1点以上の測定点を選択する工程と、選択された測定点における血流速度および血流速度勾配の値から前記血管壁面における血流速度勾配の推定値を算出する工程と、を備えることを特徴とする演算方法を提供する。
Further, in order to solve the above-mentioned problem, in the present invention, there is provided a calculation method in an ultrasonic imaging apparatus, wherein a blood flow velocity component in an ultrasonic irradiation direction in a blood vessel of the inspection target is calculated from an echo signal reflected by the inspection target. Extracting, based on the blood flow velocity component, calculating a blood flow velocity distribution in a direction along the blood vessel wall surface at a plurality of measurement points arranged in a radial direction from the blood vessel wall surface to the blood vessel center; A step of calculating a blood flow velocity gradient distribution from the blood flow velocity distribution by differential calculation, a step of calculating a predetermined range in the blood flow velocity gradient distribution, and one or more measurements from the measurement points within the predetermined range A step of selecting a point, and a step of calculating an estimated value of a blood flow velocity gradient on the blood vessel wall surface from a blood flow velocity and a blood flow velocity gradient value at the selected measurement point. Provide a calculation method.
本発明によれば、様々な血流条件下において、血管壁面近傍の血流速度勾配を高精度に推定することができる。
According to the present invention, the blood flow velocity gradient near the blood vessel wall surface can be estimated with high accuracy under various blood flow conditions.
以下、本発明の実施例を図面に従い説明する。
Hereinafter, embodiments of the present invention will be described with reference to the drawings.
図1は、実施例1の壁面せん断応力測定機能を有する超音波撮像装置の構成例を示すブロック図である。壁面せん断応力は、血管内皮細胞に変化をもたらす血流刺激で、動脈硬化の早期診断における診断指標として臨床研究で注目されているパラメータである。また、壁面せん断応力の大きさは、進行した動脈硬化で発生するプラークの破綻に影響しており、プラーク破綻のリスク予測とも関係が深い。
FIG. 1 is a block diagram illustrating a configuration example of an ultrasonic imaging apparatus having a wall shear stress measurement function according to the first embodiment. Wall shear stress is a blood flow stimulus that causes changes in vascular endothelial cells, and is a parameter that is attracting attention in clinical research as a diagnostic indicator in early diagnosis of arteriosclerosis. In addition, the magnitude of the wall shear stress has an effect on plaque failure caused by advanced arteriosclerosis and is closely related to the risk prediction of plaque failure.
装置本体1は超音波探触子2を制御しながら超音波画像を生成するものであり、入力部10、制御部11、超音波信号を発信する発信部12、エコー信号を受信する受信部13、表示部14、信号処理部15、およびメモリ16を備えている。
The apparatus main body 1 generates an ultrasonic image while controlling the ultrasonic probe 2, and includes an input unit 10, a control unit 11, a transmission unit 12 that transmits an ultrasonic signal, and a reception unit 13 that receives an echo signal. , A display unit 14, a signal processing unit 15, and a memory 16.
超音波探触子2は、被検者の生体3に接し、発信部12で生成された信号に従い、生体3内の血管30に対し超音波を照射し、受信部13は血管30のエコー信号を受信する。超音波探触子2は、スキャン方式に応じて連続波あるいはパルス波を発生する。また超音波探触子2の走査方法により、2次元的な断面を撮像する平面的撮像法、或いは3次元的な領域を撮像する立体的撮像法を適宜選択してよい。
The ultrasound probe 2 is in contact with the living body 3 of the subject, irradiates the blood vessel 30 in the living body 3 according to the signal generated by the transmitting unit 12, and the receiving unit 13 echoes the blood vessel 30. Receive. The ultrasonic probe 2 generates a continuous wave or a pulse wave according to the scanning method. Further, a two-dimensional imaging method for imaging a two-dimensional section or a three-dimensional imaging method for imaging a three-dimensional region may be appropriately selected depending on the scanning method of the ultrasonic probe 2.
装置本体1の各構成要素の機能を説明する。入力部10は、超音波撮像装置を操作する医師や技師(以下、まとめて検者という)が制御部11に対し超音波撮像装置の動作条件を設定するキーボードやポインティングデバイスを備える。また検査に心電図等の外部機器からの情報を利用する場合、外部機器からの情報を取り込む機能も備える。
The function of each component of the device body 1 will be described. The input unit 10 includes a keyboard and a pointing device in which a doctor or an engineer (hereinafter collectively referred to as an examiner) who operates the ultrasonic imaging apparatus sets operating conditions of the ultrasonic imaging apparatus with respect to the control unit 11. In addition, when information from an external device such as an electrocardiogram is used for the examination, a function of capturing information from the external device is also provided.
制御部11は、入力部10によって設定された超音波撮像装置の動作条件に基づき発信部12、受信部13、表示部14および信号処理部15を制御するもので、例えばコンピュータシステムのCPU(Central Processing Unit)に構築することができる。
The control unit 11 controls the transmission unit 12, the reception unit 13, the display unit 14, and the signal processing unit 15 based on the operating conditions of the ultrasonic imaging apparatus set by the input unit 10. Processing Unit).
発信部12は、所定の周波数の信号を発生する発振器を備え、超音波探触子2に駆動信号を送る。受信部13は、図示していないが、受信回路やサンプリング周波数が通常10MHzから50MHzのA/D(Analog-to-Digital )コンバーターを含み、そのほかに、超音波探触子2によって受信されたエコー信号に対し整相加算、検波、増幅などの信号処理を行う。この処理には、一般的な超音波撮像装置が備えている低速の速度成分を排除するフィルタ(以下、ウォールフィルタという)を含む。ただし、A/Dコンバーターは受信部13の代わりに信号処理部15の前段に備えてもよく、その場合は整相加算、検波、増幅、ウォールフィルタなどの信号処理を信号処理部15が行う。また、受信部13は、図示していないが、超音波探触子2の受信素子毎、あるいは素子を束ねた開口部ごとのエコー信号を一時的に保存する受信データメモリを有してもよい。
The transmission unit 12 includes an oscillator that generates a signal having a predetermined frequency, and sends a drive signal to the ultrasonic probe 2. Although not shown, the receiving unit 13 includes a receiving circuit and an A / D (Analog-to-Digital) converter whose sampling frequency is usually 10 MHz to 50 MHz, and in addition, an echo received by the ultrasound probe 2. Signal processing such as phasing addition, detection, and amplification is performed on the signal. This processing includes a filter (hereinafter referred to as a wall filter) that eliminates a low-speed velocity component provided in a general ultrasonic imaging apparatus. However, the A / D converter may be provided in front of the signal processing unit 15 instead of the reception unit 13, and in this case, the signal processing unit 15 performs signal processing such as phasing addition, detection, amplification, and wall filter. Although not shown, the reception unit 13 may include a reception data memory that temporarily stores an echo signal for each reception element of the ultrasound probe 2 or for each opening part in which the elements are bundled. .
次に、信号処理部15の詳細な構成要素を説明する。ここでは、CPUが実行するソフトウェアにより実現する場合を例に説明する。信号処理部15は、主要な要素として、断層画像形成部151、ドプラ速度抽出部152、速度分布演算部158、速度勾配分布演算部153、範囲特定演算部154、壁面速度勾配演算部155、壁面せん断応力演算部156、表示画像形成部157をプログラムとして有し、CPUがプログラムを読み込んで実行することにより、後述する機能を実現する。
Next, detailed components of the signal processing unit 15 will be described. Here, the case where it implement | achieves by the software which CPU runs is demonstrated to an example. The signal processing unit 15 includes, as main elements, a tomographic image forming unit 151, a Doppler velocity extraction unit 152, a velocity distribution calculation unit 158, a velocity gradient distribution calculation unit 153, a range specification calculation unit 154, a wall surface velocity gradient calculation unit 155, a wall surface A shear stress calculation unit 156 and a display image forming unit 157 are provided as programs, and the CPU reads and executes the programs, thereby realizing functions to be described later.
断層画像形成部151は、受信部13から出力されるエコー信号から、検査対象の照射領域の2次元的な組織の断層画像、あるいは2次元アレイ探触子やメカニカル探触子を用いることにより、3次元的な組織の断層画像を形成する。ドプラ速度抽出部152は、受信部13から出力されるエコー信号から超音波照射方向の血流速度成分(以下、ドプラ速度という)を抽出する。その際、ドプラ速度は、平面的撮像法を用いることで2次元的な空間分布として、あるいは立体的撮像法を用いることで3次元的な空間分布として得る。
The tomographic image forming unit 151 uses a two-dimensional tissue tomographic image of the irradiation region to be examined, or a two-dimensional array probe or a mechanical probe from the echo signal output from the receiving unit 13. A tomographic image of a three-dimensional tissue is formed. The Doppler velocity extraction unit 152 extracts a blood flow velocity component (hereinafter referred to as “Doppler velocity”) in the ultrasonic irradiation direction from the echo signal output from the reception unit 13. At that time, the Doppler velocity is obtained as a two-dimensional spatial distribution by using a planar imaging method or as a three-dimensional spatial distribution by using a stereoscopic imaging method.
速度分布演算部158は、ドプラ速度抽出部152の出力したドプラ速度に対し、血管30の壁面に沿った方向の血流速度(以下、特に方向を示さない場合、血流速度は血管30の壁面に沿った方向の血流速度を指す)を算出し、血管30の壁面から血管中心へ径方向に並んだ複数の測定点における血流速度分布を算出する。
The velocity distribution calculation unit 158 performs blood flow velocity in the direction along the wall surface of the blood vessel 30 with respect to the Doppler velocity output from the Doppler velocity extraction unit 152 (hereinafter, unless otherwise indicated, the blood flow velocity is the wall surface of the blood vessel 30. The blood flow velocity distribution in a direction along the blood vessel 30 is calculated, and blood flow velocity distributions at a plurality of measurement points arranged in the radial direction from the wall surface of the blood vessel 30 to the blood vessel center are calculated.
速度勾配分布演算部153は、速度分布演算部158で算出された血流速度分布から微分演算により血流速度勾配分布を算出する。範囲特定演算部154は、速度勾配分布演算部153の出力した血流速度勾配分布に対し、所定の範囲を算出する。
The velocity gradient distribution calculation unit 153 calculates a blood flow velocity gradient distribution by differential calculation from the blood flow velocity distribution calculated by the velocity distribution calculation unit 158. The range specifying calculation unit 154 calculates a predetermined range for the blood flow velocity gradient distribution output from the velocity gradient distribution calculation unit 153.
壁面速度勾配演算部155は、範囲特定演算部154が算出した所定の範囲内の測定点における血流速度分布および血流速度勾配分布の値を用いて、血管壁面における血流速度勾配(以下、壁面速度勾配という)を算出する。
The wall surface velocity gradient calculation unit 155 uses the blood flow velocity distribution at the measurement points within the predetermined range calculated by the range specifying calculation unit 154 and the value of the blood flow velocity gradient distribution to calculate the blood flow velocity gradient (hereinafter, Wall surface velocity gradient).
壁面せん断応力演算部156は、検査対象の診断指標となる情報を算出する診断指標演算部を構成する。壁面せん断応力演算部156は、壁面速度勾配演算部155が算出した壁面速度勾配の値に対し、例えば予め決められた値や、入力部10から入力される値、もしくはエコー信号から算出される値として与えられる血液の粘性係数を乗じることで血管壁面に作用する壁面せん断応力を算出する。表示画像形成部157は、スキャンコンバーターを備え、表示部14に表示される表示画像を形成する。形成される表示画像としては、断層画像形成部151で形成した断層画像や、ドプラ速度抽出部152で抽出したドプラ速度、速度分布演算部158で算出した血流速度分布、速度勾配分布演算部153で算出した血流速度勾配分布、範囲特定演算部154で算出した所定の範囲、壁面速度勾配演算部155で算出した壁面速度勾配、壁面せん断応力演算部156で算出した壁面せん断応力などの情報である。
The wall shear stress calculation unit 156 constitutes a diagnostic index calculation unit that calculates information serving as a diagnostic index to be inspected. For example, a predetermined value, a value input from the input unit 10, or a value calculated from an echo signal is used for the wall surface velocity gradient value calculated by the wall surface velocity gradient calculation unit 155. The wall shear stress acting on the blood vessel wall surface is calculated by multiplying the viscosity coefficient of blood given as follows. The display image forming unit 157 includes a scan converter and forms a display image displayed on the display unit 14. Display images to be formed include a tomographic image formed by the tomographic image forming unit 151, a Doppler velocity extracted by the Doppler velocity extracting unit 152, a blood flow velocity distribution calculated by the velocity distribution calculating unit 158, and a velocity gradient distribution calculating unit 153. Information such as blood flow velocity gradient distribution calculated in step 1, predetermined range calculated in range specifying calculation unit 154, wall velocity gradient calculated in wall velocity gradient calculation unit 155, wall shear stress calculated in wall shear stress calculation unit 156, and the like. is there.
なお、信号処理部15の構成要素の一部又は全部の機能は、制御部11を構成するものと同一のCPU、あるいは異なるCPUで実行するソフトウェアで実現する他、ASIC (Application Specific Integrated Circuit )やFPGA(Field-Programmable Gate Array)、GPU(Graphics Processing Unit)等のハードウェアで実現してもよい。
The functions of some or all of the constituent elements of the signal processing unit 15 are realized by software executed by the same CPU as that constituting the control unit 11 or by a different CPU, as well as by ASIC (Application Specific Integrated Circuit) It may be realized by hardware such as FPGA (Field-Programmable Gate Array) or GPU (Graphics Processing Unit).
メモリ16は、エコー信号、信号処理部15での演算に必要な情報(検者が入力部10により指示した情報等)や信号処理部15の処理結果(断層画像、ドプラ速度、血流速度分布、血流速度勾配分布、血流速度勾配分布における所定の範囲、壁面速度勾配、壁面せん断応力、表示画像等)を記憶する。
The memory 16 stores an echo signal, information necessary for calculation in the signal processing unit 15 (information instructed by the examiner through the input unit 10), and processing results of the signal processing unit 15 (tomographic image, Doppler velocity, blood flow velocity distribution). , Blood flow velocity gradient distribution, predetermined range in blood flow velocity gradient distribution, wall surface velocity gradient, wall surface shear stress, display image, etc.) are stored.
以上説明した装置の構成を踏まえ、信号処理部15の動作の実施形態の一例を、図2に示す計算処理フローを参照して説明する。
〈ステップS1〉
ドプラ速度抽出部152は、受信部13が出力したエコー信号を受け取った後、血流情報を抽出するためウォールフィルタを適用し、カラードプラ法を用いてエコー信号からドプラ速度を抽出する。その際、パルス波ドプラ法などの血流速度測定方式を用いてもよい。また、抽出したドプラ速度の空間分布や時間変化に対して、例えばローパスフィルタや、バンドパスフィルタ、平滑化フィルタなどの様々なフィルタを適用し所望の分布や時間変化を得てもよい。
〈ステップS2〉
速度分布演算部158は、ドプラ速度成分抽出部により抽出されたドプラ速度を受け取った後、血管30の壁面に沿った方向の血流速度を算出する。その際、まず、二方向以上の角度で求めたドプラ速度から速度ベクトルを算出するベクトルドプラ法を用いて血流の速度ベクトルを算出し、続いて、速度ベクトルの血管30の壁面に沿った方向の速度成分を求める。なお、血管壁面に沿った方向の血流速度を求める方法は、ベクトルドプラ法に限らず、例えば、抽出されたドプラ速度に、超音波照射角度または血流の流れ方向を考慮することで推定してもよい。その後、算出された血流速度から、血管30の壁面から血管中心へ径方向に並んだ複数の測定点における血流速度分布を算出する。その際、血管30の径方向は、断層画像形成部151により形成されメモリ16に保存されたBモード画像などの断層画像より自動的に計算されてもよいし、検者が入力部10により指示してもよい。
〈ステップS3〉
速度勾配分布演算部153は、速度分布演算部158により算出された血流速度分布を受け取った後、微分演算により血流速度勾配分布を算出する。その際、算出した血流速度勾配分布に対して、例えばローパスフィルタや、バンドパスフィルタ、平滑化フィルタなどの様々なフィルタを適用し所望の分布を得てもよい。
〈ステップS4〉
範囲特定演算部154は、速度勾配分布演算部153により算出された血流速度勾配分布を受け取った後、まず血流速度勾配分布の極値および変曲点の少なくともいずれかを算出する。この血流速度勾配分布の極値および変曲点の少なくともいずれかの座標を用いて血流速度勾配分布の棄却する領域を決定する根拠について、図3を用いて説明する。 Based on the configuration of the apparatus described above, an example of an embodiment of the operation of thesignal processing unit 15 will be described with reference to the calculation processing flow shown in FIG.
<Step S1>
After receiving the echo signal output from thereception unit 13, the Doppler velocity extraction unit 152 applies a wall filter to extract blood flow information, and extracts the Doppler velocity from the echo signal using a color Doppler method. At that time, a blood flow velocity measuring method such as a pulse wave Doppler method may be used. Further, for example, various filters such as a low-pass filter, a band-pass filter, and a smoothing filter may be applied to the extracted spatial distribution and temporal change of the Doppler velocity to obtain a desired distribution and temporal change.
<Step S2>
After receiving the Doppler velocity extracted by the Doppler velocity component extraction unit, the velocitydistribution calculation unit 158 calculates the blood flow velocity in the direction along the wall surface of the blood vessel 30. At that time, first, a velocity vector of blood flow is calculated using a vector Doppler method for calculating a velocity vector from Doppler velocity obtained at two or more angles, and then the direction of the velocity vector along the wall surface of the blood vessel 30 is calculated. Find the velocity component of. The method for obtaining the blood flow velocity in the direction along the blood vessel wall is not limited to the vector Doppler method. For example, the blood flow velocity is estimated by considering the ultrasonic irradiation angle or the blood flow direction in the extracted Doppler velocity. May be. Thereafter, the blood flow velocity distribution at a plurality of measurement points arranged in the radial direction from the wall surface of the blood vessel 30 to the blood vessel center is calculated from the calculated blood flow velocity. At that time, the radial direction of the blood vessel 30 may be automatically calculated from a tomographic image such as a B-mode image formed by the tomographic image forming unit 151 and stored in the memory 16, May be.
<Step S3>
After receiving the blood flow velocity distribution calculated by thevelocity distribution calculator 158, the velocity gradient distribution calculator 153 calculates the blood flow velocity gradient distribution by differential calculation. At this time, a desired distribution may be obtained by applying various filters such as a low-pass filter, a band-pass filter, and a smoothing filter to the calculated blood flow velocity gradient distribution.
<Step S4>
After receiving the blood flow velocity gradient distribution calculated by the velocity gradientdistribution calculation unit 153, the range specifying calculation unit 154 first calculates at least one of an extreme value and an inflection point of the blood flow velocity gradient distribution. The basis for determining the region where the blood flow velocity gradient distribution is rejected using at least one of the coordinates of the extreme value and the inflection point of the blood flow velocity gradient distribution will be described with reference to FIG.
〈ステップS1〉
ドプラ速度抽出部152は、受信部13が出力したエコー信号を受け取った後、血流情報を抽出するためウォールフィルタを適用し、カラードプラ法を用いてエコー信号からドプラ速度を抽出する。その際、パルス波ドプラ法などの血流速度測定方式を用いてもよい。また、抽出したドプラ速度の空間分布や時間変化に対して、例えばローパスフィルタや、バンドパスフィルタ、平滑化フィルタなどの様々なフィルタを適用し所望の分布や時間変化を得てもよい。
〈ステップS2〉
速度分布演算部158は、ドプラ速度成分抽出部により抽出されたドプラ速度を受け取った後、血管30の壁面に沿った方向の血流速度を算出する。その際、まず、二方向以上の角度で求めたドプラ速度から速度ベクトルを算出するベクトルドプラ法を用いて血流の速度ベクトルを算出し、続いて、速度ベクトルの血管30の壁面に沿った方向の速度成分を求める。なお、血管壁面に沿った方向の血流速度を求める方法は、ベクトルドプラ法に限らず、例えば、抽出されたドプラ速度に、超音波照射角度または血流の流れ方向を考慮することで推定してもよい。その後、算出された血流速度から、血管30の壁面から血管中心へ径方向に並んだ複数の測定点における血流速度分布を算出する。その際、血管30の径方向は、断層画像形成部151により形成されメモリ16に保存されたBモード画像などの断層画像より自動的に計算されてもよいし、検者が入力部10により指示してもよい。
〈ステップS3〉
速度勾配分布演算部153は、速度分布演算部158により算出された血流速度分布を受け取った後、微分演算により血流速度勾配分布を算出する。その際、算出した血流速度勾配分布に対して、例えばローパスフィルタや、バンドパスフィルタ、平滑化フィルタなどの様々なフィルタを適用し所望の分布を得てもよい。
〈ステップS4〉
範囲特定演算部154は、速度勾配分布演算部153により算出された血流速度勾配分布を受け取った後、まず血流速度勾配分布の極値および変曲点の少なくともいずれかを算出する。この血流速度勾配分布の極値および変曲点の少なくともいずれかの座標を用いて血流速度勾配分布の棄却する領域を決定する根拠について、図3を用いて説明する。 Based on the configuration of the apparatus described above, an example of an embodiment of the operation of the
<Step S1>
After receiving the echo signal output from the
<Step S2>
After receiving the Doppler velocity extracted by the Doppler velocity component extraction unit, the velocity
<Step S3>
After receiving the blood flow velocity distribution calculated by the
<Step S4>
After receiving the blood flow velocity gradient distribution calculated by the velocity gradient
図3(a)は血管壁面から血管中心へ径方向(y方向)に並んだ複数の測定点における血流速度の測定値を分布図として表したものであり、図3(b)は図3(a)の血流速度分布を微分演算することにより算出される血流速度勾配分布を表したものである。ただし、図中の点線は血管壁面の位置、一点鎖線は血管中心をそれぞれ表す。ここで、図3(a)、(b)の分布図は、ウォールフィルタの影響を受けている。
FIG. 3A is a distribution diagram showing measured values of blood flow velocity at a plurality of measurement points arranged in the radial direction (y direction) from the blood vessel wall surface to the blood vessel center, and FIG. It represents the blood flow velocity gradient distribution calculated by differentiating the blood flow velocity distribution of (a). However, the dotted line in the figure represents the position of the blood vessel wall surface, and the alternate long and short dash line represents the blood vessel center. Here, the distribution diagrams of FIGS. 3A and 3B are affected by the wall filter.
一方、図3(c)は血流速度分布の近似モデルの例、図3(d)は血流速度勾配分布の近似モデルの例である。まず、これらの近似モデルについて説明する。血管を最も簡易的に表す3次元形状は円断面の直管(以下、単に円管という)である。仮に、血流が時間依存性の全く無い定常流れであるとすると、血流速度分布は、数式(1)に示すHagen-Poiseuille流れの式より、2次曲線で表される。
On the other hand, FIG. 3C shows an example of an approximate model of blood flow velocity distribution, and FIG. 3D shows an example of an approximate model of blood flow velocity gradient distribution. First, these approximate models will be described. A three-dimensional shape that most simply represents a blood vessel is a straight tube having a circular cross section (hereinafter simply referred to as a circular tube). Assuming that the blood flow is a steady flow having no time dependency, the blood flow velocity distribution is expressed by a quadratic curve from the Hagen-Poiseuille flow equation shown in Equation (1).

ただし、uは血流速度、Rは血管半径、xは流れ方向の距離、rは血管中心からの半径方向の距離を表す。また、dpは流れ方向の2箇所の微小区間dxにおける圧力pの変化量であり、μは血液の粘性係数である。
However, u represents the blood flow velocity, R represents the blood vessel radius, x represents the distance in the flow direction, and r represents the distance in the radial direction from the blood vessel center. Dp is a change amount of the pressure p in two minute sections dx in the flow direction, and μ is a viscosity coefficient of blood.
血流速度勾配分布は血流速度分布の空間微分として算出できることから、円管の血流速度勾配分布は、数式(2)に示す式より、1次直線で表される。
Since the blood flow velocity gradient distribution can be calculated as a spatial differential of the blood flow velocity distribution, the blood flow velocity gradient distribution of the circular tube is expressed by a linear line from the equation shown in Equation (2).

実際の血流では、湾曲などの複雑な血管形状や、拍動などの血流の時間変動が存在するため、血流速度分布はHagen-Poiseuille流れと同じにはならないが、血管壁面近傍の局所では、壁面の滑りなし条件の影響が強く、Hagen-Poiseuille流れと共通する。このため、図3(c)、(d)では、血管壁面近傍の血流速度分布を2次曲線、血管壁面近傍の血流速度勾配分布を1次直線で近似し、血管中心付近の血流速度勾配分布は下に凸で、緩やかに0に収束するものとしてモデル化している。ただし、血流速度分布の近似モデルは2次曲線に限られるものではなく、多項式や指数関数などその他の関数で近似することもできる。
In actual blood flow, there are complex blood vessel shapes such as curvature, and temporal fluctuations in blood flow such as pulsation, so the blood flow velocity distribution is not the same as the Hagen-Poiseuille flow. Then, the influence of the non-slip condition on the wall is strong, which is the same as the Hagen-Poiseuille flow. For this reason, in FIGS. 3C and 3D, the blood flow velocity distribution near the blood vessel wall surface is approximated by a quadratic curve, and the blood flow velocity gradient distribution near the blood vessel wall surface is approximated by a linear straight line. The velocity gradient distribution is modeled as convex downward and slowly converges to zero. However, the approximation model of the blood flow velocity distribution is not limited to the quadratic curve, and can be approximated by other functions such as a polynomial function and an exponential function.
続いて、図3(a)および(b)に示すウォールフィルタの影響を受けた血流速度分布および血流速度勾配分布について説明する。ウォールフィルタは、血流と比較して低速の、血管膜や筋肉など周囲組織の動きを除外するためのフィルタである。そのため、特性上、血管壁面から受ける摩擦力により低速となった血管壁面近傍の血流速度の信号を弱め、結果として血流速度が過小に測定される。したがって、ウォールフィルタ適用後の血流速度分布を微分演算することで得られた血流速度勾配分布は、図3(b)に示すように、血管中心から血管壁面へ向かうに従って単調増加から単調減少に転じ、血管壁面における血流速度勾配が0に収束する傾向を示す。
Subsequently, the blood flow velocity distribution and blood flow velocity gradient distribution affected by the wall filter shown in FIGS. 3A and 3B will be described. The wall filter is a filter for excluding movement of surrounding tissues such as vascular membranes and muscles, which is slower than blood flow. Therefore, due to the characteristics, the blood flow velocity signal near the blood vessel wall surface that has become low speed due to the frictional force received from the blood vessel wall surface is weakened, and as a result, the blood flow velocity is measured too low. Therefore, the blood flow velocity gradient distribution obtained by differentiating the blood flow velocity distribution after applying the wall filter is monotonically increased from monotonically decreasing toward the blood vessel wall surface as shown in FIG. 3B. And the blood flow velocity gradient on the blood vessel wall surface tends to converge to zero.
以上に述べた理由から、図3(b)に示す血流速度勾配分布において、少なくとも血管壁面から血管中心に向かって単調増加から単調減少に転じる点(以下、極値aという)から血管壁面までの範囲は、血流速度および血流速度勾配が過小評価されている。また、血流速度勾配分布の変曲点のうち、上に凸から下に凸に転じる点(以下、変曲点bという)は、血流速度勾配分布が図3(d)の近似モデルに合う形状となったことを示す指標となる。したがって、血流速度勾配分布の極値aや変曲点bは、様々な血流条件下において、ウォールフィルタの影響で血流速度が過小評価された領域、すなわち、周辺組織等の検出対象外の信号に血流速度の測定値が埋もれた領域の指標となる。
〈ステップS5〉
範囲特定演算部154は、続いて、極値aおよび変曲点bの少なくともいずれかを基準として血流速度勾配分布の棄却する領域を決定し、前記血流速度勾配分布から棄却領域を除いた範囲、すなわち血管30の壁面における血流速度勾配の推定に分布上の値を用いる所定の範囲を算出する。極値aを所定の範囲の境界とした場合、壁面に近い測定点の分布上の値を壁面速度勾配の推定に用いることができる。また、変曲点bから血管壁面までをウォールフィルタの影響で過小評価された領域とみなし、変曲点bを所定の範囲の境界としてもよい。また、これらの座標を基準として検者により設定される、これらの座標と異なる点を所定の範囲の境界としてもよい。算出される範囲は、着目している血管壁面から血管中心までにおいて定義されてもよいし、血管壁面から血管中心を通って対向する血管壁面までにおいて定義されてもよい。
〈ステップS6〉
壁面速度勾配演算部155は、速度分布演算部158から算出された血流速度分布、速度勾配分布演算部153から算出された血流速度勾配分布、範囲特定演算部154から算出された所定の範囲を受け取った後、まず所定の範囲内から、壁面速度勾配の演算に用いる測定点を選ぶ。 For the reason described above, in the blood flow velocity gradient distribution shown in FIG. 3 (b), at least from the point where monotonous increase to monotonic decrease from the blood vessel wall surface toward the blood vessel center (hereinafter referred to as extreme value a) to the blood vessel wall surface. In this range, the blood flow velocity and the blood flow velocity gradient are underestimated. Further, among the inflection points of the blood flow velocity gradient distribution, the blood flow velocity gradient distribution is an approximation model shown in FIG. It becomes an index that shows that the shape is suitable. Therefore, the extreme value a and the inflection point b of the blood flow velocity gradient distribution are not detected in the region where the blood flow velocity is underestimated due to the influence of the wall filter under various blood flow conditions, that is, the surrounding tissues and the like are not detected. This is an indicator of the area where the blood flow velocity measurement value is buried in the signal.
<Step S5>
Subsequently, the range specifyingcalculation unit 154 determines a region where the blood flow velocity gradient distribution is rejected based on at least one of the extreme value a and the inflection point b, and excludes the rejection region from the blood flow velocity gradient distribution. A range, that is, a predetermined range using a distribution value for estimating the blood flow velocity gradient in the wall surface of the blood vessel 30 is calculated. When the extreme value a is a predetermined range boundary, a value on the distribution of measurement points close to the wall surface can be used for estimation of the wall surface velocity gradient. Further, the inflection point b to the blood vessel wall surface may be regarded as an underestimated region due to the influence of the wall filter, and the inflection point b may be set as a boundary of a predetermined range. Further, a point different from these coordinates set by the examiner on the basis of these coordinates may be set as the boundary of the predetermined range. The calculated range may be defined from the focused blood vessel wall surface to the blood vessel center, or may be defined from the blood vessel wall surface to the opposite blood vessel wall surface through the blood vessel center.
<Step S6>
The wall surface velocitygradient calculation unit 155 includes a blood flow velocity distribution calculated from the velocity distribution calculation unit 158, a blood flow velocity gradient distribution calculated from the velocity gradient distribution calculation unit 153, and a predetermined range calculated from the range specifying calculation unit 154. First, a measurement point used for calculating the wall velocity gradient is selected from a predetermined range.
〈ステップS5〉
範囲特定演算部154は、続いて、極値aおよび変曲点bの少なくともいずれかを基準として血流速度勾配分布の棄却する領域を決定し、前記血流速度勾配分布から棄却領域を除いた範囲、すなわち血管30の壁面における血流速度勾配の推定に分布上の値を用いる所定の範囲を算出する。極値aを所定の範囲の境界とした場合、壁面に近い測定点の分布上の値を壁面速度勾配の推定に用いることができる。また、変曲点bから血管壁面までをウォールフィルタの影響で過小評価された領域とみなし、変曲点bを所定の範囲の境界としてもよい。また、これらの座標を基準として検者により設定される、これらの座標と異なる点を所定の範囲の境界としてもよい。算出される範囲は、着目している血管壁面から血管中心までにおいて定義されてもよいし、血管壁面から血管中心を通って対向する血管壁面までにおいて定義されてもよい。
〈ステップS6〉
壁面速度勾配演算部155は、速度分布演算部158から算出された血流速度分布、速度勾配分布演算部153から算出された血流速度勾配分布、範囲特定演算部154から算出された所定の範囲を受け取った後、まず所定の範囲内から、壁面速度勾配の演算に用いる測定点を選ぶ。 For the reason described above, in the blood flow velocity gradient distribution shown in FIG. 3 (b), at least from the point where monotonous increase to monotonic decrease from the blood vessel wall surface toward the blood vessel center (hereinafter referred to as extreme value a) to the blood vessel wall surface. In this range, the blood flow velocity and the blood flow velocity gradient are underestimated. Further, among the inflection points of the blood flow velocity gradient distribution, the blood flow velocity gradient distribution is an approximation model shown in FIG. It becomes an index that shows that the shape is suitable. Therefore, the extreme value a and the inflection point b of the blood flow velocity gradient distribution are not detected in the region where the blood flow velocity is underestimated due to the influence of the wall filter under various blood flow conditions, that is, the surrounding tissues and the like are not detected. This is an indicator of the area where the blood flow velocity measurement value is buried in the signal.
<Step S5>
Subsequently, the range specifying
<Step S6>
The wall surface velocity
その際、後述する壁面速度勾配演算の方式によって、選択する測定点は一点でも複数点でもよい。好ましくは、下記の理由より、極値aおよび変曲点bの二点の測定点を選択するとよい。極値aを選択することで、所定の範囲内で最も壁面に近い測定点における血流速度および血流速度勾配の値を用いることができ、さらに、変曲点bを選択することで、血流速度勾配分布が図3(d)の近似モデルに合う形状となった点における血流速度および血流速度勾配の値を用いることができる。
〈ステップS7〉
壁面速度勾配演算部155は、続いて、選択された測定点における血流速度および血流速度勾配の値を用いて壁面速度勾配の推定値を算出する。 At that time, the measurement point to be selected may be one point or a plurality of points according to a method of wall surface velocity gradient calculation described later. Preferably, two measurement points, the extreme value a and the inflection point b, may be selected for the following reason. By selecting the extreme value a, the values of the blood flow velocity and blood flow velocity gradient at the measurement point closest to the wall surface within a predetermined range can be used, and further, by selecting the inflection point b, blood The values of the blood flow velocity and the blood flow velocity gradient at the point where the flow velocity gradient distribution has a shape that fits the approximate model of FIG. 3D can be used.
<Step S7>
Subsequently, the wall surface velocitygradient calculation unit 155 calculates the estimated value of the wall surface velocity gradient using the blood flow velocity and the blood flow velocity gradient value at the selected measurement point.
〈ステップS7〉
壁面速度勾配演算部155は、続いて、選択された測定点における血流速度および血流速度勾配の値を用いて壁面速度勾配の推定値を算出する。 At that time, the measurement point to be selected may be one point or a plurality of points according to a method of wall surface velocity gradient calculation described later. Preferably, two measurement points, the extreme value a and the inflection point b, may be selected for the following reason. By selecting the extreme value a, the values of the blood flow velocity and blood flow velocity gradient at the measurement point closest to the wall surface within a predetermined range can be used, and further, by selecting the inflection point b, blood The values of the blood flow velocity and the blood flow velocity gradient at the point where the flow velocity gradient distribution has a shape that fits the approximate model of FIG. 3D can be used.
<Step S7>
Subsequently, the wall surface velocity
ここでは、代表的な例として、選択された測定点が一点の場合(a)と二点の場合(b)について図4を用いて説明する。図4では、極値aを境界の一方とし、もう一方の境界を血管中心として、極値aから血管中心までの範囲を所定の範囲とする。ただし、所定の範囲の内側は境界を含むものとする。ここでは、図3(d)と同様に、選択された測定点から血管壁面までの血流速度勾配分布を一次直線で近似した場合について説明する。
Here, as a representative example, a case where the selected measurement point is one point (a) and a case where the selected measurement point is two points (b) will be described with reference to FIG. In FIG. 4, the extreme value a is one of the boundaries, the other boundary is the blood vessel center, and the range from the extreme value a to the blood vessel center is a predetermined range. However, the inside of the predetermined range includes the boundary. Here, as in FIG. 3D, a case where the blood flow velocity gradient distribution from the selected measurement point to the blood vessel wall surface is approximated by a linear line will be described.
測定点が一点の場合が図4(a)であり、選択された測定点から血管壁面までの血流速度勾配分布を1次直線41で近似する場合、図1および図2には図示していないが、Bモード画像など断層画像形成部151で形成した断層画像から血管壁面の位置ywを特定する必要がある。その際、血管壁面の位置ywの特定方法としては、断層画像形成部151により形成されメモリ16に保存されたBモード画像などの断層画像より自動的に計算されてもよいし、検者が入力部10により指示してもよい。血流速度勾配の定積分が血流速度となることから、測定点y0における血流速度は台形ABCDの面積となり、数式(3)が成立する。
FIG. 4A shows the case where the number of measurement points is one, and FIG. 1 and FIG. 2 show the case where the blood flow velocity gradient distribution from the selected measurement point to the blood vessel wall surface is approximated by the primary straight line 41. However, it is necessary to specify the position y w of the blood vessel wall surface from a tomographic image formed by the tomographic image forming unit 151 such as a B-mode image. At that time, as a method for specifying the position y w of the blood vessel wall surface, it may be automatically calculated from a tomographic image such as a B-mode image formed by the tomographic image forming unit 151 and stored in the memory 16, You may instruct | indicate with the input part 10. FIG. Since the definite integral of the blood flow velocity gradient becomes the blood flow velocity, the blood flow velocity at the measurement point y 0 becomes the area of the trapezoid ABCD, and the formula (3) is established.

ただし、u0は測定点y0における血流速度、du/dyは血流速度勾配を表す。
However, u 0 represents the blood flow velocity at the measurement point y 0 and du / dy represents the blood flow velocity gradient.
したがって、壁面速度勾配は数式(4)で算出される。
Therefore, the wall surface velocity gradient is calculated by Equation (4).

すなわち、血管壁面近傍の血流速度勾配分布に近似モデル(1次直線)を適用し、血管壁面から選択された測定点までの血流速度勾配分布の定積分が選択された測定点における血流速度と等しくなる関係に基づき、選択された測定点における血流速度および血流速度勾配の値から壁面速度勾配の推定値を算出することができる。
In other words, an approximate model (primary straight line) is applied to the blood flow velocity gradient distribution in the vicinity of the blood vessel wall surface, and the blood flow at the measurement point where the definite integral of the blood flow velocity gradient distribution from the blood vessel wall surface to the selected measurement point is selected. Based on the relationship equal to the velocity, the estimated value of the wall velocity gradient can be calculated from the blood flow velocity and the blood velocity gradient at the selected measurement point.
また、測定点が二点の場合が図4(b)であり、各々の測定点から血管壁面までの血流速度勾配分布を1次直線42で近似する。その際、血管壁面の位置は必ずしも特定しておく必要はない。血管壁面の座標ywを未知数として、測定点y1およびy2における血流速度と血流速度勾配の関係は、台形ABCDおよび台形ABEFより数式(5)で記述される。
Further, FIG. 4B shows the case where there are two measurement points, and the blood flow velocity gradient distribution from each measurement point to the blood vessel wall surface is approximated by a primary line 42. At that time, the position of the blood vessel wall surface is not necessarily specified. The relationship between the blood flow velocity and the blood flow velocity gradient at the measurement points y 1 and y 2 , where the coordinate y w of the blood vessel wall surface is an unknown, is described by equation (5) from trapezoid ABCD and trapezoid ABEF.

数式(5)を連立方程式として解くと、壁面速度勾配(du/dy)y=ywは算出される。例えば、測定点y1を極値aのy座標、測定点y2を変曲点bのy座標として、数式(5)に代入することで、血管壁面の位置ywが不明であっても壁面速度勾配を求めることが可能である。
〈ステップS8〉
壁面せん断応力演算部156は、壁面速度勾配演算部155から壁面速度勾配の値を受け取った後、壁面せん断応力を算出する。壁面せん断応力τは、数式(6)によって与えられる。 When Equation (5) is solved as a simultaneous equation, the wall velocity gradient (du / dy) y = yw is calculated. For example, by substituting the measurement point y 1 as the y coordinate of the extreme value a and the measurement point y 2 as the y coordinate of the inflection point b in the formula (5), the position y w of the blood vessel wall surface is unknown. It is possible to determine the wall velocity gradient.
<Step S8>
After receiving the value of the wall surface velocity gradient from the wall surface velocitygradient calculating unit 155, the wall surface shear stress calculating unit 156 calculates the wall surface shear stress. The wall shear stress τ is given by Equation (6).
〈ステップS8〉
壁面せん断応力演算部156は、壁面速度勾配演算部155から壁面速度勾配の値を受け取った後、壁面せん断応力を算出する。壁面せん断応力τは、数式(6)によって与えられる。 When Equation (5) is solved as a simultaneous equation, the wall velocity gradient (du / dy) y = yw is calculated. For example, by substituting the measurement point y 1 as the y coordinate of the extreme value a and the measurement point y 2 as the y coordinate of the inflection point b in the formula (5), the position y w of the blood vessel wall surface is unknown. It is possible to determine the wall velocity gradient.
<Step S8>
After receiving the value of the wall surface velocity gradient from the wall surface velocity

ここで、μは血液の粘性係数である。
〈ステップS9〉
表示画像形成部157は、断層画像形成部から血管30の断層画像、ドプラ速度抽出部152からドプラ速度、速度分布演算部158から血管30の壁面に沿った方向の血流速度分布、速度勾配分布演算部153から血流速度勾配分布、範囲特定演算部154から所定の範囲、壁面速度勾配演算部155から壁面速度勾配の値、壁面せん断応力演算部156から壁面せん断応力の情報を受け取った後、それらの情報の全部または一部を、予め決められた形式や入力部10から入力される指示に従い、表示画像として形成する。 Here, μ is the viscosity coefficient of blood.
<Step S9>
The displayimage forming unit 157 receives the tomographic image of the blood vessel 30 from the tomographic image forming unit, the Doppler velocity extracting unit 152 from the Doppler velocity, and the velocity distribution calculating unit 158 from the blood flow velocity distribution and velocity gradient distribution in the direction along the wall surface of the blood vessel 30. After receiving the blood flow velocity gradient distribution from the calculation unit 153, the predetermined range from the range specifying calculation unit 154, the value of the wall velocity gradient from the wall velocity gradient calculation unit 155, and the wall shear stress information from the wall shear stress calculation unit 156, All or part of the information is formed as a display image in accordance with a predetermined format or an instruction input from the input unit 10.
〈ステップS9〉
表示画像形成部157は、断層画像形成部から血管30の断層画像、ドプラ速度抽出部152からドプラ速度、速度分布演算部158から血管30の壁面に沿った方向の血流速度分布、速度勾配分布演算部153から血流速度勾配分布、範囲特定演算部154から所定の範囲、壁面速度勾配演算部155から壁面速度勾配の値、壁面せん断応力演算部156から壁面せん断応力の情報を受け取った後、それらの情報の全部または一部を、予め決められた形式や入力部10から入力される指示に従い、表示画像として形成する。 Here, μ is the viscosity coefficient of blood.
<Step S9>
The display
本実施例の装置構成においては、表示部14は速度分布演算部158が算出した血流速度分布や速度勾配分布演算部153が算出した血流速度勾配分布を表示し、範囲特定演算部154が算出した所定の範囲を、血流速度分布や血流速度勾配分布に重ねて表示してもよい。例えば、図5(a)または(b)に示すように、血管壁面に沿った方向の血流速度分布や血流速度勾配分布に対し、所定の範囲51、52の範囲内または範囲外を色付けする、あるいは単に所定の範囲51、52の境界の座標を数値として表示する表示画像を形成する。
In the apparatus configuration of this embodiment, the display unit 14 displays the blood flow velocity distribution calculated by the velocity distribution calculation unit 158 and the blood flow velocity gradient distribution calculated by the velocity gradient distribution calculation unit 153, and the range specifying calculation unit 154 displays the blood flow velocity distribution. The calculated predetermined range may be displayed superimposed on the blood flow velocity distribution or the blood flow velocity gradient distribution. For example, as shown in FIG. 5A or 5B, the blood flow velocity distribution or the blood flow velocity gradient distribution in the direction along the blood vessel wall surface is colored within or outside the predetermined ranges 51 and 52. Or a display image that simply displays the coordinates of the boundaries of the predetermined ranges 51 and 52 as numerical values is formed.
また、図6(a)または(b)に示すように、複数点について算出した壁面速度勾配または壁面せん断応力の空間分布情報を知覚情報として、血管の断層画像61、62と共に検者に提示する。すなわち、断層画像形成部151が形成した検査対象の血管の断層画像と、壁面速度勾配または壁面せん断応力の空間分布情報などの検査対象の診断指標となる情報を重ねて、空間分布図として表示する。
Also, as shown in FIG. 6 (a) or (b), the wall velocity gradient or wall shear stress spatial distribution information calculated for a plurality of points is presented to the examiner as perceptual information together with the tomographic images 61 and 62 of the blood vessel. . That is, the tomographic image of the blood vessel to be inspected formed by the tomographic image forming unit 151 and the information serving as the diagnostic index of the inspection object such as the wall surface velocity gradient or the spatial distribution information of the wall shear stress are superimposed and displayed as a spatial distribution diagram. .
その際、知覚情報を、図6(a)に示すように壁面せん断応力の大きさを幅で表示してもよいし、図6(b)に示すようにカラーバー63を利用して壁面せん断応力の大きさを色分けして表示してもよい。このように、Bモード画像などの血管の断層画像に、血流速度分布および血流速度勾配分布の少なくとも一つに重ねて表示することは、これらの情報の空間分布に対する検者の理解を助ける。
At this time, the perceptual information may be displayed by the width of the wall shear stress as shown in FIG. 6A, or the wall shear using the color bar 63 as shown in FIG. 6B. The magnitude of the stress may be displayed in different colors. Thus, displaying on a tomographic image of a blood vessel such as a B-mode image so as to overlap at least one of the blood flow velocity distribution and the blood flow velocity gradient distribution helps the examiner understand the spatial distribution of these information. .
また、図7に示すように、壁面速度勾配または壁面せん断応力の時系列変化情報71を、検者に提示してもよい。同図の横軸は時間(s)、縦軸は壁面せん断応力(Pa)である。特に、時系列変化の情報を心拍信号とともに表示することは、壁面せん断応力の時系列変化と拍動の相関に対する検者の理解を助ける。すなわち、入力部10から検査対象の心拍信号情報を入力するよう指示し、表示部14は、検査対象の診断指標となる壁面せん断応力などの情報を入力された心拍信号情報とともに時系列変化で表示する。さらに、壁面せん断応力の空間分布情報や時系列変化情報の統計値、例えば最大値、最小値、平均値、中央値などの少なくとも一つを、検者に提示してもよい。
Further, as shown in FIG. 7, wall speed gradient or wall shear stress time-series change information 71 may be presented to the examiner. In the figure, the horizontal axis represents time (s), and the vertical axis represents wall shear stress (Pa). In particular, displaying time-series change information together with the heartbeat signal helps the examiner understand the correlation between the time-series change in wall shear stress and pulsation. That is, an instruction is given to input heartbeat signal information to be examined from the input unit 10, and the display unit 14 displays information such as wall shear stress that is a diagnostic index of the examination target along with the input heartbeat signal information in a time series change. To do. Furthermore, at least one of the statistical values of the spatial distribution information of the wall shear stress and the time series change information, for example, the maximum value, the minimum value, the average value, the median value, etc. may be presented to the examiner.
実施例1においては、検査対象の診断指標となる情報を算出する診断指標演算部として、壁面速度勾配の推定値を用いて壁面せん断応力を算出する壁面せん断応力演算部を備える構成を説明したが、壁面速度勾配は、圧較差による血管弾性測定法の計算にも用いられる。実施例2として、検査対象の診断指標となる情報を算出する診断指標演算部として血管弾性演算部を有する超音波撮像装置の実施例を、実施例1の超音波撮像装置と異なる点を中心に説明する。計算処理フローではステップS8以降が異なるため、図2のステップS8、S9の代わりにステップS10、S11を挿入したフローチャートを図8に示す。
〈ステップS10〉
実施例1では、壁面速度勾配演算部155の出力を壁面せん断応力演算部156が受け取り、壁面せん断応力を算出した。実施例2では、図示を省略するが、壁面せん断応力演算部156に代え血管弾性演算部を備え、血管弾性演算部は、図1の壁面速度勾配演算部155の出力を受け取り、血管弾性を算出する。また、算出された血管弾性はメモリ16に保存される。血管弾性Eは数式(7)によって与えられる。 In Example 1, although the structure provided with the wall surface shear stress calculating part which calculates a wall surface shear stress using the estimated value of a wall surface velocity gradient as a diagnostic index calculating part which calculates the information used as the diagnostic index of a test object was demonstrated. The wall velocity gradient is also used for calculation of the vascular elasticity measurement method based on the pressure difference. As Example 2, an example of an ultrasonic imaging apparatus having a vascular elasticity calculation unit as a diagnostic index calculation unit for calculating information serving as a diagnostic index of a test object is mainly focused on differences from the ultrasonic imaging apparatus of Example 1. explain. Since the calculation processing flow is different after step S8, FIG. 8 shows a flowchart in which steps S10 and S11 are inserted instead of steps S8 and S9 in FIG.
<Step S10>
In Example 1, the wall surface shearstress calculation unit 156 received the output of the wall surface velocity gradient calculation unit 155 and calculated the wall surface shear stress. In the second embodiment, although not shown, a vascular elasticity calculation unit is provided instead of the wall surface shear stress calculation unit 156, and the vascular elasticity calculation unit receives the output of the wall surface velocity gradient calculation unit 155 of FIG. 1 and calculates the vascular elasticity. To do. The calculated vascular elasticity is stored in the memory 16. The vascular elasticity E is given by equation (7).
〈ステップS10〉
実施例1では、壁面速度勾配演算部155の出力を壁面せん断応力演算部156が受け取り、壁面せん断応力を算出した。実施例2では、図示を省略するが、壁面せん断応力演算部156に代え血管弾性演算部を備え、血管弾性演算部は、図1の壁面速度勾配演算部155の出力を受け取り、血管弾性を算出する。また、算出された血管弾性はメモリ16に保存される。血管弾性Eは数式(7)によって与えられる。 In Example 1, although the structure provided with the wall surface shear stress calculating part which calculates a wall surface shear stress using the estimated value of a wall surface velocity gradient as a diagnostic index calculating part which calculates the information used as the diagnostic index of a test object was demonstrated. The wall velocity gradient is also used for calculation of the vascular elasticity measurement method based on the pressure difference. As Example 2, an example of an ultrasonic imaging apparatus having a vascular elasticity calculation unit as a diagnostic index calculation unit for calculating information serving as a diagnostic index of a test object is mainly focused on differences from the ultrasonic imaging apparatus of Example 1. explain. Since the calculation processing flow is different after step S8, FIG. 8 shows a flowchart in which steps S10 and S11 are inserted instead of steps S8 and S9 in FIG.
<Step S10>
In Example 1, the wall surface shear

ただし、Rは血管の内径、hは血管の厚さ、Lは圧較差算出に用いる2点間の距離、Δdは前記2点間の内径差、μは血液の粘性係数を示す。これらのパラメータは、例えば予め決められた値や、入力部10から入力される値、もしくはエコー信号から算出される値のいずれを採用してもよい。
〈ステップS11〉
実施例2では、表示画像形成部157は、断層画像形成部151から血管30の断層画像、ドプラ速度抽出部152からドプラ速度、速度分布演算部158から血管30の壁面に沿った方向の血流速度分布、速度勾配分布演算部153から血流速度勾配分布、範囲特定演算部154から所定の範囲、壁面速度勾配演算部155から壁面速度勾配の値、血管弾性演算部から血管弾性の情報を受け取った後、それらの情報の全部または一部を、予め決められた形式や入力部10から入力される指示に従い、表示画像として形成する。表示形式の具体例は、図2のステップS9に準じる。 Where R is the inner diameter of the blood vessel, h is the thickness of the blood vessel, L is the distance between the two points used to calculate the pressure difference, Δd is the inner diameter difference between the two points, and μ is the viscosity coefficient of the blood. As these parameters, for example, a predetermined value, a value input from theinput unit 10, or a value calculated from an echo signal may be adopted.
<Step S11>
In the second embodiment, the displayimage forming unit 157 receives the tomographic image of the blood vessel 30 from the tomographic image forming unit 151, the Doppler velocity from the Doppler velocity extracting unit 152, and the blood flow in the direction along the wall surface of the blood vessel 30 from the velocity distribution calculating unit 158. Receives velocity distribution, blood flow velocity gradient distribution from velocity gradient distribution calculator 153, predetermined range from range specifying calculator 154, wall velocity gradient value from wall velocity gradient calculator 155, and blood vessel elasticity information from vessel elasticity calculator After that, all or part of the information is formed as a display image in accordance with a predetermined format or an instruction input from the input unit 10. A specific example of the display format conforms to step S9 in FIG.
〈ステップS11〉
実施例2では、表示画像形成部157は、断層画像形成部151から血管30の断層画像、ドプラ速度抽出部152からドプラ速度、速度分布演算部158から血管30の壁面に沿った方向の血流速度分布、速度勾配分布演算部153から血流速度勾配分布、範囲特定演算部154から所定の範囲、壁面速度勾配演算部155から壁面速度勾配の値、血管弾性演算部から血管弾性の情報を受け取った後、それらの情報の全部または一部を、予め決められた形式や入力部10から入力される指示に従い、表示画像として形成する。表示形式の具体例は、図2のステップS9に準じる。 Where R is the inner diameter of the blood vessel, h is the thickness of the blood vessel, L is the distance between the two points used to calculate the pressure difference, Δd is the inner diameter difference between the two points, and μ is the viscosity coefficient of the blood. As these parameters, for example, a predetermined value, a value input from the
<Step S11>
In the second embodiment, the display
実施例3は、検査対象の診断指標となる情報を算出する診断指標演算部として血液流量演算部を有する超音波撮像装置の実施例である。実施例3の構成を、実施例1の超音波撮像装置と異なる点を中心に説明する。本実施例では、図1に示した装置構成の壁面せん断応力演算部156に代え流量演算部を備える。流量演算部は壁面速度勾配演算部155の出力を受け取り、血液流量を算出する。具体的には、壁面速度勾配演算部155が算出した壁面速度勾配の値を用いて、流量演算部が血管壁面から測定点y1までの範囲の血流速度分布を前記の近似モデル(2次曲線)で置換し、置換後の流速分布を積分することにより血液流量を算出する。
Example 3 is an example of an ultrasonic imaging apparatus having a blood flow rate calculation unit as a diagnostic index calculation unit for calculating information serving as a diagnostic index to be examined. The configuration of the third embodiment will be described focusing on differences from the ultrasonic imaging apparatus of the first embodiment. In the present embodiment, a flow rate calculation unit is provided instead of the wall surface shear stress calculation unit 156 of the apparatus configuration shown in FIG. The flow rate calculation unit receives the output of the wall surface velocity gradient calculation unit 155 and calculates the blood flow rate. Specifically, using the value of the wall surface velocity gradient calculated by the wall surface velocity gradient calculating unit 155, the flow rate calculating unit calculates the blood flow velocity distribution in the range from the blood vessel wall surface to the measurement point y1 using the above approximate model (secondary curve). ), And the blood flow rate is calculated by integrating the flow velocity distribution after the replacement.
本実施例の構成によれば、より高精度に血液流量を求めることができる。計算処理フローでは実施例1と内容が異なるステップS8以降に関して、図2のステップS8、S9の代わりにステップS12、S13、S14、S15を挿入したフローチャートを図9に示す。
〈ステップS12〉
図示を省略した流量演算部は、壁面速度勾配の数値を受け取った後、血液流量を算出する。まず、壁面速度勾配演算部155が算出した壁面速度勾配の値を用いると、血流速度勾配分布の近似モデルは数式(8)によって与えられる。 According to the configuration of the present embodiment, the blood flow rate can be obtained with higher accuracy. FIG. 9 shows a flowchart in which steps S12, S13, S14, and S15 are inserted instead of steps S8 and S9 in FIG.
<Step S12>
A flow rate calculation unit (not shown) calculates the blood flow rate after receiving the numerical value of the wall surface velocity gradient. First, when the value of the wall surface velocity gradient calculated by the wall surface velocitygradient calculating unit 155 is used, an approximate model of the blood flow velocity gradient distribution is given by Expression (8).
〈ステップS12〉
図示を省略した流量演算部は、壁面速度勾配の数値を受け取った後、血液流量を算出する。まず、壁面速度勾配演算部155が算出した壁面速度勾配の値を用いると、血流速度勾配分布の近似モデルは数式(8)によって与えられる。 According to the configuration of the present embodiment, the blood flow rate can be obtained with higher accuracy. FIG. 9 shows a flowchart in which steps S12, S13, S14, and S15 are inserted instead of steps S8 and S9 in FIG.
<Step S12>
A flow rate calculation unit (not shown) calculates the blood flow rate after receiving the numerical value of the wall surface velocity gradient. First, when the value of the wall surface velocity gradient calculated by the wall surface velocity

〈ステップS13〉
数式(8)を積分することにより、血流速度分布の近似モデルは数式(9)によって与えられる。 <Step S13>
By integrating Equation (8), an approximate model of blood flow velocity distribution is given by Equation (9).
数式(8)を積分することにより、血流速度分布の近似モデルは数式(9)によって与えられる。 <Step S13>
By integrating Equation (8), an approximate model of blood flow velocity distribution is given by Equation (9).

〈ステップS14〉
数式(9)を血管断面全体で積分することにより、血液流量が求められる。図10は実施例3の構成で血液流量演算の積分範囲を説明するための図であり、101、103はモデル化した血流速度分布を積分する領域を、102は実測した血流速度分布を積分する領域を示す。同図に示すように、モデル化した血流速度分布を積分する領域101における血管壁面A近傍の血流速度分布の近似モデルをuA、モデル化した血流速度分布を積分する領域103における血管壁面B近傍の血流速度分布の近似モデルをuB、実測した血流速度分布を積分する領域102における血管中央の実測した血流速度分布をuCとすると、血液流量は次式で求められる。 <Step S14>
The blood flow rate is obtained by integrating Equation (9) over the entire blood vessel cross section. FIG. 10 is a diagram for explaining the integration range of blood flow calculation in the configuration of the third embodiment, where 101 and 103 are areas where the modeled blood flow velocity distribution is integrated, and 102 is the measured blood flow velocity distribution. Indicates the region to be integrated. As shown in the figure, u A is an approximate model of the blood flow velocity distribution in the vicinity of the blood vessel wall surface A in theregion 101 where the modeled blood flow velocity distribution is integrated, and blood vessels in the region 103 where the modeled blood flow velocity distribution is integrated. Assuming that u B is an approximate model of the blood flow velocity distribution in the vicinity of the wall surface B and u C is the measured blood flow velocity distribution at the center of the blood vessel in the region 102 where the measured blood flow velocity distribution is integrated, the blood flow rate is obtained by the following equation. .
数式(9)を血管断面全体で積分することにより、血液流量が求められる。図10は実施例3の構成で血液流量演算の積分範囲を説明するための図であり、101、103はモデル化した血流速度分布を積分する領域を、102は実測した血流速度分布を積分する領域を示す。同図に示すように、モデル化した血流速度分布を積分する領域101における血管壁面A近傍の血流速度分布の近似モデルをuA、モデル化した血流速度分布を積分する領域103における血管壁面B近傍の血流速度分布の近似モデルをuB、実測した血流速度分布を積分する領域102における血管中央の実測した血流速度分布をuCとすると、血液流量は次式で求められる。 <Step S14>
The blood flow rate is obtained by integrating Equation (9) over the entire blood vessel cross section. FIG. 10 is a diagram for explaining the integration range of blood flow calculation in the configuration of the third embodiment, where 101 and 103 are areas where the modeled blood flow velocity distribution is integrated, and 102 is the measured blood flow velocity distribution. Indicates the region to be integrated. As shown in the figure, u A is an approximate model of the blood flow velocity distribution in the vicinity of the blood vessel wall surface A in the

ただし、ywAは血管壁面Aの座標、ywBは血管壁面Bの座標、yAは血管壁面A近傍の測定点、yBは血管壁面B近傍の測定点をそれぞれ示す。
〈ステップS15〉
実施例3では、表示画像形成部157は、断層画像形成部151から血管30の断層画像、ドプラ速度抽出部152からドプラ速度、速度分布演算部158から血管30の壁面に沿った方向の血流速度分布、速度勾配分布演算部153から血流速度勾配分布、範囲特定演算部154から所定の範囲、壁面速度勾配演算部155から壁面速度勾配の値、血液流量演算部から血液流量の情報を受け取った後、それらの情報の全部または一部を、予め決められた形式や入力部10から入力される指示に従い、表示画像として形成する。表示形式の具体例は、ステップS9に準じる。 However, y wA is the coordinate of the blood vessel wall surface A, y wB is the coordinate of the blood vessel wall surface B, y A is the measurement point near the blood vessel wall surface A, and y B is the measurement point near the blood vessel wall surface B.
<Step S15>
In the third embodiment, the displayimage forming unit 157 includes the tomographic image of the blood vessel 30 from the tomographic image forming unit 151, the Doppler velocity from the Doppler velocity extracting unit 152, and the blood flow in the direction along the wall surface of the blood vessel 30 from the velocity distribution calculating unit 158. Receives velocity distribution, blood flow velocity gradient distribution from velocity gradient distribution calculator 153, predetermined range from range specifying calculator 154, wall velocity gradient value from wall velocity gradient calculator 155, and blood flow information from blood flow calculator. After that, all or part of the information is formed as a display image in accordance with a predetermined format or an instruction input from the input unit 10. A specific example of the display format conforms to step S9.
〈ステップS15〉
実施例3では、表示画像形成部157は、断層画像形成部151から血管30の断層画像、ドプラ速度抽出部152からドプラ速度、速度分布演算部158から血管30の壁面に沿った方向の血流速度分布、速度勾配分布演算部153から血流速度勾配分布、範囲特定演算部154から所定の範囲、壁面速度勾配演算部155から壁面速度勾配の値、血液流量演算部から血液流量の情報を受け取った後、それらの情報の全部または一部を、予め決められた形式や入力部10から入力される指示に従い、表示画像として形成する。表示形式の具体例は、ステップS9に準じる。 However, y wA is the coordinate of the blood vessel wall surface A, y wB is the coordinate of the blood vessel wall surface B, y A is the measurement point near the blood vessel wall surface A, and y B is the measurement point near the blood vessel wall surface B.
<Step S15>
In the third embodiment, the display
本発明の超音波撮像装置は、上記の実施例に限定されず、適宜要素の追加、削除などが可能である。例えば、各実施例は検査対象の診断指標となる情報を算出する診断指標演算部として、それぞれ壁面せん断応力演算部、血管弾性演算部、あるいは血液流量演算部を備えていたが、これらの二つ、あるいは三つを組み合わせて備える構成とすることも可能である。また、実施例1は動脈硬化の早期診断を例に説明したが、これは本発明の適用対象を動脈に限定するものではなく、下肢静脈などの静脈における血流速度勾配測定にも適用することが可能である。下肢静脈は、血栓や静脈瘤の生じやすい部位であり、これらの診断にも本発明を適用してもよい。
The ultrasonic imaging apparatus of the present invention is not limited to the above-described embodiment, and elements can be added or deleted as appropriate. For example, each embodiment was provided with a wall surface shear stress calculation unit, a vascular elasticity calculation unit, or a blood flow rate calculation unit as a diagnostic index calculation unit for calculating information serving as a diagnostic index of a test object. Alternatively, it is possible to have a configuration including a combination of three. Moreover, although Example 1 demonstrated the early diagnosis of arteriosclerosis as an example, this does not limit the application object of this invention to an artery, It applies also to the blood-flow velocity gradient measurement in veins, such as a leg vein. Is possible. The lower limb vein is a site where thrombi and varicose veins are likely to occur, and the present invention may also be applied to these diagnoses.
1 装置本体
2 超音波探触子
3 生体
10 入力部
11 制御部
12 発信部
13 受信部
14 表示部
15 信号処理部
16 メモリ
30 血管
41、42 一次直線
51、52 所定の範囲
61、62 血管の断層画像
63 カラーバー
71 時系列変化情報
101、103 モデル化した血流速度分布を積分する領域
102 実測した血流速度分布を積分する領域
151 断層画像形成部
152 ドプラ速度抽出部
153 速度勾配分布演算部
154 範囲特定演算部
155 壁面速度勾配演算部
156 壁面せん断応力演算部
157 表示画像形成部
158 速度分布演算部 DESCRIPTION OFSYMBOLS 1 Device main body 2 Ultrasonic probe 3 Living body 10 Input part 11 Control part 12 Transmission part 13 Reception part 14 Display part 15 Signal processing part 16 Memory 30 Blood vessel 41, 42 Primary straight line 51, 52 Predetermined range 61, 62 of blood vessel Tomographic image 63 Color bar 71 Time series change information 101, 103 Area 102 for integrating the modeled blood flow velocity distribution Area 151 for integrating the measured blood flow velocity distribution 151 Tomographic image forming unit 152 Doppler velocity extracting unit 153 Speed gradient distribution calculation Unit 154 range specifying calculation unit 155 wall velocity gradient calculation unit 156 wall shear stress calculation unit 157 display image forming unit 158 velocity distribution calculation unit
2 超音波探触子
3 生体
10 入力部
11 制御部
12 発信部
13 受信部
14 表示部
15 信号処理部
16 メモリ
30 血管
41、42 一次直線
51、52 所定の範囲
61、62 血管の断層画像
63 カラーバー
71 時系列変化情報
101、103 モデル化した血流速度分布を積分する領域
102 実測した血流速度分布を積分する領域
151 断層画像形成部
152 ドプラ速度抽出部
153 速度勾配分布演算部
154 範囲特定演算部
155 壁面速度勾配演算部
156 壁面せん断応力演算部
157 表示画像形成部
158 速度分布演算部 DESCRIPTION OF
Claims (16)
- 検査対象が反射するエコー信号を受信する受信部と、
前記受信部により受信された前記エコー信号を処理する信号処理部と、を備え、
前記信号処理部は、
前記検査対象の血管壁面から血管中心へ径方向に並んだ複数の測定点における、前記エコー信号から算出される前記血管壁面に沿った方向の血流速度の値から、血流速度勾配分布を算出する速度勾配分布演算部と、
前記血流速度勾配分布において所定の範囲を算出する範囲特定演算部と、
前記所定の範囲内の測定点における血流速度および血流速度勾配の値から、血管壁面における血流速度勾配の推定値を算出する壁面速度勾配演算部と、を備えることを特徴とする超音波撮像装置。 A receiving unit for receiving an echo signal reflected by the inspection object;
A signal processing unit that processes the echo signal received by the receiving unit,
The signal processing unit
The blood flow velocity gradient distribution is calculated from the blood flow velocity values in the direction along the blood vessel wall surface calculated from the echo signal at a plurality of measurement points arranged in the radial direction from the blood vessel wall surface to be examined to the blood vessel center. A velocity gradient distribution calculation unit to
A range specifying calculation unit for calculating a predetermined range in the blood flow velocity gradient distribution;
A wall surface velocity gradient computing unit that calculates an estimated value of the blood flow velocity gradient on the blood vessel wall surface from the blood flow velocity and the blood flow velocity gradient value at the measurement points within the predetermined range. Imaging device. - 請求項1に記載の超音波撮像装置において、
前記範囲特定演算部は、前記血流速度勾配分布の形状に基づいて棄却する領域を決定し、
前記血流速度勾配分布に対して前記棄却する領域を除いた範囲として、前記所定の範囲を算出することを特徴とする超音波撮像装置。 The ultrasonic imaging apparatus according to claim 1,
The range specifying calculation unit determines an area to be rejected based on the shape of the blood flow velocity gradient distribution,
The ultrasonic imaging apparatus, wherein the predetermined range is calculated as a range excluding the area to be rejected with respect to the blood flow velocity gradient distribution. - 請求項2に記載の超音波撮像装置において、
前記範囲特定演算部は、前記血流速度勾配分布において、前記血管壁面から前記血管中心に向かって単調増加から単調減少に転じる点および上に凸から下に凸に転じる変曲点の少なくともいずれかを基準として、前記所定の範囲を算出することを特徴とする超音波撮像装置。 The ultrasonic imaging apparatus according to claim 2,
In the blood flow velocity gradient distribution, the range specifying calculation unit is at least one of a point that turns from monotonically increasing to monotonically decreasing from the blood vessel wall surface toward the blood vessel center and an inflection point that turns from convex upward to convex downward. The ultrasonic imaging apparatus characterized in that the predetermined range is calculated with reference to. - 請求項3に記載の超音波撮像装置において、
前記範囲特定演算部は、前記血管壁面における血流速度勾配の推定に用いる測定点の所定の範囲の境界を、前記血管壁面から前記血管中心に向かって単調増加から単調減少に転じる点とし、
前記壁面速度勾配演算部は、前記境界を含む所定の範囲内の少なくとも1点以上の測定点における血流速度および血流速度勾配の値から、前記血管壁面における血流速度勾配の推定値を算出することを特徴とする超音波撮像装置。 The ultrasonic imaging apparatus according to claim 3,
The range specifying calculation unit, a boundary of a predetermined range of measurement points used for estimating a blood flow velocity gradient in the blood vessel wall surface is a point that changes from monotonic increase to monotonic decrease from the blood vessel wall surface toward the blood vessel center,
The wall surface velocity gradient calculation unit calculates an estimated value of the blood flow velocity gradient on the blood vessel wall surface from the blood flow velocity and the blood flow velocity gradient value at at least one measurement point within a predetermined range including the boundary. An ultrasonic imaging apparatus. - 請求項4に記載の超音波撮像装置において、
前記壁面速度勾配演算部は、前記血管壁面から前記血管中心に向かって単調増加から単調減少に転じる点および前記上に凸から下に凸に転じる変曲点の少なくともいずれかにおける血流速度および血流速度勾配の値から、血管壁面における血流速度勾配の推定値を算出することを特徴とする超音波撮像装置。 The ultrasonic imaging apparatus according to claim 4,
The wall surface velocity gradient calculating unit is configured to provide blood flow velocity and blood at at least one of a point where the monotonic increase changes from a monotonic increase toward a monotonic decrease toward the blood vessel center and an inflection point where the convexity changes from upward to downward. An ultrasonic imaging apparatus, wherein an estimated value of a blood flow velocity gradient on a blood vessel wall surface is calculated from a value of a flow velocity gradient. - 請求項1に記載の超音波撮像装置において、
前記信号処理部は、前記壁面速度勾配演算部が算出した前記血管壁面における血流速度勾配の推定値を用いて、前記検査対象の診断指標となる情報を算出する診断指標演算部を備えることを特徴とする超音波撮像装置。 The ultrasonic imaging apparatus according to claim 1,
The signal processing unit includes a diagnostic index calculation unit that calculates information serving as a diagnostic index of the examination target using an estimated value of a blood flow velocity gradient in the blood vessel wall surface calculated by the wall surface velocity gradient calculation unit. A characteristic ultrasonic imaging apparatus. - 請求項6に記載の超音波撮像装置において、
前記診断指標演算部は、前記血管壁面上の血流速度勾配の推定値から壁面せん断応力を算出する壁面せん断応力演算部であることを特徴とする超音波撮像装置。 The ultrasonic imaging apparatus according to claim 6,
The ultrasonic imaging apparatus, wherein the diagnostic index calculator is a wall shear stress calculator that calculates a wall shear stress from an estimated value of a blood flow velocity gradient on the blood vessel wall. - 請求項6に記載の超音波撮像装置において、
前記診断指標演算部は、前記血管壁面上の血流速度勾配の推定値から血管弾性を算出する血管弾性演算部であることを特徴とする超音波撮像装置。 The ultrasonic imaging apparatus according to claim 6,
The ultrasonic imaging apparatus, wherein the diagnostic index calculation unit is a blood vessel elasticity calculation unit that calculates blood vessel elasticity from an estimated value of a blood flow velocity gradient on the blood vessel wall surface. - 請求項6に記載の超音波撮像装置において、
前記診断指標演算部は、前記血管壁面上の血流速度勾配の推定値から血液流量を算出する血液流量演算部であることを特徴とする超音波撮像装置。 The ultrasonic imaging apparatus according to claim 6,
The ultrasonic imaging apparatus, wherein the diagnostic index calculation unit is a blood flow rate calculation unit that calculates a blood flow rate from an estimated value of a blood flow velocity gradient on the blood vessel wall surface. - 請求項1に記載の超音波撮像装置において、
前記信号処理部で得られた情報を表示する表示部を備え、
前記表示部は、前記速度勾配分布演算部が算出した前記血流速度勾配分布を表示し、
前記範囲特定演算部が算出した所定の範囲を、前記血流速度勾配分布に重ねて表示することを特徴とする超音波撮像装置。 The ultrasonic imaging apparatus according to claim 1,
A display unit for displaying information obtained by the signal processing unit;
The display unit displays the blood flow velocity gradient distribution calculated by the velocity gradient distribution calculator,
The ultrasonic imaging apparatus, wherein the predetermined range calculated by the range specifying calculation unit is displayed so as to overlap the blood flow velocity gradient distribution. - 請求項1に記載の超音波撮像装置において、
前記信号処理部は、前記エコー信号から前記検査対象の断層画像を形成する断層画像形成部を備え、
前記壁面速度勾配演算部は、前記断層画像から特定される血管壁面の位置情報と、前記範囲特定演算部が算出した所定の範囲内の測定点における血流速度および血流速度勾配の値から、血管壁面における血流速度勾配の推定値を算出することを特徴とする超音波撮像装置。 The ultrasonic imaging apparatus according to claim 1,
The signal processing unit includes a tomographic image forming unit that forms a tomographic image of the inspection target from the echo signal,
The wall surface velocity gradient calculation unit is based on the position information of the blood vessel wall surface identified from the tomographic image and the blood flow velocity and the blood flow velocity gradient value at the measurement points within the predetermined range calculated by the range identification calculation unit. An ultrasonic imaging apparatus that calculates an estimated value of a blood flow velocity gradient on a blood vessel wall surface. - 請求項6に記載の超音波撮像装置において、
前記信号処理部で得られた情報を表示する表示部を備え、
前記信号処理部は、前記エコー信号から前記検査対象の断層画像を形成する断層画像形成部を備え、
前記表示部は、前記検査対象の診断指標となる情報を前記断層画像に重ねて、空間分布図として表示することを特徴とする超音波撮像装置。 The ultrasonic imaging apparatus according to claim 6,
A display unit for displaying information obtained by the signal processing unit;
The signal processing unit includes a tomographic image forming unit that forms a tomographic image of the inspection target from the echo signal,
The ultrasonic imaging apparatus, wherein the display unit superimposes information serving as a diagnostic index of the inspection target on the tomographic image and displays the information as a spatial distribution diagram. - 請求項6に記載の超音波撮像装置において、
前記検査対象の心拍信号情報を入力する入力部と、
前記入力部および前記信号処理部で得られた情報を表示する表示部と、を備え、
前記表示部は、前記検査対象の診断指標となる情報を前記心拍信号情報とともに時系列変化で表示することを特徴とする超音波撮像装置。 The ultrasonic imaging apparatus according to claim 6,
An input unit for inputting heartbeat signal information to be examined;
A display unit for displaying information obtained by the input unit and the signal processing unit,
The ultrasonic imaging apparatus, wherein the display unit displays information serving as a diagnostic index of the inspection target together with the heartbeat signal information in a time series change. - 超音波撮像装置における演算方法であって、
検査対象が反射するエコー信号から前記検査対象の血管内における超音波照射方向の血流速度成分を抽出する工程と、前記血流速度成分に基づいて、前記血管壁面から前記血管中心へ径方向に並んだ複数の測定点における、血管壁面に沿った方向の血流速度分布を算出する工程と、
微分演算により前記血流速度分布から血流速度勾配分布を算出する工程と、
前記血流速度勾配分布において所定の範囲を算出する工程と、
前記所定の範囲内の測定点から1点以上の測定点を選択する工程と、
選択された測定点における血流速度および血流速度勾配の値から血管壁面における血流速度勾配の推定値を算出する工程と、
を備えることを特徴とする演算方法。 A calculation method in an ultrasonic imaging apparatus,
A step of extracting a blood flow velocity component in the ultrasonic irradiation direction in the blood vessel of the inspection object from an echo signal reflected by the inspection object, and a radial direction from the blood vessel wall surface to the blood vessel center based on the blood flow velocity component Calculating a blood flow velocity distribution in a direction along the blood vessel wall surface at a plurality of measurement points arranged;
Calculating a blood flow velocity gradient distribution from the blood flow velocity distribution by a differential operation;
Calculating a predetermined range in the blood flow velocity gradient distribution;
Selecting one or more measurement points from the measurement points within the predetermined range;
Calculating an estimated value of the blood flow velocity gradient in the blood vessel wall surface from the value of the blood flow velocity and the blood flow velocity gradient at the selected measurement point;
An arithmetic method comprising: - 請求項14に記載の演算方法において、
前記選択された測定点における血流速度勾配の値を用いて、前記血管壁面近傍における前記血流速度勾配分布に近似モデルを適用し、前記近似モデルにおける血流速度勾配分布の定積分が前記選択された測定点における血流速度の値と等しくなる関係に基づいて、前記選択された測定点における血流速度および血流速度勾配の値から前記血管壁面における血流速度勾配の推定値を算出することを特徴とする演算方法。 The calculation method according to claim 14,
Using the value of the blood flow velocity gradient at the selected measurement point, an approximate model is applied to the blood flow velocity gradient distribution in the vicinity of the blood vessel wall surface, and the definite integral of the blood flow velocity gradient distribution in the approximate model is the selection An estimated value of the blood flow velocity gradient at the blood vessel wall surface is calculated from the blood flow velocity at the selected measurement point and the value of the blood flow velocity gradient based on the relationship equal to the value of the blood flow velocity at the measured measurement point. An arithmetic method characterized by the above. - 請求項15に記載の演算方法において、
前記血管壁面近傍における前記血流速度勾配分布の近似モデルを1次直線とすることを特
徴とする演算方法。 The calculation method according to claim 15, wherein
A calculation method characterized in that an approximate model of the blood flow velocity gradient distribution in the vicinity of the blood vessel wall surface is a linear line.
Priority Applications (1)
| Application Number | Priority Date | Filing Date | Title |
|---|---|---|---|
| US16/308,951 US20190192111A1 (en) | 2016-07-19 | 2017-06-13 | Ultrasonic Imaging Device and Operation Method Thereof |
Applications Claiming Priority (2)
| Application Number | Priority Date | Filing Date | Title |
|---|---|---|---|
| JP2016141217A JP6668191B2 (en) | 2016-07-19 | 2016-07-19 | Ultrasound imaging apparatus and its calculation method |
| JP2016-141217 | 2016-07-19 |
Publications (1)
| Publication Number | Publication Date |
|---|---|
| WO2018016233A1 true WO2018016233A1 (en) | 2018-01-25 |
Family
ID=60992170
Family Applications (1)
| Application Number | Title | Priority Date | Filing Date |
|---|---|---|---|
| PCT/JP2017/021781 WO2018016233A1 (en) | 2016-07-19 | 2017-06-13 | Ultrasound image capture device and computation method thereof |
Country Status (3)
| Country | Link |
|---|---|
| US (1) | US20190192111A1 (en) |
| JP (1) | JP6668191B2 (en) |
| WO (1) | WO2018016233A1 (en) |
Families Citing this family (2)
| Publication number | Priority date | Publication date | Assignee | Title |
|---|---|---|---|---|
| WO2018195944A1 (en) * | 2017-04-28 | 2018-11-01 | 深圳迈瑞生物医疗电子股份有限公司 | Ultrasonic imaging apparatus and method for detecting shear index of vascular wall using ultrasonic waves |
| CN109589136B (en) * | 2018-12-29 | 2022-02-01 | 深圳开立生物医疗科技股份有限公司 | Display device and ultrasonic diagnosis system |
Citations (3)
| Publication number | Priority date | Publication date | Assignee | Title |
|---|---|---|---|---|
| JP2010042283A (en) * | 2009-10-23 | 2010-02-25 | National Institute Of Advanced Industrial & Technology | Blood dynamic characteristic measuring apparatus |
| JP2011062358A (en) * | 2009-09-17 | 2011-03-31 | Tohoku Univ | Ultrasonic diagnostic apparatus, blood flow visualization apparatus, and control program |
| JP2013132437A (en) * | 2011-12-27 | 2013-07-08 | Seiko Epson Corp | Blood pressure measurement apparatus and control method for the same |
-
2016
- 2016-07-19 JP JP2016141217A patent/JP6668191B2/en active Active
-
2017
- 2017-06-13 US US16/308,951 patent/US20190192111A1/en not_active Abandoned
- 2017-06-13 WO PCT/JP2017/021781 patent/WO2018016233A1/en active Application Filing
Patent Citations (3)
| Publication number | Priority date | Publication date | Assignee | Title |
|---|---|---|---|---|
| JP2011062358A (en) * | 2009-09-17 | 2011-03-31 | Tohoku Univ | Ultrasonic diagnostic apparatus, blood flow visualization apparatus, and control program |
| JP2010042283A (en) * | 2009-10-23 | 2010-02-25 | National Institute Of Advanced Industrial & Technology | Blood dynamic characteristic measuring apparatus |
| JP2013132437A (en) * | 2011-12-27 | 2013-07-08 | Seiko Epson Corp | Blood pressure measurement apparatus and control method for the same |
Also Published As
| Publication number | Publication date |
|---|---|
| JP6668191B2 (en) | 2020-03-18 |
| JP2018011634A (en) | 2018-01-25 |
| US20190192111A1 (en) | 2019-06-27 |
Similar Documents
| Publication | Publication Date | Title |
|---|---|---|
| US9072493B1 (en) | Ultrasonic diagnostic apparatus and elastic evaluation method | |
| US8343052B2 (en) | Ultrasonograph, medical image processing device, and medical image processing program | |
| US8465426B2 (en) | Ultrasonograph | |
| JP5627706B2 (en) | Ultrasonic imaging device, ultrasonic imaging program | |
| US20130310691A1 (en) | System, method and device for automatic and autonomous determination of hemodynamic and cardiac parameters using ultrasound | |
| US8298143B2 (en) | Ultrasonograph that determines tissue properties utilizing a reference waveform | |
| CN110415248B (en) | Blood vessel monitoring method, device, equipment and storage medium based on ultrasound | |
| KR20170085516A (en) | Imaging Methods and Apparatuses for Performing Shear Wave Elastography Imaging | |
| Cinthio et al. | Intra-observer variability of longitudinal displacement and intramural shear strain measurements of the arterial wall using ultrasound noninvasively in vivo | |
| JP2020503099A (en) | Prenatal ultrasound imaging | |
| WO2014091999A1 (en) | Ultrasonic imaging device and method | |
| JP2015126955A (en) | Ultrasonic diagnostic device and ultrasonic diagnostic method | |
| JP5736462B2 (en) | Ultrasonic imaging apparatus and method | |
| US20230142143A1 (en) | System and method for robust flow measurements in vessels | |
| Vos et al. | Contrast-enhanced high-frame-rate ultrasound imaging of flow patterns in cardiac chambers and deep vessels | |
| Hansen et al. | In vivo comparison of three ultrasound vector velocity techniques to MR phase contrast angiography | |
| US20170086792A1 (en) | Ultrasonic diagnostic device | |
| EP3181056A1 (en) | Ultrasonic image processing device | |
| WO2018016233A1 (en) | Ultrasound image capture device and computation method thereof | |
| Bazan et al. | A new high-resolution spectral approach to noninvasively evaluate wall deformations in arteries | |
| KR20130095160A (en) | Ultrasound apparatus and method for generating ultrasound image | |
| US20090299179A1 (en) | Method For Detecting Cardiac Transplant Rejection | |
| JP5885234B2 (en) | Image analysis method in disease determination apparatus and ultrasonic image forming apparatus | |
| KR20180031559A (en) | Apparatus and method for displaying ultrasound image | |
| JP2013223625A (en) | Ultrasonic image analyzer and ultrasonic image analyzing method |
Legal Events
| Date | Code | Title | Description |
|---|---|---|---|
| 121 | Ep: the epo has been informed by wipo that ep was designated in this application |
Ref document number: 17830753 Country of ref document: EP Kind code of ref document: A1 |
|
| NENP | Non-entry into the national phase |
Ref country code: DE |
|
| 122 | Ep: pct application non-entry in european phase |
Ref document number: 17830753 Country of ref document: EP Kind code of ref document: A1 |