WO2017169770A1 - Cell analysis system - Google Patents
Cell analysis system Download PDFInfo
- Publication number
- WO2017169770A1 WO2017169770A1 PCT/JP2017/010359 JP2017010359W WO2017169770A1 WO 2017169770 A1 WO2017169770 A1 WO 2017169770A1 JP 2017010359 W JP2017010359 W JP 2017010359W WO 2017169770 A1 WO2017169770 A1 WO 2017169770A1
- Authority
- WO
- WIPO (PCT)
- Prior art keywords
- cells
- cell
- image data
- control unit
- collection container
- Prior art date
Links
- 238000004458 analytical method Methods 0.000 title claims abstract description 48
- 238000001514 detection method Methods 0.000 claims abstract description 36
- 238000010186 staining Methods 0.000 claims abstract description 26
- 210000004027 cell Anatomy 0.000 claims description 188
- 210000000601 blood cell Anatomy 0.000 claims description 8
- 238000005286 illumination Methods 0.000 claims description 6
- 239000000975 dye Substances 0.000 claims description 5
- 238000003384 imaging method Methods 0.000 abstract description 23
- 239000007850 fluorescent dye Substances 0.000 description 24
- CIWBSHSKHKDKBQ-JLAZNSOCSA-N Ascorbic acid Chemical compound OC[C@H](O)[C@H]1OC(=O)C(O)=C1O CIWBSHSKHKDKBQ-JLAZNSOCSA-N 0.000 description 22
- 230000005284 excitation Effects 0.000 description 22
- 108090000623 proteins and genes Proteins 0.000 description 20
- 210000003743 erythrocyte Anatomy 0.000 description 17
- 101000835093 Homo sapiens Transferrin receptor protein 1 Proteins 0.000 description 10
- 102100026144 Transferrin receptor protein 1 Human genes 0.000 description 10
- MHMNJMPURVTYEJ-UHFFFAOYSA-N fluorescein-5-isothiocyanate Chemical compound O1C(=O)C2=CC(N=C=S)=CC=C2C21C1=CC=C(O)C=C1OC1=CC(O)=CC=C21 MHMNJMPURVTYEJ-UHFFFAOYSA-N 0.000 description 9
- 238000010586 diagram Methods 0.000 description 7
- 238000000684 flow cytometry Methods 0.000 description 7
- 210000000265 leukocyte Anatomy 0.000 description 5
- 238000000034 method Methods 0.000 description 5
- 239000000523 sample Substances 0.000 description 5
- 102000053602 DNA Human genes 0.000 description 4
- 108020004414 DNA Proteins 0.000 description 4
- 210000003855 cell nucleus Anatomy 0.000 description 4
- 239000000428 dust Substances 0.000 description 4
- 238000011084 recovery Methods 0.000 description 4
- 101000738771 Homo sapiens Receptor-type tyrosine-protein phosphatase C Proteins 0.000 description 3
- 102100037422 Receptor-type tyrosine-protein phosphatase C Human genes 0.000 description 3
- 238000012252 genetic analysis Methods 0.000 description 3
- 239000007788 liquid Substances 0.000 description 3
- YXHLJMWYDTXDHS-IRFLANFNSA-N 7-aminoactinomycin D Chemical compound C[C@H]1OC(=O)[C@H](C(C)C)N(C)C(=O)CN(C)C(=O)[C@@H]2CCCN2C(=O)[C@@H](C(C)C)NC(=O)[C@H]1NC(=O)C1=C(N)C(=O)C(C)=C2OC(C(C)=C(N)C=C3C(=O)N[C@@H]4C(=O)N[C@@H](C(N5CCC[C@H]5C(=O)N(C)CC(=O)N(C)[C@@H](C(C)C)C(=O)O[C@@H]4C)=O)C(C)C)=C3N=C21 YXHLJMWYDTXDHS-IRFLANFNSA-N 0.000 description 2
- 108700012813 7-aminoactinomycin D Proteins 0.000 description 2
- 108010004729 Phycoerythrin Proteins 0.000 description 2
- 239000001000 anthraquinone dye Substances 0.000 description 2
- 239000000427 antigen Substances 0.000 description 2
- 102000036639 antigens Human genes 0.000 description 2
- 108091007433 antigens Proteins 0.000 description 2
- 230000014509 gene expression Effects 0.000 description 2
- 210000005259 peripheral blood Anatomy 0.000 description 2
- 239000011886 peripheral blood Substances 0.000 description 2
- 239000000049 pigment Substances 0.000 description 2
- 238000003752 polymerase chain reaction Methods 0.000 description 2
- XJMOSONTPMZWPB-UHFFFAOYSA-M propidium iodide Chemical compound [I-].[I-].C12=CC(N)=CC=C2C2=CC=C(N)C=C2[N+](CCC[N+](C)(CC)CC)=C1C1=CC=CC=C1 XJMOSONTPMZWPB-UHFFFAOYSA-M 0.000 description 2
- 102000004169 proteins and genes Human genes 0.000 description 2
- INCIMLINXXICKS-UHFFFAOYSA-M pyronin Y Chemical compound [Cl-].C1=CC(=[N+](C)C)C=C2OC3=CC(N(C)C)=CC=C3C=C21 INCIMLINXXICKS-UHFFFAOYSA-M 0.000 description 2
- PRDFBSVERLRRMY-UHFFFAOYSA-N 2'-(4-ethoxyphenyl)-5-(4-methylpiperazin-1-yl)-2,5'-bibenzimidazole Chemical compound C1=CC(OCC)=CC=C1C1=NC2=CC=C(C=3NC4=CC(=CC=C4N=3)N3CCN(C)CC3)C=C2N1 PRDFBSVERLRRMY-UHFFFAOYSA-N 0.000 description 1
- FWBHETKCLVMNFS-UHFFFAOYSA-N 4',6-Diamino-2-phenylindol Chemical compound C1=CC(C(=N)N)=CC=C1C1=CC2=CC=C(C(N)=N)C=C2N1 FWBHETKCLVMNFS-UHFFFAOYSA-N 0.000 description 1
- 102000017420 CD3 protein, epsilon/gamma/delta subunit Human genes 0.000 description 1
- 108050005493 CD3 protein, epsilon/gamma/delta subunit Proteins 0.000 description 1
- 206010015150 Erythema Diseases 0.000 description 1
- 101001057504 Homo sapiens Interferon-stimulated gene 20 kDa protein Proteins 0.000 description 1
- 101001055144 Homo sapiens Interleukin-2 receptor subunit alpha Proteins 0.000 description 1
- 101001043809 Homo sapiens Interleukin-7 receptor subunit alpha Proteins 0.000 description 1
- 101000946889 Homo sapiens Monocyte differentiation antigen CD14 Proteins 0.000 description 1
- 101000716102 Homo sapiens T-cell surface glycoprotein CD4 Proteins 0.000 description 1
- 102100026878 Interleukin-2 receptor subunit alpha Human genes 0.000 description 1
- 102100021593 Interleukin-7 receptor subunit alpha Human genes 0.000 description 1
- 102100035877 Monocyte differentiation antigen CD14 Human genes 0.000 description 1
- 102100036011 T-cell surface glycoprotein CD4 Human genes 0.000 description 1
- 108010004469 allophycocyanin Proteins 0.000 description 1
- 230000005540 biological transmission Effects 0.000 description 1
- 210000004369 blood Anatomy 0.000 description 1
- 239000008280 blood Substances 0.000 description 1
- 230000004186 co-expression Effects 0.000 description 1
- 239000003086 colorant Substances 0.000 description 1
- RGWHQCVHVJXOKC-SHYZEUOFSA-N dCTP Chemical compound O=C1N=C(N)C=CN1[C@@H]1O[C@H](CO[P@](O)(=O)O[P@](O)(=O)OP(O)(O)=O)[C@@H](O)C1 RGWHQCVHVJXOKC-SHYZEUOFSA-N 0.000 description 1
- 231100000321 erythema Toxicity 0.000 description 1
- 150000002148 esters Chemical class 0.000 description 1
- 238000002073 fluorescence micrograph Methods 0.000 description 1
- 229910052736 halogen Inorganic materials 0.000 description 1
- 150000002367 halogens Chemical class 0.000 description 1
- 238000012744 immunostaining Methods 0.000 description 1
- QSHDDOUJBYECFT-UHFFFAOYSA-N mercury Chemical compound [Hg] QSHDDOUJBYECFT-UHFFFAOYSA-N 0.000 description 1
- 229910052753 mercury Inorganic materials 0.000 description 1
- 238000012986 modification Methods 0.000 description 1
- 230000004048 modification Effects 0.000 description 1
- 210000000440 neutrophil Anatomy 0.000 description 1
- 210000004940 nucleus Anatomy 0.000 description 1
- 230000003287 optical effect Effects 0.000 description 1
- 239000012488 sample solution Substances 0.000 description 1
- 241000894007 species Species 0.000 description 1
- 239000000126 substance Substances 0.000 description 1
- -1 succinimidyl ester Chemical class 0.000 description 1
- MPLHNVLQVRSVEE-UHFFFAOYSA-N texas red Chemical compound [O-]S(=O)(=O)C1=CC(S(Cl)(=O)=O)=CC=C1C(C1=CC=2CCCN3CCCC(C=23)=C1O1)=C2C1=C(CCC1)C3=[N+]1CCCC3=C2 MPLHNVLQVRSVEE-UHFFFAOYSA-N 0.000 description 1
- WFKWXMTUELFFGS-UHFFFAOYSA-N tungsten Chemical compound [W] WFKWXMTUELFFGS-UHFFFAOYSA-N 0.000 description 1
- 229910052721 tungsten Inorganic materials 0.000 description 1
- 239000010937 tungsten Substances 0.000 description 1
- 229910052724 xenon Inorganic materials 0.000 description 1
- FHNFHKCVQCLJFQ-UHFFFAOYSA-N xenon atom Chemical compound [Xe] FHNFHKCVQCLJFQ-UHFFFAOYSA-N 0.000 description 1
Images


Classifications
-
- G—PHYSICS
- G06—COMPUTING; CALCULATING OR COUNTING
- G06V—IMAGE OR VIDEO RECOGNITION OR UNDERSTANDING
- G06V20/00—Scenes; Scene-specific elements
- G06V20/60—Type of objects
- G06V20/69—Microscopic objects, e.g. biological cells or cellular parts
- G06V20/693—Acquisition
-
- C—CHEMISTRY; METALLURGY
- C12—BIOCHEMISTRY; BEER; SPIRITS; WINE; VINEGAR; MICROBIOLOGY; ENZYMOLOGY; MUTATION OR GENETIC ENGINEERING
- C12Q—MEASURING OR TESTING PROCESSES INVOLVING ENZYMES, NUCLEIC ACIDS OR MICROORGANISMS; COMPOSITIONS OR TEST PAPERS THEREFOR; PROCESSES OF PREPARING SUCH COMPOSITIONS; CONDITION-RESPONSIVE CONTROL IN MICROBIOLOGICAL OR ENZYMOLOGICAL PROCESSES
- C12Q1/00—Measuring or testing processes involving enzymes, nucleic acids or microorganisms; Compositions therefor; Processes of preparing such compositions
- C12Q1/02—Measuring or testing processes involving enzymes, nucleic acids or microorganisms; Compositions therefor; Processes of preparing such compositions involving viable microorganisms
-
- G—PHYSICS
- G01—MEASURING; TESTING
- G01N—INVESTIGATING OR ANALYSING MATERIALS BY DETERMINING THEIR CHEMICAL OR PHYSICAL PROPERTIES
- G01N15/00—Investigating characteristics of particles; Investigating permeability, pore-volume, or surface-area of porous materials
- G01N15/10—Investigating individual particles
- G01N15/14—Electro-optical investigation, e.g. flow cytometers
- G01N15/1468—Electro-optical investigation, e.g. flow cytometers with spatial resolution of the texture or inner structure of the particle
-
- G—PHYSICS
- G01—MEASURING; TESTING
- G01N—INVESTIGATING OR ANALYSING MATERIALS BY DETERMINING THEIR CHEMICAL OR PHYSICAL PROPERTIES
- G01N33/00—Investigating or analysing materials by specific methods not covered by groups G01N1/00 - G01N31/00
- G01N33/48—Biological material, e.g. blood, urine; Haemocytometers
- G01N33/483—Physical analysis of biological material
- G01N33/4833—Physical analysis of biological material of solid biological material, e.g. tissue samples, cell cultures
-
- H—ELECTRICITY
- H04—ELECTRIC COMMUNICATION TECHNIQUE
- H04N—PICTORIAL COMMUNICATION, e.g. TELEVISION
- H04N23/00—Cameras or camera modules comprising electronic image sensors; Control thereof
- H04N23/70—Circuitry for compensating brightness variation in the scene
- H04N23/71—Circuitry for evaluating the brightness variation
-
- H—ELECTRICITY
- H04—ELECTRIC COMMUNICATION TECHNIQUE
- H04N—PICTORIAL COMMUNICATION, e.g. TELEVISION
- H04N23/00—Cameras or camera modules comprising electronic image sensors; Control thereof
- H04N23/70—Circuitry for compensating brightness variation in the scene
- H04N23/73—Circuitry for compensating brightness variation in the scene by influencing the exposure time
-
- G01N15/149—
-
- G—PHYSICS
- G01—MEASURING; TESTING
- G01N—INVESTIGATING OR ANALYSING MATERIALS BY DETERMINING THEIR CHEMICAL OR PHYSICAL PROPERTIES
- G01N15/00—Investigating characteristics of particles; Investigating permeability, pore-volume, or surface-area of porous materials
- G01N15/10—Investigating individual particles
- G01N2015/1006—Investigating individual particles for cytology
-
- G—PHYSICS
- G01—MEASURING; TESTING
- G01N—INVESTIGATING OR ANALYSING MATERIALS BY DETERMINING THEIR CHEMICAL OR PHYSICAL PROPERTIES
- G01N15/00—Investigating characteristics of particles; Investigating permeability, pore-volume, or surface-area of porous materials
- G01N15/10—Investigating individual particles
- G01N15/14—Electro-optical investigation, e.g. flow cytometers
- G01N15/1468—Electro-optical investigation, e.g. flow cytometers with spatial resolution of the texture or inner structure of the particle
- G01N2015/1472—Electro-optical investigation, e.g. flow cytometers with spatial resolution of the texture or inner structure of the particle with colour
-
- G—PHYSICS
- G01—MEASURING; TESTING
- G01N—INVESTIGATING OR ANALYSING MATERIALS BY DETERMINING THEIR CHEMICAL OR PHYSICAL PROPERTIES
- G01N15/00—Investigating characteristics of particles; Investigating permeability, pore-volume, or surface-area of porous materials
- G01N15/10—Investigating individual particles
- G01N15/14—Electro-optical investigation, e.g. flow cytometers
- G01N2015/1493—Particle size
-
- G—PHYSICS
- G01—MEASURING; TESTING
- G01N—INVESTIGATING OR ANALYSING MATERIALS BY DETERMINING THEIR CHEMICAL OR PHYSICAL PROPERTIES
- G01N15/00—Investigating characteristics of particles; Investigating permeability, pore-volume, or surface-area of porous materials
- G01N15/10—Investigating individual particles
- G01N15/14—Electro-optical investigation, e.g. flow cytometers
- G01N2015/1497—Particle shape
-
- G—PHYSICS
- G01—MEASURING; TESTING
- G01N—INVESTIGATING OR ANALYSING MATERIALS BY DETERMINING THEIR CHEMICAL OR PHYSICAL PROPERTIES
- G01N21/00—Investigating or analysing materials by the use of optical means, i.e. using sub-millimetre waves, infrared, visible or ultraviolet light
- G01N21/62—Systems in which the material investigated is excited whereby it emits light or causes a change in wavelength of the incident light
- G01N21/63—Systems in which the material investigated is excited whereby it emits light or causes a change in wavelength of the incident light optically excited
- G01N21/64—Fluorescence; Phosphorescence
- G01N21/6428—Measuring fluorescence of fluorescent products of reactions or of fluorochrome labelled reactive substances, e.g. measuring quenching effects, using measuring "optrodes"
-
- G—PHYSICS
- G06—COMPUTING; CALCULATING OR COUNTING
- G06T—IMAGE DATA PROCESSING OR GENERATION, IN GENERAL
- G06T2207/00—Indexing scheme for image analysis or image enhancement
- G06T2207/10—Image acquisition modality
- G06T2207/10064—Fluorescence image
-
- G—PHYSICS
- G06—COMPUTING; CALCULATING OR COUNTING
- G06T—IMAGE DATA PROCESSING OR GENERATION, IN GENERAL
- G06T2207/00—Indexing scheme for image analysis or image enhancement
- G06T2207/30—Subject of image; Context of image processing
- G06T2207/30004—Biomedical image processing
- G06T2207/30024—Cell structures in vitro; Tissue sections in vitro
-
- G—PHYSICS
- G06—COMPUTING; CALCULATING OR COUNTING
- G06T—IMAGE DATA PROCESSING OR GENERATION, IN GENERAL
- G06T7/00—Image analysis
- G06T7/50—Depth or shape recovery
-
- G—PHYSICS
- G06—COMPUTING; CALCULATING OR COUNTING
- G06T—IMAGE DATA PROCESSING OR GENERATION, IN GENERAL
- G06T7/00—Image analysis
- G06T7/60—Analysis of geometric attributes
- G06T7/62—Analysis of geometric attributes of area, perimeter, diameter or volume
-
- G—PHYSICS
- G06—COMPUTING; CALCULATING OR COUNTING
- G06T—IMAGE DATA PROCESSING OR GENERATION, IN GENERAL
- G06T7/00—Image analysis
- G06T7/90—Determination of colour characteristics
Definitions
- the present invention relates to a cell analysis system.
- Patent Document 1 in order to confirm that a cell is derived from a donor by examining the co-expression of up to four types of cell surface markers existing on individual donor cells using flow cytometry, Sorting with a cell sorter.
- PCR polymerase chain reaction
- the present invention has been made in view of such circumstances, and an object thereof is to provide a cell analysis system capable of maintaining only target cells in a fresh state.
- a cell analysis system includes a detection device that detects a staining intensity of a stained cell, a collection container that collects a plurality of cells whose staining intensity is detected by the detection device, and a stained cell
- a control unit that determines the priority order for acquiring image data based on the detection result based on the staining intensity, and an image that acquires the image data of the cells collected in the recovery container based on the priority order determined by the control unit An imaging device.
- control unit determines the conditions for acquiring image data based on the detection result based on the staining intensity of the stained cells.
- control unit limits the number of cells from which image data is acquired based on the detection result of the stained cells based on the staining intensity and the number of cells collected in the collection container.
- control unit limits the number of cells from which image data is acquired based on a detection result based on the staining intensity of the stained cells and a time during which the cells are collected in the collection container.
- the cells are stained with a plurality of staining species.
- control unit determines whether to analyze the cells collected in the collection container based on the image data.
- the cell is a blood cell.
- the conditions include at least one of an exposure time when acquiring image data, an observation magnification, a wavelength of illumination light, and a wavelength of observation light.
- At least one of cell morphology, color, size, and staining intensity is analyzed based on the image data.
- the cell analysis system of the present invention only target cells can be maintained in a fresh state, and cell analysis can be performed efficiently.
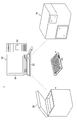
- FIG. 1 is a schematic configuration diagram of a cell analysis system.
- the cell analysis system 1 includes a detection device 10, a collection container 20, an image imaging device 30, and a personal computer 50 including a control unit 40.
- the personal computer 50 is electrically connected to the detection device 10 and the image capturing device 30.
- the personal computer 50 including the control unit 40 controls the overall operation of the cell analysis system 1.
- the personal computer 50 includes a keyboard 52 that is an operation input unit, and a display 54 that is a display unit.
- the control unit 40 includes a calculation unit that performs various processes, various programs, a storage unit that stores data, and the like.
- the detection device 10 is a device that can detect the staining intensity of the stained cells, and examples of the detection device 10 include a flow cytometer.
- a flow cytometer means an apparatus used for flow cytometry.
- a stained cell means a cell to which a chemical substance having staining information such as a dye or a dye is bound, and a preferred embodiment includes a cell to which an antibody labeled with a fluorescent dye is bound.
- the staining intensity is information related to the structure and function of the cell, and a preferred embodiment is the fluorescence intensity from the fluorescent dye that specifically binds to the cell nucleus, and is information related to the cell nucleus.
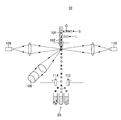
- FIG. 2 briefly explains the principle of the detection device 10.
- the sample to be analyzed includes cells C to which an antibody labeled with a fluorescent dye is bound.
- a sample solution S containing cells C is introduced into the flow cell 104 from the nozzle 102. Further, the sheath liquid L is introduced into the flow cell 104.
- the cells C are arranged in a line.
- the cell C is irradiated with, for example, laser light from the light source 106.
- the fluorescent pigment labeled with the cell C is excited by the laser light irradiation, and emits fluorescence. This fluorescence intensity is detected by the detector 108.
- the detection result of the fluorescence intensity of the cell C is input to the control unit 40 and stored.
- scattered light forward scattered light, side scattered light, etc.
- the detection result of the fluorescence intensity by the scattered light from the cell C is input to the control unit 40 and stored.
- the forward scattered light can measure the size of the cell to be measured, and the side scattered light and fluorescence can measure the structure of the cell to be measured.
- droplets containing cells C to which ultrasonic waves are applied are formed.
- the control unit 40 charges the droplet positively or negatively based on the detection result.
- the control unit 40 does not charge the droplets to be discarded.
- the charged droplets are collected by being attracted to one of the deflection electrode plates 112 and 114 and collected in the collection container 20.
- a plurality of laser light sources having different wavelengths can be used as the light source 106 for exciting the fluorescent dye.
- a fluorescence filter that cuts off the excitation light of the laser light source and selectively transmits the fluorescence wavelength from the fluorescent dye in order to detect the fluorescence intensity at the same time.
- the cell C can be stained with a plurality of fluorescent dyes.
- the antibodies specifically binding to antigens such as CD3, CD4, CD14, CD25, CD127, etc. possessed by the blood cells are labeled with a fluorescent dye and labeled.
- the antibody is preferably stained with cells, and DAPI (4′6-diamidino-2-phenylindole 4 ′, 6), which is a fluorescent dye that binds to deoxyribonucleic acid (DNA) of the cell nucleus. -diamidino-2-phenylindole).
- the combination of the excitation wavelength of the light source 106 to be used and the fluorescent filter is preferably determined according to the fluorescent dye labeled with an antibody that specifically binds to the antigen of the cell C or the fluorescent dye stained with DNA.
- fluorescent dyes that can be used in the present embodiment include propidium iodide (PI), pyronin Y (Pyronin Y), fluorescein isothiocyanate (FITC), phycoerythrin (PE), and allophycocyanin.
- PI propidium iodide
- Pyronin Y pyronin Y
- FITC fluorescein isothiocyanate
- PE phycoerythrin
- allophycocyanin APC: Allophicocyanin
- Texas Red TR®
- Hoechst 33342 7-amino-actinomycin D (7-AAD)
- 2′-deoxycytidine 5′-triphosphate Cy3
- sulfoindocyaninsk examples include cinimidyl ester (Cy5), DRAQ5 (registered trademark), Brilliant Violet 570, and Brilliant Violet 421.
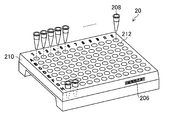
- FIG. 3A and 3B are enlarged perspective views of the collection container 20.
- the collection container 20 has a plurality of wells 202 having an opening and a bottom surface, and a side wall 204 integrally formed with the wells 202 in order to collect a plurality of cells.
- the plurality of wells 202 are arranged in rows and columns.
- numerical values indicating rows and letters indicating columns are displayed on the opening side of the wells 202 of the collection container 20.
- cells are collected in each well 202.
- an identification mark 206 such as a barcode is displayed on the side wall of the collection container 20.
- the collection container 20 in a form different from that in FIG. 3A includes a plurality of tubes 208 having openings and bottom surfaces for collecting a plurality of cells, and a plurality of tubes 208. And a support member 210 having a plurality of holes 212.
- a plurality of holes 212 are formed in rows and columns. In order to specify the position of each hole 212, numerical values indicating rows and letters indicating columns are displayed on the side of the recovery container 20 where the holes 212 are formed.
- cells are collected in each tube 208 held by the support member 210.
- an identification mark 206 such as a barcode is displayed on the side wall of the support member 210, for example.
- the tube 208 may be, for example, a single tube or a tube in which a plurality of tubes are connected.
- the tube 208 may be a tube having a cap (not shown).
- FIG. 4 is a schematic configuration diagram of the image pickup device 30.
- the image capturing device 30 can acquire image data of the cells C collected in the collection container 20.
- the image data of the cell C includes at least one of image data obtained by imaging the fluorescence emission of the stained cell C and bright field image data obtained by photographing a light transmission image of the cell C.
- the imaging device 30 includes a first light source 302 for excitation for measuring fluorescence of the cell C, a table 304 for placing the collection container 20, and a lens disposed on the well 202 side of the collection container 20. 306, a filter group including an excitation filter 308, a dichroic mirror 310, and a fluorescence filter 312, a second light source 314 disposed on the opposite side of the well 202 of the collection container 20, and fluorescence and transmitted light from the cell C And an imaging device 316 that captures images of the images.
- the second light source 314 irradiates the cell C with light for measuring transmitted light.
- the first light source 302 for example, a high pressure mercury lamp, a high pressure xenon lamp, a light emitting diode, a laser diode, a tungsten lamp, a halogen lamp, a white light emitting diode, or the like can be used. Even when these light sources are used, only the target wavelength can be transmitted by the excitation filter 308.
- the fluorescent dye that labels the antibody that binds to the cell C can be irradiated with light having a target excitation wavelength. Note that a light source similar to the first light source 302 can be used as the second light source 314.
- image data is acquired by the imaging device 316 in order to obtain fluorescence intensity from a fluorescent dye that labels an antibody that binds to the cell C.
- the light emitted from the first light source 302 is transmitted only by the excitation filter 308 in the target wavelength region.
- the light transmitted through the excitation filter 308 is reflected by the dichroic mirror 310 toward the collection container 20.
- the light reflected by the dichroic mirror 310 passes through the lens 306 and irradiates the cells C collected in the well 202.
- the light irradiated to the cell C is in a wavelength region that excites a fluorescent dye that labels the antibody that binds to the cell C.
- the fluorescent dye that labels the antibody that binds to the cell C is excited by light and emits fluorescence having a wavelength different from the irradiated excitation wavelength.
- the fluorescence from the fluorescent dye that labels the antibody that binds to the cell C is imaged by the imaging device 316 via the lens 306, the dichroic mirror 310, and the fluorescence filter 312, and image data is acquired.
- the acquired fluorescence image data is input to the control unit 40 and stored.
- the wavelength of the fluorescence is longer than that of the excitation light. Therefore, the light having the wavelength of the excitation light is reflected by the dichroic mirror 310 to the collection container 20, and the light having the wavelength of the fluorescence.
- the fluorescent filter 312 can transmit only fluorescence without transmitting excitation light. Therefore, the imaging device 316 can capture the fluorescence of the fluorescent dye that labels the antibody that binds to the cell C. Since only the fluorescence is transmitted through the fluorescent filter 312, the image captured by the imaging device 316 is not affected by the excitation light, so that accurate image data can be acquired.
- the image capturing apparatus 30 includes a table 304 and a driving device (not shown) for moving the collection container 20 to an arbitrary position (for example, the X direction, the Y direction, and the Z direction).
- the specific well 202 of the collection container 20 can be moved to the observation position by the table 304 and the driving device. It is preferable that the driving device can move the table 304 in the X direction, the Y direction, and the Z direction.
- image data of different fluorescence wavelengths is acquired by switching to different filter groups (excitation filter 308, dichroic mirror 310, and fluorescence filter 312). be able to.
- Bright field image data can be acquired by imaging the transmitted light with the imaging device 316.
- the acquired bright field image data is input to the control unit 40 and stored therein.
- Samples to be analyzed include peripheral blood containing blood cells, two types of fluorescent dye-labeled antibodies that stain cells (for example, CD45 antibody labeled with Brilliant Violet 421 and CD71 antibody labeled with FITC), double-stranded DNA
- FITC Fluorescence Activated Cell Sorting System
- a high affinity anthraquinone dye, DRAQ5 and APC are prepared, and these are mixed and incubated to stain blood cells.
- a sample to be analyzed is set in the detection device 10, and the fluorescence intensity (fluorescence, forward scattered light, and side scattered light) of the cells bound with the antibody labeled with the fluorescent dye is detected by flow cytometry. To do.
- the fluorescence intensity detected for each cell is input to the control unit 40.
- the control unit 40 stores the detected cell and the fluorescence intensity in association with each other.
- the control unit 40 stores an analysis program.
- the analysis program can perform analysis based on each cell and fluorescence intensity data.
- the control unit 40 uses BSC-A, which is the relative value of the side scattered light intensity, from the fluorescence intensity of each cell as the vertical axis and the relative value of the light intensity of the forward scattered light. Create a scattergram with a certain FSC-A as the horizontal axis. From this scattergram, nucleated red blood cells are gated (taken up), and a region (P) where nucleated red blood cells appear is fractionated.
- BSC-A is the relative value of the side scattered light intensity, from the fluorescence intensity of each cell as the vertical axis and the relative value of the light intensity of the forward scattered light.
- control unit 40 creates a scattergram for the gated nucleated red blood cells, with FSC-A as the vertical axis and CD45 antibody: Brilliant Violet 421 as the horizontal axis.
- the regions (Q1) and (Q2) where leukocytes appear from the gated nucleated red blood cells are gated out (extracted), and the region (Q3) where nucleated red blood cells excluding leukocytes appear is fractionated.
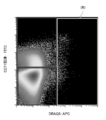
- the control unit 40 uses the relative value of the fluorescence intensity of the FITC of the CD71 antibody as the vertical axis, and DRAQ5 (anthraquinone dye) that is information on the cell nucleus.
- a scattergram is created with the horizontal axis of the relative value of the fluorescence intensity. Since the wavelength region overlaps with other fluorescent dyes, the amount of leakage into the detector of each wavelength is compensated (Compensate).
- a region (R) where CD71 positive and DRAQ5 positive nucleated red blood cells appear is fractionated from the gated nucleated red blood cells. Finally, CD71 positive nucleated red blood cells are measured.
- a cell to which an antibody labeled with a fluorescent dye is bound is analyzed by the detection device 10 based on the fluorescence intensity. Based on the analysis result, cells bound with an antibody labeled with a fluorescent dye are fractionated into a region (R) where CD71-positive nucleated red blood cells appear by the scattergrams shown in FIGS.
- About 500 cells included in the region (R) are collected in, for example, a plurality of collection containers 20 having 96 wells 202 per one, and one cell is collected in one well.
- the identification display of the collection container 20 When collecting about 500 cells in a plurality of collection containers 20, the identification display of the collection container 20, the position of the well 202 of the collection container 20, and the fluorescence intensity of each cell are associated with each other and the associated related data. Is input and stored in the control unit 40.
- the region (R) where the cells are collected is estimated based on the detection result based on the staining intensity of the cells.
- the control unit 40 determines a priority order for acquiring image data.
- the control unit 40 determines a priority order for acquiring image data based on the rating information.
- the fluorescence intensity weight can be changed as FITC fluorescence intensity of ⁇ ⁇ CD71 antibody + ⁇ ⁇ DRAQ5 fluorescence intensity ( ⁇ and ⁇ are arbitrary coefficients set in advance).
- the coefficients ⁇ and ⁇ can be determined from the total number of cells collected by flow cytometry and the number of cells to be collected.
- the ⁇ coefficient of the FITC fluorescence intensity of the CD71 antibody is increased, and if importance is attached to the detection of nuclei, the rating is increased by increasing the fluorescence intensity of DRAQ5. You can change the priority order.
- a plurality of collection containers 20 are conveyed from the detection device 10 to the image capturing device 30.
- the means for transporting the collection container 20 to the image capturing device 30 is not particularly limited.
- FIG. 8 is a plan view of the collection container 20 placed on the table 304 of the image pickup device 30.
- the identification mark 206 of the collection container 20 is read from, for example, a barcode reader or the like, and information on the collection container 20 is input to the control unit 40.
- Information on the collection container 20 can also be input to the control unit 40 from the keyboard 52.
- the collection container 20 when the collection container 20 is placed on the table 304, information on the shape of the collection container 20, information on the outer shape of the collection container 20, the opening diameter of the wells 202, the pitch between the wells 202, the number of the wells 202, etc. is input to the control unit 40.
- the control unit 40 reads the fluorescence intensity and rating information of the cells collected in the well 202 from the information of the collection container 20. Based on the read information, the control unit 40 specifies the position of the well 202 having a high priority in the collection container 20.
- the control unit 40 includes a region AR1 (A11, A12, B11, B12, C11, C12) surrounded by a solid line and a region AR2 (E11, E12, F11, F12, G11) surrounded by a solid line. G12) is identified as a well 202 having a high priority.
- an area AR3 (01, 02, 03, D04 to D12, H04 to H12) surrounded by a broken line is specified as a well 202 having a low priority.
- the control unit 40 drives the table 304 based on the priority order, and moves the imaging target well 202 to the observation position.
- the control unit 40 moves the well 202 located at A11 to the observation position, and then acquires image data of cells by the imaging device 316 of the image imaging device 30.
- the acquired image data is input to the control unit 40, and the control unit 40 stores the image data.
- the control unit 40 determines whether or not there are cells in the collection container 20 from which image data should be acquired. When the control unit 40 determines that there is a cell from which image data is to be acquired, the control unit 40 drives the table 304 to thereby complete the acquisition of the image data, for example, the well 202 of A12 at the observation position. Moving. Cell image data is acquired by the imaging device 316 of the image imaging device 30. The acquired image data is input to the control unit 40, and the control unit 40 stores the image data.
- the control unit 40 repeats the movement of the well 202 and the acquisition of image data until the control unit 40 determines that there is no cell from which image data should be acquired.
- the image capturing apparatus 30 acquires image data of only the six wells 202 out of the 96 wells 202 of the recovery container 20, and acquires the image data of the mounted recovery container 20. finish.
- the time for acquiring the image data can be shortened.
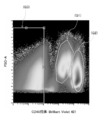
- FIG. 9 is an image diagram expressing the fluorescence color of the dye labeled on the cells collected in the well 202 by binarization.
- the fluorescence color of the cells in the well 202 is reproduced based on the staining intensity (fluorescence intensity) of the cells acquired by the detection apparatus 10.
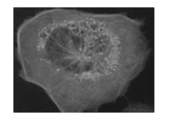
- FIG. 10A shows image data of the well 202 of G12
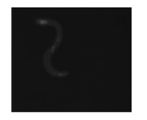
- FIG. 10B shows image data of the well 202 of G02.
- the fluorescence emission of a plurality of colors and the outline of the cell outline were confirmed. It can be judged that there is a high possibility that the target cells are collected in the well 202 of G12.
- the fluorescence emission and the outline of the cell outline were not confirmed. It can be determined that dust or dead cells were collected in the well 202 of G02.
- image data can be acquired with high probability for a target cell.
- the image capturing device 30 acquires image data of the fluorescence intensity of the cells. It is preferable that the control unit 40 determines a condition for acquiring image data based on the detection result.
- the control unit 40 preferably determines at least one of an exposure time, an observation magnification, a wavelength of illumination light, and a wavelength of observation light when acquiring image data. An example will be described.
- the detection apparatus 10 irradiates the cells with light in a wavelength region of 650 nm as excitation light.
- Cells excited by light at 650 nm and stained with Cy5 express fluorescence in the wavelength region of 670 nm.
- the detection apparatus 10 detects the fluorescence intensity in the wavelength region of 670 nm with a detector (for example, PMT: Photomultiplier Tube). From this detection result, the fluorescence intensity emitted from the cell is estimated.
- a detector for example, PMT: Photomultiplier Tube
- the control unit 40 sets the exposure time to 100 msec and the magnification to 20 times. The brighter the exposure time, the brighter the magnification.
- the control unit 40 selects an excitation filter that transmits light having a wavelength region of 650 nm that serves as excitation light.
- the excitation light becomes illumination light for illuminating the cell, and the wavelength of the illumination light is determined.
- the control unit 40 selects a fluorescent filter that does not transmit excitation light but transmits light in the wavelength region of 670 nm of fluorescence.
- the wavelength of the observation light is determined.
- the illumination light and the observation light may have different wavelengths or may have the same wavelength.
- the number of cells from which image data is acquired is limited by the control unit 40 based on the detection result of the stained cells by the staining intensity and the number of cells collected in the collection container 20. For example, there are cases where the number of cells to be subjected to gene analysis is predetermined. When the number of cells to be subjected to genetic analysis has been reached, it is preferable to end the acquisition of image data without acquiring image data for all of a plurality of cells with high priority. According to the present embodiment, it is also possible to acquire a predetermined number of image data from a plurality of cells with high priority, and not to acquire image data for all cells. By limiting the number of cells from which image data is acquired, the time for acquiring image data can be shortened.
- the number of cells from which image data is acquired is limited by the control unit 40 based on the detection result of the stained cells by the staining intensity and the time during which the cells are collected in the collection container 20.
- the freshness of cells may be required. Even when a plurality of cells having a high priority are collected in the collection container 20, the time during which the cells are collected in the collection container from the plurality of cells having a high priority, that is, the cells are collected in the collection container. It is preferable to acquire image data of cells within a certain period after being collected. According to this embodiment, it is possible to maintain the freshness of cells by limiting the time for acquiring image data.
- problems such as inability to analyze may occur when the time from blood collection to gene analysis is long. According to the cell analysis system of this embodiment, it is possible to shorten the time until the genetic analysis.
- control unit 40 determines whether to analyze the cells collected in the collection container 20 based on the image data. As a result of acquiring the image data, the cell may not be the target cell. By determining whether or not the cell analysis is performed by the control unit 40, only the target cell can be analyzed. Examples of cell analysis include gene analysis.
- ⁇ ⁇ ⁇ Based on the image data, determine the priority rank of gene analysis from the cell size. For example, when it is extremely small, it can be determined that dust is stored in the well instead of cells. If it is extremely large, it can be determined that a plurality of cells may be stored in one well. If the size is appropriate, it can be determined that there is a high possibility of a single cell.
- the rank indicating the possibility of red blood cells is determined from the color of the cells. If it is red, it is a red blood cell, and the possibility of a nucleated red blood cell increases, so it is given a high rank as a collection target. On the other hand, in the case of white, since the possibility of white blood cells and neutrophils increases, a low rank is given as a collection target.
- ⁇ ⁇ ⁇ Based on the image data, determine the rank of the priority of gene analysis from the morphology (shape) of the cells. When it is round, it can be judged as a good red blood cell, and when it is not round, it can be judged as a white blood cell or damaged red blood cell.
- the control unit 40 can determine whether or not the cell is suitable for gene analysis by combining at least one of the above analysis procedures or each of them.
- the case where the cell is a blood cell is exemplified, but the present invention is not limited to this. Moreover, although the cell collect
Landscapes
- Health & Medical Sciences (AREA)
- Life Sciences & Earth Sciences (AREA)
- Engineering & Computer Science (AREA)
- Chemical & Material Sciences (AREA)
- Physics & Mathematics (AREA)
- Biomedical Technology (AREA)
- General Health & Medical Sciences (AREA)
- Analytical Chemistry (AREA)
- Immunology (AREA)
- Biochemistry (AREA)
- General Physics & Mathematics (AREA)
- Pathology (AREA)
- Molecular Biology (AREA)
- Biophysics (AREA)
- Urology & Nephrology (AREA)
- Hematology (AREA)
- Food Science & Technology (AREA)
- Medicinal Chemistry (AREA)
- Organic Chemistry (AREA)
- Proteomics, Peptides & Aminoacids (AREA)
- Zoology (AREA)
- Wood Science & Technology (AREA)
- Dispersion Chemistry (AREA)
- Multimedia (AREA)
- Optics & Photonics (AREA)
- General Engineering & Computer Science (AREA)
- Microbiology (AREA)
- Biotechnology (AREA)
- Signal Processing (AREA)
- Bioinformatics & Cheminformatics (AREA)
- Genetics & Genomics (AREA)
- Theoretical Computer Science (AREA)
- Investigating, Analyzing Materials By Fluorescence Or Luminescence (AREA)
- Investigating Or Analysing Biological Materials (AREA)
Abstract
Description
本発明の実施形態について、図1から4を参照して説明する。図1は、細胞分析システムの概略構成図である。 <Cell analysis system>
An embodiment of the present invention will be described with reference to FIGS. FIG. 1 is a schematic configuration diagram of a cell analysis system.
次に、細胞分析システム1の動作について説明する。分析対象試料として、血球細胞を含む末梢血と、細胞を染色する2種類の蛍光色素標識抗体(たとえば、CD45抗体についてBrilliant Violet 421で標識、CD71抗体についてFITCで標識)と、二本鎖DNAに高親和性のアントラキノン色素であるDRAQ5及びAPCとを準備し、これらを混合してインキュベーションすることにより血球細胞を染色する。 <Operation of cell analysis system>
Next, the operation of the
10 検出装置
20 回収容器
30 画像撮像装置
40 制御部
50 パーソナルコンピューター
52 キーボード
54 ディスプレイ
102 ノズル
104 フローセル
106 光源
108 検知器
110 検知器
112、114 偏向電極板
202 ウェル
204 側壁
206 識別標識
208 チューブ
210 支持部材
212 孔
302 第1光源
304 テーブル
306 レンズ
308 励起フィルタ
310 ダイクロイックミラー
312 蛍光フィルタ
314 第2光源
316 撮像装置 DESCRIPTION OF
Claims (9)
- 染色された細胞の染色強度を検出する検出装置と、
前記検出装置により染色強度が検出された複数の細胞を回収する回収容器と、
前記染色された細胞の染色強度の検出結果に基づいて、画像データを取得する優先順位を決定する制御部と、
前記制御部により決定された優先順位に基づいて、前記回収容器に回収された細胞の画像データを取得する画像撮像装置と、
を備える細胞分析システム。 A detection device for detecting the staining intensity of the stained cells;
A collection container for collecting a plurality of cells whose staining intensity is detected by the detection device;
Based on the detection result of the staining intensity of the stained cells, a control unit for determining a priority order for acquiring image data;
Based on the priority determined by the control unit, an image capturing device that acquires image data of cells collected in the collection container;
A cell analysis system comprising: - 前記制御部は、前記染色された細胞の染色強度の検出結果に基づいて画像データ取得の条件を決定する請求項1に記載の細胞分析システム。 The cell analysis system according to claim 1, wherein the control unit determines a condition for acquiring image data based on a detection result of a staining intensity of the stained cells.
- 前記条件が、前記画像データを取得する際の露光時間、観察倍率、照明光の波長、及び観察光の波長の少なくとも1つ以上を含む請求項2に記載の細胞分析システム。 3. The cell analysis system according to claim 2, wherein the condition includes at least one of an exposure time when acquiring the image data, an observation magnification, a wavelength of illumination light, and a wavelength of observation light.
- 前記制御部は、前記染色された細胞の染色強度の検出結果と、前記回収容器に回収された細胞の数とに基づいて、前記画像データを取得する前記細胞の数を制限する請求項1から3の何れか一項に記載の細胞分析システム。 The control unit limits the number of the cells from which the image data is acquired based on the detection result of the staining intensity of the stained cells and the number of cells collected in the collection container. 4. The cell analysis system according to any one of 3.
- 前記制御部は、前記染色された細胞の染色強度の検出結果と、前記回収容器に前記細胞が回収されている時間とに基づいて、前記画像データを取得する前記細胞の数を制限する請求項1から3の何れか一項に記載の細胞分析システム。 The control unit limits the number of the cells from which the image data is acquired based on a detection result of a staining intensity of the stained cells and a time during which the cells are collected in the collection container. The cell analysis system according to any one of 1 to 3.
- 前記細胞が複数の種類の染料により染色される請求項1から5の何れか一項に記載の細胞分析システム。 The cell analysis system according to any one of claims 1 to 5, wherein the cells are stained with a plurality of types of dyes.
- 前記制御部は、前記画像データに基づいて、前記回収容器に回収された細胞を、細胞解析するか否かを判定する請求項1から6の何れか一項に記載の細胞分析システム。 The cell analysis system according to any one of claims 1 to 6, wherein the control unit determines whether or not to analyze a cell collected in the collection container based on the image data.
- 前記細胞が血球細胞である、請求項1から7の何れか一項に記載の細胞分析システム。 The cell analysis system according to any one of claims 1 to 7, wherein the cell is a blood cell.
- 前記画像データに基づいて、前記細胞の形態、色、大きさ、及び染色強度の少なくとも1つ以上を解析する請求項1から8の何れか一項に記載の細胞分析システム。 The cell analysis system according to any one of claims 1 to 8, wherein at least one of the morphology, color, size, and staining intensity of the cell is analyzed based on the image data.
Priority Applications (3)
| Application Number | Priority Date | Filing Date | Title |
|---|---|---|---|
| EP17774314.3A EP3438644B1 (en) | 2016-03-28 | 2017-03-15 | Cell analysis system |
| JP2018508987A JP6629429B2 (en) | 2016-03-28 | 2017-03-15 | Cell analysis system |
| US16/143,726 US20190026536A1 (en) | 2016-03-28 | 2018-09-27 | Cell analysis system |
Applications Claiming Priority (2)
| Application Number | Priority Date | Filing Date | Title |
|---|---|---|---|
| JP2016-064094 | 2016-03-28 | ||
| JP2016064094 | 2016-03-28 |
Related Child Applications (1)
| Application Number | Title | Priority Date | Filing Date |
|---|---|---|---|
| US16/143,726 Continuation US20190026536A1 (en) | 2016-03-28 | 2018-09-27 | Cell analysis system |
Publications (1)
| Publication Number | Publication Date |
|---|---|
| WO2017169770A1 true WO2017169770A1 (en) | 2017-10-05 |
Family
ID=59964330
Family Applications (1)
| Application Number | Title | Priority Date | Filing Date |
|---|---|---|---|
| PCT/JP2017/010359 WO2017169770A1 (en) | 2016-03-28 | 2017-03-15 | Cell analysis system |
Country Status (4)
| Country | Link |
|---|---|
| US (1) | US20190026536A1 (en) |
| EP (1) | EP3438644B1 (en) |
| JP (1) | JP6629429B2 (en) |
| WO (1) | WO2017169770A1 (en) |
Cited By (2)
| Publication number | Priority date | Publication date | Assignee | Title |
|---|---|---|---|---|
| WO2020129462A1 (en) * | 2018-12-21 | 2020-06-25 | ソニー株式会社 | Particle verification method, chip for capturing particles, and particle analysis system |
| JP2020134414A (en) * | 2019-02-22 | 2020-08-31 | シスメックス株式会社 | Device and method for measuring sample |
Families Citing this family (3)
| Publication number | Priority date | Publication date | Assignee | Title |
|---|---|---|---|---|
| JPWO2018100913A1 (en) * | 2016-11-29 | 2019-10-17 | ソニー株式会社 | Information processing apparatus, information processing method, program, and observation system |
| WO2022256683A1 (en) * | 2021-06-03 | 2022-12-08 | Cellchorus Inc. | Systems and devices for automated cellular profiling and methods of use thereof |
| CN114088606B (en) * | 2021-10-23 | 2023-05-09 | 广州市艾贝泰生物科技有限公司 | Cell analysis device |
Citations (7)
| Publication number | Priority date | Publication date | Assignee | Title |
|---|---|---|---|---|
| JP2001526051A (en) * | 1997-12-10 | 2001-12-18 | シエラ ダイアグノスティクス,インク. | Methods and reagents for preserving DNA in body fluids |
| JP2005257450A (en) * | 2004-03-11 | 2005-09-22 | Sysmex Corp | Sample analysis device, program, and recording medium recording its program |
| JP2010510782A (en) * | 2006-11-30 | 2010-04-08 | オリンパス ライフ サイエンス リサーチ ヨーロッパ ゲーエムベーハー | Method for performing an enzymatic reaction |
| JP2010535013A (en) * | 2007-03-14 | 2010-11-18 | シエラ モレキュラー コーポレイション | Compositions, systems and methods for storage and / or stabilization of cells and / or macromolecules |
| WO2015056516A1 (en) * | 2013-10-16 | 2015-04-23 | ソニー株式会社 | Particle fractionation device, particle fractionation method, and program |
| JP2015078927A (en) * | 2013-10-17 | 2015-04-23 | ソニー株式会社 | Particle sorter, particle sorting method and program |
| JP2015152439A (en) * | 2014-02-14 | 2015-08-24 | ソニー株式会社 | Particle sorting apparatus, particle sorting method, and program |
Family Cites Families (5)
| Publication number | Priority date | Publication date | Assignee | Title |
|---|---|---|---|---|
| JP2002310886A (en) * | 2001-04-11 | 2002-10-23 | Canon Inc | Analyzing method and device by disc cytometry |
| JP5320510B2 (en) * | 2010-11-01 | 2013-10-23 | 公益財団法人神奈川科学技術アカデミー | Cell analyzer |
| US8934698B2 (en) * | 2011-06-22 | 2015-01-13 | The Johns Hopkins University | System and device for characterizing cells |
| US20150132766A1 (en) * | 2012-03-30 | 2015-05-14 | On-Chip Cellomics Consortium | Imaging cell sorter |
| WO2014103137A1 (en) * | 2012-12-27 | 2014-07-03 | ソニー株式会社 | Cell analysis system, cell analysis program, and cell analysis method |
-
2017
- 2017-03-15 WO PCT/JP2017/010359 patent/WO2017169770A1/en active Application Filing
- 2017-03-15 EP EP17774314.3A patent/EP3438644B1/en active Active
- 2017-03-15 JP JP2018508987A patent/JP6629429B2/en not_active Expired - Fee Related
-
2018
- 2018-09-27 US US16/143,726 patent/US20190026536A1/en not_active Abandoned
Patent Citations (7)
| Publication number | Priority date | Publication date | Assignee | Title |
|---|---|---|---|---|
| JP2001526051A (en) * | 1997-12-10 | 2001-12-18 | シエラ ダイアグノスティクス,インク. | Methods and reagents for preserving DNA in body fluids |
| JP2005257450A (en) * | 2004-03-11 | 2005-09-22 | Sysmex Corp | Sample analysis device, program, and recording medium recording its program |
| JP2010510782A (en) * | 2006-11-30 | 2010-04-08 | オリンパス ライフ サイエンス リサーチ ヨーロッパ ゲーエムベーハー | Method for performing an enzymatic reaction |
| JP2010535013A (en) * | 2007-03-14 | 2010-11-18 | シエラ モレキュラー コーポレイション | Compositions, systems and methods for storage and / or stabilization of cells and / or macromolecules |
| WO2015056516A1 (en) * | 2013-10-16 | 2015-04-23 | ソニー株式会社 | Particle fractionation device, particle fractionation method, and program |
| JP2015078927A (en) * | 2013-10-17 | 2015-04-23 | ソニー株式会社 | Particle sorter, particle sorting method and program |
| JP2015152439A (en) * | 2014-02-14 | 2015-08-24 | ソニー株式会社 | Particle sorting apparatus, particle sorting method, and program |
Non-Patent Citations (1)
| Title |
|---|
| See also references of EP3438644A4 * |
Cited By (4)
| Publication number | Priority date | Publication date | Assignee | Title |
|---|---|---|---|---|
| WO2020129462A1 (en) * | 2018-12-21 | 2020-06-25 | ソニー株式会社 | Particle verification method, chip for capturing particles, and particle analysis system |
| JP7435450B2 (en) | 2018-12-21 | 2024-02-21 | ソニーグループ株式会社 | Particle confirmation method, particle capture chip, and particle analysis system |
| JP2020134414A (en) * | 2019-02-22 | 2020-08-31 | シスメックス株式会社 | Device and method for measuring sample |
| JP7348730B2 (en) | 2019-02-22 | 2023-09-21 | シスメックス株式会社 | Sample measuring device and sample measuring method |
Also Published As
| Publication number | Publication date |
|---|---|
| JP6629429B2 (en) | 2020-01-15 |
| US20190026536A1 (en) | 2019-01-24 |
| EP3438644A1 (en) | 2019-02-06 |
| EP3438644A4 (en) | 2019-04-10 |
| EP3438644B1 (en) | 2020-12-23 |
| JPWO2017169770A1 (en) | 2019-02-14 |
Similar Documents
| Publication | Publication Date | Title |
|---|---|---|
| JP6629429B2 (en) | Cell analysis system | |
| CA2676077C (en) | Method, system, and compositions for cell counting and analysis | |
| US9442106B2 (en) | Simple and affordable method for immunophenotyping using a microfluidic chip sample preparation with image cytometry | |
| EP1558934B1 (en) | A method for assessment of particles | |
| EP2210081B1 (en) | Method for the identification and handling of particles | |
| JP2015510592A (en) | Flow cytometer with digital holographic microscope | |
| US11874228B2 (en) | Methods for identification of particles in a fluid sample | |
| US20230360413A1 (en) | Methods for distinguishing particles in a fluid sample | |
| US10429387B2 (en) | Simple and affordable method for immuophenotyping using a microfluidic chip sample preparation with image cytometry | |
| US20230288427A1 (en) | Information processing apparatus, biological specimen analysis method, biological specimen detection apparatus, and biological specimen detection system | |
| US11060964B2 (en) | Cell detection method | |
| Shapiro | The cytometric future: it ain’t necessarily flow! | |
| US20190025183A1 (en) | Gene analysis method | |
| US20230333105A1 (en) | High-throughput flow cytometry analysis of highly multiplexed samples using sample indexing with specific binding member-fluor conjugates | |
| JP2000157298A (en) | Analyzing of chromosomal abnormality and apparatus | |
| Sabido | Flow cytometry (FCM) measurement of cells in suspension | |
| Tárnok et al. | Immunophenotyping using a laser scanning cytometer | |
| Franco Nitta et al. | Cellaca® PLX Image Cytometer as an Alternative for Immunophenotyping, GFP/RFP Transfection Efficiencies, and Apoptosis Analysis | |
| Baer et al. | Absolute Enumeration of Rare Cell Types in Peripheral Blood Using Laser Induced Fluorescence and Volumetric Microscopy |
Legal Events
| Date | Code | Title | Description |
|---|---|---|---|
| WWE | Wipo information: entry into national phase |
Ref document number: 2018508987 Country of ref document: JP |
|
| NENP | Non-entry into the national phase |
Ref country code: DE |
|
| WWE | Wipo information: entry into national phase |
Ref document number: 2017774314 Country of ref document: EP |
|
| ENP | Entry into the national phase |
Ref document number: 2017774314 Country of ref document: EP Effective date: 20181029 |
|
| 121 | Ep: the epo has been informed by wipo that ep was designated in this application |
Ref document number: 17774314 Country of ref document: EP Kind code of ref document: A1 |