WO2017168740A1 - Microorganism identification method - Google Patents
Microorganism identification method Download PDFInfo
- Publication number
- WO2017168740A1 WO2017168740A1 PCT/JP2016/060865 JP2016060865W WO2017168740A1 WO 2017168740 A1 WO2017168740 A1 WO 2017168740A1 JP 2016060865 W JP2016060865 W JP 2016060865W WO 2017168740 A1 WO2017168740 A1 WO 2017168740A1
- Authority
- WO
- WIPO (PCT)
- Prior art keywords
- mass
- ribosomal protein
- salmonella
- microorganism
- serotype
- Prior art date
Links
Images


Classifications
-
- G—PHYSICS
- G01—MEASURING; TESTING
- G01N—INVESTIGATING OR ANALYSING MATERIALS BY DETERMINING THEIR CHEMICAL OR PHYSICAL PROPERTIES
- G01N33/00—Investigating or analysing materials by specific methods not covered by groups G01N1/00 - G01N31/00
- G01N33/48—Biological material, e.g. blood, urine; Haemocytometers
- G01N33/50—Chemical analysis of biological material, e.g. blood, urine; Testing involving biospecific ligand binding methods; Immunological testing
- G01N33/68—Chemical analysis of biological material, e.g. blood, urine; Testing involving biospecific ligand binding methods; Immunological testing involving proteins, peptides or amino acids
- G01N33/6803—General methods of protein analysis not limited to specific proteins or families of proteins
- G01N33/6848—Methods of protein analysis involving mass spectrometry
- G01N33/6851—Methods of protein analysis involving laser desorption ionisation mass spectrometry
-
- C—CHEMISTRY; METALLURGY
- C12—BIOCHEMISTRY; BEER; SPIRITS; WINE; VINEGAR; MICROBIOLOGY; ENZYMOLOGY; MUTATION OR GENETIC ENGINEERING
- C12Q—MEASURING OR TESTING PROCESSES INVOLVING ENZYMES, NUCLEIC ACIDS OR MICROORGANISMS; COMPOSITIONS OR TEST PAPERS THEREFOR; PROCESSES OF PREPARING SUCH COMPOSITIONS; CONDITION-RESPONSIVE CONTROL IN MICROBIOLOGICAL OR ENZYMOLOGICAL PROCESSES
- C12Q1/00—Measuring or testing processes involving enzymes, nucleic acids or microorganisms; Compositions therefor; Processes of preparing such compositions
- C12Q1/02—Measuring or testing processes involving enzymes, nucleic acids or microorganisms; Compositions therefor; Processes of preparing such compositions involving viable microorganisms
- C12Q1/04—Determining presence or kind of microorganism; Use of selective media for testing antibiotics or bacteriocides; Compositions containing a chemical indicator therefor
-
- G—PHYSICS
- G01—MEASURING; TESTING
- G01N—INVESTIGATING OR ANALYSING MATERIALS BY DETERMINING THEIR CHEMICAL OR PHYSICAL PROPERTIES
- G01N27/00—Investigating or analysing materials by the use of electric, electrochemical, or magnetic means
- G01N27/62—Investigating or analysing materials by the use of electric, electrochemical, or magnetic means by investigating the ionisation of gases, e.g. aerosols; by investigating electric discharges, e.g. emission of cathode
- G01N27/64—Investigating or analysing materials by the use of electric, electrochemical, or magnetic means by investigating the ionisation of gases, e.g. aerosols; by investigating electric discharges, e.g. emission of cathode using wave or particle radiation to ionise a gas, e.g. in an ionisation chamber
-
- G—PHYSICS
- G01—MEASURING; TESTING
- G01N—INVESTIGATING OR ANALYSING MATERIALS BY DETERMINING THEIR CHEMICAL OR PHYSICAL PROPERTIES
- G01N2333/00—Assays involving biological materials from specific organisms or of a specific nature
- G01N2333/195—Assays involving biological materials from specific organisms or of a specific nature from bacteria
- G01N2333/24—Assays involving biological materials from specific organisms or of a specific nature from bacteria from Enterobacteriaceae (F), e.g. Citrobacter, Serratia, Proteus, Providencia, Morganella, Yersinia
- G01N2333/255—Salmonella (G)
-
- Y—GENERAL TAGGING OF NEW TECHNOLOGICAL DEVELOPMENTS; GENERAL TAGGING OF CROSS-SECTIONAL TECHNOLOGIES SPANNING OVER SEVERAL SECTIONS OF THE IPC; TECHNICAL SUBJECTS COVERED BY FORMER USPC CROSS-REFERENCE ART COLLECTIONS [XRACs] AND DIGESTS
- Y02—TECHNOLOGIES OR APPLICATIONS FOR MITIGATION OR ADAPTATION AGAINST CLIMATE CHANGE
- Y02A—TECHNOLOGIES FOR ADAPTATION TO CLIMATE CHANGE
- Y02A50/00—TECHNOLOGIES FOR ADAPTATION TO CLIMATE CHANGE in human health protection, e.g. against extreme weather
- Y02A50/30—Against vector-borne diseases, e.g. mosquito-borne, fly-borne, tick-borne or waterborne diseases whose impact is exacerbated by climate change
Definitions
- the present invention relates to a microorganism identification method using mass spectrometry.
- Salmonella belongs to the Enterobacteriaceae family of Gram-negative facultative anaerobes. Salmonella belongs to Salmonella enterica, Salmonella bongori and Salmonella subterranea, and Salmonella enterica has six subspecies (Salmonella (hereinafter “ (S. ⁇ enterica subsp. Houtenae, S. enterica subsp. Indica) may also be abbreviated as "S.”) (enterica subsp. Enterica, S. enterica subsp. Salamae, S. enterica subsp. being classified.
- S. Salmonella
- Non-patent Document 1 There are approximately 2500 serotypes in the genus Salmonella, which is determined by the Kaffmann-White classification based on the difference in the combination of O antigen, which is a cell wall lipopolysaccharide, and H antigen, which is a flagellar protein.
- Pathogenic salmonella such as food addictive salmonella, mostly belong to S. enterica subsp. Enterica. This subspecies is also classified into about 1500 serovars (Non-patent Document 1).
- antiserum agglutination tests are used to determine serotypes. It is a group O test by slide agglutination and a test by H type by tube agglutination. The H type test increases motility and induces phase for the determination of one phase and two phases. It takes time and skill.
- Non-typhoidal Salmonella infection routes cover a wide range of environments such as rivers, wild animals, pets, foods (including not only primary contamination but secondary contamination such as barbarians and insects), and serotype determination is infection It is important for prevention and epidemiological analysis and has been used for over 80 years (Non-Patent Document 2).
- Non-Patent Documents 3 and 4 As methods for detecting Salmonella and determining serotypes so far, multiplex PCR (Non-Patent Documents 3 and 4), pulse field gel electrophoresis (Non-Patent Document 5), multilocus sequence typing method (Non-Patent Document 6) ) Etc. have been reported. However, in multiplex PCR, only a few serotypes are determined, or only a part of O antigens and H antigens are determined, and other methods require a complicated operation and take time. is there.
- microorganism identification technology based on matrix-assisted laser desorption / ionization time-of-flight mass spectrometry (MALDI-TOF MS) has been rapidly spreading in the clinical and food fields.
- This method is a method for identifying microorganisms based on the mass spectrum pattern obtained by using a very small amount of microorganism sample, and can obtain analysis results in a short time, and it is easy to continuously analyze multiple samples. Therefore, simple and rapid microorganism identification is possible. So far, several research groups have attempted to identify Salmonella using MALDI-TOF MS (Non-Patent Documents 7, 8, 9, 10).
- Non-patent document 10 distinguishes Salmonella ⁇ ⁇ enterica subsp. Enterica subspecies and five main serotypes by selecting a biomarker and preparing a decision tree. Dieckman et al.'S study examines protein peaks very finely, but there are strains with and without biomarker peaks, and it takes time to identify the peaks.
- Patent Document 1 utilizes the fact that about half of the peak obtained by mass spectrometry of microbial cells is derived from ribosomal protein, and the mass-to-charge ratio of the peak obtained by mass spectrometry is calculated based on the base of the ribosomal protein gene. It has been shown that a method (S10-GERMS method) of assigning the type of protein from which the peak is derived by relating sequence information to a calculated mass estimated from the translated amino acid sequence is useful (Patent Document 1). ). According to this method, it is possible to perform highly reliable microorganism identification based on a theoretical basis using mass spectrometry and software attached thereto (Patent Document 2).
- the problem to be solved by the present invention is to provide a highly reliable biomarker based on genetic information, which can quickly and easily identify Salmonella enterica subsp. Enterica serotype.
- ribosomal proteins S8 and Peptidylpropyl are used as marker proteins to identify which serotype of Salmonella genus is contained by mass spectrometry. It was discovered that isomerase is useful, and that serotypes of Salmonella spp. can be quickly identified with good reproducibility by using at least one of these ribosomal proteins, and the present invention has been achieved.
- the microorganism identification method made to solve the above problems, a) mass-analyzing a sample containing microorganisms to obtain a mass spectrum; b) reading the mass-to-charge ratio m / z of the peak derived from the marker protein from the mass spectrum; c) an identification step for identifying, based on the mass-to-charge ratio m / z, which serotype of Salmonella spp.the microorganism contained in the sample comprises:
- the marker protein at least one of two kinds of ribosomal proteins S8 and Peptidylpropyl isomerase is used.
- the Salmonella serotype is Orion
- at least Peptidylpropyl isomerase is included as the marker protein.
- Salmonella serotype is Rissen
- at least S8 is included as the marker protein.
- the serotype of Salmonella spp. Is Saint Paul it is preferable that at least L21, S7, YaiA, YciF are included as the marker protein.
- the marker protein includes at least a group consisting of SOD or gns and L25.
- Salmonella serotype is ⁇ Montevideo or Schwarzengrund
- at least one of SOD and L21 and S7 are included as the marker protein.
- the serotype of Salmonella spp. Is Enteritidis it is preferable that at least SOD, L17, and S7 are included as the marker protein.
- the serotype of Salmonella spp. Is Infantis it is preferable that at least SOD, L21, S7, YibT, and YciF are included as the marker protein.
- a ribosomal protein exhibiting a mutation unique to the serotype of Salmonella spp. Is used as a marker protein
- the serotype of Salmonella spp. Can be quickly identified with good reproducibility.
- a ribosomal protein exhibiting a mutation specific to the serotype of Salmonella genus as a marker protein and performing cluster analysis using the mass-to-charge ratio m / z of the peak derived from the marker protein on the mass spectrum as an index.
- the serotypes of Salmonella spp. Contained in the sample can be collectively identified.
- the block diagram which shows the principal part of the microorganism identification system used for the microorganism identification method which concerns on this invention.
- the flowchart which shows an example of the procedure of the identification method of the microorganisms which concern on this invention.
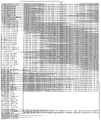
- wrist of the theoretical mass value of each ribosomal protein of Salmonella genus bacteria used in the Example, and the measured value by MALDI-TOF MS (the 1).
- wrist of the theoretical mass value of each ribosomal protein of Salmonella genus bacteria used in the Example, and the measured value by MALDI-TOF MS (the 2).
- DNA sequence of ribosomal protein S8 (part 3). DNA sequence of ribosomal protein S8 (part 4). DNA sequence of ribosomal protein L15 (part 1). DNA sequence of ribosomal protein L15 (part 2). DNA sequence of ribosomal protein L15 (part 3). DNA sequence of ribosomal protein L15 (part 4). DNA sequence of ribosomal protein L15 (part 5). DNA sequence of ribosomal protein L17 (part 1). DNA sequence of ribosomal protein L17 (part 2). DNA sequence of ribosomal protein L17 (part 3). DNA sequence of ribosomal protein L17 (part 4). DNA sequence of ribosomal protein L17 (part 5).
- DNA sequence of ribosomal protein sodA (part 1). DNA sequence of ribosomal protein sodA (part 2). DNA sequence of ribosomal protein sodA (part 3). DNA sequence of ribosomal protein sodA (part 4). DNA sequence of ribosomal protein sodA (part 5). DNA sequence of ribosomal protein sodA (part 6). DNA sequence of ribosomal protein sodA (part 7). DNA sequence of ribosomal protein L21 (part 1). DNA sequence of ribosomal protein L21 (part 2). DNA sequence of ribosomal protein L21 (part 3). DNA sequence of ribosomal protein L21 (part 4). DNA sequence of ribosomal protein L25 (part 1).
- DNA sequence of ribosomal protein L25 (part 2). DNA sequence of ribosomal protein L25 (part 3). DNA sequence of ribosomal protein S7 (part 1). DNA sequence of ribosomal protein S7 (part 2). DNA sequence of ribosomal protein S7 (part 3). DNA sequence of ribosomal protein S7 (part 4). DNA sequence of ribosomal protein S7 (part 5). DNA sequence of ribosomal protein gns (part 1). DNA sequence of ribosomal protein gns (part 2). DNA sequence of ribosomal protein yibT (part 1). DNA sequence of ribosomal protein yibT (part 2). DNA sequence of ribosomal protein ppiC (part 1).
- DNA sequence of ribosomal protein ppiC (part 2). DNA sequence of ribosomal protein yaiA. DNA sequence of ribosomal protein yciF (part 1). DNA sequence of ribosomal protein yciF (part 2). Amino acid sequence of ribosomal protein SOD (Part 1). Amino acid sequence of ribosomal protein SOD (part 2). Amino acid sequence of ribosomal protein SOD (Part 3). Amino acid sequence of ribosomal protein L17 (part 1). Amino acid sequence of ribosomal protein L17 (part 2). Amino acid sequence of ribosomal protein L21 (part 1).
- FIG. 1 is an overall view of a microorganism identification system used in a microorganism identification method according to the present invention.
- This microorganism identification system is roughly composed of a mass analysis unit 10 and a microorganism identification unit 20.
- the mass analyzer 10 is an ionization unit 11 that ionizes molecules and atoms in a sample by matrix-assisted laser desorption ionization (MALDI), and a flight that separates various ions emitted from the ionization unit 11 according to a mass-to-charge ratio.
- MALDI matrix-assisted laser desorption ionization
- a time-type mass separator (TOF) 12 is provided.
- the TOF 12 includes an extraction electrode 13 for extracting ions from the ionization unit 11 and guiding them to the ion flight space in the TOF 12, and a detector 14 for detecting ions separated in mass in the ion flight space.
- the substance of the microbe discrimination unit 20 is a computer such as a workstation or a personal computer, a central processing unit (CPU) 21 that is a central processing unit, a memory 22, a display unit 23 including an LCD (Liquid Crystal Display), a keyboard, and the like.
- An input unit 24 including a mouse and a mouse and a storage unit 30 including a large-capacity storage device such as a hard disk or an SSD (Solid State Drive) are connected to each other.
- the storage unit 30 stores an OS (Operating System) 31, a spectrum creation program 32, a genus / species determination program 33, and a lower classification determination program 35 (a program according to the present invention), as well as a first database 34 and a first database 34. 2 database 36 is stored.
- the microbe discrimination unit 20 further includes an interface (I / F) 25 for direct connection with an external device or connection with a network such as a LAN (Local Area Network) with the external apparatus.
- the interface 25 is connected to the mass spectrometer 10 via the network cable NW (or wireless LAN).
- a spectrum acquisition unit 37, an m / z reading unit 38, a lower classification determination unit 39, a cluster analysis unit 40, and a dendrogram (system diagram) creation unit 41 are shown as related to the lower classification determination program 35.
- These are basically functional means realized by software by the CPU 21 executing the lower classification determination program 35.
- the lower classification determination program 35 is not necessarily a single program, and may be a function incorporated in a genus / species determination program 33 or a part of a program for controlling the mass analyzer 10, for example.
- the form is not particularly limited.
- As the genus / species determination program 33 for example, a program for performing microorganism identification by a conventional fingerprint method can be used.
- the spectrum creation program 32, the genus / species determination program 33, the lower classification determination program 35, the first database 34, and the second database 36 are mounted on the terminal operated by the user. Is provided in another device connected to the terminal via a computer network, and processing and / or access to a database is executed by a program provided in the other device in accordance with an instruction from the terminal. It is good also as a structure to be made.
- This mass list is a list of mass-to-charge ratios of ions detected when a certain microbial cell is subjected to mass spectrometry.
- the classification group (family) to which the microbial cell belongs is listed. (Genus, species, etc.) information (classification information).
- Such a mass list is desirably created in advance based on data (actual measurement data) obtained by actually performing mass analysis on various microbial cells by the same ionization method and mass separation method as those performed by the mass analyzer 10. .
- peaks appearing in a predetermined mass-to-charge ratio range are extracted from the mass spectrum acquired as the measured data.
- the mass-to-charge ratio range is set to about 2,000 to 35,000, it is possible to extract mainly protein-derived peaks.
- the ribosomal protein group is expressed in a large amount in the cell, most of the mass-to-charge ratio described in the mass list can be derived from the ribosomal protein by appropriately setting the threshold value. .
- the mass-to-charge ratios (m / z) of the peaks extracted as described above are listed for each cell, and are added to the first database 34 after adding the classification information and the like.
- information on marker proteins for identifying known microorganisms by subordinate classification is registered.
- Information on the marker protein includes at least information on the mass-to-charge ratio (m / z) of the marker protein in known microorganisms.
- m / z mass-to-charge ratio
- at least 12 types of ribosomal proteins S8, L15, L17, and L21 are used as information on marker proteins for determining which serotype of the Salmonella genus is the test microorganism.
- the calculated mass obtained by translating the base sequence of each marker protein into the amino acid sequence and the mass-to-charge ratio detected by actual measurement are compared. It is desirable to sort them.
- the base sequence of the marker protein can be determined by sequencing, or can be obtained from a public database such as NCBI (National Center for Biotechnology Information) database.
- NCBI National Center for Biotechnology Information
- the penultimate amino acid residue is Gly, Ala, Ser, Pro, Val, Thr, or Cys
- the theoretical value is calculated assuming that the N-terminal methionine is cleaved.
- the calculated mass that is, obtained when each protein is analyzed with MALDI-TOF MS is also taken into account
- the Salmonella serotype identification procedure using the microorganism identification system according to the present embodiment will be described with reference to a flowchart.
- the user prepares a sample containing the constituent components of the test microorganism, and sets the sample in the mass analyzer 10 to execute mass analysis.
- a sample in addition to a cell extract or a cell component purified from a cell extract such as a ribosomal protein, a cell or a cell suspension can be used as it is.
- the spectrum creation program 32 acquires a detection signal obtained from the detector 14 of the mass analyzer 10 via the interface 25, and creates a mass spectrum of the test microorganism based on the detection signal (step S101).
- the species determination program 33 compares the mass spectrum of the test microorganism with a mass list of known microorganisms recorded in the first database 34, and has a mass-to-charge ratio pattern similar to the mass spectrum of the test microorganism.
- a mass list of known microorganisms for example, a mass list that contains many peaks that match each peak in the mass spectrum of the test microorganism within a predetermined error range is extracted (step S102).
- the species determination program 33 specifies the biological species to which the known microorganisms corresponding to the mass list belong by referring to the classification information stored in the first database 34 in association with the mass list extracted in step S102. (Step S103).
- this species is not Salmonella (No in step S104), the species is output as the species of the test microorganism to the display unit 23 (step S116), and the identification process is terminated. .
- the process proceeds to the identification process by the lower classification determination program 35.
- the process may be advanced to the lower classification determination program 35 without using the species determination program using the mass spectrum.
- Each ratio value is read from the second database 36 (step S105).
- the spectrum acquisition unit 37 acquires the mass spectrum of the test microorganism created in step S101.
- the m / z reading unit 38 selects a peak appearing in the mass-to-charge ratio range stored in the second database 36 in association with each marker protein on the mass spectrum as a peak corresponding to each marker protein.
- the mass-to-charge ratio is read (step S106). Then, cluster analysis is performed using the read mass-to-charge ratio as an index. Specifically, the sub-classification determination unit 39 compares the mass-to-charge ratio with the value of the mass-to-charge ratio of each marker protein read from the second database 36, and determines the protein assignment for the read mass-to-charge ratio. (Step S107). Based on the determined attribution, cluster analysis is performed to determine the serotype of the test microorganism (step S108), and that fact is output to the display unit 23 as the identification result of the test microorganism (step S109).
- the numbers shown in FIGS. 7A to 7G are the theoretical masses of the mass-to-charge ratio (m / z) determined from the genes.
- the symbols “ ⁇ ”, “ ⁇ ”, and “x” represent mass peak detection results in actual measurement. Specifically, the symbol “ ⁇ ” indicates a peak detected within the theoretical range of 500 ppm by the default peak processing setting (Threshold offset; 0.015mV, Threshold response; 1.200) of the AXIMA microorganism identification system. “X” indicates that there was a case where it could not be detected. Further, the symbol “ ⁇ ” means that the theoretical mass difference in each strain or the difference from other protein peaks is within 500 ppm, and the mass difference could not be identified even if a peak was detected.
- the ribosomal proteins L23, L16, L24, S8, L6, S5, L15, L17 encoded within the s10-spc-alpha operon, and L21, L25, S7 outside the operon, SODa, gns, YibT, Peptidylpropyl isomerase, YaiA, and YciF (total 17 types) have different theoretical mass values depending on the strain of Salmonella enterica subsp. Enterica, and are useful proteins that can be used for serotype identification of Salmonella enterica subsp. Enterica The possibility of being a marker was shown.
- L23, L16, L24, L6 and S5 have strains with a theoretical mass difference of more than 500 ppm, and it can be seen that they can be powerful biomarkers for identification of these strains. There was a stock that could not.
- SODa is an important biomarker for salmonella enterica subsp. Enterica serotype identification, but its genotype was diverse and seven different mass-to-charge ratios were confirmed. All of these mass-to-charge ratios are as large as 23,000 m / z. In this region, if the difference from other mass-to-charge ratios is not more than 800 ppm, the analysis accuracy with the currently provided MALDI-TOF MS is low, and identification Since it is not possible, four types that can be identified at present are used as biomarkers.
- the mass difference of SODa within 800 ppm was registered as 5: 22962.8 as the nearest 1: 22948.82, 6: 2296.82 and 7: 23004.88 as 2: 23010.84.
- gns, YibT, YaiA, and YciF in which contaminated peaks exist 6483.51, 803.008, 7110.89, and 18463.13 / 18653.16, respectively.
- Non-Patent Document 10 10 types of biomarkers found this time except S8 and Peptidylpropyl isomerase are reported in Non-Patent Document 10.
- confirmation of each peak is required, and it takes time to perform spectrum analysis of MALDI-TOF MS for identifying serotypes.
- the non-patent document 10 reported that the mass-to-charge ratio m / z 6036 is an important peak for Enteriridis identification. In non-patent document 10, no peak was confirmed in 5 out of 32 strains. Peaks could not be confirmed in 8 of 35 strains. For this reason, it was not used as a biomarker for serotype identification of Salmonella enterica subsp. Enterica.
- FIGS. 8A to 8D are enlarged views of 12 kinds of biomarker peak portions in the chart of FIG. As can be seen from FIG. 11 to FIG. 22, the peaks can be distinguished by shifting the mass of each biomarker. Comparison with the measured values of 12 types of biomarkers and assignment made them consistent with the results shown in FIGS. 8A to 8D.
- SODa, S7, and gns are involved in the identification of multiple serotypes and are particularly important as biomarkers for serotype identification of Salmonella enterica subsp. Enterica. Moreover, Enteritidis, Mbandaka, and Choleraesuis can be distinguished from other serotypes by the combination of mutations of SODa and S7. Furthermore, Infantis is identified by gns, and Enteritidis and Mbandaka are identified. Typhimurium, which is the highest serotype of non-typhoidal Salmonella infection-causing serotype, is divided by YaiA and Thompson by YibT.
- Pullorm (Gallinarum) is identified by L17, Rissen by S8, Orion by Peptidylpropyl isomerase, and Altona by L15. L25 separates Infantis and Amsterdam, and L21 is important for identifying Montevideo, Shwarzengrund, and Minnesota. YciF is important for Infantis identification.
Abstract
Description
a)微生物を含む試料を質量分析してマススペクトルを得るステップと、
b)前記マススペクトルから、マーカータンパク質由来のピークの質量電荷比m/zを読み取るステップと、
c)前記質量電荷比m/zに基づいて、前記試料に含まれる微生物が、Salmonella属菌のいずれの血清型の菌を含むかを識別する識別ステップと
を有し、
前記マーカータンパク質として2種類のリボソームタンパク質S8、Peptidylpropyl isomeraseの少なくとも一方を用いることを特徴とする。 That is, the microorganism identification method according to the present invention made to solve the above problems,
a) mass-analyzing a sample containing microorganisms to obtain a mass spectrum;
b) reading the mass-to-charge ratio m / z of the peak derived from the marker protein from the mass spectrum;
c) an identification step for identifying, based on the mass-to-charge ratio m / z, which serotype of Salmonella spp.the microorganism contained in the sample comprises:
As the marker protein, at least one of two kinds of ribosomal proteins S8 and Peptidylpropyl isomerase is used.
前記マーカータンパク質として、少なくとも12種類のリボソームタンパク質S8、L15、L17、L21、L25、S7、SODa、Peptidylpropyl isomerase、gns、YibT、YaiA、YciFに由来する質量電荷比m/zを指標とするクラスター解析を用いて、Salmonella属菌の血清型を分類することが好ましい。 In the above microorganism identification method,
Cluster analysis using as a marker the mass-to-charge ratio m / z derived from at least 12 kinds of ribosomal proteins S8, L15, L17, L21, L25, S7, SODa, Peptidylpropyl isomerase, gns, YibT, YaiA, YciF Is preferably used to classify Salmonella serotypes.
また、Salmonella属菌の血清型に特有な変異を示すリボソームタンパク質をマーカータンパク質として用い、マススペクトル上におけるマーカータンパク質由来のピークの質量電荷比m/zを指標としてクラスター解析を行うことにより、複数の試料に含まれるSalmonella属菌の血清型の識別を一括で行うことができる。 According to the present invention, since a ribosomal protein exhibiting a mutation unique to the serotype of Salmonella spp. Is used as a marker protein, the serotype of Salmonella spp. Can be quickly identified with good reproducibility.
In addition, by using a ribosomal protein exhibiting a mutation specific to the serotype of Salmonella genus as a marker protein and performing cluster analysis using the mass-to-charge ratio m / z of the peak derived from the marker protein on the mass spectrum as an index, The serotypes of Salmonella spp. Contained in the sample can be collectively identified.
図1は本発明に係る微生物の識別方法に用いられる微生物識別システムの全体図である。この微生物識別システムは、大別して質量分析部10と微生物判別部20とから成る。質量分析部10は、マトリックス支援レーザ脱離イオン化法(MALDI)によって試料中の分子や原子をイオン化するイオン化部11と、イオン化部11から出射された各種イオンを質量電荷比に応じて分離する飛行時間型質量分離器(TOF)12を備える。 Hereinafter, specific embodiments of the microorganism identification method according to the present invention will be described.
FIG. 1 is an overall view of a microorganism identification system used in a microorganism identification method according to the present invention. This microorganism identification system is roughly composed of a
図3に記載の通り、独立行政法人製品評価技術基盤機構バイオテクノロジーセンター(NBRC)、菌株保存機関である理化学研究所 バイオリソースセンター微生物材料開発室 (JCM)(つくば)、ナショナルバイオリソースプロジェクトGTCコレクション(岐阜)およびアメリカンタイプカルチャーコレクション(Manassas, VA, USA)から入手可能なサルモネラ菌、及び、一般財団法人日本食品分析センターの単離菌、並びに兵庫県健康生活科学研究所の単離菌、合計64株を解析に使用した。Salmonella enterica subsp. entericaの血清型は、サルモネラ免疫血清「生研」(デンカ生研株式会社)および非特許文献3、4により報告されたマルチプレックスPCR法により決定した。この方法では22の血清型に分類された。図4に、O抗原免疫血清と血清型の関係を示す。 (1) Strains used As shown in Fig. 3, the National Institute for Biotechnology, National Institute of Biotechnology, Bioresource Center (NBRC), the Biotechnology Center (NBRC), the National Institute for Biotechnology, National Institute for Biotechnology, Tsukuba, Salmonella available from Project GTC Collection (Gifu) and American Type Culture Collection (Manassas, VA, USA), isolate from Japan Food Research Center, and isolate from Hyogo Prefectural Institute for Health and Life Science A total of 64 strains were used for the analysis. The serotype of Salmonella enterica subsp. Enterica was determined by the multiplex PCR method reported by Salmonella immune serum “Seiken” (Denka Seiken Co., Ltd.) and
Escherichia coliのデータベース作成(非特許文献11)で使用したプライマーの中でSalmonella属菌と共用できないものをコンセンサス配列に基づいて設計した。設計したプライマーを図5に示す。これらのプライマーを用いてS10-spc-alphaオペロンおよびバイオマーカーとなりうるタンパク質遺伝子のDNA配列を解析した。詳述すると、各菌株より常法にてゲノム抽出し、それを鋳型としてKOD plusによりPCRを行い、目的遺伝子領域を増幅した。得られたPCR産物を精製し、それをシーケンス解析の鋳型とした。シーケンス解析にはBig Dye ver. 3.1 Cycle Sequencing Kit(アプライド・バイオシステムズ, Foster City、カリフォルニア州、米国)を用いて行った。遺伝子のDNA配列からそれぞれの遺伝子のアミノ酸配列に変換し、図6のアミノ酸質量に基づき質量電荷比を算出して、理論質量値とした。 (2) Analysis of DNA Primers used in the creation of a database of Escherichia coli (Non-patent Document 11) were designed based on consensus sequences that cannot be shared with Salmonella spp. The designed primer is shown in FIG. Using these primers, the DNA sequence of the protein gene that can serve as the S10-spc-alpha operon and biomarker was analyzed. Specifically, genomes were extracted from each strain by a conventional method, and PCR was performed using KOD plus as a template to amplify the target gene region. The obtained PCR product was purified and used as a template for sequence analysis. Sequence analysis was performed using the Big Dye ver. 3.1 Cycle Sequencing Kit (Applied Biosystems, Foster City, California, USA). The DNA sequence of the gene was converted into the amino acid sequence of each gene, and the mass-to-charge ratio was calculated based on the amino acid mass of FIG.
Luria Agar培地(Sigma-Aldrich Japan合同会社、東京、日本)に生育した菌体を回収し、およそ2コロニー分の菌体を10μLのシナピン酸マトリックス剤(50v/v%アセトニトリル、0.6 v/v%トリフルオロ酢酸溶液中に25mg/mLのシナピン酸(和光純薬工業株式会社、大阪、日本))に加えて良く撹拌し、そのうち1.2 μLをサンプルプレートに搭載し自然乾燥した。MALDI-TOF MS測定にはAXIMA微生物同定システム(島津製作所、京都市、日本)を使用し、ポジティブリニアモード、スペクトルレンジ2000m/z~35000m/zにて試料の測定を行った。上述の計算質量を測定された質量電荷比と許容誤差500ppmでマッチングし、適宜修正を施した。なお、質量分析装置のキャリブレーションには大腸菌DH5α株を用い、説明書に従い実施した。 (3) Analysis by MALDI-TOF MS The cells grown on Luria Agar medium (Sigma-Aldrich Japan GK, Tokyo, Japan) were collected, and about 2 colonies of cells were collected with 10 μL of sinapinic acid matrix agent (50v /
上記(2)で得られたリボソームタンパク質等の理論質量値と、(3)で得られたMALDI-TOF MSによるピークチャートを照合し、実測で検出できたタンパク質に関しては、遺伝子配列から求めた理論値と実測値に相違がないことを確認した。そして、S10-spc-αオペロン内のリボソームタンパク質、および菌株により異なる質量を示したその他バイオマーカーとなりうるタンパク質の理論値および実測値を、データベースとして図7A~図7Gのようにまとめた。 (4) Construction of Salmonella enterica subsp. Enterica database The theoretical mass values of ribosomal proteins obtained in (2) above can be compared with the peak chart obtained by MALDI-TOF MS obtained in (3) and detected by actual measurement. As for the protein, it was confirmed that there was no difference between the theoretical value obtained from the gene sequence and the actually measured value. Then, theoretical values and actual measured values of ribosomal proteins in the S10-spc-α operon and other biomarkers that have different masses depending on strains are summarized as databases as shown in FIGS. 7A to 7G.
以上より、菌株によらず安定して検出される8種類のタンパク質S8、L15、L17、L21、L25、S7、SODa、Peptidylpropyl isomerase と、1つの質量の有無を確認する4種のタンパク質gns、YibT、YaiAおよびYciFの計12種のタンパク質をバイオマーカーとして、その理論質量値を特許文献2に示されるようなソフトウェアに登録した。 (5) Assignment of MALDI-TOFMS measured values by software From the above, eight proteins S8, L15, L17, L21, L25, S7, SODa, Peptidylpropyl isomerase, which are stably detected regardless of the strain, The total mass of four proteins gns, YibT, YaiA, and YciF for confirming the presence or absence of mass was used as biomarkers, and their theoretical mass values were registered in software as shown in
実際に、既存のフィンガープリント方式(SARAMIS)による識別結果と、表6の示すバイオマーカー理論質量値を指標とした識別結果を比較した。まず、MALDI-TOF MSにおける実測では図9に示すようなチャートが得られた。本結果をAXIMA微生物同定システムの説明書に従いSARAMISにて解析した。これにより得られた結果を図10A及び図10Bに示す。これらの図から分かるように、試料に用いた全てのSalmonella属菌が91%~99.9%でSalmonella enterica subsp. entericaと同定され、種の識別、血清型の識別は行われなかった。 (6) Comparison with fingerprint method (SARAMIS) Actually, the identification result by the existing fingerprint method (SARAMIS) was compared with the identification result using the biomarker theoretical mass value shown in Table 6 as an index. First, an actual measurement by MALDI-TOF MS gave a chart as shown in FIG. This result was analyzed by SARAMIS according to the instructions of the AXIMA microorganism identification system. The results thus obtained are shown in FIGS. 10A and 10B. As can be seen from these figures, 91% to 99.9% of all Salmonella species used in the samples were identified as Salmonella enterica subsp. Enterica, and no species or serotype was identified.
SODa、S7、gnsが複数の血清型の識別に関与しており、Salmonella enterica subsp. entericaの血清型識別のためのバイオマーカーとして特に重要である。
また、SODaとS7の変異の組み合わせでEnteritidis、Mbandaka、Choleraesuisを他の血清型から識別することができる。
さらに、gnsによって、Infantisを識別し、EnteritidisとMbandakaを識別する。
非チフス性サルモネラ菌感染症原因血清型の上位であるTyphimuriumはYaiAによって、ThompsonはYibTによって分けられる。また、Pullorm(Gallinarum)はL17によって、RissenはS8によって、OrionはPeptidylpropyl isomeraseによって、AltonaはL15によって識別される。L25はInfantisとAmsterdamを分け、L21はMontevideoおよびShwarzengrund、Minnesotaを識別するのに重要である。YciFはInfantisの識別に重要である。 From the above, the following can be understood.
SODa, S7, and gns are involved in the identification of multiple serotypes and are particularly important as biomarkers for serotype identification of Salmonella enterica subsp. Enterica.
Moreover, Enteritidis, Mbandaka, and Choleraesuis can be distinguished from other serotypes by the combination of mutations of SODa and S7.
Furthermore, Infantis is identified by gns, and Enteritidis and Mbandaka are identified.
Typhimurium, which is the highest serotype of non-typhoidal Salmonella infection-causing serotype, is divided by YaiA and Thompson by YibT. Pullorm (Gallinarum) is identified by L17, Rissen by S8, Orion by Peptidylpropyl isomerase, and Altona by L15. L25 separates Infantis and Amsterdam, and L21 is important for identifying Montevideo, Shwarzengrund, and Minnesota. YciF is important for Infantis identification.
Salmonella enterica subsp. entericaの菌株によって異なる理論質量値を示した、S10-spc-alphaオペロン内にコードされているリボソームタンパク質S8、L15、L17と、オペロン外のSODa、L21、L25、S7、gns、YibT、Peptidylpropyl isomeraseおよびYciFの、計12種類のリボソームタンパク質の各菌株におけるDNA配列及びアミノ酸配列を図24~図47にまとめた。 (7) Biomarker gene sequence and amino acid sequence The ribosomal proteins S8, L15, L17 encoded in the S10-spc-alpha operon and different from the operon showed different theoretical mass values depending on the strain of Salmonella enterica subsp. Enterica The DNA sequence and amino acid sequence of each of 12 strains of ribosomal proteins of SODa, L21, L25, S7, gns, YibT, Peptidylpropyl isomerase and YciF are summarized in FIGS.
11…イオン化部
12…TOF
13…引き出し電極
14…検出器
20…微生物判別部
21…CPU
22…メモリ
23…表示部
24…入力部
25…I/F
30…記憶部
31…OS
32…スペクトル作成プログラム
33…属・種決定プログラム
34…第1データベース
35…下位分類決定プログラム
36…第2データベース
37…スペクトル取得部
38…m/z読み取り部
39…下位分類判定部
40…クラスター解析部
41…デンドログラム作成部 10 ...
13 ...
22 ...
30 ...
32 ...
Claims (6)
- a)微生物を含む試料を質量分析してマススペクトルを得るステップと、
b)前記マススペクトルから、マーカータンパク質由来のピークの質量電荷比m/zを読み取るステップと、
c)前記質量電荷比m/zに基づいて、前記試料に含まれる微生物が、Salmonella属菌のいずれの血清型の菌を含むかを識別する識別ステップと
を有し、
前記マーカータンパク質として2種類のリボソームタンパク質S8、Peptidylpropyl isomeraseの少なくとも一方を用いることを特徴とする微生物の識別方法。 a) mass-analyzing a sample containing microorganisms to obtain a mass spectrum;
b) reading the mass-to-charge ratio m / z of the peak derived from the marker protein from the mass spectrum;
c) an identification step for identifying, based on the mass-to-charge ratio m / z, which serotype of Salmonella spp.the microorganism contained in the sample comprises:
At least one of two types of ribosomal protein S8 and Peptidylpropyl isomerase is used as said marker protein, The microorganism identification method characterized by the above-mentioned. - 請求項1に記載の微生物の識別方法において、
前記マーカータンパク質として、少なくとも12種類のリボソームタンパク質S8、L15、L17、L21、L25、S7、SODa、Peptidylpropyl isomerase、gns、YibT、YaiA、YciFに由来する質量電荷比m/zを指標とするクラスター解析を用いて、Salmonella属菌の血清型を分類することを特徴とする識別方法。 The microorganism identification method according to claim 1,
Cluster analysis using as a marker the mass-to-charge ratio m / z derived from at least 12 types of ribosomal proteins S8, L15, L17, L21, L25, S7, SODa, Peptidylpropyl isomerase, gns, YibT, YaiA, and YciF And classifying the serotype of Salmonella spp. - 請求項2に記載の微生物の識別方法において、
前記クラスター解析による識別結果を表すデンドログラムを作成するステップを、さらに有することを特徴とする微生物の識別方法。 The method for identifying a microorganism according to claim 2,
The microorganism identification method further comprising the step of creating a dendrogram representing the identification result by the cluster analysis. - 請求項1に記載の微生物の識別方法において、
Salmonella属菌の血清型が Orionであって、
前記マーカータンパク質として少なくとも、Peptidylpropyl isomeraseを含むことを特徴とする微生物の識別方法。 The microorganism identification method according to claim 1,
The Salmonella serotype is Orion,
A microorganism identification method comprising at least Peptidylpropyl isomerase as the marker protein. - 請求項1に記載の微生物の識別方法において、
Salmonella属菌の血清型が Rissenであって、
前記マーカータンパク質として少なくとも、S8を含むことを特徴とする微生物の識別方法。 The microorganism identification method according to claim 1,
The serotype of Salmonella is Rissen,
A method for identifying a microorganism, comprising at least S8 as the marker protein. - コンピュータに請求項1~5のいずれかに記載の各ステップを実行させるためのプログラム。 A program for causing a computer to execute each step according to any one of claims 1 to 5.
Priority Applications (7)
| Application Number | Priority Date | Filing Date | Title |
|---|---|---|---|
| PCT/JP2016/060865 WO2017168740A1 (en) | 2016-03-31 | 2016-03-31 | Microorganism identification method |
| EP16896957.4A EP3438655B1 (en) | 2016-03-31 | 2016-03-31 | Microorganism identification method |
| JP2018508328A JP6692016B2 (en) | 2016-03-31 | 2016-03-31 | Microbial identification method |
| US16/089,836 US11747344B2 (en) | 2016-03-31 | 2016-03-31 | Microorganism identification method |
| CN201680084370.5A CN109313161B (en) | 2016-03-31 | 2016-03-31 | Method for identifying microorganism |
| US18/221,829 US20240077493A1 (en) | 2016-03-31 | 2023-07-13 | Microorganism identification method |
| US18/221,835 US20240060987A1 (en) | 2016-03-31 | 2023-07-13 | Microorganism identification method |
Applications Claiming Priority (1)
| Application Number | Priority Date | Filing Date | Title |
|---|---|---|---|
| PCT/JP2016/060865 WO2017168740A1 (en) | 2016-03-31 | 2016-03-31 | Microorganism identification method |
Related Child Applications (3)
| Application Number | Title | Priority Date | Filing Date |
|---|---|---|---|
| US16/089,836 A-371-Of-International US11747344B2 (en) | 2016-03-31 | 2016-03-31 | Microorganism identification method |
| US18/221,835 Continuation US20240060987A1 (en) | 2016-03-31 | 2023-07-13 | Microorganism identification method |
| US18/221,829 Division US20240077493A1 (en) | 2016-03-31 | 2023-07-13 | Microorganism identification method |
Publications (1)
| Publication Number | Publication Date |
|---|---|
| WO2017168740A1 true WO2017168740A1 (en) | 2017-10-05 |
Family
ID=59963847
Family Applications (1)
| Application Number | Title | Priority Date | Filing Date |
|---|---|---|---|
| PCT/JP2016/060865 WO2017168740A1 (en) | 2016-03-31 | 2016-03-31 | Microorganism identification method |
Country Status (5)
| Country | Link |
|---|---|
| US (3) | US11747344B2 (en) |
| EP (1) | EP3438655B1 (en) |
| JP (1) | JP6692016B2 (en) |
| CN (1) | CN109313161B (en) |
| WO (1) | WO2017168740A1 (en) |
Cited By (7)
| Publication number | Priority date | Publication date | Assignee | Title |
|---|---|---|---|---|
| JP2020054299A (en) * | 2018-10-03 | 2020-04-09 | 株式会社島津製作所 | Microorganism identification device and microorganism identification method |
| JP2020139789A (en) * | 2019-02-27 | 2020-09-03 | 株式会社島津製作所 | Preparation method of sample for microorganism analysis and analytical method of microorganism and identification method of microorganism and kit for microorganism analysis |
| JPWO2020202861A1 (en) * | 2019-04-03 | 2020-10-08 | ||
| WO2021245798A1 (en) | 2020-06-02 | 2021-12-09 | 株式会社島津製作所 | Method for identifying microorganism identification marker |
| JP7302524B2 (en) | 2020-04-23 | 2023-07-04 | 株式会社島津製作所 | Microbial analysis method |
| JP7310694B2 (en) | 2020-04-23 | 2023-07-19 | 株式会社島津製作所 | Microbial analysis method |
| JP7413911B2 (en) | 2020-04-23 | 2024-01-16 | 株式会社島津製作所 | Microbial analysis method |
Families Citing this family (1)
| Publication number | Priority date | Publication date | Assignee | Title |
|---|---|---|---|---|
| JP7365007B2 (en) * | 2020-04-27 | 2023-10-19 | 株式会社島津製作所 | Serotype determination method |
Citations (2)
| Publication number | Priority date | Publication date | Assignee | Title |
|---|---|---|---|---|
| JP2007316063A (en) * | 2006-04-28 | 2007-12-06 | National Institute Of Advanced Industrial & Technology | Method and device for quickly identifying cell |
| JP2015184020A (en) * | 2014-03-20 | 2015-10-22 | 株式会社島津製作所 | Identification method of microorganism |
Family Cites Families (10)
| Publication number | Priority date | Publication date | Assignee | Title |
|---|---|---|---|---|
| JP2003199572A (en) * | 2001-12-28 | 2003-07-15 | Eiken Chem Co Ltd | Primer for detection of salmonella and detection method using the same |
| JP4249712B2 (en) * | 2003-03-31 | 2009-04-08 | カウンシル オブ サイエンティフィク アンド インダストリアル リサーチ | Stn gene oligonucleotide primer for detecting Salmonella species and detection method using the same |
| JP5565991B2 (en) | 2004-12-15 | 2014-08-06 | 株式会社島津製作所 | Microbe species estimation system and method |
| DE102010019869B4 (en) * | 2010-05-07 | 2012-04-05 | Bruker Daltonik Gmbh | Mass spectrometric rapid detection of Salmonella |
| JP5750676B2 (en) | 2011-10-18 | 2015-07-22 | 株式会社島津製作所 | Cell identification device and program |
| US9074236B2 (en) * | 2012-05-01 | 2015-07-07 | Oxoid Limited | Apparatus and methods for microbial identification by mass spectrometry |
| CN103204936B (en) * | 2013-01-25 | 2014-06-18 | 天津商业大学 | Preparation method for polyclonal antibody to salmonella effect protein SopB |
| CN104034792B (en) * | 2014-06-26 | 2017-01-18 | 云南民族大学 | Secondary protein mass spectrum identification method based on mass-to-charge ratio error recognition capability |
| JP7413911B2 (en) * | 2020-04-23 | 2024-01-16 | 株式会社島津製作所 | Microbial analysis method |
| JP7302524B2 (en) * | 2020-04-23 | 2023-07-04 | 株式会社島津製作所 | Microbial analysis method |
-
2016
- 2016-03-31 US US16/089,836 patent/US11747344B2/en active Active
- 2016-03-31 EP EP16896957.4A patent/EP3438655B1/en active Active
- 2016-03-31 JP JP2018508328A patent/JP6692016B2/en active Active
- 2016-03-31 CN CN201680084370.5A patent/CN109313161B/en active Active
- 2016-03-31 WO PCT/JP2016/060865 patent/WO2017168740A1/en active Application Filing
-
2023
- 2023-07-13 US US18/221,835 patent/US20240060987A1/en active Pending
- 2023-07-13 US US18/221,829 patent/US20240077493A1/en active Pending
Patent Citations (2)
| Publication number | Priority date | Publication date | Assignee | Title |
|---|---|---|---|---|
| JP2007316063A (en) * | 2006-04-28 | 2007-12-06 | National Institute Of Advanced Industrial & Technology | Method and device for quickly identifying cell |
| JP2015184020A (en) * | 2014-03-20 | 2015-10-22 | 株式会社島津製作所 | Identification method of microorganism |
Non-Patent Citations (3)
| Title |
|---|
| DIECKMANN, RALF ET AL.: "Rapid Screening of Epidemiologically Important Salmonella enterica subsp. enterica Serovars by Whole- Cell Matrix- Assisted Laser Desorption Ionization-Time of Flight Mass Spectrometry", APPLIED AND ENVIRONMENTAL MICROBIOLOGY, vol. 77, no. 12, June 2011 (2011-06-01), pages 4136 - 4146, XP055548096, ISSN: 0099-2240 * |
| KANAE TERAMOTO ET AL.: "Rapid Classification and Identification of Bacteria by Matrix- Assisted Laser Desorption/Ionization-Mass Spectrometry Using Ribosomal Proteins as Biomarkers", JOURNAL OF THE MASS SPECTROMETRY SOCIETY OF JAPAN, vol. 55, no. 3, 1 June 2007 (2007-06-01), pages 209 - 216, XP055427241, ISSN: 1340-8097 * |
| TOMOHISA WATARI: "Shitsuryo Bunseki Sochi o Mochiita Biseibutsu no Dotei to Genba deno Oyo", MEDICAL TECHNOLOGY, vol. 42, no. 7, July 2014 (2014-07-01), pages 718 - 728, XP009511708, ISSN: 0389-1887 * |
Cited By (11)
| Publication number | Priority date | Publication date | Assignee | Title |
|---|---|---|---|---|
| JP2020054299A (en) * | 2018-10-03 | 2020-04-09 | 株式会社島津製作所 | Microorganism identification device and microorganism identification method |
| JP7057973B2 (en) | 2018-10-03 | 2022-04-21 | 株式会社島津製作所 | Microorganism identification device and microorganism identification method |
| JP2020139789A (en) * | 2019-02-27 | 2020-09-03 | 株式会社島津製作所 | Preparation method of sample for microorganism analysis and analytical method of microorganism and identification method of microorganism and kit for microorganism analysis |
| JPWO2020202861A1 (en) * | 2019-04-03 | 2020-10-08 | ||
| WO2020202861A1 (en) * | 2019-04-03 | 2020-10-08 | 株式会社島津製作所 | Analysis method, microbe identifying method and testing method |
| JP7205616B2 (en) | 2019-04-03 | 2023-01-17 | 株式会社島津製作所 | Analysis method, microorganism identification method and test method |
| JP7302524B2 (en) | 2020-04-23 | 2023-07-04 | 株式会社島津製作所 | Microbial analysis method |
| JP7310694B2 (en) | 2020-04-23 | 2023-07-19 | 株式会社島津製作所 | Microbial analysis method |
| JP7413911B2 (en) | 2020-04-23 | 2024-01-16 | 株式会社島津製作所 | Microbial analysis method |
| WO2021245798A1 (en) | 2020-06-02 | 2021-12-09 | 株式会社島津製作所 | Method for identifying microorganism identification marker |
| JP7364073B2 (en) | 2020-06-02 | 2023-10-18 | 株式会社島津製作所 | How to identify markers for identifying microorganisms |
Also Published As
| Publication number | Publication date |
|---|---|
| US20240077493A1 (en) | 2024-03-07 |
| JP6692016B2 (en) | 2020-05-13 |
| US20240060987A1 (en) | 2024-02-22 |
| EP3438655A4 (en) | 2020-01-15 |
| CN109313161B (en) | 2021-05-07 |
| US11747344B2 (en) | 2023-09-05 |
| CN109313161A (en) | 2019-02-05 |
| JPWO2017168740A1 (en) | 2019-03-22 |
| EP3438655B1 (en) | 2021-02-17 |
| EP3438655A1 (en) | 2019-02-06 |
| US20200300862A1 (en) | 2020-09-24 |
Similar Documents
| Publication | Publication Date | Title |
|---|---|---|
| WO2017168740A1 (en) | Microorganism identification method | |
| Paauw et al. | Rapid and reliable discrimination between Shigella species and Escherichia coli using MALDI-TOF mass spectrometry | |
| Sauget et al. | Can MALDI-TOF mass spectrometry reasonably type bacteria? | |
| JP6864855B2 (en) | How to identify microorganisms | |
| Welker et al. | Applications of whole-cell matrix-assisted laser-desorption/ionization time-of-flight mass spectrometry in systematic microbiology | |
| Murray | Matrix-assisted laser desorption ionization time-of-flight mass spectrometry: usefulness for taxonomy and epidemiology | |
| Dieckmann et al. | Rapid classification and identification of salmonellae at the species and subspecies levels by whole-cell matrix-assisted laser desorption ionization-time of flight mass spectrometry | |
| Fournier et al. | Modern clinical microbiology: new challenges and solutions | |
| Dieckmann et al. | Rapid screening of epidemiologically important Salmonella enterica subsp. enterica serovars by whole-cell matrix-assisted laser desorption ionization–time of flight mass spectrometry | |
| Van Belkum et al. | Biomedical mass spectrometry in today's and tomorrow's clinical microbiology laboratories | |
| Ojima-Kato et al. | Matrix-assisted Laser Desorption Ionization-Time of Flight Mass Spectrometry (MALDI-TOF MS) can precisely discriminate the lineages of Listeria monocytogenes and species of Listeria | |
| Khan et al. | Plasma antibody profiles as diagnostic biomarkers for tuberculosis | |
| JP6709434B2 (en) | Microbial identification method | |
| Karger | Current developments to use linear MALDI‐TOF spectra for the identification and typing of bacteria and the characterization of other cells/organisms related to infectious diseases | |
| Calderaro et al. | Leptospira species and serovars identified by MALDI-TOF mass spectrometry after database implementation | |
| Veenemans et al. | Comparison of MALDI-TOF MS and AFLP for strain typing of ESBL-producing Escherichia coli | |
| Del Chierico et al. | Proteomics boosts translational and clinical microbiology | |
| Sonthayanon et al. | Whole cell matrix assisted laser desorption/ionization time-of-flight mass spectrometry (MALDI-TOF MS) for identification of Leptospira spp. in Thailand and Lao PDR | |
| Bajaj et al. | Accurate identification of closely related mycobacterium tuberculosis complex species by high resolution tandem mass spectrometry | |
| JP6934650B2 (en) | How to identify microorganisms | |
| JP7413911B2 (en) | Microbial analysis method | |
| Poeta et al. | Tuberculosis in the 21th century: Current status of diagnostic methods | |
| Xiao et al. | A novel approach for differentiating pathogenic and non-pathogenic Leptospira based on molecular fingerprinting | |
| Rothen et al. | A simple, rapid typing method for Streptococcus agalactiae based on ribosomal subunit proteins by MALDI-TOF MS | |
| Slavov et al. | Feature selection from mass spectra of bacteria for serotyping Salmonella |
Legal Events
| Date | Code | Title | Description |
|---|---|---|---|
| WWE | Wipo information: entry into national phase |
Ref document number: 2018508328 Country of ref document: JP |
|
| NENP | Non-entry into the national phase |
Ref country code: DE |
|
| WWE | Wipo information: entry into national phase |
Ref document number: 2016896957 Country of ref document: EP |
|
| ENP | Entry into the national phase |
Ref document number: 2016896957 Country of ref document: EP Effective date: 20181031 |
|
| 121 | Ep: the epo has been informed by wipo that ep was designated in this application |
Ref document number: 16896957 Country of ref document: EP Kind code of ref document: A1 |