Verfahren und Mittel zur Diagnostik von Tumoren Method and means for the diagnosis of tumors
Die Erfindung betrifft Verfahren und Mittel zur Diagnostik von Tumoren, insbesondere zur Frühdiagnostik (Vorsorge) und zur Unterscheidung von benignen und malignen Tumoren mittels PCR, insbesondere in Körperflüssigkeiten The invention relates to methods and means for the diagnosis of tumors, in particular for early diagnosis (precaution) and for the differentiation of benign and malignant tumors by means of PCR, in particular in body fluids
Für die Prognose von Krebserkrankungen, wie Prostata- und Brustkrebs wie auch anderen soliden Tumoren, ist der Zeitpunkt der Diagnosestellung von entscheidender Bedeutung. So hängen die 5- bzw. 10-Jahresüberlebensraten stark vom Tumorstadium ab, in dem die Erkrankung entdeckt wurde. Eine zu spät gestellte Diagnostik einer Tumorerkrankung ist oftmals mit bereits auftretenden Metastasen assoziiert. Für eine rechtzeitige Diagnostik von malignen Entartungen sind deshalb Biomarker erforderlich, die eine solche Entartung mit hoher diagnostischer Sensitivität und Spezifität frühzeitig anzeigen. Die bisher bekannten und in der klinisch-chemischen Diagnostik eingesetzten Tumormarker haben sich bisher nur für die Verlaufskontrolle von Tumorpatienten nach therapeutischen Interventionen bewährt, sie erlauben jedoch bis auf wenige Ausnahmen keinen Einsatz in der Frühdiagnostik (Screening bzw. Vorsorge) von Tumorerkrankungen. Hier sind die diagnostischen Sensitivitäten und Spezifitäten noch unzureichend, um mit Hilfe dieser Biomarker Tumorerkrankte von Gesunden, insbesondere im frühen Entwicklungsstadium, sicher zu unterscheiden. For the prognosis of cancers, such as prostate and breast cancer as well as other solid tumors, the timing of the diagnosis is crucial. For example, 5- and 10-year survival rates are strongly dependent on the tumor stage in which the disease was detected. A late diagnosis of a tumor disease is often associated with metastases already occurring. For a timely diagnosis of malignant degeneration biomarkers are therefore required that indicate such degeneration with high diagnostic sensitivity and specificity early. The tumor markers hitherto known and used in clinical-chemical diagnostics have hitherto proven only for the follow-up of tumor patients after therapeutic interventions, but they do not allow, with a few exceptions, no use in the early diagnosis (screening or prevention) of tumor diseases. Here, the diagnostic sensitivities and specificities are still insufficient to distinguish with the help of these biomarkers tumor patients of healthy, especially in the early stages of development, safely.
Tumorzellen unterscheiden sich neben sequenzabhängigen durch sequenzunabhängige epigenetische Veränderungen der DNA, wozu Hypermethylierungen zählen. Diese Tumorspezifischen Veränderungen in der DNA-Methylierung lassen sich als neue Krebsmarker nutzen (z. B. WO2012007462A1 , WO2013064163A1 , US20130022974, US201 10301050). Tumor cells differ in sequence-dependent sequence-independent epigenetic changes in DNA, including hypermethylation. These tumor-specific changes in DNA methylation can be used as new cancer markers (eg WO2012007462A1, WO2013064163A1, US20130022974, US201 10301050).
Der Nachweis dieser veränderten Methylierungsmuster von selektiven DNA-Abschnitten in Blut-, Urin- oder anderen menschlichen Körperflüssigkeiten bzw. Abstrichen und histologischen Präparaten ist bisher jedoch nur mit einer ungenügenden analytischen Sensitivität möglich. Die Bestimmung des Methylierungsgrades unterschiedlicher Zielgene erfolgt bisher hauptsächlich mit Hilfe PCR-basierter Verfahren, die sich mit Ausnahme der methylierungssensitiven Restriktionsenzymanalyse (MSRE-PCR) einer Bisulfit- Vorbehandlung von genomischer DNA anschließen. Die Nachweisgrenzen der einzelnen Methoden für die Detektion methylierter DNA sind unterschiedlich. Die Direct-BSP (Sequenzierung nach Sanger) weist eine Sensitivität von 10-20 % auf, während Pyrosequencing und MALDI-TOF-Massenspektrometrie-basierte Verfahren Sensitivitäten
von ca. 5 % erreichen [1 ,2]. MSP (methylation specific PCR), MethyLight, SMART-MSP (Sensitive Melting Analysis after Real Time-Methylation Specific PCR) und MS-HRM (methylation-sensitive high-resolution melting) verfügen über eine Nachweisempfindlichkeit zwischen 0,1 %-1 ,0 % [3-6]. Als ein wesentlicher Nachteil bisheriger PCR-basierter Methoden wird die sogenannte PCR-Bias diskutiert, ein Phänomen, wodurch methylierte und nicht-methylierte DNA-Stränge mit unterschiedlicher Effizienz vervielfältigt werden [3,4]. The detection of these altered methylation patterns of selective DNA sections in blood, urine or other human body fluids or smears and histological preparations is so far only possible with insufficient analytical sensitivity. The determination of the degree of methylation of different target genes has hitherto mainly been carried out with the aid of PCR-based methods which, with the exception of the methylation-sensitive restriction enzyme analysis (MSRE-PCR), follow a bisulfite pretreatment of genomic DNA. The detection limits of the individual methods for the detection of methylated DNA are different. The direct BSP (Sanger sequencing) has a sensitivity of 10-20%, while pyrosequencing and MALDI-TOF mass spectrometry-based method sensitivities of about 5% [1, 2]. MSP (methylation specific PCR), MethyLight, SMART-MSP (Sensitive Melting Analysis after Real Time-Methylation Specific PCR) and MS-HRM (methylation-sensitive high-resolution melting) have a detection sensitivity between 0.1% -1, 0 % [3-6]. A major disadvantage of previous PCR-based methods is the so-called PCR bias, a phenomenon whereby methylated and non-methylated DNA strands are amplified with different efficiency [3,4].
Ein weiteres Problem bisheriger Nachweisverfahren für DNA-Methylierungen stellen falschpositive Ergebnisse dar, welche aufgrund von unvollständiger Bisulfit-Umwandlung und unspezifischem Primer-Annealing insbesondere bei Verwendung methylspezifischer Primer entstehen können [4]. Außerdem ist mit keiner der genannten Methoden ein sensitiver und vor allem quantitativer Nachweis heterogen methylierter DNA-Fragmente, sogenannte EpiAllele, möglich. Eine neue Technik stellt die digitale PCR dar. Bei dieser Technik tritt keine PCR-Bias auf, da jedes DNA-Molekül in einem eigenen Reaktionskompartiment vervielfältigt wird [7, 8]. Abhängig von der zur Verfügung stehenden DNA-Menge und dem Assay-Design wurden für die dPCR Sensitivitäten von bis zu 0,001 % beschrieben [9]. Ein weiterer Vorteil dieser Technik beruht darin, dass auch ohne Verwendung von Kaiibratoren absolute Werte erzielt werden [9]. Another problem of previous detection methods for DNA methylations represent false positive results, which may arise due to incomplete bisulfite conversion and nonspecific primer annealing, especially when using methyl-specific primers [4]. In addition, none of the methods mentioned allows a sensitive and, above all, quantitative detection of heterogeneously methylated DNA fragments, so-called EpiAllele. A new technique is the digital PCR. In this technique, no PCR bias occurs because each DNA molecule is amplified in its own reaction compartment [7, 8]. Depending on the amount of DNA available and the assay design, sensitivities of up to 0.001% have been reported for the dPCR [9]. Another advantage of this technique is that absolute values are obtained even without the use of calibrators [9].
Ein kommerzieller Test, der auf dem Nachweis zellulärer epigenetischer Veränderungen wie der DNA-Methylierung als frühes und typisches Merkmal maligner Veränderungen beruht, existiert bisher nur für die Diagnostik des kolorektalen Karzinoms mit der Bestimmung des methylierten SEPT9 [10], von Gliomen durch MGMT und Lungen-Karzinomen durch SHOX2- Bestimmungen [1 1 ]. Der SEPT9-Test (Epigenomics AG, Berlin, DE) weist eine diagnostische Sensitivität von 72% und eine diagnostische Spezifität von 90% beim Nachweis eines Kolonkarzinoms auf, d.h. 10% der untersuchten Individuen wird ein pathologischer Befund zugeordnet, obwohl kein Kolonkarzinom vorliegt [10]. Für das GSTP1-Gen ist der LightMix Kit GSTP1 (Epigenomics, Berlin, DE) kommerziell erhältlich, doch auf Grund einer fehlenden hohen analytischen Sensitivität fand dieser Test in Verbindung mit der PSA-Bestimmung bisher keine breite klinisch-chemische Anwendung in der Diagnostik von Prostatakarzinomen. Der von MDxHealth vertriebene ConfimMDx-Test zum Nachweis bzw. Ausschluss eines Prostatakarzinoms in Prostata-Gewebebiopsieproben weist eine diagnostische Sensitivität von 68% und eine diagnostische Spezifität von 64% für den Nachweis von Prostatatumorzellen in den untersuchten Geweben auf, d.h. für 36% der untersuchten Gewebeproben werden pathologische Befunde erstellt, obwohl kein Prostata- Karzinom vorliegt [12].
Wie wichtig die Etablierung neuer Biomarker und die Bereitstellung entsprechender kommerzieller Testkits z. B. für die Diagnostik des Prostatakarzinoms (PCa) ist, zeigt sich in der hohen Anzahl (mehr als 150.000) der allein in Deutschland jährlich durchgeführten Prostatabiopsien, die auf Grund von PSA-Bestimmungen indiziert sind und bei denen nur in ca. 25 % der untersuchten Fälle Tumoren nachgewiesen werden [13, 14]. Die Prostatastanzbiopsie stellt ein invasives diagnostisches Verfahren dar, das in etwa 5 % der durchgeführten Biopsien mit behandlungsbedürftigen Nebenwirkungen wie Blutungen und Entzündungen einhergeht [13, 14]. Zudem werden nicht alle PCa mit Hilfe einer einmaligen Gewebebiopsie erkannt, so dass Wiederholungsuntersuchungen erforderlich sind, auch schließt ein Negativbefund das Vorliegen eines PCa nicht sicher aus [13, 14]. A commercial test based on the detection of cellular epigenetic changes, such as DNA methylation, as an early and typical feature of malignant changes, has so far existed only for the diagnosis of colorectal carcinoma with the determination of methylated SEPT9 [10], gliomas by MGMT and lungs Carcinomas by SHOX2 determinations [1 1]. The SEPT9 test (Epigenomics AG, Berlin, DE) has a diagnostic sensitivity of 72% and a diagnostic specificity of 90% in the detection of colon carcinoma, ie 10% of the examined individuals is assigned a pathological finding, although there is no colon carcinoma [10 ]. For the GSTP1 gene, the LightMix kit GSTP1 (Epigenomics, Berlin, DE) is commercially available, but due to a lack of high analytical sensitivity, this test in conjunction with the PSA determination has so far found no broad clinical-chemical application in the diagnosis of prostate cancer , MDxHealth's ConfimMDx Prostate Tissue Biopsy Samples Test for Prostate Cancer has a diagnostic sensitivity of 68% and a diagnostic specificity of 64% for the detection of prostate tumor cells in the tissues examined, ie for 36% of the tissue samples tested Pathological findings are made, although there is no prostate carcinoma [12]. How important the establishment of new biomarkers and the provision of appropriate commercial test kits z. As for the diagnosis of prostate cancer (PCa), is shown in the high number (more than 150,000) in Germany alone annually performed prostate biopsies, which are indicated on the basis of PSA determinations and in which only in about 25% of investigated cases tumors are detected [13, 14]. Prostate biopsy is an invasive diagnostic procedure that involves approximately 5% of biopsies that require treatment, such as bleeding and inflammation [13, 14]. In addition, not all PCa are detected with the help of a single tissue biopsy, so that repeat examinations are necessary, and a negative finding does not preclude the presence of a PCa [13, 14].
Aufgabe der Erfindung ist es ein verbessertes Verfahren zur Diagnostik von Tumoren sowie ein Kit zu dessen Durchführung anzugeben, welches sich insbesondere zur Frühdiagnostik (Vorsorge) und zur Unterscheidung von benignen und malignen Tumoren mittels PCR, insbesondere in Körperflüssigkeiten, eignet. The object of the invention is to provide an improved method for the diagnosis of tumors and a kit for its implementation, which is particularly suitable for early diagnosis (prevention) and for the differentiation of benign and malignant tumors by PCR, especially in body fluids.
Die Aufgabe wird gelöst durch ein Verfahren zur Diagnose einer Tumorerkrankung in einer isolierten Probe mit den Schritten a) Bisulfit-Umwandlung der DNA in der Probe (Umwandlung nicht-methylierter Cytosine in Uracil), The object is achieved by a method for diagnosing a tumor disease in an isolated sample with the steps of: a) bisulfite conversion of the DNA in the sample (conversion of non-methylated cytosines into uracil),
b) (Prä-)Amplifikation von methylierten und nicht-methylierten DNA-Sequenzen mittels PCR, wobei bevorzugt die methylierten DNA-Sequenzen (wenn sie Tumorspezifisch sind) stärker amplifiziert werden als die nicht-methylierten DNA- Sequenzen bzw. alternativ die nicht-methylierten DNA-Sequenzen (wenn sie Tumor-spezifisch sind) gegenüber methylierter DNA-Sequenzen und nachfolgend c) Quantifizierung der prä-amplifizierten methylierten und nicht-methylierten DNA mittels digitaler PCR (dPCR), wobei in der dPCR die eingesetzte Anzahl von prä- amplifizierten DNA-Kopien bevorzugt oberhalb der normalen Poisson-Verteilung liegt. b) (pre-) amplification of methylated and unmethylated DNA sequences by means of PCR, whereby preferably the methylated DNA sequences (if they are tumor-specific) are amplified more strongly than the non-methylated DNA sequences or alternatively the non-methylated ones DNA sequences (if they are tumor-specific) against methylated DNA sequences and subsequently c) quantification of the pre-amplified methylated and unmethylated DNA by means of digital PCR (dPCR), wherein in the dPCR the number of pre-amplified DNA used Copies preferably lies above the normal Poisson distribution.
Der Schritt b) beinhaltet eine Präamplifikation genomischer DNA mittels einer optimierten Bias-basierten PCR, wobei die Bias bevorzugt zugunsten der methylierten oder alternativ zugunsten der nicht-methylierten Sequenzen besteht (je nach der Spezifität für Tumor- DNA). Dieser Schritt wird daher nachfolgend auch Bias-basierte PCR-Amplifikation (BBPA) genannt. In diesem Schritt werden genomische DNA-Sequenzen, die bekanntermaßen in bösartigen Tumoren methyliert sind (nachfolgend Zielgene oder Zielsequenzen genannt)
mittels spezifischer Primerpaare jeweils so amplifiziert, dass auch korrespondierende nicht- methylierte Sequenzen (DNA aus gesunden Zellen) mitamplifiziert werden. Überraschend hat sich gezeigt, dass dadurch gegenüber einer (herkömmlichen) methyl-spezifischen PCR (MS-PCR) mit methyl-spezifischen Primern (MSP) im erfindungsgemäßen Verfahren die Anzahl falsch positiver Ergebnisse deutlich reduziert wird. Für jedes Primerpaar wird dazu bevorzugt zunächst die Bias in Abhängigkeit der MgCI2-Konzentration, Annealingtemperatur und Zyklenanzahl bestimmt. Auf diese Weise werden bei der Unterscheidung zwischen Gesund und Tumorerkrankt deutlich höhere diagnostische Spezifitäten erreicht, ohne dass die analytische Sensitivität vermindert wird. Eine hohe diagnostische Spezifität, d.h. eine niedrige Rate von falsch-positiven Befunden, ist entscheidend, ob ein Testverfahren für ein Screening bzw. Vorsorge von Tumorerkankungen eingesetzt werden kann. Vorteilhaft wird im erfindungsgemäßen Verfahren auch teilweise-methylierte DNA (sogenannte heterogen methylierte Epi-Allele) mit amplifiziert. In Schritt b) (Prä-Amplifikation) werden die Reaktionsbedingungen wie MgCI2-Konzentration und Annealingtemperatur bevorzugt so gewählt, dass unabhängig davon, wieviel nicht-methylierte Sequenzen in der zu untersuchenden Probe enthalten sind, zum überwiegenden Anteil methylierte Sequenzen vervielfältigt und bei Abwesenheit methylierter DNA-Sequenzen ausschließlich nicht- methylierte Sequenzen vervielfältigt werden. Step b) involves a pre-amplification of genomic DNA by means of an optimized bias-based PCR, the bias preferably being in favor of the methylated or alternatively in favor of the unmethylated sequences (depending on the specificity for tumor DNA). This step is therefore also referred to below as bias-based PCR amplification (BBPA). In this step, genomic DNA sequences known to be methylated in malignant tumors (hereinafter called target genes or target sequences) in each case by means of specific primer pairs so amplified that also corresponding non-methylated sequences (DNA from healthy cells) are mitamplifiziert. Surprisingly, it has been shown that in comparison to a (conventional) methyl-specific PCR (MS-PCR) with methyl-specific primers (MSP) in the method according to the invention, the number of false positive results is significantly reduced. For each primer pair, the bias is preferably first determined as a function of the MgCl 2 concentration, annealing temperature and number of cycles. In this way, distinctively higher diagnostic specificities are achieved in the distinction between healthy and tumor patients without reducing the analytical sensitivity. A high diagnostic specificity, ie a low rate of false-positive findings, is crucial as to whether a screening procedure can be used to screen for tumor cancers. Partially methylated DNA (so-called heterogeneously methylated epi-alleles) is advantageously also amplified in the process according to the invention. In step b) (pre-amplification), the reaction conditions, such as MgCl 2 concentration and annealing temperature, are preferably selected such that, regardless of how much unmethylated sequences are contained in the sample to be examined, methylated sequences predominantly multiply and methylated in the absence DNA sequences exclusively non-methylated sequences are amplified.
Der Begriff Zielgen (target of interest) oder Zielsequenz schließt dabei auch regulatorische Sequenzen mit ein, die außerhalb eines ORFs (open reading-frame) liegen. The term target gene (target of interest) or target sequence also includes regulatory sequences that lie outside an ORF (open reading frame).
Vorteilhaft hat sich gezeigt, dass im erfindungsgemäßen Verfahren die bevorzugte Präamplifikation methylierter Sequenzen auch in Proben möglich ist, in denen eine hohe Hintergrund-DNA (nicht-methylierte DNA) vorliegt. Diese stört im erfindungsgemäßen Verfahren nicht. Damit eignet sich das erfindungsgemäße Verfahren auch für die Analyse von Tumor-DNA in Körperflüssigkeiten, Abstrichen oder Gewebeproben (free circulating Tumor DNA - fc-Tumor DNA). Advantageously, it has been shown that in the method according to the invention the preferred pre-amplification of methylated sequences is also possible in samples in which a high background DNA (non-methylated DNA) is present. This does not interfere in the process according to the invention. Thus, the inventive method is also suitable for the analysis of tumor DNA in body fluids, smears or tissue samples (free circulating tumor DNA - fc tumor DNA).
In der Regel sind die methylierten DNA-Sequenzen Tumor-spezifisch und werden daher in Schritt b) stärker amplifiziert als die nicht-methylierten DNA-Sequenzen. Dies ist z. B. bei den nachfolgend bevorzugt untersuchten Zielgenen PLA2R1 , RASSF1A, GSTP1 , AOX1 , SERPINE-1 und Thrombomodulin der Fall. Es gibt allerdings auch Fälle, wie z.B. beim MGMT-Gen beim Glioblastom [15], in denen die nicht-methylierten DNA-Sequenzen Tumorspezifisch sind und die methylierten DNA-Sequenzen in gesundem Gewebe vorkommen. In diesen Fällen werden in Schritt b) bevorzugt die nicht-methylierten DNA-Sequenzen stärker amplifiziert als die methylierten DNA-Sequenzen
In Schritt c) erfolgt eine Quantifizierung mittels digitaler PCR - nachfolgend auch dPCR genannt. In den bekannten Methoden der digitalen PCR erfolgt eine Grenzverdünnung der eingesetzten DNA derart, dass in einer maximalen Anzahl von Kompartimenten kein oder genau ein DNA-Molekül vorliegt (Poisson-Verteilung). Die Erfinder haben nun überraschend herausgefunden, dass eine Erhöhung der in der dPCR eingesetzten DNA-Menge über die Poissonverteilung hinaus (z. B. werden bei 10.000 Kompartimenten mehr als 80.000 DNA- Kopien in der dPCR, d. h. mit einem KPK [Kopien pro Kompartiment]-Wert > 8 analysiert), die Spezifität und die Unterscheidung zwischen gesund und bösartiger Tumorerkrankung deutlich verbessert. Nach dem Stand der Technik ist für die dPCR eine Poissonverteilung vorliegend, wenn die KPK < 8 beträgt, da ansonsten keine Kompartimente ohne DNA-Kopien als Grundlage für die Berechnungen vorliegen [9]. In general, the methylated DNA sequences are tumor-specific and are therefore amplified more strongly in step b) than the non-methylated DNA sequences. This is z. As in the following preferably investigated target genes PLA2R1, RASSF1A, GSTP1, AOX1, SERPINE-1 and thrombomodulin the case. However, there are also cases such as the MGMT gene in glioblastoma [15], in which the non-methylated DNA sequences are tumor-specific and the methylated DNA sequences occur in healthy tissue. In these cases, in step b), preferably the non-methylated DNA sequences amplify more than the methylated DNA sequences In step c), quantification is carried out by means of digital PCR - also referred to below as dPCR. In the known methods of digital PCR, a limiting dilution of the DNA used is such that in a maximum number of compartments there is no or exactly one DNA molecule (Poisson distribution). The inventors have now surprisingly found that increasing the amount of DNA used in the dPCR beyond the Poisson distribution (eg, in 10,000 compartments, more than 80,000 DNA copies are made in the dPCR, ie with one KPK [copies per compartment]. Value> 8 analyzed), the specificity and the distinction between healthy and malignant tumor disease significantly improved. According to the state of the art, there is a Poisson distribution for the dPCR if the KPK is <8, since otherwise no compartments without DNA copies are the basis for the calculations [9].
Durch die Kombination der Schritte b) und c) - nachfolgend auch BBPA-dPCR genannt - werden einerseits vorteilhaft deutlich höhere analytische und diagnostische Sensitivitäten erreicht, andererseits ermöglicht das erfindungsgemäße Verfahren überraschend eine deutlich zuverlässigere Aussage, ob ein bösartiger Tumor vorliegt oder nicht. Damit eignet sich das Verfahren für das Früherkennungsscreening (Vorsorge). Weiter vorteilhaft ermöglicht das erfindungsgemäße Verfahren eine Unterscheidung gutartiger (benigner) von bösartigen (malignen) Tumoren und den Nachweis einer minimalen Resterkrankung (MRD) und damit der Therapieüberwachung und Verlaufskontrolle. Das Prinzip des erfindungsgemäßen Verfahrens ist anhand von Ausführungsformen in Fig. 1 zusammengefasst dargestellt. The combination of steps b) and c) - hereinafter also referred to as BBPA-dPCR - on the one hand advantageously significantly higher analytical and diagnostic sensitivities achieved, on the other hand surprisingly allows the inventive method a much more reliable statement whether a malignant tumor is present or not. This makes the procedure suitable for early detection screening (prevention). Further advantageously, the inventive method allows a distinction benign (malignant) from malignant (malignant) tumors and the detection of minimal residual disease (MRD) and thus the therapy monitoring and follow-up. The principle of the method according to the invention is summarized on the basis of embodiments in FIG. 1.
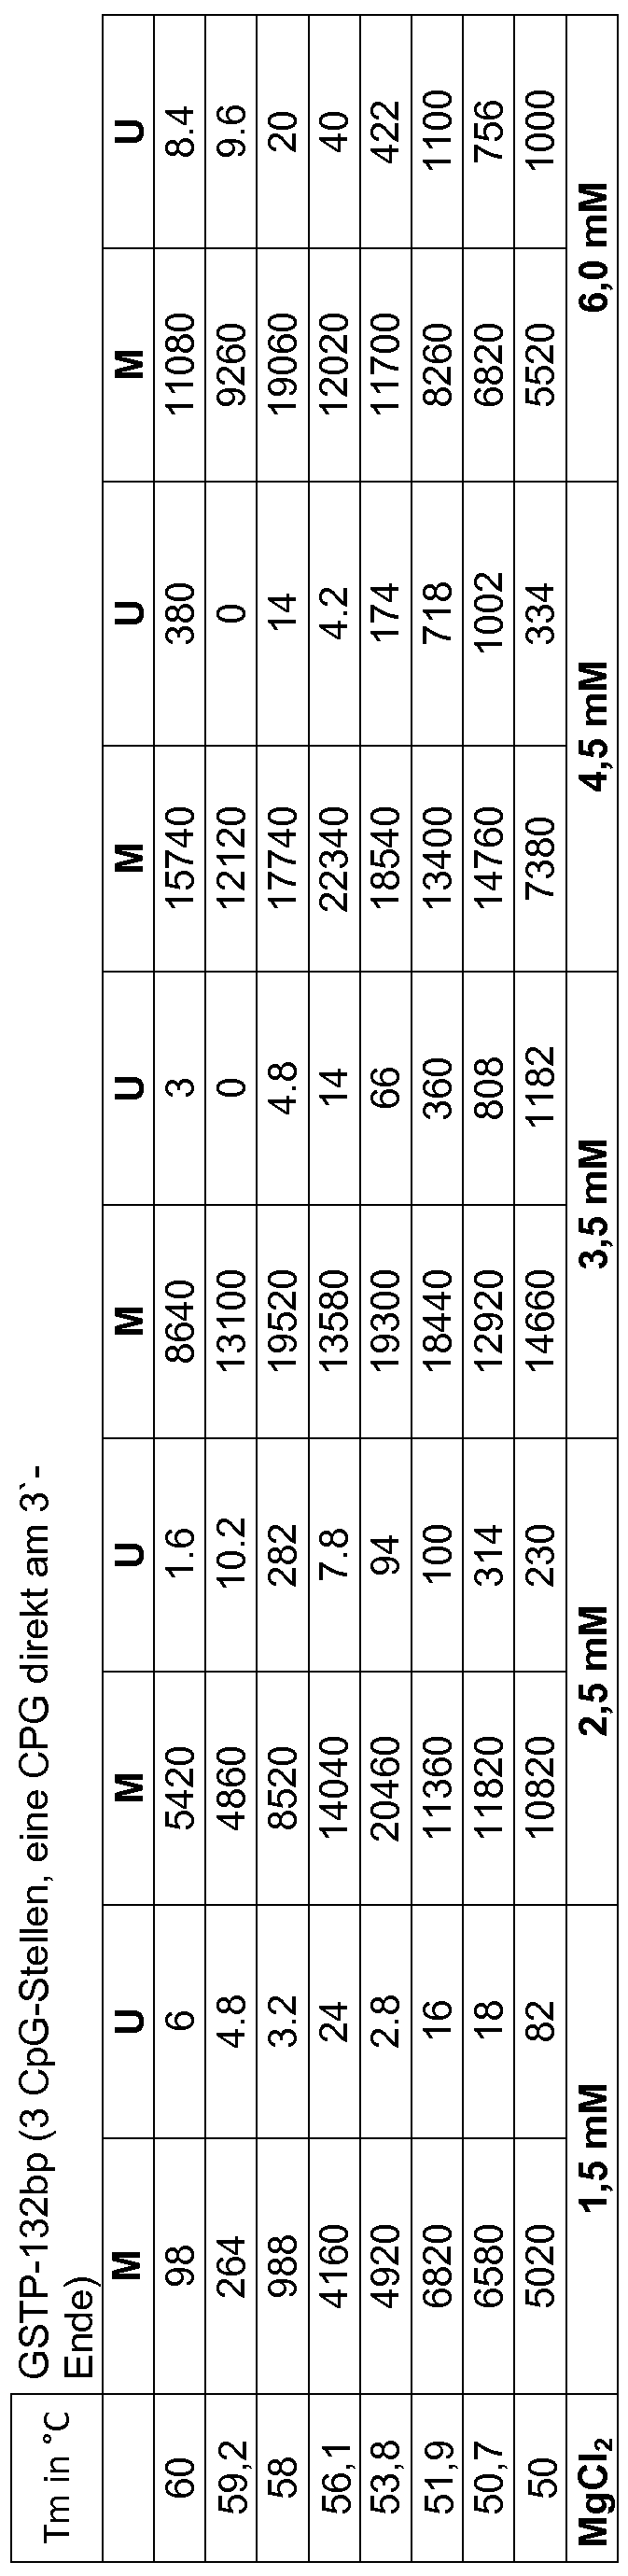
Bei Voruntersuchungen der Erfinder stellte sich überraschend heraus, dass bei Wahl einer optimalen Annealingtemperatur in der BBPA der in der anschließenden dPCR bestimmte Methylierungsgrad der untersuchten Zielgene in Proben gesunder Probanden mit steigender PCR-Zyklenanzahl der BBPA in Richtung 0 %, der von Patientinnen mit Mammakarzinomen und Patienten mit Prostatakarzinomen in Richtung 100 % sich verschob, wenn bei einer entsprechenden Annealingtemperatur eine passende MgCI2-Konzentration und Zyklenanzahl in der BBPA gewählt wurde (Fig. 2-4, 7 und 8, Tabellen 2-5). Dieses unerwartete Phänomen ist noch nicht vollständig erklärt, doch kann dieses Phänomen für eine deutlich verbesserte Unterscheidung zwischen Gesund, d. h. ohne fc-Tumor-DNA-Nachweis und Krank, d. h. mit entsprechendem Nachweis von fcT-DNA verwendet werden. Solch eine stringente Unterscheidung gestattet im Prinzip eine Ja/Nein-Antwort auf die Frage, ob eine Tumorspezifische DNA und damit eine Tumorerkrankung vorliegt oder nicht. Dieses Verfahren ermöglicht prinzipiell den spezifischen Nachweis nur eines einzelnen Tumor-DNA-Moleküls vor einem großen Hintergrund normaler DNA.
Umso höher der Anteil methylierter Sequenzen, umso höher ist die Wahrscheinlichkeit, dass eine bösartige Tumorerkrankung, insbesondere im fortgeschrittenen Stadium, vorliegt. In preliminary investigations by the inventors, it was surprisingly found that, when choosing an optimal annealing temperature in the BBPA, the degree of methylation of the investigated target genes in samples of healthy subjects in the subsequent dPCR with increasing PCR cycle number of BBPA in the direction of 0%, that of patients with breast cancer and Patients with prostate cancer in the direction of 100% shifted when an appropriate MgCl 2 concentration and number of cycles in the BBPA was selected at a corresponding annealing temperature (Figures 2-4, 7 and 8, Tables 2-5). This unexpected phenomenon is not yet fully explained, but this phenomenon can be used for a significantly improved distinction between healthy, ie, without fc tumor DNA detection and disease, ie, with appropriate detection of fcT DNA. Such a stringent distinction, in principle, allows a yes / no answer to the question of whether or not there is a tumor-specific DNA and thus a tumor disease. In principle, this method makes it possible to specifically detect only a single tumor DNA molecule in front of a large background of normal DNA. The higher the proportion of methylated sequences, the higher the likelihood that a malignant tumor disease, especially at an advanced stage, will be present.
Nach dem Stand der Technik sind die digitale PCR allein als auch die bisher bekannten PCR-basierten Techniken (MS-qPCR oder PCR mit anschließender Schmelzkurvenanalyse [MS-HRM]) allein nicht in der Lage, Tumorerkrankte sicher von Gesunden (ohne Tumorerkrankung) an Hand von Proben aus Körperflüssigkeiten („liquid-biopsy"- Untersuchungen) zu unterscheiden. So kann bei Ergebnissen, d.h. dem Anteil von fcT-DNA im Verhältnis zu dem Anteil normaler Wildtyp-DNA zwischen Gesunden und Tumorerkrankten, die dicht beieinander liegen und nicht sicher unterschieden werden können, mittels MS-HRM oder dPCR allein nicht weiter differenziert werden mit Ausnahme, mehr DNA in die Untersuchungen einzusetzen. Im Fall der Nutzung von Liquid-Biopsy- Materialien, wie z.B. Serum, Plasma, Urin, Liquor cerebrospinalis oder Abstrichen ist das jedoch oftmals nicht möglich. Im Gegensatz dazu liefert die erfindungsgemäße BBPA-dPCR- Technik die Möglichkeit durch Erhöhung der Zyklenanzahl in der BBPA die Stringenz bei der Unterscheidung zwischen Gesund und Krank entsprechend zu erhöhen. Das ist besonders bedeutsam bei der Unterscheidung benigner Hyperplasien, z. B. der benignen Hyperplasie der Prostata (BPH) und malignen Erkrankungen wie dem Prostatakarzinom, wie in den Ausführungsbeispielen an Hand von Zellkulturen und Serumproben von Patienten mit Prostatakarzinom gezeigt werden konnte. According to the state of the art, the digital PCR alone as well as the previously known PCR-based techniques (MS-qPCR or PCR with subsequent melting curve analysis [MS-HRM]) alone are not able to hand tumor patients safely from healthy persons (without tumor disease) In the case of results, ie the proportion of fcT-DNA in relation to the proportion of normal wild-type DNA, a distinction is made between healthy and tumor patients who are close to each other and not sure can not be further differentiated using MS-HRM or dPCR alone, with the exception of adding more DNA to the studies, however, in the case of using Liquid Biopsy materials, such as serum, plasma, urine, cerebrospinal fluid, or smears In contrast, the BBPA-dPCR technique of the invention provides the possibility of increasing the number of cycles in the BBPA by the St Increase in the distinction between healthy and ill accordingly. This is particularly important in distinguishing benign hyperplasia, e.g. Benign hyperplasia of the prostate (BPH) and malignancies such as prostate cancer, as shown in the embodiments using cell cultures and serum samples from patients with prostate cancer.
Bevorzugt werden in Schritt b) die methylierten und nicht-methylierten DNA-Sequenzen der Zielgene mit Hilfe einer entsprechend hohen Anzahl von PCR-Zyklen (bevorzugt 10 bis 50 Zyklen) vervielfältigt und anschließend direkt oder nach einer geringfügen Vorverdünnung der Amplifikate im Fall einer hohen Zyklenanzahl bei der BBPA in der dPCR (Schritt c) quantifiziert. Preferably, in step b) the methylated and unmethylated DNA sequences of the target genes are amplified by means of a correspondingly high number of PCR cycles (preferably 10 to 50 cycles) and then directly or after a small pre-dilution of the amplificates in the case of a high number of cycles quantified at the BBPA in the dPCR (step c).
Nachfolgend werden die einzelnen Schritte des Verfahrens und bevorzugte Ausgestaltungen näher erläutert: The individual steps of the method and preferred embodiments are explained in more detail below:
Vor Schritt a) erfolgt bevorzugt eine DNA-Isolierung (Schritt a')) mit bekannten Methoden. Die Durchführung der Bisulfitumwandlung ist dem Fachmann ebenfalls bekannt. Für beide Schritte kann sich der Fachmann kommerziell erhältlicher Kits bedienen. Prior to step a), DNA isolation (step a ') is preferably carried out by known methods. The implementation of bisulfite conversion is also known to the person skilled in the art. For both steps, the expert can use commercially available kits.
Die isolierte Probe kann prinzipiell eine Gewebeprobe sein. Vorteilhaft eignet sich das erfindungsgemäße Verfahren aber insbesondere zum Nachweis von methylierter Tumor-
DNA in Körperflüssigkeiten („liquid biopsy"), wie z. B. Vollblut, Serum, Plasma, Urin, Liquor (cerebrospinal fluid), Sputum, Bronchiallavage, Spermaflüssigkeit, Brustdrüsensekret, Scheidensekret (Abstrich) oder Lymphe, besonders bevorzugt Serum, Plasma oder Urin. The isolated sample can in principle be a tissue sample. Advantageously, however, the method according to the invention is particularly suitable for the detection of methylated tumor cells. DNA in body fluids ("liquid biopsy"), such as whole blood, serum, plasma, urine, cerebrospinal fluid, sputum, bronchial lavage, sperm fluid, mammary gland secretions, vaginal secretions (smears) or lymph, more preferably serum, plasma or Urine.
In Schritt b) (BBPA) werden methylierte und korrespondierende nicht-methylierte DNA- Sequenzen desselben Genabschnittes mittels PCR so amplifiziert, dass die methylierten DNA-Sequenzen (wenn sie spezifisch für Tumoren sind) oder nicht-methylierte DNA- Sequenzen (wenn sie spezifisch für Tumoren sind) stärker amplifiziert werden. In step b) (BBPA), methylated and corresponding non-methylated DNA sequences of the same gene segment are PCR amplified such that the methylated DNA sequences (if specific for tumors) or unmethylated DNA sequences (if specific for Tumors) are amplified more.
Entgegen dem Stand der Technik, in dem Primerpaare mit maximal 2 CpG-Stellen, in einzelnen Fällen mit 3 CpG-Stellen empfohlen wird, die sich alle so nah wie möglich am 5"- Ende, nicht aber am 3"-Ende der Primersequenzen befinden sollen [4, 16-19], können erfindungsgemäß, insbesondere in Kombination mit geeigneten MgCI2-Konzentrationen und Annealingtemperaturen, Primer in der Prä-Amplifikation eingesetzt werden, die zusammen bis zu sieben CpG-Stellen in ihren Sequenzen enthalten. Die CpG-Stellen können dabei über die gesamte Primersequenz verteilt sein, bevorzugt in der Nähe des 3"-Endes bis hin, dass ein Cytosin einer CpG-Dinukleotidsequenz sich direkt am 3"-Ende befindet. Auf diese Weise können Tumor-DNA deutlich sensitiver und gleichzeitig spezifischer nachgewiesen werden, d.h. ohne dass falsch positive Signale verstärkt entstehen, auch wenn ein hoher Anteil normaler DNA (Wildtyp-DNA) in der zu untersuchenden Probe vorliegt, was in menschlichen Körperflüssigkeiten, Abstrichen oder Gewebeproben häufig der Fall ist. Darüber hinaus lassen sich auf diese Weise auch Primer für CpG-reiche Gensequenzen konstruieren, mit deren Hilfe diese Gensequenzen ansonsten hätten nicht untersucht werden können. Contrary to the state of the art, in which primer pairs are recommended with a maximum of 2 CpG sites, in some cases with 3 CpG sites, which are all as close as possible to the 5 " end but not to the 3 " end of the primer sequences [4, 16-19], can be used according to the invention, in particular in combination with suitable MgCl 2 concentrations and annealing temperatures, primers in the pre-amplification, which together contain up to seven CpG sites in their sequences. The CpG sites may be distributed throughout the primer sequence, preferably near the 3 " end, to the point where a cytosine of a CpG dinucleotide sequence is located directly at the 3 " end. In this way, tumor DNA can be detected significantly more sensitive and at the same time more specific, ie without that false positive signals increasingly arise, even if a high proportion of normal DNA (wild-type DNA) is present in the sample to be examined, which in human body fluids, smears or Tissue samples are often the case. In addition, primers for CpG-rich gene sequences can be constructed in this way, with the help of which these gene sequences otherwise could not have been investigated.
Da die Primer und insbesondere auch die Reaktionsbedingungen (Annealingtemperatur immer bei entsprechend optimierter MgCI2-Konzentration im Reaktionspuffer) so ausgewählt sind, dass sie sowohl methylierte als auch nicht-methylierte DNA-Sequenzen amplifizieren, d.h. sie sind methylierungsunabhängig (MIP, methylation independent primer), kommt es bei den optimierten Reaktionsbedingungen zu einer selektiven Konkurrenzreaktion der Primer um methylierte und nicht-methylierte DNA-Moleküle, wodurch im Gegensatz zur Nutzung methylierungsspezifischer Primer (MSP) das Auftreten falsch positiver Signale vermieden wird. Neben der erhöhten Spezifität können auf diese Weise methylierte DNA-Kopien vor einem großen Hintergrund nicht-methylierter DNA-Kopien wesentlich sensitiver und spezifischer bestimmt werden. Zudem werden neben homogen methylierten auch heterogen methylierte DNA-Fragmente (sogenannte Epi-Allele) quantifiziert, wodurch eine stringentere Differenzierung zwischen Tumorerkrankung und Gesund möglich wird.
Bevorzugt werden die PCR-Bedingungen (insbesondere Primersequenzen, Magnesiumkonzentration, Annealingtemperatur und insbesondere auch die Zyklenanzahl) so eingestellt, dass die Bias zugunsten der methylierten DNA-Sequenzen optimiert wird, ohne dabei nicht-methylierte DNA-Sequenzen nicht mit zu amplifizieren. Since the primers and in particular also the reaction conditions (annealing temperature always with correspondingly optimized MgCl 2 concentration in the reaction buffer) are selected such that they amplify both methylated and non-methylated DNA sequences, ie they are methylation independent primer (MIP). In the optimized reaction conditions, there is a selective competitive reaction of the primers with methylated and unmethylated DNA molecules, which, in contrast to the use of methylation-specific primers (MSP), avoids the occurrence of false-positive signals. In addition to the increased specificity, in this way methylated DNA copies can be determined much more sensitively and specifically against a large background of unmethylated DNA copies. In addition to heterogeneously methylated DNA fragments (so-called epi-alleles) are quantified in addition to homogeneously methylated, whereby a more stringent differentiation between tumor disease and healthy is possible. The PCR conditions (in particular primer sequences, magnesium concentration, annealing temperature and, in particular, the number of cycles) are preferably adjusted so that the bias is optimized in favor of the methylated DNA sequences without also not amplifying non-methylated DNA sequences.
Bevorzugt werden in Schritt b) für die PCR Magnesiumkonzentrationen (Endkonzentrationen) von 0,5 bis 15 mmol/l, vorzugsweise 1 bis 10 mmol/l, besonders bevorzugt 2 bis 5 mmol/l, insbesondere 2 bis 4 mmol/l, besonders bevorzugt 2,5 bis 3,5 mmol/l gewählt. In step b), magnesium concentrations (final concentrations) of 0.5 to 15 mmol / l, preferably 1 to 10 mmol / l, particularly preferably 2 to 5 mmol / l, in particular 2 to 4 mmol / l, are particularly preferred for the PCR 2.5 to 3.5 mmol / l selected.
Die Erfinder haben herausgefunden, dass die Bias durch eine hohe Annealingtemperatur und hohen 5'-CG-3'-Gehalt zugunsten der methylierten DNA-Sequenzen verschoben wird. Vorteilhaft kann die Spezifität und Sensitivität des Verfahrens bei einer entsprechend aufeinander abgestimmten Wahl der Annealingtemperatur, MgCI2-Konzentration, Zyklenanzahl und des Primerdesigns so erhöht werden kann, dass ein Tumorfrühscreening (Vorsorge) und der Nachweis einer minimalen Resterkrankung (MRD) anhand einer Liquid Biopsy möglich ist. Sollen methylierte gegenüber nicht-methylierten Sequenzen bevorzugt prä-amplifiziert werden, werden bevorzugt neben den 5'-CG-3'-enthaltenen Primersequenzen hohe Annealingtemperaturen und erniedrigte MgCI2-Konzentrationen (hier allerdings nur soweit erniedrigt, dass nicht-methylierte DNA-Sequenzen noch geringfügig mit prä-amplifiziert und dadurch falsch-positive Signale vermieden werden) gewählt werden. Sollen nicht-methylierte gegenüber methylierten Sequenzen bevorzugt prä-amplifiziert werden, können neben dem Design der Primer (möglichst keine oder maximal zwei 5'-CG-3'- enthaltene Sequenz) die Annealingtemperatur und MgCI2-Konzentration nach Voruntersuchungen, wie sie im Folgenden beschrieben sind, entsprechend verändert werden. The inventors have found that the bias is shifted by a high annealing temperature and high 5'-CG-3 'content in favor of the methylated DNA sequences. Advantageously, the specificity and sensitivity of the method can be increased with a suitably coordinated choice of Annealingtemperatur, MgCl 2 concentration, number of cycles and the primer design so that a tumor early screening (precaution) and the detection of minimal residual disease (MRD) using a Liquid Biopsy is possible. If methylated compared to non-methylated sequences are preferably pre-amplified, preferably in addition to the 5'-CG-3'-contained primer sequences high annealing temperatures and decreased MgCl 2 concentrations (here, however, only so far lowered that non-methylated DNA sequences still slightly pre-amplified, thereby avoiding false-positive signals). If non-methylated compared to methylated sequences are preferably pre-amplified, in addition to the design of the primer (possibly no or at most two 5'-CG-3'- contained sequence), the annealing temperature and MgCl 2 concentration after preliminary investigations, as described below are described, are changed accordingly.
Die Primer werden in Schritt b) bevorzugt so gewählt, dass sie keine bis sieben 5'-CG-3' Dinukleotidsequenzen pro Primerpaar, bevorzugt zwei bis sechs, vorzugsweise drei bis fünf, besonders bevorzugt ein bis maximal drei, weiter bevorzugt ein oder zwei 5'-CG-3' Dinukleotidsequenzen pro Primerpaar, enthalten. The primers are preferably selected in step b) such that they contain no to seven 5'-CG-3 'dinucleotide sequences per primer pair, preferably two to six, preferably three to five, particularly preferably one to a maximum of three, more preferably one or two '-CG-3' dinucleotide sequences per primer pair.
Überraschend hat sich auch gezeigt, dass die diagnostische Sensitivität des Verfahrens weiter erhöht wird, d.h. die Anzahl der pathologischen Befunde bei tatsächlich vorliegender Tumorerkrankung steigt, wenn pro Zielgen 2 oder mehrere (unterschiedliche) Primerpaare in der Prä-Amplifikation separat oder gleichzeitig eingesetzt werden, die bevorzugt alle die Sequenz einschließen, die durch die Sonden in der dPCR detektiert werden.
Die Annealingtemperaturen sind vorzugsweise über 40°C, insbesondere über 45°C, und liegen bevorzugt zwischen 50 und 72°C, vorzugsweise 53 bis 70°C, besonders bevorzugt bis 63°C. Die optimalen Annealingtemperaturen werden wie auch die MgCI2-Konzentrationen und die optimalen Zyklenanzahl bevorzugt für jedes Primer-Paar empirisch ermittelt. Surprisingly, it has also been shown that the diagnostic sensitivity of the method is further increased, ie, the number of pathological findings in actually present tumor disease increases, if per target gene 2 or more (different) primer pairs are used separately or simultaneously in the pre-amplification, the preferably all include the sequence detected by the probes in the dPCR. The annealing temperatures are preferably above 40 ° C., in particular above 45 ° C., and are preferably between 50 and 72 ° C., preferably 53 to 70 ° C., particularly preferably up to 63 ° C. Be found in the 2 concentrations and the optimum number of cycles for each primer pair preferably empirically the optimum annealing temperatures as well as MgCl.
Die Optimierung der Bias zugunsten der methylierten DNA-Sequenzen erfolgt bevorzugt durch empirische Anpassung der Primersequenzen und Annealingtemperaturen, bevorzugt gemeinsam mit der MgCI2-Konzentration, entlang der oben genannten Auswahlregeln. Für jedes Zielgen bzw. jede Zielsequenz werden die PCR-Bedingungen (insbesondere Primerauswahl und Annealingtemperatur gemeinsam mit der MgCI2-Konzentration und Zyklenanzahl) bevorzugt mit einer Probe mit bekanntem Verhältnis methylierte DNA nicht- methylierte DNA bestimmt (Fig. 34-37 und Tabellen 21 und 22). Erreicht man bei Primern ohne 5'-CG-3' Dinukleotidsequenz keine Bias oder nur bei hohen Annealingtemperaturen (z. B. über 70°C) wird bevorzugt eine 5'-CG-3' Dinukleotidsequenz eingefügt, wenn das nicht ausreicht, insgesamt maximal zwei, drei oder vier 5'-CG-3' Dinukleotidsequenzen (d. h. jeweils eine 5'-CG-3' Dinukleotidsequenz in die Forward- und Reverse-Primer-Sequenz oder zwei bis vier 5'-CG-3' Dinukleotidsequenz in die Forward- oder Reverse-Primer-Sequenz eingefügt). Bei niedrigen MgCI2-Konzentrationen (z.B. unterhalb von 1 ,0 mmol/l) werden bevorzugt drei 5'-CG-3' Dinukleotidsequenzen eingefügt, wenn das nicht ausreicht, insgesamt maximal acht, bevorzugt maximal sieben, 5'-CG-3' Dinukleotidsequenzen pro Primerpaar. Dabei spielt es keine Rolle, dass die 5'-CG-3' Dinukleotidsequenzen sich am 5"- Ende der Primer befinden, wie es in der bisherigen Literatur empfohlen wurde [4, 16-19]. Ganz im Gegenteil lässt sich die Sensitivität der Tests an Proben mit einem hohen Hintergrund normaler Wild-Typ-DNA mit Primern erhöhen, bei denen die 5'-CG-3' Dinukleotidsequenzen sich besonders in der Nähe bzw. direkt am 3"-Ende der Primer befinden [Fig. 38-45, Tabellen 27-30]. Neben einer höheren analytischen Sensitivität lassen sich auf diese Weise vorteilhaft auch Primer für Genabschnitte konstruieren, die durch eine hohe Dichte an 5'-CG-3' Dinukleotidsequenzen charakterisiert sind und die sich bisher - entsprechend den bisherigen Literaturempfehlungen [4, 16-19] - einer Untersuchung entzogen haben. The optimization of the bias in favor of the methylated DNA sequences is preferably carried out by empirical adaptation of the primer sequences and annealing temperatures, preferably together with the MgCl 2 concentration, along the above selection rules. PCR conditions for each gene or each target sequence (in particular, primer selection and annealing, together with the MgCl 2 concentration and cycle number) are preferred with a sample having a known ratio of methylated DNA non-methylated DNA is determined (Fig. 34-37 and Tables 21 and 22). If no bias is achieved for primers without a 5'-CG-3 'dinucleotide sequence or only at high annealing temperatures (eg above 70 ° C.), a 5'-CG-3' dinucleotide sequence is preferably added if this is not sufficient, in total maximum two, three or four 5'-CG-3 'dinucleotide sequences (ie, one 5'-CG-3' dinucleotide sequence each into the forward and reverse primer sequence or two to four 5'-CG-3 'dinucleotide sequences in the forward or reverse primer sequence inserted). At low MgCl 2 concentrations (eg below 1, 0 mmol / l) preferably three 5'-CG-3 'Dinukleotidsequenzen be inserted, if that is not sufficient, a maximum of eight, preferably a maximum of seven, 5'-CG-3' Dinucleotide sequences per primer pair. It does not matter that the 5'-CG-3 'dinucleotide sequences are located at the 5 " end of the primers, as recommended in the previous literature [4, 16-19]. On the contrary, the sensitivity of the Increase assays on samples with a high background of normal wild type DNA with primers in which the 5'-CG-3 'dinucleotide sequences are particularly close to or directly at the 3 ' end of the primers [Fig. 38-45, Tables 27-30]. In addition to a higher analytical sensitivity can be advantageously constructed in this way, primers for gene sections that are characterized by a high density of 5'-CG-3 'Dinukleotidsequenzen and the previously - according to previous literature recommendations [4, 16-19] - have withdrawn from an investigation.
Die Anzahl der PCR-Zyklen im Schritt b) ist insbesondere abhängig von der Ausgangskonzentration der DNA in der zu untersuchenden Probe. Je nach zur Verfügung stehender DNA-Menge werden Zyklenzahlen von 5 bis 50, bevorzugt 10 bis 50, besonders bevorzugt mindestens 15 und/oder bis 40 gewählt.
Das erfindungsgemäße Verfahren ist prinzipiell für jedes zu untersuchende Ziel-Gen (target of interest) anwendbar. Bevorzugt werden im erfindungsgemäßen Verfahren DNA- Sequenzen von drei bis fünf, bevorzugt bis sechs Zielgenen auf den Methylierungsgrad analysiert. Bevorzugt wird dazu Schritt b) als Multiplex-PCR durchgeführt, d. h. die Primerpaare für die Prä-Amplifikation der Zielsequenzen werden so aufeinander abgestimmt, dass sie eine Annealingtemperatur in der gleichen Größenordnung aufweisen und nicht miteinander hybridisieren. Bevorzugt werden die Primerpaare für die Präamplifikation der Zielsequenzen in Schritt so gewählt, dass bei der gleichen Annealingtemperatur, MgCI2- Konzentration und Zyklenanzahl die höchsten analytischen und diagnostischen Sensitivitäten und Spezifitäten resultieren. The number of PCR cycles in step b) depends in particular on the starting concentration of the DNA in the sample to be examined. Depending on the available amount of DNA, cycle numbers of from 5 to 50, preferably from 10 to 50, more preferably at least 15 and / or up to 40 are selected. The method according to the invention is applicable in principle for each target gene to be investigated (target of interest). In the method according to the invention, DNA sequences of three to five, preferably up to six, target genes are preferably analyzed for the degree of methylation. Preferably, step b) is carried out as a multiplex PCR, ie, the primer pairs for the pre-amplification of the target sequences are coordinated so that they have an annealing temperature of the same order and do not hybridize with each other. Preferably, the primer pairs for the pre-amplification of the target sequences are selected in step such that the highest analytical and diagnostic sensitivities and specificities result at the same annealing temperature, MgCl 2 concentration and number of cycles.
Vorteile des 2-stufigen Verfahrens (BBPA-dPCR) bestehen darin, dass das Verfahren eine wesentlich höhere diagnostische Sensitivität und insbesondere auch Spezifität gegenüber bisherigen Verfahren wie dPCR, MSP oder MS-HRM aufweist, wodurch prinzipiell ein einzelnes Tumor-DNA-Molekül vor einem großen Hintergrund normaler DNA (Wildtyp-DNA) detektiert werden kann. Dadurch können neben Plasma auch Serumproben untersucht werden, ohne eine spezielle Prä-Analytik beachten zu müssen. Die analytische und diagnostische Sensitivität des neuen Verfahrens ist letztendlich nur dadurch limitiert, dass in der zu untersuchenden Probe tatsächlich ein einzelnes Tumor-DNA-Molekül mit der zu untersuchenden Zielgensequenz vorliegt und in die Prä-Amplifikation überführt werden kann. Advantages of the two-stage method (BBPA-dPCR) are that the method has a significantly higher diagnostic sensitivity and in particular also specificity compared to previous methods such as dPCR, MSP or MS-HRM, which in principle a single tumor DNA molecule before a large background normal DNA (wild-type DNA) can be detected. As a result, in addition to plasma, serum samples can also be examined without having to consider a special pre-analysis. The analytical and diagnostic sensitivity of the new method is ultimately only limited by the fact that in the sample to be examined actually a single tumor DNA molecule with the target gene sequence to be examined is present and can be converted into the pre-amplification.
Durch die gleichzeitige Prä-Amplifikation nicht-methylierter DNA-Fragmente, wenn auch durch eine deutlich geringere Effizienz gegenüber methylierten DNA-Sequenzen oder, wie sich überraschend zeigte, mit einer höheren Effizienz gegenüber methylierten DNA- Sequenzen in Proben von Probanden ohne Tumorerkrankung, werden falsch positive Signale vermieden. Dies beruht vermutlich auf einer Konkurrenzreaktion der Primer um die Zielsequenzen. Des Weiteren können trotz der PCR-Bias die ermittelten relativen Methylierungsgrade der Zielgene zwischen einzelnen Patientenproben miteinander verglichen werden, da die Höhe der Bias bei konstanten PCR-Bedingungen (konstante Annealingtemperatur, MgCI2-Konzentration und Zyklenanzahl) für jede untersuchte Probe gleich hoch ist. Durch die bereits genannten Vorteile und der erzielten hohen diagnostischen Spezifitäten des neuen Verfahrens ist auch eine Unterscheidung zwischen benignen Hyperplasien und malignen Erkrankungen möglich. Bevorzugt ist das in der Differentialdiagnostik der benignen Prostatahyperplasie (BPH), Prostatitis und Prostatakarzinom (PCa)-Erkrankungen von Interesse, da auf Grund erhöhter PSA-Werte (der kritische Bereich liegt zwischen 2,0-15,0 mg/ml, Referenzbereich liegt bei < 2,5- 4,0 mg/ml) die Indikation für eine Prostatagewebebiopsie gestellt werden muss.
Umso höher der Anteil methylierter Sequenzen (insbesondere wenn diese spezifisch für Tumor-DNA sind), umso höher ist die Wahrscheinlichkeit, dass eine fortgeschrittene bösartige Tumorerkrankung vorliegt. Sind nicht-methylierte Sequenzen Tumor-spezifisch, verhält es sich genau umgekehrt. The simultaneous pre-amplification of non-methylated DNA fragments, albeit by a significantly lower efficiency compared to methylated DNA sequences or, surprisingly, with a higher efficiency compared to methylated DNA sequences in samples from subjects without tumor disease, are wrong avoided positive signals. This is probably due to a competitive reaction of the primers to the target sequences. Furthermore, despite the PCR bias, the relative methylation levels of target genes detected between individual patient samples can be compared since the level of bias at constant PCR conditions (constant annealing temperature, MgCl 2 concentration, and number of cycles) is the same for each sample tested. Due to the advantages already mentioned and the achieved high diagnostic specificities of the new method, a distinction between benign hyperplasia and malignant diseases is also possible. This is of particular interest in the differential diagnosis of benign prostatic hyperplasia (BPH), prostatitis and prostate carcinoma (PCa) diseases since, due to increased PSA values (the critical range is between 2.0-15.0 mg / ml, reference range) at <2.5-4.0 mg / ml), the indication for prostate tissue biopsy must be provided. The higher the proportion of methylated sequences (especially if they are specific for tumor DNA), the higher the likelihood that an advanced malignant tumor disease will be present. If non-methylated sequences are tumor-specific, the opposite is true.
In Abhängigkeit von den gewählten Primern und PCR-Bedingungen (Annealingtemperatur, Magnesiumchloridkonzentration und Anzahl der Zyklen) in der Prä-Amplifikation werden die prozentualen Anteile (fraktionale Häufigkeit) an methylierten Sequenzkopien bestimmt, die als Referenzbereich (Normalbereich Gesunder) für die Abwesenheit einer malignen Erkrankung sprechen. In den Ausführungsbeispielen sprechen z. B. bevorzugt jeweils ein Anteil methylierte Sequenzen > 2 % bei PLA2R1 (bevorzugt 168 bp Fragment), > 0,1 % bei RASSF1A (bevorzugt 1 17 bp Fragment), > 2 % bei GSTP1 (bevorzugt 120 bp Fragment) und > 0,05 % bei GSTP1 (bevorzugt 1 16 bp Fragment) für eine bösartige Tumorerkrankung. Diese Grenzen (ct/i-off-Werte) zwischen Gesund und Krank werden für jede Zielsequenz (und konkreten PCR-Bedingungen) durch Mitführen von Kontrollen für Gesund (z. B. DNA isoliert aus gesunden Epithelzellen der Prostata (PrEC), der Mamma (HMEC, MCF10A- Zelllinie) oder anderen zu untersuchenden Geweben und Krank (z. B. DNA isoliert aus maligen LNCAP-, PC-3 und DU145-Zellen der Prostata, aus malignen MCF-7, Cal-51 , UACC-812, BT-474, MDA-MB-453 und MDA-MB231 -Zellen der Mamma) bestimmt. Depending on the selected primers and PCR conditions (annealing temperature, magnesium chloride concentration and number of cycles) in the pre-amplification, the percentages (fractional abundance) of methylated sequence copies are determined, the reference range (normal range healthy) for the absence of a malignant disease speak. In the embodiments z. B. in each case a proportion of methylated sequences> 2% in PLA2R1 (preferably 168 bp fragment),> 0.1% in RASSF1A (preferably 1 17 bp fragment),> 2% in GSTP1 (preferably 120 bp fragment) and> 0, 05% for GSTP1 (preferably 1 16 bp fragment) for a malignant tumor disease. These limits (ct / i-off values) between healthy and diseased are determined for each target sequence (and specific PCR conditions) by carrying controls for healthy (eg, DNA isolated from healthy prostate epithelial cells (PrEC), the mamma (HMEC, MCF10A cell line) or other tissues and patients to be examined (eg DNA isolated from malignant LNCAP, PC-3 and DU145 cells of the prostate, from malignant MCF-7, Cal-51, UACC-812, BT-474, MDA-MB-453 and mammalian MDA-MB231 cells).
Als tumorerkrankte Patienten werden bevorzugt Patienten klassifiziert, die für mindestens ein, bevorzugt zwei, oder auch mehr Zielgensequenzen erhöhte Werte für homogen methylierte oder heterogen methylierte Epi-Allele aufweisen. Patients who have increased values for homogeneously methylated or heterogeneously methylated epi-alleles for at least one, preferably two, or even more target gene sequences are preferably classified as tumor-affected patients.
In Schritt c) erfolgt eine Quantifizierung mittels digitaler PCR, wobei im Gegensatz zur herkömmlichen dPCR die eingesetzte Anzahl von prä-amplifizierten DNA-Kopien außerhalb der normalen Poisson-Verteilung liegt. In step c), quantification is carried out by means of digital PCR, wherein, in contrast to the conventional dPCR, the number of pre-amplified DNA copies used is outside the normal Poisson distribution.
Überraschend führt eine derartige„Überladung" der digitalen PCR mit DNA-Kopiemengen über einen KPK-Wert von 8 hinaus zur Erhöhung der Spezifität und damit deutlich verbesserten Unterscheidung zwischen Gesund (ohne Tumorerkrankung) und bösartiger Tumorerkrankung (siehe Tabelle 6 gemeinsam mit Tabelle 4 und 5). So ergab die in die dPCR eingesetzte Probenmenge gesunder Probanden einen KPK-Wert von 560 und für die an Prostatakarzinomen erkrankten Patienten einen KPK-Wert von 1938, bei der die beste Unterscheidung (d.h. ein möglichst niedriger Wert für Gesund bei möglichst hohem Wert für Krank) zwischen Gesund und Krank erzielt wurde (Tabelle 5).
Bevorzugt wird dazu die in Schritt b) präamplifizierte DNA unverdünnt oder leicht verdünnt (z. B. bis zu 1 :1000 nach 50 Zyklen) auf die Kompartimente für die digitale PCR verteilt. Bevorzugt wird eine DNA-Menge in die digitale PCR eingesetzt, so dass in jedem Kompartiment mindestens ein DNA-Molekül vorliegt, bevorzugt mindestens fünf Moleküle vorliegen. Bevorzugt liegt die eingesetzte DNA-Menge doppelt so hoch wie die nach der Poisson-Verteilung und -Statistik erlaubt ist. Bevorzugt liegen pro Kompartiment gemittelt mindestens 10, vorzugsweise mindestens 20, weiter bevorzugt mindestens 50 DNA- Moleküle, besonders bevorzugt mindestens 100 DNA-Moleküle vor. Diese Kopienzahl pro Kompartiment (KPK) bezeichnet dabei die gemittelte Anzahl (arithmetisches Mittel) dsDNA- Moleküle pro Kompartiment. Surprisingly, such an "overloading" of the digital PCR with DNA copy amounts beyond a KPK value of 8 leads to an increase in the specificity and thus significantly improved distinction between healthy (without tumor disease) and malignant tumor disease (see Table 6 together with Table 4 and FIG For example, the sample volume of healthy subjects used in the dPCR gave a KPK value of 560 and for the patients suffering from prostate cancer a KPK value of 1938, in which the best distinction (ie the lowest possible value for healthy and as high as possible for Sick) between healthy and sick (Table 5). For this purpose, the DNA pre-amplified in step b) is preferably distributed undiluted or slightly diluted (for example up to 1: 1000 after 50 cycles) to the compartments for the digital PCR. Preferably, a DNA amount is used in the digital PCR, so that in each compartment at least one DNA molecule is present, preferably at least five molecules are present. Preferably, the amount of DNA used is twice as high as that allowed by the Poisson distribution and statistics. Preferably, at least 10, preferably at least 20, more preferably at least 50 DNA molecules, more preferably at least 100 DNA molecules, are present per compartment. This copy number per compartment (KPK) denotes the average number (arithmetic mean) dsDNA molecules per compartment.
Die in der dPCR einzusetzende Kopienzahl der prä-amplifizierten DNA lässt sich wie folgt berechnen: The copy number of the pre-amplified DNA to be used in the dPCR can be calculated as follows:
Kopienanzahl = KPK * Anzahl der Kompartimente: Number of copies = KPK * Number of compartments:
Demnach ergibt sich beispielweise bei einer bevorzugten KPK von 8 und 5.000 Kompartimenten eine benötigte DNA-Kopienanzahl von 40.000, bei 100.000 Kompartimenten entsprechend 800.000. Bei einer weiter bevorzugten KPK von 50 müssen bei 100.000 Kompartimenten 5 x 10⁶ Kopien in die dPCR eingetragen werden. Bei Verwendung z.B. des RainDrop Digitalen Systems (RainDance-Technologies) mit bis zu 1 Million Kompartimenten (Tröpfchen) werden somit bei einer bevorzugten KPK von 10 in der dPCR 1 x 10⁷ DNA-Kopien und bei einer weiter bevorzugten KPK von 50 in der dPCR 5 x 10⁷ DNA-Kopien eingesetzt. Thus, for example, in a preferred KPK of 8 and 5,000 compartments, a required DNA copy number of 40,000 results, with 100,000 compartments corresponding to 800,000. For a more preferred KPK of 50, 5 x 10 6 copies must be entered into the dPCR for 100,000 compartments. For example, when using the RainDrop Digital System (RainDance Technologies) with up to 1 million compartments (droplets), a preferred KPK of 10 in the dPCR will yield 1 x 10 7 DNA copies and a more preferred KPK of 50 in the dPCR 5 x 10 7 DNA copies used.
Die Quantifizierung der methylierten und nicht-methylierten DNA-Sequenzen erfolgt in Schritt c) mittels Sonden, die spezifisch mit methylierten bzw. den korrespondieren nicht- methylierten Bereichen der prä-amplifizierten Zielsequenzen hybridisieren. The quantification of the methylated and unmethylated DNA sequences takes place in step c) by means of probes which specifically hybridize with methylated or the corresponding unmethylated regions of the pre-amplified target sequences.
Bevorzugt weisen die Sonden für die methylierten DNA-Sequenzen insgesamt für jedes Zielgen mindestens drei, bevorzugt mindestens vier, und bis zu acht, bevorzugt bis zu sieben, 5'-CG-3' Dinukleotide auf. Die Sonden für die nicht-methylierten DNA-Sequenzen weisen bevorzugt insgesamt für jedes Gen mindestens drei, bevorzugt vier, bis zu acht, bevorzugt bis zu sieben, 5'-CA-3' Dinukleotide auf. Alternativ kann mit den Sonden der komplementäre Strang im amplifizierten DNA-Doppelstrangmolekül detektiert werden. Dies erfolgt entweder separat oder gemeinsam mit der Sonde für den kodierenden Strang (coding Strand). Zur Detektion des komplementären Strang weisen die Sonden für die nicht-
methylierten DNA-Sequenzen bevorzugt drei, bevorzugt vier, bis sieben 5'-TG-3' Dinukleotide (anstelle den 5'-CA-3' Dinukleotiden) auf. Die Anzahl der 5'-CG-3' Dinukleotide in den Sonden für die methylierten DNA-Sequenzen korrespondiert bevorzugt zu der Anzahl der 5'-CA-3' Dinukleotide (bzw. 5'-TG-3' Dinukleotide) in den Sonden für die nicht- methylierten DNA-Sequenzen desselben Zielgens. Die oben genannte Anzahl der 5'-CG-3' bzw. 5'-CA-3' (oder 5'-TG-3') Dinukleotide ist pro Zielgen entweder in einer Sonde enthalten oder auf mehrere Sonden verteilt (insbesondere wenn aufgrund der Sequenz des Zielgens nicht eine Sonde designed werden kann, welche alle Methylierungsstellen umfasst). Im Fall von zwei Sonden für ein Zielgen enthalten beide Sonden für die methylierten Sequenzen bevorzugt jeweils drei oder vier 5'-CG-3' Dinukleotide und beide Sonden für die nicht- methylierten Sequenzen bevorzugt drei oder vier 5'-CA-3' (oder 5'-TG-3') Dinukleotide. Preferably, the probes for the methylated DNA sequences have a total of at least three, preferably at least four, and up to eight, preferably up to seven, 5'-CG-3 'dinucleotides for each target gene. The probes for the non-methylated DNA sequences preferably have a total of at least three, preferably four, up to eight, preferably up to seven, 5'-CA-3 'dinucleotides for each gene in total. Alternatively, with the probes, the complementary strand can be detected in the amplified DNA double-stranded molecule. This is done either separately or together with the coding strand probe. For the detection of the complementary strand, the probes for the non- methylated DNA sequences preferably three, preferably four, to seven 5'-TG-3 'dinucleotides (instead of the 5'-CA-3' dinucleotides) on. The number of 5'-CG-3 'dinucleotides in the probes for the methylated DNA sequences preferably corresponds to the number of 5'-CA-3' dinucleotides (or 5'-TG-3 'dinucleotides) in the probes for the unmethylated DNA sequences of the same target gene. The abovementioned number of 5'-CG-3 'or 5'-CA-3' (or 5'-TG-3 ') dinucleotides is either contained in one probe or distributed among several probes per target gene (in particular if, due to the Sequence of the target gene can not be designed a probe, which includes all methylation sites). In the case of two probes for a target gene, both probes for the methylated sequences preferably each contain three or four 5'-CG-3 'dinucleotides, and both probes for the unmethylated sequences preferably contain three or four 5'-CA-3' (or 5'-TG-3 ') dinucleotides.
Die digitale PCR wird ansonsten nach den gängigen Methoden durchgeführt und quantifiziert. Die Kompartimente sind bevorzugt Öltröpfchen (droplet digital PCR - ddPCR). Alternativ bevorzugt sind die Kompartimente auf einem Chip angeordnet. In der digitalen PCR werden jedoch bevorzugt mehr als ein Amplifikationszyklus durchgeführt, vorzugsweise mindestens 5, bevorzugt mindestens 15, weiter bevorzugt 20 bis 50, besonders bevorzugt 30 bis 45, weiter bevorzugt bis zu 40. Zur Quantifizierung werden die Kompartimente ausgezählt, in denen eine Amplifikation stattgefunden hat und mit denen die Sonden für die methylierten bzw. nicht-methylierten DNA-Sequenzen hybridisieren. Als Primer für die dPCR können jeweils dieselben Primer eingesetzt werden wie für die BBPA in Schritt b). Alternativ und bevorzugt werden„nested" Primer gewählt, die an anderen Stellen der präamplifizierten Sequenz anbinden. Eine nested PCR kann die Spezifizität weiter erhöhen. Die Auswahl der Primer kann hier nach den üblichen Regeln erfolgen und muss hier nicht zwingend den in Schritt b) erwähnten Auswahlregeln genügen. Bevorzugt erfolgt die Auswahl jedoch nach den gleichen Regeln wie in Schritt b). The digital PCR is otherwise performed and quantified according to common methods. The compartments are preferably oil droplets (droplet digital PCR - ddPCR). Alternatively preferably, the compartments are arranged on a chip. In the digital PCR, however, preferably more than one amplification cycle is carried out, preferably at least 5, preferably at least 15, more preferably 20 to 50, particularly preferably 30 to 45, more preferably up to 40. For quantification, the compartments are counted, in which an amplification has taken place and with which the probes hybridize for the methylated or non-methylated DNA sequences. The same primers can be used as primers for the dPCR as for the BBPA in step b). Alternatively and preferably, "nested" primers are chosen which bind to other sites of the pre-amplified sequence.A nested PCR can further increase the specificity, the selection of the primers can be carried out according to the usual rules and need not necessarily be mentioned in step b) However, the selection preferably takes place according to the same rules as in step b).
Unter einer digitalen PCR (dPCR) im Sinne der Erfindung wird somit eine PCR in einer großen Anzahl getrennter Kompartimente, bevorzugt mit einem Volumen im Picoliterbereich oder im Nanobereich verstanden. Die dPCR zeichnet sich dadurch aus, dass die Quantifizierung der Kompartimente nach einem digitalen Ergebnis (Amplifikation: ja oder nein) erfolgt. Durch Auszählen einer großen Anzahl von Reaktionskompartimenten (High- throughput Screening mit bevorzugt 10.000 bis 100.000 Kompartimenten pro PCR) wird eine statistische Signifikanz erreicht. Der Anteil an Reaktionsräumen mit erfolgter Amplifikation ist proportional zur eingesetzten DNA-Menge der amplifizierten DNA-Sequenz, was zur Mengenbestimmung verwendet wird.
Die Sonden sind bevorzugt fluoreszenzmarkiert, wobei für die Sonden für methylierte und nicht methylierte-Sequenzen bevorzugt mit unterschiedlichen Fluoreszenzmarkern versehen sind. Der Fluoreszenzlabel ist bevorzugt an einem Ende der Sonde (bevorzugt dem 5'-Ende) angebracht. Am anderen Ende befindet sich bevorzugt ein zum Fluoreszenzlabel passender Quencher, der das Fluoreszenzsignal unterdrückt. Durch Hybridisierung oder nach Hybridisierung und anschließender Polymerasewirkung mit der amplifizierten DNA wird der Quencheffekt aufgehoben und das Fluoreszenzsignal detektierbar. Derartige Fluoreszenzlabel und Quencher sind dem Fachmann gut bekannt und für beliebige Sondensequenzen kommerziell erhältlich. A digital PCR (dPCR) within the meaning of the invention thus means a PCR in a large number of separate compartments, preferably with a volume in the picoliter range or in the nanoscale. The dPCR is characterized by the fact that the quantification of the compartments follows a digital result (amplification: yes or no). By counting a large number of reaction compartments (high-throughput screening with preferably 10,000 to 100,000 compartments per PCR) a statistical significance is achieved. The proportion of reaction chambers with successful amplification is proportional to the amount of DNA used in the amplified DNA sequence, which is used for quantification. The probes are preferably fluorescently labeled, with the probes for methylated and non-methylated sequences preferably being provided with different fluorescence markers. The fluorescent label is preferably attached to one end of the probe (preferably the 5 'end). At the other end, there is preferably a quencher suitable for the fluorescent label, which suppresses the fluorescence signal. By hybridization or after hybridization and subsequent polymerase effect with the amplified DNA, the quenching effect is abolished and the fluorescence signal detectable. Such fluorescent labels and quenchers are well known to those skilled in the art and commercially available for any probe sequences.
Wenn entsprechende Mehrfarben-Fluoreszenzdetektionssysteme zur Verfügung stehen, wird die digitale PCR bevorzugt ebenfalls als Multiplex-PCR durchgeführt. Zur Quantifizierung werden bevorzugt für jedes amplifizierte Zielgen unterschiedlich farbige Sonden eingesetzt. Die Sonden werden hier bevorzugt so designed, dass sie eine vergleichbare Hybridisierungstemperatur aufweisen. If appropriate multi-color fluorescence detection systems are available, the digital PCR is preferably also performed as a multiplex PCR. For quantification, differently colored probes are preferably used for each amplified target gene. The probes are here preferably designed so that they have a comparable hybridization temperature.
Alternativ werden die Sonden in separaten Ansätzen in der dPCR eingesetzt und ausgewertet. Das trifft auch zu, wenn die Sonden unterschiedliche Hybridisierungs- temperaturen aufweisen. Alternatively, the probes are used in separate batches in the dPCR and evaluated. This also applies if the probes have different hybridization temperatures.
Wenn pro Zielgen mehrere Sonden eingesetzt werden, können diese dieselben Fluoreszenzmarker aufweisen und das Signal integriert werden. Alternativ kommen die beiden oben für die Multiplex-PCR beschriebenen Alternativen zum Einsatz. If several probes are used per target gene, they can have the same fluorescent markers and the signal can be integrated. Alternatively, the two alternatives described above for the multiplex PCR are used.
Bevorzugt werden zur Prä-Amplfikation in Schritt b) Primer eingesetzt, welche methylierte und nicht-methylierte DNA-Sequenzen der Gene PLA2R1 , RASSF1A und GSTP1 amplifizieren (wobei methylierte DNA stärker amplifiziert wird als nicht-methylierte DNA). In Schritt c) wird die Methylierung dieser Zielgene quantifiziert. For the pre-amplification in step b), preference is given to using primers which amplify methylated and unmethylated DNA sequences of the genes PLA2R1, RASSF1A and GSTP1 (whereby methylated DNA is amplified more strongly than non-methylated DNA). In step c) the methylation of these target genes is quantified.
Die Auswahl dieser drei Zielgene ermöglicht wie in den Ausführungsbeispielen gezeigt (s. insbesondere Tabellen 7-1 1 ) vorteilhaft eine Unterscheidung von Gesund und Krank für alle getesteten Tumore (Prostatakarzinom, Mammakarzinom, Ovarialkarzinom und Nierenzellkarzinom). The selection of these three target genes, as shown in the exemplary embodiments (see, in particular, Tables 7-1 1), advantageously makes it possible to differentiate between healthy and diseased for all tumors tested (prostate carcinoma, breast carcinoma, ovarian carcinoma and renal cell carcinoma).
Für die Prä-Amplifikation von methylierten und nicht-methylierten DNA-Sequenzen der Gene PLA2R1 (Phospolipase A2 Rezeptor 1 , HGNC Acc. HGNC 9042, Ensembl: ENSG00000153246), RASSF1A (Rass association (RalGDS/AF-6) domain family member 1 , HGNC Acc. HGNC 9882, Ensembl: ENSG00000068028) und GSTP1 (Gluthathione S-
Transferase pi 1 , HGNC Acc HGNC 4638, Ensembl: ENSG00000084207)) werden in Schritt b) bevorzugt folgende Primerpaare eingesetzt: For the pre-amplification of methylated and unmethylated DNA sequences of the genes PLA2R1 (Phospholipase A2 Receptor 1, HGNC Acc. HGNC 9042, Ensembl: ENSG00000153246), RASSF1A (Rass association (RalGDS / AF-6) domain family member 1, HGNC Acc. HGNC 9882, Ensembl: ENSG00000068028) and GSTP1 (Gluthathione S Transferase pi 1, HGNC Acc HGNC 4638, Ensembl: ENSG00000084207)), the following primer pairs are preferably used in step b):
Optional wird anstelle des PLA2R1 (168 bp) Forward-Primers (SEQ ID No. 1 ) der Forward- Primer gemäß SEQ ID No. 7 und/oder 53 und/oder anstelle des Reverse-Primers (SEG ID NO. 2) einer der folgenden Reverse-Primer (SEQ ID No. 8, 9, 10, oder 1 1 ) eingesetzt: Optionally, instead of the PLA2R1 (168 bp) forward primer (SEQ ID No. 1), the forward primer according to SEQ ID no. 7 and / or 53 and / or instead of the reverse primer (SEG ID NO. 2) of one of the following reverse primers (SEQ ID No. 8, 9, 10 or 11):
Optional werden anstelle des GSTP1 (120 bp) Forward-Primers (SEQ ID No. 5) die Forward-Primer gemäß SEQ ID No. 91 , 93, 95 oder 97 und/oder anstelle des Reverse- Primers (SEG ID NO. 6) die Reverse-Primer gemäß SEQ ID No. 92, 94, 96 oder 98 eingesetzt: Optionally, instead of the GSTP1 (120 bp) forward primer (SEQ ID No. 5), the forward primers according to SEQ ID no. 91, 93, 95 or 97 and / or instead of the reverse primer (SEG ID NO. 6), the reverse primer according to SEQ ID NO. 92, 94, 96 or 98 used:
Target Forward (5λ->3λ) SEQ Reverse (5 λ->3 λ) SEQ Target Forward ( 5λ -> 3λ ) SEQ Reverse ( 5λ -> 3λ ) SEQ
ID ID ID ID
GSTPl CGTAGCGGTTTTAGGGAATTT 91 TCCCCAACGAAACCTAAAAA 92 (114bp)
GSTP1 ATCGTAGCGGTTTTAGGGAA 93 TCCCCAACGAAACCTAAAAA 94 (116bp) GSTPL CGTAGCGGTTTTAGGGAATTT 91 TCCCCAACGAAACCTAAAAA 92 (114bp) GSTP1 ATCGTAGCGGTTTTAGGGAA 93 TCCCCAACGAAACCTAAAAA 94 (116bp)
GSTP1 TGTAAGTTTCGGGATCGTAGC 95 TCCCCAACGAAACCTAAAAA 96 (129bp) GSTP1 TGTAAGTTTCGGGATCGTAGC 95 TCCCCAACGAAACCTAAAAA 96 (129bp)
GSTP1 GTGTGTAAGTTTCGGGATCG 97 TCCCCAACGAAACCTAAAAA 98 (132bp) GSTP1 GTGTGTAAGTTTCGGGATCG 97 TCCCCAACGAAACCTAAAAA 98 (132bp)
Weiter, optional wird anstelle des GSTP1 (120 bp) Forward-Primers (SEQ ID No. 5) der Forward-Primer gemäß SEQ ID No. 12 und/oder anstelle des Reverse-Primers (SEG ID NO. 6) der Reverse-Primer gemäß SEQ ID No. 13 eingesetzt: Further, optionally, instead of the GSTP1 (120 bp) forward primer (SEQ ID No. 5), the forward primer according to SEQ ID no. 12 and / or instead of the reverse primer (SEG ID NO. 6) of the reverse primer according to SEQ ID NO. 13 used:
Dieses Primerpaar ist insbesondere bevorzugt, wenn anschließend in der dPCR die GSTP1 - Sonden mit 4 CpG-Stellen (bevorzugt SEQ ID No 45 und 46 oder jeweils komplementäre Sequenzen) und/oder die GSTP1 -Sonden mit 5 CpG-Stellen (bevorzugt SEQ ID No. 47 und 48 oder jeweils komplementäre Sequenzen) eingesetzt werden. This primer pair is particularly preferred if the GSTP1 probes with 4 CpG sites (preferably SEQ ID Nos. 45 and 46 or complementary sequences) and / or the GSTP1 probes with 5 CpG sites (preferably SEQ ID Nos 47 and 48 or complementary sequences).
Um die Aussagekraft des erfindungsgemäßen Verfahrens oder dessen Anwendungsbereich (weitere Tumoren) weiter zu erhöhen, werden in einer bevorzugten Ausgestaltung zusätzlich methylierte und nicht-methylierte Sequenzen des/der Gene AOX-1 (Aldehyde oxidase 1 , HGNC Acc HGNC 553, Ensembl: ENSG00000138356) und/oder SERPINE-1 (Serpin peptidase inhibitor, HGNC Acc HGNC 8583, Ensembl: ENSG00000106366) und/oder Thrombomodulin (HGNC THBD, HGNC:1 1784, Ensembl:ENSG00000178726) und/oder Septin-9 (SEPT9, HGNC:HGNC:7323 Ensembl:ENSG00000184640) prä-amplifiziert und in Schritt c) die Methylierung dieser Gene quantifiziert. In order to further increase the validity of the method according to the invention or its field of application (further tumors), in a preferred embodiment additionally methylated and unmethylated sequences of the gene AOX-1 (aldehyde oxidase 1, HGNC Acc HGNC 553, Ensemble: ENSG00000138356) and / or SERPINE-1 (serpin peptidase inhibitor, HGNC Acc HGNC 8583, Ensembl: ENSG00000106366) and / or thrombomodulin (HGNC THBD, HGNC: 1 1784, Ensembl: ENSG00000178726) and / or Septin-9 (SEPT9, HGNC: HGNC: 7323 Ensembl: ENSG00000184640) and quantified in step c) the methylation of these genes.
Bevorzugt sind die Primer zur Präamplifikation dieser Zielgene wie folgt ausgewählt: Preferably, the primers for the pre-amplification of these target genes are selected as follows:
Target Forward (5λ->3λ) SEQ Reverse (5 λ->3 λ) SEQ Target Forward ( 5λ -> 3λ ) SEQ Reverse ( 5λ -> 3λ ) SEQ
ID ID ID ID
AOX1 TGGGTTGGATTTTAGGTTTTAG 14 CTCACCTTACGACCGTTC 15 (180 bp)
SERPINE1 AGAGCGTTGTTAAGAAGA 16 C CC ACC AAAA C CAAAA 17AOX1 TGGGTTGGATTTTAGGTTTTAG 14 CTCACCTTACGACCGTTC 15 (180 bp) SERPINE1 AGAGCGTTGTTAAGAAGA 16 C CC ACC AAAA C CAAAA 17
(123 bp) (123 bp)
Optional wird anstelle des AOX1 (180 bp) Forward-Primers (SEQ ID No. 14) der Forward- Primer gemäß SEQ ID No. 18 und/oder anstelle des Reverse-Primers (SEG ID NO. 15) der Reverse-Primer gemäß SEQ ID No. 19 eingesetzt: Optionally, instead of the AOX1 (180 bp) forward primer (SEQ ID No. 14), the forward primer according to SEQ ID no. 18 and / or instead of the reverse primer (SEG ID NO. 15) of the reverse primer according to SEQ ID NO. 19 used:
Dieses Primerpaar ist insbesondere bevorzugt, wenn anschließend in der dPCR die AOX1 - Sonden mit 4 CpG-Stellen (bevorzugt SEQ ID No 39 und 40 oder jeweils komplementäre Sequenzen) und/oder die AOX1 -Sonden mit 5 CpG-Stellen (bevorzugt SEQ ID No. 41 und 42 oder jeweils komplementäre Sequenzen) eingesetzt werden. This primer pair is particularly preferred if the AOX1 probes with 4 CpG sites (preferably SEQ ID Nos. 39 and 40 or in each case complementary sequences) and / or the AOX1 probes with 5 CpG sites (preferably SEQ ID No 41 and 42 or complementary sequences).
Für die Quantifizierung per dPCR werden in Schritt c) bevorzugt Sonden ausgewählt aus den folgenden Sequenzen eingesetzt: For the quantification by dPCR, probes selected from the following sequences are preferably used in step c):
Diese sind komplementär für den coding Strand. These are complementary to the coding beach.
Alternativ kann auch jeweils der (komplementäre) template Strand separat oder gemeinsam mit dem coding Strand in einem Ansatz quantifiziert werden. Dafür sind folgende (komplementäre) Sonden geeignet und bevorzugt: Alternatively, each of the (complementary) template beach can be quantified separately or together with the coding beach in one approach. For this the following (complementary) probes are suitable and preferred:
Target methyliert (5λ->3λ) SEQ nicht-methyliert (5λ->3λ) SEQ
ID IDTarget methylated (5 λ -> 3 λ ) SEQ unmethylated (5 λ -> 3 λ ) SEQ ID ID
PLA2R1 TTGCGTCGCGGAGTAGTTGGG 60 TTTGTGTTGTGGAGTAGTTGGGTT 26 (3 CpG) PLA2R1 TTGCGTCGCGGAGTAGTTGGG 60 TTTGTGTTGTGGAGTAGTTGGGTT 26 (3 CpG)
PLA2R1 CGTTTGCGTCGCGGAGTAGTTG 27 TGTTTGTGTTGTGGAGTAGTTGGGTT 28 (4 CpG) PLA2R1 CGTTTGCGTCGCGGAGTAGTTG 27 TGTTTGTGTTGTGGAGTAGTTGGGTT 28 (4 CpG)
RASSF1A CGGGAGTTGGTATTCGTTGGGCG 29 TTGTGGGAGTTGGTATTTGTTGGGTG 30 (3 CpG) RASSF1A CGGGAGTTGGTATTCGTTGGGCG 29 TTGTGGGAGTTGGTATTTGTTGGGTG 30 (3 CpG)
RASSF1A CGCGGGAGTTGGTATTCGTTGGGCG 31 GAGTTGTGGGAGTTGGTATTTGTTGGGTG 32 (4 CpG) RASSF1A CGCGGGAGTTGGTATTCGTTGGGCG 31 GAGTTGTGGGAGTTGGTATTTGTTGGGTG 32 (4 CpG)
GSTP1 GTTGCGTATATTTCGTTGCG 33 GTTGTGTATATTTTGTTGTG 34 (3 CpG) GSTP1 GTTGCGTATATTTCGTTGCG 33 GTTGTGTATATTTTGTTGTG 34 (3 CpG)
GSTP1 GTTTCGGCGCGTTAGTTCGT 35 GTTTTGGTGTGTTAGTTTGT 36 (4 CpG) GSTP1 GTTTCGGCGCGTTAGTTCGT 35 GTTTTGGTGTGTTAGTTTGT 36 (4 CpG)
GSTP1 GGTTGTAGTGAGTCGTCGAGATCG 49 GAGGTTGTAGTGAGTCGTCGAGATCG 50 (3 CpG) GSTP1 GGTTGTAGTGAGTCGTCGAGATCG 49 GAGGTTGTAGTGAGTCGTCGAGATCG 50 (3 CpG)
GSTP1 TTGTAGTGAGTCGTCGAGATCGCG 51 AGGTTGTAGTGAGTCGTCGAGATCGCG 52 (4 CpG) GSTP1 TTGTAGTGAGTCGTCGAGATCGCG 51 AGGTTGTAGTGAGTCGTCGAGATCGCG 52 (4 CpG)
Sofern zusätzlich methylierte und nicht-methylierte Sequenzen des/der Gene AOX-1 und/oder SERPINE-1 prä-amplifiziert werden, werden in Schritt c) zur Quantifizierung der Methylierung dieser Gene besonders bevorzugt Sonden ausgewählt aus den folgenden Sequenzen und komplementäre Sequenzen eingesetzt: If, in addition, methylated and unmethylated sequences of the gene (s) AOX-1 and / or SERPINE-1 are pre-amplified, particularly preferred probes selected from the following sequences and complementary sequences are used in step c) for quantifying the methylation of these genes:
Target methyliert (5λ->3λ) SEQ nicht-methyliert (5λ->3λ) SEQ Target methylated (5 λ -> 3 λ ) SEQ unmethylated (5 λ -> 3 λ ) SEQ
ID ID ID ID
AOX1 ACTCGAACGCCCGATCCATTATAA 37 ACAACTCAAACACCCAATCCATTATAA 38 (3 CpG) AOX1 ACTCGAACGCCCGATCCATTATAA 37 ACAACTCAAACACCCAATCCATTATAA 38 (3 CpG)
AOX1 CGCTÄÄTTCÜAÄÄÄCCCÜAAACGA 39 CACTÄÄTTCAÄÄÄÄCCCAÄÄÄCAÄ 40 (4 CpG) AOX1 CGCTÄÄTTCÜAÄÄÄÄÄÄÄÄÄÄÄÄÄÄÄÄÄÄÄÄÄÄÄÄÄÄÄÄÄÄÄÄÄÄÄÄÄÄÄÄÄÄÄÄÄÄÄÄÄÄÄÄÄÄÄÄÄÄÄÄÄÄÄÄÄÄÄÄÄÄÄÄÄÄÄÄ 40
AOX1 CGCGCTAÄTTCGAAAACCCGAAACGA 41 CACACTAÄTTCAAAAACCCAAAACÄA 42 (5 CpG) AOX1 CGCGCTAÄTTCGAAAACCCGAAACGA 41 CACACTAÄTTCAAAAACCCAAACAA 42 (5 CpG)
SERPINE1 CGATTAACGATTCGTCCTACTCTAACG 43 CAATTAACAATTCATCCTACTCTAACA 44 (4 CpG)
Alternativ oder ergänzend lassen sich in Schritt b) folgende weitere Primer einsetzen: SERPINE1 CGATTAACGATTCGTCCTACTCTAACG 43 CAATTAACAATTCATCCTACTCTAACA 44 (4 CpG) Alternatively or additionally, the following further primers can be used in step b):
Target Forward (5λ->3λ) SEQ Reverse (5 λ->3 λ) SEQ Target Forward ( 5λ -> 3λ ) SEQ Reverse ( 5λ -> 3λ ) SEQ
ID ID ID ID
RASSF1A GCGTTTGTTAGCGTTTAAAG 61 AACCGAATACGACCCTTC 62 (124bp) RASSF1A GCGTTTGTTAGCGTTTAAAG 61 AACCGAATACGACCCTTC 62 (124bp)
AOX1 GTTGGAT GGT AG AAG 63 GCCCGATCCATTATAATATC 64 (138bp) AOX1 GTTGGAT GGT AG AAG 63 GCCCGATCCATTATAATATC 64 (138bp)
AOX1 GGA TTTAGG TTAGTAAG TC 65 GCCCGA CCA TA AA A CCG 66 (135bp) AOX1 GGA TTTAGG TTAGTAAG TC 65 GCCCGA CCA TA AA A CCG 66 (135bp)
AOX1 GATTTTAGGTTTTAGTAAGTTTCG 67 AOX1 GATTTTAGGTTTTAGTAAGTTTCG 67
(134p) (134p)
AOX1 TTTTAATTAAGGTTTTTTTCGTCG 99 CCCGATCCATTATAATATCCG 100 AOX1 TTTTAATTAAGGTTTTTTCGTCG 99 CCCGATCCATTATAATATCCG 100
(171p) (171P)
SERPINE1 CGTTGTTAAGAAGATTTATAC 68 TAAACCCGAAATAAAAAATTAAA 69 (119bp) SERPINE1 CGTTGTTAAGAAGATTTATAC 68 TAAACCCGAAATAAAA ATTAAA 69 (119bp)
TM GGTCGATTCGTATGTTAGA 70 AACCGTACCGAAACAAAA 71 TM GGTCGATTCGTATGTTAGA 70 AACCGTACCGAAACAAAA 71
(125bp) (125bp)
TM GTTTGGGTTGGGACGGATA 72 AAAAACCAAAACCCCAAACA 73 TM GTTTGGTTGGGACGGATA 72 AAAAACCAAAACCCCAAACA 73
(144bp) (144bp)
TM GTTTGGGGTTTTGGTTTTTG 74 GCAATCCGTCGCAAATCTAA 75 TM GTTTGGGGTTTTGGTTTTTG 74 GCAATCCGTCGCAAATCTAA 75
(166bp) (166bp)
TM CAATCCGTCGCAAATCTAAC 76 TM CAATCCGTCGCAAATCTAAC 76
(165bp) (165bp)
TM TTTGTGTTTTTTTGTTTCGGTAC 101 CACCCGACTACGACTCTACG 102 TM TTTGTGTTTTTTTGTTTCGGTAC 101 CACCCGACTACGACTCTACG 102
(160bp) (160bp)
TM ACCCGACTACGACTCTACGA 103 TM ACCCGACTACGACTCTACGA 103
(159bp) (159bp)
RASSF1A TTTAGTTTGGATTTTGGGGGA 104 C AAC T AAACGC AACAAA 105 RASSF1A TTTAGTTTGGATTTTGGGGGA 104 C AAC T AAACGC AACAAA 105
(86bp) (86bp)
RASSF1A GTTTGGATTTTGGGGGAGC 106 AC TAAACGCTAACAAACG 107 RASSF1A GTTTGGATTTTGGGGGAGC 106 AC TAAACGCTAACAAACG 107
(82bp) (82bp)
RASSF1A TTTGGATTTTGGGGGAGCG 108 CGCTAAC AAACGCTAAC 109 RASSF1A TTTGGATTTTGGGGGAGCG 108 CGCTAAC AAACGCTAAC 109
(82bp) (82bp)
RASSF1A TTTAGTTTGGATTTTGGGGGAG 110 CGCT ACTTTAAACGCT ACAAA 111 RASSF1A TTTAGTTTGGATTTTGGGGGAG 110 CGCT ACTTTAAACGCT ACAAA 111
(86bp)
TM GGTCGATTCGTATGTTAGA 126 AACCGTACCGAAACAAAA 127(86bp) TM GGTCGATTCGTATGTTAGA 126 AACCGTACCGAAACAAAA 127
(125bp) (125bp)
TM TAGCGGTAAGAAGTGTTTG 128 TM TAGCGGTAAGAAGTGTTTG 128
(83bp) (83bp)
TM TACGGTTTTGTCGTAGTG 129 CCCAAACATATTACCCAAAC 130 TM TACGGTTTGTCGTAGTG 129 CCCAAACATATTACCCAAAC 130
(70bp) (70bp)
TM GGAGAGGTTGTCGTTATC 131 CCCAAACATATTACCCAAAC 132 TM GGAGAGGTTGTCGTTATC 131 CCCAAACATATTACCCAAAC 132
(113bp) (113bp)
TM ACCCCAAACATATTACCC 133 TM ACCCCAAACATATTACCC 133
(115bp) (115bp)
TM GTCGAGTACGATTGTTTC 134 ACGCACTATCATTAAATAACC 135 TM GTCGAGTACGATTGTTTC 134 ACGCACTATCATTAAATAACC 135
(99bp) (99bp)
TM CGGTGGTTGTCGATGTTA 136 CCGCAACCGAATAACAAC 137 TM CGGTGGTTGTCGATGTTA 136 CCGCAACCGAATAACAAC 137
(97bp) (97bp)
TM TTGCGGGGTTATTTAATG 138 CAACCGAATAACAACTACA 139 TM TTGCGGGGTTATTTAATG 138 CAACCGAATAACAACTACA 139
(125bp) (125bp)
Septin- 9 GCGATTCGTTGTTTATTAG 140 ATCCGAAATAATCCCATC 141 Septin-9 GCGATTCGTTGTTTATTAG 140 ATCCGAAATAATCCCATC 141
(72bp) (72 bp)
Septin- 9 CGGTTAGTTTTGTATTGTAG 142 Septin-9 CGGTTAGTTTTGTATTGTAG 142
(169bp) (169bp)
Septin- 9 CGGGGTTGTTTTGTTTAAG 143 CCAACACCGACAATCAAA 144 Septin-9 CGGGGTTGTTTTGTTTAAG 143 CCAACACCGACAATCAAA 144
(94bp) (94bp)
Die AOX1 -Primerpaare (SEQ ID No 63 und 64 bzw.65 und 66 bzw. 65 und 67 bzw. 99 und 100) sind insbesondere bevorzugt, wenn anschließend in der dPCR die AOX1 -Sonden mit 4 CpG-Stellen (bevorzugt SEQ ID No 77 und 78 bzw. 79 oder jeweils komplementäre Sequenzen) bzw. die AOX1 -Sonden mit 5 CpG-Stellen (bevorzugt SEQ ID No 1 12 und 1 13 bzw. 1 12 und 1 14 oder jeweils komplementäre Sequenzen) eingesetzt werden. The AOX1 primer pairs (SEQ ID Nos. 63 and 64 or 65 and 66 or 65 and 67 or 99 and 100) are particularly preferred if the AOX1 probes with 4 CpG sites (preferably SEQ ID No 77 and 78 or 79 or in each case complementary sequences) or the AOX1 probes with 5 CpG sites (preferably SEQ ID No 1 12 and 1 13 or 1 12 and 1 14 or respectively complementary sequences) are used.
Die Thrombomodulin (TM)-Primerpaare (SEQ ID No 70 und 71 bzw. 72 und 73 bzw. 101 und 102 bzw. 101 und 103) sind insbesondere bevorzugt, wenn anschließend in der dPCR die TM-Sonden mit 3 CpG-Stellen (bevorzugt SEQ ID No 80 und 81 oder jeweils komplementäre Sequenzen) und die TM-Primerpaare (SEQ ID No 74 und 75 bzw. 74 und 76), wenn die TM- Sonden mit 4 CpG-Stellen (bevorzugt SEQ ID No. 82 und 83 oder jeweils komplementäre Sequenzen) eingesetzt werden.
Die Thrombomodulin (TM)-Primerpaare (SEQ ID No 126 und 127 bzw. 127 und 128) sind insbesondere bevorzugt, wenn anschließend in der dPCR die TM-Sonden mit 3 CpG-Stellen (bevorzugt SEQ ID No 145 und 146 oder jeweils komplementäre Sequenzen) und die TM- Primerpaare (SEQ ID No 129 und 130 bzw. 131 und 132), wenn die TM-Sonden mit 5 CpG- Stellen (bevorzugt SEQ ID No. 147 und 148 oder jeweils komplementäre Sequenzen) eingesetzt werden. Die Thrombomodulin (TM)-Primerpaare (SEQ ID No 131 und 133) sind insbesondere bevorzugt, wenn anschließend in der dPCR die TM-Sonden mit 5 CpG-Stellen (bevorzugt SEQ ID No 149 und 150 oder jeweils komplementäre Sequenzen), die TM- Primerpaare (SEQ ID No 134 und 135), wenn die TM-Sonden mit 3 CpG-Stellen (bevorzugt SEQ ID No. 151 und 152 oder jeweils komplementäre Sequenzen), die TM-Primerpaare (SEQ ID No 136 und 137), wenn die TM-Sonden mit 5 CpG-Stellen (bevorzugt SEQ ID No. 153 und 154 oder jeweils komplementäre Sequenzen), die TM-Primerpaare (SEQ ID No 138 und 139), wenn die TM-Sonden mit 4 CpG-Stellen (bevorzugt SEQ ID No. 155 und 156 bzw. 157 und 158 oder jeweils komplementäre Sequenzen) eingesetzt werden. The thrombomodulin (TM) primer pairs (SEQ ID Nos. 70 and 71 or 72 and 73 or 101 and 102 or 101 and 103) are particularly preferred when subsequently in the dPCR the TM probes with 3 CpG sites (preferred SEQ ID No 80 and 81 or complementary sequences respectively) and the TM primer pairs (SEQ ID No 74 and 75 or 74 and 76), if the TM probes with 4 CpG sites (preferably SEQ ID No. 82 and 83 or each complementary sequences) can be used. The thrombomodulin (TM) primer pairs (SEQ ID Nos. 126 and 127 or 127 and 128) are particularly preferred when subsequently in the dPCR the TM probes with 3 CpG sites (preferably SEQ ID Nos. 145 and 146 or respectively complementary sequences and the TM primer pairs (SEQ ID Nos. 129 and 130 or 131 and 132) when the TM probes are used with 5 CpG sites (preferably SEQ ID Nos. 147 and 148 or complementary sequences, respectively). The thrombomodulin (TM) primer pairs (SEQ ID Nos. 131 and 133) are particularly preferred when subsequently in the dPCR the TM probes with 5 CpG sites (preferably SEQ ID Nos. 149 and 150 or in each case complementary sequences), the TM Primer pairs (SEQ ID Nos. 134 and 135) when the TM probes with 3 CpG sites (preferably SEQ ID Nos. 151 and 152 or complementary sequences, respectively), the TM primer pairs (SEQ ID Nos. 136 and 137), if the TM probes with 5 CpG sites (preferably SEQ ID Nos. 153 and 154 or complementary sequences respectively), the TM primer pairs (SEQ ID Nos. 138 and 139) if the TM probes have 4 CpG sites (preferably SEQ ID No. 155 and 156 or 157 and 158 or complementary sequences respectively).
Die Septin-9-Primerpaare (SEQ ID No 140 und 141 ) sind insbesondere bevorzugt, wenn anschließend in der dPCR die TM-Sonden mit 4 CpG-Stellen (bevorzugt SEQ ID No 159 und 160 oder jeweils komplementäre Sequenzen), die Septin-9-Primerpaare (SEQ ID No 141 und 142), wenn die TM-Sonden mit 4 CpG-Stellen (bevorzugt SEQ ID No. 161 und 162 oder jeweils komplementäre Sequenzen) und die Septin-9-Primerpaare (SEQ ID No 143 und 144), wenn die TM-Sonden mit 2 CpG-Stellen (bevorzugt SEQ ID No. 163 und 164 oder jeweils komplementäre Sequenzen) eingesetzt werden. The septin-9 primer pairs (SEQ ID Nos. 140 and 141) are particularly preferred when subsequently in the dPCR the TM probes with 4 CpG sites (preferably SEQ ID Nos. 159 and 160 or respectively complementary sequences), the Septin-9 Primer pairs (SEQ ID Nos. 141 and 142) when the TM probes have 4 CpG sites (preferably SEQ ID Nos. 161 and 162 or complementary sequences, respectively) and the Septin 9 primer pairs (SEQ ID Nos. 143 and 144) if the TM probes are used with 2 CpG sites (preferably SEQ ID No. 163 and 164 or complementary sequences in each case).
Die RASSFIA-Primerpaare (SEQ ID No 104 und 105 bzw.106 und 107 bzw. 108 und 109 bzw. 1 10 und 1 1 1 ) sind insbesondere bevorzugt, wenn anschließend in der dPCR die RASSFIA-Sonden mit 4 CpG-Stellen (bevorzugt SEQ ID No 1 15 und 1 16 bzw. 1 15 und 1 17 bzw. 1 15 und 1 16 oder jeweils komplementäre Sequenzen) eingesetzt werden. The RASSFIA primer pairs (SEQ ID Nos. 104 and 105 or 106 and 107 or 108 and 109 or 110 and 111) are particularly preferred when the RASSFIA probes with 4 CpG sites (preferably SEQ ID No 1 15 and 1 16 or 1 15 and 1 17 or 1 15 and 1 16 or each complementary sequences) are used.
Für die Quantifizierung per dPCR werden in Schritt c) bevorzugt Sonden ausgewählt aus den folgenden Sequenzen eingesetzt: For the quantification by dPCR, probes selected from the following sequences are preferably used in step c):
Target methyliert (5λ->3λ) SEQ nicht-methyliert (5λ->3λ) SEQ Target methylated (5 λ -> 3 λ ) SEQ unmethylated (5 λ -> 3 λ ) SEQ
ID ID ID ID
AOX1 CGC TÄÄT TTOAÄÄÄCCCÜAÄÄCGA 77 CAC TÄÄT TCAÄÄÄÄCCCAÄÄÄCAÄ 78 (4 CpG) AOX1 CGC TÄÄT TTOAÄÄÄÄÄÄÄÄÄÄÄÄÄÄÄÄÄÄÄÄÄÄÄÄÄÄÄÄÄÄÄÄÄÄÄÄÄÄÄÄÄÄÄÄÄÄÄÄÄÄÄÄÄÄÄÄÄÄÄÄÄÄÄÄÄÄÄÄÄÄÄÄÄÄÄÄÄÄÄÄÄÄÄÄÄÄÄÄÄÄÄÄÄÄÄÄÄÄÄÄÄÄÄÄÄÄÄÄÄÄÄÄÄÄÄÄÄÄÄÄÄÄÄÄÄÄÄÄÄÄÄÄÄÄÄÄÄÄÄÄÄÄÄÄÄÄÄÄÄÄÄÄÄÄÄÄÄÄÄÄÄÄÄÄÄÄÄÄÄÄÄÄÄÄÄÄÄÄÄÄÄÄÄÄÄÄÄÄÄ
AOX1 CACTAATTCÄÄÄÄACCCÄAAÄCÄAAÄÄ 79 (4 CpG)
AOX1 CGCGCTÄÄTTCGAÄÄÄCCCGAÄÄCGA 112 CACACT ATTCAAAAACCCAAAACAA 113 (5 CpG) AOX1 CACTAATTCÄÄÄÄACCCÄAAÄÄÄÄÄÄÄÄÄÄÄÄÄ 79 (4 CpG) AOX1 CGCGCTÄÄTGAGAÄÄÄCGAÄÄCGA 112 CACACT ATTCAAAAACCCAAAACAA 113 (5 CpG)
AOX1 CACACTAATTCAAAAACCCAAAACAAAAA 114 (5 CpG) AOX1 CACACTAATTCAAAACACAAAACAAAAA 114 (5 CpG)
RASSF1A CGCGAACCGAACGAAACCAC 115 CACAAACCAAACAAAACCAC 116 (4 CpG) RASSF1A CGCGAACCGAACGAAACCAC 115 CACAAACCAAACAAACCAC 116 (4 CpG)
RASSF1A CACAAACCAAACAAAACCACAAA 117 (4 CpG) RASSF1A CACAAACCAAACAAAACCACAAA 117 (4 CpG)
RASSF1A AAACACAAACCAAACAAAACCACAAA 118 (4 CpG) RASSF1A AAACACAAACCAAACAAAACCACAAA 118 (4 CpG)
TM ACGCCGATAACGACAACCTCT 80 AAAAAGCAGATAAAGACAACCTCT 81 TM ACGCCGATAACGACAACCTCT 80 AAAAAGCAGATAAAGACAACCTCT 81
(3 CpG) (3 CpG)
TM CCGACTACGACTCTACGAATACGAA 82 CAGACTAAGACTCTAAGAATAAGAAAAAC 83 TM CCGACTACGACTCTACGAATACGAA 82 CAGACTAAGACTCTAAGAATAAGAAAAC 83
(4 CpG) (4 CpG)
TM ACGCCGATAACGACAACCTCT 145 AAGCAGATAAAGACAACCTCT 146 TM ACGCCGATAACGACAACCTCT 145 AAGCAGATAAAGACAACCTCT 146
(3 CpG) (3 CpG)
TM CGCCGCGTACAAACGCCGAA 147 AGCAGAGTACAAAAGCAGAA 148 TM CGCCGCGTACAAACGCCGAA 147 AGCAGAGTACAAAAGCAGAA 148
(5 CpG) (5 CpG)
TM AACGCGCCGCGTACAAACGC 149 AAAGAGCAGAGTACAAAAGC 150 TM AACGCGCCGCGTACAAACGC 149 AAAGAGCAGAGTACAAAAGC 150
(5 CpG) (5 CpG)
TM CGCAATCCGTCGCAAATCTAACT 151 AGCAATCAGTAGCAAATCTAACT 152 TM CGCAATCCGTCGCAAATCTAACT 151 AGCAATCAGTAGCAAATCTAACT 152
(3 CpG) (3 CpG)
TM AACGCCGACGACCAACGCCG 153 AAAGCAGAAGACCAAAGCAG 154 TM AACGCCGACGACCAACGCCG 153 AAAGCAGAAGACCAAAGCAG 154
(5 CpG) (5 CpG)
TM AAAACGCCGACGACCAACGC 155 AAAAAGCAGAAGACCAAAGC 156 TM AAAACGCCGACGACCAACGC 155 AAAAAGCAGAAGACCAAAGC 156
(4 CpG) (4 CpG)
TM AAAACGCCGACGACCAACGCC 157 AAAAAGCAGAAGACCAAAGCC 158 TM AAAACGCCGACGACCAACGCC 157 AAAAAGCAGAAGACCAAAGCC 158
(4 CpG) (4 CpG)
Septin- 9 CGTTAACCGCGAAATCCGACATAAT 159 AGTTAACAGAGAAATCAGACATAAT 160 (4 CpG) Septin-9 CGTTAACCGCGAAATCCGACATAAT 159 AGTTAACAGAGAAATCAGACATAAT 160 (4 CpG)
Septin- 9 CGTTAACCGCGAAATCCGACATAATAA 161 AGTTAACAGAGAAATCAGACATAATAA 162 (4 CpG) Septin-9 CGTTAACCGCGAAATCCGACATAATAA 161 AGTTAACAGAGAAATCAGACATAATAA 162 (4 CpG)
Septin- 9 AAACGCACGCACTCACAAACT 163 AAAAGCAAGCACTCACAAACT 164 (2 CpG) Septin-9 AAACGCACGCACTCACAAACT 163 AAAAGCAAGCACTCACAAACT 164 (2 CpG)
Diese sind komplementär für den coding Strand. These are complementary to the coding beach.
Alternativ kann auch jeweils der (komplementäre) template Strand separat oder gemeinsam mit dem coding Strand in einem Ansatz quantifiziert werden. Dafür sind folgende (komplementäre) Sonden geeignet und bevorzugt:
ie Sonden sind besonders bevorzugt, wie in den Beispielen 5'-FAM (methylierte DNA) bzw. "-HEX (nicht methylierte DNA) markiert und am 3'-Ende mit dem Quencher BHQ-1 markiert.
Die Aufgabe wird weiter gelöst durch ein Kit zur Diagnose einer Tumorerkrankung in einer isolierten Probe enthaltend: i) Primer zur Prä-Amplifikation von methylierten und nicht-methylierten DNA- Sequenzen der Gene PLA2R1 , RASSF1A und GSTP1 mittels PCR, wobei die Primer jeweils so ausgewählt werden, dass Forward- und Reverse-Primer zusammen bis zu sieben, bevorzugt zwei bis sechs, bevorzugt eins bis vier, besonders bevorzugt ein bis drei, weiter bevorzugt drei bis vier, weiter bevorzugt vier bis fünf 5'-CG-3' Dinukleotide aufweisen, Alternatively, each of the (complementary) template beach can be quantified separately or together with the coding beach in one approach. For this the following (complementary) probes are suitable and preferred: The probes are particularly preferred, as marked in the examples 5'-FAM (methylated DNA) or " -HEX (unmethylated DNA) and labeled at the 3 'end with the quencher BHQ-1. The object is further achieved by a kit for the diagnosis of a tumor disease in an isolated sample comprising: i) primers for the pre-amplification of methylated and unmethylated DNA sequences of the genes PLA2R1, RASSF1A and GSTP1 by means of PCR, the primers being selected in each case be that forward and reverse primer together up to seven, preferably two to six, preferably one to four, more preferably one to three, more preferably three to four, more preferably four to five 5'-CG-3 'Dinukleotide have .
ii) Sonden zur Quantifizierung der methylierten und nicht-methylierten DNA- Sequenzen der Gene PLA2R1 , RASSF1A und GSTP1 , bevorzugt wie oben beschrieben jeweils mit einem Fluoreszenz-Marker und einem Quencher. ii) probes for quantifying the methylated and unmethylated DNA sequences of the genes PLA2R1, RASSF1A and GSTP1, preferably as described above, each with a fluorescence marker and a quencher.
Die für die digitale PCR eingesetzten Primer sind entweder identisch zu denen der Prä- Amplifikation. Alternativ und bevorzugt enthält der Kit zusätzlich: iii) Primer für die digitale PCR zur Amplifikation von methylierten und nicht- methylierten DNA-Sequenzen der Gene PLA2R1 , RASSF1A und GSTP1 . The primers used for the digital PCR are either identical to those of the pre-amplification. Alternatively and preferably, the kit additionally contains: iii) primers for the digital PCR for the amplification of methylated and unmethylated DNA sequences of the genes PLA2R1, RASSF1A and GSTP1.
Diese zusätzlichen Primer werden bevorzugt als intrinsische Primer eingesetzt, wenn in der Prä-Amplifikation extrinsische Primer (als nested Primer) eingesetzt wurden. These additional primers are preferably used as intrinsic primers if in the pre-amplification extrinsic primers (as nested primer) were used.
Bevorzugt enthält das Kit weitere Bestandteile ausgewählt aus: The kit preferably contains further constituents selected from:
iv) Reaktionspuffer für die Bias basierte PCR Amplifikation, bevorzugt mit einer Magnesiumchloridkonzentration von 0,5 bis 15,0 mmol/l, bevorzugt 1 ,5 bis 8 mmol/l, weiter bevorzugt bis 3,5 mmol/l Endkonzentration, besonders bevorzugt 2,5 bis 3,5 mmol/l, oder alternativ einen Standard PCR Puffer und eine konzentrierte Magnesiumlösung, v) Reaktionspuffer für die dPCR vi) Desoxyribonukleotid-Mix vii) eine DNA-Polymerase, wie z. B. HotStarTaq Plus, viii) Kontroll-DNA, bevorzugt eine nicht-methylierte DNA-Kontrolle und eine methylierte DNA-Kontrolle, ix) Gebrauchsanweisung und ggf. Computersoftware zur Auswertung. iv) Reaction buffer for bias-based PCR amplification, preferably with a magnesium chloride concentration of 0.5 to 15.0 mmol / l, preferably 1, 5 to 8 mmol / l, more preferably up to 3.5 mmol / l final concentration, particularly preferably 2 , 5 to 3.5 mmol / l, or alternatively a standard PCR buffer and a concentrated magnesium solution, v) reaction buffer for the dPCR vi) deoxyribonucleotide mix vii) a DNA polymerase, such as. HotStarTaq Plus, viii) control DNA, preferably a non-methylated DNA control and a methylated DNA control, ix) instructions for use and possibly computer software for evaluation.
Bevorzugt sind die Primer und Sonden sowie die Kontroll-DNA für das Kit wie weiter oben für das Verfahren beschrieben ausgewählt. Dies gilt insbesondere für die bevorzugten Zielgene
PLAR1 , RASSF1A und GSTP1 aber auch die optionalen zusätzlichen Zielgene AOX1 , SERPINE1 , Thrombomodulin (TM) und/oder Septin-9. Preferably, the primers and probes, as well as the control DNA for the kit are selected as described above for the method. This is especially true for the preferred target genes PLAR1, RASSF1A and GSTP1 but also the optional additional target genes AOX1, SERPINE1, Thrombomodulin (TM) and / or Septin-9.
Als Kontroll-DNA für das erfindungsgemäße Verfahren oder das Kit werden bevorzugt aus primären Zellen oder Zelllinien isolierte DNA verwendet. As control DNA for the method or kit according to the invention, DNA isolated from primary cells or cell lines is preferably used.
Vorzugsweise wird als nicht-methylierte Kontrolle (Negativkontrolle) DNA aus Zellen oder Zelllinien verwendet, in denen die Zielsequenzen nicht methyliert sind. Besonders bevorzugt wird als nicht-methylierte DNA-Kontrolle DNA aus Epithelzellen des dem Tumor entsprechenden gesunden Gewebes verwendet. So wird vorzugweise DNA aus humanen Prostata Epithelzellen (PrEC) oder humanen Mamma-Epithelzellen (HMEC) als nicht- methylierte Kontrolle für Diagnose von Prostata bzw. Mammakarzinomen verwendet. Als negative Kontrolle für den Nachweis von Brustkrebs wird alternativ DNA aus MCF10A- Zelllinien verwendet. Preferably, the non-methylated control (negative control) used is DNA from cells or cell lines in which the target sequences are not methylated. More preferably, DNA from epithelial cells of the healthy tissue corresponding to the tumor is used as the non-methylated DNA control. For example, DNA from human prostate epithelial cells (PrEC) or human mammary epithelial cells (HMEC) is used as unmethylated control for the diagnosis of prostate or breast cancer. As a negative control for the detection of breast cancer, DNA from MCF10A cell lines is alternatively used.
Als methylierte Kontrolle (Positivkontrolle) zum Nachweis von Prostatakarzinomen wird für jedes Zielgen bevorzugt DNA aus einer Zelllinie gewählt, in der die Zielsequenz homogen methyliert vorliegt. Für PLA2R1 wird bevorzugt DNA aus der U937-Leukämiezelllinie und/oder der LNCaP-Zelllinie verwendet; für RASSF1A bevorzugt DNA aus der U937- Leukämie- und/oder PC-3-Zelllinie und für GSTP1 bevorzugt DNA aus der U937- Leukämiezelllinie, der LNCaP- und/oder DU-145-Zelllinie. Für SERPINE1 und Thrombomodulin werden als positive Kontrollen bevorzugt DNA aus der DU-145-Zellinie und/oder für AOX1 bevorzugt DNA aus der U937-Leukämiezelllinie und/oder PC-3-Zellinie verwendet. Für Septin-9 werden als positive Kontrollen bevorzugt DNA aus den LNCaP, PC- 3 und DU-145-Zellinien verwendet. As a methylated control (positive control) for the detection of prostate cancer, DNA from a cell line in which the target sequence is homogeneously methylated is preferably selected for each target gene. For PLA2R1, DNA from the U937 leukemia cell line and / or the LNCaP cell line is preferably used; for RASSF1A preferably DNA from the U937 leukemia and / or PC-3 cell line and for GSTP1 preferably DNA from the U937 leukemia cell line, the LNCaP and / or DU-145 cell line. For SERPINE1 and thrombomodulin, DNA from the DU-145 cell line and / or DNA from the U937 leukemia cell line and / or PC-3 cell line are preferably used as positive controls. For Septin-9, DNAs from the LNCaP, PC-3 and DU-145 cell lines are preferably used as positive controls.
Für den Nachweis von Brustkrebs werden bevorzugt als positive Kontrollen DNA von MCF-7, Cal-51 , UACC-812, BT-474, MDA-MB-453 und/oder MDA-MB231 Zelllinien verwendet. For detection of breast cancer, preferably positive controls are DNA from MCF-7, Cal-51, UACC-812, BT-474, MDA-MB-453 and / or MDA-MB231 cell lines.
Alternativ oder bevorzugt ergänzend wird als positive Kontrolle für heterogen methylierte EpiAllele DNA verwendet, in denen zwei von drei bzw. drei von vier 5'-CG-3' Dinukleotiden methyliert vorliegen. Als Kontrollen für die Identifikation und Quantifizierung von homogen und heterogen methylierten Api-Allele werden besonders bevorzugt DNA-Proben der BPH-1 Zelllinie mitgeführt, in denen Epi-Allele nachgewiesen und als Vergleich bei der Differentialdiagnose von BPH, Prostatitis und Prostatakarzinom genutzt werden. Insbesondere für die Gene PLA2R1 , RASSF1A und/oder GSTP1 wird hier bevorzugt DNA aus der BHP1 -Zellinie verwendet. Bei der Untersuchung der benignen Prostatazelllinie BPH- 1 im Vergleich zu normalen Epithelialzellen der Prostata (PrEC) konnten die Erfinder heterogen methylierte DNA-Fragmente, besonders in den Zielgenen PLA2R1 und RASSF1A
nachweisen (Fig. 18 und 19). Bei Verwendung von Sonden mit mindestens 3 CpG-Stellen in ihren Sequenzen konnten die heterogen methylierten Epi-Allele von den homogen methylierten Epi-Allelen differenziert und quantifiziert werden (Fig. 20-29). Dabei zeigte sich, dass homogen methylierte Epi-Allele gegenüber heterogen methylierten Epi-Allelen spezifisch für Tumor-DNA sind und deren Bestimmung Grundlage für eine stringente und damit sichere Differentialdiagnose von benignen und malignen Erkrankungen, insbesondere der Prostata darstellt. Aus diesem Grund werden Sonden, die mindestens drei 5'-CG-3' bzw. 5'-CA-3' Dinukleotide in ihrer Sequenz enthalten, in der dPCR nach Prä-Amplifikation eingesetzt. Wenn in Einzelfällen mit Hilfe dieser Sonden eine Differenzierung z. B. von benignen Hyperplasien wie der BPH und malignen Erkrankungen wie dem Prostatakarzinom nicht möglich ist, werden Sonden mit vier, fünf oder mehr 5'-CG-3'-Stellen oder wenn auf Grund der Gensequenzen der Zielgene oder dem Design der Sonden dies nicht möglich ist, werden mehrere Sonden mit jeweils drei 5'-CG-3' bzw. 5'-CA-3' Dinukleotide für ein und das selbe Zielgen (target of interest) in der dPCR (Schritt c) des erfindungsgemäßen Verfahrens oder dem Kit verwendet. Auf diese Weise ist eine stringentere Unterscheidung zwischen benignen und malignen Erkrankungen möglich, indem das Vorliegen eines malignem Tumors nur den Proben zugeordnet wird, bei denen zunächst jeweils erhöhte Spiegel an homogen methylierten Epi-Allelen nachgewiesen und quantifiziert werden (d. h. vier, fünf oder sechs 5'-CG-3' sind gleichzeitig methyliert). Stellt sich diese Vorgabe für den Nachweis von Tumor-DNA als zu stringent heraus, so dass die diagnostische Sensitivität zu gering ist, werden bevorzugt heterogen methylierte Epi-Allele mit einer entsprechend hohen Anzahl von methylierten CpG-Stellen (d. h. mindestens jeweils zwei von drei 5'-CG-3' Dinukleotiden methyliert, also gleichzeitig insgesamt vier von sechs untersuchten 5'-CG-3' Dinukleotiden methyliert) quantifiziert und in die Datenauswertung einbezogen. Wie die Ergebnisse der Erfinder bereits demonstrierten, können heterogen methylierte Epi-Allele bei Verwendung der genannten Sondensequenzen quantifiziert werden (Figuren 20-29). Alternatively or preferably additionally used as a positive control for heterogeneously methylated EpiAllele DNA in which two of three or three of four 5'-CG-3 'dinucleotides are methylated. As controls for the identification and quantitation of homogeneously and heterogenously methylated Api alleles DNA samples of the BPH-1 cell line are particularly preferred in which Epi alleles are detected and used as a comparison in the differential diagnosis of BPH, prostatitis and prostate carcinoma. In particular for the genes PLA2R1, RASSF1A and / or GSTP1, DNA from the BHP1 cell line is preferably used here. In the investigation of the benign prostate cell line BPH-1 compared to normal epithelial cells of the prostate (PrEC), the inventors were able to heterogenously methylated DNA fragments, especially in the target genes PLA2R1 and RASSF1A prove (Figures 18 and 19). Using probes with at least 3 CpG sites in their sequences, the heterogenously methylated epi-alleles could be differentiated and quantitated from the homogeneously methylated epi-alleles (Figures 20-29). It was found that homogeneously methylated epi-alleles are heterogeneously methylated epi alleles specific for tumor DNA and their determination is the basis for a stringent and thus safe differential diagnosis of benign and malignant diseases, especially the prostate. For this reason, probes containing at least three 5'-CG-3 'or 5'-CA-3' dinucleotides in their sequence are used in the dPCR after pre-amplification. If in individual cases with the help of these probes a differentiation z. For example, if benign hyperplasias such as BPH and malignancies such as prostate cancer are not possible, probes with four, five or more 5'-CG-3 'sites or if due to the gene sequences of the target genes or the design of the probes will not is possible, several probes, each with three 5'-CG-3 'or 5'-CA-3' dinucleotides for one and the same target gene (target of interest) in the dPCR (step c) of the method or kit used. In this way, a more stringent distinction between benign and malignant diseases is possible by assigning the presence of a malignant tumor only to the samples in which initially elevated levels of homogeneously methylated epi-alleles are detected and quantified (ie four, five or six 5 '-CG-3' are simultaneously methylated). If this requirement for the detection of tumor DNA turns out to be too stringent, so that the diagnostic sensitivity is too low, it is preferable to use heterogenously methylated epi-alleles with a correspondingly high number of methylated CpG sites (ie at least two out of three) '-CG-3' dinucleotides methylated, so simultaneously a total of four of six investigated 5'-CG-3 'dinucleotides methylated) quantified and included in the data analysis. As the results of the inventors have already demonstrated, heterogenously methylated epi-alleles can be quantified using said probe sequences (Figures 20-29).
Gegenstand der Erfindung ist auch die Verwendung des Kits zur Durchführung des erfindungsgemäßen Verfahrens. The invention also relates to the use of the kit for carrying out the method according to the invention.
Der Begriff Tumordiagnostik im Sinne der Erfindung schließt insbesondere das Früherkennungsscreening (Vorsorge), die Prognose, die Verlaufsdiagnostik, Therapiekontrolle und den Nachweis von MRD mit ein. The term tumor diagnosis within the meaning of the invention includes in particular the early detection screening (screening), the prognosis, the course diagnostics, therapy control and the detection of MRD.
Der Nachweis frei-zirkulierender Tumor-DNA mit Hilfe der BBPA-dPCR kann prinzipiell zur Diagnostik eines jeden soliden Tumors eingesetzt werden, insbesondere wenn in Körperflüssigkeiten oder Abstrichen („Liquid Biopsien") entsprechende Zielgensequenzen (target of interest) vorkommen.
Das erfindungsgemäße Verfahren und Kit eignet sich insbesondere zur Diagnostik von malignen Tumoren, wie Prostata-, Mamma-, Nierenzell- und ableitende Harnwegs- und Harnblasen-, Pankreas-, Hoden-, Mundhöhlen- und Rachen-, Speiseröhren-, Kehlkopf-, Schilddrüsen-, Magen-, Ösophagus-, Darm- (insbesondere Kolon- und Rektumkarzinom), Lungen-, Eierstock-, Gebärmutterhals- und Gebärmutterkörper-Karzinomen und Gallenblasen-Karzinomen, malignes Melanom der Haut, Astrozytom, Glioblastom, Neuroblastom, aber auch zur Diagnostik von Non-Hodgkin- und Hodgkin-Lymphomen, Lymphomen der Haut, des ZNS, des Gl-Traktes, Magenlymphome und intestinalen Lymphome und Leukämien. The detection of free-circulating tumor DNA with the aid of BBPA-dPCR can in principle be used for the diagnosis of any solid tumor, in particular if corresponding body tissue or smears ("liquid biopsies") corresponding target gene sequences (target of interest) occur. The method and kit according to the invention are particularly suitable for the diagnosis of malignant tumors, such as prostate, mammary, renal cell and draining urinary tract and urinary bladder, pancreatic, testicular, oral and pharyngeal, esophageal, laryngeal and thyroid glands -, gastric, esophageal, intestinal (especially colon and rectal), lung, ovarian, cervical and uterine carcinomas and gallbladder carcinomas, malignant melanoma of the skin, astrocytoma, glioblastoma, neuroblastoma, but also for diagnosis non-Hodgkin's and Hodgkin's lymphomas, skin, CNS, GI tract, gastric lymphoma and intestinal lymphoma and leukemia.
Eine bevorzugte Einsatzmöglichkeit des Verfahrens und Kits besteht in der allgemeinen Früherkennung (eigenständiges Screening bzw. Vorsorge) maligner Erkrankungen (wozu die oben genannten Tumorentitäten zählen), insbesondere aber in Kombination mit der PSA- Bestimmung und der Indikation für eine Gewebebiopsie bei erhöhten PSA-Werten und der Diagnostik eines Prostatakarzinoms oder in Kombination mit der Mammografie und suspekten Befunden bei der Diagnostik eines Mammakarzinoms oder in Kombination mit dem Vorliegen einer Genmutation mit erhöhtem familiären Risiko für das Mamma- und Ovarialkarzinom und der Entscheidung für eine prophylaktische Mastektomie und/oder Ovariektomie. A preferred application of the method and kit consists in the general early detection (independent screening or prevention) of malignant diseases (which includes the above-mentioned tumor entities), but especially in combination with the PSA determination and the indication for tissue biopsy at elevated PSA levels and the diagnosis of a prostate carcinoma or in combination with the mammography and suspected findings in the diagnosis of breast cancer or in combination with the presence of a gene mutation with increased familial risk for breast and ovarian carcinoma and the decision for a prophylactic mastectomy and / or ovariectomy.
Dabei wird in einer Ausführungsform der Erfindung ein Screening bzw. Vorsorge anhand von gepoolten Proben, z. B. von Serum- oder Plasmaproben, durchgeführt, indem jeweils DNA- Probenmaterial von z. B. 10 und 100 Probanden/Patienten in einem Pool zusammengefasst und zunächst der 100-fache Pool untersucht wird. Lassen sich in einem Pool aus 100 Probanden/Patientenproben Tumor-DNA bestimmten, werden die parallel herstellten 10- fachen Poolproben der entsprechenden Probanden/Patientenproben analysiert. Ist in einem oder mehreren dieser 10-fachen Poolproben Tumor-DNA nachweisbar, werden die Einzelproben analysiert. Lassen sich in den 100-fachen Poolproben keine Tumor-DNA bestimmten, entfallen die Untersuchungen der 10-fachen Poolproben und der Einzelproben. Auf diese Weise können eine große Anzahl von Proben auf das Vorliegen von Tumor-DNA gescreent werden, da auf Grund des stringenten Verstärkungseffektes des BBPA-dPCR- Verfahrens einzelne Tumor-DNA-Moleküle detektiert werden, unabhängig wie hoch die Hintergrunds-DNA-Konzentration ist. In one embodiment of the invention, a screening or prevention on the basis of pooled samples, z. As serum or plasma samples, performed by each DNA sample material of z. B. 10 and 100 subjects / patients in a pool summarized and first 100-fold pool is examined. If tumor DNA can be determined in a pool of 100 test persons / patient samples, the parallel 10-fold pool samples of the corresponding test subjects / patient samples are analyzed. If tumor DNA can be detected in one or more of these 10-fold pool samples, the individual samples are analyzed. If no tumor DNA can be determined in the 100-fold pool samples, the investigations of the 10-fold pool samples and the individual samples are omitted. In this way, a large number of samples can be screened for the presence of tumor DNA since, due to the stringent enhancement effect of the BBPA-dPCR method, individual tumor DNA molecules are detected, regardless of how high the background DNA concentration is ,
Wurde eine Tumorerkrankung diagnostiziert, kann durch die Bestimmung von Tumor-DNA mittels BBPA-dPCR nach Operation, Chemo- oder radiologischer Therapie der Verlauf der Erkrankung kontrolliert und das Vorliegen einer minimalen Resterkrankung (minimal residual disease, MRD) diagnostiziert bzw. ausgeschlossen werden. Lassen sich keine Tumor-DNA
nach erfolgter Therapie nachweisen, ist von einem guten Ansprechen auf die Therapie auszugehen und eine MRD kann ausgeschlossen werden. Sind weiterhin Tumor-DNA nachweisbar, kann das Anlass für eine Therapieoptimierung sein. Lassen sich Tumor-DNA im Verlauf nachweisen, nachdem das zuvor nicht der Fall war, ist von einem Rezidiv auszugehen, das Anlass für eine erneute optimierte Therapie ist. If a tumor disease has been diagnosed, the determination of tumor DNA using BBPA-dPCR after surgery, chemo- or radiological therapy can control the course of the disease and diagnose or rule out the presence of a minimal residual disease (MRD). Do not let tumor DNA After successful therapy, a good response to the therapy can be expected and MRD can be ruled out. If tumor DNA can still be detected, this can be the reason for therapy optimization. If tumor DNA can be detected in the course, after this was not the case, a recurrence is expected, which is the reason for a renewed optimized therapy.
Vorteilhaft eignet sich das erfindungsgemäße Verfahren und Kit besonders zur Differentialdiagnose von benignen Erkrankungen und malignen Tumorerkrankungen. Ganz besonders eignet sich die Erfindung zur Differentialdiagnose benigner Prostatahyperplasie(n), Prostatitis und Prostatakarzinomen, insbesondere wenn nach bisherigen Stand der Technik auf Grund von erhöhten PSA-Werten eine Prostatagewebebiopsie indiziert ist. Durch die erfindungsgemäße Bestimmung der PLA2R1- und RASSF1A- und GS7Pi-Methylierungen (sowie ggf. AOX1-, SERPINE1-, Thrombomodulin- und/oder Septin-9-Methylierungen) mit Hilfe der BBPA-dPCR kann festgestellt werden, inwieweit fcT-DNA in Serum-, Plasma-, Urin- und/oder Seminalflüssigkeit nachweisbar sind. Basierend auf dem ermittelten Methylierungsgrad kann zwischen einer benignen Prostatahyperplasie, Prostatitis und Prostatakarzinomen unterschieden werden, so dass in vielen Fällen eine unnötige Prostatagewebebiopsie und eine Operation vermieden werden kann. Lassen sich z. B. in einer Serum-, Plasma- oder Urinprobe mit Hilfe der BBPA- dPCR keine Tumor-DNA finden, kann eine weitere PSA-Bestimmung (z. B. nach 3 oder 6 Monaten) abgewartet werden. Sind dagegen Tumor-DNA in den Proben nachweisbar, muss die Indikation für eine Gewebebiopsie verstärkt gestellt werden. Advantageously, the method and kit according to the invention are particularly suitable for the differential diagnosis of benign diseases and malignant tumor diseases. The invention is particularly suitable for the differential diagnosis of benign prostatic hyperplasia (s), prostatitis and prostate carcinomas, especially if, according to the prior art, a prostate tissue biopsy is indicated due to increased PSA values. The determination according to the invention of the PLA2R1 and RASSF1A and GS7Pi methylations (and also, if appropriate, AOX1, SERPINE1, thrombomodulin and / or Septin 9 methylations) with the aid of the BBPA-dPCR can be used to determine the extent to which fcT DNA in Serum, plasma, urine and / or seminal fluid are detectable. Benign prostatic hyperplasia, prostatitis and prostate cancer can be differentiated based on the degree of methylation detected, so that in many cases unnecessary prostate tissue biopsy and surgery can be avoided. Can be z. For example, if no tumor DNA is found in a serum, plasma or urine sample using BBPA-dPCR, further PSA determination (eg after 3 or 6 months) can be awaited. If, on the other hand, tumor DNA can be detected in the samples, the indication for tissue biopsy must be strengthened.
Vorteilhaft eignet sich das erfindungsgemäße Verfahren und Kit auch zur Differentialdiagnose von Mamma-Karzinomen, insbesondere wenn auf Grund von suspekten Mammografie-Befunden nach bisherigem Stand der Technik eine Gewebebiopsie indiziert ist. Durch die erfindungsgemäße Bestimmung der PLA2R1- und RASSF1A- und GSTP1- Methylierungen (sowie ggf. AOX1-, SERPINE1-, Thrombomodulin- und/oder Septin-9- Methylierungen) mit Hilfe der BBPA-dPCR kann festgestellt werden, inwieweit fcT-DNA in Serum-, Plasma-, Urin- und/oder Brustsekreten nachweisbar sind. Basierend auf dem ermittelten Methylierungsgrad kann zwischen einer benignen Mikrokalzifizierung oder Zyste und einem Mammakarzinom unterschieden werden, so dass in vielen Fällen bei falschpositiven Befunden des Mammografie-Screenings eine Gewebebiopsie und Operation vermieden werden kann. Etwa zwei Drittel aller Frauen, bei denen im Alter von 40 Jahren mit einem jährlichen Mammographie-Screening beginnen, treten in den ersten zehn Jahren falsch-positive Befunde auf. Bei 7 Prozent kommt es zu einer unnötigen Biopsie [20].
Andererseits können falsch-negative Befunde im Mammografie-Screening durch das erfindungsgemäße Verfahren und entsprechenden Kits vermindert werden. Advantageously, the method and kit according to the invention is also suitable for the differential diagnosis of breast carcinomas, in particular if tissue biopsy is indicated on the basis of suspicious mammographic findings according to the prior art. The determination according to the invention of the PLA2R1 and RASSF1A and GSTP1 methylations (and also, if appropriate, AOX1, SERPINE1, thrombomodulin and / or Septin 9 methylations) with the aid of the BBPA-dPCR can be used to determine the extent to which fcT-DNA in Serum, plasma, urine and / or Brustsekreten are detectable. Based on the determined degree of methylation, a distinction can be made between a benign microcalcification or cyst and a breast carcinoma, so that in many cases a false biopsy result of mammography screening can be used to avoid tissue biopsy and surgery. About two-thirds of all women starting annual mammography screening at the age of 40 experience false-positive results in the first ten years. At 7 percent there is an unnecessary biopsy [20]. On the other hand, false-negative findings in mammography screening can be reduced by the method according to the invention and corresponding kits.
Das erfindungsgemäße Verfahren und Kit eignet sich auch zur Differentialdiagnose von Ovarialkarzinomen, insbesondere wenn auf Grund von suspekten Sonografie-Befunden die Frage nach einer benignen Veränderung wie Zysten oder einem Karzinom der Ovarien besteht und nach bisherigem Stand der Technik weitere invasive diagnostische Verfahren eingesetzt werden sollen. The inventive method and kit is also suitable for the differential diagnosis of ovarian cancer, especially if due to suspicious ultrasound findings there is the question of a benign change such as cysts or a carcinoma of the ovaries and according to the prior art further invasive diagnostic methods are to be used.
Des Weiteren ist das erfindungsgemäße Verfahren und Kit bei Vorliegen einer pathologischen Genmutation mit einem erhöhten familiären Risiko für Mamma- und Ovarialkarzinomen, wie z.B im BRCA1 und BRCA2-Gen, als weitere Entscheidungshilfe für eine prophylaktische Mastektomie und/oder Ovariektomie geeignet, insbesondere wenn die Familienplanung der betroffenen Patienten noch nicht beendet ist. Furthermore, in the presence of a pathological gene mutation with an increased familial risk for breast and ovarian carcinomas, such as in the BRCA1 and BRCA2 gene, the method and kit according to the invention is suitable as further decision support for a prophylactic mastectomy and / or ovariectomy, in particular if the family planning the affected patient has not yet finished.
Das erfindungsgemäße Verfahren eröffnet neue Möglichkeiten in der Diagnostik von Tumorerkrankungen, insbesondere in der Frühdiagnostik, da hierdurch einzelne cf-Tumor- DNA-Kopien vor dem großen Hintergrund normaler Wildtyp-DNA in Blut, Urin oder anderen biologischen Proben entsprechend spezifisch vervielfältig werden, bevor die Quantifizierung in der dPCR folgt. The method according to the invention opens up new possibilities in the diagnosis of tumor diseases, in particular in early diagnostics, since in this way individual cf tumor DNA copies corresponding to the large background of normal wild-type DNA in blood, urine or other biological samples are correspondingly specifically multiplied before the Quantification in the dPCR follows.
Wenngleich auf Grund der eingeführten Bias das ursprüngliche Verhältnis zwischen methylierten DNA-Fragmenten als Zeichen einer malignen Entartung und der normalen nicht-methylierten Wildtyp-DNA sich verändert, können die mit Hilfe der BBPA-dPCR ermittelten Daten für eine Prognose-Einschätzung (Tumor-Last), Ansprechen auf eine Therapie (Abfall oder Konstanz der fcT-DNA), Resterkrankung (minimal residual disease) und der Nachsorge von Tumorpatienten (Rezidiv durch Wiederanstieg von fcT-DNA) eingesetzt werden. Grundlage dafür ist, dass im erfindungsgemäßen Verfahren der Grad die Bias durch Wahl von Annealingtemperatur, Magnesiumkonzentration im Reaktionspuffer und Zyklenanzahl variabel gestaltet werden kann und die Bias unter konstanten Bedingungen zwischen den einzelnen zu untersuchenden Proben gleich groß und damit eine relative Quantifizierung möglich ist. Although the initial bias between methylated DNA fragments as a sign of malignant degeneration and normal non-methylated wild-type DNA changes due to the bias introduced, the data obtained by BBPA-dPCR can be used for a prognosis (tumor burden ), Response to therapy (decrease or constancy of the fcT DNA), residual disease (minimal residual disease) and follow-up of tumor patients (relapse due to reincrease of fcT DNA). The basis for this is that in the method according to the invention the degree of bias can be made variable by the choice of annealing temperature, magnesium concentration in the reaction buffer and number of cycles and the bias under constant conditions between the individual samples to be examined the same size and thus a relative quantification is possible.
Ein weiterer Vorteil von Bias-induzierenden Oligonukleotiden (BIP) gegenüber methylspezifischen Oligonukleotiden (MSP) besteht darin, dass die Anzahl normaler Wildtyp- DNA-Fragmente als interne Kontrolle verwendet werden kann. Auch ist durch den Einsatz eines Primerpaares, das die gleichzeitige Quantifizierung methylierter und nicht-methylierter
DNA-Sequenzen ermöglicht, ausgeschlossen, dass unterschiedliche Anteile von Zielgen- Fragmenten (target of interest) und internen Kontrollgenfragmenten wie ALU-Sequenzen zu falschen Ergebnissen führen. Another advantage of bias-inducing oligonucleotides (BIP) over methyl-specific oligonucleotides (MSP) is that the number of normal wild-type DNA fragments can be used as an internal control. Also, by using a primer pair, the simultaneous quantification is methylated and unmethylated Excluding DNA sequences, it is impossible that different proportions of target gene fragments and internal control gene fragments such as ALU sequences lead to false results.
Gegenstand der Erfindung sind auch die Primer gemäß den Sequenzen 1 bis 19, 53, 61 bis 76, 91 bis 1 1 1 sowie 126 bis 144 und die Nukleinsäuresonden gemäß den Sequenzen 20 bis 52, 54 bis 60, 77 bis 90, 1 12 bis 125 und 145 bis 184 sowie deren Verwendung für die oben genannten Zwecke. The invention also relates to the primers according to the sequences 1 to 19, 53, 61 to 76, 91 to 1 1 1 and 126 to 144 and the nucleic acid probes according to the sequences 20 to 52, 54 to 60, 77 to 90, 1 12 to 125 and 145 to 184 and their use for the purposes mentioned above.
Anhand der nachfolgenden Abbildungen und Beispiele wird die Erfindung näher erläutert ohne diese zu beschränken. Based on the following figures and examples, the invention is explained in more detail without limiting this.
Die Abbildungen zeigen: The pictures show:
Fig. 1 : Skizze zur bevorzugten Durchführung der erfindungsgemäßen BBPA-dPCR FIG. 1: Sketch for the preferred implementation of the BBPA-dPCR according to the invention
Fig. 2: Kopienanzahl methylierter (methyl) und nicht-methylierter (unmethyl) RASSF1A- Sequenzen in Abhängigkeit von der Annealingtemperatur bei 30 Zyklen und 2,5 mmol/l MgCI2-Konzentration in der BBPA in Serumpoolproben gesunder Probandinnen (BA) oder Patientinnen mit Mamma-Karzinom (Mamma-CA, siehe auch Tabelle 2). FIG. 2: Copy number of methylated (methyl) and unmethylated (unmethyl) RASSF1A sequences as a function of the annealing temperature at 30 cycles and 2.5 mmol / l MgCl 2 concentration in the BBPA in serum pool samples of healthy volunteers (BA) or patients with breast carcinoma (mamma CA, see also Table 2).
Fig. 3: Kopienanzahl methylierter (methyl) und nicht-methylierter (unmethyl) RASSF1A- Sequenzen in Abhängigkeit von der Zyklenanzahl (0 [d. h. ohne BBPA], 8, 12 und 16) bei 60°C und 2,5 mmol/l MgCI2-Konzentration in der BBPA in Serumpoolproben gesunder Probandinnen (BA) oder Patientinnen mit Mamma-Karzinom (Mamma-CA, siehe auch Tabelle 3). FIG. 3: Copy number of methylated (methyl) and unmethylated (unmethyl) RASSF1A sequences as a function of the number of cycles (0 [ie without BBPA], 8, 12 and 16) at 60 ° C. and 2.5 mmol / l MgCl 2 concentration in BBPA in serum pool samples from healthy volunteers (BA) or patients with breast carcinoma (mamma CA, see also Table 3).
Fig. 4: Kopienanzahl methylierter (methyl) und nicht-methylierter (unmethyl) RASSF1A- Sequenzen in Abhängigkeit von der Zyklenanzahl (0 [d. h. ohne BBPA], 8, 12, 16 [siehe Fig. 3 zuvor] und 40) bei 60°C und 2,5 mmol/l MgCI2-Konzentration in der BBPA in Serumpoolproben gesunder Probandinnen (BA) oder Patientinnen mit Mamma-Karzinom (Mamma-CA, siehe auch Tabelle 3). Fig. 4: Copy number of methylated (methyl) and unmethylated (unmethyl) RASSF1A sequences as a function of the number of cycles (0 [ie without BBPA], 8, 12, 16 [see Fig. 3 above] and 40) at 60 ° C and 2.5 mmol / l MgCl 2 concentration in the BBPA in serum pool samples of healthy volunteers (BA) or patients with breast carcinoma (mamma CA, see also Table 3).
Fig. 5 (Vergleichsdaten): Anzahl FAM-positiver (obere Abbildung) und HEX-positiver (untere Abbildung) Signale für methylierte und nicht-methylierte RASSFIA-Seq Uenzen in der dPCR ohne BBPA in Serumpoolproben gesunder Probandinnen (BA) und Patientinnen mit Mamma-Karzinom (Mamma-CA). NTC, Non-Template-Kontrolle (ohne DNA). Geschlossene Pfeile zeigen zwei FAM-positive Signale in der Serumpoolprobe von Patientinnen mit Mamma-CA, die offenen Pfeile markieren FAM-positive Signale, die in ihrer Fluoreszenzstärke sowohl in der Serumpoolprobe gesunder Probandinnen und Patientinnen mit Mamma-CA vorkommen. In der unteren Abbildungen sind die HEX-positiven Signale für
nicht-methylierte RASSF1A-Seq Uenzen in den Serumpoolproben gesunder Probandinnen und Patientinnen mit Mamma-CA oberhalb der Grenzlinie zu sehen, die in den NTC-Proben wie auch FAM-positive Signale fehlen. Unterhalb der Grenzlinien sind die Signale der doppelt-negativen Tröpfchen dargestellt. Die Poolproben BA und Mamma-CA sind identisch zu denen in Fig. 2-4 untersuchten Proben. Fig. 5 (comparative data): Number of FAM-positive (upper panel) and HEX-positive (lower panel) signals for methylated and unmethylated RASSFIA sequences in the dPCR without BBPA in serum pool samples of healthy volunteers (BA) and patients with breast Carcinoma (mamma CA). NTC, non-template control (without DNA). Closed arrows show two FAM-positive signals in the serum pool sample of patients with mamma CA. The open arrows mark FAM-positive signals, which occur in their fluorescence intensity both in the serum pool sample of healthy subjects and mamma CA. In the pictures below are the HEX positive signals for Unmethylated RASSF1A Seq Uenzen in the serum pool samples of healthy subjects with mamma CA above the borderline missing in the NTC samples as well as FAM positive signals. Below the borderline the signals of the double-negative droplets are shown. Pool samples BA and Mamma-CA are identical to those in Figures 2-4.
Fig. 6 (Vergleichsdaten): MS-HRM-Analyse des ft^SSFM-Methylierungsgrades in Serumpoolproben gesunder Probandinnen (offener Pfeil) und Probandinnen mit Mamma- Karzinom (geschlossener Pfeil) durch Schmelzkurvenanalyse, in der keine methylierten Anteile festzustellen waren. Unterbrochene Linien: Standard-DNA-Proben mit nicht- methylierter (0 %) und methylierter (100 %)-DNA. Die Poolproben BA und Mamma-CA sind identisch zu denen in Fig. 2-4 untersuchten Proben. Fig. 6 (comparative data): MS-HRM analysis of the ft ^ SSFM methylation degree in serum pool samples of healthy volunteers (open arrow) and women with mammary carcinoma (closed arrow) by melting curve analysis in which no methylated portions were observed. Broken lines: standard DNA samples with unmethylated (0%) and methylated (100%) DNA. Pool samples BA and Mamma-CA are identical to those in Figures 2-4.
Fig. 7 (Vergleichsdaten): Relative Häufigkeit (Y-Achse in %) methylierter RASSF1A- Sequenzen in fc-DNA-Proben aus Serum von gesunden Probandinnen (K1 -K10, links) und an Mamma-CA erkrankten Patientinnen (P1 -P10, rechts) nach dPCR ohne BBPA. Neben den Medianwerten sind die Poisson-Variationsbereiche dargestellt. Die offenen Pfeile zeigen 4 von 10 Proben von Patientinnen mit Mamma-CA, die richtig als pathologisch identifiziert wurden. Fig. 7 (comparative data): Relative frequency (Y axis in%) of methylated RASSF1A sequences in fc DNA samples from serum of healthy test subjects (K1-K10, left) and patients suffering from mamma CA (P1-P10, right) to dPCR without BBPA. In addition to the median values, the Poisson variation ranges are shown. The open arrows show 4 out of 10 samples from patients with mammary CA that have been correctly identified as pathological.
Fig. 8: Relative Häufigkeit (Y-Achse in %) methylierter RASSFIA-Seq Uenzen in fc-DNA- Proben aus Serum von gesunden Probandinnen (K1 -K10, links) und an Mamma-CA erkrankten Patientinnen (P1 -P10, rechts) nach BBPA-dPCR (15 Zyklen bei 52°C und 2,5 mmol/l MgCI2-Konzentration unverdünnt in der anschließenden dPCR). Die ausgefüllten Pfeile links zeigen die Werte für die Proben K1 -K10 der gesunden Probandinnen und rechts von 2 Proben (P5 und P9), für die keine erhöhten RASSF A-Methylierungen gefunden wurden. Die nicht-ausgefüllten Pfeile zeigen 8 von 10 Proben von Mamma-CA-Patientinnen, für die ein richtig positiver Wert gefunden wurde. Die Ergebnisse der BBPA-dPCR und MS- HRM-Analysen sind in Tabelle 7 zusammengefasst. FIG. 8: Relative frequency (Y-axis in%) of methylated RASSFIA sequences in fc-DNA samples from serum of healthy test subjects (K1-K10, left) and patients suffering from mamma CA (P1-P10, right) after BBPA-dPCR (15 cycles at 52 ° C and 2.5 mmol / l MgCl 2 concentration undiluted in the subsequent dPCR). The filled-in arrows on the left show the values for samples K1-K10 of healthy subjects and to the right of 2 samples (P5 and P9) for which no elevated RASSF A methylation was found. The unfilled arrows show 8 out of 10 samples from mammary CA patients for which a true positive score was found. The results of the BBPA-dPCR and MS-HRM analyzes are summarized in Table 7.
Fig. 9 (Vergleichsdaten): Methylierungsgrad von RASSFIA-Sequenzen in fc-DNA-Proben aus Serum von gesunden Probandinnen (K1 -K10, Tabelle 7) und an Mamma-CA erkrankten Patientinnen (P1 -P10, Tabelle 7) nach MS-HRM-Analyse. Die Pfeile in C und D zeigen die Proben K8 und K9, die in der MS-HRM schwach positive Methylierungsgrade aufwiesen, in der BBPA-dPCR aber eindeutig negative Ergebnisse lieferten (siehe Fig. 8). Die Probe P1 , für die in der BBPA-dPCR ein deutlich erhöhter Methylierungsgrad für RASSF1A zugeordnet wurde (Fig. 8), weist in der MS-HRM ein scheinbar negatives Ergebnis auf (E und F). A, C und E: relative Signaländerungen in Beziehung zum 0 %-DNA-Standard; B, D und F: Schmelzkurvencharakteristik der MS-HRM-Amplifikate in Beziehung zu den 0 %- und 100 %-
DNA-Standards. Die Ergebnisse der MS-HRM- und BBPA-dPCR-Analysen sind in Tabelle 7 zusammengefasst. Figure 9 (comparative data): Methylation level of RASSFIA sequences in fc DNA samples from serum from healthy volunteers (K1-K10, Table 7) and from mamma CA-affected patients (P1-P10, Table 7) after MS-HRM -Analysis. The arrows in C and D show the samples K8 and K9, which had weakly positive methylation levels in the MS-HRM, but clearly gave negative results in the BBPA-dPCR (see FIG. 8). Sample P1, for which a significantly increased degree of methylation for RASSF1A was assigned in the BBPA-dPCR (FIG. 8), has an apparently negative result in the MS-HRM (E and F). A, C and E: relative signal changes in relation to the 0% DNA standard; B, D and F: Melting curve characteristics of the MS-HRM amplicons in relation to the 0% and 100% DNA standards. The results of the MS-HRM and BBPA-dPCR analyzes are summarized in Table 7.
Fig. 10: Bestimmung des Methylierungsgrades des PLA2R1 -Gens (Y-Achse in %) in fc- DNA-Proben aus Serum gesunder Probanden (K1 -K10) und Prostatakarzinom-Patienten (P1 -P10) mit Hilfe der BBPA-dPCR (35 Zyklen bei 59°C und 2,5 mmol/l MgCI2-Konzentration und 1 :104-Verdünnung mit anschließender dPCR). In den Proben K10 und P3, für die keine Werte angezeigt sind, betrug der Methylierungsgrad jeweils 0 %. Fig. 10: Determination of the degree of methylation of the PLA2R1 gene (Y-axis in%) in fc DNA samples from serum of healthy subjects (K1 -K10) and prostate cancer patients (P1 -P10) using BBPA-dPCR (35 Cycles at 59 ° C and 2.5 mmol / l MgCl 2 concentration and 1: 10 4 dilution followed by dPCR). In samples K10 and P3, for which no values are indicated, the degree of methylation was 0% in each case.
Fig. 11 : Bestimmung des Methylierungsgrades des RASSF1 A-Gens (Y-Achse in %) in fc- DNA-Proben aus Serum gesunder Probanden (K1 -K10) und PCa-Patienten (P1 -P10) mit Hilfe der BBPA-dPCR (50 Zyklen bei 59°C und 2,5 mmol/l MgCI2-Konzentration und 1 : 104- Verdünnung mit anschließender dPCR). In den Proben K2-K5, K8, K9 und P8, für die keine Werte angezeigt sind, betrug der Methylierungsgrad jeweils 0 %. FIG. 11: Determination of the degree of methylation of the RASSF1A gene (Y axis in%) in fc DNA samples from serum of healthy subjects (K1 -K10) and PCa patients (P1 -P10) with the aid of BBPA-dPCR (FIG. 50 cycles at 59 ° C and 2.5 mmol / l MgCl 2 concentration and 1: 10 4 dilution with subsequent dPCR). In samples K2-K5, K8, K9 and P8, for which no values are indicated, the degree of methylation was 0% in each case.
Fig. 12: Bestimmung des Methylierungsgrades des GSTP1-Gens (Y-Achse in %) in fc-DNA- Proben aus Serum gesunder Probanden (K1 1 -K20) und Prostatakarzinom-Patienten (P1 1 - P19) mit Hilfe der BBPA-dPCR-Analyse (35 Zyklen bei 57°C und 2,5 mmol/l MgCI2- Konzentration und 1 :25 x 103-Verdünnung mit anschließender dPCR bei 51 ,9°C). In den Proben K12, K12, K16 und K19, für die keine Werte angezeigt sind, betrug der Methylierungsgrad jeweils 0 %. Fig. 12: Determination of the degree of methylation of the GSTP1 gene (Y-axis in%) in fc-DNA samples from serum of healthy subjects (K1 1 -K20) and prostate cancer patients (P1 1 -P19) using the BBPA-dPCR Analysis (35 cycles at 57 ° C and 2.5 mmol / l MgCl 2 concentration and 1: 25 x 10 3 dilution followed by dPCR at 51.9 ° C). In samples K12, K12, K16 and K19, for which no values are indicated, the degree of methylation was 0% in each case.
Fig. 13: 2-D-Darstellung der FAM-positiven Signale (methylierte DNA-Sequenzen, Y-Achse) und HEX-positiven Signale (nicht-methylierte DNA-Sequenzen, X-Achse) des GSTP1-Gens in fc-DNA-Proben aus Serum gesunder Probanden (K1 -K7, K9 und K10, in A) und von Prostatakarzinom-Patienten (P1 in B, P3 in C und P6 in D, siehe auch Tabelle 8) mit Hilfe der BBPA-dPCR (35 Zyklen bei 57°C und 2,5 mmol/l MgCI2-Konzentration und 1 :25 x 103- Verdünnung in anschließender dPCR bei 51 ,9°C). Die Pfeile zeigen die positiven Tröpfchen, die in den Proben der gesunden Probanden (siehe in A) nicht vorkamen. 13: 2-D representation of the FAM-positive signals (methylated DNA sequences, Y-axis) and HEX-positive signals (non-methylated DNA sequences, X-axis) of the GSTP1 gene in fc-DNA Samples from serum of healthy volunteers (K1 -K7, K9 and K10, in A) and prostate cancer patients (P1 in B, P3 in C and P6 in D, see also Table 8) using the BBPA-dPCR (35 cycles at 57 ° C and 2.5 mmol / l MgCl 2 concentration and 1:25 x 10 3 dilution in subsequent dPCR at 51.9 ° C). The arrows show the positive droplets that did not occur in the samples of healthy volunteers (see in A).
Fig. 14: ROC-Analyse der mittels BBPA-dPCR bestimmten Methylierungsgrade von PLA2R1-, RASSF1A- und GSTP1-Genen allein und in Kombination bei der Untersuchung von fc-DNA-Proben aus Serum gesunder Probanden und Prostatakarzinom-Patienten (die einzelnen Ergebnisse sind in Tabelle 8 zusammengefasst). FIG. 14: ROC analysis of the levels of methylation of PLA2R1, RASSF1A and GSTP1 genes determined by BBPA-dPCR alone and in combination in the study of fc DNA samples from serum of healthy volunteers and prostate carcinoma patients (the individual results are summarized in Table 8).
Fig. 15: Bestimmung des Methylierungsgrades des PLA2R1 -Gens (Y-Achse in %) in fc- DNA-Proben aus Serum von Patienten mit PSA-Werten zwischen 3,5-15,0 ng/ml (Ausnahme Probe M2 mit einem PSA-Wert von 31 15 ng/ml) mit Hilfe der BBPA-dPCR (15 Zyklen bei 59°C und 2,5 mmol/l MgCI2-Konzentration in der BBPA und unverdünnter Einsatz in der dPCR bei 58,8°C). Neben den Medianwerten sind die Poisson-Variationsbereiche gezeigt. In der Probe M15, für die kein Wert angezeigt ist, betrug der Methylierungsgrad 0 %.
Fig. 16: Bestimmung des Methylierungsgrades des (Y-Achse in %) in fc-DNA- Proben aus Serum von Patienten mit PSA-Werten zwischen 3,5-15,0 ng/ml (Ausnahme Probe M2 mit einem PSA-Wert von 31 15 ng/ml) mit Hilfe der BBPA-dPCR (15 Zyklen bei 57°C und 2,5 mmol/l MgCI2-Konzentration in der BBPA und unverdünnter Einsatz in der dPCR bei 51 ,9°C). Neben den Medianwerten sind die Poisson-Variationsbereiche gezeigt. In der Probe M10, für die kein Wert angezeigt ist, betrug der Methylierungsgrad 0 %. Fig. 15: Determination of the degree of methylation of the PLA2R1 gene (Y axis in%) in fc DNA samples from serum of patients with PSA values between 3.5-15.0 ng / ml (exception sample M2 with a PSA value of 31 15 ng / ml) using the BBPA-dPCR (15 cycles at 59 ° C and 2.5 mmol / l MgCl 2 concentration in the BBPA and undiluted use in dPCR at 58.8 ° C). In addition to the median values, the Poisson variation ranges are shown. In sample M15, for which no value is indicated, the degree of methylation was 0%. Fig. 16: Determination of the degree of methylation of the (Y-axis in%) in fc-DNA samples from serum of patients with PSA values between 3.5-15.0 ng / ml (exception sample M2 with a PSA value of 31 15 ng / ml) using BBPA-dPCR (15 cycles at 57 ° C and 2.5 mmol / l MgCl 2 concentration in the BBPA and undiluted use in the dPCR at 51, 9 ° C). In addition to the median values, the Poisson variation ranges are shown. In the sample M10 for which no value is indicated, the methylation degree was 0%.
Fig. 17: Relative Häufigkeit methylierter PL^2 ?7-Sequenzen (Y-Achse in %) in fc-DNA- Proben aus Serum von gesunden Probanden (K1 1 -K18) und an Nierenzellkarzinomen erkrankten Patienten (N1 -N10) nach BBPA-dPCR (15 Zyklen bei 59°C und 2,5 mmol/l MgCI2- Konzentration und unverdünnt in dPCR bei 58,8°C). Neben den Medianwerten sind die Poisson-Variationsbereiche gezeigt. In den Proben K1 1 , K13-K18, N5 und N9, für die keine Werte angezeigt sind, betrug der Methylierungsgrad 0 %. Fig. 17: Relative frequency of methylated PL ^ 2? 7 sequences (Y axis in%) in fc DNA samples from serum of healthy subjects (K1 1 -K18) and patients suffering from renal cell carcinoma (N1 -N10) after BBPA -dPCR (15 cycles at 59 ° C and 2.5 mmol / l MgCl 2 - concentration and undiluted in dPCR at 58.8 ° C). In addition to the median values, the Poisson variation ranges are shown. In samples K1 1, K13-K18, N5 and N9, for which no values are indicated, the degree of methylation was 0%.
Fig. 18 (Vergleichsdaten): FAM-Signale (oben) für methylierte und HEX-Signale (unten) für nicht-methylierte PLA2R1-Seq Uenzen in DNA-Proben aus PrEC, BPH-1 , LNCaP, PC-3, DU- 145 und U937-Zelllinien und Non-Template-Kontrolle (keine DNA vorgelegt, NTC). Die Bisulfit-umgewandelte DNA wurde ohne BBPA in 40 Zyklen bei 58,8°C in der dPCR quantifizert. Der schmale Pfeil zeigt die durch mismatch nachweisbaren heterogen methylierten Epi-Allele in den BPH-1 -Zellen, die auch in LNCaP-, PC-3- und DU-145-Zellen nachweisbar waren. Im Vergleich dazu die homogen methylierten Epi-Allele in den Tumorzelllinien LNCaP, PC-3, DU-145 und U937-Zelllinien (dicker Pfeil). Figure 18 (comparative data): FAM signals (top) for methylated and HEX signals (bottom) for unmethylated PLA2R1 sequences in DNA samples from PrEC, BPH-1, LNCaP, PC-3, DU-145 and U937 cell lines and non-template control (no DNA submitted, NTC). The bisulfite converted DNA was quantified without BBPA for 40 cycles at 58.8 ° C in the dPCR. The narrow arrow shows the mismatch detectable heterogenous methylated epi-alleles in the BPH-1 cells, which were also detectable in LNCaP, PC-3 and DU-145 cells. In comparison, the homogeneously methylated epi-alleles in the tumor cell lines LNCaP, PC-3, DU-145 and U937 cell lines (thick arrow).
Fig. 19 (Vergleichsdaten): FAM-Signale (oben) für methylierte und HEX-Signale (unten) für nicht-methylierte RASSFIA-Seq Uenzen in DNA-Proben aus PrEC, BPH-1 , LNCaP, PC-3, DU-145-Zelllinien, NTC (Non-Template-Kontrolle) und gDNA (genomische DNA-Kontrolle ohne Bisulfit-Umwandlung). Die Bisulfit-umgewandelte DNA wurde ohne BBPA in 40 Zyklen bei 51 ,9°C in der dPCR quantifiziert. Der schmale Pfeil zeigt 1 Kopie einer homogen methylierten RASSFIA-Sequenz in der PrEC und der dicke Pfeil die zahlreichen Kopien homogen methylierter R/ASSFi/A-Sequenzen in den BPH-1 -, LNCaP-, PC-3- und DU-145- Zelllinien. Die homogen methylierten Epi-Allele können von den heterogen methylierten EpiAllelen, die sich durch mismatch nachweisen lassen, insbesondere durch entsprechendes Einstellen der Grenzlinien (thresholds), quantifiziert werden (siehe nachfolgende Fig. 20). Figure 19 (comparative data): FAM signals (top) for methylated and HEX signals (bottom) for unmethylated RASSFIA sequences in DNA samples from PrEC, BPH-1, LNCaP, PC-3, DU-145 Cell lines, NTC (non-template control) and gDNA (genomic DNA control without bisulfite conversion). The bisulfite-converted DNA was quantified without BBPA in 51 cycles at 51.9 ° C in the dPCR. The narrow arrow shows 1 copy of a homogeneously methylated RASSFIA sequence in the PrEC and the thick arrow shows the numerous copies of homogeneously methylated R / ASSFi / A sequences in the BPH-1, LNCaP, PC-3 and DU-145 cell lines. The homogeneously methylated epi-alleles can be quantified by the heterogenously methylated epialles, which can be detected by mismatch, in particular by appropriate adjustment of the thresholds (see below Fig. 20).
Fig. 20: Kopienanzahl methylierter und unmethlyierter RASSFIA-Seq Uenzen (obere Abbildung, Y-Achse = Anzahl Ereignisse) und relative Häufigkeit (Y-Achse in %) homogen methylierter R/ASSFM-Sequenzen (untere Abbildung) in PrEC, BPH-1 , LNCaP, PC-3 und DU-145 Zellen. Obere Abbildung: Anzahl positiver Signale für homogen methylierte und nicht-methylierte Kopien in PrEC: 1/ 106; BPH-1 : 47/ 89; LNCaP: 1397/ 12; PC-3: 1855/ 9, DU-145: 825/ 175, NTC (Non-Template-Kontrolle): 0/ 0 und gDNA (genomische DNA): 0/ 1 .
Untere Abbildung: Neben den Medianwerten sind die Poisson-Variationsbereiche gezeigt. Die relative homogene R/ASSFi/A-Epi-Allel-Methylierung betrug in PrEC 0,9 %, BPH-1 : 35,0 %, LNCaP: 99,2 %, PC-3: 99,6 %, DU-145: 83,0 %, NTC: 0 % und gDNA: 0 %. Figure 20: Copy number of methylated and unmethylated RASSFIA sequences (upper panel, Y axis = number of events) and relative frequency (Y axis in%) of homogeneously methylated R / ASSFM sequences (lower panel) in PrEC, BPH-1 , LNCaP, PC-3 and DU-145 cells. Upper panel: Number of positive signals for homogeneously methylated and unmethylated copies in PrEC: 1/106; BPH-1: 47/89; LNCaP: 1397/12; PC-3: 1855/9, DU-145: 825/175, NTC (non-template control): 0/0 and gDNA (genomic DNA): 0/1. Lower figure: In addition to the median values, the Poisson variation ranges are shown. The relative homogeneous R / ASSFi / A-epi-allele methylation was 0.9% in PrEC, BPH-1: 35.0%, LNCaP: 99.2%, PC-3: 99.6%, DU-145 : 83.0%, NTC: 0% and gDNA: 0%.
Fig. 21 : Häufigkeit FAM-positiver (methylierter, obere Abbildung) und HEX-positiver (nicht- methylierter, untere Abbildung) SERPINEI-Seq Uenzen in PrEC, BPH-1 , LNCaP (LN), PC-3, DU-145 (DU)-Zellen und 0 %-, 100 %-DNA-Standards (Qiagen GmbH) und in NTC (NonTemplate-Kontrolle). Der schmale Pfeil zeigt die Hauptfraktion heterogen methylierter EpiAllele (3 von 4 CpG-Stellen methyliert) in der DU-145-Zelllinie im Vergleich zu den homogen methylierten DNA-Sequenzen im 100 %-DNA-Standard (dicker Pfeil). In PrEC und BPH-1 zeigten sich keine 2-, 3- und 4-fach-methylierten Epi-Allele im Gegensatz zu den malignen LNCaP, PC-3 und DU-145-Zellen, die entsprechend quantifizierbar waren (siehe Fig. 22). FIG. 21: Frequency of FAM-positive (methylated, upper panel) and HEX-positive (unmethylated, lower panel) SERPINEI sequences in PrEC, BPH-1, LNCaP (LN), PC-3, DU-145 (FIG. DU) cells and 0%, 100% DNA standards (Qiagen GmbH) and in NTC (NonTemplate control). The narrow arrow shows the major fraction of heterogenously methylated EpiAllele (3 of 4 CpG sites methylated) in the DU-145 cell line compared to the homogeneously methylated DNA sequences in the 100% DNA standard (thick arrow). In PrEC and BPH-1, there were no 2-, 3- and 4-fold methylated epi-alleles in contrast to the malignant LNCaP, PC-3 and DU-145 cells which were quantifiable accordingly (see Fig. 22). ,
Fig. 22: Oben: Signalhäufigkeiten (Y-Achse = Anzahl Ereignisse) für methylierte und nicht- methylierte SERPINEI-Seq Uenzen in PrEC (0 methyliert/ 74 nicht-methyliert), BPH-1 (0/ 270), LNCaP (404/ 123), PC-3 (382/ 1241 ), DU-145 (1295/ 1 ), 0 %-DNA-Standard (0/ 947), 100 %-DNA-Standard (827/ 6) und Non-Template-Kontrolle (NTC: 0/ 1 ). Die Pfeile zeigen die nicht nachweisbaren Kopien methylierter SERPINEI-Seq Uenzen in PrEC und der BPH-1 - Zelllinie. Unten: relative Häufigkeit (Y-Achse in %) aller, d. h. sowohl homogen als auch heterogen methylierter Epi-Allele des S ERPINE 1-Gens in PrEC (0 %), BPH-1 (0 %), LNCaP (77 %), PC-3 (22,6 %), DU-145 (99,93 %), 0 %-DNA-Standard (0 %), 100 %-DNA-Standard (99,3 %) und NTC: 0 %. Die Pfeile zeigen die 0 % methylierter SERPINEI-Seq Uenzen in PrEC und der BPH-1 -Zelllinie. FIG. 22: Top: signal frequencies (Y axis = number of events) for methylated and unmethylated SERPINEI sequences in PrEC (0 methylated / 74 unmethylated), BPH-1 (0/270), LNCaP (404 / 123), PC-3 (382/1241), DU-145 (1295/1), 0% DNA standard (0/947), 100% DNA standard (827/6) and non-template control (NTC: 0/1). The arrows show the undetectable copies of methylated SERPINEI sequences in PrEC and the BPH-1 cell line. Below: relative frequency (y-axis in%) of all, d. H. both homogeneous and heterogeneously methylated epi-alleles of the S ERPINE 1 gene in PrEC (0%), BPH-1 (0%), LNCaP (77%), PC-3 (22.6%), DU-145 ( 99.93%), 0% DNA standard (0%), 100% DNA standard (99.3%) and NTC: 0%. The arrows show the 0% methylated SERPINEI sequences in PrEC and the BPH-1 cell line.
Fig. 23: Häufigkeit methylierter (obere Abbildung) und nicht-methylierter (untere Abbildung) GSTPf-Sequenzen in PrEC, BPH-1 , LNCaP (LN), PC-3, DU-145 (DU)-Zellen und 0 %-, 100 %-DNA-Standards und NTC (Non-Template-Kontrolle). Die schmalen Pfeile zeigen heterogen methylierte Epi-Allele (1 von 3 CpG-Stellen methyliert) in PrEC und BPH-1 im Gegensatz zu den überwiegend homogenen 3-fach methylierten Epi-Allelen in LNCaP-Zellen (dicke Pfeil) und 2-fach heterogen methylierten Allelen in PC-3-Zellen (2. senkrechter dicker Pfeil). Fig. 23: Frequency of methylated (upper panel) and unmethylated (lower panel) GSTPf sequences in PrEC, BPH-1, LNCaP (LN), PC-3, DU-145 (DU) cells and 0% -, 100% DNA standards and NTC (non-template control). The narrow arrows show heterogenously methylated epi-alleles (1 of 3 CpG sites methylated) in PrEC and BPH-1, in contrast to the predominantly homogeneous 3-fold methylated epi-alleles in LNCaP cells (thick arrow) and 2-fold heterogeneous methylated alleles in PC-3 cells (2nd vertical thick arrow).
Fig. 24 Oben: Signalhäufigkeiten (Y-Achse = Anzahl Ereignisse) für methylierte und nicht- methylierte GSTPf-Sequenzen in PrEC (3 methyliert/ 138 nicht-methyliert), BPH-1 (8/ 532), LNCaP (1777/ 22), PC-3 (987/ 2460), DU-145 (490/ 1947), 0 %-DNA-Standard (1/ 279), 100 %-DNA-Standard (200/ 37) und Non-Template-Kontrolle (NTC: 0/ 0). Unten: relative Häufigkeit (Y-Achse in %) methylierter GS7Pi-Sequenzen in PrEC (2,1 %), BPH-1 (1 ,4 %), LNCaP (98,84 %), PC-3 (27,5 %) DU-145 (19,2 %), 0 %-DNA-Standard (0,4 %), 100 %- DNA-Standard (84,5 %) und NTC (0 %).
Fig. 25: 2-D-Darstellung der FAM- und HEX-positiven Signale bei der Bestimmung der GSTPf-Methylierung (siehe auch Fig. 23). In der oberen Abbildung sind deutlich zwei Populationen von Tröpfchen mit homogen (obere Fraktion) und heterogen (untere Fraktion, 2 von 3 CpG-Stellen methyliert) methylierten Epi-Allelen sichtbar (dicke Pfeile). Untere Abbildung: Werden nur diese zwei Populationen von Tröpfchen mit homogen (obere Fraktion) und heterogen (untere Fraktion) mit 2 von 3 methylierten CpG-Stellen methylierten Epi-Allele quantifiziert (siehe Trennlinien in oberer und unterer Abbildung), zeigen sich in den PrEC und BPH-1 -Zellen keinerlei methylierte GSTPi-Sequenzen. Fig. 24 Top: Signal Frequencies (Y-axis = number of events) for methylated and unmethylated GSTPf sequences in PrEC (3 methylated / 138 unmethylated), BPH-1 (8/532), LNCaP (1777/22) , PC-3 (987/2460), DU-145 (490/1947), 0% DNA standard (1/279), 100% DNA standard (200/37) and non-template control (NTC : 0/0). Bottom: relative abundance (Y-axis in%) of methylated GS7Pi sequences in PrEC (2.1%), BPH-1 (1, 4%), LNCaP (98.84%), PC-3 (27.5%). ) DU-145 (19.2%), 0% DNA standard (0.4%), 100% DNA standard (84.5%) and NTC (0%). Fig. 25: 2-D representation of the FAM and HEX positive signals in the determination of GSTPf methylation (see also Fig. 23). In the figure above, clearly two populations of droplets with homogeneous (upper fraction) and heterogeneous (lower fraction, 2 of 3 CpG sites methylated) methylated epi alleles are visible (thick arrows). Lower figure: If only these two populations of droplets with homogeneous (upper fraction) and heterogeneous (lower fraction) with 2 of 3 methylated CpG sites methylated Epi alleles are quantified (see dividing lines in upper and lower figure), the PrEC and BPH-1 cells lack any methylated GSTPi sequences.
Fig. 26: Oben: Signalhäufigkeiten (Y-Achse = Anzahl Ereignisse). Daraus ergaben sich folgende positive FAM- und HEX-Signale für methylierte und nicht-methylierte GSTP1- Sequenzen in PrEC (0/ 141 ), BPH-1 (0/ 534), LNCaP (1488/ 22), PC-3 (682/ 2515), DU145 (312/ 1982), 0 %- (1/ 295), 100 %-DNA-Standard (155/ 46) und NTC (0/ 0). Unten: Relative Häufigkeiten (Y-Achse in %) der methylierten GS7Pi-Sequenzen in PrEC (0 %), BPH-1 (0 %), LNCaP (98,6 %), PC-3 (20,2 %), DU-145 (12,9 %), 0 % (0,3 %), 100 %-DNA-Standard (77 %) und NTC (0 %). Im Vergleich dazu betrug die relative Häufigkeit 2,1 % für PrEC und 1 ,4% für BPH-1 -Zellen bei der entsprechenden Grenzeinstellung (threshold) in Fig. 23 und 24. Die 100 %-Standard-DNA ist für GSTP1 nur zu 77 % vollständig methyliert, wie bereits in Fig. 25 ersichtlich war (untere Abbildung mit zwei dicken Pfeilen rechts markiert). Fig. 26: Top: signal frequencies (Y-axis = number of events). This resulted in the following positive FAM and HEX signals for methylated and unmethylated GSTP1 sequences in PrEC (0/141), BPH-1 (0/534), LNCaP (1488/22), PC-3 (682 / 2515), DU145 (312/1982), 0% - (1/295), 100% DNA standard (155/46) and NTC (0/0). Bottom: Relative frequencies (Y-axis in%) of the methylated GS7Pi sequences in PrEC (0%), BPH-1 (0%), LNCaP (98.6%), PC-3 (20.2%), DU -145 (12.9%), 0% (0.3%), 100% DNA standard (77%) and NTC (0%). In comparison, the relative abundance was 2.1% for PrEC and 1.4% for BPH-1 cells at the corresponding threshold level in Figures 23 and 24. The 100% standard DNA is only too GSTP1 77% completely methylated, as already seen in Fig. 25 (lower image marked with two thick arrows on the right).
Fig. 27: 2-D-Darstellung der FAM- und HEX-positiven Signale bei der Bestimmung der PL^2/?7-Methylierung in Serumproben gesunder Probanden (K1 -K20) und Patienten mit Prostatakarzinomen (P1 -P40) nach 15 Zyklen in der BBPA bei 59°C und 2,5 mM MgCI2- Konzentration und anschließend in der dPCR. Die Grenzen (thresholds) für die FAM- und HEX-positiven Signale wurden so eingestellt, dass alle drei mit Pfeilen markierten Fraktionen der FAM-positiven homogen als auch heterogen methylierten PLA2R7-Epi-Allelen in die Berechnungen (Tab. 12) einbezogen wurden. Fig. 27: 2-D plot of the FAM and HEX positive signals in the determination of PL ^ 2 /? 7 methylation in serum samples of healthy volunteers (K1 -K20) and patients with prostate cancer (P1 -P40) after 15 cycles in BBPA at 59 ° C and 2.5 mM MgCl 2 concentration and then in the dPCR. The thresholds for the FAM and HEX positive signals were adjusted so that all three arrow-marked fractions of the FAM-positive homogeneous and heterogeneously methylated PLA2R7-Epi alleles were included in the calculations (Table 12).
Fig. 28: 2-D-Darstellung der FAM- und HEX-positiven Signale bei der Bestimmung der PL^2/?7-Methylierung in Serumproben gesunder Probanden (K1 -K20) und Patienten mit Prostatakarzinomen (P1 -P40) nach 15 Zyklen in der BBPA bei 59°C und 2,5 mM MgCI2- Konzentration und anschließend in der dPCR. Die Grenzen (thresholds) für die FAM- und HEX-positiven Signale wurden so eingestellt, dass nur die mit dem Pfeil markierte Fraktion des FAM-positiven homogen methylierten PLA2R1 -Epi-Allels in die Berechnungen (Tab. 12) einbezogen wurde. Fig. 28: 2-D plot of the FAM and HEX positive signals in the determination of PL ^ 2 /? 7 methylation in serum samples of healthy volunteers (K1 -K20) and patients with prostate cancer (P1 -P40) after 15 cycles in BBPA at 59 ° C and 2.5 mM MgCl 2 concentration and then in the dPCR. The thresholds for the FAM and HEX positive signals were adjusted so that only the arrowed fraction of the FAM-positive homogeneously methylated PLA2R1-Epi allele was included in the calculations (Table 12).
Fig. 29: 2-D-Darstellung der FAM- und HEX-positiven Signale bei der Bestimmung der PL^2/?7-Methylierung in Serumproben gesunder Probanden (K1 -K20) und Patienten mit Prostatakarzinomen (P1 -P40) nach 15 Zyklen in der BBPA bei 59°C und 2,5 mM MgCI2- Konzentration und anschließend in der dPCR. Die Grenzen (thresholds) für die FAM- und
HEX-positiven Signale wurden so eingestellt, dass nur zwei mit Pfeilen markierten Fraktionen der FAM-positiven homogen als auch heterogen (2 von 3 CpG-Stellen) methylierten PLA2/?7-Epi-Allele in die Berechnungen (Tab. 12) einbezogen wurden. Fig. 29: 2-D plot of the FAM and HEX positive signals in the determination of PL ^ 2 /? 7 methylation in serum samples from healthy volunteers (K1 -K20) and patients with prostate cancer (P1 -P40) after 15 cycles in BBPA at 59 ° C and 2.5 mM MgCl 2 concentration and then in the dPCR. The limits (thresholds) for the FAM and HEX-positive signals were adjusted so that only two arrow-marked fractions of the FAM-positive homogeneous and heterogeneous (2 of 3 CpG sites) methylated PLA2 / 77-epi alleles were included in the calculations (Table 12) ,
Fig. 30: Anzahl FAM-positiver Signale für methylierte PL^2 ?7-Sequenzen ohne BBPA (Vergleichsdaten) und nach BBPA mit 50 Zyklen bei 63,0°C und 2,5 mmol/l MgCI2- Konzentration in normalen Epithelzellen der Prostata (PrEC), benigner Prostatahyperplasie- Zelllinie (BPH-1 ) und malignen Prostatazelllinien LNCaP, PC-3 und DU-145. Offene Pfeile zeigen positive Signale in DNA-Proben aus PrEC und BPH-1 ohne BBPA im Vergleich nach BBPA; ausgefüllte Pfeile zeigen positive Signale in DNA-Proben aus LNCaP, PC-3 und DU- 145 vor und nach BBPA; der Stern markiert die Grenze (threshold) zwischen negativen und positiven FAM-Signalen. Fig. 30: Number of FAM-positive signals for methylated PL ^ 2? 7 sequences without BBPA (comparative data) and after BBPA with 50 cycles at 63.0 ° C and 2.5 mmol / l MgCl 2 concentration in normal epithelial cells of Prostate (PrEC), benign prostatic hyperplasia cell line (BPH-1) and malignant prostate cell lines LNCaP, PC-3 and DU-145. Open arrows show positive signals in DNA samples from PrEC and BPH-1 without BBPA compared to BBPA; filled arrows show positive signals in DNA samples from LNCaP, PC-3 and DU-145 before and after BBPA; the star marks the threshold between negative and positive FAM signals.
Fig. 31 : Kopienanzahl (Y-Achse) methylierter (methyl) und nicht-methylierter (unmethyl) PLA2R1-Seq Uenzen ohne BBPA (Vergleichsdaten) und nach BBPA mit 15, 30, 40 und 50 Zyklen bei 63,0°C und 2,5 mmol/l MgCI2-Konzentration in normalen Epithelzellen der Prostata (PrEC), benigner Prostatahyperplasie-Zelllinie (BPH-1 ) und malignen Prostatazelllinien LNCaP, PC-3 und DU-145. Nach BBPA wurden 1 μΙ der 25 μΙ-PCR- Ansätze in die dPCR gegeben. Um die Kopienanzahl mit denen ohne BBPA vergleichen zu können, wurden diese mit 25 multipliziert. FIG. 31: Copy number (Y-axis) of methylated (methyl) and unmethylated (unmethyl) PLA2R1-Seq bases without BBPA (comparative data) and according to BBPA with 15, 30, 40 and 50 cycles at 63.0 ° C. and 2 , 5 mmol / l MgCl 2 concentration in prostate normal epithelial cells (PrEC), benign prostate hyperplasia cell line (BPH-1) and malignant prostate cell lines LNCaP, PC-3 and DU-145. After BBPA, 1 μΙ of the 25 μΙ PCR batches were added to the dPCR. To compare the number of copies with those without BBPA, these were multiplied by 25.
Fig. 32: Anzahl FAM-positiver (Y-Achse, für methyliert) und HEX-positive (X-Achse, für nicht- methyliert ) Signale für PLA2R1-Seq Uenzen nach BBPA mit 50 Zyklen bei 63,0°C und 2,5 mmol/l MgCI2-Konzentration in normalen Epithelzellen der Prostata (PrEC), benigner Prostatahyperplasie-Zelllinie (BPH-1 ) und maligenen Prostatazelllinien LNCaP, PC-3 und DU-145. Die Pfeile zeigen die Punktwolken für die PrEC, BPH-1 , LNCaP, PC-3 und DU-145- Zelllinien und der Non-Template-Kontrolle (ohne DNA, NTC). Die NTC sind durch den unteren Pfeil ohne Bezeichnung markiert und die einzelnen Werte sind in Tab. 20 zusammengefasst. FIG. 32: Number of FAM-positive (Y-axis, for methylated) and HEX-positive (X-axis, for unmethylated) signals for PLA2R1-Seq Uenzen according to BBPA with 50 cycles at 63.0 ° C. and FIG. 5 mmol / l MgCl 2 concentration in normal epithelial cells of the prostate (PrEC), benign prostate hyperplasia cell line (BPH-1) and malignant prostate cell lines LNCaP, PC-3 and DU-145. The arrows show the point clouds for the PrEC, BPH-1, LNCaP, PC-3 and DU-145 cell lines and the non-template control (without DNA, NTC). The NTC are marked by the lower arrow without label and the individual values are summarized in Tab.
Fig. 33: Anzahl FAM-positiver (Y-Achse, für methylierte) und HEX-positive (X-Achse, für nicht-methylierte) Signale für PLA2R1-Seq Uenzen nach BBPA mit 50 Zyklen bei 63,0°C in normalen Epithelzellen der Prostata (PrEC), benigner Prostatahyperplasie-Zelllinie (BPH-1 ) und maligenen Prostatazelllinien LNCaP, PC-3 und DU-145. Die Pfeile zeigen die Punktwolken für die PrEC, BPH-1 , LNCaP, PC-3 und DU-145-Zelllinien. Im Vergleich zur Fig. 29 ist die Non-Template-Kontrolle nicht dargestellt, wodurch deutlich wird, dass alle Proben keine doppelt-negativen Tröpfchen in der dPCR mehr enthielten. Die einzelnen Werte sind in Tab. 20 zusammengefasst.
Fig. 34: Kopienanzahl methylierter (ausgefüllte Kreise) und nicht-methylierter (offene Kreise) PLA2R1 -DNA-Fragmente nach 16 Zyklen Prä-Amplifikation bei steigenden Annealingtemperaturen (50-63°C) in Abhängigkeit von der MgCI2-Konzentration (1 ,5 mmol/l - 8,0 mmol/l) mit dem Primerpaar 168bp (SEQ ID: 1 und 2) und anschließender dPCR. Figure 33: Number of FAM-positive (Y-axis, for methylated) and HEX-positive (X-axis, for unmethylated) signals for PLA2R1-Seq sequences after BBPA with 50 cycles at 63.0 ° C in normal epithelial cells the prostate (PrEC), benign prostatic hyperplasia cell line (BPH-1) and malignant prostate cell lines LNCaP, PC-3 and DU-145. The arrows show the point clouds for the PrEC, BPH-1, LNCaP, PC-3 and DU-145 cell lines. Compared to Figure 29, the non-template control is not shown, indicating that all samples no longer contained double negative droplets in the dPCR. The individual values are summarized in Tab. 20. Fig. 34: Copy number of methylated (filled circles) and unmethylated (open circles) PLA2R1 DNA fragments after 16 cycles of pre-amplification at increasing annealing temperatures (50-63 ° C) versus MgCl 2 concentration (Fig. 5 mmol / l - 8.0 mmol / l) with the primer pair 168bp (SEQ ID: 1 and 2) and subsequent dPCR.
Fig. 35: Kopienanzahl methylierter (ausgefüllte Kreise) und nicht-methylierter (offene Kreise) PLA2R1 -DNA-Fragmente nach 16 Zyklen Prä-Amplifikation bei steigenden Annealingtemperaturen (50-63°C) in Abhängigkeit von MgCI2-Konzentration (1 ,5 mmol/l - 8,0 mmol/l) mit dem Primerpaar 161 bp (SEQ ID: 53 und 10) und anschließender dPCR. Figure 35: Copy number of methylated (filled circles) and unmethylated (open circles) PLA2R1 DNA fragments after 16 cycles of pre-amplification with increasing annealing temperatures (50-63 ° C) versus MgCl 2 concentration (1, 5 mmol / l - 8.0 mmol / l) with the primer pair 161 bp (SEQ ID: 53 and 10) and subsequent dPCR.
Fig. 36: Kopienanzahl methylierter (ausgefüllte Kreise) und nicht-methylierter (offene Kreise) PLA2R1 -DNA-Fragmente nach 16 Zyklen Prä-Amplifikation bei steigenden Annealingtemperaturen (50-63°C) in Abhängigkeit von der MgCI2-Konzentration (1 ,5 mmol/l - 8,0 mmol/l) mit dem Primerpaar 150bp (SEQ ID: 53 und 9) und anschließender dPCR. FIG. 36: Copy number of methylated (filled circles) and unmethylated (open circles) PLA2R1 DNA fragments after 16 cycles of pre-amplification with increasing annealing temperatures (50-63 ° C.) as a function of the MgCl 2 concentration (FIG. 1, FIG. 5 mmol / l - 8.0 mmol / l) with the primer pair 150bp (SEQ ID: 53 and 9) followed by dPCR.
Fig. 37: Kopienanzahl methylierter (ausgefüllte Kreise) und nicht-methylierter (offene Kreise) PLA2R1 -DNA-Fragmente nach 16 Zyklen Prä-Amplifikation bei steigenden Annealingtemperaturen (50-63°C) in Abhängigkeit von der MgCI2-Konzentrationen (1 ,5 mmol/l - 8,0 mmol/l) mit dem Primerpaar 133bp (SEQ ID: 7 und 8) und anschließender dPCR. 37: Copy number of methylated (filled circles) and unmethylated (open circles) PLA2R1 DNA fragments after 16 cycles of pre-amplification with increasing annealing temperatures (50-63 ° C.) as a function of the MgCl 2 concentrations (1, 5 mmol / l - 8.0 mmol / l) with primer pair 133bp (SEQ ID: 7 and 8) followed by dPCR.
Fig. 38: FAM-Signale (methylierte PLA2R1 -DNA-Fragmente [obere Abbildung]) und HEX- Signale (nicht-methylierte PLA2R1 -DNA-Fragmente [untere Abbildung] nach 15 (links vom Trennstrich) und 50 Zyklen Prä-Amplifikation (rechts vom Trennstrich) in Proben mit 3000 (Bahn 1 ), 20 (Bahn 2), 10 (Bahn 3), 5 (Bahn 4) und keiner Kopie methylierter PLA2R1 -DNA- Fragmente (Bahn 5) und jeweils einem Anteil von 70.000 Kopien nicht-methylierter PLA2R1 - DNA-Fragmente mit dem Primerpaar 133 bp (SEQ ID: 7 und 8) bei 6,0 mM MgCI2- Konzentration und einer Annealingtemperatur von 63°C. NTC: Non-Template- Negativkontrolle. Die Rohdaten sind in Tab. 28 und 30 aufgeführt. Fig. 38: FAM signals (methylated PLA2R1 DNA fragments [upper panel]) and HEX signals (non-methylated PLA2R1 DNA fragments [lower panel] after 15 (left of the dividing line) and 50 cycles of pre-amplification ( to the right of the dividing line) in samples containing 3000 (lane 1), 20 (lane 2), 10 (lane 3), 5 (lane 4) and no copy of methylated PLA2R1 DNA fragments (lane 5) and each containing 70,000 copies non-methylated PLA2R1 DNA fragments with the primer pair 133 bp (SEQ ID: 7 and 8) at 6.0 mM MgCl 2 concentration and an annealing temperature of 63 ° C. NTC: Non-template negative control Tab. 28 and 30 are listed.
Fig. 39: Anzahl der positiven Tröpfchen nach 15 (links vom Trennstrich) und 50 Zyklen Prä- Amplifikation (rechts vom Trennstrich) in Proben mit 3000 (Bahn 1 ), 20 (Bahn 2), 10 (Bahn 3), 5 (Bahn 4) und keiner Kopie methylierter PLA2R1 -DNA-Fragmente (Bahn 5) und jeweils einem Anteil von 70.000 Kopien nicht-methylierter PLA2R1 -DNA-Fragmente mit dem Primerpaar 133 bp (SEQ ID: 7 und 8) bei 6,0 mmol/l MgCI2-Konzentration und einer Annealingtemperatur von 63°C. NTC: Non-Template-Negativkontrolle. Die Rohdaten sind in Tab. 28 und 30 aufgeführt. Fig. 39: Number of positive droplets after 15 (to the left of the dividing line) and 50 cycles of pre-amplification (to the right of the dividing line) in samples with 3000 (lane 1), 20 (lane 2), 10 (lane 3), 5 (lane 4) and no copy of methylated PLA2R1 DNA fragments (lane 5) and 70,000 copies each of non-methylated PLA2R1 DNA fragments with primer pair 133 bp (SEQ ID: 7 and 8) at 6.0 mmol / l MgCl 2 concentration and an annealing temperature of 63 ° C. NTC: Non-Template Negative Control. The raw data are listed in Tab. 28 and 30.
Fig. 40: FAM-Signale (methylierte PLA2R1 -DNA-Fragmente [obere Abbildung]) und HEX- Signale (nicht-methylierte PLA2R1 -DNA-Fragmente [untere Abbildung] nach 15 (links vom Trennstrich) und 50 Zyklen Prä-Amplifikation (rechts vom Trennstrich) in Proben mit 3000 (Bahn 1 ), 20 (Bahn 2), 10 (Bahn 3), 5 (Bahn 4) und keiner Kopie methylierter PLA2R1 -DNA-
Fragmente (Bahn 5) und jeweils einem Anteil von 175.000 Kopien nicht-nmethylierter PLA2R1 -DNA-Fragmente mit dem Primerpaar 133 bp (SEQ ID: 7 und 8) bei 6,0 mmol/l MgCI2-Konzentration und einer Annealingtemperatur von 63°C. NTC: Non-Template- Negativkontrolle. Die Rohdaten sind in Tab. 28 und 30 aufgeführt. Fig. 40: FAM signals (methylated PLA2R1 DNA fragments [upper panel]) and HEX signals (non-methylated PLA2R1 DNA fragments [lower panel] after 15 (left of the dividing line) and 50 cycles of pre-amplification ( to the right of the hyphen) in samples containing 3000 (lane 1), 20 (lane 2), 10 (lane 3), 5 (lane 4) and no copy of methylated PLA2R1 DNA Fragments (lane 5) and each containing 175,000 copies of non-methylated PLA2R1 DNA fragments with the primer pair 133 bp (SEQ ID: 7 and 8) at 6.0 mmol / l MgCl 2 concentration and an annealing temperature of 63 ° C. NTC: Non-Template Negative Control. The raw data are listed in Tab. 28 and 30.
Fig. 41 : Anzahl der positiven Tröpfchen nach 15 (links vom Trennstrich) und 50 Zyklen Prä- Amplifikation (rechts vom Trennstrich) in Proben mit 3000 (Bahn 1 ), 20 (Bahn 2), 10 (Bahn 3), 5 (Bahn 4) und keiner Kopie methylierter PLA2R1 -DNA-Fragmente (Bahn 5) und jeweils einem Anteil von 175.000 Kopien nicht-methylierter PLA2R1 -DNA-Fragmente mit dem Primerpaar 133 bp (SEQ ID: 7 und 8) bei 6,0 mmol/l MgCI2-Konzentration und einer Annealingtemperatur von 63°C. NTC: Non-Template-Negativkontrolle. Die Rohdaten sind in Tab. 28 und 30 aufgeführt. FIG. 41: Number of positive droplets after 15 (to the left of the dividing line) and 50 cycles of pre-amplification (to the right of the dividing line) in samples with 3000 (lane 1), 20 (lane 2), 10 (lane 3), 5 (lane 4) and no copy of methylated PLA2R1 DNA fragments (lane 5) and each containing 175,000 copies of unmethylated PLA2R1 DNA fragments with primer pair 133 bp (SEQ ID: 7 and 8) at 6.0 mmol / L MgCl 2 concentration and an annealing temperature of 63 ° C. NTC: Non-Template Negative Control. The raw data are listed in Tab. 28 and 30.
Fig. 42: FAM-Signale (methylierte PLA2R1 -DNA-Fragmente [obere Abbildung]) und HEX- Signale (nicht-methylierte PLA2R1 -DNA-Fragmente [untere Abbildung] nach 15 (links vom Trennstrich) und 50 Zyklen Prä-Amplifikation (rechts vom Trennstrich) in Proben mit 3000 (Bahn 1 ), 20 (Bahn 2), 10 (Bahn 3), 5 (Bahn 4) und keiner Kopie methylierter PLA2R1 -DNA- Fragmente (Bahn 5) und jeweils einem Anteil von 350.000 Kopien nicht-methylierter PLA2R1 -DNA-Fragmente mit dem Primerpaar 133 bp (SEQ ID: 7 und 8) bei 6,0 mmol/l MgCI2-Konzentration und einer Annealingtemperatur von 63°C. NTC: Non-Template- Negativkontrolle. Die Rohdaten sind in Tab. 28 und 30 aufgeführt. Fig. 42: FAM signals (methylated PLA2R1 DNA fragments [upper panel]) and HEX signals (non-methylated PLA2R1 DNA fragments [lower panel] after 15 (left of the dividing line) and 50 cycles of pre-amplification ( to the right of the dividing line) in samples containing 3000 (lane 1), 20 (lane 2), 10 (lane 3), 5 (lane 4) and no copy of methylated PLA2R1 DNA fragments (lane 5), each containing 350,000 copies non-methylated PLA2R1 DNA fragments with the primer pair 133 bp (SEQ ID: 7 and 8) at 6.0 mmol / l MgCl 2 concentration and an annealing temperature of 63 ° C. NTC: Non-template negative control are listed in Tab. 28 and 30.
Fig. 43: Anzahl der positiven Tröpfchen nach 15 (links vom Trennstrich) und 50 Zyklen Prä- Amplifikation (rechts vom Trennstrich) in Proben mit 3000 (Bahn 1 ), 20 (Bahn 2), 10 (Bahn 3), 5 (Bahn 4) und keiner Kopie methylierter PLA2R1 -DNA-Fragmente (Bahn 5) und jeweils einem Anteil von 350.000 Kopien nicht-methylierter PLA2R1 -DNA-Fragmente mit dem Primerpaar 133 bp (SEQ ID: 7 und 8) bei 6,0 mmol/l MgCI2-Konzentration und einer Annealingtemperatur von 63°C. NTC: Non-Template-Negativkontrolle. Die Rohdaten sind in Tab. 28 und 30 aufgeführt. Fig. 43: Number of positive droplets after 15 (to the left of the dividing line) and 50 cycles of pre-amplification (to the right of the dividing line) in samples with 3000 (lane 1), 20 (lane 2), 10 (lane 3), 5 (lane 4) and no copy of methylated PLA2R1 DNA fragments (lane 5) and a proportion of 350,000 copies each of non-methylated PLA2R1 DNA fragments with primer pair 133 bp (SEQ ID: 7 and 8) at 6.0 mmol / l MgCl 2 concentration and an annealing temperature of 63 ° C. NTC: Non-Template Negative Control. The raw data are listed in Tab. 28 and 30.
Fig. 44: FAM-Signale (methylierte PLA2R1 -DNA-Fragmente [obere Abbildung]) und HEX- Signale (nicht-methylierte PLA2R1 -DNA-Fragmente [untere Abbildung] nach 15 (links vom Trennstrich) und 50 Zyklen Prä-Amplifikation (rechts vom Trennstrich) in Proben mit 3000 (Bahn 1 ), 20 (Bahn 2), 10 (Bahn 3), 5 (Bahn 4) und keiner Kopie methylierter PLA2R1 -DNA- Fragmente (Bahn 5) und jeweils einem Anteil von 700.000 Kopien nicht-methylierter PLA2R1 -DNA-Fragmente mit dem Primerpaar 133 bp (SEQ ID: 7 und 8) bei 6,0 mM MgCI2- Konzentration und einer Annealingtemperatur von 63°C. NTC: Non-Template- Negativkontrolle. Die Rohdaten sind in Tab. 28 und 30 aufgeführt. Fig. 44: FAM signals (methylated PLA2R1 DNA fragments [upper panel]) and HEX signals (non-methylated PLA2R1 DNA fragments [lower panel] after 15 (left of the dividing line) and 50 cycles of pre-amplification ( to the right of the hyphen) in samples containing 3000 (lane 1), 20 (lane 2), 10 (lane 3), 5 (lane 4) and no copy of methylated PLA2R1 DNA fragments (lane 5) and each containing 700,000 copies unmethylated PLA2R1 DNA fragments with primer pair 133 bp (SEQ ID: 7 and 8) at 6.0 mM MgCl 2 concentration and an annealing temperature of 63 ° C. NTC: Non-template negative control Tab. 28 and 30 are listed.
Fig. 45: Anzahl der positiven Tröpfchen nach 15 (links vom Trennstrich) und 50 Zyklen Prä- Amplifikation (rechts vom Trennstrich) in Proben mit 3000 (Bahn 1 ), 20 (Bahn 2), 10 (Bahn
3) , 5 (Bahn 4) und keiner Kopie methylierter PLA2R1 -DNA-Fragmente (Bahn 5) und jeweils einem Anteil von 700.000 Kopien nicht-methylierter PLA2R1 -DNA-Fragmente mit dem Primerpaar 133 bp (SEQ ID: 7 und 8) bei 6,0 mmol/l MgCI2-Konzentration und einer Annealingtemperatur von 63°C. NTC: Non-Template-Negativkontrolle. Die Rohdaten sind in Tab. 28 und 30 aufgeführt. Fig. 45: Number of positive droplets after 15 (to the left of the dividing line) and 50 cycles of pre-amplification (to the right of the dividing line) in samples with 3000 (lane 1), 20 (lane 2), 10 (lane 3), 5 (lane 4) and no copy of methylated PLA2R1 DNA fragments (lane 5) and each containing 700,000 copies of unmethylated PLA2R1 DNA fragments with primer pair 133 bp (SEQ ID: 7 and 8) 6.0 mmol / l MgCl 2 concentration and an annealing temperature of 63 ° C. NTC: Non-Template Negative Control. The raw data are listed in Tab. 28 and 30.
Fig. 46: FAM-Signale (methylierte PLA2R1 -DNA-Fragmente, obere Abbildung) und HEX- Signale (nicht-methylierte PLA2R1 -DNA-Fragmente, untere Abbildung) aus normalen PrEC (Position 1 ), benigne BPH-Zellen (Position 2), malignen LNCaP (Position 3), PC-3 (Position Fig. 46: FAM signals (methylated PLA2R1 DNA fragments, top panel) and HEX signals (non-methylated PLA2R1 DNA fragments, bottom panel) from normal PrEC (position 1), benign BPH cells (position 2 ), malignant LNCaP (position 3), PC-3 (position
4) und DU-145-Zellen (Position 5) nach 50 Zyklen Prä-Amplifikation bei 2,5 mM MgCI2- Konzentration bei steigenenden Annealingtemperaturen (50-63°C) mit dem Primerpaar 168bp (SEQ ID: 1 und 2) und anschließender dPCR. Die Pfeile zeigen den Verlauf der FAM- und HEX-Signale in Abhängigkeit der Annealingtemperaturen für die PC-3-Zellen. 4) and DU-145 cells (position 5) after 50 cycles of pre-amplification at 2.5 mM MgCl 2 concentration with increasing annealing temperatures (50-63 ° C) with primer pair 168bp (SEQ ID: 1 and 2) and subsequent dPCR. The arrows show the course of the FAM and HEX signals as a function of the annealing temperatures for the PC-3 cells.
Fig. 47: FAM-Signale (methylierte PLA2R1 -DNA-Fragmente, obere Abbildung) und HEX- Signale (nicht-methylierte PLA2R1 -DNA-Fragmente, untere Abbildung) aus normalen PrEC (Position 1 ), benigne BPH-Zellen (Position 2), malignen LNCaP (Position 3), PC-3 (Position 4) und DU-145-Zellen (Position 5) nach 50 Zyklen Prä-Amplifikation bei 2,5 mmol/l MgCI2- Konzentration bei steigenenden Annealingtemperaturen (50-63°C) mit dem Primerpaar 161 bp (SEQ ID: 53 und 10) und anschließender dPCR. Die Pfeile zeigen den Verlauf der FAM- und HEX-Signale in Abhängigkeit der Annealingtemperaturen für die PC-3-Zellen.Figure 47: FAM signals (methylated PLA2R1 DNA fragments, top panel) and HEX signals (non-methylated PLA2R1 DNA fragments, bottom panel) from normal PrEC (position 1), benign BPH cells (position 2 ), malignant LNCaP (position 3), PC-3 (position 4) and DU-145 cells (position 5) after 50 cycles of pre-amplification at 2.5 mmol / l MgCl 2 concentration with increasing annealing temperatures (50-63 ° C) with the primer pair 161 bp (SEQ ID: 53 and 10) and subsequent dPCR. The arrows show the course of the FAM and HEX signals as a function of the annealing temperatures for the PC-3 cells.
Fig. 48: FAM-Signale (methylierte PLA2R1 -DNA-Fragmente, obere Abbildung) und HEX- Signale (nicht-methylierte PLA2R1 -DNA-Fragmente, untere Abbildung) aus normalen PrEC (Position 1 ), benigne BPH-Zellen (Position 2), malignen LNCaP (Position 3), PC-3 (Position 4) und DU-145-Zellen (Position 5) nach 50 Zyklen Prä-Amplifikation bei 2,5 mmol/l MgCI2- Konzentration bei steigenenden Annealingtemperaturen (50-63°C) mit dem Primerpaar 150bp (SEQ ID: 53 und 9) und anschließender dPCR. Die Pfeile zeigen den Verlauf der FAM- und HEX-Signale in Abhängigkeit der Annealingtemperaturen für die PC-3-Zellen.Figure 48: FAM signals (methylated PLA2R1 DNA fragments, top panel) and HEX signals (non-methylated PLA2R1 DNA fragments, bottom panel) from normal PrEC (position 1), benign BPH cells (position 2 ), malignant LNCaP (position 3), PC-3 (position 4) and DU-145 cells (position 5) after 50 cycles of pre-amplification at 2.5 mmol / l MgCl 2 concentration with increasing annealing temperatures (50-63 ° C) with the primer pair 150bp (SEQ ID: 53 and 9) and subsequent dPCR. The arrows show the course of the FAM and HEX signals as a function of the annealing temperatures for the PC-3 cells.
Fig. 49: FAM-Signale (methylierte PLA2R1 -DNA-Fragmente, obere Abbildung) und HEX- Signale (nicht-methylierte PLA2R1 -DNA-Fragmente, untere Abbildung) aus normalen PrEC (Position 1 ), benigne BPH-Zellen (Position 2), malignen LNCaP (Position 3), PC-3 (Position 4) und DU-145-Zellen (Position 5) nach 50 Zyklen Prä-Amplifikation bei 2,5 mmol/l MgCI2- Konzentration bei steigenenden Annealingtemperaturen (50-63°C) mit dem Primerpaar 133bp (SEQ ID: 7 und 8) und anschließender dPCR. Die Pfeile zeigen den Verlauf der FAM- Signale bis 52,6°C für die PC-3-Zellen und oberhalb von 52,6°C für PrEC und BPH-1 . Fig. 49: FAM signals (methylated PLA2R1 DNA fragments, top panel) and HEX signals (non-methylated PLA2R1 DNA fragments, bottom panel) from normal PrEC (position 1), benign BPH cells (position 2 ), malignant LNCaP (position 3), PC-3 (position 4) and DU-145 cells (position 5) after 50 cycles of pre-amplification at 2.5 mmol / l MgCl 2 concentration with increasing annealing temperatures (50-63 ° C) with the primer pair 133bp (SEQ ID: 7 and 8) and subsequent dPCR. The arrows show the progression of FAM signals up to 52.6 ° C for the PC-3 cells and above 52.6 ° C for PrEC and BPH-1.
Fig. 50: FAM-Signale (methylierte GSTP1 -DNA-Fragmente, obere Abbildung) und HEX- Signale (nicht-methylierte GSTP1 -DNA-Fragmente, untere Abbildung) aus normalen PrEC (Position 1 ), benigne BPH-Zellen (Position 2), malignen LNCaP (Position 3), PC-3 (Position
4) und DU-145-Zellen (Position 5) nach 50 Zyklen Prä-Amplifikation bei 2,5 mmol/l MgCI2- Konzentrationen bei steigenenden Annealingtemperaturen (50-63°C) mit dem Primerpaar 120bp (SEQ ID: 5 und 6) und anschließender dPCR. Die Pfeile zeigen den Verlauf der FAM- Signale bis 60,8°C für die PC-3-Zellen und oberhalb von 60,8°C für PrEC und BPH-1 . Fig. 50: FAM signals (methylated GSTP1 DNA fragments, top panel) and HEX signals (non-methylated GSTP1 DNA fragments, bottom panel) from normal PrEC (position 1), benign BPH cells (position 2 ), malignant LNCaP (position 3), PC-3 (position 4) and DU-145 cells (position 5) after 50 cycles of pre-amplification at 2.5 mmol / l MgCl 2 concentrations with increasing annealing temperatures (50-63 ° C.) with the primer pair 120 bp (SEQ ID: 5 and 6 ) and subsequent dPCR. The arrows show the progression of FAM signals up to 60.8 ° C for the PC-3 cells and above 60.8 ° C for PrEC and BPH-1.
Fig. 51 : FAM-Signale (methylierte GSTP1 -DNA-Fragmente) in Abhängigkeit von der Zyklenanzahl (20x, 30x, 40x und 50x) und der MgCI2-Konzentration im Reaktionspuffer (1 ,5; 2,5; 4,5 und 6,0 mmol/l) in der Prä-Amplifikation mit dem Primerpaar 120 bp (SEQ ID: 5 und 6) bei einer Annealingtemperatur von 50,7°C. Bahn 1 : 0% methylierte Standard-DNA, Bahn 2: 50% methylierte Standard-DNA und Bahn 3: Non-Template-Negativkontrolle. Die dünnen Pfeile zeigen die Streusignale bei 0% methylierter Standard-DNA und Non-Template- Negativkontrollen und die dicken Pfeile die steigende Signalintensitäten der 50% methylierten Standard-DNA mit steigender Zyklenanzahl (unten dargestellt). Fig. 51: FAM signals (methylated GSTP1 DNA fragments) as a function of the number of cycles (20x, 30x, 40x and 50x) and the MgCl 2 concentration in the reaction buffer (1, 5, 2.5, 4.5 and 6.0 mmol / L) in the pre-amplification with the primer pair 120 bp (SEQ ID: 5 and 6) at an annealing temperature of 50.7 ° C. Lane 1: 0% methylated standard DNA, lane 2: 50% methylated standard DNA and lane 3: non-template negative control. The thin arrows show the scattering signals at 0% methylated standard DNA and non-template negative controls and the thick arrows the increasing signal intensities of the 50% methylated standard DNA with increasing number of cycles (shown below).
Fig. 52: FAM-Signale (methylierte GSTP1 -DNA-Fragmente) in Abhängigkeit von der Zyklenanzahl (20x, 30x, 40x und 50x) und der MgCI2-Konzentration im Reaktionspuffer (1 ,5; 2,5; 4,5 und 6,0 mmol/l) in der Prä-Amplifikation mit dem Primerpaar 1 16 bp (SEQ ID: 84 und 85) bei einer Annealingtemperatur von 53,8°C. Bahn 1 : 0% methylierte Standard-DNA, Bahn 2: 50% methylierte Standard-DNA und Bahn 3: Non-Template-Negativkontrolle. Die Pfeile zeigen die Intensitäten der FAM-Signale der 50% methylierten Standard-DNA in Abhängigkeit von der Zyklenanzahl in den Proben mit 1 ,5 und 6,0 mmol/l MgCI2- Konzentrationen. Fig. 52: FAM signals (methylated GSTP1 DNA fragments) as a function of the number of cycles (20x, 30x, 40x and 50x) and the MgCl 2 concentration in the reaction buffer (1, 5, 2.5, 4.5 and 6.0 mmol / L) in the pre-amplification with the primer pair 1 16 bp (SEQ ID: 84 and 85) at an annealing temperature of 53.8 ° C. Lane 1: 0% methylated standard DNA, lane 2: 50% methylated standard DNA and lane 3: non-template negative control. The arrows show the intensities of the FAM signals of the 50% methylated standard DNA as a function of the number of cycles in the samples with 1, 5 and 6.0 mmol / l MgCl 2 concentrations.
Fig. 53: FAM-Signale (methylierte GSTP1 -DNA-Fragmente, obere Abbildung) und HEX- Signale (nicht-methylierte GSTP1 -DNA-Fragmente, untere Abbildung) in Serumproben gesunder Probandinnen (GF1 -GF20, links getrennt durch 1 . Trennungslinie) und Serumproben von Patientinnen mit Mammakarzinom (MF1 -MF20, rechts von der 1. Tennungslinie) und Non-Template-Kontrolle (NTC, ohne DNA bzw. genomische DNA ohne Bisulfitumwandlung, jeweils rechts der 2. Trennungslinie) nach 15 Zyklen in der BBPA mit dem GSTP1 -1 16bp-Primern (SEQ ID: 93 und 94) und 1 ,5 mmol/l MgCI2-Konzentration bei 53,8°C und anschließender dPCR. Die Pfeile in der oberen Abbildung zeigen die zusätzlichen Patientenproben, die bei einer MgCI2-Konzentration von 4,5 mM (Fig. 54) positive Ergebnisse für die GSTP1 -Methylierung lieferten und die Pfeile in der unteren Abbildung die schwachen HEX-Signale, die bei einer MgCI2-Konzentration von 1 ,5 mM erhalten wurden. Fig. 53: FAM signals (methylated GSTP1 DNA fragments, top panel) and HEX signals (non-methylated GSTP1 DNA fragments, bottom panel) in serum samples from healthy volunteers (GF1 -GF20, separated on the left by the 1st dividing line ) and serum samples from breast cancer patients (MF1-MF20, to the right of the 1st lineage) and non-template control (NTC, no DNA or genomic DNA without bisulfite conversion, to the right of the 2nd lineage) after 15 cycles in the BBPA with the GSTP1-1 16bp primers (SEQ ID: 93 and 94) and 1.5 mmol / l MgCl 2 concentration at 53.8 ° C followed by dPCR. The arrows in the upper panel show the additional patient samples that gave positive results for GSTP1 methylation at a MgCl 2 concentration of 4.5 mM (Figure 54) and the arrows in the lower panel the weak HEX signals at a MgCl 2 concentration of 1.5 mM.
Fig. 54: FAM-Signale (methylierte GSTP1 -DNA-Fragmente, obere Abbildung) und HEX- Signale (nicht-methylierte GSTP1 -DNA-Fragmente, untere Abbildung) in Serumproben gesunder Probandinnen (GF1 -GF20, links getrennt durch 1 . Trennungslinie) und Serumproben von Patientinnen mit Mammakarzinom (MF1 -MF20, rechts von der 1.
Tennungslinie) und Non-Template-Kontrolle (NTC, ohne DNA bzw. genomische DNA ohne Bisulfitumwandlung, jeweils rechts der 2. Trennungslinie) nach 15 Zyklen in der BBPA mit dem GSTP1 -1 16bp-Primern (SEQ ID: 93 und 94) und 4,5 mmol/l MgCI2-Konzentration bei 53,8°C und anschließender dPCR. Die Pfeile in der oberen Abbildung zeigen die zusätzlichen Patientenproben, die bei einer MgCI2-Konzentration von 4,5 mM im Vergleich zu 1 ,5 mM (Fig. 53) positive Ergebnisse für die GSTP1 -Methylierung lieferten und die Pfeile in der unteren Abbildung die starken HEX-Signale, die bei einer MgCI2-Konzentration von 4,5 mM erhalten wurden. Fig. 54: FAM signals (methylated GSTP1 DNA fragments, top panel) and HEX signals (non-methylated GSTP1 DNA fragments, bottom panel) in serum samples from healthy volunteers (GF1 -GF20, separated on the left by the 1st dividing line ) and serum samples from patients with breast cancer (MF1 - MF20, right of the 1. Tennest line) and non-template control (NTC, without DNA or genomic DNA without bisulfite conversion, to the right of the second dividing line) after 15 cycles in the BBPA with the GSTP1-1 16bp primers (SEQ ID: 93 and 94) and 4.5 mmol / l MgCl 2 concentration at 53.8 ° C and subsequent dPCR. The arrows in the upper panel show the additional patient samples that gave positive results for GSTP1 methylation at 4.5 mM MgCl 2 concentration compared to 1.5 mM (Figure 53) and the arrows in the lower panel the strong HEX signals obtained at a MgCl 2 concentration of 4.5 mM.
Fig. 55: FAM-Signale (methylierte GSTP1 -DNA-Fragmente, obere Abbildung) und HEX- Signale (nicht-methylierte GSTP1 -DNA-Fragmente, untere Abbildung) in Serumproben gesunder Probanden (GM1 -GM20, links getrennt durch 1. Trennlinie), Non-Template- Kontrolle (NTC, ohne DNA in der ddPCR, rechts von der 1 . Trennlinie), Serumproben von Patienten mit Prostatakarzinom (PCa; PPCa1 -PPCa20, rechts von der 2. Tennlinie) und Non-Template-Kontrollen (NTC, ohne DNA bzw. genomische DNA ohne Bisulfitumwandlung, rechts der 3. Trennlinie) nach 15 Zyklen in der BBPA mit dem GSTP1 -120bp-Primern (SEQ ID: 5 und 5) und 2,5 mmol/l MgCI2-Konzentration bei 50,7°C und anschließender dPCR. Die Pfeile zeigen die Serumproben der Patienten mit PCa an, in denen sich die FAM-Signale signifikant von denen in den Serumproben der gesunden Probanden unterscheiden lassen (Tab.13). Fig. 55: FAM signals (methylated GSTP1 DNA fragments, top panel) and HEX signals (non-methylated GSTP1 DNA fragments, bottom panel) in serum samples from healthy volunteers (GM1 -GM20, separated left by 1st dividing line ), Non-template control (NTC, without DNA in the ddPCR, to the right of the 1st dividing line), serum samples from patients with prostate cancer (PCa, PPCa1 -PPCa20, to the right of the second T-line) and non-template controls ( NTC, without DNA or genomic DNA without bisulfite conversion, right of the 3rd dividing line) after 15 cycles in the BBPA with the GSTP1 -120bp primers (SEQ ID: 5 and 5) and 2.5 mmol / l MgCl 2 concentration at 50.7 ° C and subsequent dPCR. The arrows indicate the serum samples of patients with PCa in which the FAM signals are significantly different from those in the healthy subjects' serum samples (Table 13).
Fig. 56: FAM-Signale (methylierte GSTP1 -DNA-Fragmente, obere Abbildung) und HEX- Signale (nicht-methylierte GSTP1 -DNA-Fragmente, untere Abbildung) in Serumproben gesunder Probanden (GM1 -GM20, links getrennt durch 1. Trennlinie), Non-Template- Kontrolle (NTC, ohne DNA in der ddPCR, rechts von der 1 . Trennlinie), Serumproben von Patienten mit Prostatakarzinom (PPCa1 -PPCa20, rechts von der 2. Tennlinie) und NonTemplate-Kontrollen (NTC, ohne DNA bzw. genomische DNA ohne Bisulfitumwandlung, rechts der 3. Trennlinie) nach 15 Zyklen in der BBPA mit dem GSTP1 -1 16bp-Primern (SEQ ID: 93 und 94) und 4,5 mmol/l MgCI2-Konzentration bei 53,8°C und anschließender dPCR. Die Pfeile zeigen die Serumproben der Patienten mit PCa an, in denen sich die FAM-Signale signifikant von denen in den Serumproben der gesunden Probanden unterscheiden lassen (Tab. 14). Fig. 56: FAM signals (methylated GSTP1 DNA fragments, top panel) and HEX signals (non-methylated GSTP1 DNA fragments, bottom panel) in serum samples from healthy volunteers (GM1 -GM20, separated left by 1st dividing line ), Non-template control (NTC, without DNA in the ddPCR, right of the 1st division), serum samples from patients with prostate cancer (PPCa1 -PPCa20, to the right of the 2nd Tennlinie) and non-template controls (NTC, without DNA or genomic DNA without bisulfite conversion, right of the 3rd division) after 15 cycles in the BBPA with the GSTP1-1 16bp primers (SEQ ID: 93 and 94) and 4.5 mmol / l MgCl 2 concentration at 53.8 ° C and subsequent dPCR. The arrows indicate the serum samples of the patients with PCa in which the FAM signals are significantly different from those in the serum samples of the healthy subjects (Table 14).
Fig. 57: FAM-Signale (methylierte S£RP//V£7-DNA-Fragmente, obere Abbildung) und HEX- Signale (nicht-methylierte SERPINE 7-DNA-Fragmente, untere Abbildung) in Serumproben gesunder Probanden (GM1 -GM20, links getrennt durch 1. Trennlinie), Serumproben von Patienten mit Prostatakarzinom (PPCa1 -PPCa20, rechts von der 1 . Tennlinie) und NonTemplate-Kontrollen (NTC, ohne DNA bzw. genomische DNA ohne Bisulfitumwandlung, rechts der 2. Trennlinie) nach 15 Zyklen in der BBPA mit dem S£RP//V£7-123bp-Primern (SEQ ID: 16 und 17) und 3,5 mM MgCI2-Konzentration bei 52,0°C und anschließender
dPCR. Die Pfeile zeigen die Serumproben der Patienten mit PCa an, in denen sich die FAM- Signale signifikant von denen in den Serumproben der gesunden Probanden unterscheiden lassen (Tab. 15). FIG. 57: FAM signals (methylated S ε RP // V ε 7 DNA fragments, top panel) and HEX signals (unmethylated SERPINE 7 DNA fragments, bottom panel) in serum samples from healthy volunteers (GM1). GM20, left separated by 1st division), serum samples from patients with prostate cancer (PPCa1 -PPCa20, right of the 1st Tennlinie) and NonTemplate controls (NTC, without DNA or genomic DNA without bisulfite conversion, right of the 2nd dividing line) 15 cycles in the BBPA with the S.I.P.V.V. 7-123bp primers (SEQ ID: 16 and 17) and 3.5mM MgCl 2 concentration at 52.0 ° C and then dPCR. The arrows indicate the serum samples of the patients with PCa, in which the FAM signals can be significantly differentiated from those in the serum samples of the healthy subjects (Table 15).
Fig. 58: FAM-Signale (methylierte S£RP//V£i-DNA-Fragmente, obere Abbildung) und HEX- Signale (nicht-methylierte SERPINE•/-DNA-Fragmente, untere Abbildung) in Serumproben gesunder Probanden (GM1 -GM20, links getrennt durch 1. Trennlinie), Serumproben von Patienten mit Prostatakarzinom (PPCa1 -PPCa20, rechts von der 1 . Tennlinie) und NonTemplate-Kontrollen (NTC, ohne DNA bzw. genomische DNA ohne Bisulfitumwandlung, rechts der 2. Trennlinie) nach 50 Zyklen in der BBPA mit dem SERP/Λ/ΕΜ 23bp-Primern (SEQ ID: 16 und 17) und 3,5 mmol/l MgCI2-Konzentration bei 52,0°C und anschließender dPCR. Die Pfeile zeigen die Serumproben der Patienten mit PCa an, in denen sich die FAM- Signale signifikant von denen in den Serumproben der gesunden Probanden unterscheiden lassen (Tab. 16). Fig. 58: FAM signals (S £ methylated RP // V £ i-DNA fragments, upper panel) and HEX signals (unmethylated serpins • / DNA fragments, lower figure) (in serum samples from healthy subjects GM1 -GM20, left separated by 1st division), serum samples from patients with prostate cancer (PPCa1 -PPCa20, right of the 1st Tennlinie) and NonTemplate controls (NTC, without DNA or genomic DNA without bisulfite conversion, right of the 2nd dividing line) after 50 cycles in the BBPA with the SERP / Λ / ΕΜ 23bp primers (SEQ ID: 16 and 17) and 3.5 mmol / l MgCl 2 concentration at 52.0 ° C followed by dPCR. The arrows indicate the serum samples of patients with PCa, in which the FAM signals can be significantly different from those in the serum samples of healthy volunteers (Table 16).
Fig. 59: FAM-Signale (methylierte AOX1 -DNA-Fragmente, obere Abbildung) und HEX- Signale (nicht-methylierte AOX1 -DNA-Fragmente, untere Abbildung) in Serumproben gesunder Probanden (GM1 -GM20, links getrennt durch 1. Trennlinie), Serumproben von Patienten mit Prostatakarzinom (PPCa1 -PPCa20, rechts von der 1 . Tennlinie) und NonTemplate-Kontrollen (NTC, ohne DNA bzw. genomische DNA ohne Bisulfitumwandlung, rechts der 2. Trennlinie) nach 15 Zyklen in der BBPA mit dem AOX1 -138bp-Primern (SEQ ID: 18 und 19) und 2,5 mmol/l MgCI2-Konzentration bei 50,0°C und anschließender dPCR. Die Pfeile zeigen die FAM-Signale in Serumproben von 3 gesunden Probanden und einem PCa-Patienten an, die nach 30 Zyklen in der BBPA deutlich in ihrer Intensität abfielen (Fig. 60 und Tab. 17 und 18). Fig. 59: FAM signals (methylated AOX1 DNA fragments, top panel) and HEX signals (non-methylated AOX1 DNA fragments, bottom panel) in serum samples from healthy volunteers (GM1 -GM20, separated left by 1st dividing line ), Serum samples from patients with prostate cancer (PPCa1 -PPCa20, to the right of the 1st Tennlinie) and NonTemplate controls (NTC, without DNA or genomic DNA without bisulfite conversion, right of the 2nd dividing line) after 15 cycles in the BBPA with the AOX1 -138bp primers (SEQ ID: 18 and 19) and 2.5 mmol / l MgCl 2 concentration at 50.0 ° C followed by dPCR. The arrows indicate the FAM signals in serum samples from 3 healthy volunteers and a PCa patient, which decreased significantly in intensity after 30 cycles in the BBPA (FIG. 60 and Tab. 17 and 18).
Fig. 60: FAM-Signale (methylierte AOX1 -DNA-Fragmente, obere Abbildung) und HEX- Signale (nicht-methylierte AOX1 -DNA-Fragmente, untere Abbildung) in Serumproben gesunder Probanden (GM1 -GM20, links von der 1 . Trennlinie dargestellt), Serumproben von Patienten mit Prostatakarzinom (PPCa1 -PPCa20, rechts von der 1 . Tennlinie) und NonTemplate-Kontrollen (NTC, ohne DNA bzw. genomische DNA ohne Bisulfitumwandlung, rechts der 2. Trennlinie) nach 30 Zyklen in der BBPA mit dem AOX1 -138bp-Primern (SEQ ID: 18 und 19) und 2,5 mmol/l MgCI2-Konzentration bei 50,0°C und anschließender dPCR. Die Pfeile zeigen die FAM-Signale in Serumproben von gesunden Probanden und einem PCa-Patienten an, die im Vergleich zu 15 Zyklen (Fig. 59) nach 30 Zyklen in der BBPA deutlich in ihrer Intensität abfielen. Der Pfeil rechts zeigt den Befund des Patienten PPCa14 an, bei dem nach 15 Zyklen in der BBPA noch deutlich erhöhte Werte sichtbar waren und nach 30 Zyklen im Gegensatz z.B. der Patienten PPCa12 und 17 deutlich vermindert und von denen der gesunden Probanden GM12 und 16 nicht mehr zu unterscheiden waren. Wird der Grenzwert (threshold) so eingestellt, dass diese Proben keine FAM-positiven Signale
aufweisen, zeigen 7 Serumproben von Patienten mit PCa deutlich erhöhte FAM-Signalwerte und unterscheiden sich signifikant von denen gesunder Probanden (Tab. 17 und 18). Figure 60: FAM signals (methylated AOX1 DNA fragments, top panel) and HEX signals (non-methylated AOX1 DNA fragments, bottom panel) in healthy volunteer serum samples (GM1 -GM20, to the left of the 1st dividing line serum samples from patients with prostate cancer (PPCa1 -PPCa20, to the right of the 1st Tennlinie) and NonTemplate controls (NTC, without DNA or genomic DNA without bisulfite conversion, right of the 2nd dividing line) after 30 cycles in the BBPA with the AOX1 -138bp primers (SEQ ID: 18 and 19) and 2.5 mmol / l MgCl 2 concentration at 50.0 ° C and subsequent dPCR. The arrows indicate the FAM signals in serum samples from healthy volunteers and a PCa patient that significantly decreased in intensity as compared to 15 cycles (FIG. 59) after 30 cycles in BBPA. The arrow on the right shows the findings of the patient PPCa14, in which clearly increased values were still visible after 15 cycles in the BBPA and after 30 cycles in contrast to the patients PPCa12 and 17 significantly reduced and those of the healthy subjects GM12 and 16 no longer were to be distinguished. If the threshold is set so that these samples are not FAM positive signals 7 serum samples from patients with PCa show markedly elevated FAM signal values and differ significantly from healthy subjects (Table 17 and 18).
Fig. 61 : Box-Blot für die PSA-Konzentrationswerte (ng/ml), die im Serum von 20 Patienten mit benigner Prostatahyperplasie (BPH, links Nr. 1 ) und 20 Patienten mit PCa (rechts Nr. 2) ermittelt wurden und sich nicht signifikant unterschieden (p<0,552).
Fig. 61: Box blot for the PSA concentration values (ng / ml) determined in the serum of 20 patients with benign prostatic hyperplasia (BPH, left # 1) and 20 patients with PCa (# 2 right) and themselves did not differ significantly (p <0.552).
Allgemeine Vorschriften: General regulations:
Isolierung und Bisulfit-Unwandlung frei-zirkulierender DNA (fc-DNA): Als Erstes wird die frei-zirkulierende DNA (fc-DNA) aus der zu untersuchenden Probe, wie z. B. aus 1 -5 ml Serumproben mit Hilfe des QIAamp Circulating Nucleis Acid Kit von Qiagen GmbH (Hilden, BRD) entsprechend der Testkitbeschreibung isoliert und in jew. 25 μΙ eluiert. Isolation and bisulfite transformation of free-circulating DNA (fc-DNA): First, the free-circulating DNA (fc-DNA) from the sample to be examined, such. B. from 1 -5 ml serum samples using the QIAamp Circulating Nucleic Acid Kit from Qiagen GmbH (Hilden, Germany) according to the test kit description isolated and eluted in jew. 25 μΙ.
Bisulfit-Umwandlung der fc-DNA: Die Bisulfit-Umwandlung von jew. 20 μΙ der fc-DNA erfolgte mit Hilfe des EpiTect Fast Bisulfit Conversion Kit von Qiagen GmbH entsprechend der Testkitbeschreibung. Nach Eluation erhält man jew. 15 μΙ Bisulfit-behandelte fc-DNA- Lösung. Bisulfite conversion of the fc DNA: The bisulfite conversion of each 20 μΙ of the fc DNA was carried out using the EpiTect Fast Bisulfite Conversion Kit from Qiagen GmbH according to the test kit description. After elution, each 15 μΙ bisulfite-treated fc-DNA solution is obtained.
Bias-basierte Prä-Amplifikation (BBPA) der Proben: Bias-based pre-amplification (BBPA) of the samples:
Nach der Bisulfit-Umwandlung wurden die DNA-Konzentrationen der DNA-Proben mit Hilfe des Quantus™Fluorometers (Promega) bestimmt. Lag die DNA-Konzentration unterhalb oder oberhalb von 1 ng/μΙ, wurden 2 bzw. 1 μΙ der Bisulfit-behandelten DNA in die BBPA eingesetzt. After bisulfite conversion, the DNA concentrations of the DNA samples were determined using the Quantus ™ Fluorometer (Promega). If the DNA concentration was below or above 1 ng / μΙ, 2 or 1 μΙ of the bisulfite-treated DNA were inserted into the BBPA.
Mastermix für die BBPA: Mastermix for the BBPA:
Reagenz Vol. [μΙ] Endkonzentration. Reagent Vol. [ΜΙ] Final concentration.
PCR-Buffer [15 mM MgCI] 2,50 1 ,5 mmol/l PCR buffer [15 mM MgCl] 2.50 1.5 mmol / l
dNTPs [2,5 mM] 2,00 200 μπποΙ/Ι dNTPs [2.5 mM] 2.00 200 μπποΙ / Ι
forward Primer 1 ,00 400 nmol/l forward primer 1, 00 400 nmol / l
reverse Primer 1 ,00 400 nmol/l reverse primer 1, 00 400 nmol / l
HotStarTaq Plus [5 ΙΙ/μΙ] 0,125 0,625 U HotStarTaq Plus [5 ΙΙ / μΙ] 0.125 0.625 U
MgCI2 [25 mM] 0-13,50, 0 bis +13,5, MgCl 2 [25 mM] 0-13.50, 0 to +13.5,
bevorzugt 1 ,00-2,00 bevorzugt +1 -2 mmol/l preferably 1, 00-2.00, preferably +1 -2 mmol / l
RNase freies Aqua dest 2,875-17,375, RNase free aqua dest 2.875-17.375,
bevorzugt 13,50-15,50 preferably 13.50-15.50
Träger-DNA 1 ,00-2,00 Carrier DNA 1, 00-2.00
Endvolumen 25,00 mM = mmol/l
rimer für die BBPA: Final volume 25.00 mM = mmol / l rimer for the BBPA:
Target Forward (5λ->3λ) SEQ Reverse (5 λ->3 λ) SEQ Target Forward ( 5λ -> 3λ ) SEQ Reverse ( 5λ -> 3λ ) SEQ
ID ID ID ID
RASSF1A GCGTTTGTTAGCGTTTAAAG 61 AACCGAATACGACCCTTC 62 (124bp) RASSF1A GCGTTTGTTAGCGTTTAAAG 61 AACCGAATACGACCCTTC 62 (124bp)
GSTP1 CG AGCGGTTTTAGGGAAT T 91 TCCCCAACGAAACCTAAAAA 92 (114bp) GSTP1 CG AGCGGTTTTAGGGAAT T 91 TCCCCAACGAAACCTAAAAA 92 (114bp)
GSTP1 TGTAAGTTTCGGGATCGTAGC 95 TCCCCAACGAAACCTAAAAA 96 (129bp) GSTP1 TGTAAGTTTCGGGATCGTAGC 95 TCCCCAACGAAACCTAAAAA 96 (129bp)
GSTP1 GTGTGTAAGTTTCGGGATCG 97 TCCCCAACGAAACCTAAAAA 98 (132bp) GSTP1 GTGTGTAAGTTTCGGGATCG 97 TCCCCAACGAAACCTAAAAA 98 (132bp)
AOX1 GTTGGATTTTAGGTTTTAGTA-AG 63 GCCCGATCCATTATAATATC 64 (138bp) AOX1 GTTGGATTTTAGGTTTTAGTA-AG 63 GCCCGATCCATTATAATATC 64 (138bp)
AOX1 GGATTTTAGGTTTTAGTAAGTTTC 65 GCCCGA CC T ATATCCG 66 (135bp) AOX1 GGATTTTAGGTTTTAGTAAGTTTC 65 GCCCGA CC ATATCCG 66 (135bp)
AOX1 GATTTTAGGTTTT GTAAGTTTCG 67 AOX1 GATTTTAGGTTTT GTAAGTTTCG 67
(134p) (134p)
SERPINE1 CGTTGT AAGAAGATT A AC 68 TAAACCCGAAATAAAAAATTAAA 69 (119bp) SERPINE1 CGTTGT AAGAAGATT A AC 68 TAAACCCGAAATAAAA ATTAAA 69 (119bp)
TM GGTCGATTCGTATGTTAGA 70 5 " -AACCGTACCGAAACAAAA 71TM GGTCGATTCGTATGTTAGA 70 5 " -AACCGTACCGAAACAAAA 71
(125bp) (125bp)
TM GTTTGGGTTGGGACGGATA 72 5 " -AAAAACCAAAACCCCAAACA 73TM GTTTGGTTGGGACGGATA 72 5 " -AAAAACCAAAACCCCAAACA 73
(144bp) (144bp)
TM GTTTGGGGTTTTGGTTTTTG 74 5 " -GCAATCCGTCGCAAATCTAA 75TM GTTTGGGGTTTTGGTTTTTG 74 5 " -GCAATCCGTCGCAAATCTAA 75
(166bp) (166bp)
TM 5 " -CAATCCGTCGCAAATCTAAC 76TM 5 " -CAATCCGTCGCAAATCTAAC 76
(165bp) (165bp)
Nachdem unter Einsatz methylspezifischer Primer nach Prä-Amplifikation und dPCR sowohl in Serumproben von Tumorpatienten als auch in fc-DNA-Proben aus Serum von gesunden Probanden methylierte DNA-Fragmenten nachgewiesen wurden, was bei Verwendung eines weniger methylspezifischen Primerpaares nicht der Fall war, wurden die methylspezifischen Primer empirisch so verändert, dass neben methylierten auch nicht-methylierte DNA- Fragmente amplifiziert wurden und dabei möglichst eine Bias zugunsten von methylierten DNA-Sequenzen während der Amplifikation auftrat. Dabei wurden die oben genannten Primer erhalten. So wurden für das RASSF1A-Gen ein Oligonukleotid-Paar generiert (1 17
bp-Amplifikatgröße), dass über einen großen Temperaturbereich sowohl methylierte als auch nicht-methylierte DNA-Fragmente amplifiziert und dabei eine deutlich Bias zugunsten methylierter DNA-Fragmente aufwies. Ähnliches erfolgte für die Zielgene PLA2R1 (Fig. 34- 37), GSTP1 (Tab. 15), SERPINE1, AOX1 und Thrombomodulin, ohne dass ausschließlich nur methylierte Fragmente amplifiziert werden. After methylated DNA fragments were detected using methyl-specific primers after pre-amplification and dPCR both in serum samples from tumor patients and in serum fc DNA samples from healthy subjects, which was not the case when using a less methyl-specific primer pair methyl-specific primer empirically modified so that in addition to methylated and non-methylated DNA fragments were amplified, while a possible bias in favor of methylated DNA sequences during amplification occurred. The above-mentioned primers were obtained. Thus, an oligonucleotide pair was generated for the RASSF1A gene (1 17 bp amplificate size) that amplified both methylated and non-methylated DNA fragments over a wide temperature range and thereby had a marked bias in favor of methylated DNA fragments. The same was done for the target genes PLA2R1 (FIG. 34-37), GSTP1 (Tab. 15), SERPINE1, AOX1 and thrombomodulin, without exclusively amplifying only methylated fragments.
Die oben genannten Primer wurden in den nachfolgenden Beispielen sowohl für die BBPA als auch die dPCR eingesetzt. Selbstverständlich können für die dPCR auch andere Primer (nested-PCR-Primer) eingesetzt werden, die mit den durch die BBPA präamplifizierten Sequenzabschnitten hybridisieren (Annealing). Die in der dPCR eingesetzten Primer müssen die DNA-Sequenz einschließen, für die die verwendeten Sonden spezifisch sind. Da in der dPCR ein Bias ausgeschlossen ist, können die Primer hier nach herkömmlichen Regeln ausgewählt werden oder es werden die BBPA-spezifischen Primer ebenfalls in der dPCR eingesetzt. The above-mentioned primers were used in the following examples for both BBPA and dPCR. Of course, it is also possible to use other primers (nested PCR primers) for the dPCR which hybridize (anneal) to the sequence sequences pre-amplified by the BBPA. The primers used in the dPCR must include the DNA sequence for which the probes used are specific. Since a bias is excluded in the dPCR, the primers can be selected here according to conventional rules or the BBPA-specific primers are also used in the dPCR.
Temperatur und Zeitschema für die BBPA: Temperature and time schedule for the BBPA:
Mastermix für ddPCR: Mastermix for ddPCR:
Bestandteil Ansatz-Vol [μΙ] Endkonzentration Component batch-vol [μΙ] final concentration
2x ddPCR Supermix 2x ddPCR supermix
(BioRad) 10,0 (BioRad) 10.0
20x Primer / Sonden-Mix 1 ,0 900 mmol/l / 250 nmol/l 20x primer / probe mix 1, 0 900 mmol / l / 250 nmol / l
DNA 2,0 DNA 2.0
RNase-freies Aqua dest. 7,0 RNase-free dist. 7.0
Endvolumen 20,0
Sonden: für die dPCR Final volume 20.0 Probes: for the dPCR
Target methyliert (5λ->3λ) SEQ nicht-methyliert (5λ->3λ) SEQ Hybridisie Target methylated (5 λ -> 3 λ ) SEQ unmethylated (5 λ -> 3 λ ) SEQ hybridization
ID ID rg. temp. ID ID rg. temp.
PLA2R1 CCCAACTACTCCGCGACGCAA 20 AACCCAACTACTCCACAACACAAA 21 58, 8°C (3 CpG) PLA2R1 CCCAACTACTCCGCGACGCAA 20 AACCCAACTACTCCACAACACAAA 21 58, 8 ° C (3 CpG)
PLA2R1 CAACTACTCCGCGACGCAAAC 22 AACCCAACTACTCCACAACACAAAC 23 51, 9°C (4 CpG) G A PLA2R1 CAACTACTCCGCGACGCAAAC 22 AACCCAACTACTCCACAACACAAAC 23 51, 9 ° C (4 CpG) G A
RASSF1A CGCCCAACGAATACCAACTCC 24 CACCCAACAAATACCAACTCCCACA 25 51, 9°C (3 CpG) CG A- RASSF1A CGCCCAACGAATACCAACTCC 24 CACCCAACAAATACCAACTCCCACA 25 51.9 ° C (3 CpG) CG A-
RASSF1A CGCCCAACGAATACCAACTCC 54 CACCCAACAAATACCAACTCCCACA 55 51, 9°C (4 CpG) CGCG ACTC- RASSF1A CGCCCAACGAATACCAACTCC 54 CACCCAACAAATACCAACTCCCACA 55 51, 9 ° C (4 CpG) CGCG ACTC
GSTP1 CGCAACGAAATATACGCAAC 56 CACAACAAAATATACACAAC 57 50, 7°C (3 CpG) GSTP1 CGCAACGAAATATACGCAAC 56 CACAACAAATACACAAC 57 50, 7 ° C (3 CpG)
GSTP1 ACGAACTAACGCGCCGAAAC 58 ACAAACTAACACACCAAAAC 59 51, 9°C (4 CpG) GSTP1 ACGAACTAACGCGCCGAAAC 58 ACAAACTAACACACCAAAAC 59 51, 9 ° C (4 CpG)
A0X1 ACTCGAACGCCCGATCCATTA 37 ACAACTCAAACACCCAATCCATTAT 38 50, 7°C (3 CpG) TAA AA A0X1 ACTCGAACGCCCGATCCATTA 37 ACAACTCAAACACCCAATCCATTATE 38 50, 7 ° C (3 CpG) TAA AA
A0X1 CGCTAATTCGAÄÄACCCGAÄA 39 CACTAATTCÄÄÄÄACCCÄÄÄAC A 40 53, 8°C (4 CpG) A0X1 CGCTAATTCGAÄÄACCCGAÄA 39 CACTAATTCÄÄÄÄACCCÄÄÄAC A 40 53, 8 ° C (4 CpG)
AOX1 ΓΠΓΠΓΤΆΆΤΤΓΠΆΆΆACCCGA 41 CACACTAATTCAAAÄACCCAAAACA 42 51, 9°C (5 CpG) AACGA A AOX1 ΓΠΓΠΓΤΆΆΤΤΓΠΆΆΆACCCGA 41 CACACTAATTCAAAACACAAAACA 42 51, 9 ° C (5 CpG) AACGA A
SERPINE1 CGATTAACGATTCGTCCTACT 43 CAATTAACAATTCATCCTACTCTAA 44 58, 8°C (4 CpG) CTAACG CA
SERPINE1 CGATTAACGATTCGTCCTACT 43 CAATTAACAATTCATCCTACTCTAA 44 58.8 ° C (4 CpG) CTAACG CA
Alle Sonden sind in den Beispielen 5'- FAM (methylierte DNA) bzw. HEX (nicht methylierte DNA) markiert und am 3'-Ende mit dem Quencher BHQ-1 markiert. All probes are labeled in Examples 5'-FAM (methylated DNA) or HEX (unmethylated DNA) and labeled at the 3 'end with the quencher BHQ-1.
Herstellung der Tröpfchen (Droplet-Generator [BioRad]): Production of Droplets (Droplet Generator [BioRad]):
20 μΙ Mastermix mit DNA-Probe 20 μΙ master mix with DNA sample
+ 70 μΙ Öl in entsprechende Cartridges (BioRad); + 70 μΙ oil in corresponding cartridges (BioRad);
Generierung von etwa 20.000 Öl/Emulsionströpfchen, Generation of about 20,000 oil / emulsion droplets,
davon 35 μΙ in die nachfolgende dPCR thereof 35 μΙ in the following dPCR
Temperatur und Zeitschema für die dPCR mittels T100-PCR-Gerät (BioRad): Temperature and time diagram for the dPCR using the T100 PCR device (BioRad):
Messung der Fluoreszenzen in den Töpfchen: Measurement of fluorescence in the pots:
Die Messung der Tröpfchenfluoreszenz erfolgte mittels QY100 (BioRad) entsprechend der Herstellerbeschreibung.
Genauswahl Droplet fluorescence was measured by QY100 (BioRad) according to the manufacturer's description. Just dial
Anhand von Untersuchungen an Prostatazellen (normale PrEC und BPH-1 und maligne LNCaP, PC-3 und DU-145-Zelllinien), Brustkrebszellen (normale HMEC und maligne Cal-51 , BT-474, MCF-7 und MDA-MB-453-Zelllinien), Leukämiezelllinien (U937 und Jurkat), Hepatomzelllinie (HepG2) und normale Endothelzellen (HUVEC und HCAEC) wurden die Gene PLA2R1 , RASSF1A und GSTP1 ergänzt durch die Gene SERPINE1 (PAI-1 ) und AOX1 ausgewählt. Ein weiterer Genkandidat ist das Thrombomodulin (TM.). Bei den Genen uPA, Del-1 und Jam-C zeigten sich nur vereinzelt erhöhte Methylierungswerte in den Prostatatumorzelllinien. Das Gen PLA2G5 wies bereits in den normalen PrEC erhöhte Methylierungswerte auf und ist deshalb für den Einsatz als Biomarker zur Diagnose von Tumorerkranklungen ungeeignet. From studies on prostate cells (normal PrEC and BPH-1 and malignant LNCaP, PC-3 and DU-145 cell lines), breast cancer cells (normal HMEC and malignant Cal-51, BT-474, MCF-7 and MDA-MB-453 Cell lines), leukemia cell lines (U937 and Jurkat), hepatoma cell line (HepG2) and normal endothelial cells (HUVEC and HCAEC), the genes PLA2R1, RASSF1A and GSTP1 were complemented by the genes SERPINE1 (PAI-1) and AOX1. Another gene candidate is thrombomodulin (TM.). In the case of the genes uPA, Del-1 and Jam-C, there were only sporadic increases in methylation levels in the prostate tumor cell lines. The gene PLA2G5 already showed elevated methylation levels in the normal PrEC and is therefore unsuitable for use as a biomarker for the diagnosis of tumor diseases.
Tabelle 1 : Übersicht über die untersuchten Gen-Methylierungen (%) in Prostata- (normale PrEC und BPH-1 und maligne LNCaP, PC-3 und DU-145-Zellinien), Brustkrebs- (normale HMEC und maligne Cal-51 , BT-474, MCF-7 und MDA-MB-453-Zelllinien), Leukämie- (U937 und Jurkat), Hepatomzelllinie (HepG2) und normale Endothelzellen (HUVEC und HCAEC) Table 1: Overview of the examined gene methylations (%) in prostate (normal PrEC and BPH-1 and malignant LNCaP, PC-3 and DU-145 cell lines), breast cancer (normal HMEC and malignant Cal-51, BT -474, MCF-7 and MDA-MB-453 cell lines), leukemia (U937 and Jurkat), hepatoma cell line (HepG2) and normal endothelial cells (HUVEC and HCAEC)
n.d. = nicht bestimmt.
Ausführungsbeispiel 1 : Ergebnisse der BBPA-dPCR anhand der Methylierung von RASSF1 in Serumpoolproben von Patientinnen mit Mammakarzinom im Vergleich zu gesunden Probandinnen nd = not determined. Exemplary Embodiment 1 Results of the BBPA-dPCR Based on the Methylation of RASSF1 in Serum Pool Samples of Patients with Breast Cancer in Comparison to Healthy Test Subjects
Bei Verwendung des Bias-induzierenden RASSFI-^ 17 bp)-Primerpaares (SEQ ID No. 3 und 4) stellte sich überraschend heraus, dass mit steigender Zyklenanzahl und ohne zusätzlicher Verdünnung der prä-amplifizierten Amplifikate die Schere zwischen den ermittelten Methylierungsgraden des RASSF1A-Gens zwischen gesunden Probandinnen und Patientinnen mit Mammakarzinom sich zunehmend vergrößerte, soweit dass die Werte der gesunden Probandinnen sich in Richtung 0 % und die der Mammakarzinom-Patientinnen in Richtung 100 % sich verschoben. So zeigte sich, dass bei Nutzung des obigen Primerpaares bei einer Annealingtemperatur von 66,1 °C bis 60,0°C in den Proben von Mammakarzinompatienten die Kopienzahl methylierter Sequenzen im Vergleich zu nicht- methylierten stärker anstiegen (Fig. 2). Unerwartet war jedoch, dass die in den fc-DNA gesunder Probandinnen vorkommenden methylierten DNA-Kopien, wenn sie auch in niedriger Menge vorliegen, gegenüber nicht-methylierten DNA-Kopien nicht bevorzugt vervielfältigt wurden. Ganz im Gegenteil wurden in den gesunden Proben die nicht- methylierten DNA-Kopien gegenüber den methylierten Kopien verstärkt vervielfältigt (Tabelle 2). Ohne BBPA betrug der Methylierungsgrad (fraktionale Häufigkeit) 0,6 % (Poisson- Wahrscheinlichkeitsbereich: 0-1 ,2%) bei gesunden Probandinnen und 1 ,5 % (Poisson- Wahrscheinlichkeitsbereich: 0,8-2,1 %) bei Patientinnen mit Mammakarzinom (Tab. 2).
When using the bias-inducing RASSFI-17 bp primer pair (SEQ ID Nos. 3 and 4) it was surprisingly found that with increasing number of cycles and without additional dilution of the pre-amplified amplicons, the gap between the determined methylation levels of RASSF1A- The proportion of healthy volunteers with breast cancer increased so much that the values of healthy volunteers shifted towards 0% and those of breast cancer patients to 100%. Thus, when using the above primer pair at an annealing temperature of 66.1 ° C to 60.0 ° C in the samples of breast carcinoma patients, the copy number of methylated sequences increased more in comparison to unmethylated ones (Figure 2). However, it was unexpected that the methylated DNA copies found in the fc DNA of healthy subjects, although present in low abundance, were not preferentially amplified over non-methylated DNA copies. On the contrary, in the healthy samples, the unmethylated DNA copies were increasingly amplified compared to the methylated copies (Table 2). Without BBPA, the degree of methylation (fractional frequency) was 0.6% (Poisson probability range: 0-1, 2%) in healthy subjects and 1.5% (Poisson probability range: 0.8-2.1%) in patients with Breast cancer (Table 2).
Tabelle 2: Kopienanzahl methylierter (Met) und nicht-methylierter (Unm)
in Abhängigkeit von der Annealingtemperatur (60,0-69,3°C) in der BBPA bei 30 Zyklen in Serumpoolproben gesunder Probandinnen (BA) oder Patientinnen mit Mamma-Karzinom (PatP). Nach BBPA wurden 1 μΙ der 25 μΙ-PCR-Ansätze in die dPCR eingesetzt, weshalb die Werte nach der BBPA zum Vergleich mit 25 multipliziert wurden, „ohne" in der Spalte Temp./ °C bedeutet ohne vorherige BBPA. TABLE 2 Number of Copies of Methylated (Met) and Non-Methylated (Unm) depending on the annealing temperature (60.0-69.3 ° C) in the BBPA at 30 cycles in serum pool samples from healthy women (BA) or patients with breast cancer (PatP). After BBPA 1 μΙ of the 25 μΙ PCR batches were used in the dPCR, which is why the values were multiplied by 25 for comparison with BBPA, "without" in the column Temp./ ° C means without previous BBPA.
Poisson Poisson Poisson Poisson
Kopien Chl- Chl- Akzeptierte Fraktionale Fraktionale Fraktionale Copies Chl-Chl- Accepted Fractional Fractional Fractionals
Probe Target 1:25 Positive Negative Chl+Ch2+ Chl+Ch2- Temp./ °C Sample Target 1:25 Positive Negative Chl + Ch2 + Chl + Ch2- Temp./ ° C
/20μΙ Λ/θΙΙ Ch2+ Ch2- Tröpfchen Häufigkeit Häufigkeit Häufigkeit / 20μΙ Λ / θΙΙ Ch2 + Ch2 droplets Frequency Frequency Frequency
Max Min Max Min
RASSFl RASSFl
BA 9 9 4 10353 0 4 669 9684 10357 0,6 1,2 0 ohne Met BA 9 9 4 10353 0 4 669 9684 10357 0.6 1.2 0 without met
RASSFl RASSFl
BA 1580 1580 669 9688 ohne Unm BA 1580 1580 669 9688 without gross
RASSFl RASSFl
PatP 40 40 19 11016 1 18 1202 9814 11035 1,5 2,1 0,8 ohne PatP 40 40 19 11016 1 18 1202 9814 11035 1.5 2.1 0.8 without
Met mead
RASSFl RASSFl
PatP 2720 2720 1203 9832 ohne Unm PatP 2720 2720 1203 9832 without Unm
RASSFl RASSFl
BA 30x 2 50 1 11872 1 0 65 11807 11873 1,5 5 0 69,3 BA 30x 2 50 1 11872 1 0 65 11807 11873 1.5 5 0 69.3
Met mead
RASSFl RASSFl
BA 30x 132 3300 66 11807 69,3 BA 30x 132 3300 66 11807 69.3
Unm Unm
RASSFl RASSFl
PatP 30x 11,2 280 6 12562 0 6 73 12489 12568 8 14 2 69,3 PatP 30x 11.2 280 6 12562 0 6 73 12489 12568 8 14 2 69.3
Met mead
RASSFl RASSFl
PatP 30x 138 3450 73 12495 69,3 PatP 30x 138 3450 73 12495 69.3
Unm Unm
RASSFl RASSFl
BA 30x 18 450 8 10515 4 4 447 10068 10523 1,7 2,9 0,5 68,0 BA 30x 18 450 8 10515 4 4 447 10068 10523 1.7 2.9 0.5 68.0
Met mead
RASSFl RASSFl
BA 30x 1030 25750 451 10072 68,0 BA 30x 1030 25750 451 10072 68.0
Unm Unm
RASSFl RASSFl
PatP 30x 32 800 19 13584 0 19 351 13233 13603 5,1 7,3 2,8 68,0 PatP 30x 32 800 19 13584 0 19 351 13233 13603 5.1 7.3 2.8 68.0
Met mead
RASSFl RASSFl
PatP 30x 616 15400 351 13252 68,0 PatP 30x 616 15400 351 13252 68.0
Unm Unm
BA 30x RASSFl 162 4050 71 10332 35 36 3692 6640 10403 1,52 1,87 1,17 66,1
BA 30x RASSFl 162 4050 71 10332 35 36 3692 6640 10403 1.52 1.87 1.17 66.1
Met mead
RASSF1 RASSF1
BA 30x 10440 261000 3727 6676 66,1 BA 30x 10440 261000 3727 6676 66.1
Unm Unm
RASSF1 RASSF1
PatP 30x 17660 441500 6583 5888 2325 4258 2801 3087 12471 58,6 59,5 57,7 66,1 PatP 30x 17660 441500 6583 5888 2325 4258 2801 3087 12471 58.6 59.5 57.7 66.1
Met mead
RASSF1 RASSF1
PatP 30x 12460 311500 5126 7345 66,1 PatP 30x 12460 311500 5126 7345 66.1
Unm Unm
RASSF1 RASSF1
BA 30x 0 0 0 10851 0 0 6036 4815 10851 0 0 0 60,0 BA 30x 0 0 0 10851 0 0 6036 4815 10851 0 0 0 60.0
Met mead
RASSF1 RASSF1
BA 30x 19120 478000 6036 4815 60,0 BA 30x 19120 478000 6036 4815 60.0
Unm Unm
RASSF1 RASSF1
PatP 30x 74000 1850000 12234 550 1678 10556 12 538 12784 95,69 95,91 95,46 60,0 PatP 30x 74000 1850000 12234 550 1678 10556 12 538 12784 95.69 95.91 95.46 60.0
Met mead
RASSF1 RASSF1
PatP 30x 3340 83500 1690 11094 60,0 PatP 30x 3340 83500 1690 11094 60.0
Unm
Unm
Tabelle 3: Kopienanzahl methylierter (methyl) und nicht-methylierter (unmethyl) RASSF1A- Sequenzen in Abhängigkeit von der Zyklenanzahl (Ox [d.h. ohne BBPA], 8x, 12x, 16x und 40x) in der BBPA bei 60,0°C in Serumpoolproben gesunder Probandinnen (BA) oder Patientinnen mit Mamma-Karzinom (PatP). Nach BBPA wurden 1 μΙ der 25 μΙ-PCR-Ansätze in die dPCR eingesetzt, weshalb die Werte nach der BBPA zum Vergleich mit 25 multipliziert wurden. Table 3: Copy number of methylated (methyl) and unmethylated (unmethyl) RASSF1A sequences as a function of number of cycles (Ox [ie, without BBPA], 8x, 12x, 16x and 40x) in the BBPA at 60.0 ° C in serum pool samples healthy subjects (BA) or patients with breast carcinoma (PatP). After BBPA 1 μΙ of the 25 μΙ PCR approaches were used in the dPCR, which is why the values were multiplied by BBPA for comparison.
Poisson Poisson Poisson Poisson
AkzepFraktFraktFrakt¬AkzepFraktFraktFrakt¬
Κορϊεη/20μ_ Chl+ Chl+ Chl- Chl- tierte ionale Κορϊεη / 20μ_ Chl + Chl + Chl- chlorinated ionic
Probe 1:25 Positive Negative ionale ionale Sample 1:25 Positive Negative ionic ionale
Well Ch2+ Ch2- Ch2+ Ch2- TröpHäufigHäufigHäufigfchen keit Well Ch2 + Ch2- Ch2 + Ch2-TröpFreedomFrequentlyfrequency
keit Min keit Max Min. speed Max
BA (Ox) BA (Ox)
12 12 5 9728 1 4 567 9161 9733 0,8 0,1 1,6 methyl. 12 12 5 9728 1 4 567 9161 9733 0.8 0.1 1.6 methyl.
BA (Ox) BA (Ox)
1420 1420 568 9165 1420 1420 568 9165
unmeth. unmeth.
PatP (Ox) PatP (Ox)
40 40 19 11241 4 15 907 10334 11260 2 1.1 2.8 methyl. 40 40 19 11241 4 15 907 10334 11260 2 1.1 2.8 methyl.
PatP PATP
(Ox) 1980 1980 911 10349 (Ox) 1980 1980 911 10349
unmeth. unmeth.
BA 8x BA 8x
2,2 55 1 11053 1 0 20 11033 11054 5 0 15 methyl. 2.2 55 1 11053 1 0 20 11033 11054 5 0 15 methyl.
BA 8x BA 8x
44 1100 21 11033 44 1100 21 11033
unmeth. unmeth.
PatP 8x PatP 8x
22 550 8 8730 2 6 36 8694 8738 17 6 29 methyl. 22 550 8 8730 2 6 36 8694 8738 17 6 29 methyl.
PatP 8x PatP 8x
102 2550 38 8700 102 2550 38 8700
unmeth. unmeth.
BA 12x BA 12x
7 175 3 10206 3 0 43 10163 10209 6 0 13 methyl. 7 175 3 10206 3 0 43 10163 10209 6 0 13 methyl.
BA 12x BA 12x
106 2650 46 10163 106 2650 46 10163
unmeth. unmeth.
PatP 12x PatP 12x
150 3750 63 9832 0 63 58 9774 9895 52 43 61 methyl. 150 3750 63 9832 0 63 58 9774 9895 52 43 61 methyl.
PatP PATP
12x 138 3450 58 9837 12x 138 3450 58 9837
unmeth. unmeth.
BA 6x BA 6x
8,4 210 4 11236 2 2 1014 10222 11240 0,37 0 0,76 methyl. 8.4 210 4 11236 2 2 1014 10222 11240 0.37 0 0.76 methyl.
BA 16x BA 16x
2220 55500 1016 10224 2220 55500 1016 10224
unmeth. unmeth.
PatP 16x PatP 16x
1544 38600 755 11125 8 747 144 10981 11880 83,6 81,2 86 methyl. 1544 38600 755 11125 8 747 144 10981 11880 83.6 81.2 86 methyl.
PatP PATP
16x 302 7550 152 11728 16x 302 7550 152 11728
unmeth. unmeth.
BA 40x BA 40x
30 750 16 12592 6 10 4345 8247 12608 0,3 0,15 0,45 methyl. 30 750 16 12592 6 10 4345 8247 12608 0.3 0.15 0.45 methyl.
BA 40 BA 40
9960 249000 4351 8257 9960 249000 4351 8257
unmeth. unmeth.
PatP 40x PatP 40x
46580 1164500 9298 1490 1665 7633 198 1292 10788 91,26 90,85 91,67 methyl. 46580 1164500 9298 1490 1665 7633 198 1292 10788 91.26 90.85 91.67 methyl.
PatP PATP
40x 4460 111500 1863 8925 40x 4460 111500 1863 8925
unmeth.
Dieses ungewöhnliche Verhalten wurde auch deutlich, wenn die Annealingtemperatur mit 60,0°C konstant gehalten und die Vervielfältigung in Abhängigkeit von der Zyklenanzahl analysiert wurde. Auch hier stiegt die methylierte gegenüber der nicht-methylierten Fraktion in den fc-DNA-Proben Tumorerkrankter bereits nach 16 Zyklen und weiter nach 40 Zyklen stark an (Fig. 3 und 4). Im Gegensatz dazu kam es zu einem deutlich starken Anstieg der nicht-methylierten DNA-Fraktion bei gesunden Probandinnen, während der Anteil der methylierten DNA nur geringfügig anstieg (Fig. 3 und 4, Tabelle 3). Ohne BBPA betrug der Methylierungsgrad (fraktionale Häufigkeit) 0,8 % (Poisson-Wahrscheinlichkeitsbereich: 0,1 - 1 ,6%) bei gesunden Probandinnen und 2,0 % (Poisson-Wahrscheinlichkeitsbereich: 1 ,1 - 2,8%) bei Patientinnen mit Mammakarzinom (Tab. 3). unmeth. This unusual behavior was also evident when the annealing temperature was kept constant at 60.0 ° C and the duplication was analyzed as a function of the number of cycles. Here, too, the methylated versus the non-methylated fraction in the fc DNA samples tumorous disease rises sharply already after 16 cycles and further after 40 cycles (FIGS. 3 and 4). In contrast, there was a marked increase in the non-methylated DNA fraction in healthy volunteers, while the proportion of methylated DNA increased only slightly (FIGS. 3 and 4, Table 3). Without BBPA, the degree of methylation (fractional frequency) was 0.8% (Poisson probability range: 0.1 - 1, 6%) in healthy subjects and 2.0% (Poisson probability range: 1, 1 - 2.8%) Patients with breast cancer (Table 3).
Wie dieses Phänomen zu erklären ist, kann noch nicht vollständig beantwortet werden. Es erklärt zunächst die Beobachtung, dass mit steigender PCR-Zyklusanzahl der ermittelte fraktionale Methylierungsgrad des RASSF1A-Gens (Verhältnis zwischen methylierten und nicht-methylierten DNA-Fragmenten in Beziehung zur Gesamtmenge der methylierten und nicht-methylierten DNA-Fragmenten) in der fc-DNA-Probe Gesunder sich in Richtung 0 % verschiebt, während der Methylierungsgrad in der fc-DNA-Probe Mammakarzinomerkrankter in Richtung 100 % ansteigt. How this phenomenon can be explained can not yet be fully answered. It first explains the observation that as the number of PCR cycles increases, the fractional degree of methylation of the RASSF1A gene (ratio between methylated and unmethylated DNA fragments relative to the total amount of methylated and unmethylated DNA fragments) in the fc DNA is determined Sample Healthy moves towards 0%, while the degree of methylation in the fc DNA sample of breast cancer patients increases towards 100%.
Auf diese Weise kann anhand der Methylierungsbestimmung z. B. des RASSF1A-Gens eine stringente Unterscheidung zwischen Gesund und Krank erreicht werden, was mit Hilfe der dPCR allein oder der MS-HRM nicht möglich ist. So ließen sich in den gleichen Serumpoolproben mit der alleinigen dPCR fraktionale Methylierungsgrade des RASSF1A- Gens von 0,5 % (Poisson-Wahrscheinlichkeitsbereich: 0,05-0,99 %) bei gesunden Probandinnen und 1 ,00 % (Poisson-Wahrscheinlichkeitsbereich: 0-2,00 %) bei Patientinnen mit Mammakarzinom finden (Fig. 5), d.h. sie waren nicht statistisch signifikant unterscheidbar. In this way, based on the methylation determination z. As the RASSF1A gene a stringent distinction between health and disease can be achieved, which is not possible with the help of dPCR alone or the MS-HRM. Fractional methylation levels of the RASSF1A gene of 0.5% (Poisson probability range: 0.05-0.99%) were found in healthy volunteers and in the same serum pool samples with the dPCR alone (Poisson probability range: 0 -2.00%) in patients with breast cancer (Fig. 5), ie they were not statistically significantly differentiable.
Auch zeigten sich bei den gleichen Poolproben keine signifikanten Unterschiede in den Schmelzkurveneigenschaften durch die MS-HRM-Analyse zwischen gesunden Probandinnen und Patientinnen mit Mammakarzinom (Fig. 6).
Ausführungsbeispiel 2: Ergebnisse der BBPA-dPCR anhand der Methylierung von RASSF1 in Serumpoolproben von Prostatakarzinompatienten im Vergleich zu gesunden Probanden Also, in the same pool samples, there were no significant differences in the melting curve characteristics by the MS-HRM analysis between healthy female patients with breast cancer (Figure 6). Exemplary Embodiment 2 Results of the BBPA-dPCR Based on the Methylation of RASSF1 in Serum Pool Samples of Prostate Cancer Patients in Comparison to Healthy Subjects
Das zunächst an Mammakarzinom-Patientinnen beobachtete Phänomen, dass bei einer selektiven Annealingtemparatur und steigender Zyklenanzahl, d. h. steigenden prä- amplifizierten Kopienzahlen die Werte für die RASSFIA-Methylierung zwischen Gesund und Krank zunehmend auseinanderweichen, zeigte sich auch an Serumpoolproben von Patienten mit Prostatakarzinom im Vergleich zu gesunden Probanden (Tabellen 4 und 5). So ließ sich hier ebenfalls ein starker Unterschied zwischen gesunden Probanden und Prostatakarzinompatienten finden, wenn die Prä-Amplifiaktion mit 59°C im Vergleich zu 52°C durchgeführt wurde und nach 50 Zyklen unterschiedliche Mengen der prä-amplifizierten DNA-Kopien (z.B. 1 :107 verdünnt im Vergleich zu Verdünnung von 1 :105, d.h. 100-fach weniger verdünnt), in der dPCR analysiert wurden (Tabelle 4). Das zeigte sich auch bei konstanter Annealingtemperatur von 59°C und der Durchführung von 35 oder 50 Zyklen in der Prä-Amplifikation (Tabelle 5). The phenomenon initially observed in breast cancer patients, that with a selective annealing cycle and increasing number of cycles, ie increasing pre-amplified copy numbers, the values for RASSFIA methylation between healthy and sick increasingly diverge, was also found in serum pool samples from patients with prostate cancer compared to healthy volunteers (Tables 4 and 5). Thus, a strong difference between healthy volunteers and prostate cancer patients could also be found here if the pre-amplification was carried out at 59 ° C. compared to 52 ° C. and after 50 cycles different amounts of the pre-amplified DNA copies (eg 1:10) 7 diluted compared to dilution of 1: 10 5 , ie, diluted 100-fold less) in which dPCR was analyzed (Table 4). This was also evident at constant annealing temperature of 59 ° C and performing 35 or 50 cycles in pre-amplification (Table 5).
Tabelle 4: Relative Häufigkeit methylierter RASSFIA-Seq Uenzen in fc-DNA-Proben aus einem Serum-Pool von gesunden Probanden (BA) und an Prostatakarzinom erkrankten Patienten (Pat) nach BBPA (50 Zyklen bei 52°C bzw. 59°C) in Abhängigkeit der in der dPCR eingesetzten DNA-Menge (Verdünnungen von 1 :107, 1 : 106 und 1 :105). Table 4: Relative frequency of methylated RASSFIA sequences in fc DNA samples from a serum pool of healthy volunteers (BA) and prostate cancer patients (Pat) after BBPA (50 cycles at 52 ° C and 59 ° C, respectively). depending on the amount of DNA used in the dPCR (dilutions of 1: 10 7 , 1: 10 6 and 1: 10 5 ).
BBPA BA Pat BBPA BA Pat
50 Zyklen bei 52°C und Verdünnung von 1 :107 2,52 % 9,52 %50 cycles at 52 ° C and dilution of 1: 10 7 2.52% 9.52%
50 Zyklen bei 59°C und Verdünnung von 1 :107 0,91 % 81 ,9 %50 cycles at 59 ° C and dilution of 1: 10 7 0.91% 81, 9%
50 Zyklen bei 52°C und Verdünnung von 1 :106 0,153 % 9,73 %50 cycles at 52 ° C and dilution of 1: 10 6 0.153% 9.73%
50 Zyklen bei 59°C und Verdünnung von 1 :106 0,067 % 96,26 %50 cycles at 59 ° C and dilution of 1: 10 6 0.067% 96.26%
50 Zyklen bei 52°C und Verdünnung von 1 :105 0 % 1 1 ,6 %50 cycles at 52 ° C and dilution of 1: 10 5 0% 1 1, 6%
50 Zyklen bei 59°C und Verdünnung von 1 :105 0,006 % 99,09 %
Tabelle 5: Relative Häufigkeit methylierter RASSF1 A-Seq Uenzen in fc-DNA-Proben aus einem Serum-Pool von gesunden Probanden (BA) und an Prostatakarzinom erkrankten Patienten (Pat) nach BBPA (35 bzw. 50 Zyklen bei 59°C) in Abhängigkeit der in der dPCR eingesetzten DNA-Menge (Verdünnungen von 1 : 107 bis 103). 50 cycles at 59 ° C and dilution of 1: 10 5 0.006% 99.09% Table 5: Relative frequency of methylated RASSF1 A sequences in fc DNA samples from a serum pool of healthy volunteers (BA) and prostate cancer patients (Pat) after BBPA (35 and 50 cycles at 59 ° C, respectively) in Dependence of the amount of DNA used in the dPCR (dilutions of 1: 10 7 to 10 3 ).
BBPA BA Pat BBPA BA Pat
35 Zyklen bei 59°C und Verdünnung von 1 : 107 4,7 % 65,7 %35 cycles at 59 ° C and dilution of 1: 10 7 4.7% 65.7%
50 Zyklen bei 59°C und Verdünnung von 1 : 107 0,42 % 79,8 %50 cycles at 59 ° C and dilution of 1: 10 7 0.42% 79.8%
35 Zyklen bei 59°C und Verdünnung von 1 : 106 2,7 % 65,6 %35 cycles at 59 ° C and dilution of 1:10 6 2.7% 65.6%
50 Zyklen bei 59°C und Verdünnung von 1 : 106 0,01 1 % 92,0 %50 cycles at 59 ° C and dilution of 1: 10 6 0.01 1% 92.0%
35 Zyklen bei 59°C und Verdünnung von 1 : 105 1 ,1 % 75,2 %35 cycles at 59 ° C and dilution of 1: 10 5 1, 1% 75.2%
50 Zyklen bei 59°C und Verdünnung von 1 : 105 0,006 % 96,5 %50 cycles at 59 ° C and dilution of 1: 10 5 0.006% 96.5%
35 Zyklen bei 59°C und Verdünnung von 1 : 104 0,01 % 70,2 %35 cycles at 59 ° C and dilution of 1: 10 4 0.01% 70.2%
50 Zyklen bei 59°C und Verdünnung von 1 : 104 0 % 98,5 %50 cycles at 59 ° C and dilution of 1: 10 4 0% 98.5%
35 Zyklen bei 59°C und Verdünnung von 1 : 103 0 % 75,5 %35 cycles at 59 ° C and dilution of 1: 10 3 0% 75.5%
50 Zyklen bei 59°C und Verdünnung von 1 : 103 0,004 % 96,3 %
50 cycles at 59 ° C and dilution of 1: 10 3 0.004% 96.3%
Tabelle 6: Absolute Kopienanzahl methylierter (methyl) und nicht-methylierter (unmethyl)
in fc-DNA-Proben aus einem Serum-Pool von gesunden Probanden (BA) und an Prostatakarzinom erkrankten Patienten (PatP) nach BBPA (50 Zyklen bei 59°C, unverdünnt [unv]). Die nach entsprechenden Verdünnungen (1 : 103, 1 :104, 1 :105, 1 :106 und 1 :107) resultierenden und in der dPCR eingesetzten Anzahl an DNA-Kopien sind aufgezeigt. Daraus ließen sich die KPKs entsprechend der Formel: KPK (Kopien pro Kompartiment) = Kopien/Kompatimentanzahl für die Untersuchungen, die in Tabelle 4 und 5 dargestellt sind und bei denen eine durchschnittliche Tröpfchenanzahl von 12000 vorlag, für die Proben der gesunden Probanden (BA KPK) und an Prostatakarzinomen erkrankten Patienten (PatP KPK) berechnen. Table 6: Absolute copy number of methylated (methyl) and unmethylated (unmethyl) in fc DNA samples from a serum pool of healthy volunteers (BA) and prostate cancer patients (PatP) after BBPA (50 cycles at 59 ° C, undiluted [unv]). The number of DNA copies resulting from corresponding dilutions (1: 10 3 , 1: 10 4 , 1: 10 5 , 1: 10 6 and 1: 10 7 ) and used in the dPCR are shown. From this, the KPKs could be expressed according to the formula: KPK (Copies Per Compartment) = Copies / Comp. Number for the assays shown in Tables 4 and 5, with an average droplet count of 12,000 for the samples of the healthy volunteers (BA KPK ) and prostate cancer patients (PatP KPK).
Für die dPCR wird nach dem Stand der Technik ein KPK-Wert (engl. CPD - copies per droplets) von maximal 8 angegeben, damit die Poisson-Verteilung und die damit verbundene Statistik gelten [9]. Die hier vorgestellten Daten zeigen jedoch, dass bei einem KPK-Wert >8 die Unterscheidung zwischen Gesund und Krank sich noch stringenter verhält. Ein KPK von 8 bedeutet, dass maximal 80.000 DNA-Kopien in einer dPCR mit 10.000 Kompartimente (z. B. Öl-Emulsionströpfchen oder sogenannte Nano-Kammern auf einem festen Träger) eingesetzt werden. Nach 35 bzw. 50 Amplifikationszyklen kommt es theoretisch zu einer 3,43 x 10¹⁰ bzw. 1 ,12 x 1015-fachen Vervielfältigung der Ausgangs-DNA-Kopien, wird eine Effizienz der PCR von 100 % zugrunde gelegt. In dem dargestellten Beispiel resultierten nach 50 Zyklen 1 ,828 x 1011 methylierte und 4,98 x 10¹⁰ nicht-methylierte RASSF1A-DNA- Fragmentkopien in den Proben von Patienten mit Prostatakarzinom und 2,4 x 10⁸ methylierte und 6,7 x 10¹⁰ nicht-methylierte RASSF1A-DNA-Fragmentkopien in den Proben der
gesunden Probanden (Tabelle 6). Wird z.B. der Ansatz mit der stärksten Trennung (Stringenz) selektiert, d. h. 50 Zyklen bei 59°C und einer Verdünnung von 1 :104, bei der für Gesund (BA) eine 0 %-ige und Krank (PatP) eine 98,5 %-ige RASSFIA-Methylierung resultierte, betrugen die KPK-Werte für die BA-Probe 560 und PatP-Probe 1938 (Tabelle 6). According to the state of the art, a KPK value (CPD) of maximum 8 is specified for the dPCR, so that the Poisson distribution and the associated statistics apply [9]. However, the data presented here show that with a KPK value> 8, the distinction between healthy and sick is even more stringent. A KPK of 8 means that a maximum of 80,000 DNA copies are used in a dPCR with 10,000 compartments (eg oil emulsion droplets or so-called nano-chambers on a solid support). After 35 or 50 cycles of amplification, it is theoretically a 3.43 x 10 10 or 1, 12 x 10 15- fold duplication of the starting DNA copies, an efficiency of 100% PCR is used. In the example shown, after 50 cycles, 1.288 x 10 11 methylated and 4.98 x 10 10 unmethylated RASSF1A DNA fragment copies resulted in the samples from patients with prostate carcinoma and 2.4 x 10 8 methylated and 6.7 x 10 10 non-methylated RASSF1A DNA fragment copies in the samples of healthy volunteers (Table 6). If, for example, the mixture with the strongest separation (stringency) is selected, ie 50 cycles at 59 ° C and a dilution of 1: 10 4 , for healthy (BA) a 0% and sick (PatP) a 98.5 % RASSFIA methylation resulted in KPK values for BA sample 560 and PatP sample 1938 (Table 6).
Auf Grundlage dieser hohen Stringenz gestattet die BBA-dPCR im Prinzip eine Ja/Nein- Antwort auf die Frage, ob eine Tumor-spezifische DNA in der zu untersuchenden Probe (Liquid Biopsy) und damit eine Tumorerkrankung vorliegt. Mit Hilfe der variablen Stellgröße in Form der Zyklenanzahl, ohne dass dabei unspezifische Signale mit amplifiziert und dadurch verstärkt werden, ist der Nachweis nur eines einzelnen Tumor-DNA-Moleküls spezifisch vor einem großen Hintergrund normaler DNA in einer zu untersuchenden Probe möglich. Solch ein sensitiver und vor allem spezifischer Nachweis ist mit alleiniger dPCR nicht möglich. On the basis of this high stringency, the BBA-dPCR in principle allows a yes / no answer to the question of whether a tumor-specific DNA is present in the sample to be examined (liquid biopsy) and thus a tumor disease. With the aid of the variable manipulated variable in the form of the number of cycles without amplifying and thereby amplifying non-specific signals, it is possible to detect only a single tumor DNA molecule specifically against a large background of normal DNA in a sample to be examined. Such a sensitive and, above all, specific detection is not possible with sole dPCR.
Ausführungsbeispiel 3: Ergebnisse der BBPA-dPCR anhand der Methylierung von RASSF1 in Einzelserumproben von Mammakarzinompatientinnen - Vergleich mit dPCR allein und MS-HRM Exemplary Embodiment 3 Results of the BBPA-dPCR Based on the Methylation of RASSF1 in Single Serum Samples of Breast Cancer Patients - Comparison with dPCR alone and MS-HRM
In jeweils 10 Serumproben von gesunden Probandinnen ohne Tumorerkrankung und 10 Patientinnen mit Mamma-Karzinomen zeigte sich in der RASSF A-Methylierungsanalyse, dass mit der alleinigen dPCR nur 4 Patientinnen (P2, P3, P8 und P19) als richtig positiv identifiziert wurden (Fig. 7, Tabelle 7), während anhand der RASSF A-Methylierungsanalyse durch die erfindungsgemäße BBPA-dPCR 8 der 10 Patientinnen mit Mamma-CA (P1 -P4, P6- P8 und P10) richtig zugeordnet wurden (Fig. 8, Tabelle 7). In each of 10 serum samples from healthy subjects without tumor disease and 10 patients with breast carcinomas, the RASSF A methylation analysis revealed that only 4 patients (P2, P3, P8 and P19) were identified as being positively positive with the dPCR alone (FIG. 7, Table 7), while 10 of the 10 patients with mammalian CA (P1 -P4, P6-P8 and P10) were correctly assigned by the RASSF A methylation analysis by the BBPA-dPCR 8 according to the invention (FIG. 8, Table 7).
In einer parallel durchgeführten MS-HRM-Analyse an den identischen fc-DNA-Proben zeigte sich in einer Probe der Gruppe der gesunden Probandinnen eine deutlich erhöhte R/ASSF7/A-Methylierung (Fig 9C und 9D, Proben-ID K9, Tabelle 7) und in einer weiteren Probe eine gering erhöhte R/ASSF 7>A-Methylierung (Fig. 9C, Proben-ID K8, Tabelle 7). Im Gegensatz dazu ließ sich in einer Probe (P1 ) aus der Gruppe der Mammakarzinompatientinnen kein positiver R>ASSF7-Befund mit Hilfe der MS-HRM-Analyse finden (Fig. 9F), obwohl sich in der BBPA-dPCR-Analyse eine deutlich erhöhte RASSFIA-Methylierung in dieser Probe zeigte (Fig. 8 und Tabelle 7).
Tabelle 7: Übersicht über die Methylierungsgrade von RASSF1A im Serum von gesunden Probandinnen (K1 -K10) und Patentinnen mit Mamma-Karzinom (P1 -P10), die mit Hilfe der dPCR allein, der MS-HRM- und der BBPA-dPCR-Technik erzielt wurden (dick geschrieben: Methylierungswerte >9 % als ct/i-off-Wert im Fall der dPCR allein und >0,460 % im Fall der BBPA-dPCR-Analyse; eine semi-quantitative Auswertung erfolgte in der MS-HRM-Analyse) In a parallel MS-HRM analysis on the identical fc-DNA samples, a significantly higher R / ASSF7 / A methylation was found in one sample of the group of healthy volunteers (FIGS. 9C and 9D, sample ID K9, Table 7) ) and in another sample a small increase in R / ASSF 7> A methylation (Figure 9C, Sample ID K8, Table 7). In contrast, in a sample (P1) from the group of breast carcinoma patients no positive R> ASSF7 finding was found by means of MS-HRM analysis (FIG. 9F), although in the BBPA-dPCR analysis a markedly increased RASFIA methylation in this sample showed (Figure 8 and Table 7). Table 7: Overview of the methylation levels of RASSF1A in the serum of healthy subjects (K1-K10) and breast cancer patients (P1-P10), using the dPCR alone, the MS-HRM and the BBPA-dPCR technique methylated values> 9% as ct / i-off in the case of dPCR alone and> 0.460% in BBPA-dPCR analysis, semi-quantitative evaluation in MS-HRM analysis)
Im Ergebnis wurden bei der MS-HRM-Analyse 2 von 10 Proben der Gruppe der gesunden Probandinnen als falsch pathologisch eingestuft, was bei der BBPA-dPCR nicht der Fall war (Tabelle 7). Bei der MS-HRM allein betrug damit die diagnostische Sensitivität (d. h. Kranke richtig diagnostiziert) 70 % und die diagnostische Spezifität (d. h. Gesunde richtig diagnostiziert) 80 %. Bei der dPCR allein betrug die diagnostische Sensitivität 40 % und die diagnostische Spezifität 100 %, wenn ein Grenzwert für die RASSF A-Methylierung von
< 9,1 % für Gesund zugrunde gelegt wurde. Bei der BBPA-dPCR betrug die diagnostische Sensitivität 80 % und die diagnostische Spezifität 100 %, wenn ein Grenzwert für die RASSF A-Methylierung von < 0,460 % für Gesund zugrunde gelegt wurde. Für einen frühzeitigen Nachweis einer Tumorerkrankung (Screening bzw. Vorsorge) sind eine diagnostische Sensitivität und Spezifität nahe 100 % erforderlich, um falsch positive (Gesunde irrtümlicherweise als Krank diagnostiziert) und falsch negative Werte (Kranke als solche nicht erkannt) auszuschließen. As a result, in MS-HRM analysis, 2 out of 10 samples from the group of healthy volunteers were considered to be false pathology, which was not the case with BBPA-dPCR (Table 7). In MS-HRM alone, the diagnostic sensitivity (ie correctly diagnosed patients) was 70% and the diagnostic specificity (ie the correctly diagnosed healthy) 80%. For the dPCR alone, the diagnostic sensitivity was 40% and the diagnostic specificity 100%, if a threshold for the RASSF A methylation of <9.1% was used as the basis for health. For the BBPA-dPCR, the diagnostic sensitivity was 80% and the diagnostic specificity was 100%, when a threshold for RASSF A methylation of <0.460% for healthy people was used. For an early detection of a tumor disease (screening), a diagnostic sensitivity and specificity near 100% are required to rule out false positives (healthy erroneously diagnosed as ill) and false negatives (not diagnosing the patient as such).
Bei der BBPA-dPCR kann wie nachfolgend in weiteren Beispielen gezeigt wird, die diagnostische Sensitivität durch Kombination mehrerer Kandidatengene in der Methylierungsuntersuchung erhöht werden. Auch kann durch Einsatz von 5 ml anstelle von 1 ml Serum, wie es hier der Fall war, die diagnostische Sensititvität erhöht werden. Weiterhin kann durch einen multiplexen Einsatz von Primern in der BBPA die diagnostische Sensititvität erhöht werden, in dem auf diese Weise die gesamte isolierte DNA für die Analytik der einzelnen Genkandidaten in der anschließenden dPCR zur Verfügung steht. In the BBPA-dPCR, as further examples show, the diagnostic sensitivity can be increased by combining several candidate genes in the methylation study. Also, by using 5 ml instead of 1 ml of serum, as was the case here, the diagnostic sensitivity can be increased. Furthermore, a multiplexed use of primers in the BBPA can increase the diagnostic sensitivity by thus making available the entire isolated DNA for the analysis of the individual gene candidates in the subsequent dPCR.
Auch kann - wie in dem Ausführungsbeispiel 12 gezeigt wird - die diagnostische Sensitivität des Verfahrens erhöht werden, indem mehrere Primerpaare für ein und dasselbe Gen in der Prä-Amplifikation eingesetzt werden, die die Sequenzen einschließen, die durch die Sonden in der dPCR detektiert werden. Also, as shown in embodiment 12, the diagnostic sensitivity of the method can be increased by using multiple primer pairs for one and the same gene in the pre-amplification, including the sequences detected by the probes in the dPCR.
Ausführungsbeispiel 4: Ergebnisse der BBPA-dPCR anhand der PLA2R1-, RASSF1A-, GSTP1- und ΛΟ ί-Methylierungen in Serum von Prostatakarzinompatienten Exemplary Embodiment 4 Results of the BBPA-dPCR Based on the PLA2R1, RASSF1A, GSTP1 and ΛΟ ί Methylations in Serum of Prostate Cancer Patients
In einer weiteren Untersuchung an einer Gruppe von 19 Patienten mit Prostata-Karzinom (PCa) und einer Vergleichsgruppe von 20 Probanden ohne Tumorerkrankungen zeigte sich, dass mit Hilfe der BBPA-dPCR die Bestimmung der PLA2R1- (unter Einsatz des Primerpaares SEQ ID No. 1 und 2, Sondenpaares SEQ ID No. 20 und 21 ), RASSF1A- (Primerpaar SEQ ID No. 3 und 4, Sondenpaar SEQ ID No. 24 und 25), GSTP1- (Primerpaar SEQ ID No. 5 und 6, Sondenpaar SEQ ID No. 56 und 57) und AOX1- (Primerpaar SEQ ID No. 14 und 15, Sondenpaar SEQ ID No. 37 und 38) Methylierungen in 18 der 19 Patienten zu erhöhten Werten für mindestens eines der untersuchten Gene im Vergleich zu den gesunden Probanden nachweisbar war (Fig. 10-12, Tabelle 8). In a further study on a group of 19 patients with prostate carcinoma (PCa) and a comparison group of 20 subjects without tumor diseases, it was found that the determination of the PLA2R1 (with the use of the primer pair SEQ ID No. 1) was determined with the aid of BBPA-dPCR and 2, probe pair SEQ ID No. 20 and 21), RASSF1A- (primer pair SEQ ID No. 3 and 4, probe pair SEQ ID No. 24 and 25), GSTP1- (primer pair SEQ ID No. 5 and 6, probe pair SEQ ID No. 56 and 57) and AOX1 (primer pair SEQ ID Nos. 14 and 15, probe pair SEQ ID Nos. 37 and 38) detectable methylation in 18 of the 19 patients at elevated levels for at least one of the tested genes compared to healthy subjects was (Figures 10-12, Table 8).
Bei diesen Untersuchungen zeigte sich in der 2-D-Auswertung eine distinkte Population von Tröpfchen, die doppelt markiert (FAM- und HEX-positiv) waren und die sich deutlich von denen der nicht-methylierten fc-DNA (nur HEX-positiv) unterschieden, wenn die BBPA mit
einer entsprechend hohen Zyklenanzahl durchgeführt und die resultierenden Amplifikate weniger verdünnt in der dPCR analysiert wurden (Fig. 13). Für die kombinierten BBPA- dPCR-basierten Untersuchungen der PLA2R1 -, RASSF1A-, GSTP-1 und AOX1 -Zielgene ergab sich eine diagnostische Sensitivität von 95 % und eine diagnostische Spezifität von 100 %. Die ROC-Analyse zeigten für die PLA2R7-Methylierung ein AUC-Wert von 0,718, für RASSF1A ein Wert von 0,692 und GSTP1 ein Wert von 0,976. Wurden die 3 Biomarker kombiniert, betrug der AUC-Wert 0,982 für die Unterscheidung zwischen Patienten mit PCa im Vergleich zu Gesunden anhand der Serumuntersuchungen (Fig. 14). In these studies, the 2-D analysis showed a distinct population of droplets that were doubly labeled (FAM- and HEX-positive) and that differed markedly from those of non-methylated fc-DNA (HEX-positive only) when the BBPA with a correspondingly high number of cycles were carried out and the resulting amplified products were analyzed less diluted in the dPCR (FIG. 13). The combined BBPA-dPCR-based studies of the PLA2R1, RASSF1A, GSTP-1 and AOX1 target genes revealed a diagnostic sensitivity of 95% and a diagnostic specificity of 100%. The ROC analysis showed an AUC value of 0.718 for PLA2R7 methylation, a value of 0.692 for RASSF1A, and a value of 0.976 for GSTP1. When the 3 biomarkers were combined, the AUC value was 0.982 for the discrimination between patients with PCa compared to healthy subjects from the serum studies (Figure 14).
Tabelle 8: Übersicht über die Bestimmungen der Methylierungsgrade der PLA2R1-, RASSF1A-, GSTP1- und AOX1-Gene mit Hilfe der BBPA-dPCR-Analysen in % in fc-DNA- Proben aus Serum von gesunden Probanden (K1 -20) und Patienten mit PCa (P1 -19) und der PSA-Konzentrationen (ng/ml); (fett gedruckt: Werte > 2,0 % im Fall des PLA2R1-; > 0,1 % im Fall des RASSF1A-; > 2,1 % im Fall des GSTP1- und > 1 ,0 % des AOX1 -Gens). Table 8: Overview of the methylation levels of the PLA2R1, RASSF1A, GSTP1 and AOX1 genes using the% BBPA dPCR analyzes in serum from healthy volunteers (K1-20) and patients in fc DNA samples with PCa (P1 -19) and PSA concentrations (ng / ml); (in bold: values> 2.0% in the case of PLA2R1;> 0.1% in the case of RASSF1A;> 2.1% in the case of GSTP1 and> 1.0% of the AOX1 gene).
RASSF1A in RASSF1A in
ID PSA/ ng/ml PLA2R1 in % % GSTP1 in % AOX1 in % ID PSA / ng / ml PLA2R1 in%% GSTP1 in% AOX1 in%
K1 0,080 0,076 0,007 0 K1 0.080 0.076 0.007 0
K2 0 0 0,003 0 K2 0 0 0.003 0
K3 0, 120 0 0,0026 0,006 K3 0, 120 0 0.0026 0.006
K4 0 0 0,021 0 K4 0 0 0,021 0
K5 0, 130 0,0027 0,007 0,018 K5 0, 130 0.0027 0.007 0.018
K6 0,090 0,006 0,0029 0,039 K6 0.090 0.006 0.0029 0.039
K7 0,070 0 0,018 0, 138 K7 0.070 0 0.018 0.138
K8 0, 150 0 2,05 1 , 1 K8 0, 150 0 2.05 1, 1
K9 0,027 0 0,0029 0 K9 0.027 0 0.0029 0
K10 0 0,002 0,0026 0 K10 0 0.002 0.0026 0
K1 1 0 0 0 0,017 K1 1 0 0 0 0.017
K12 1 ,970 0,003 0 0 K12 1, 970 0.003 0 0
K13 1 ,250 0,003 0,009 0 K13 1, 250 0.003 0.009 0
K14 0,008 0 0,0014 0 K14 0.008 0 0.0014 0
K15 0 0 0,004 0,034 K15 0 0 0.004 0.034
K16 0,01 1 0 0 0,02 K16 0.01 1 0 0 0.02
K17 0 0 0,0025 0 K17 0 0 0.0025 0
K18 0,270 0 0,007 0 K18 0.270 0 0.007 0
K19 0,910 0 0 0 K19 0,910 0 0 0
K20 0,074 0 0,009 0 K20 0.074 0 0.009 0
P1 52,49 31,400 100 43,9 0 P1 52.49 31.400 100 43.9 0
P2 37,48 0,047 57,3 5,58 0 P2 37.48 0.047 57.3 5.58 0
P3 73,66 0 53,6 19,2 0 P3 73.66 0 53.6 19.2 0
P4 86,31 2,130 47,9 19,7 55,7 P4 86.31 2.130 47.9 19.7 55.7
P5 33,63 0,015 40,5 0,28 0 P5 33.63 0.015 40.5 0.28 0
P6 75,53 12,800 0,8 84,5 93,3 P6 75.53 12.800 0.8 84.5 93.3
P7 79,68 0,360 45,5 2,82 0,018 P7 79.68 0.360 45.5 2.82 0.018
P8 23,84 0,089 0 0, 129 0,05 P8 23.84 0.089 0 0, 129 0.05
P9 28,51 0,0022 46,9 0, 1 18 0 P9 28.51 0.0022 46.9 0, 1 18 0
P10 37,98 0,0024 0 5,11 0,22 P10 37.98 0.0024 0 5.11 0.22
P1 1 26,78 5,560 0 0, 166 0, 14
P12 I 20,74 3,690 0 0,048 0 P1 1 26.78 5.560 0 0, 166 0, 14 P12 I 20,74 3,690 0 0,048 0
P13 I 24,96 2,360 0 0, 131 0 P13 I 24.96 2.360 0 0, 131 0
P14 I 18,65 0,290 0 6,83 66,2 P14 I 18.65 0.290 0 6.83 66.2
P15 I 77,99 0,087 0 70,2 99,8 P15 I 77.99 0.087 0 70.2 99.8
P16 I 25,63 4,450 52,1 0,01 1 0 P16 I 25.63 4,450 52.1 0.01 1 0
P17 I 38,26 3,770 0 60,2 90,01 P17 I 38.26 3.770 0 60.2 90.01
P18 I 59,93 20,30 0 56,5 91,95 P18 I 59.93 20,30 0 56,5 91,95
P19 I 54,74 0 29,4 5,83 46,1 P19 I 54.74 0 29.4 5.83 46.1
Neben den hohen AUC-Werten wies die BBPA-dPCR geringe Intra- und Interassay- Variationskoeffizienten (VK) von 3-10 % aus, die deutlich unterhalb der mittels MS-HRM- Analysen erzielten VK lagen, die insbesondere im Methylierungsbereich von 1 -3 % Werte von 50-100 % erreichten. Darüber hinaus wurden mit der BBPA-dPCR eine analytische Sensitivität von < 0,003 % erzielt, obwohl für diese Untersuchungen nur 1 ml Serum zur Verfügung standen. Auch standen nur Serumproben und keine Plasmaproben hierfür zur Verfügung. Letztere werden bevorzugt für die Untersuchung von fc-DNA genutzt, da auf Grund der eintretenden Gerinnung bei Serumproben mit einer starken Freisetzung von DNA aus Blutleukozyten und deshalb mit einer hohen Hintergrundskonzentration nicht- methylierter DNA zu rechnen ist. Die Ergebnisse zeigten, dass bei Nutzung der BBPA-dPCR selbst bei einem hohen Hintergrund von normaler DNA sehr sensitiv fc-Tumor-DNA nachgewiesen werden kann. Ferner wurden die Serumproben prä-analytisch nicht gesondert behandelt, wozu ein schnelles Abzentrifugieren des Serums und anschließendes Einfrieren bis zur fc-DNA-lsolierung zählt. Im Vergleich dazu betrug die Sensitivität der MS-HRM- Technik in eigenen Untersuchungen maximal 1 %. Ein Grund für den negativen Befund (bei der BBPA-dPCR-Untersuchung) in der Patientenprobe P8 (Tab. 8) könnte in einer zu geringen Serummenge (1 ml) begründet sein, so dass möglicherweise keine methylierte DNA-Kopie in der untersuchten Probe vorlag. In addition to the high AUC values, the BBPA-dPCR had low intra- and inter-assay coefficient of variation (CV) of 3-10%, which was significantly lower than the CV obtained by MS-HRM analyzes, especially in the methylation range of 1 -3 % Values reached 50-100%. In addition, the BBPA-dPCR achieved an analytical sensitivity of <0.003%, although only 1 ml of serum was available for these studies. Also, only serum samples and no plasma samples were available. The latter are preferably used for the investigation of fc-DNA, since due to the incoming coagulation in serum samples with a strong release of DNA from blood leukocytes and therefore a high background concentration of unmethylated DNA is to be expected. The results showed that using the BBPA-dPCR, even with a high background of normal DNA, very fc tumor DNA can be detected. Further, the serum samples were not separately treated pre-analytically, including rapid serum centrifugation and subsequent freezing to fc DNA isolation. In comparison, the sensitivity of the MS-HRM technique in own investigations was a maximum of 1%. One reason for the negative finding (in the BBPA-dPCR study) in the patient sample P8 (Table 8) could be due to an insufficient amount of serum (1 ml), so that possibly no methylated DNA copy was present in the sample being examined ,
Aus diesem Grund wurden als nächstes Serumproben mit PSA-Werten zwischen 3,5-15 ng/ml analysiert, von denen jeweils 3-5 ml zur Verfügung standen. Bei dem genannten PSA- Konzentrationsbereich handelt es sich um den kritischen Bereich für die Indikation einer Prostatagewebebiopsie. In 17 Serumproben wurden die PLA2R1- und GSTP1- Methylierungen unter Einsatz der BBPA-dPCR bestimmt. Dabei konnten signifikante Unterschiede hinsichtlich der Methylierungen in den Proben nachgewiesen werden (Fig. 15 und 16, Tabelle 9).
Tabelle 9: Übersicht über die Bestimmung der Methylierungsgrade von PLA2R1 und GSTP1 und der Gesamt-PSA-Konzentrationen (Referenzbereich: <4 ng/ml) und des Quotienten freies/ Gesamt-PSA (Referenzbereich < 20 %); dick gedruckt: Werte oberhalb des cut-off- Wertes > 0, 1 % für die Methylierungen der PLA2R1 - und GSTP1 -Gene. fPSA/Ge For this reason, serum samples with PSA values between 3.5-15 ng / ml were analyzed next, of which 3-5 ml were available. The aforementioned PSA concentration range is the critical range for the indication of prostate tissue biopsy. In 17 serum samples, PLA2R1 and GSTP1 methylations were determined using BBPA-dPCR. Significant differences in methylation in the samples could be detected (Figures 15 and 16, Table 9). Table 9: Overview of the determination of the methylation levels of PLA2R1 and GSTP1 and the total PSA concentrations (reference range: <4 ng / ml) and the quotient free / total PSA (reference range <20%); printed thick: values above the cut-off value> 0.1% for the methylations of the PLA2R1 and GSTP1 genes. fPSA / Ge
samt- velvet-
PSA in PSA in PLA2R1 GSTP1 in PSA in PSA in PLA2R1 GSTP1 in
ID ng/ml % in % % Befund ID ng / ml% in%% Findings
Prostatabiopsie mit 1/16 Zylindern rechts Prostate biopsy with 1/16 cylinders on the right
M1 6,88 1 1 ,48 4,45 0,02 positiv M1 6.88 1 1, 48 4.45 0.02 positive
nicht Not
M2 31 14,7 bestimmt 0,003 4,64 m etastas ie re nd es P rostata karzi nom M2 31 14,7 determined 0,003 4,64 m etastas ie nd es P rostata karzi nom
M3 6,51 24,6 0,0021 2,69 M3 6.51 24.6 0.0021 2.69
M4 13,87 12, 1 1 0,65 0,04 Prostatabiopsie positiv M4 13.87 12, 1 1 0.65 0.04 Prostate biopsy positive
M5 6, 19 7, 1 1 4,25 0,36 ? M5 6, 19 7, 1 1 4.25 0.36?
M6 3,52 52,27 0,019 0,009 M6 3.52 52.27 0.019 0.009
M7 3,48 24, 1 0,017 1,14 M7 3.48 24, 1 0.017 1.14
M8 4,36 19,5 0,085 0,016 M8 4.36 19.5 0.085 0.016
M9 4,86 10,7 1,66 0,35 ? M9 4.86 10.7 1.66 0.35?
M10 6,24 8,49 0,005 0 M10 6.24 8.49 0.005 0
M1 1 8,64 9,84 0,008 0,077 M1 1 8.64 9.84 0.008 0.077
M12 7,49 4,27 1,24 0,0039 Prostatabiopsie mit 1/12 Zylindern positiv M12 7.49 4.27 1.24 0.0039 Prostate biopsy with 1/12 cylinders positive
M13 8,9 30,79 0,01 1 0,023 M13 8.9 30.79 0.01 1 0.023
Prostatabiopsie durchgeführt, noch kein Prostate biopsy performed, not yet
M14 8,32 22,5 1,41 0,005 Befund M14 8.32 22.5 1.41 0.005 Findings
M15 4,26 16,9 0 0,0025 M15 4.26 16.9 0 0.0025
mäßig vergrößert Prostata mit partiell moderately enlarged prostate with partial
M16 14,88 7,6 0,73 0,192 obstruktiven Seitenlappen M16 14.88 7.6 0.73 0.192 obstructive lateral lobes
Metastasierendes Kolon-Ca, 14/23 LM, pM1 a Metastatic colonic Ca, 14/23 LM, pM1 a
M17 10, 17 5,9 0,94 0,048 (hepatisch)
Wird ein cut-off-Wert von < 0,1 % für die Methylierung beider Biomarker zu Grunde gelegt, konnte in 7 Proben (M1 , M4, M5, M9, M12, M16 und M17, Tabelle 9) die Indikation für eine Biopsie verstärkt werden, der auf Grund des Quotienten freies/Gesamt PSA < 20 % bestand. In 4 Proben mit einem Quotienten freies/Gesamt-PSA < 20 % ließen sich keine erhöhten Werte für die untersuchten Biomarker finden, so dass hier eine Gewebebiopsie nicht indiziert wäre (M8, M10, M1 1 und M15, Tabelle 9). Im Gegensatz dazu wurden in 3 Proben (M3, M7 und M14) trotz des freien PSA-Anteils von > 20 % erhöhte Werte für die PLA2R1- und GS7Pi-Methylierungen gefunden. Bei den Patientenproben M1 , M2, M4 und M12 wurden bereits Prostatakarzinome nachgewiesen. In einer weiteren Probe (M14) erfolgte bereits eine Prostatabiopsie (Tabelle 9). M17 10, 17 5.9 0.94 0.048 (hepatic) If a cut-off value of <0.1% was used for the methylation of both biomarkers, the indication for a biopsy could be amplified in 7 samples (M1, M4, M5, M9, M12, M16 and M17, Table 9) which was based on the quotient free / total PSA <20%. In 4 samples with a free / total PSA ratio <20%, no elevated values were found for the investigated biomarkers, so that a tissue biopsy would not be indicated here (M8, M10, M1 1 and M15, Table 9). In contrast, in 3 samples (M3, M7 and M14) despite the free PSA content of> 20%, elevated levels of PLA2R1 and GS7Pi methylation were found. Patients M1, M2, M4 and M12 have already had prostate cancer detected. Another prostate biopsy was performed in another sample (M14) (Table 9).
Ausführungsbeispiel 5: Kombination BBPA-ddPCR für /?>ASSF7>A-Methylierung mit MS-HRM für PLA2R1 -Methylierungen in Serum von Prostatakarzinompatienten Embodiment 5: Combination BBPA-ddPCR for /?> ASSF7> A methylation with MS-HRM for PLA2R1 methylations in serum of prostate carcinoma patients
In weiteren 27 Patientenproben wurde die R/ASSFi/A-Methylierung mit Hilfe der BBPA-dPCR analysiert. Für die PLA2R7-Methylierungsbestimmung mittels BBPA-dPCR stand nicht mehr genügend isolierte DNA-Probe zur Verfügung, so dass die RASSFIA-Ergebnisse mit den PLA2R1 -Ergebnissen kombiniert wurden, die in der MS-HRM-Analyse untersucht worden waren. In another 27 patient samples, R / ASF / A methylation was analyzed using BBPA-dPCR. For the PLA2R7 methylation assay using BBPA-dPCR, there was not enough isolated DNA sample available to combine the RASSFIA results with the PLA2R1 results studied in the MS-HRM analysis.
Die Ergebnisse zeigten deutlich erhöhte Werte für die RASSF A-Methylierung in den Proben 11 , 12, 118, 119, 121 und I24. Bemerkenswert ist, dass in den Proben 119, 121 und I24 bereits ein PCa nachgewiesen wurde (Tabelle 10). In der Probe 112 war keine erhöhte RASSF1A- Methylierung feststellbar, obwohl der Patient an einem PCa mit PSA-positiven Metastasen erkrankt war. Hier zeigte sich jedoch, dass in dieser Probe eine deutlich methylierte Subfraktion des PLA2R1-Gens vorlag (Tabelle 10). Ein positiver PLA2R1- Methylierungsbefund ohne gleichzeitig erhöhte RASSF A-Methylierung ließ sich bei einem weiteren Patienten mit PCa finden (Probe 117, Tabelle 10). Bei dem Patienten, von dem die Probe 12 stammte, wurde ebenfalls eine Prostatabiopsie durchgeführt. Bei den Proben 11 , 11 1 und 118 ist bisher nicht bekannt, inwieweit die Patienten an einem Prostatakarzinom erkrankt sind. Diese Frage kann erst in Zukunft beantwortet werden.
Tabelle 10: Übersicht über die Bestimmung der Methylierungsgrade von RASSF1A mittels BBPA-dPCR und PLA2R1 mittels MS-HRM und der Gesamt-PSA-Konzentrationen (Referenzbereich <4 ng/ml) und des Quotienten freies/ Gesamt-PSA (Referenzbereich < 20 %); fett gedruckt: Werte oberhalb des ct/i-off-Wertes > 0,1 % für die RASSF1A- Methylierung, eine semi-quantitative Auswertung erfolgte in der MS-HRM-Analyse des PLA2R1-Gens; PCa, Prostatakarzinom. The results showed significantly increased levels of RASSF A methylation in Samples 11, 12, 118, 119, 121, and I24. It is noteworthy that a PCa was already detected in samples 119, 121 and I24 (Table 10). There was no increase in RASSF1A methylation in sample 112, although the patient had a PCa with PSA-positive metastases. Here, however, it was found that a clearly methylated subfraction of the PLA2R1 gene was present in this sample (Table 10). A positive PLA2R1 methylation finding without simultaneously increased RASSF A methylation was found in another patient with PCa (Sample 117, Table 10). A prostate biopsy was also performed on the patient from whom sample 12 originated. In the samples 11, 11 1 and 118 it is not yet known to what extent the patients are suffering from a prostate carcinoma. This question can only be answered in the future. Table 10: Overview of the determination of the methylation levels of RASSF1A by means of BBPA-dPCR and PLA2R1 using MS-HRM and the total PSA concentrations (reference range <4 ng / ml) and the quotient free / total PSA (reference range <20%) ; in bold: Values above the ct / i-off value> 0.1% for RASSF1A methylation, semi-quantitative evaluation was performed in the MS-HRM analysis of the PLA2R1 gene; PCa, prostate carcinoma.
fPSA G fPSA G
esamt- RASSF1A in PLA2R1 all-RASSF1A in PLA2R1
PSA in PSA in % mittels mittels PSA in PSA in% by means of
ID ng/ml % BBPA-dPCR MS-HRM Klinische Befund ID ng / ml% BBPA-dPCR MS-HRM Clinical Findings
11 3,25 18,2 6,7 + ? 11 3.25 18.2 6.7 +?
Prostatabiopsie wurde durchgeführt, Befund noch Prostate biopsy was performed, findings still
12 9,33 7,8 36,0 ++ offen 12 9.33 7.8 36.0 ++ open
13 4, 14 12,3 0, 147 13 4, 14 12,3 0, 147
14 3,88 26,8 0, 166 P-Biopsie 201 1 und 2014 jeweils negativ 14 3.88 26.8 0, 166 P biopsy 201 1 and 2014 each negative
15 3,41 32,8 0 Prostatitis 15 3.41 32.8 0 prostatitis
16 3,47 17,0 0,017 16 3.47 17.0 0.017
17 7,77 21 ,5 0,046 17 7.77 21, 5 0.046
18 4,82 30,3 0,5 18 4,82 30,3 0,5
ig 3,41 23,2 0,202 3,4 3.41 23.2 0.202
110 4,78 16,9 0,6 110 4.78 16.9 0.6
11 1 4,79 23,8 0,01 1 ++ ? 11 1 4.79 23.8 0.01 1 ++?
112 3,30 27,6 0,023 +++ Prostata-CA mit PSA-positiven Metastasen 112 3.30 27.6 0.023 +++ Prostate CA with PSA-positive metastases
113 5,03 27,6 0,24 113 5.03 27.6 0.24
114 6,67 8,9 0,28 114 6.67 8.9 0.28
115 5,03 18, 1 0,49 115 5.03 18, 1 0.49
116 8,28 10,6 0,71 116 8.28 10.6 0.71
117 5,71 18,6 0,36 ++ Prostata-CA, Bestrahlung 7/2013 117 5.71 18.6 0.36 ++ Prostate CA, Irradiation 7/2013
118 5,73 14, 1 19,9 + ? 118 5.73 14, 1 19.9 +?
Prostata-CA in Prostatabiopsie (3 von 14 Zylindern Prostate CA in prostate biopsy (3 out of 14 cylinders
119 7,44 2,2 21 ,1 ++ positiv) 119 7.44 2.2 21, 1 ++ positive)
I20 3, 17 44,5 0,025 I20 3, 17 44.5 0.025
PSA, fPSA u. BBPA-dPCR aus Blut vom September 2013; Juli 2015 histologisch gesichertes Prostata-CA PSA, fPSA u. BBPA-dPCR from blood of September 2013; July 2015 histologically confirmed prostate-CA
121 3,45 8,4 36,3 mit Knochemmetastase 121 3.45 8.4 36.3 with bone metastasis
I22 3,85 19,0 0,3 hier erfolgten vierteljährliche PSA-Kontrollen I22 3.85 19.0 0.3 quarterly PSA controls performed here
I23 5,63 8,9 1 , 1
Prostata-CA in Prostatabiopsie (4 von 12 ZylindernI23 5.63 8.9 1, 1 Prostate CA in prostate biopsy (4 out of 12 cylinders
124 2,54 1 ,2 34,5 + positiv) 124 2.54 1, 2 34.5 + positive)
Ausführungsbeispiel 6: BBPA-dPCR für RASSF1A- und GSTPf-Methylierung in Serum von Nierenzellkarzinompatienten Embodiment 6: BBPA-dPCR for RASSF1A and GSTPf methylation in serum of renal cell carcinoma patients
In einer weiteren Untersuchung wurden 10 Serumproben von Patienten mit einem Nierenzellkarzinom im Vergleich zu 8 gesunden Probanden analysiert. In another study, 10 serum samples from patients with renal cell carcinoma were analyzed in comparison to 8 healthy volunteers.
Die Ergebnisse zeigten ebenfalls erhöhte PLA2/?7-Methylierungen (unter Einsatz des Primerpaares SEQ ID No. 1 und 2 und des Sondenpaares SEQ ID No. 20 und 21 ) in den Proben N1 -N4, N6-N8 und N10, während die Methylierung in den fc-DNA-Proben gesunder Probanden weniger als 0,005 % betrug (Fig. 17). Gemeinsam mit der Bestimmung der RASSF1A- (unter Einsatz des Primerpaares SEQ ID No. 3 und 4 und des Sondenpaares SEQ ID No. 24 und 25) und GSTP1- (Primerpaar SEQ ID No. 5 und 6, Sondenpaar SEQ ID No. 56 und 57) Methylierungen konnten alle Serumproben als pathologisch erhöht identifiziert werden (Tabelle 1 1 ). The results also showed increased PLA2 / Δ7 methylation (using primer pair SEQ ID Nos. 1 and 2 and probe pair SEQ ID Nos. 20 and 21) in samples N1-N4, N6-N8 and N10, while methylation in the fc DNA samples of healthy subjects was less than 0.005% (Figure 17). Together with the determination of the RASSF1A- (using the primer pair SEQ ID No. 3 and 4 and the probe pair SEQ ID No. 24 and 25) and GSTP1- (primer pair SEQ ID No. 5 and 6, probe pair SEQ ID No. 56 and 57) All serum samples were identified as being pathologically elevated in methylation (Table 1 1).
Tabelle 11 : Übersicht über die Bestimmung der Methylierungsgrade von PLA2R1, RASSF1A und GSTP1 im Serumproben von Patienten mit Nierenzellkarzinom (NZK1 -10; fett gedruckte Werte sind erhöhte Methylierungswerte [> 0,1 %]) Table 11: Overview of the methylation levels of PLA2R1, RASSF1A and GSTP1 in serum samples from patients with renal cell carcinoma (NZK1 -10, in bold type are elevated methylation values [> 0.1%])
ID PLA2R1 in % RASSF1A in % GSTP1 in % ID PLA2R1% RASSF1A% GSTP1%
NZK1 0,60 0 9,5 NZK1 0.60 0 9.5
NZK2 0,19 10,9 0 NZK2 0.19 10.9 0
NZK3 1,56 3,52 30,0 NZK3 1.56 3.52 30.0
NZK4 0,21 0 12,6 NZK4 0.21 0 12.6
NZK5 0 2,6 0 NZK5 0 2.6 0
NZK6 1,05 13,8 5,4 NZK6 1.05 13.8 5.4
NZK7 0,097 14,5 0 NZK7 0.097 14.5 0
NZK8 0,082 10,7 0 NZK8 0.082 10.7 0
NZK9 0 16,6 0 NZK9 0 16.6 0
NZK10 6,6 0 0
Ausführungsbeispiel 7: BBPA-ddPCR für PLA2R1-, RASSF1A- und GSTP1 - Methylierung zur Unterscheidung einer benignen Prostatahyperplasie von einem Prostatakarzinom in Serum von Patienten NZK10 6,6 0 0 Embodiment 7: BBPA-ddPCR for PLA2R1, RASSF1A and GSTP1 methylation for distinguishing benign prostatic hyperplasia from prostate carcinoma in patient serum
Nachdem mit Hilfe der neuen BBPA-dPCR-Methode Prostatakarzinome, Mammakarzinome und Nierenzellkarzinome eindeutig Patienten zugeordnet werden konnten, stellt sich die Frage, inwieweit bei erhöhten PSA-Werten eine benigne Prostatahyperplasie (BPH) von einem PCa mit Hilfe der BBPA-dPCR sicher unterschieden werden kann, um unnötige Prostatagewebebiopsien zu vermeiden. Dazu wurden die malignen Prostatazelllinien LNCaP, PC-3 und DU-145-Zellen und die benigne Prostatahyperplasie-Zelllinie BPH-1 untersucht. After using the new BBPA-dPCR method prostate cancer, breast carcinoma and renal cell carcinoma could be clearly assigned to patients, the question arises to what extent benign prostatic hyperplasia (BPH) from a PCa with the help of BBPA-dPCR can be safely distinguished at elevated PSA levels can to avoid unnecessary prostate tissue biopsies. For this purpose, the malignant prostate cell lines LNCaP, PC-3 and DU-145 cells and the benign prostate hyperplasia cell line BPH-1 were investigated.
Dabei zeigte sich, dass in der benignen Prostatazelllinie BPH-1 im Vergleich zu normalen Epithelialzellen der Prostata (PrEC) bereits heterogen methylierte DNA-Fragmente, besonders in den Zielgenen PLA2R1 und RASSF1A auftraten (Fig. 18 und 19). Bei Verwendung von Sonden mit mindestens 3 CpG-Stellen in ihren Sequenzen ließen sich diese heterogen methylierten Epi-Allele von den homogen methylierten Epi-Allelen unterscheiden und quantifizieren (Fig. 20). Homogen methylierte Epi-Allele, d.h. 3 von 3 CpG-Stellen sind methyliert, scheinen bei der Unterscheidung zwischen BPH und PCa spezifisch für cf-Tumor-DNA zu sein und können Grundlage für eine sichere Differentialdiagnose von benignen und malignen Erkrankungen der Prostata darstellen. It was found that in the benign prostate cell line BPH-1 compared to normal epithelial cells of the prostate (PrEC) already heterogenous methylated DNA fragments, especially in the target genes PLA2R1 and RASSF1A occurred (Figures 18 and 19). Using probes with at least 3 CpG sites in their sequences, these heterogenously methylated epi-alleles could be differentiated and quantified from the homogeneously methylated epi-alleles (Figure 20). Homogeneously methylated epi-alleles, i. 3 out of 3 CpG sites are methylated, appear to be specific for cf tumor DNA in distinguishing between BPH and PCa, and may provide a basis for a reliable differential diagnosis of benign and malignant prostate disease.
Im Fall des SERPINEI -Methylierung (unter Einsatz des Primerpaares SEQ ID No. 16 und 17 und des Sondenpaares SEQ ID No. 43 und 44) zeigten sich in den DNA-Proben aus PrEC und BPH-1 keine homogen noch heterogen methylierte Epi-Allele, so dass sich dieses Gen ebenfalls als Kandidatengen für die Differentialdiagnostik von BPH und Prostatakarzinomen anbietet (Fig. 21 und 22). In the case of SERPINEI methylation (using the primer pair SEQ ID Nos. 16 and 17 and the probe pair SEQ ID NOS 43 and 44), the DNA samples from PrEC and BPH-1 did not show homogeneous or heterogeneously methylated epi-alleles so that this gene is also a candidate gene for the differential diagnosis of BPH and prostate cancer (Figures 21 and 22).
Ebenso zeigte sich für das GSTP1 -Gen, dass sowohl in PrEC als auch in BPH-1 -Zellen im Gegensatz zu den malignen Prostatazelllinien LNCaP, PC-3 und DU-145 keine homogen als auch heterogen methylierte (2 von 3 CpG-Stellen methyliert) Epi-Allele nachgewiesen werden konnten (Fig. 23 und 24). Interessanterweise kamen in der malignen PC-3-Zelllinie hauptsächlich heterogen methylierte (2 von 3 CpG-Stellen methyliert) Epi-Allele vor, die sich deutlich von denen der PrEC und BPH-1 unterschieden (Fig. 25 und 26). Hier lagen nur heterogen methylierte (1 von 3 CpG-Stellen methyliert) Epi-Allele in geringer Konzentration vor, die durch Erhöhung der einzustellenden Grenzlinie gut von denen der maligenen Zelllinien abzutrennen waren (Fig. 25 und 26).
Ausführungsbeispiel 8: Differenzierung zwischen Gesund, benignen (gutartigen) und malignen (bösartigen) Prostata-Erkrankungen unter Einbeziehung und Quantifizierung von PLA2/?f-Epi-Allelen The GSTP1 gene also showed that in both PrEC and in BPH-1 cells, unlike the malignant prostate cell lines LNCaP, PC-3 and DU-145, no homogeneous or heterogenously methylated (2 of 3 CpG sites were methylated ) Epi-alleles could be detected (Figures 23 and 24). Interestingly, in the malignant PC-3 cell line, mainly heterogenously methylated (2 of 3 CpG sites methylated) epi-alleles were found that differed markedly from those of PrEC and BPH-1 (Figures 25 and 26). Here, only heterogeneously methylated (1 of 3 CpG sites methylated) epi-alleles were present in low concentration, which could be separated well by increasing the limit line to be set from those of the maligenic cell lines (FIGS. 25 and 26). Embodiment 8: Differentiation between healthy, benign (benign) and malignant (malignant) prostate diseases involving and quantifying PLA2 /? F Epi alleles
Eine verbesserte Unterscheidung zwischen gesunden Probanden und Patienten mit Prostatakarzinomen zeigte sich auch bei der Bestimmung und Quantifizierung von PLA2R1 - Epi-Allelen. So ließen sich, wurden 3 Epi-Allel-Fraktionen in die Bestimmung einbezogen (siehe Fig. 27), nur 4 der 40 PCa-Patienten (P1 , P5, P21 und P30; cut-off der fraktionellen Methylierungshäufigkeit <3,25%) klar von den gesunden Probanden unterscheiden (Tab. 12). Wurden nur die homogen methylierten PLA2R1 -Epi-Allele, d.h. 3 von 3 CpG-Stellen waren methyliert, bestimmt und quantifiziert (siehe Fig. 28), ließen sich 5 der 40 PCa- Patienten identifizieren (P1 , P12, P17, P21 und P30; cut-off-Wert der fraktionellen Methylierungshäufigkeit <0,01 1 %; Tab. 12). Interessant hierbei ist, dass bei Einbeziehung und Quantifizierung von nur homogen methylierten PLA2R1 -Epi-Allelen P12 und P17 als PCa-erkrankte Patienten, dafür aber nicht P5 als PCa-Patient identifiziert wurden, was bei Einbeziehung von drei PLA2R1 -Epi-Allelen zuvor aber der Fall war. An improved distinction between healthy volunteers and patients with prostate cancer was also found in the determination and quantification of PLA2R1 - Epi alleles. Thus, 3 epi-allele fractions were included in the determination (see Figure 27), only 4 of the 40 PCa patients (P1, P5, P21 and P30; cut-off of fractional methylation frequency <3.25%). clearly different from healthy subjects (Table 12). Were only the homogeneously methylated PLA2R1 -Epi alleles, i. 3 out of 3 CpG sites were methylated, quantified and determined (see Figure 28), 5 of the 40 PCa patients could be identified (P1, P12, P17, P21 and P30; fractional methylation frequency cut-off <0, 01 1%, Table 12). Interestingly, the involvement and quantification of only homogeneously methylated PLA2R1 -Epi alleles identified P12 and P17 as PCa-affected patients, but not P5 as a PCa patient, but with the inclusion of three PLA2R1 -Epi alleles the case was.
Im Gegensatz dazu wurden sowohl P1 , P21 und P30 als auch P5, P12 und P17 und darüber hinaus P15, P33, P34 und P38 als PCa-Patienten erkannt, wenn zwei der PLA2R1 -Epi-Allele (homogen und heterogen methylierte Epi-Allel mit 2 von 3 methylierten CpG-Stellen) quantifiziert wurden, d.h. 10 der 40 PCa-Patienten wurden identifiziert mit einer diagnostischen Spezifität von 100% (ct/i-off-Wert der fraktionellen Methylierungshäufigkeit <0,123%; Tab. 12). Da für diese Untersuchungen nur 200 μΙ Serum zur Verfügung standen, kann die hier - bei Einbeziehung von zwei PLA2R1 -Epi-Allelen - erreichte diagnostische Sensitivität von 25% bei Einsatz einer größeren Menge von Serumvolumen und/oder bei Kombination mit anderen Gensequenzen weiter erhöht werden.
In contrast, P1, P21 and P30 as well as P5, P12 and P17 and, in addition, P15, P33, P34 and P38 were recognized as PCa patients when two of the PLA2R1 -Epi alleles (homogeneous and heterogenous methylated epi-allele with 2 out of 3 methylated CpG sites), ie, 10 of the 40 PCa patients were identified with a diagnostic specificity of 100% (ct / i-off fractional methylation frequency <0.123%, Table 12). Since only 200 μΙ of serum was available for these studies, the diagnostic sensitivity of 25% achieved with the inclusion of two PLA2R1 -Epi alleles can be further increased by using a larger amount of serum volume and / or in combination with other gene sequences ,
Tabelle 12: Übersicht über die Bestimmung der Methylierungsgrade von PLA2R1 in Serumproben von gesunden Probanden (K1 -20) und Patienten mit Prostatakarzinom (P1 -40) bei Einbeziehung von 1 , 2 oder 3 PLA2R1 -Epi-Allelen (Fig. 27-29). Die Kopienanzahl/ 20 μΙ, Ratio (Verhältnis methyliert zu nicht-methyliert), FM (fraktionale Methyl ierung, d.h. Anteil methylierter im Verhältnis zu nicht-methylierten und methylierten Fragmenten) und GR (eingestellte Grenzen, thresholds) sind aufgeführt. Fett gedruckte Werte sind gegenüber den ct/i-off-Werten erhöhte Methylierungswerte. M: methylierte, U: nicht-methylierte DNA- Fragmente und NTC: Negativkontrollen ohne DNA-Template. Table 12: Overview of the determination of levels of methylation of PLA2R1 in serum samples from healthy subjects (K1-20) and patients with prostate cancer (P1 -40) when incorporating 1, 2 or 3 PLA2R1 -Epi alleles (Figures 27-29). , The number of copies / 20 μΙ, ratio (ratio methylated to unmethylated), FM (fractional methylation, i.e. proportion of methylated relative to unmethylated and methylated fragments) and GR (adjusted limits, thresholds) are listed. Bold values are elevated methylation levels over the ct / i-off values. M: methylated, U: unmethylated DNA fragments and NTC: negative controls without DNA template.
Einbeziehung von 3 Epi-Allelen Einbeziehung von 1 Epi-Allel Einbeziehung von 2 Epi-AllelenInclusion of 3 epi-alleles Inclusion of 1 epi-allele Inclusion of 2 epi-alleles
Kopien/ Kopien/ Kopien/ Copies / Copies / Copies /
ID Target Ratio FM GR Ratio FM GR Ratio FR GR ID Target Ratio FM GR Ratio FM GR Ratio FR GR
20μΙ 20μΙ 20μΙ 20μΙ 20μΙ 20μΙ
K1 M 904 0.0203 1.99 6669 0 0 0 12799 40 0.00091 0.091 10415 K1 M 904 0.0203 1.99 6669 0 0 0 12799 40 0.00091 0.091 10415
U 44600 3200 44600 3200 44600 3212U 44600 3200 44600 3200 44600 3212
K2 M 816 0.0108 1.07 6669 0 0 0 12799 0 0 0 10415K2 M 816 0.0108 1.07 6669 0 0 0 12799 0 0 0 10415
U 75600 3200 75600 3200 75400 3212U 75600 3200 75600 3200 75400 3212
K3 M 966 0.0105 1.04 6669 0 0 0 12799 0 0 0 10415K3 M 966 0.0105 1.04 6669 0 0 0 12799 0 0 0 10415
U 92000 3200 92000 3200 91800 3212U 92000 3200 92000 3200 91800 3212
K4 M 2900 0.0315 3.05 6669 0 0 0 12799 24 0.00026 0.026 10415K4 M 2900 0.0315 3.05 6669 0 0 0 12799 24 0.00026 0.026 10415
U 91800 3200 91800 3200 91600 3212U 91800 3200 91800 3200 91600 3212
K5 M 1300 0.013 1.29 6669 0 0 0 12799 0 0 0 10415K5 M 1300 0.013 1.29 6669 0 0 0 12799 0 0 0 10415
U 99600 3200 99600 3200 99400 3212U 99600 3200 99600 3200 99400 3212
K6 M 200 0.0026 0.26 6669 0 0 0 12799 0 0 0 10415K6 M 200 0.0026 0.26 6669 0 0 0 12799 0 0 0 10415
U 77600 3200 77600 3200 77600 3212U 77600 3200 77600 3200 77600 3212
K7 M 266 0.0031 0.31 6669 0 0 0 12799 0 0 0 10415K7 M 266 0.0031 0.31 6669 0 0 0 12799 0 0 0 10415
U 84800 3200 84800 3200 84600 3212U 84800 3200 84800 3200 84600 3212
K8 M 712 0.008 0.79 6669 0 0 0 12799 0 0 0 10415K8 M 712 0.008 0.79 6669 0 0 0 12799 0 0 0 10415
U 89600 3200 89600 3200 89400 3212 U 89600 3200 89600 3200 89400 3212
3.00E- 3.00E-
K9 M 2060 0.0299 2.91 6669 2.2 0.003 12799 18 0.00026 0.026 10415 K9 M 2060 0.0299 2.91 6669 2.2 0.003 12799 18 0.00026 0.026 10415
05 05
U 68600 3200 68600 3200 68400 3212 U 68600 3200 68600 3200 68400 3212
K10 M 0 0 0 6669 0 0 0 12799 0 0 0 10415K10 M 0 0 0 6669 0 0 0 12799 0 0 0 10415
U 74000 3200 74000 3200 73800 3212 U 74000 3200 74000 3200 73800 3212
5.00E- 5.00E-
K1 1 M 3.4 0.005 6669 0 0 0 12799 0 0 0 10415 K1 1 M 3.4 0.005 6669 0 0 0 12799 0 0 0 10415
05 05
U 72000 3200 72000 3200 71800 3212 U 72000 3200 72000 3200 71800 3212
5.00E- 5.00E-
K12 M 1 1 10 0.0124 1.22 6669 0 0 0 12799 4.6 0.005 10415 K12 M 1 1 10 0.0124 1.22 6669 0 0 0 12799 4.6 0.005 10415
05 05
U 90000 3200 90000 3200 89600 3212 U 90000 3200 90000 3200 89600 3212
K13 M 20 0.00025 0.025 6669 0 0 0 12799 0 0 0 10415K13 M 20 0.00025 0.025 6669 0 0 0 12799 0 0 0 10415
U 77800 3200 77800 3200 77600 3212U 77800 3200 77800 3200 77600 3212
K14 M 814 0.012 1.19 6669 0 0 0 12799 1.8 2.6E-05 0.0026 10415K14 M 814 0.012 1.19 6669 0 0 0 12799 1.8 2.6E-05 0.0026 10415
U 68000 3200 68000 3200 67800 3212U 68000 3200 68000 3200 67800 3212
K15 M 786 0.01 12 1.1 1 6669 0 0 0 12799 0 0 0 10415K15 M 786 0.01 12 1.1 1 6669 0 0 0 12799 0 0 0 10415
U 70200 3200 70200 3200 70000 3212U 70200 3200 70200 3200 70000 3212
K16 M 10 0.00014 0.014 6669 0 0 0 12799 0 0 0 10415K16 M 10 0.00014 0.014 6669 0 0 0 12799 0 0 0 10415
U 77000 3200 77000 3200 76600 3212U 77000 3200 77000 3200 76600 3212
K17 M 218 0.0023 0.23 6669 0 0 0 12799 0 0 0 10415K17 M 218 0.0023 0.23 6669 0 0 0 12799 0 0 0 10415
U 94600 3200 94600 3200 94200 3212U 94600 3200 94600 3200 94200 3212
K18 M 162 0.0022 0.21 6669 0 0 0 12799 0 0 0 10415K18 M 162 0.0022 0.21 6669 0 0 0 12799 0 0 0 10415
U 75400 3200 75400 3200 75400 3212U 75400 3200 75400 3200 75400 3212
K19 M 48 0.0006 0.06 6669 0 0 0 12799 0 0 0 10415K19 M 48 0.0006 0.06 6669 0 0 0 12799 0 0 0 10415
U 79600 3200 79600 3200 79400 3212U 79600 3200 79600 3200 79400 3212
K20 M 2160 0.0336 3.25 6669 7.2 0.0001 1 0.01 1 12799 78 0.00123 0.123 10415
U 64000 3200 64000 3200 64000 3212K20 M 2160 0.0336 3.25 6669 7.2 0.0001 1 0.01 1 12799 78 0.00123 0.123 10415 U 64000 3200 64000 3200 64000 3212
P1 M 940 0.09 8.2 6669 288 0.0275 2.67 12799 590 0.056 5.3 10415P1 M 940 0.09 8.2 6669 288 0.0275 2.67 12799 590 0.056 5.3 10415
U 10480 3200 10480 3200 10460 3212U 10480 3200 10480 3200 10460 3212
P2 M 0 0 0 6669 0 0 0 12799 0 0 0 10415P2 M 0 0 0 6669 0 0 0 12799 0 0 0 10415
U 51800 3200 51800 3200 51800 3212U 51800 3200 51800 3200 51800 3212
P3 M 0 0 0 6669 0 0 0 12799 0 0 0 10415P3 M 0 0 0 6669 0 0 0 12799 0 0 0 10415
U 27940 3200 27940 3200 27940 3212U 27940 3200 27940 3200 27940 3212
P4 M 564 0.0134 1.32 6669 0 0 0 12799 52 0.0012 0.12 10415P4 M 564 0.0134 1.32 6669 0 0 0 12799 52 0.0012 0.12 10415
U 42200 3200 42200 3200 42200 3212 U 42200 3200 42200 3200 42200 3212
9.00E- 9.00E-
P5 M 1520 0.061 5.76 6669 2.4 0.009 12799 394 0.0158 1.55 10415 P5 M 1520 0.061 5.76 6669 2.4 0.009 12799 394 0.0158 1.55 10415
05 05
U 24980 3200 24980 3200 24960 3212 U 24980 3200 24980 3200 24960 3212
P6 M 0 0 0 6669 0 0 0 12799 0 0 0 10415P6 M 0 0 0 6669 0 0 0 12799 0 0 0 10415
U 7000 3200 7000 3200 7000 3212U 7000 3200 7000 3200 7000 3212
P7 M 0 0 0 6669 0 0 0 12799 0 0 0 10415P7 M 0 0 0 6669 0 0 0 12799 0 0 0 10415
U 21000 3200 21000 3200 20980 3212U 21000 3200 21000 3200 20980 3212
P8 M 2360 0.0301 2.92 6669 0 0 0 12799 30 0.00038 0.038 10415P8 M 2360 0.0301 2.92 6669 0 0 0 12799 30 0.00038 0.038 10415
U 78600 3200 78600 3200 78400 3212 U 78600 3200 78600 3200 78400 3212
9.00E- 9.00E-
P9 M 1360 0.0159 1.57 6669 7.8 0.009 12799 50 0.00058 0.058 10415 P9 M 1360 0.0159 1.57 6669 7.8 0.009 12799 50 0.00058 0.058 10415
05 05
U 85400 3200 85400 3200 84800 3212 U 85400 3200 85400 3200 84800 3212
P10 M 0 0 0 6669 0 0 0 12799 0 0 0 10415P10 M 0 0 0 6669 0 0 0 12799 0 0 0 10415
U 5200 3200 5200 3200 5200 3212 U 5200 3200 5200 3200 5200 3212
6.00E- 6.00E-
P1 1 M 790 0.0133 1.31 6669 3.8 0.006 12799 30 0.00051 0.051 10415 P1 1 M 790 0.0133 1.31 6669 3.8 0.006 12799 30 0.00051 0.051 10415
05 05
U 59400 3200 59400 3200 59200 3212 U 59400 3200 59400 3200 59200 3212
P12 M 1920 0.0267 2.6 6669 20 0.00029 0.029 12799 166 0.0023 0.23 10415P12 M 1920 0.0267 2.6 6669 20 0.00029 0.029 12799 166 0.0023 0.23 10415
U 71800 3200 71800 3200 71600 3212U 71800 3200 71800 3200 71600 3212
P13 M 710 0.0126 1.24 6669 0 0 0 12799 64 0.001 12 0.1 12 10415P13 M 710 0.0126 1.24 6669 0 0 0 12799 64 0.001 12 0.1 12 10415
U 56400 3200 56400 3200 56400 3212U 56400 3200 56400 3200 56400 3212
P14 M 4.2 0.00018 0.018 6669 0 0 0 12799 4.2 0.00018 0.018 10415P14 M 4.2 0.00018 0.018 6669 0 0 0 12799 4.2 0.00018 0.018 10415
U 23480 3200 23480 3200 23460 3212U 23480 3200 23480 3200 23460 3212
P15 M 634 0.0334 3.24 6669 0 0 0 12799 250 0.0132 1.3 10415P15 M 634 0.0334 3.24 6669 0 0 0 12799 250 0.0132 1.3 10415
U 18960 3200 18960 3200 18920 3212 U 18960 3200 18960 3200 18920 3212
8.00E- 8.00E-
P16 M 4.8 0.008 6669 0 0 0 12799 0 0 0 10415 P16 M 4.8 0.008 6669 0 0 0 12799 0 0 0 10415
05 05
U 60600 3200 60600 3200 60400 3212 U 60600 3200 60600 3200 60400 3212
P17 M 762 0.0283 2.75 6669 176 0.0066 0.65 12799 432 0.0161 1.58 10415P17 M 762 0.0283 2.75 6669 176 0.0066 0.65 12799 432 0.0161 1.58 10415
U 26900 3200 26900 3200 26860 3212U 26900 3200 26900 3200 26860 3212
P18 M 0 0 0 6669 0 0 0 12799 0 0 0 10415P18 M 0 0 0 6669 0 0 0 12799 0 0 0 10415
U 22080 3200 22080 3200 22060 3212U 22080 3200 22080 3200 22060 3212
P19 M 0 0 0 6669 0 0 0 12799 0 0 0 10415P19 M 0 0 0 6669 0 0 0 12799 0 0 0 10415
U 43580 3200 43580 3200 43460 3212U 43580 3200 43580 3200 43460 3212
P20 M 34 0.00031 0.031 6669 0 0 0 12799 0 0 0 10415P20 M 34 0.00031 0.031 6669 0 0 0 12799 0 0 0 10415
U 107200 3200 107200 3200 106400 3212U 107200 3200 107200 3200 106400 3212
P21 M 1580 0.069 6.42 6669 202 0.0088 0.87 12799 700 0.0305 2.96 10415P21 M 1580 0.069 6.42 6669 202 0.0088 0.87 12799 700 0.0305 2.96 10415
U 23000 3200 23000 3200 23000 3212U 23000 3200 23000 3200 23000 3212
P22 M 0 0 0 6669 0 0 0 12799 0 0 0 10415P22 M 0 0 0 6669 0 0 0 12799 0 0 0 10415
U 9060 3200 9060 3200 9060 3212U 9060 3200 9060 3200 9060 3212
P23 M 0 0 0 6669 0 0 0 12799 0 0 0 10415P23 M 0 0 0 6669 0 0 0 12799 0 0 0 10415
U 5420 3200 5420 3200 5420 3212U 5420 3200 5420 3200 5420 3212
P24 M 0 0 0 6669 0 0 0 12799 0 0 0 10415P24 M 0 0 0 6669 0 0 0 12799 0 0 0 10415
U 992 3200 992 3200 992 3212U 992 3200 992 3200 992 3212
P25 M 0 0 0 6669 0 0 0 12799 0 0 0 10415P25 M 0 0 0 6669 0 0 0 12799 0 0 0 10415
U 342 3200 342 3200 342 3212U 342 3200 342 3200 342 3212
P26 M 1.8 0.00012 0.012 6669 0 0 0 12799 1.8 0.00012 0.012 10415P26 M 1.8 0.00012 0.012 6669 0 0 0 12799 1.8 0.00012 0.012 10415
U 15740 3200 15740 3200 15720 3212U 15740 3200 15740 3200 15720 3212
P27 M 0 0 0 6669 0 0 0 12799 0 0 0 10415P27 M 0 0 0 6669 0 0 0 12799 0 0 0 10415
U 500 3200 500 3200 500 3212
5.00E-U 500 3200 500 3200 500 3212 5.00E-
P28 M 890 0.0108 1.06 6669 0 0 0 12799 4.2 0.005 10415 P28 M 890 0.0108 1.06 6669 0 0 0 12799 4.2 0.005 10415
05 05
U 82800 3200 82800 3200 82400 3212 U 82800 3200 82800 3200 82400 3212
P29 M 680 0.01 14 1.13 6669 0 0 0 12799 26 0.00044 0.044 10415P29 M 680 0.01 14 1.13 6669 0 0 0 12799 26 0.00044 0.044 10415
U 59400 3200 59400 3200 59400 3212U 59400 3200 59400 3200 59400 3212
P30 M 2360 0.0585 5.53 6669 64 0.0016 0.16 12799 454 0.01 12 1.11 10415P30 M 2360 0.0585 5.53 6669 64 0.0016 0.16 12799 454 0.01 12 1.11 10415
U 40440 3200 40440 3200 40400 3212U 40440 3200 40440 3200 40400 3212
P31 M 244 0.0032 0.32 6669 0 0 0 12799 0 0 0 10415P31 M 244 0.0032 0.32 6669 0 0 0 12799 0 0 0 10415
U 77200 3200 77200 3200 77000 3212U 77200 3200 77200 3200 77000 3212
P32 M 3.4 0.00019 0.019 6669 0 0 0 12799 3.4 0.00019 0.019 10415P32 M 3.4 0.00019 0.019 6669 0 0 0 12799 3.4 0.00019 0.019 10415
U 18480 3200 18480 3200 18460 3212U 18480 3200 18480 3200 18460 3212
P33 M 454 0.0244 2.38 6669 0 0 0 12799 152 0.0081 0.81 10415P33 M 454 0.0244 2.38 6669 0 0 0 12799 152 0.0081 0.81 10415
U 18660 3200 18660 3200 18640 3212U 18660 3200 18660 3200 18640 3212
P34 M 654 0.0178 1.74 6669 0 0 0 12799 46 0.0013 0.13 10415P34 M 654 0.0178 1.74 6669 0 0 0 12799 46 0.0013 0.13 10415
U 36840 3200 36840 3200 36820 3212U 36840 3200 36840 3200 36820 3212
P35 M 0 0 0 6669 0 0 0 12799 0 0 0 10415P35 M 0 0 0 6669 0 0 0 12799 0 0 0 10415
U 46000 3200 46000 3200 46000 3212U 46000 3200 46000 3200 46000 3212
P36 M 0 0 0 6669 0 0 0 12799 0 0 0 10415P36 M 0 0 0 6669 0 0 0 12799 0 0 0 10415
U 28920 3200 28920 3200 28900 3212U 28920 3200 28920 3200 28900 3212
P37 M 0 0 0 6669 0 0 0 12799 0 0 0 10415P37 M 0 0 0 6669 0 0 0 12799 0 0 0 10415
U 82 3200 82 3200 72 3212U 82 3200 82 3200 72 3212
P38 M 676 0.0279 2.71 6669 0 0 0 12799 148 0.0061 0.61 10415P38 M 676 0.0279 2.71 6669 0 0 0 12799 148 0.0061 0.61 10415
U 24240 3200 24240 3200 24200 3212U 24240 3200 24240 3200 24200 3212
P39 M 0 0 0 6669 0 0 0 12799 0 0 0 10415P39 M 0 0 0 6669 0 0 0 12799 0 0 0 10415
U 73000 3200 73000 3200 72800 3212U 73000 3200 73000 3200 72800 3212
P40 M 62 0.0026 0.26 6669 0 0 0 12799 14 0.00062 0.062 10415P40 M 62 0.0026 0.26 6669 0 0 0 12799 14 0.00062 0.062 10415
U 23440 3200 23440 3200 23420 3212U 23440 3200 23440 3200 23420 3212
NTC M 0 0 0 6669 0 0 0 12799 0 0 0 10415NTC M 0 0 0 6669 0 0 0 12799 0 0 0 10415
U 3200 0 3200 0 3212U 3200 0 3200 0 3212
NTC M 0 0 0 6669 0 0 0 12799 0 0 0 10415NTC M 0 0 0 6669 0 0 0 12799 0 0 0 10415
U 3200 0 3200 0 3212U 3200 0 3200 0 3212
NTC M 0 0 0 6669 0 0 0 12799 0 0 0 10415NTC M 0 0 0 6669 0 0 0 12799 0 0 0 10415
U 3200 0 3200 0 3212 U 3200 0 3200 0 3212
Da aus Zelllinien isolierte DNA in ausreichend Menge vorliegt, was in Liquid Biopsien wie Serum, Plasma oder Seminalflüssigkeit oftmals nicht der Fall ist, stellte sich die Frage, wie sich die fraktionale PLA2R1 -Methylierungshäufigkeit in normalen PrEC und BPH-1 -Zellen, in denen vereinzelt homogen als auch heterogen methylierte Epi-Allel-Kopien auftraten, nach der BBPA-dPCR im Vergleich zur dPCR allein verhält. Im Vergleich zur dPCR allein (Fig. 30, links) zeigte sich auch hier nach Prä-Amplifikation mit 50 Zyklen bei 63°C, dass der resultierende PLA2R1 -Methylierungsgrad bei normalen PrEC und nicht-malignen BPH-1 - Zellen sich in Richtung 0 % veränderte und die Methylierung der malignen Prostatazelllinien sich deutlich von der BPH-1 -Zelllinie abgrenzen ließ (Fig. 30, rechts). Grund dafür ist erneut das Phänomen, dass in den PrEC und BPH-1 -Zellen, trotz dass eine bestimmte Anzahl methylierter PLA2R1 -Fragmente, wenn auch in geringer Menge, in den Proben vorkam, mit steigender Anzahl der Zyklen in der BBPA die nicht-methylierten Sequenzen verstärkt vervielfältigt wurden, ohne dass die methylierten Fragmente gleichermaßen mit vervielfältigt wurden (Fig. 31 ). Umgekehrt zeigte sich in den DNA-Proben der LNCaP und DU-145-Zellen eine deutlich bevorzugte Amplifikation der methylierten gegenüber nicht-methylierten
Sequenzen. In den PC-3-Zellen erfolgte eine in etwa vergleichbare effiziente Vervielfältigung sowohl der methylierten als auch der nicht-methylierten PLA2R1 -Sequenzen (Fig. 31 ). Since DNA isolated from cell lines is present in sufficient quantities, which is often not the case in liquid biopsies such as serum, plasma or seminal fluid, the question arose as to how the fractional PLA2R1 methylation frequency in normal PrEC and BPH-1 cells, in which occasionally appeared homogeneous as well as heterogenously methylated epi-allele copies, according to which BBPA-dPCR behaves alone in comparison to dPCR. Compared to the dPCR alone (FIG. 30, left), here again, after pre-amplification with 50 cycles at 63 ° C., the resulting PLA2R1 methylation level in the case of normal PrEC and non-malignant BPH-1 cells was in the 0 direction % and the methylation of the malignant prostate cell lines could be clearly differentiated from the BPH-1 cell line (FIG. 30, right). Again, this is due to the phenomenon that in the PrEC and BPH-1 cells, despite a certain number of methylated PLA2R1 fragments, albeit in small quantities, being present in the samples, as the number of cycles in the BBPA increases, so does the number of cycles. amplified methylated sequences were amplified without the methylated fragments were equally amplified with (Fig. 31). Conversely, in the DNA samples of the LNCaP and DU-145 cells, a clearly preferred amplification of the methylated versus non-methylated Sequences. In the PC-3 cells, an approximately comparable efficient amplification of both the methylated and non-methylated PLA2R1 sequences was performed (Figure 31).
Die 2-D-Darstellung der FAM- und HEX-positiven Signale nach 50-Zyklen in der BBPA belegte, dass die BPH-1 -Zellpopulation sich deutlich von den PC-3, LNCaP und DU-145- Zellen absetzen ließ (Fig. 32). Ohne Darstellung der NTC, d. h. der doppelt-negativen Tröpfchen zeigte sich auch, dass nach 50 Zyklen bei allen Zellproben keine doppeltnegativen Tröpfchen mehr vorkamen, was bedeutet, dass die dPCR stark mit prä- amplifizierten DNA-Kopien überladen war und die Poisson-Verteilung und -Statistik nicht mehr zutraf und trotzdem oder gerade deshalb die maligen Prostatazelllinien sich so gut von den BPH-1 abtrennen ließen (Fig. 33). In der alleinigen dPCR ergab sich für die PrEC und BPH-1 noch ein fraktionaler Methylierungsgrad von 2,1 % (1 ,1 -3,1 %) bzw. 8,3 % (7,0- 9,5 %). In der BBPA-dPCR betrug der Methylierungsgrad für beide Zelllinien 0 %, während der Methylierungsgrad für die malignen Prostatazelllinien LNCaP, PC-3 und DU-145 mit den Daten der alleinigen dPCR gut übereinstimmten (Tabelle 20). The 2-D plot of the FAM and HEX positive signals after 50 cycles in the BBPA demonstrated that the BPH-1 cell population could be clearly deposited from the PC-3, LNCaP and DU-145 cells (Fig. 32). Without representation of the NTC, d. H. The double-negative droplet also showed that after 50 cycles, no double-negative droplets were present in all cell samples, which means that the dPCR was heavily overloaded with pre-amplified DNA copies and the Poisson distribution and statistics were no longer applicable and Nevertheless, or perhaps because of this, the malignant prostate cell lines could be separated from the BPH-1 so well (Fig. 33). In the dPCR alone, there was still a fractional degree of methylation of 2.1% (1.1-3.1%) and 8.3% (7.0-9.5%) for the PrEC and BPH-1, respectively. In the BBPA-dPCR, the methylation level for both cell lines was 0%, while the degree of methylation for the malignant prostate cell lines LNCaP, PC-3 and DU-145 was in good agreement with the data of the sole dPCR (Table 20).
Ausführungsbeispiel 9: Bestimmung der Bias zugunsten methylierter bzw. nicht- methylierter PLA2R1 -Gensequenzen in Abhängigkeit vom Primer-Design, Annealingtemperatur, MgCI2-Konzentration und Zyklenanzahl in der BBPA Exemplary embodiment 9: Determination of the bias in favor of methylated or unmethylated PLA2R1 gene sequences as a function of the primer design, annealing temperature, MgCl 2 concentration and number of cycles in the BBPA
An Hand von Untersuchungen des PLA2R1 -Gens und unterschiedlicher Primerpaare konnte mit Hilfe der dPCR gezeigt werden, wie die PCR-Bias für methylierte gegenüber nicht- methylierter DNA-Sequenzen in Abhängigkeit der MgCI2-Konzentrationen und Annealingtemperaturen sich veränderte. Auf Grund dieser Ergebnisse können für jedes zu untersuchende Gen neue Testsysteme entwickelt werden, bei denen einzelne Tumor-DNA- Fragmente auch vor einem großen Hintergrund von Wild-Typ-DNA hoch sensitiv und spezifisch detektiert werden sollen. Durch entsprechende Einstellungen von MgCI2- Konzentration, Annealingtemperaturen, Zyklenanzahl und Konstruktion der Primer können die Amplifikationsraten methylierter und nicht-methylierter Sequenzen so eingestellt werden, dass eine optimale Bias resultiert, je nachdem, ob methylierte oder nicht-methylierte Sequenzen als Target zur Identifikation von Tumor-spezifischer DNA dienen sollen. Im Fall von nicht-methylierten Sequenzen als Zieltarget werden bevorzugt Primerpaare ohne CpG- Stellen verwendet. Ist das auf Grund der Gensequenz nicht möglich, sind Primer so zu konstruieren, dass sie so wenig wie möglich CpG-Sequenzen enthalten und diese eher in Richtung des 5"-Endes der Primer angeordnet sind. Des Weiteren sind hier die MgCI2- Konzentrationen und Annealingtemperaturen so einzustellen, dass bevorzugt nicht- methylierte gegenüber methylierten Sequenzen vervielfältigt werden.
So zeigte sich bei Verwendung von Proben mit 50%-igem Anteil von jeweils methylierten und nicht-methylierten DNA-Kopien und dem Primerpaar ohne CpG-Stellen (Primerpaar 168 bp) bei einer MgCI2-Konzentration von 1 ,5 mM über den gesamten Temperaturbereich von 50- 63°C eine Bias zugunsten nicht-methylierter DNA-Sequenzen (Fig. 34). Bei einer MgCI2- Konzentration von 2,5-4,5 mM war bei diesem Primerpaar keine wesentliche Bias zu erkennen. Bei einer MgCI2-Konzentration von 6,0 mM und besonders bei 8,0 mM zeigte sich bei diesem Primerpaar jedoch eine deutliche Bias zugunsten methylierter DNA-Sequenzen in den Temperaturbereichen 58,2-60,8°C bzw. 55,1 -63,0°C (Fig. 34). By means of studies of the PLA2R1 gene and different primer pairs, dPCR was used to demonstrate how the PCR bias for methylated versus non-methylated DNA sequences changed as a function of MgCl 2 concentrations and annealing temperatures. Based on these results, new test systems can be developed for each gene to be examined, in which individual tumor DNA fragments are to be detected highly sensitively and specifically even against a large background of wild-type DNA. By adjusting MgCl 2 concentration, annealing temperatures, number of cycles, and construction of primers, the amplification rates of methylated and unmethylated sequences can be adjusted to give optimum bias, depending on whether methylated or unmethylated sequences are used as targets for identification To serve tumor-specific DNA. In the case of non-methylated sequences as target target, preference is given to using primer pairs without CpG sites. If this is not possible due to the gene sequence, primers should be designed to contain as few CpG sequences as possible and are located closer to the 5 " end of the primers, as well as MgCl 2 concentrations and Adjust annealing temperatures so that preferably non-methylated over methylated sequences are amplified. Thus, when using samples with 50% proportion of each methylated and unmethylated DNA copies and the primer pair without CpG sites (primer pair 168 bp) at a MgCl 2 concentration of 1, 5 mM over the entire temperature range from 50- 63 ° C bias in favor of non-methylated DNA sequences (Figure 34). At a MgCl 2 concentration of 2.5-4.5 mM, no significant bias was seen in this primer pair. At a MgCl 2 concentration of 6.0 mM and especially at 8.0 mM, however, this primer pair showed a clear bias in favor of methylated DNA sequences in the temperature ranges 58.2-60.8 ° C. or 55.1. 63.0 ° C (Fig. 34).
Bei Verwendung von Primerpaaren mit 1 CpG-Stelle (PL-161 bp) bzw. 2 CpG-Stellen (PL- 150 bp) zeigte sich gegenüber den Primern ohne CpG-Stelle (PL-168 bp) eine Bias zugunsten methylierter Sequenzen, deren Höhe über die MgCI2-Konzentration und Annealingtemperatur entsprechend eingestellt werden kann (Fig. 35 und 36). When using primer pairs with 1 CpG site (PL-161 bp) or 2 CpG sites (PL-150 bp), there was a bias in favor of methylated sequences, the amount of which compared to the primers without CpG site (PL-168 bp) can be adjusted accordingly via the MgCl 2 concentration and annealing temperature (FIGS. 35 and 36).
Enthielten die Primer 4 CpG-Stellen, wobei ein Cytosinrest einer CpG-Sequenz direkt am 3"- Ende eines Primers angeordnet war, zeigte sich eine am stärksten ausgeprägte Bias, wobei die Amplifikationseffizienz in Abhängigkeit von der gewählten MgCI2-Konzentration bei steigenden Annealingtemperaturen deutlich abnahm (Fig. 37). So fiel bei einer 1 ,5 mM MgCI2-Konzentration die Amplifikationseffizienz für methylierte Sequenzen oberhalb einer Annealingtemperatur von 52,6°C kontinuierlich ab (Fig. 37). Containing the primer 4 CpG sites, wherein a cytosine residue of a CpG sequence located on the 3 "- was positioned end of a primer, a most pronounced bias, wherein the amplification efficiency in dependence on the selected MgCl 2 concentration with increasing annealing temperatures clearly showed Thus, at a 1.5 mM MgCl 2 concentration, the amplification efficiency for methylated sequences dropped continuously above an annealing temperature of 52.6 ° C (Figure 37).
Eine Bias zugunsten methylierter DNA-Sequenzen in Abhängigkeit von der Konstruktion der Primer, Annealingtemperatur und MgCI2-Konzentration zeigten sich auch für die RASSF1A- und GSTP1 -Primer (Tab. 21 und 22). A bias in favor of methylated DNA sequences depending on the construction of the primers, annealing temperature and MgCl 2 concentration was also shown for the RASSF1A and GSTP1 primers (Table 21 and 22).
Ausführungsbeispiel 10: Analytische Sensitivitat und Spezifität der BBPA-ddPCR in Abhängigkeit vom Design der Primer, Annealingtemperatur, MgCI2-Konzentration und Zyklenanzahl der BBPA Embodiment 10 Analytical sensitivity and specificity of BBPA-ddPCR as a function of primer design, annealing temperature, MgCl 2 concentration, and number of cycles of BBPA
Um festzustellen, unter welchen Bedingungen die größte analytische Sensitivität, insbesondere vor einem großen Hintergrund von Wildtyp-DNA erhalten werden kann, ohne dass falsch-positive Signale verstärkt auftreten - eine Grundvoraussetzung für eine hohe analytische und diagnostische Spezifität des Testverfahrens - wurden Testproben generiert, die einen geringen Anteil methylierter DNA-Fragmente (DNA aus U937-Leukämiezellen) gegenüber einem steigenden Anteil normaler Wild-Typ-DNA enthielten. Dazu wurden genomische DNA aus Blutleukozyten gesunder Probanden in einer PCR amplifziert. Auf diese Weise konnten Proben generiert werden, die eine ausreichend große Menge an nicht- methylierten, normalen Wild-Typ-DNA enthielten und denen keine oder nur geringe Mengen methylierter DNA zugesetzt wurden, d.h. 5, 10, 20 oder 3000 Kopien methylierte DNA-
Fragmente. Als Hintergrund dienten 70.000, 175.000, 350.000 und 700.000 Kopien nicht- methylierter DNA. Daraus ergaben sich z.B. in Proben mit 700.000 nicht-methylierter DNA- Fragmente ein Anteil von 0%, 0,0007%, 0,0014%, 0,0028% und 0,43% methylierter PLA2R1 -DNA-Fragmente. In order to determine the conditions under which the greatest analytical sensitivity, especially against a large background of wild-type DNA, can be obtained without increasing false-positive signals - a prerequisite for a high analytical and diagnostic specificity of the test procedure - test samples were generated a small proportion of methylated DNA fragments (DNA from U937 leukemia cells) against an increasing proportion of normal wild-type DNA contained. For this purpose, genomic DNA from blood leukocytes of healthy volunteers were amplified in a PCR. In this way, samples could be generated which contained a sufficiently large amount of unmethylated, normal wild-type DNA and to which no or only small amounts of methylated DNA were added, ie 5, 10, 20 or 3000 copies of methylated DNA. Fragments. The background was made up of 70,000, 175,000, 350,000 and 700,000 copies of unmethylated DNA. This resulted, for example, in samples containing 700,000 non-methylated DNA fragments, a proportion of 0%, 0.0007%, 0.0014%, 0.0028% and 0.43% of methylated PLA2R1 DNA fragments.
In einer anschließenden dPCR, d.h. ohne vorherige Prä-Amplifikation, zeigten sich bei Verwendung der Primerpaare ohne CpG-Stellen (PLA2R1 168 bp) und mit 4 CpG-Stellen (PLA2R1 133 bp), dass mit beiden Primerpaaren in den Proben mit 70.000 nicht- methylierten Kopien die methylierten Kopien gut nachzuweisen waren (Tab. 23 und 24). Bei weiterem Anstieg der nicht-methylierten Kopien, d.h. in den Proben mit 175.000, 350.000 und 700.000 nicht-methylierten Kopien zeigte sich bei Verwendung des Primerpaares ohne CpG-Stellen ein zunehmend verminderter Nachweis der 3000 methylierten DNA-Fragmente (von 2780 bei 70.000 nicht-methylierten Kopien auf 1968, 560 bzw. 1 14 methylierter Kopien bei steigenden nicht-methylierten Kopien von 175.000, 350.000 und 700.000 nicht- methylierten Kopien, Tab. 23). Ein ähnlicher Abfall stellte sich auch bei Verwendung dieses Primerpaares in den Proben mit 5, 10 und 20 Kopien methylierter DNA ein (Tab. 23). Im Gegensatz dazu konnten mit dem Primerpaar mit 4 CpG-Stellen (PLA2R1 -133 bp) die 3000 Kopien methylierter DNA auch in den Proben mit 175.000, 350.000 und 700.000 nicht- methylierten Kopien vollständig nachgewiesen werden (Tab. 24). Die geringen Konzentrationen methylierten DNA-Fragmente ließen sich jedoch auch hier bei steigendem Hintergrund nicht-methylierter DNA nicht sicher detektieren (Tab. 24). In a subsequent dPCR, i. without prior pre-amplification, using the primer pairs without CpG sites (PLA2R1 168 bp) and 4 CpG sites (PLA2R1 133 bp), the methylated copies were good with both primer pairs in the samples containing 70,000 unmethylated copies (Table 23 and 24). Upon further increase in unmethylated copies, i. in the samples containing 175,000, 350,000 and 700,000 non-methylated copies, using the primer pair without CpG sites showed progressively diminished detection of the 3,000 methylated DNA fragments (from 2,780 in 70,000 non-methylated copies to 1968, 560 and 14 respectively methylated copies with increasing non-methylated copies of 175,000, 350,000 and 700,000 unmethylated copies, Table 23). A similar drop also occurred when using this primer pair in the samples containing 5, 10 and 20 copies of methylated DNA (Table 23). In contrast, with the primer pair with 4 CpG sites (PLA2R1 -133 bp), the 3,000 copies of methylated DNA could be fully detected in the samples containing 175,000, 350,000 and 700,000 unmethylated copies (Table 24). However, the low concentrations of methylated DNA fragments could not be reliably detected here as the background of non-methylated DNA increased (Table 24).
Im Folgenden wurde deshalb der Frage nachgegangen, unter welchen Bedingungen eine verbesserte Sensitivität für den Nachweis geringer Konzentrationen von Tumor-DNA vor einem großen Hintergrund an Wild-Typ-DNA erreicht werden kann, ohne dabei verstärkt falsch positive Signale zu generieren. Letzteres bedeutet, dass die erhaltenen Werte in den Proben ohne Kopien methylierter DNA sich von den Proben mit nur 5 Kopien methylierter DNA deutlich unterscheiden. In the following, the question of the conditions under which improved sensitivity for the detection of low concentrations of tumor DNA against a large background of wild-type DNA can be achieved, without increasingly generating false-positive signals. The latter means that the values obtained in the samples without copies of methylated DNA differ significantly from the samples with only 5 copies of methylated DNA.
Bei Verwendung der Primerpaare mit einer (PLA2R1 161 bp) oder zwei CpG-Stellen (PLA2R1 150 bp) im Vergleich zu dem Primerpaar ohne CpG-Stelle (PLA2R1 168 bp) war eine erhöhte analytische Sensitivität nach einer Prä-Amplifikation durch 15 Zyklen bei einer Annealingtemperatur von 63°C und einer 2,5 mM MgCI2-Konzentration nachweisbar (Tab. 25 und 26). When primer pairs were used with one (PLA2R1 161 bp) or two CpG sites (PLA2R1 150 bp) compared to the primer pair lacking the CpG site (PLA2R1 168 bp), increased analytical sensitivity was after 15 cycles of pre-amplification Annealing temperature of 63 ° C and a 2.5 mM MgCl 2 concentration detectable (Table 25 and 26).
Eine erhöhte Sensitivität und vor allem aber eine deutlich verbesserte analytische Spezifität zeigte sich auch hier überraschend mit dem Primerpaar mit 4 CpG-Stellen (PLA2R1 133bp), wenn dabei die MgCI2-Konzentration und Annealingtemperatur beachtet wurden. Während bei einer MgCI2-Konzentration von 6,0 mM bei einer Annealingtemperatur von 50°C nur die 3000 methylierten Kopien, nicht aber die 5, 10 und 20 Kopien methylierter DNA
nachzuweisen waren, wurde eine Unterscheidung der Proben mit dem geringen Anteil methylierter DNA möglich, wenn bei gleicher Annealingtemperatur von 50°C die MgCI2- Konzentration auf 1 ,5 mM reduziert wurde (Tab. 27 und 29). Wurde im Vergleich dazu die Annealingtemperatur auf 63°C erhöht bei gleichzeitiger MgCI2-Konzentration von 1 ,5 mM, ließen sich die Proben ohne und mit 5 Kopien methylierter DNA vor einem Hintergrund von 700.000 nicht-methylierten DNA-Kopien sowohl nach 15x als auch nach 50x Zyklen nicht voneinander unterscheiden (Tab. 28 und 30). Das änderte sich, wenn bei einer Annealingtemperatur von 63°C die MgCI2-Konzentration auf 6,0 mM erhöht wurde. Hier zeigte sich nach 15 Zyklen unter Verwendung des Primerpaares mit 4 CpG-Stellen (PLA2R1 133 bp) bei allen Proben eine hohe analytische Sensitivität und Spezifität. Wurde die Zyklenzahl von 15 auf 50 erhöht, d.h. die KPK (Kopien pro Kompartiment) lag weit oberhalb der nach dem Stand der Technik empfohlenen KPK von maximal 8 [9], zeigten sich die besten Ergebnisse hinsichtlich analytischer Sensitivität und Spezifität, die jeweils 100% betrugen. Waren die Signale zwischen den Proben ohne methylierte Kopien mit denen mit 5 Kopien methylierter DNA bereits nach 15 Zyklen deutlich und signifikant zu unterscheiden, zeigten sich nach 50 Zyklen in allen Proben ohne Kopien methylierter DNA (mit Ausnahme der Probe mit 350.000 Kopien nicht-methylierter DNA (hier war 1 Tröpfchen der insgesamt 16.235 Tröpfchen falsch positiv für FAM-Signale), keine positiven Signale, während in allen anderen Proben mit methylierten DNA-Fragmenten deutlich erhöhte FAM-Signale nachweisbar waren (Tab. 28 und 30, Fig. 38-45). An increased sensitivity and, above all, a significantly improved analytical specificity were also surprisingly found here with the primer pair with 4 CpG sites (PLA2R1 133bp), if the MgCl 2 concentration and annealing temperature were taken into account. While at an MgCl 2 concentration of 6.0 mM at an annealing temperature of 50 ° C, only the 3,000 methylated copies, but not the 5, 10 and 20 copies of methylated DNA To differentiate the samples with the low proportion of methylated DNA was possible, if at the same annealing temperature of 50 ° C, the MgCl 2 concentration was reduced to 1, 5 mM (Table 27 and 29). In contrast, when the annealing temperature was increased to 63 ° C with a concurrent MgCl 2 concentration of 1.5 mM, the samples were incubated with and without 5 copies of methylated DNA against a background of 700,000 unmethylated DNA copies both after 15x and do not differ from each other after 50x cycles (Table 28 and 30). This changed when the MgCl 2 concentration was increased to 6.0 mM at an annealing temperature of 63 ° C. Here, after 15 cycles using the primer pair with 4 CpG sites (PLA2R1 133 bp), a high analytical sensitivity and specificity were found in all samples. When the number of cycles was increased from 15 to 50, ie the KPK (Copies per compartment) was far above the maximum of 8 recommended by the prior art [9], the best results were achieved in terms of analytical sensitivity and specificity, each 100% cheat. If the signals between the samples without methylated copies and those with 5 copies of methylated DNA were clearly and significantly differentiated already after 15 cycles, after 50 cycles in all samples without copies of methylated DNA (with the exception of the sample with 350,000 copies of unmethylated DNA (Here, 1 droplet of the 16,235 droplets was false positive for FAM signals), no positive signals, while in all other samples with methylated DNA fragments significantly increased FAM signals were detectable (Table 28 and 30, Fig. 38-45 ).
Die Grundlage für die erreichten hohen analytischen Sensitivitäten und Spezifitäten könnte unter den gewählten Reaktionsbedingungen in einer besonderen Konkurrenzreaktion der Primer mit 4 CpG-Stellen, wobei ein Cytosinrest sich direkt am 3"-Ende befindet (PLA2R1 133 bp) um die methylierten und nicht-methylierten DNA-Fragmenten begründet sein. So zeigte sich in der 2-D-Grafik, dass nach 50 Zyklen Prä-Am plifikation die 70.000 nicht- methylierten DNA-Kopien nur zu einem positiven HEX-Signal führten, wenn absolut keine Kopie methylierter DNA in der Ausgangsproben vorlag (Fig. 38 und 39). Bereits 5 Kopien methylierter DNA verhinderten, dass nach 50 Zyklen Prä-Amplifikation 70.000 Kopien nicht- methylierter DNA zu einem Anstieg der HEX-Signale führte. Wurde die Kopienanzahl nicht- methylierter DNA auf 175.000 erhöht, reichten 10, nicht aber 5 Kopien methylierter DNA mehr aus, die Generierung positiver HEX-Signale vollständig zu verhindern (Fig. 40 und 41 ). Wurden die nicht-methylierten DNA-Kopien weiter auf 350.000 und 700.000 erhöht, reichten schließlich nur die 3000 Kopien methylierter DNA aus, die Generierung von positiven HEX- Signalen zu unterbinden (Fig. 42 und 44). Auf Grund dieser Konkurrenzreaktion scheinen unter diesen stringenten Reaktionsbedingungen falsch-positive Signale verhindert zu werden, was bei der PCR unter Verwendung methylspezifischer Primer (MSP) bisher nicht der Fall war [4, 16-19]. Werden die starken Signalunterschiede zwischen den Proben mit 5
bzw. keinen Kopien methylierter PLA2R1 -DNA-Fragmente bei einem jeweiligen Hintergrund von 700.000 nicht-methylierten DNA-Kopien berücksichtigt (Fig. 44), kann davon ausgegangen werden, dass auch ein einzelnes methyliertes PLA2R1 -Fragment mit dem Primerpaar mit 4 CpG-Stellen (PLA2R1 -133 bp) bei 6,0 mM MgCI2-Konzentration und 63,0°C sicher nachgewiesen werden kann. Daraus würde sich eine analytische Sensitivitat von 1 zu 700.000 (Verhältnis von 1 ,4 x 10"6) bzw. einem Methylierungsgrad von 0,00014% ergeben.
The basis for the achieved high analytical sensitivities and specificities could under the selected reaction conditions in a particular competition reaction of the primers with 4 CpG sites, where a cytosine residue is located directly at the 3 " end (PLA2R1 133 bp) around the methylated and unmethylated ones For example, after 50 cycles of pre-amplification, the 70,000 non-methylated DNA copies produced only a positive HEX signal, with absolutely no copy of methylated DNA in the 2-D graphic Already 5 copies of methylated DNA prevented that after 50 cycles of pre-amplification 70,000 copies of unmethylated DNA led to an increase in the HEX signals, when the copy number of unmethylated DNA was increased to 175,000, 10, but not 5 copies of methylated DNA, were more than sufficient to completely prevent the generation of positive HEX signals (Figures 40 and 41) thylated DNA copies further increased to 350,000 and 700,000, were finally sufficient only the 3000 copies of methylated DNA to prevent the generation of positive HEX signals (Fig. 42 and 44). Due to this competitive reaction, false-positive signals appear to be prevented under these stringent reaction conditions, which has not been the case in PCR using methyl-specific primers (MSP) [4, 16-19]. Are the strong signal differences between the samples with 5 or no copies of methylated PLA2R1 DNA fragments at a respective background of 700,000 unmethylated DNA copies (Figure 44), it can be assumed that also a single methylated PLA2R1 fragment with the primer pair with 4 CpG sites (PLA2R1 -133 bp) at 6.0 mM MgCl 2 concentration and 63.0 ° C can be detected safely. It would an analytical Sensitivitat of 1 to 700,000 (ratio of 1, 4 x 10 "6) or a degree of methylation of 0.00014% yield.
Tabelle 13: FAM-Signale (methylierte GSTPf-DNA-Fragmente) und HEX-Signale (nicht-methylierte GSTPf-DNA-Fragmente) in Serumproben gesunder Probandinnen (GF1 -GF20) und Serumproben von Patientinnen mit Mammakarzinom (MF1 -MF20) und Non-Template-Kontrolle (NTC, ohne DNA bzw. genomische DNA ohne Bisulfitumwandlung) nach 15 Zyklen in der BBPA mit dem GSTP1 -120bp-Primern (SEQ ID: 5 und 6) und 2,5 mM MgCI2-Konzentration bei 50,7°C und anschließender dPCR. Cut-off-W ert <0,07%; Rohdaten zur Fig. 55. Table 13: FAM signals (methylated GSTPf DNA fragments) and HEX signals (non-methylated GSTPf DNA fragments) in serum samples from healthy volunteers (GF1 -GF20) and serum samples from patients with breast cancer (MF1-MF20) and Non Template control (NTC, without DNA or genomic DNA without bisulfite conversion) after 15 cycles in the BBPA with the GSTP1 -120bp primers (SEQ ID: 5 and 6) and 2.5 mM MgCl 2 concentration at 50.7 ° C and subsequent dPCR. Cut-off value <0.07%; Raw data for FIG. 55.
Ch1 + Ch1 + Ch1- TröpfchenFrakt. Ch1 + Ch1 + Ch1 droplet fract.
Pos. Probe Kopien/20pL Positiv Negativ Ch1-Ch2+ Ratio Grenzwert Pos. Sample Copies / 20pL Positive Negative Ch1-Ch2 + Ratio Limit
Ch2+ Ch2- Ch2- anzahl Häufigkeit Ch2 + Ch2- Ch2- number of frequencies
A01 GM1 0 0 1 1659 0 0 9615 2044 1 1659 0 0 3979 A01 GM1 0 0 1 1659 0 0 9615 2044 1 1659 0 0 3979
A01 40960 9615 2044 0 0 9615 2044 1 1659 2133 A01 40960 9615 2044 0 0 9615 2044 1 1659 2133
B01 GM2 9.2 5 12808 3 2 7860 4948 12813 0.00041 0.041 3979 B01 GM2 9.2 5 12808 3 2 7860 4948 12813 0.00041 0.041 3979
B01 22380 7863 4950 3 2 7860 4948 12813 2133 B01 22380 7863 4950 3 2 7860 4948 12813 2133
C01 GM3 9.6 5 12273 4 1 9038 3235 12278 0.00031 0.031 3979 C01 GM3 9.6 5 12273 4 1 9038 3235 12278 0.00031 0.031 3979
C01 31380 9042 3236 4 1 9038 3235 12278 2133 C01 31380 9042 3236 4 1 9038 3235 12278 2133
D01 GM4 0 0 12271 0 0 10748 1523 12271 0 0 3979 D01 GM4 0 0 12271 0 0 10748 1523 12271 0 0 3979
D01 49000 10748 1523 0 0 10748 1523 12271 2133 D01 49000 10748 1523 0 0 10748 1523 12271 2133
E01 GM5 0 0 13518 0 0 12481 1037 13518 0 0 3979 E01 GM5 0 0 13518 0 0 12481 1037 13518 0 0 3979
E01 60400 12481 1037 0 0 12481 1037 13518 2133 E01 60400 12481 1037 0 0 12481 1037 13518 2133
F01 GM6 0 0 10542 0 0 9441 1 101 10542 0 0 3979 F01 GM6 0 0 10542 0 0 9441 1 101 10542 0 0 3979
F01 53200 9441 1 101 0 0 9441 1 101 10542 2133 F01 53200 9441 1 101 0 0 9441 1 101 10542 2133
G01 GM7 7.8 4 121 16 2 2 8646 3470 12120 0.00026 0.026 3979 G01 GM7 7.8 4 121 16 2 2 8646 3470 12120 0.00026 0.026 3979
G01 29420 8648 3472 2 2 8646 3470 12120 2133 G01 29420 8648 3472 2 2 8646 3470 12120 2133
H01 GM8 3.8 2 12457 1 1 1 1087 1370 12459 7,00E-05 0.007 3979 H01 GM8 3.8 2 12457 1 1 1 1087 1370 12459 7.00E-05 0.007 3979
H01 52000 1 1088 1371 1 1 1 1087 1370 12459 2133 H01 52000 1 1088 1371 1 1 1 1087 1370 12459 2133
A02 GM9 0 0 12452 0 0 10674 1778 12452 0 0 3979 A02 GM9 0 0 12452 0 0 10674 1778 12452 0 0 3979
A02 45800 10674 1778 0 0 10674 1778 12452 2133 A02 45800 10674 1778 0 0 10674 1778 12452 2133
B02 GM10 0 0 12588 0 0 1 1275 1313 12588 0 0 3979 B02 GM10 0 0 12588 0 0 1 1275 1313 12588 0 0 3979
B02 53200 1 1275 1313 0 0 1 1275 1313 12588 2133 B02 53200 1 1275 1313 0 0 1 1275 1313 12588 2133
C02 GM1 1 0 0 12385 0 0 1 1 107 1278 12385 0 0 3979 C02 GM1 1 0 0 12385 0 0 1 1 107 1278 12385 0 0 3979
C02 53400 1 1 107 1278 0 0 1 1 107 1278 12385 2133 C02 53400 1 1 107 1278 0 0 1 1 107 1278 12385 2133
D02 GM12 5.6 3 12540 2 1 10747 1793 12543 0.00012 0.012 3979 D02 GM12 5.6 3 12540 2 1 10747 1793 12543 0.00012 0.012 3979
D02 45800 10749 1794 2 1 10747 1793 12543 2133 D02 45800 10749 1794 2 1 10747 1793 12543 2133
E02 GM13 0 0 1 1600 0 0 10610 990 1 1600 0 0 3979 E02 GM13 0 0 1 1600 0 0 10610 990 1 1600 0 0 3979
E02 58000 10610 990 0 0 10610 990 1 1600 2133
E02 58000 10610 990 0 0 10610 990 1 1600 2133
F02 GM14 19.2 10 12310 6 4 8428 3882 12320 0.0007 0.07 3979F02 GM14 19.2 10 12310 6 4 8428 3882 12320 0.0007 0.07 3979
F02 27140 8434 3886 6 4 8428 3882 12320 2133F02 27140 8434 3886 6 4 8428 3882 12320 2133
G02 GM15 9.8 5 12025 4 1 9614 241 1 12030 0.00026 0.026 3979G02 GM15 9.8 5 12025 4 1 9614 241 1 12030 0.00026 0.026 3979
G02 37820 9618 2412 4 1 9614 241 1 12030 2133G02 37820 9618 2412 4 1 9614 241 1 12030 2133
H02 GM16 1.6 1 13960 1 0 12996 964 13961 2.7E-05 0.0027 3979H02 GM16 1.6 1 13960 1 0 12996 964 13961 2.7E-05 0.0027 3979
H02 62800 12997 964 1 0 12996 964 13961 2133H02 62800 12997 964 1 0 12996 964 13961 2133
A03 GM17 13.2 7 12464 5 2 9108 3356 12471 0.00043 0.043 3979A03 GM17 13.2 7 12464 5 2 9108 3356 12471 0.00043 0.043 3979
A03 30880 91 13 3358 5 2 9108 3356 12471 2133A03 30880 91 13 3358 5 2 9108 3356 12471 2133
B03 GM18 3.8 2 12154 0 2 6479 5675 12156 0.00022 0.022 3979B03 GM18 3.8 2 12154 0 2 6479 5675 12156 0.00022 0.022 3979
B03 17920 6479 5677 0 2 6479 5675 12156 2133B03 17920 6479 5677 0 2 6479 5675 12156 2133
C03 GM19 1.8 1 12487 0 1 7424 5063 12488 9,00E-05 0.009 3979C03 GM19 1.8 1 12487 0 1 7424 5063 12488 9,00E-05 0.009 3979
C03 21240 7424 5064 0 1 7424 5063 12488 2133C03 21240 7424 5064 0 1 7424 5063 12488 2133
D03 GM20 0 0 14041 0 0 1 1809 2232 14041 0 0 3979D03 GM20 0 0 14041 0 0 1 1809 2232 14041 0 0 3979
D03 43280 1 1809 2232 0 0 1 1809 2232 14041 2133D03 43280 1 1809 2232 0 0 1 1809 2232 14041 2133
E03 ddNTC 0 0 1 1889 0 0 2 1 1887 1 1889 0 0 3979E03 ddNTC 0 0 1 1889 0 0 2 1 1887 1 1889 0 0 3979
E03 4 2 1 1887 0 0 2 1 1887 1 1889 2133E03 4 2 1 1887 0 0 2 1 1887 1 1889 2133
F03 ddNTC 0 0 13770 0 0 1 13769 13770 0 0 3979F03 ddNTC 0 0 13770 0 0 1 13769 13770 0 0 3979
F03 1.8 1 13769 0 0 1 13769 13770 2133F03 1.8 1 13769 0 0 1 13769 13770 2133
G03 ddNTC 0 0 12580 0 0 1 1 12569 12580 0 0 3979G03 ddNTC 0 0 12580 0 0 1 1 12569 12580 0 0 3979
G03 20 1 1 12569 0 0 1 1 12569 12580 2133G03 20 1 1 12569 0 0 1 1 12569 12580 2133
H03 ddNTC 0 0 12067 0 0 4 12063 12067 0 0 3979H03 ddNTC 0 0 12067 0 0 4 12063 12067 0 0 3979
H03 7.8 4 12063 0 0 4 12063 12067 2133H03 7.8 4 12063 0 0 4 12063 12067 2133
A04 PPCal 9.8 5 1 1906 3 2 8509 3397 1 191 1 0.00033 0.033 3979A04 PPCal 9.8 5 1 1906 3 2 8509 3397 1 191 1 0.00033 0.033 3979
A04 29500 8512 3399 3 2 8509 3397 1 191 1 2133A04 29500 8512 3399 3 2 8509 3397 1 191 1 2133
B04 PPCa2 2 1 12218 0 1 6498 5720 12219 0.0001 1 0.01 1 3979B04 PPCa2 2 1 12218 0 1 6498 5720 12219 0.0001 1 0.01 1 3979
B04 17860 6498 5721 0 1 6498 5720 12219 2133B04 17860 6498 5721 0 1 6498 5720 12219 2133
C04 PPCa3 2580 1356 1 1727 389 967 2516 921 1 13083 0.436 30.4 3979C04 PPCa3 2580 1356 1 1727 389 967 2516 921 1 13083 0.436 30.4 3979
C04 5900 2905 10178 389 967 2516 921 1 13083 2133C04 5900 2905 10178 389 967 2516 921 1 13083 2133
D04 PPCa4 696 380 12663 1 10 270 7269 5394 13043 0.0354 3.42 3979D04 PPCa4 696 380 12663 1 10 270 7269 5394 13043 0.0354 3.42 3979
D04 19620 7379 5664 1 10 270 7269 5394 13043 2133D04 19620 7379 5664 1 10 270 7269 5394 13043 2133
E04 PPCa5 2.6 1 8926 1 0 4 8922 8927 0 0 3979E04 PPCa5 2.6 1 8926 1 0 4 8922 8927 0 0 3979
E04 14 5 8922 1 0 4 8922 8927 2133E04 14 5 8922 1 0 4 8922 8927 2133
F04 PPCa6 0 0 13126 0 0 1 1605 1521 13126 0 0 3979F04 PPCa6 0 0 13126 0 0 1 1605 1521 13126 0 0 3979
F04 50800 1 1605 1521 0 0 1 1605 1521 13126 2133
F04 50800 1 1605 1521 0 0 1 1605 1521 13126 2133
G04 PPCa7 76 40 12261 32 8 7991 4270 12301 0.0031 0.31 3979G04 PPCa7 76 40 12261 32 8 7991 4270 12301 0.0031 0.31 3979
G04 24860 8023 4278 32 8 7991 4270 12301 2133G04 24860 8023 4278 32 8 7991 4270 12301 2133
H04 PPCa8 226 1 18 12178 96 22 7170 5008 12296 0.0108 1.07 3979H04 PPCa8 226 1 18 12178 96 22 7170 5008 12296 0.0108 1.07 3979
H04 21040 7266 5030 96 22 7170 5008 12296 2133H04 21040 7266 5030 96 22 7170 5008 12296 2133
A05 PPCa9 1 1.4 6 12345 4 2 8044 4301 12351 0.00046 0.046 3979A05 PPCa9 1 1.4 6 12345 4 2 8044 4301 12351 0.00046 0.046 3979
A05 24800 8048 4303 4 2 8044 4301 12351 2133A05 24800 8048 4303 4 2 8044 4301 12351 2133
B05 PPCal O 5 3 13879 0 3 7226 6653 13882 0.00029 0.029 3979B05 PPCal O 5 3 13879 0 3 7226 6653 13882 0.00029 0.029 3979
B05 17300 7226 6656 0 3 7226 6653 13882 2133B05 17300 7226 6656 0 3 7226 6653 13882 2133
C05 PPCa1 1 0 0 13220 0 0 7999 5221 13220 0 0 3979C05 PPCa1 1 0 0 13220 0 0 7999 5221 13220 0 0 3979
C05 21860 7999 5221 0 0 7999 5221 13220 2133C05 21860 7999 5221 0 0 7999 5221 13220 2133
D05 PPCa12 3.8 2 12680 1 1 9583 3097 12682 0.0001 1 0.01 1 3979D05 PPCa12 3.8 2 12680 1 1 9583 3097 12682 0.0001 1 0.01 1 3979
D05 33160 9584 3098 1 1 9583 3097 12682 2133D05 33160 9584 3098 1 1 9583 3097 12682 2133
E05 PPCa13 26 16 14337 0 16 4798 9539 14353 0.0027 0.27 3979E05 PPCa13 26 16 14337 0 16 4798 9539 14353 0.0027 0.27 3979
E05 9580 4798 9555 0 16 4798 9539 14353 2133E05 9580 4798 9555 0 16 4798 9539 14353 2133
F05 PPCa14 3.6 2 13179 0 2 7233 5946 13181 0.00019 0.019 3979F05 PPCa14 3.6 2 13179 0 2 7233 5946 13181 0.00019 0.019 3979
F05 18720 7233 5948 0 2 7233 5946 13181 2133F05 18720 7233 5948 0 2 7233 5946 13181 2133
G05 PPCa15 210 100 1 1 137 9 91 4348 6789 1 1237 0.0182 1.79 3979G05 PPCa15 210 100 1 1 137 9 91 4348 6789 1 1237 0.0182 1.79 3979
G05 1 1540 4357 6880 9 91 4348 6789 1 1237 2133G05 1 1540 4357 6880 9 91 4348 6789 1 1237 2133
H05 PPCa16 9 5 12963 3 2 8580 4383 12968 0.00036 0.036 3979H05 PPCa16 9 5 12963 3 2 8580 4383 12968 0.00036 0.036 3979
H05 25520 8583 4385 3 2 8580 4383 12968 2133H05 25520 8583 4385 3 2 8580 4383 12968 2133
A06 PPCa17 316 202 14943 101 101 6978 7965 15145 0.0213 2.09 3979A06 PPCa17 316 202 14943 101 101 6978 7965 15145 0.0213 2.09 3979
A06 14820 7079 8066 101 101 6978 7965 15145 2133A06 14820 7079 8066 101 101 6978 7965 15145 2133
B06 PPCa18 8.6 5 13773 3 2 5824 7949 13778 0.0007 0.07 3979B06 PPCa18 8.6 5 13773 3 2 5824 7949 13778 0.0007 0.07 3979
B06 12940 5827 7951 3 2 5824 7949 13778 2133B06 12940 5827 7951 3 2 5824 7949 13778 2133
C06 PPCa19 7.4 4 12673 0 4 4727 7946 12677 0.0007 0.07 3979C06 PPCa19 7.4 4 12673 0 4 4727 7946 12677 0.0007 0.07 3979
C06 10980 4727 7950 0 4 4727 7946 12677 2133C06 10980 4727 7950 0 4 4727 7946 12677 2133
D06 PPCa20 24 14 13839 0 14 4895 8944 13853 0.0023 0.23 3979D06 PPCa20 24 14 13839 0 14 4895 8944 13853 0.0023 0.23 3979
D06 10260 4895 8958 0 14 4895 8944 13853 2133 gDNA D06 10260 4895 8958 0 14 4895 8944 13853 2133 gDNA
E06 14.6 8 12975 0 8 879 12096 12983 0.009 0.9 3979 E06 14.6 8 12975 0 8 879 12096 12983 0.009 0.9 3979
15 15
E06 1640 879 12104 0 8 879 12096 12983 2133 E06 1640 879 12104 0 8 879 12096 12983 2133
F06 NTC 15 0 0 13676 0 0 53 13623 13676 0 0 3979F06 NTC 15 0 0 13676 0 0 53 13623 13676 0 0 3979
F06 92 53 13623 0 0 53 13623 13676 2133
F06 92 53 13623 0 0 53 13623 13676 2133
Tabelle 14: FAM-Signale (methylierte GSTPf-DNA-Fragmente) und HEX-Signale (nicht-methylierte GSTPf-DNA-Fragmente) in Serumproben gesunder Probandinnen (GF1 -GF20) und Serumproben von Patientinnen mit Mammakarzinom (MF1 -MF20) und Non-Template-Kontrolle (NTC, ohne DNA bzw. genomische DNA ohne Bisulfitumwandlung) nach 15 Zyklen in der BBPA mit dem GSTP1 -1 16bp-Primern (SEQ ID: 93 und 94) und 4,5 mM MgCI2-Konzentration bei 53,8°C und anschließender dPCR. Cut-off-W ert < 0,023%; Rohdaten zur Fig. 56. Table 14: FAM signals (methylated GSTPf DNA fragments) and HEX signals (non-methylated GSTPf DNA fragments) in serum samples from healthy volunteers (GF1 -GF20) and serum samples from patients with breast cancer (MF1-MF20) and Non Template control (NTC, without DNA or genomic DNA without bisulfite conversion) after 15 cycles in the BBPA with the GSTP1-1 16bp primers (SEQ ID: 93 and 94) and 4.5 mM MgCl 2 concentration at 53, 8 ° C and subsequent dPCR. Cut-off value <0.023%; Raw data for FIG. 56.
Ch1 + Ch1 + Tröpfchen¬Ch1 + Ch1 + droplets
Pos. Probe Kopien/20pL Positiv Negativ Ch1-Ch2+ Ch1-Ch2- Ratio Frakt. Häufigkeit Grenzwert Pos. Sample Copies / 20pL Positive Negative Ch1-Ch2 + Ch1-Ch2 Ratio Fracture Frequency Threshold
Ch2+ Ch2- anzahl Ch2 + Ch2 number
A01 GM1 1.4 1 15767 0 1 7390 8377 15768 0.0001 0.01 2927 A01 GM1 1.4 1 15767 0 1 7390 8377 15768 0.0001 0.01 2927
A01 14880 7390 8378 0 1 7390 8377 15768 1705 A01 14880 7390 8378 0 1 7390 8377 15768 1705
B01 GM2 0 0 14360 0 0 2251 12109 14360 0 0 2927 B01 GM2 0 0 14360 0 0 2251 12109 14360 0 0 2927
B01 4020 2251 12109 0 0 2251 12109 14360 1705 B01 4020 2251 12109 0 0 2251 12109 14360 1705
C01 GM3 0 0 14640 0 0 6362 8278 14640 0 0 2927 C01 GM3 0 0 14640 0 0 6362 8278 14640 0 0 2927
C01 13420 6362 8278 0 0 6362 8278 14640 1705 C01 13420 6362 8278 0 0 6362 8278 14640 1705
D01 GM4 0 0 14771 0 0 10267 4504 14771 0 0 2927 D01 GM4 0 0 14771 0 0 10267 4504 14771 0 0 2927
D01 27940 10267 4504 0 0 10267 4504 14771 1705 D01 27940 10267 4504 0 0 10267 4504 14771 1705
E01 GM5 0 0 14872 0 0 1 1 131 3741 14872 0 0 2927 E01 GM5 0 0 14872 0 0 1 1 131 3741 14872 0 0 2927
E01 32480 1 1 131 3741 0 0 1 1 131 3741 14872 1705 E01 32480 1 1 131 3741 0 0 1 1 131 3741 14872 1705
F01 GM6 1.8 1 13135 0 1 7488 5647 13136 9,00E-05 0.009 2927 F01 GM6 1.8 1 13135 0 1 7488 5647 13136 9,00E-05 0.009 2927
F01 19860 7488 5648 0 1 7488 5647 13136 1705 F01 19860 7488 5648 0 1 7488 5647 13136 1705
G01 GM7 0 0 13798 0 0 3363 10435 13798 0 0 2927 G01 GM7 0 0 13798 0 0 3363 10435 13798 0 0 2927
G01 6580 3363 10435 0 0 3363 10435 13798 1705 G01 6580 3363 10435 0 0 3363 10435 13798 1705
H01 GM8 0 0 13949 0 0 4887 9062 13949 0 0 2927 H01 GM8 0 0 13949 0 0 4887 9062 13949 0 0 2927
H01 10140 4887 9062 0 0 4887 9062 13949 1705 H01 10140 4887 9062 0 0 4887 9062 13949 1705
A02 GM9 0 0 12667 0 0 6686 5981 12667 0 0 2927 A02 GM9 0 0 12667 0 0 6686 5981 12667 0 0 2927
A02 17660 6686 5981 0 0 6686 5981 12667 1705 A02 17660 6686 5981 0 0 6686 5981 12667 1705
B02 GM10 0 0 13982 0 0 10312 3670 13982 0 0 2927 B02 GM10 0 0 13982 0 0 10312 3670 13982 0 0 2927
B02 31480 10312 3670 0 0 10312 3670 13982 1705 B02 31480 10312 3670 0 0 10312 3670 13982 1705
C02 GM1 1 2 1 12293 1 0 3608 8685 12294 0.00023 0.023 2927 C02 GM1 1 2 1 12293 1 0 3608 8685 12294 0.00023 0.023 2927
C02 8180 3609 8685 1 0 3608 8685 12294 1705 C02 8180 3609 8685 1 0 3608 8685 12294 1705
D02 GM12 0 0 13369 0 0 3709 9660 13369 0 0 2927 D02 GM12 0 0 13369 0 0 3709 9660 13369 0 0 2927
D02 7640 3709 9660 0 0 3709 9660 13369 1705
D02 7640 3709 9660 0 0 3709 9660 13369 1705
Tabelle 15: FAM-Signale (methylierte SE/?P//VE7-DNA-Fragmente) und HEX-Signale (nicht-methylierte SE/?P//VE7-DNA-Fragmente) in Serumproben gesunder Probandinnen (GF1 -GF20) und Serumproben von Patientinnen mit Mammakarzinom (MF1 -MF20) und Non-Template- Kontrolle (NTC, ohne DNA bzw. genomische DNA ohne Bisulfitumwandlung) nach 15 Zyklen in der BBPA mit dem S£RP//V£7-123bp-Primern (SEQ ID: 16 und 17) und 3,5 mM MgCI2-Konzentration bei 52,0°C und anschließender dPCR. Ctvi-off-Wert: < 25,9%. Rohdaten zur Fig. 57. Table 15: FAM signals (methylated SE /? P // VE7 DNA fragments) and HEX signals (unmethylated SE /? P // VE7 DNA fragments) in serum samples from healthy volunteers (GF1 -GF20) and Serum samples from patients with breast carcinoma (MF1-MF20) and non-template control (NTC, without DNA or genomic DNA without bisulfite conversion) after 15 cycles in the BBPA with the SRPVV7-123bp primers (SEQ ID: 16 and 17) and 3.5 mM MgCl 2 concentration at 52.0 ° C followed by dPCR. Ctvi-off value: <25.9%. Raw data for FIG. 57.
Ch1 + Ch1 + Ch1- Tröpfchen¬Ch1 + Ch1 + Ch1 droplets
Pos. Probe Κορίβη/20μΙ_ Positiv Negativ Ch1-Ch2- Ratio Frakt. Häufigkeit Grenzwert Pos. Sample Κορίβη / 20μΙ_ Positive Negative Ch1-Ch2 Ratio Fract. Frequency Threshold
Ch2+ Ch2- Ch2+ anzahl Ch2 + Ch2- Ch2 + number
A01 GM1 20 12 14245 4 8 1 132 131 13 14257 0.01 1 3576 A01 GM1 20 12 14245 4 8 1 132 131 13 14257 0.01 1 3576
A01 1960 1 136 13121 4 8 1 132 131 13 14257 3908 A01 1960 1 136 13121 4 8 1 132 131 13 14257 3908
B01 GM2 2 1 121 14 0 1 487 1 1627 121 15 0.002 0.2 3576 B01 GM2 2 1 121 14 0 1 487 1 1627 121 15 0.002 0.2 3576
B01 966 487 1 1628 0 1 487 1 1627 121 15 3908 B01 966 487 1 1628 0 1 487 1 1627 121 15 3908
C01 GM3 24 15 14517 3 12 1088 13429 14532 0.013 1.3 3576 C01 GM3 24 15 14517 3 12 1088 13429 14532 0.013 1.3 3576
C01 1840 1091 13441 3 12 1088 13429 14532 3908 C01 1840 1091 13441 3 12 1088 13429 14532 3908
D01 GM4 210 102 1 1324 10 92 1724 9600 1 1426 0.054 5.2 3576 D01 GM4 210 102 1 1324 10 92 1724 9600 1 1426 0.054 5.2 3576
D01 3880 1734 9692 10 92 1724 9600 1 1426 3908 D01 3880 1734 9692 10 92 1724 9600 1 1426 3908
E01 GM5 18 1 1 14493 2 9 3160 1 1333 14504 0.0031 0.31 3576 E01 GM5 18 1 1 14493 2 9 3160 1 1333 14504 0.0031 0.31 3576
E01 5780 3162 1 1342 2 9 3160 1 1333 14504 3908 E01 5780 3162 1 1342 2 9 3160 1 1333 14504 3908
F01 GM6 766 487 14709 36 451 1940 12769 15196 0.234 19 3576 F01 GM6 766 487 14709 36 451 1940 12769 15196 0.234 19 3576
F01 3280 1976 13220 36 451 1940 12769 15196 3908 F01 3280 1976 13220 36 451 1940 12769 15196 3908
G01 GM7 86 52 14280 0 52 455 13825 14332 0.1 13 10.1 3576 G01 GM7 86 52 14280 0 52 455 13825 14332 0.1 13 10.1 3576
G01 760 455 13877 0 52 455 13825 14332 3908 G01 760 455 13877 0 52 455 13825 14332 3908
H01 GM8 966 562 13412 51 51 1 1501 1 191 1 13974 0.349 25.9 3576 H01 GM8 966 562 13412 51 51 1 1501 1 191 1 13974 0.349 25.9 3576
H01 2780 1552 12422 51 51 1 1501 1 191 1 13974 3908 H01 2780 1552 12422 51 51 1 1501 1 191 1 13974 3908
A02 GM9 14 1 1724 0 1 0 1724 1725 0 0 3576 A02 GM9 14 1 1724 0 1 0 1724 1725 0 0 3576
A02 0 0 1725 0 1 0 1724 1725 3908 A02 0 0 1725 0 1 0 1724 1725 3908
B02 GM10 50 25 1 1855 4 21 2835 9020 1 1880 0.0077 0.77 3576 B02 GM10 50 25 1 1855 4 21 2835 9020 1 1880 0.0077 0.77 3576
B02 6420 2839 9041 4 21 2835 9020 1 1880 3908 B02 6420 2839 9041 4 21 2835 9020 1 1880 3908
C02 GM1 1 5.2 3 13687 1 2 1253 12434 13690 0.0023 0.23 3576 C02 GM1 1 5.2 3 13687 1 2 1253 12434 13690 0.0023 0.23 3576
C02 2260 1254 12436 1 2 1253 12434 13690 3908 C02 2260 1254 12436 1 2 1253 12434 13690 3908
D02 GM12 552 305 12830 43 262 851 1 1979 13135 0.333 25 3576
D02 GM12 552 305 12830 43 262 851 1 1979 13135 0.333 25 3576
D02 1660 894 12241 43 262 851 1 1979 13135 3908D02 1660 894 12241 43 262 851 1 1979 13135 3908
E02 GM13 102 58 13391 4 54 2469 10922 13449 0.021 2.1 3576E02 GM13 102 58 13391 4 54 2469 10922 13449 0.021 2.1 3576
E02 4780 2473 10976 4 54 2469 10922 13449 3908E02 4780 2473 10976 4 54 2469 10922 13449 3908
F02 GM14 304 140 10770 3 137 718 10052 10910 0.189 15.9 3576F02 GM14 304 140 10770 3 137 718 10052 10910 0.189 15.9 3576
F02 1600 721 10189 3 137 718 10052 10910 3908F02 1600 721 10189 3 137 718 10052 10910 3908
G02 GM15 10.4 6 13536 1 5 589 12947 13542 0.01 1 3576G02 GM15 10.4 6 13536 1 5 589 12947 13542 0.01 1 3576
G02 1048 590 12952 1 5 589 12947 13542 3908G02 1048 590 12952 1 5 589 12947 13542 3908
H02 GM16 10.4 6 13557 2 4 1605 1 1952 13563 0.0035 0.35 3576H02 GM16 10.4 6 13557 2 4 1605 1 1952 13563 0.0035 0.35 3576
H02 2960 1607 1 1956 2 4 1605 1 1952 13563 3908H02 2960 1607 1 1956 2 4 1605 1 1952 13563 3908
A03 GM17 3.8 2 12274 0 2 287 1 1987 12276 0.007 0.7 3576A03 GM17 3.8 2 12274 0 2 287 1 1987 12276 0.007 0.7 3576
A03 556 287 1 1989 0 2 287 1 1987 12276 3908A03 556 287 1 1989 0 2 287 1 1987 12276 3908
B03 GM18 0 0 12516 0 0 530 1 1986 12516 0 0 3576B03 GM18 0 0 12516 0 0 530 1 1986 12516 0 0 3576
B03 1018 530 1 1986 0 0 530 1 1986 12516 3908B03 1018 530 1 1986 0 0 530 1 1986 12516 3908
C03 GM19 36 24 15274 4 20 1 133 14141 15298 0.02 2 3576C03 GM19 36 24 15274 4 20 1 133 14141 15298 0.02 2 3576
C03 1820 1 137 14161 4 20 1 133 14141 15298 3908C03 1820 1 137 14161 4 20 1 133 14141 15298 3908
D03 GM20 10.4 6 13578 2 4 3671 9907 13584 0.0014 0.14 3576D03 GM20 10.4 6 13578 2 4 3671 9907 13584 0.0014 0.14 3576
D03 7420 3673 991 1 2 4 3671 9907 13584 3908D03 7420 3673 991 1 2 4 3671 9907 13584 3908
A04 PPCal 48 24 1 1619 4 20 327 1 1292 1 1643 0.072 6.7 3576A04 PPCal 48 24 1 1619 4 20 327 1 1292 1 1643 0.072 6.7 3576
A04 678 331 1 1312 4 20 327 1 1292 1 1643 3908A04 678 331 1 1312 4 20 327 1 1292 1 1643 3908
B04 PPCa2 8.4 5 14014 0 5 383 13631 14019 0.013 1.3 3576B04 PPCa2 8.4 5 14014 0 5 383 13631 14019 0.013 1.3 3576
B04 652 383 13636 0 5 383 13631 14019 3908B04 652 383 13636 0 5 383 13631 14019 3908
C04 PPCa3 6440 3173 10077 283 2890 1916 8161 13250 1.51 60.1 3576C04 PPCa3 6440 3173 10077 283 2890 1916 8161 13250 1.51 60.1 3576
C04 4280 2199 1 1051 283 2890 1916 8161 13250 3908C04 4280 2199 1 1051 283 2890 1916 8161 13250 3908
D04 PPCa4 910 540 13698 0 540 158 13540 14238 3.5 77.6 3576D04 PPCa4 910 540 13698 0 540 158 13540 14238 3.5 77.6 3576
D04 262 158 14080 0 540 158 13540 14238 3908D04 262 158 14080 0 540 158 13540 14238 3908
E04 PPCa5 28 14 1 1907 0 14 257 1 1650 1 1921 0.054 5.1 3576E04 PPCa5 28 14 1 1907 0 14 257 1 1650 1 1921 0.054 5.1 3576
E04 512 257 1 1664 0 14 257 1 1650 1 1921 3908E04 512 257 1 1664 0 14 257 1 1650 1 1921 3908
F04 PPCa6 314 166 12345 15 151 2808 9537 1251 1 0.052 5 3576F04 PPCa6 314 166 12345 15 151 2808 9537 1251 1 0.052 5 3576
F04 6020 2823 9688 15 151 2808 9537 1251 1 3908F04 6020 2823 9688 15 151 2808 9537 1251 1 3908
G04 PPCa7 1560 859 12602 38 821 1295 1 1307 13461 0.63 38.7 3576G04 PPCa7 1560 859 12602 38 821 1295 1 1307 13461 0.63 38.7 3576
G04 2460 1333 12128 38 821 1295 1 1307 13461 3908G04 2460 1333 12128 38 821 1295 1 1307 13461 3908
H04 PPCa8 2060 1070 1 1694 131 939 2340 9354 12764 0.407 28.9 3576H04 PPCa8 2060 1070 1 1694 131 939 2340 9354 12764 0.407 28.9 3576
H04 5060 2471 10293 131 939 2340 9354 12764 3908H04 5060 2471 10293 131 939 2340 9354 12764 3908
A05 PPCa9 44 25 13399 1 24 1095 12304 13424 0.022 2.1 3576
A05 PPCa9 44 25 13399 1 24 1095 12304 13424 0.022 2.1 3576
A05 2000 1096 12328 1 24 1095 12304 13424 3908A05 2000 1096 12328 1 24 1095 12304 13424 3908
B05 PPCal O 9.8 5 12050 0 5 406 1 1644 12055 0.012 1.2 3576B05 PPCal O 9.8 5 12050 0 5 406 1 1644 12055 0.012 1.2 3576
B05 806 406 1 1649 0 5 406 1 1644 12055 3908B05 806 406 1 1649 0 5 406 1 1644 12055 3908
C05 PPCa1 1 4320 2523 12518 642 1881 3607 891 1 15041 0.553 35.6 3576C05 PPCa1 1 4320 2523 12518 642 1881 3607 891 1 15041 0.553 35.6 3576
C05 7820 4249 10792 642 1881 3607 891 1 15041 3908C05 7820 4249 10792 642 1881 3607 891 1 15041 3908
D05 PPCa12 758 509 15556 10 499 1073 14483 16065 0.461 31.6 3576D05 PPCa12 758 509 15556 10 499 1073 14483 16065 0.461 31.6 3576
D05 1642 1083 14982 10 499 1073 14483 16065 3908D05 1642 1083 14982 10 499 1073 14483 16065 3908
E05 PPCa13 256 155 14213 3 152 559 13654 14368 0.272 21.4 3576E05 PPCa13 256 155 14213 3 152 559 13654 14368 0.272 21.4 3576
E05 938 562 13806 3 152 559 13654 14368 3908E05 938 562 13806 3 152 559 13654 14368 3908
F05 PPCa14 624 394 14667 21 373 2408 12259 15061 0.151 13.1 3576F05 PPCa14 624 394 14667 21 373 2408 12259 15061 0.151 13.1 3576
F05 4140 2429 12632 21 373 2408 12259 15061 3908F05 4140 2429 12632 21 373 2408 12259 15061 3908
G05 PPCa15 50 29 13505 1 28 313 13192 13534 0.091 8.4 3576G05 PPCa15 50 29 13505 1 28 313 13192 13534 0.091 8.4 3576
G05 552 314 13220 1 28 313 13192 13534 3908G05 552 314 13220 1 28 313 13192 13534 3908
H05 PPCa16 8.6 5 13566 0 5 1356 12210 13571 0.0035 0.35 3576H05 PPCa16 8.6 5 13566 0 5 1356 12210 13571 0.0035 0.35 3576
H05 2480 1356 12215 0 5 1356 12210 13571 3908H05 2480 1356 12215 0 5 1356 12210 13571 3908
A06 PPCa17 68 39 13523 0 39 135 13388 13562 0.29 22 3576A06 PPCa17 68 39 13523 0 39 135 13388 13562 0.29 22 3576
A06 236 135 13427 0 39 135 13388 13562 3908A06 236 135 13427 0 39 135 13388 13562 3908
B06 PPCa18 0 0 12779 0 0 782 1 1997 12779 0 0 3576B06 PPCa18 0 0 12779 0 0 782 1 1997 12779 0 0 3576
B06 1480 782 1 1997 0 0 782 1 1997 12779 3908B06 1480 782 1 1997 0 0 782 1 1997 12779 3908
C06 PPCa19 0 0 14452 0 0 350 14102 14452 0 0 3576C06 PPCa19 0 0 14452 0 0 350 14102 14452 0 0 3576
C06 576 350 14102 0 0 350 14102 14452 3908C06 576 350 14102 0 0 350 14102 14452 3908
D06 PPCa20 24 14 13202 0 14 226 12976 13216 0.061 5.8 3576D06 PPCa20 24 14 13202 0 14 226 12976 13216 0.061 5.8 3576
D06 406 226 12990 0 14 226 12976 13216 3908D06 406 226 12990 0 14 226 12976 13216 3908
E03 15 gNTC 3.4 2 13554 0 2 16 13538 13556 0.12 1 1 3576E03 15 gNTC 3.4 2 13554 0 2 16 13538 13556 0.12 1 1 3576
E03 28 16 13540 0 2 16 13538 13556 3908E03 28 16 13540 0 2 16 13538 13556 3908
F03 15 NTC 8.8 6 161 14 1 5 35 16079 16120 0.17 14 3576F03 15 NTC 8.8 6 161 14 1 5 35 16079 16120 0.17 14 3576
F03 52 36 16084 1 5 35 16079 16120 3908
F03 52 36 16084 1 5 35 16079 16120 3908
Tabelle 16: FAM-Signale (methylierte SE/?P//VE7-DNA-Fragmente) und HEX-Signale (nicht-methylierte SE/?P//VE7-DNA-Fragmente) in Serumproben gesunder Probandinnen (GF1 -GF20) und Serumproben von Patientinnen mit Mammakarzinom (MF1 -MF20) und Non-Template- Kontrolle (NTC, ohne DNA bzw. genomische DNA ohne Bisulfitumwandlung) nach 50 Zyklen in der BBPA mit dem S£RP//V£7-123bp-Primern (SEQ ID: 16 und 17) und 3,5 mM MgCI2-Konzentration bei 52,0°C und anschließender dPCR. Ct/i-off-Wert: < 0,0012%, n.d.: nicht bestimmbar, da nicht-methylierte DNA-Fragmentanteil zu gering war. Rohdaten zur Fig. 58. Table 16: FAM signals (methylated SE /? P // VE7 DNA fragments) and HEX signals (unmethylated SE /? P // VE7 DNA fragments) in serum samples from healthy volunteers (GF1 -GF20) and Serum samples from patients with breast carcinoma (MF1-MF20) and non-template control (NTC, without DNA or genomic DNA without bisulfite conversion) after 50 cycles in the BBPA with the SRPVV7-123bp primers (SEQ ID: 16 and 17) and 3.5 mM MgCl 2 concentration at 52.0 ° C followed by dPCR. Ct / i-off value: <0.0012%, nd: not determinable since non-methylated DNA fragment content was too low. Raw data for FIG. 58.
Ch1 + Ch1 + Ch1- Ch1- Tröpfchen¬Ch1 + Ch1 + Ch1-Ch1 droplets
Pos. Probe Κορίβη/20μΙ_ Positiv Negativ Ratio Frakt. Häufigkeit Grenzwert Pos. Sample Κορίβη / 20μΙ_ Positive Negative Ratio Fracture Frequency Threshold
Ch2+ Ch2- Ch2+ Ch2- anzahl Ch2 + Ch2- Ch2 + Ch2- number
A07 GM1 0 0 1 1322 0 0 1 1002 320 1 1322 0 0 3508 A07 GM1 0 0 1 1322 0 0 1 1002 320 1 1322 0 0 3508
A07 84000 1 1002 320 0 0 1 1002 320 1 1322 3780 A07 84000 1 1002 320 0 0 1 1002 320 1 1322 3780
B07 GM2 0 0 1 1951 0 0 9517 2434 1 1951 0 0 3508 B07 GM2 0 0 1 1951 0 0 9517 2434 1 1951 0 0 3508
B07 37440 9517 2434 0 0 9517 2434 1 1951 3780 B07 37440 9517 2434 0 0 9517 2434 1 1951 3780
C07 GM3 0 0 14343 0 0 1 1625 2718 14343 0 0 3508 C07 GM3 0 0 14343 0 0 1 1625 2718 14343 0 0 3508
C07 39140 1 1625 2718 0 0 1 1625 2718 14343 3780 C07 39140 1 1625 2718 0 0 1 1625 2718 14343 3780
D07 GM4 0 0 10890 0 0 9128 1762 10890 0 0 3508 D07 GM4 0 0 10890 0 0 9128 1762 10890 0 0 3508
D07 42800 9128 1762 0 0 9128 1762 10890 3780 D07 42800 9128 1762 0 0 9128 1762 10890 3780
E07 GM5 0 0 14075 0 0 14057 18 14075 0 0 3508 E07 GM5 0 0 14075 0 0 14057 18 14075 0 0 3508
E07 156000 14057 18 0 0 14057 18 14075 3780 E07 156000 14057 18 0 0 14057 18 14075 3780
F07 GM6 0 0 13893 0 0 13305 588 13893 0 0 3508 F07 GM6 0 0 13893 0 0 13305 588 13893 0 0 3508
F07 74400 13305 588 0 0 13305 588 13893 3780 F07 74400 13305 588 0 0 13305 588 13893 3780
G07 GM7 0 0 16335 0 0 13 16322 16335 n.d. 3508 G07 GM7 0 0 16335 0 0 13 16322 16335 n.d. 3508
G07 18 13 16322 0 0 13 16322 16335 3780 G07 18 13 16322 0 0 13 16322 16335 3780
H07 GM8 0 0 12775 0 0 10756 2019 12775 0 0 3508 H07 GM8 0 0 12775 0 0 10756 2019 12775 0 0 3508
H07 43400 10756 2019 0 0 10756 2019 12775 3780 H07 43400 10756 2019 0 0 10756 2019 12775 3780
A08 GM9 0 0 13185 0 0 92 13093 13185 n.d. 3508 A08 GM9 0 0 13185 0 0 92 13093 13185 n.d. 3508
A08 164 92 13093 0 0 92 13093 13185 3780 A08 164 92 13093 0 0 92 13093 13185 3780
B08 GM10 0 0 14823 0 0 14755 68 14823 0 0 3508 B08 GM10 0 0 14823 0 0 14755 68 14823 0 0 3508
B08 126600 14755 68 0 0 14755 68 14823 3780 B08 126600 14755 68 0 0 14755 68 14823 3780
C08 GM1 1 1.6 1 14258 1 0 14206 52 14259 1.2E-05 0.0012 3508 C08 GM1 1 1.6 1 14258 1 0 14206 52 14259 1.2E-05 0.0012 3508
C08 132000 14207 52 1 0 14206 52 14259 3780
C08 132000 14207 52 1 0 14206 52 14259 3780
D08 GM12 1.6 1 14402 1 0 1 10 14292 14403 n.d. 3508D08 GM12 1.6 1 14402 1 0 1 10 14292 14403 n.d. 3508
D08 182 1 1 1 14292 1 0 1 10 14292 14403 3780D08 182 1 1 1 14292 1 0 1 10 14292 14403 3780
E08 GM13 0 0 15072 0 0 15067 5 15072 0 0 3508E08 GM13 0 0 15072 0 0 15067 5 15072 0 0 3508
E08 188000 15067 5 0 0 15067 5 15072 3780E08 188000 15067 5 0 0 15067 5 15072 3780
F08 GM14 0 0 12834 0 0 12596 238 12834 0 0 3508F08 GM14 0 0 12834 0 0 12596 238 12834 0 0 3508
F08 93800 12596 238 0 0 12596 238 12834 3780F08 93800 12596 238 0 0 12596 238 12834 3780
G08 GM15 0 0 15407 0 0 14642 765 15407 0 0 3508G08 GM15 0 0 15407 0 0 14642 765 15407 0 0 3508
G08 70600 14642 765 0 0 14642 765 15407 3780G08 70600 14642 765 0 0 14642 765 15407 3780
H08 GM16 0 0 14278 0 0 12857 1421 14278 0 0 3508H08 GM16 0 0 14278 0 0 12857 1421 14278 0 0 3508
H08 54200 12857 1421 0 0 12857 1421 14278 3780H08 54200 12857 1421 0 0 12857 1421 14278 3780
A09 GM17 0 0 12396 0 0 1546 10850 12396 0 0 3508A09 GM17 0 0 12396 0 0 1546 10850 12396 0 0 3508
A09 3140 1546 10850 0 0 1546 10850 12396 3780A09 3140 1546 10850 0 0 1546 10850 12396 3780
B09 GM18 0 0 16490 0 0 9336 7154 16490 0 0 3508B09 GM18 0 0 16490 0 0 9336 7154 16490 0 0 3508
B09 19640 9336 7154 0 0 9336 7154 16490 3780B09 19640 9336 7154 0 0 9336 7154 16490 3780
C09 GM19 0 0 16559 0 0 12271 4288 16559 0 0 3508C09 GM19 0 0 16559 0 0 12271 4288 16559 0 0 3508
C09 31800 12271 4288 0 0 12271 4288 16559 3780C09 31800 12271 4288 0 0 12271 4288 16559 3780
D09 GM20 0 0 15035 0 0 12902 2133 15035 0 0 3508D09 GM20 0 0 15035 0 0 12902 2133 15035 0 0 3508
D09 45940 12902 2133 0 0 12902 2133 15035 3780D09 45940 12902 2133 0 0 12902 2133 15035 3780
A10 PPCal 0 0 13235 0 0 9609 3626 13235 0 0 3508A10 PPCal 0 0 13235 0 0 9609 3626 13235 0 0 3508
A10 30460 9609 3626 0 0 9609 3626 13235 3780A10 30460 9609 3626 0 0 9609 3626 13235 3780
B10 PPCa2 1.6 1 13988 1 0 13495 493 13989 2.1 E-05 0.0021 3508B10 PPCa2 1.6 1 13988 1 0 13495 493 13989 2.1 E-05 0.0021 3508
B10 78800 13496 493 1 0 13495 493 13989 3780B10 78800 13496 493 1 0 13495 493 13989 3780
C10 PPCa3 20000000 14683 0 4147 10536 0 0 14683 2600 99.961 3508C10 PPCa3 20000000 14683 0 4147 10536 0 0 14683 2600 99.961 3508
C10 7800 4147 10536 4147 10536 0 0 14683 3780C10 7800 4147 10536 4147 10536 0 0 14683 3780
D10 PPCa4 20000000 15104 0 19 15085 0 0 15104 680000 100 3508D10 PPCa4 20000000 15104 0 19 15085 0 0 15104 680000 100 3508
D10 30 19 15085 19 15085 0 0 15104 3780D10 30 19 15085 19 15085 0 0 15104 3780
E10 PPCa5 30 18 14361 18 0 14335 26 14379 0.0002 0.02 3508E10 PPCa5 30 18 14361 18 0 14335 26 14379 0.0002 0.02 3508
E10 148600 14353 26 18 0 14335 26 14379 3780E10 148600 14353 26 18 0 14335 26 14379 3780
F10 PPCa6 1.6 1 14999 1 0 14951 48 15000 1.2E-05 0.0012 3508F10 PPCa6 1.6 1 14999 1 0 14951 48 15000 1.2E-05 0.0012 3508
F10 135200 14952 48 1 0 14951 48 15000 3780F10 135200 14952 48 1 0 14951 48 15000 3780
G10 PPCa7 135400 14833 47 1 1752 3081 1 46 14880 3.69 78.7 3508G10 PPCa7 135400 14833 47 1 1752 3081 1 46 14880 3.69 78.7 3508
G10 36700 1 1753 3127 1 1752 3081 1 46 14880 3780G10 36700 1 1753 3127 1 1752 3081 1 46 14880 3780
H10 PPCa8 56980 12597 1227 12556 41 1 1 15 1 12 13824 0.538 35 3508H10 PPCa8 56980 12597 1227 12556 41 1 1 15 1 12 13824 0.538 35 3508
H10 106000 13671 153 12556 41 1 1 15 1 12 13824 3780
H10 106000 13671 153 12556 41 1 1 15 1 12 13824 3780
A1 1 PPCa9 0 0 16071 0 0 15879 192 16071 0 0 3508A1 1 PPCa9 0 0 16071 0 0 15879 192 16071 0 0 3508
A1 1 104200 15879 192 0 0 15879 192 16071 3780A1 1 104200 15879 192 0 0 15879 192 16071 3780
B1 1 PPCal O 0 0 15132 0 0 14281 851 15132 0 0 3508B1 1 PPCal O 0 0 15132 0 0 14281 851 15132 0 0 3508
B1 1 67800 14281 851 0 0 14281 851 15132 3780B1 1 67800 14281 851 0 0 14281 851 15132 3780
C1 1 PPCa1 1 766 376 1 1348 376 0 10945 403 1 1724 0.0097 0.96 3508C1 1 PPCa1 1 766 376 1 1348 376 0 10945 403 1 1724 0.0097 0.96 3508
C1 1 79400 1 1321 403 376 0 10945 403 1 1724 3780C1 1 79400 1 1321 403 376 0 10945 403 1 1724 3780
D1 1 PPCa12 384 219 13304 63 156 918 12386 13523 0.217 17.8 3508D1 1 PPCa12 384 219 13304 63 156 918 12386 13523 0.217 17.8 3508
D1 1 1780 981 12542 63 156 918 12386 13523 3780D1 1 1780 981 12542 63 156 918 12386 13523 3780
E1 1 PPCa13 70 42 13912 41 1 12039 1873 13954 0.0015 0.15 3508E1 1 PPCa13 70 42 13912 41 1 12039 1873 13954 0.0015 0.15 3508
E1 1 47240 12080 1874 41 1 12039 1873 13954 3780E1 1 47240 12080 1874 41 1 12039 1873 13954 3780
F1 1 PPCa14 3.4 2 141 13 2 0 14049 64 141 15 2.6E-05 0.0026 3508F1 1 PPCa14 3.4 2 141 13 2 0 14049 64 141 15 2.6E-05 0.0026 3508
F1 1 127000 14051 64 2 0 14049 64 141 15 3780F1 1 127000 14051 64 2 0 14049 64 141 15 3780
G1 1 PPCa15 0 0 15448 0 0 15138 310 15448 0 0 3508G1 1 PPCa15 0 0 15448 0 0 15138 310 15448 0 0 3508
G1 1 92000 15138 310 0 0 15138 310 15448 3780G1 1 92000 15138 310 0 0 15138 310 15448 3780
H1 1 PPCa16 0 0 13649 0 0 13583 66 13649 0 0 3508H1 1 PPCa16 0 0 13649 0 0 13583 66 13649 0 0 3508
H1 1 125400 13583 66 0 0 13583 66 13649 3780H1 1 125400 13583 66 0 0 13583 66 13649 3780
E09 PPCa17 18.8 13 16318 8 5 1868 14450 16331 0.0065 0.65 3508E09 PPCa17 18.8 13 16318 8 5 1868 14450 16331 0.0065 0.65 3508
E09 2880 1876 14455 8 5 1868 14450 16331 3780E09 2880 1876 14455 8 5 1868 14450 16331 3780
F09 PPCa18 0 0 16149 0 0 15886 263 16149 0 0 3508F09 PPCa18 0 0 16149 0 0 15886 263 16149 0 0 3508
F09 96800 15886 263 0 0 15886 263 16149 3780F09 96800 15886 263 0 0 15886 263 16149 3780
G09 PPCa19 0 0 14312 0 0 10027 4285 14312 0 0 3508G09 PPCa19 0 0 14312 0 0 10027 4285 14312 0 0 3508
G09 28380 10027 4285 0 0 10027 4285 14312 3780G09 28380 10027 4285 0 0 10027 4285 14312 3780
H09 PPCa20 0 0 15428 0 0 14086 1342 15428 0 0 3508H09 PPCa20 0 0 15428 0 0 14086 1342 15428 0 0 3508
H09 57400 14086 1342 0 0 14086 1342 15428 3780H09 57400 14086 1342 0 0 14086 1342 15428 3780
G06 50 gDNA 0 0 14576 0 0 3 14573 14576 0 0 3508G06 50 gDNA 0 0 14576 0 0 3 14573 14576 0 0 3508
G06 4.8 3 14573 0 0 3 14573 14576 3780G06 4.8 3 14573 0 0 3 14573 14576 3780
H06 50 NTC 0 0 14603 0 0 3 14600 14603 0 0 3508H06 50 NTC 0 0 14603 0 0 3 14600 14603 0 0 3508
H06 4.8 3 14600 0 0 3 14600 14603 3780
H06 4.8 3 14600 0 0 3 14600 14603 3780
Tabelle 17: FAM-Signale (methylierte ΛΟ ί-DNA-Fragmente) und HEX-Signale (nicht-methylierte ΛΟ ί-DNA-Fragmente) in Serumproben gesunder Probandinnen (GF1 -GF20) und Serumproben von Patientinnen mit Mammakarzinom (MF1 -MF20) und Non-Template-Kontrolle (NTC, ohne DNA bzw. genomische DNA ohne Bisulfitumwandlung) nach 15 Zyklen in der BBPA mit dem AOX1 -138bp-Primern (SEQ ID: 18 und 19) und 2,5 mM MgCI2-Konzentration bei 50,0°C und anschließender dPCR. Cut-off-W ert < 3,2%. Rohdaten zur Fig. 59. Table 17: FAM signals (methylated ΛΟ ί DNA fragments) and HEX signals (non-methylated ΛΟ ί DNA fragments) in serum samples from healthy volunteers (GF1 -GF20) and serum samples from patients with breast cancer (MF1-MF20) and non-template control (NTC, without DNA or genomic DNA without bisulfite conversion) after 15 cycles in the BBPA with the AOX1 -138bp primers (SEQ ID: 18 and 19) and 2.5 mM MgCl 2 concentration at 50 , 0 ° C and subsequent dPCR. Cut-off value <3.2%. Raw data for Fig. 59.
Ch1 + Ch1 + Ch1- Ch1- Tröpfchen¬Ch1 + Ch1 + Ch1-Ch1 droplets
Pos. Probe Κορίβη/20μΙ_ Positiv Negativ Ratio Frakt. Häufigkeit Grenzwert Pos. Sample Κορίβη / 20μΙ_ Positive Negative Ratio Fracture Frequency Threshold
Ch2+ Ch2- Ch2+ Ch2- anzahl Ch2 + Ch2- Ch2 + Ch2- number
A01 GM1 0 0 12775 0 0 6165 6610 12775 0 0 2946 A01 GM1 0 0 12775 0 0 6165 6610 12775 0 0 2946
A01 15500 6165 6610 0 0 6165 6610 12775 4102 A01 15500 6165 6610 0 0 6165 6610 12775 4102
B01 GM2 0 0 121 19 0 0 2097 10022 121 19 0 0 2946 B01 GM2 0 0 121 19 0 0 2097 10022 121 19 0 0 2946
B01 4480 2097 10022 0 0 2097 10022 121 19 4102 B01 4480 2097 10022 0 0 2097 10022 121 19 4102
C01 GM3 0 0 12749 0 0 4875 7874 12749 0 0 2946 C01 GM3 0 0 12749 0 0 4875 7874 12749 0 0 2946
C01 1 1340 4875 7874 0 0 4875 7874 12749 4102 C01 1 1340 4875 7874 0 0 4875 7874 12749 4102
D01 GM4 0 0 13129 0 0 10076 3053 13129 0 0 2946 D01 GM4 0 0 13129 0 0 10076 3053 13129 0 0 2946
D01 34320 10076 3053 0 0 10076 3053 13129 4102 D01 34320 10076 3053 0 0 10076 3053 13129 4102
E01 GM5 0 0 13716 0 0 10633 3083 13716 0 0 2946 E01 GM5 0 0 13716 0 0 10633 3083 13716 0 0 2946
E01 35120 10633 3083 0 0 10633 3083 13716 4102 E01 35120 10633 3083 0 0 10633 3083 13716 4102
F01 GM6 0 0 14337 0 0 8638 5699 14337 0 0 2946 F01 GM6 0 0 14337 0 0 8638 5699 14337 0 0 2946
F01 21700 8638 5699 0 0 8638 5699 14337 4102 F01 21700 8638 5699 0 0 8638 5699 14337 4102
G01 GM7 1.6 1 15201 1 0 4846 10355 15202 0.00017 0.017 2946 G01 GM7 1.6 1 15201 1 0 4846 10355 15202 0.00017 0.017 2946
G01 9040 4847 10355 1 0 4846 10355 15202 4102 G01 9040 4847 10355 1 0 4846 10355 15202 4102
H01 GM8 0 0 13459 0 0 4734 8725 13459 0 0 2946 H01 GM8 0 0 13459 0 0 4734 8725 13459 0 0 2946
H01 10200 4734 8725 0 0 4734 8725 13459 4102 H01 10200 4734 8725 0 0 4734 8725 13459 4102
A02 GM9 84 36 10028 12 24 631 1 3717 10064 0.0036 0.36 2946 A02 GM9 84 36 10028 12 24 631 1 3717 10064 0.0036 0.36 2946
A02 23280 6323 3741 12 24 631 1 3717 10064 4102 A02 23280 6323 3741 12 24 631 1 3717 10064 4102
B02 GM10 0 0 10929 0 0 9009 1920 10929 0 0 2946 B02 GM10 0 0 10929 0 0 9009 1920 10929 0 0 2946
B02 40920 9009 1920 0 0 9009 1920 10929 4102 B02 40920 9009 1920 0 0 9009 1920 10929 4102
C02 GM1 1 1.6 1 14000 0 1 6620 7380 14001 0.0001 1 0.01 1 2946 C02 GM1 1 1.6 1 14000 0 1 6620 7380 14001 0.0001 1 0.01 1 2946
C02 15060 6620 7381 0 1 6620 7380 14001 4102 C02 15060 6620 7381 0 1 6620 7380 14001 4102
D02 GM12 282 136 1 1314 24 1 12 3455 7859 1 1450 0.033 3.2 2946
D02 GM12 282 136 1 1314 24 1 12 3455 7859 1 1450 0.033 3.2 2946
D02 8520 3479 7971 24 1 12 3455 7859 1 1450 4102D02 8520 3479 7971 24 1 12 3455 7859 1 1450 4102
E02 GM13 0 0 12943 0 0 8381 4562 12943 0 0 2946E02 GM13 0 0 12943 0 0 8381 4562 12943 0 0 2946
E02 24540 8381 4562 0 0 8381 4562 12943 4102E02 24540 8381 4562 0 0 8381 4562 12943 4102
F02 GM14 8 4 1 1691 0 4 3261 8430 1 1695 0.001 0.1 2946F02 GM14 8 4 1 1691 0 4 3261 8430 1 1695 0.001 0.1 2946
F02 7700 3261 8434 0 4 3261 8430 1 1695 4102F02 7700 3261 8434 0 4 3261 8430 1 1695 4102
G02 GM15 0 0 12712 0 0 3386 9326 12712 0 0 2946G02 GM15 0 0 12712 0 0 3386 9326 12712 0 0 2946
G02 7280 3386 9326 0 0 3386 9326 12712 4102G02 7280 3386 9326 0 0 3386 9326 12712 4102
H02 GM16 274 123 10496 26 97 4435 6061 10619 0.0214 2.09 2946H02 GM16 274 123 10496 26 97 4435 6061 10619 0.0214 2.09 2946
H02 12820 4461 6158 26 97 4435 6061 10619 4102H02 12820 4461 6158 26 97 4435 6061 10619 4102
A03 GM17 0 0 12345 0 0 2934 941 1 12345 0 0 2946A03 GM17 0 0 12345 0 0 2934 941 1 12345 0 0 2946
A03 6380 2934 941 1 0 0 2934 941 1 12345 4102A03 6380 2934 941 1 0 0 2934 941 1 12345 4102
B03 GM18 0 0 12222 0 0 3388 8834 12222 0 0 2946B03 GM18 0 0 12222 0 0 3388 8834 12222 0 0 2946
B03 7640 3388 8834 0 0 3388 8834 12222 4102B03 7640 3388 8834 0 0 3388 8834 12222 4102
C03 GM19 0 0 1 1851 0 0 5087 6764 1 1851 0 0 2946C03 GM19 0 0 1 1851 0 0 5087 6764 1 1851 0 0 2946
C03 13200 5087 6764 0 0 5087 6764 1 1851 4102C03 13200 5087 6764 0 0 5087 6764 1 1851 4102
D03 GM20 0 0 10021 0 0 97 9924 10021 0 0 2946D03 GM20 0 0 10021 0 0 97 9924 10021 0 0 2946
D03 228 97 9924 0 0 97 9924 10021 4102D03 228 97 9924 0 0 97 9924 10021 4102
A04 PPCal 0 0 1 1521 0 0 921 10600 1 1521 0 0 2946A04 PPCal 0 0 1 1521 0 0 921 10600 1 1521 0 0 2946
A04 1960 921 10600 0 0 921 10600 1 1521 4102A04 1960 921 10600 0 0 921 10600 1 1521 4102
B04 PPCa2 34 18 12312 3 15 2476 9836 12330 0.0065 0.65 2946B04 PPCa2 34 18 12312 3 15 2476 9836 12330 0.0065 0.65 2946
B04 5280 2479 9851 3 15 2476 9836 12330 4102B04 5280 2479 9851 3 15 2476 9836 12330 4102
C04 PPCa3 50080 10976 1483 1 14 10862 216 1267 12459 79 98.75 2946C04 PPCa3 50080 10976 1483 1 14 10862 216 1267 12459 79 98.75 2946
C04 632 330 12129 1 14 10862 216 1267 12459 4102C04 632 330 12129 1 14 10862 216 1267 12459 4102
D04 PPCa4 670 341 1 1814 1 340 487 1 1327 12155 0.69 41 2946D04 PPCa4 670 341 1 1814 1 340 487 1 1327 12155 0.69 41 2946
D04 964 488 1 1667 1 340 487 1 1327 12155 4102D04 964 488 1 1667 1 340 487 1 1327 12155 4102
E04 PPCa5 0 0 1 1024 0 0 445 10579 1 1024 0 0 2946E04 PPCa5 0 0 1 1024 0 0 445 10579 1 1024 0 0 2946
E04 970 445 10579 0 0 445 10579 1 1024 4102E04 970 445 10579 0 0 445 10579 1 1024 4102
F04 PPCa6 188 96 1 1922 26 70 9738 2184 12018 0.0048 0.48 2946F04 PPCa6 188 96 1 1922 26 70 9738 2184 12018 0.0048 0.48 2946
F04 39380 9764 2254 26 70 9738 2184 12018 4102F04 39380 9764 2254 26 70 9738 2184 12018 4102
G04 PPCa7 3760 1605 9243 38 1567 2960 6283 10848 0.495 33.1 2946G04 PPCa7 3760 1605 9243 38 1567 2960 6283 10848 0.495 33.1 2946
G04 7620 2998 7850 38 1567 2960 6283 10848 4102G04 7620 2998 7850 38 1567 2960 6283 10848 4102
H04 PPCa8 27180 8330 3833 640 7690 1347 2486 12163 6.47 86.6 2946H04 PPCa8 27180 8330 3833 640 7690 1347 2486 12163 6.47 86.6 2946
H04 4200 1987 10176 640 7690 1347 2486 12163 4102H04 4200 1987 10176 640 7690 1347 2486 12163 4102
A05 PPCa9 0 0 12275 0 0 4339 7936 12275 0 0 2946
A05 PPCa9 0 0 12275 0 0 4339 7936 12275 0 0 2946
A05 10260 4339 7936 0 0 4339 7936 12275 4102A05 10260 4339 7936 0 0 4339 7936 12275 4102
B05 PPCal O 0 0 12250 0 0 3684 8566 12250 0 0 2946B05 PPCal O 0 0 12250 0 0 3684 8566 12250 0 0 2946
B05 8420 3684 8566 0 0 3684 8566 12250 4102B05 8420 3684 8566 0 0 3684 8566 12250 4102
C05 PPCa1 1 60800 13449 1094 894 12555 172 922 14543 34 97.14 2946C05 PPCa1 1 60800 13449 1094 894 12555 172 922 14543 34 97.14 2946
C05 1800 1066 13477 894 12555 172 922 14543 4102C05 1800 1066 13477 894 12555 172 922 14543 4102
D05 PPCa12 1750 1018 13185 41 977 2474 1071 1 14203 0.382 27.6 2946D05 PPCa12 1750 1018 13185 41 977 2474 1071 1 14203 0.382 27.6 2946
D05 4580 2515 1 1688 41 977 2474 1071 1 14203 4102D05 4580 2515 1 1688 41 977 2474 1071 1 14203 4102
E05 PPCa13 0 0 1 1674 0 0 710 10964 1 1674 0 0 2946E05 PPCa13 0 0 1 1674 0 0 710 10964 1 1674 0 0 2946
E05 1480 710 10964 0 0 710 10964 1 1674 4102E05 1480 710 10964 0 0 710 10964 1 1674 4102
F05 PPCa14 714 403 13078 74 329 5960 71 18 13481 0.051 4.87 2946F05 PPCa14 714 403 13078 74 329 5960 71 18 13481 0.051 4.87 2946
F05 13960 6034 7447 74 329 5960 71 18 13481 4102F05 13960 6034 7447 74 329 5960 71 18 13481 4102
G05 PPCa15 0 0 13606 0 0 382 13224 13606 0 0 2946G05 PPCa15 0 0 13606 0 0 382 13224 13606 0 0 2946
G05 670 382 13224 0 0 382 13224 13606 4102G05 670 382 13224 0 0 382 13224 13606 4102
H05 PPCa16 0 0 131 1 1 0 0 4457 8654 131 1 1 0 0 2946H05 PPCa16 0 0 131 1 1 0 0 4457 8654 131 1 1 0 0 2946
H05 9780 4457 8654 0 0 4457 8654 131 1 1 4102H05 9780 4457 8654 0 0 4457 8654 131 1 1 4102
A06 PPCa17 2440 1261 1 1550 34 1227 1063 10487 1281 1 1.16 53.7 2946A06 PPCa17 2440 1261 1 1550 34 1227 1063 10487 1281 1 1.16 53.7 2946
A06 2100 1097 1 1714 34 1227 1063 10487 1281 1 4102A06 2100 1097 1 1714 34 1227 1063 10487 1281 1 4102
B06 PPCa18 0 0 12831 0 0 3704 9127 12831 0 0 2946B06 PPCa18 0 0 12831 0 0 3704 9127 12831 0 0 2946
B06 8020 3704 9127 0 0 3704 9127 12831 4102B06 8020 3704 9127 0 0 3704 9127 12831 4102
C06 PPCa19 1.6 1 14781 0 1 4803 9978 14782 0.00017 0.017 2946C06 PPCa19 1.6 1 14781 0 1 4803 9978 14782 0.00017 0.017 2946
C06 9240 4803 9979 0 1 4803 9978 14782 4102C06 9240 4803 9979 0 1 4803 9978 14782 4102
D06 PPCa20 0 0 14244 0 0 1678 12566 14244 0 0 2946D06 PPCa20 0 0 14244 0 0 1678 12566 14244 0 0 2946
D06 2940 1678 12566 0 0 1678 12566 14244 4102D06 2940 1678 12566 0 0 1678 12566 14244 4102
E03 15 gDNA 0 0 13787 0 0 63 13724 13787 0 0 2946E03 15 gDNA 0 0 13787 0 0 63 13724 13787 0 0 2946
E03 108 63 13724 0 0 63 13724 13787 4102E03 108 63 13724 0 0 63 13724 13787 4102
F03 15 NTC 0 0 14654 0 0 84 14570 14654 0 0 2946F03 15 NTC 0 0 14654 0 0 84 14570 14654 0 0 2946
F03 136 84 14570 0 0 84 14570 14654 4102
F03 136 84 14570 0 0 84 14570 14654 4102
Tabelle 18: FAM-Signale (methylierte ΛΟ ί-DNA-Fragmente) und HEX-Signale (nicht-methylierte ΛΟ ί-DNA-Fragmente) in Serumproben gesunder Probandinnen (GF1 -GF20) und Serumproben von Patientinnen mit Mammakarzinom (MF1 -MF20) und Non-Template-Kontrolle (NTC, ohne DNA bzw. genomische DNA ohne Bisulfitumwandlung) nach 30 Zyklen in der BBPA mit dem AOX1 -138bp-Primern (SEQ ID: 18 und 19) und 2,5 mM MgCI2-Konzentration bei 50,0°C und anschließender dPCR. Ct/i-off-Wert: < 0,008%. Rohdaten zur Fig. 60. Table 18: FAM signals (methylated ΛΟ ί DNA fragments) and HEX signals (non-methylated ΛΟ ί DNA fragments) in serum samples from healthy volunteers (GF1 -GF20) and serum samples from breast cancer patients (MF1-MF20) and non-template control (NTC, without DNA or genomic DNA without bisulfite conversion) after 30 cycles in the BBPA with the AOX1 -138bp primers (SEQ ID: 18 and 19) and 2.5 mM MgCl 2 concentration at 50 , 0 ° C and subsequent dPCR. Ct / i off value: <0.008%. Raw data for Fig. 60.
Ch1 + Ch1 + Ch1- Ch1- Tröpfchen¬Ch1 + Ch1 + Ch1-Ch1 droplets
Pos. Probe Κορίβη/20μΙ_ Positiv Negativ Ratio Frakt. Häufigkeit Grenzwert Pos. Sample Κορίβη / 20μΙ_ Positive Negative Ratio Fracture Frequency Threshold
Ch2+ Ch2- Ch2+ Ch2- anzahl Ch2 + Ch2- Ch2 + Ch2- number
A07 GM1 0 0 13363 0 0 12829 534 13363 0 0 2522 A07 GM1 0 0 13363 0 0 12829 534 13363 0 0 2522
A07 75800 12829 534 0 0 12829 534 13363 4026 A07 75800 12829 534 0 0 12829 534 13363 4026
B07 GM2 1.8 1 13210 0 1 7853 5357 1321 1 8,00E-05 0.008 2522 B07 GM2 1.8 1 13210 0 1 7853 5357 1321 1 8,00E-05 0.008 2522
B07 21240 7853 5358 0 1 7853 5357 1321 1 4026 B07 21240 7853 5358 0 1 7853 5357 1321 1 4026
C07 GM3 0 0 13321 0 0 1 1436 1885 13321 0 0 2522 C07 GM3 0 0 13321 0 0 1 1436 1885 13321 0 0 2522
C07 46000 1 1436 1885 0 0 1 1436 1885 13321 4026 C07 46000 1 1436 1885 0 0 1 1436 1885 13321 4026
D07 GM4 0 0 13023 0 0 12677 346 13023 0 0 2522 D07 GM4 0 0 13023 0 0 12677 346 13023 0 0 2522
D07 85400 12677 346 0 0 12677 346 13023 4026 D07 85400 12677 346 0 0 12677 346 13023 4026
E07 GM5 0 0 13143 0 0 12216 927 13143 0 0 2522 E07 GM5 0 0 13143 0 0 12216 927 13143 0 0 2522
E07 62400 12216 927 0 0 12216 927 13143 4026 E07 62400 12216 927 0 0 12216 927 13143 4026
F07 GM6 0 0 12889 0 0 7603 5286 12889 0 0 2522 F07 GM6 0 0 12889 0 0 7603 5286 12889 0 0 2522
F07 20980 7603 5286 0 0 7603 5286 12889 4026 F07 20980 7603 5286 0 0 7603 5286 12889 4026
G07 GM7 0 0 12650 0 0 12048 602 12650 0 0 2522 G07 GM7 0 0 12650 0 0 12048 602 12650 0 0 2522
G07 71600 12048 602 0 0 12048 602 12650 4026 G07 71600 12048 602 0 0 12048 602 12650 4026
H07 GM8 0 0 12586 0 0 12099 487 12586 0 0 2522 H07 GM8 0 0 12586 0 0 12099 487 12586 0 0 2522
H07 76600 12099 487 0 0 12099 487 12586 4026 H07 76600 12099 487 0 0 12099 487 12586 4026
A08 GM9 0 0 12154 0 0 1 1019 1 135 12154 0 0 2522 A08 GM9 0 0 12154 0 0 1 1019 1 135 12154 0 0 2522
A08 55800 1 1019 1 135 0 0 1 1019 1 135 12154 4026 A08 55800 1 1019 1 135 0 0 1 1019 1 135 12154 4026
B08 GM10 0 0 13926 0 0 13704 222 13926 0 0 2522 B08 GM10 0 0 13926 0 0 13704 222 13926 0 0 2522
B08 97400 13704 222 0 0 13704 222 13926 4026 B08 97400 13704 222 0 0 13704 222 13926 4026
C08 GM1 1 0 0 13333 0 0 8498 4835 13333 0 0 2522 C08 GM1 1 0 0 13333 0 0 8498 4835 13333 0 0 2522
C08 23860 8498 4835 0 0 8498 4835 13333 4026 C08 23860 8498 4835 0 0 8498 4835 13333 4026
D08 GM12 1.6 1 14130 1 0 13577 553 14131 2.2E-05 0.0022 2522 D08 GM12 1.6 1 14130 1 0 13577 553 14131 2.2E-05 0.0022 2522
D08 76200 13578 553 1 0 13577 553 14131 4026
D08 76200 13578 553 1 0 13577 553 14131 4026
E08 GM13 0 0 12767 0 0 12491 276 12767 0 0 2522E08 GM13 0 0 12767 0 0 12491 276 12767 0 0 2522
E08 90200 12491 276 0 0 12491 276 12767 4026E08 90200 12491 276 0 0 12491 276 12767 4026
F08 GM14 0 0 12841 0 0 5483 7358 12841 0 0 2522F08 GM14 0 0 12841 0 0 5483 7358 12841 0 0 2522
F08 13100 5483 7358 0 0 5483 7358 12841 4026F08 13100 5483 7358 0 0 5483 7358 12841 4026
G08 GM15 0 0 13297 0 0 12877 420 13297 0 0 2522G08 GM15 0 0 13297 0 0 12877 420 13297 0 0 2522
G08 81200 12877 420 0 0 12877 420 13297 4026G08 81200 12877 420 0 0 12877 420 13297 4026
H08 GM16 1.6 1 13873 0 1 13246 627 13874 2.3E-05 0.0023 2522H08 GM16 1.6 1 13873 0 1 13246 627 13874 2.3E-05 0.0023 2522
H08 72800 13246 628 0 1 13246 627 13874 4026H08 72800 13246 628 0 1 13246 627 13874 4026
A09 GM17 0 0 13562 0 0 831 12731 13562 0 0 2522A09 GM17 0 0 13562 0 0 831 12731 13562 0 0 2522
A09 1480 831 12731 0 0 831 12731 13562 4026A09 1480 831 12731 0 0 831 12731 13562 4026
B09 GM18 0 0 14121 0 0 13408 713 14121 0 0 2522B09 GM18 0 0 14121 0 0 13408 713 14121 0 0 2522
B09 70200 13408 713 0 0 13408 713 14121 4026B09 70200 13408 713 0 0 13408 713 14121 4026
C09 GM19 0 0 14979 0 0 14395 584 14979 0 0 2522C09 GM19 0 0 14979 0 0 14395 584 14979 0 0 2522
C09 76400 14395 584 0 0 14395 584 14979 4026C09 76400 14395 584 0 0 14395 584 14979 4026
D09 GM20 0 0 13243 0 0 18 13225 13243 0 0 2522D09 GM20 0 0 13243 0 0 18 13225 13243 0 0 2522
D09 32 18 13225 0 0 18 13225 13243 4026D09 32 18 13225 0 0 18 13225 13243 4026
E09 PPCal 0 0 13470 0 0 4 13466 13470 0 0 2522E09 PPCal 0 0 13470 0 0 4 13466 13470 0 0 2522
E09 7 4 13466 0 0 4 13466 13470 4026E09 7 4 13466 0 0 4 13466 13470 4026
F09 PPCa2 1.6 1 14957 0 1 10789 4168 14958 5,00E-05 0.005 2522F09 PPCa2 1.6 1 14957 0 1 10789 4168 14958 5.00E-05 0.005 2522
F09 30060 10789 4169 0 1 10789 4168 14958 4026F09 30060 10789 4169 0 1 10789 4168 14958 4026
G09 PPCa3 20000000 14287 0 2 14285 0 0 14287 1000000 100 2522G09 PPCa3 20000000 14287 0 2 14285 0 0 14287 1000000 100 2522
G09 3.2 2 14285 2 14285 0 0 14287 4026G09 3.2 2 14285 2 14285 0 0 14287 4026
H09 PPCa4 74200 13824 619 4240 9584 0 619 14443 9.06 90.06 2522H09 PPCa4 74200 13824 619 4240 9584 0 619 14443 9.06 90.06 2522
H09 8180 4240 10203 4240 9584 0 619 14443 4026H09 8180 4240 10203 4240 9584 0 619 14443 4026
E10 PPCa5 0 0 13312 0 0 5568 7744 13312 0 0 2522E10 PPCa5 0 0 13312 0 0 5568 7744 13312 0 0 2522
E10 12740 5568 7744 0 0 5568 7744 13312 4026E10 12740 5568 7744 0 0 5568 7744 13312 4026
F10 PPCa6 1.6 1 15410 0 1 15331 79 1541 1 1.2E-05 0.0012 2522F10 PPCa6 1.6 1 15410 0 1 15331 79 1541 1 1.2E-05 0.0012 2522
F10 123800 15331 80 0 1 15331 79 1541 1 4026F10 123800 15331 80 0 1 15331 79 1541 1 4026
G10 PPCa7 79200 14676 523 13689 987 124 399 15199 1.407 58.5 2522G10 PPCa7 79200 14676 523 13689 987 124 399 15199 1.407 58.5 2522
G10 56400 13813 1386 13689 987 124 399 15199 4026G10 56400 13813 1386 13689 987 124 399 15199 4026
H10 PPCa8 145600 14096 29 183 13913 0 29 14125 470 99.79 2522H10 PPCa8 145600 14096 29 183 13913 0 29 14125 470 99.79 2522
H10 306 183 13942 183 13913 0 29 14125 4026H10 306 183 13942 183 13913 0 29 14125 4026
A1 1 PPCa9 0 0 14180 0 0 12203 1977 14180 0 0 2522A1 1 PPCa9 0 0 14180 0 0 12203 1977 14180 0 0 2522
A1 1 46360 12203 1977 0 0 12203 1977 14180 4026
A1 1 46360 12203 1977 0 0 12203 1977 14180 4026
B11 PPCalO 0 0 15288 0 0 13636 1652 15288 0 0 2522B11 PPCalO 0 0 15288 0 0 13636 1652 15288 0 0 2522
B11 52400 13636 1652 0 0 13636 1652 15288 4026B11 52400 13636 1652 0 0 13636 1652 15288 4026
C11 PPCa11 228000 15823 1 24 15799 0 1 15824 6400 99.984 2522C11 PPCa11 228000 15823 1 24 15799 0 1 15824 6400 99.984 2522
C11 36 24 15800 24 15799 0 1 15824 4026C11 36 24 15800 24 15799 0 1 15824 4026
D11 PPCa12 62280 15829 1207 11567 4262 95 1112 17036 2.29 69.6 2522D11 PPCa12 62280 15829 1207 11567 4262 95 1112 17036 2.29 69.6 2522
D11 27140 11662 5374 11567 4262 95 1112 17036 4026D11 27140 11662 5374 11567 4262 95 1112 17036 4026
E11 PPCa13 1.4 1 16189 0 1 1474 14715 16190 0.0006 0.06 2522E11 PPCa13 1.4 1 16189 0 1 1474 14715 16190 0.0006 0.06 2522
E11 2240 1474 14716 0 1 1474 14715 16190 4026E11 2240 1474 14716 0 1 1474 14715 16190 4026
F11 PPCa14 0 0 16641 0 0 16278 363 16641 0 0 2522F11 PPCa14 0 0 16641 0 0 16278 363 16641 0 0 2522
F11 90000 16278 363 0 0 16278 363 16641 4026F11 90000 16278 363 0 0 16278 363 16641 4026
G11 PPCa15 0 0 16513 0 0 12586 3927 16513 0 0 2522G11 PPCa15 0 0 16513 0 0 12586 3927 16513 0 0 2522
G11 33800 12586 3927 0 0 12586 3927 16513 4026G11 33800 12586 3927 0 0 12586 3927 16513 4026
H11 PPCa16 0 0 14607 0 0 8223 6384 14607 0 0 2522H11 PPCa16 0 0 14607 0 0 8223 6384 14607 0 0 2522
H11 19480 8223 6384 0 0 8223 6384 14607 4026H11 19480 8223 6384 0 0 8223 6384 14607 4026
A10 PPCa17 11640 5373 8388 6 5367 1 8387 13761 1000 99.9 2522A10 PPCa17 11640 5373 8388 6 5367 1 8387 13761 1000 99.9 2522
A10 12 7 13754 6 5367 1 8387 13761 4026A10 12 7 13754 6 5367 1 8387 13761 4026
B10 PPCa18 0 0 14246 0 0 11148 3098 14246 0 0 2522B10 PPCa18 0 0 14246 0 0 11148 3098 14246 0 0 2522
B10 35900 11148 3098 0 0 11148 3098 14246 4026B10 35900 11148 3098 0 0 11148 3098 14246 4026
C10 PPCa19 0 0 14141 0 0 13102 1039 14141 0 0 2522C10 PPCa19 0 0 14141 0 0 13102 1039 14141 0 0 2522
C10 61400 13102 1039 0 0 13102 1039 14141 4026C10 61400 13102 1039 0 0 13102 1039 14141 4026
D10 PPCa20 0 0 15013 0 0 13431 1582 15013 0 0 2522D10 PPCa20 0 0 15013 0 0 13431 1582 15013 0 0 2522
D10 53000 13431 1582 0 0 13431 1582 15013 4026D10 53000 13431 1582 0 0 13431 1582 15013 4026
G06 30 gDNA 0 0 15273 0 0 5 15268 15273 0 0 2522G06 30 gDNA 0 0 15273 0 0 5 15268 15273 0 0 2522
G06 7.8 5 15268 0 0 5 15268 15273 4026G06 7.8 5 15268 0 0 5 15268 15273 4026
H06 30 NTC 0 0 14501 0 0 2 14499 14501 0 0 2522H06 30 NTC 0 0 14501 0 0 2 14499 14501 0 0 2522
H06 3.2 2 14499 0 0 2 14499 14501 4026
H06 3.2 2 14499 0 0 2 14499 14501 4026
Ausführungsbeispiel 11 : Unterscheidung von benigner Prostatahyperplasie und Prostata-Karzinom Exemplary embodiment 11: Differentiation of benign prostate hyperplasia and prostate carcinoma
Da für ein Screening und damit verbunden für eine Vorsorge von Tumorerkrankungen die sichere Unterscheidung einer benignen (nicht-bösartigen) von einer malignen Erkrankung Grundvoraussetzung ist, d.h. die analytische und diagnostische Spezifität muss nahezu 100% betragen, wurden unter Einsatz verschiedener PLA2R1 -Primerpaare neben normalen PrEC-Zellen und malignen Prostatazelllinien (LNCaP, PC-3 und DU-145) die benigne Prostatahyperplasiezelllinie BPH-1 analysiert. Dabei zeigte sich nach 50 Zyklen Prä- Amplifikation bei Verwendung einer MgCI2-Konzentration von 2,5 mM und dem Einsatz des PLA2R1 -Primerpaares 168 bp, dass die Höhe der FAM- und HEX-Signale in Abhängigkeit der Annealingtemperatur konstant blieben, d.h. keine Bias auftrat (Fig. 46). Das entspricht den Ergebnissen, die bei der Untersuchung von 50%-iger Standard-DNA-Proben erhalten wurden (Fig. 34). Im Gegensatz dazu trat bei Verwendung des PLA2R1 -Primerpaares 161 bp ab einer Temperatur von 58,2°C und bei Einsatz des PLA2R1 -Primerpaares 150 bp ab einer Temperatur von 50,8°C eine deutliche Bias zugunsten methylierter Sequenzen ein, die durch steigende FAM-Signale für die PC-3-Zelllinie ersichtlich wurde (Fig. 47 und 48). Eine besonders starke Bias zeigte sich für das PLA2R1 -Primerpaare 133 bp bereits bei einer Annealingtemperatur von 50,0°C (Fig. 49). Oberhalb einer Temperatur von 52,6°C stellten sich dabei jedoch zunehmend Artefakte (d.h. falsch-positive Signale) ein, indem für die normalen PrEC und BPH-1 Zelllinien erhöhte FAM-Signale gemessen wurden und die Werte nicht von denen maligner Prostatazelllinien zu unterscheiden waren (Fig. 49). Daraus läßt sich schließen, dass bei einer MgCI2-Konzentration von 2,5 mM für den Einsatz dieses Primerpaares eine Annealingtemperatur von maximal 52,6°C gewählt werden darf. Eine Alternative dazu besteht darin, bei höheren Annealingtemperaturen, z.B. bei 63,0°C die MgCI2-Konzentration auf 6,0 mM zu erhöhen, wodurch das Auftreten falsch-positiver Signale vermieden werden kann (siehe Tab. 28 und 30 und Fig. 38-45). Since a clear distinction between a benign (non-malignant) and a malignant disease is a prerequisite for screening and, thus, precautionary tumor disease, ie the analytical and diagnostic specificity must be nearly 100%, in addition to normal, different PLA2R1 primer pairs were used PrEC cells and malignant prostate cell lines (LNCaP, PC-3 and DU-145) analyzed the benign prostate hyperplasia cell line BPH-1. It was shown after 50 cycles of pre-amplification when using a MgCl 2 concentration of 2.5 mM and the use of the PLA2R1 -Primerpaares 168 bp that the height of the FAM and HEX signals depending on the annealing temperature remained constant, ie none Bias occurred (Figure 46). This corresponds to the results obtained when examining 50% standard DNA samples (Figure 34). In contrast, when using the PLA2R1 -Primerpaares 161 bp from a temperature of 58.2 ° C and when using the PLA2R1 -Primerpaares 150 bp from a temperature of 50.8 ° C, a clear bias in favor of methylated sequences occurred by increasing FAM signals for the PC-3 cell line became apparent (Figures 47 and 48). A particularly strong bias was already evident for the PLA2R1 primer pair 133 bp at an annealing temperature of 50.0 ° C. (FIG. 49). Above 52.6 ° C, however, artifacts (ie, false-positive signals) were increasingly established by measuring elevated FAM signals for the normal PrEC and BPH-1 cell lines and not distinguishing the values from those of malignant prostate cell lines were (Fig. 49). From this it can be concluded that at a MgCl 2 concentration of 2.5 mM for the use of this primer pair an annealing temperature of a maximum of 52.6 ° C may be selected. An alternative to this is to increase the MgCl 2 concentration to 6.0 mM at higher annealing temperatures, eg 63.0 ° C., whereby the occurrence of false-positive signals can be avoided (see Tables 28 and 30 and FIG. 38-45).
Ein ähnliches Phänomen, dass bei einer MgCI2-Konzentration von 2,5 mM bei steigenden Annealingtemperaturen falsch-positive Signale verstärkt gebildet wurden, zeigte sich beim Primerpaar GSTP1 -120bp (Fig. 50). Hier traten oberhalb einer Annealingtemperatur von 60,8°C ebenfalls Artefakte, d.h. falsch-positive Werte auf. Auch hier kann durch Erhöhung der MgCI2-Konzentration das Auftreten von falsch-positiven Signalen bei steigender Annealingtemperatur vermieden und dadurch wesentlich höhere diagnostische Spezifitäten erreicht werden. A similar phenomenon that at a MgCl 2 concentration of 2.5 mM false-positive signals were increasingly formed with increasing annealing temperatures was found in the primer pair GSTP1 -120 bp (FIG. 50). Above an annealing temperature of 60.8 ° C, artifacts, ie false-positive values, also occurred here. Again, by increasing the MgCl 2 concentration, the occurrence of false-positive signals can be avoided as the annealing temperature rises and significantly higher diagnostic specificities can be achieved.
Die Beobachtung, dass mit steigenden Prä-Amplifikationszyklenzahlen die Signale in Proben Gesunder gegen 0% und in Proben von Tumorpatienten gegen 100% tendieren, wodurch eine sichere Unterscheidung zwischen Gesund und Krank möglich wird, zeigte sich auch am Beispiel der GSTP7-Methylierung an Proben mit 0% und 50%-igem Anteil methylierter
Standard-DNA (Fig. 51 und 52). Während bei Verwendung des GSTP1 -120 bp-Primerpaares unspezifische Signale der 0%-Standard-DNA-Probe bei 20 Zyklen auftraten, verschwanden diese nach 50 Zyklen vollständig (Fig. 51 ). Im Gegensatz dazu nahmen die spezifischen FAM-Signale in der 50%-Probe mit steigender Zyklenanzahl in ihrer Intensität zu, wenn MgCI2-Konzentrationen von 1 ,5-2,5 mM eingesetzt wurden (Fig. 51 ). Dass dieses Phänomen stark vom Primerdesign und der MgCI2-Konzentration abhängt, zeigte sich auch am Beispiel des GSTP1 -1 16bp-Primerpaares. Hier nahm die FAM-Signalintensität nach mehr als 20 Zyklen ab, wenn die MgCI2-Konzentration mehr als 2,5 mM betrug (Fig. 52). Aus diesem Grund ist bei diesem Primerpaar die Zyklenzahl in der Prä-Amplifikation auf 20 zu begrenzen, wenn eine MgCI2-Konzentration zwischen 2,5-6,0 mM genutzt wird. Alternativ kann die MgCI2-Konzentration auf 1 ,5 mM erniedrigt und die Zyklenanzahl entsprechend erhöht werden (Fig. 52). The observation that with increasing numbers of pre-amplification cycles the signals in samples of healthy towards 0% and in samples of tumor patients against 100%, whereby a safe distinction between healthy and sick is possible, was also demonstrated by the example of GSTP7 methylation on samples 0% and 50% methylated fraction Standard DNA (Figures 51 and 52). While nonspecific signals from the 0% standard DNA sample occurred at 20 cycles when using the GSTP1 -120 bp primer pair, they disappeared completely after 50 cycles (Figure 51). In contrast, the specific FAM signals in the 50% sample increased in intensity as the number of cycles increased when MgCl 2 concentrations of 1.5-2.5 mM were used (Figure 51). The fact that this phenomenon depends strongly on the primer design and the MgCl 2 concentration was also shown by the example of the GSTP1-1 16bp primer pair. Here, the FAM signal intensity decreased after more than 20 cycles when the MgCl 2 concentration was greater than 2.5 mM (Figure 52). For this reason, in this primer pair, the number of cycles in the pre-amplification should be limited to 20, if a MgCl 2 concentration between 2.5-6.0 mM is used. Alternatively, the MgCl 2 concentration can be reduced to 1.5 mM and the number of cycles increased accordingly (Figure 52).
Des Weiteren zeigte sich im Fall des GSTP1 -1 16bp-Primers an Serumproben von Patientinnen mit Mammakarzinom, dass die diagnostische Sensitivität und Spezifität deutlich anstieg, wenn die MgCI2-Konzentration anstelle von 1 ,5 mM auf eine Konzentration von 4,5 mM in der BBPA heraufgesetzt wurde (Fig. 53 und 54). Während bei einer 1 ,5 mM MgCI2- Konzentration 4 von 20 Mammakarzinom-Patientinnen richtig identifiziert wurden, stieg diese Anzahl auf 6 bei Verwendung von 4,5 mM MgCI2 an, obwohl bei der höherer MgCI2- Konzentration auch der Anteil nicht-methylierter DNA-Fragmente anstieg. Letzteres kann unter diesen Bedingungen als ideale interne Kontrolle eingesetzt werden, was bei einer MgCI2-Konzentration von 1 ,5 mM nicht der Fall war. Furthermore, in the case of the GSTP1-1 16bp primer on serum samples from breast cancer patients, the diagnostic sensitivity and specificity increased significantly when the MgCl 2 concentration was reduced to 4.5 mM in place of 1.5 mM BBPA was raised (Figures 53 and 54). While 4 out of 20 breast cancer patients were correctly identified at a 1, 5 mM MgCl 2 concentration, this number increased to 6 when using 4.5 mM MgCl 2 , although at the higher MgCl 2 concentration the proportion of non-cancerous patients increased as well. increased methylated DNA fragments. The latter can be used under these conditions as an ideal internal control, which was not the case with a MgCl 2 concentration of 1.5 mM.
In einer weiteren Untersuchung an Serumproben von Patienten mit PCa zeigte sich eine verbesserte diagnostische Sensitivität und Spezifität, wenn unter den optimierten Bedingungen (4,5 mM MgCI2 und 53,8°C Annealingtemperatur) das GSTP1 -1 16bp- Primerpaar mit dem GSTP1 -120bp-Primerpaar (2,5 mM MgCI2 und 50,7°C Annealingtemperatur) verglichen wurde. So ließen sich mit dem GSTP1 -1 16 bp-Primerpaar in der Gruppe von 20 PCa-Patienten 13 richtig als erkrankt identifizieren, ohne dass von den 20 gesunden Probanden einer als falsch krank identifiziert wurde, während mit dem GSTP1 - 120bp-Primerpaar 8 richtig als PCa-erkrankt identifiziert wurden (Fig. 55 und 56, Tab. 13 und 14). Dabei wurden in den Serumproben der Patienten PPCa13 und 20 positive Signale mit Hilfe des GSTP1 -120bp-Primerpaares gefunden, die in den Untersuchungen mit dem GSTP1 -1 16bp-Primerpaar negativ waren, so dass sich die diagnostische Sensitivität des Tests durch die Verwendung beider Primerpaare; separat in zwei verschiedenen BBPA- dPCR-Ansätzen oder gleichzeitig in einem Ansatz weiter erhöhen lässt. Further study on serum samples from patients with PCa showed improved diagnostic sensitivity and specificity when, under the optimized conditions (4.5 mM MgCl 2 and 53.8 ° C annealing temperature), the GSTP1 -1 16bp primer pair with the GSTP1 - 120bp primer pair (2.5mM MgCl 2 and 50.7 ° C annealing temperature). Thus, with the GSTP1-1 16 bp primer pair in the group of 20 PCa patients, 13 were correctly identified as being ill, without any of the 20 healthy subjects being identified as being ill, whereas with the GSTP1 - 120bp primer pair 8, they were correctly identified were identified as having PCa (Figures 55 and 56, Tables 13 and 14). In the serum samples of the patients PPCa13 and 20 positive signals were found with the help of the GSTP1-120bp primer pair, which were negative in the studies with the GSTP1-1 16bp primer pair, so that the diagnostic sensitivity of the test by the use of both primer pairs ; separately in two different BBPA-dPCR approaches or in one approach at a time.
Beim Einsatz der BBPA-dPCR-Technik für die Zielgene SERPINE1 und AOX1 stellte sich - wie bereits zu Beginn für das RASSF1A-1 17bp-Primerpaar beschrieben wurde - heraus,
dass insbesondere im Fall des SERPINE1 -Primerpaares 50 Zyklen, aber auch im Fall des AOX1 -Primerpaares 30 Zyklen im Vergleich zu 15 Zyklen in der BBPA zu einer deutlich verbesserten Zuordnung der PCa-Patienten gegenüber den gesunden Probanden in der anschließenden dPCR führten. Dabei resultierten durch beide Zyklenzahlen keine redundanten, sondern sich ergänzende Ergebnisse (Fig. 57-60, Tab.15-18). Das bedeutet, dass durch den gleichzeitigen Einsatz unterschiedlicher Zyklenzahlen in der BBPA, z.B. 15 und 30 oder 15 und 50 Zyklen, die Sensitivitat und Spezifität des Verfahrens ebenfalls weiter erhöht werden kann. So lässt sich z.B. nach 15 Zyklen der BBPA ein Teil des Probenmaterials entnehmen und die restlichen Probenmaterialien für weitere 35 Zyklen (insgesamt 50 Zyklen) in der BBPA prä-amplifizieren. Liegt genügend Untersuchungsmaterial vor, können die Patientenproben auch separat voneinander in der BBPA für 15 und 30 oder 15 und 50 Zyklen prä-amplifizert werden, um eine mögliche Kontamination der Proben untereinander zu minimieren. The use of the BBPA-dPCR technique for the target genes SERPINE1 and AOX1 turned out to be - as already described at the beginning for the RASSF1A-1 17bp primer pair - that, in particular in the case of the SERPINE1 primer pair, 50 cycles, but also in the case of the AOX1 primer pair 30 cycles compared to 15 cycles in the BBPA led to a significantly improved association of the PCa patients with the healthy subjects in the subsequent dPCR. Both numbers of cycles did not result in redundant but complementary results (FIGS. 57-60, Tab.15-18). This means that by simultaneously using different numbers of cycles in the BBPA, eg 15 and 30 or 15 and 50 cycles, the sensitivity and specificity of the method can also be further increased. For example, after 15 cycles of the BBPA, one part of the sample material can be removed and the remaining sample materials can be pre-amplified in the BBPA for a further 35 cycles (a total of 50 cycles). If sufficient specimens are available, the patient specimens may also be pre-amplified separately in the BBPA for 15 and 30 or 15 and 50 cycles to minimize potential contamination of the specimens.
Um zu prüfen, ob die neue BBPA-dPCR-Technik in der Lage ist, durch Bestimmung von methylierten DNA-Fragmenten der PLA2R1 , RASSF1A, GSTP1 und PAI 1 -Gene zwischen Gesund, BPH und PCa differentialdiagnostisch zu unterscheiden und damit die Frage nach der Indikation für eine Gewebebiopsie zu unterstützen, wurden jeweils 20 Serumproben von gesunden Probanden, Patienten mit BPH und Patienten mit PCa analysiert. Dabei wurden Patientenproben für beide Gruppen analysiert, die sich in ihren PSA-Serumkonzentrationen nicht signifikant unterschieden, wobei die PSA-Werte in dem kritischen Bereich zwischen 2 und 15 ng/ml lagen (p<0,552; Fig. 61 ). Eine Differentialdiagnostik zwischen BPH und PCa war anhand des Quotienten freies PSA/ Gesamt-PSA (Referenzwert >20%) bei den Patienten ebenfalls nicht möglich (Tab. 19). To determine whether the new BBPA-dPCR technique is able to differentiate between healthy, BPH and PCa in a differential diagnosis by determining methylated DNA fragments of the PLA2R1, RASSF1A, GSTP1 and PAI 1 genes To support the indication for tissue biopsy, 20 serum samples from healthy volunteers, patients with BPH, and patients with PCa were analyzed. Patient samples were analyzed for both groups that did not differ significantly in their PSA serum concentrations, with PSA values in the critical range between 2 and 15 ng / ml (p <0.552, Figure 61). A differential diagnosis between BPH and PCa was also not possible in the patients on the basis of the quotient free PSA / total PSA (reference value> 20%) (Table 19).
In 20 Serumproben gesunder Probanden, d.h. ohne BPH- oder PCa-Erkrankungen, fanden sich nur geringe Anteile methylierter DNA-Fragmente, deren Anteile anschließend als cut-off- Werte (PLA2RK0.1 1 %; RASSF1A<0,1 1 %, GSTP1 <0,05% und SERPINE1 <0,13%) genutzt wurden. Basierend auf diesen Werten ließen sich keine erhöhten Werte bei 1 1 Patienten der Gruppe der 20 BPH-Patienten nachweisen. Diese 1 1 Patienten wiesen bis heute, d.h. 2 Jahre nach der Blutentnahme und durchgeführten Gewebebiopsie kein PCa auf (Tab. 19; Stand 15.12. 2016). Im Gegensatz dazu konnten in 13 Serumproben methylierte Tumor-DNA für mindestens eins der untersuchten 4 Gene nachgewiesen werden und alle diese Patienten waren tatsächlich an einem PCa erkrankt (Tab. 19). In 20 serum samples of healthy subjects, i. without BPH or PCa diseases, only small proportions of methylated DNA fragments were found, the proportions of which were then measured as cut-off values (PLA2RK0.1 1%, RASSF1A <0.1 1%, GSTP1 <0.05% and SERPINE1 <0.13%) were used. Based on these values, no elevated levels could be detected in 1 1 patients in the group of 20 BPH patients. These 1 1 patients had until today, i. No PCa 2 years after blood sampling and tissue biopsy (Table 19, status 15.12.2016). In contrast, in 13 serum samples, methylated tumor DNA could be detected for at least one of the 4 genes studied, and all of these patients actually had PCa (Table 19).
Bei 9 der 20 Serumproben der BPH-Gruppe wurden ebenfalls methylierte Tumor-DNA für mindestens eins der untersuchten 4 Gene festgestellt. Bei vier dieser BPH-Patienten
(Patienten BPH14, BPH15, BPH17 und BPH18 entwickelte sich nach der Blutentnahmer und Untersuchung in der Folgezeit ein PCa. In 9 of the 20 serum samples of the BPH group, methylated tumor DNA was also detected for at least one of the 4 genes examined. In four of these BPH patients (Patients BPH14, BPH15, BPH17 and BPH18 developed a PCa after the blood collection and examination in the subsequent period.
So ließen sich 10/2016 bei dem Patienten BPH 14 ein PCa nachweisen, nachdem 2014 und 8/2016 in 2 Prostatabiopsien keine malignen Zellen gefunden wurden. In der BBPA-dPCR- Analyse zeigten sich bereits 10/2014 in der Serumprobe Tumor-DNA für RASSF1A und GSTP1 (Tab. 19). For example, PCa was detected in the BPH 14 patient in 10/2016, after no malignant cells were found in 2 prostate biopsies in 2014 and 8/2016. In the BBPA-dPCR analysis, the serum sample already showed tumor DNA for RASSF1A and GSTP1 in 10/2014 (Table 19).
Bei zwei weiteren BPH-Patienten (BPH 15 und BPH 17) zeigten sich 1 1/2014 nach TUR-P bzw. Biopsie jeweils ein PCa mit einem Malignitätsgrad IIa. In den Serumproben konnten 2 bzw. 4 Monate zuvor bereits Tumor-DNA für GSTP1 und SERPINE1 festgestellt werden. Bei dem BPH17-Patient betrug der Quotient freies PSA/ Gesamt-PSA 40,2% und war damit deutlich oberhalb des ct/i-off-Wertes von 20%, trotzdem entwickelte der Patient ein PCa, was bereits 3 Monate zuvor durch deutlich erhöhte Anteile von methylierten GSTP1 und SERPINE1 -DNA-Fragementen mit 9% (normal <0,05%) bzw. 31 ,7% (normal <0,13%) sicher angezeigt wurde (Tab. 19). In two further BPH patients (BPH 15 and BPH 17), one PCa with a malignancy grade IIa was shown in 1/2014 after TUR-P or biopsy. In the serum samples, tumor DNA for GSTP1 and SERPINE1 could already be detected 2 and 4 months before. In the BPH17 patient, the free PSA / total PSA ratio was 40.2%, which was well above the ct / i-off value of 20%; nevertheless, the patient developed a PCa, which was significantly increased 3 months earlier Levels of methylated GSTP1 and SERPINE1 DNA fragments were shown to be safe at 9% (normal <0.05%) and 31.7% (normal <0.13%), respectively (Table 19).
Bei dem BPH18-Patienten wurde auf Grund eines PSA-Anstieges 8/2014 eine Blutentnahme und Gewebebiopsie durchgeführt. In der Histologie zeigte sich in dem Einsendungsmaterial kein Anhalt für intraepitheliale Neoplasie/Dysplasie oder Malignität. Der QfPSA/PSA lag mit 22,5% oberhalb des ct/i-off-Wertes. Auf Grund einer Verdopplung des PSA auf 13,9 ng/ml innerhalb eines Jahres wurde 9/2015 eine weitere Biopsie durchgeführt mit einem erneuten stanzbioptischen Malginitätsausschluß. Im Juli 2016 wurde der Patient auf Grund eines akutem Harnverhaltes und einer Dauerkatheter-pflichtigen Prostatahyperplasie notfallmäßig behandelt und bei einer 9/2016 schließlich durchgeführten TUR-P zeigte sich ein PCa. Interessanterweise war in der Blutprobe von 8/2014, d.h. 2 Jahre zuvor, bereits ein deutlicher Anteil methylierter SERPINE1 -DNA-Fragmente (1 1 ,4% bei einem cut-off-Wert von 0,13%) detektierbar (Tab. 19). The BPH18 patient underwent blood sampling and tissue biopsy due to PSA elevation 8/2014. In histology, the submission material showed no evidence of intraepithelial neoplasia / dysplasia or malignancy. The QfPSA / PSA was 22.5% above the ct / i-off value. Due to a doubling of the PSA to 13.9 ng / ml within one year, another biopsy was carried out in 9/2015 with a renewed punch biopsy exclusion of malignancy. In July 2016, the patient underwent emergency treatment due to acute urinary retention and permanent catheter prostate hyperplasia, and a TUR-P finally performed in 9/2016 revealed a PCa. Interestingly, in the blood sample of 8/2014, i. 2 years earlier, a significant proportion of methylated SERPINE1 DNA fragments (1 1, 4% at a cut-off value of 0.13%) were already detectable (Table 19).
Bei dem BPH16-Patienten, bei dem 2014 ebenfalls eine Blutentnahme und Biopsie durchgeführt wurde, zeigte sich in der Histologie kein Anhalt für intraepitheliale Neoplasie/Dysplasie oder Malignität. Der QfPSA/PSA lag mit 12,9% allerdings unterhalb des ct/i-off-Wertes von 20%. Im März 2016 wurde erneut eine Biopsie durchgeführt, bei der in 1 Biopsiestanze kleinherdig hochgradige intraepitheliale Neoplasieherde (HGPIN) gefunden wurden und deshalb eine erneute Gewebebiopsie in 6 Monaten empfohlen wurde. Diese steht noch aus. Auch bei diesem Patienten wurden in der Serumprobe von 9/2014 bereits mit Hilfe der BBPA-dPCR-Technik erhöhte Werte für alle 4 untersuchten Gene bestimmt (Tab. 19). There was no evidence for intraepithelial neoplasia / dysplasia or malignancy in the BPH16 patient, who also underwent blood sampling and biopsy in 2014. The QfPSA / PSA, however, was below the ct / i-off value of 20% at 12.9%. In March 2016, another biopsy was performed to detect small-scale high-grade intraepithelial neoplasia (HGPIN) in 1 biopsy puncture, suggesting re-tissue biopsy in 6 months. This is still pending. Also in this patient, in the serum sample of 9/2014, increased values for all 4 genes were already determined using the BBPA-dPCR technique (Table 19).
Ebenfalls erhöhte Werte für alle 4 Gene zeigten sich in der Serumprobe von 10/2014 bei dem BPH12-Patienten, bei dem gleichzeitig eine TUR-P durchgeführt wurde und eine
atypische adenomatöse Hyperplasie (AAH), aber kein Karzinom in dem eingeschickten Untersuchungsmaterial (Späne) nachweisbar war. Also, elevated values for all 4 genes were seen in the 10/2014 serum sample in the BPH12 patient who had a TUR-P concurrent and one atypical adenomatous hyperplasia (AAH) but no carcinoma was detectable in the returned specimen (shavings).
Bei dem BPH13-Patienten, bei dem in der Serumprobe von 10/2014 eine deutlich erhöhte Anzahl methylierter GSTP1 -Genfragmente gefunden wurde, zeigten sich in einer ebenfalls 10/2014 durchgeführten Prostatabiopsie einzelne Drüsenproliferate unklarer Dignität. In den Nachuntersuchungen ließ sich keine Racemase-Überexpression und damit kein PCa nachweisen. Im Februar 2016 erfolgte bei diesem Patienten auf Grund einer Dauerkathederpflichtigen Prostatahyperplasie eine TUR-P. Auch hier zeigten sich einzelne Drüsenproliferate unklarer Dignität, deren Nachuntersuchungen aber bisher kein PCa identifizierten (Tab. 19). In the BPH13 patient, in which a significantly increased number of methylated GSTP1 gene fragments were found in the serum sample of 10/2014, single gland proliferates of unclear dignity were also revealed in a 10/2014 prostate biopsy. In the follow-up, no racemase overexpression and thus no PCa could be detected. In February 2016, a TUR-P was performed in this patient due to permanent catheter-dependent prostatic hyperplasia. Here, too, single glandular proliferates of unclear dignity were found, but their follow-up examinations have not yet identified any PCa (Table 19).
Auch bei den BPH-19 und BPH-20-Patienten, bei denen im Serum erhöhte methylierte DNA- Fragmente für alle 4 Gene feststellbar waren, zeigten sich in den Histologieberichten suspekte Befunde nach TUR-P bzw. Prostatabiopsie, wenngleich bisher in beiden Fällen kein PCa eindeutig nachweisbar war (Tab. 19). Also in the BPH-19 and BPH-20 patients in whom elevated methylated DNA fragments were detectable in the serum for all 4 genes, suspicious findings after TUR-P or prostate biopsy were found in the histology reports, although in both cases no PCa was clearly detectable (Table 19).
Zusammengefasst kann festgestellt werden, dass mit Hilfe der BBPA-dPCR-Technik bei allen 20 gesunden Probanden die erhaltenen Werte unterhalb der festgelegten ct/i-off-Werte lagen und damit in keinen der Fälle ein falsch-positives Signal erhalten wurde (diagnostische Spezifität 100%). In der Gruppe der 20 Patienten mit einem PCa wurden 13 als richtig positiv identifiziert (diagnostische Sensitivität 65%). In der Gruppe der 20 Patienten mit einer BPH wurden bei 1 1 Patienten negative Befunde erhalten, d.h. diese Patienten als Gesund (ohne PCa) klassifizeirt. Bei diesen Patienten konnten nach mehr als 2 Jahren (Stand 15.12.2016) seit den erfolgten Blutuntersuchungen tatsächlich kein PCa festgestellt werden. Bei 9 der 20 untersuchten BPH-Patienten fanden sich positive Signale für mindestens ein untersuchtes Zielgen in der BBPA-dPCR. In 4 Fällen fand sich bei diesen Patienten im Zeitraum von 4 Monaten bis 2 Jahren nach den Blutuntersuchungen ein PCa. Bei den anderen 5 BPH- Patienten zeigten sich in der Folgezeit nach der Blutuntersuchung suspekte Befunde in der Histologie, ohne dass bisher maligne Veränderungen klar identifiert werden konnten (Tab. 19). Inwieweit sich auch bei diesen Patienten in der Folgezeit ein PCa entwickeln wird, lässt sich nur durch Untersuchungen in Zukunft beantworten. In summary, it can be stated that with the help of the BBPA-dPCR technique, the values obtained were below the defined ct / i-off values in all 20 healthy volunteers and thus in no case a false-positive signal was obtained (diagnostic specificity 100 %). In the group of 20 patients with a PCa 13 were identified as correctly positive (diagnostic sensitivity 65%). In the group of 20 patients with BPH negative results were obtained in 1 1 patients, i. these patients are classified as healthy (without PCa). In these patients, after more than 2 years (as of 15.12.2016), no PCa could actually be detected since the blood tests had been carried out. In 9 of the 20 BPH patients examined, positive signals for at least one target gene were found in the BBPA-dPCR. In 4 cases, PCa was found in these patients from 4 months to 2 years after the blood tests. In the other 5 BPH patients, suspicious findings in the histology were found in the subsequent period after the blood test, without it being possible to clearly identify malignant changes (Table 19). To what extent a PCa will develop in these patients in the future, can only be answered by investigations in the future.
Damit konnte gezeigt werden, dass mit Hilfe der neuen BBPA-dPCR-Technik eine wesentlich höhere diagnostische Spezifität und ein wesentlich höherer positiver prädiktiver Wert im Vergleich zu den PSA-Bestimmungen gefunden wurden, insbesondere im PSA- Konzentrationsbereich von 2-15 ng/ml, wo keine signifikanten Unterschiede zwischen den Gruppen BPH und PCa vorlagen (Fig. 61 ). It could thus be shown that, with the aid of the new BBPA-dPCR technique, a significantly higher diagnostic specificity and a significantly higher positive predictive value compared to the PSA determinations were found, in particular in the PSA concentration range of 2-15 ng / ml, where there were no significant differences between the groups BPH and PCa (Figure 61).
Wie wichtig die Etablierung neuer Biomarker und die Bereitstellung entsprechender kommerzieller Testkits für die Diagnostik von PCa ist, wurde bereits zu Beginn ausgeführt.
Das neu entwickelte Verfahren der BBPA-dPCR-Technik kann hier einen wesentlichen Beitrag liefern, um unnötige Biopsie zu vermindern oder zu einer rechtzeitigen Biopsie führen, wodurch einerseits unnötige Belastungen und Nebenwirkungen reduziert und andererseits auch die Kosten dieser Behandlungen deutlich vermindert werden können. Allein in Deutschland werden auf Grund der PSA-Bestimmungen jährlich zwischen 250.000 und 350.000 Biopsien durchgeführt, von denen bis zu 75% unnötig sind. The importance of establishing new biomarkers and providing appropriate commercial PCa diagnostic kits was already stated at the beginning. The newly developed method of the BBPA-dPCR technique can make a significant contribution here to reduce unnecessary biopsy or lead to a timely biopsy, which on the one hand unnecessary burdens and side effects can be reduced and on the other hand, the cost of these treatments can be significantly reduced. In Germany alone, between 250,000 and 350,000 biopsies are performed every year, of which up to 75% are unnecessary.
Auch die diagnostische Sensitivität des neuen Verfahrens ist im Vergleich zum PSA deutlich verbessert, insbesondere wenn berücksichtigt wird, dass für die hier beschriebenen Untersuchungen max. 1 ml Serum zur Verfügung standen, die zudem hinsichtlich einer speziellen Präanalytik wie Hemmung von DNasen nicht speziell vorbehandelt wurden. So ist für den Nachweis von Tumor-DNA in Patientenproben das Vorliegen mindestens 1 Tumor- DNA-Kopie Grundvoraussetzung, so dass die Wahrscheinlichkeit, dass so eine Kopie vorliegt, mit der Menge des zu untersuchenden Probenmaterials naturgemäß ansteigt, insbesondere wenn die Tumorerkrankung so früh wie möglich diagnostiziert werden soll, d.h in einer frühen Entwicklungsphase der Tumorerkrankung, um damit eine bereits stattgefundene Metastasierung zu vermeiden. Also, the diagnostic sensitivity of the new method is significantly improved compared to PSA, especially when it is considered that for the studies described here max. 1 ml of serum were available, which were also not specially pretreated for a special pre-analysis such as inhibition of DNases. Thus, for the detection of tumor DNA in patient samples, the presence of at least 1 tumor DNA copy is a prerequisite, so that the probability of such a copy naturally increases with the amount of sample material to be examined, especially if the tumor disease is as early as be diagnosed as possible, ie in an early stage of development of the tumor disease, so as to avoid an already occurred metastasis.
Darüber hinaus stand für die Untersuchung kein weiteres Probenmaterial zur Verfügung, um weitere Primerpaare wie das GSTP1 -1 16bp-Primerpaar einzusetzen oder weitere Zielgene wie das AOX1 , Thrombomodulin und/oder Septin-9 zu untersuchen, wodurch die diagnostische Sensitivität weiter gesteigert werden kann. In addition, no further sample material was available for the assay in order to use further primer pairs such as the GSTP1-1 16bp primer pair or to study further target genes such as AOX1, thrombomodulin and / or septin-9, which can further increase the diagnostic sensitivity.
Insbesondere bei der Diagnostik von PCa, Nieren- und Blasenkarzinomen bieten sich neben der Untersuchung von Blutproben (Serum oder Plasma) auch Urinproben an, welches nichtinvasiv und in größeren Menge gewonnen und für diese Untersuchungen leicht zur Verfügung gestellt werden kann. In particular, in the diagnosis of PCa, renal and bladder carcinomas offer in addition to the examination of blood samples (serum or plasma) and urine samples, which can be obtained non-invasively and in larger quantities and easily made available for these investigations.
Eine hohe analytische und diagnostische Sensitivität bei nahezu 100%-iger Spezifität stellt sich insbesodnere für die Diagnostik von minimalen Resterkrankungen (MRD), z.B. nach einer chirurgischen Operation, wo sich die Frage nach der Notwendigkeit einer anschließenden Chemotherapie/Bestrahlung stellt und auch für die spätere Nachsorge der Patienten ist eine diagnostische Sensitivität und Spezifität von nahezu 100% unabdingbar, sollen so früh wie möglich Rezidive erkannt werden. So zeigte sich z.B. bei dem PCa1 - Patienten in der Histologie nach operativer Entfernung des Tumors eine Infiltration des Resektionsrandes, so dass sich hier die Frage stellt, inwieweit z.B. in der Blutbahn oder über die Urinausscheidung fc-Tumor-DNA nachweisen lässt, die Grundlage für eine intensive Nachsorge z.B. durch einen frühzeitigen erneuten operativen Eingriff sein könnte.
Tabelle 19 : Untersuchungsergebnisse zur Differenzierung zwischen gesunden Probanden, Patienten mit benigner Prostatahyperplasie (BPH) und Patienten mit Prostatakarzinom (PCa) mit PSA-Konzentrationen im Serum, Quotient zwischen freiem und Gesamt-PSA (QfPSA/PSA), Menge methylierter PLA2R1-, RASSF1A (RASS)-, GSTP1- und SERPINE-1 (ΡΛ/fj-DNA-Fragmenten im Verhältnis zu nicht-methylierten Fragmenten und den klinischen Daten. Die ct/i-off-Werte sind in der ersten Zeile angegeben. A high analytical and diagnostic sensitivity with almost 100% specificity is present, especially for the diagnosis of minimal residual disease (MRD), eg after a surgical operation, where the question of the necessity of subsequent chemotherapy / radiation arises and for the later After-care of the patients is a diagnostic sensitivity and specificity of nearly 100% indispensable, as early as possible Reziden be recognized. For example, in PCa1 patients in histology, after surgical removal of the tumor, an infiltration of the edge of the resection occurred, so that the question arises to what extent fc tumor DNA can be detected in the bloodstream or via urine excretion An intensive follow-up could be eg by an early renewed surgical procedure. Table 19: Assay results for differentiation between healthy volunteers, patients with benign prostatic hyperplasia (BPH), and patients with prostate cancer (PCa) with PSA levels in serum, free-to-total PSA (QfPSA / PSA), amount of methylated PLA2R1, RASSF1A (RASS), GSTP1 and SERPINE-1 (ΡΛ / fj DNA fragments relative to unmethylated fragments and clinical data.) The ct / i-off values are given in the first line.
Datum Alter PSA QfPSA/ PLA2R1 RASS GSTP1 PAIl Klinik Date Age PSA QfPSA / PLA2R1 RAS GSTP1 PAIl Clinic
Jahre <4,0 TPSA <0,11% <0,4% <0,05% <0,13% Years <4.0 TPSA <0.11% <0.4% <0.05% <0.13%
ng/ml >20% ng / ml> 20%
GMl 5/2015 22 0,009 0 0 0,056 GMl 5/2015 22 0.009 0 0 0.056
GM2 5/2015 28 0 0 0 0 GM2 5/2015 28 0 0 0 0
GM3 5/2015 22 0 0,4 0 0,003 GM3 5/2015 22 0 0,4 0 0,003
GM4 5/2015 32 0,023 0 0 0 GM4 5/2015 32 0.023 0 0 0
GM5 5/2015 35 0 0 0 0 GM5 5/2015 35 0 0 0 0
GM6 5/2015 23 0 0,007 0 0 GM6 5/2015 23 0 0.007 0 0
GM7 5/2015 30 0 0 0 0 GM7 5/2015 30 0 0 0 0
GM8 5/2015 28 0 0 0,007 0,018 GM8 5/2015 28 0 0 0.007 0.018
GM9 5/2015 44 0,019 0 0,046 0,03 GM9 5/2015 44 0.019 0 0.046 0.03
GM10 5/2015 50 0 0 0 0 GM10 5/2015 50 0 0 0 0
GM11 5/2015 49 0 0 0 0,017 GM11 5/2015 49 0 0 0 0.017
GM12 5/2015 63 0,0025 0,025 0 0 GM12 5/2015 63 0.0025 0.025 0 0
GM13 5/2015 21 0 0 0 0,008 GM13 5/2015 21 0 0 0 0.008
GM14 5/2015 23 0,0026 0 0 0,0029 GM14 5/2015 23 0.0026 0 0 0.0029
GM15 5/2015 23 0 0 0 0 GM15 5/2015 23 0 0 0 0
GM16 5/2015 28 0 0,007 0,005 0,015 GM16 5/2015 28 0 0.007 0.005 0.015
GM17 5/2015 62 0 0 0 0,0027 GM17 5/2015 62 0 0 0 0.0027
GM18 5/2015 29 0 0 0 0,044 GM18 5/2015 29 0 0 0 0.044
GM19 5/2015 23 0 0 0 0,007 GM19 5/2015 23 0 0 0 0.007
GM20 5/2015 46 0,104 0,012 0 0,13 GM20 5/2015 46 0.104 0.012 0 0.13
BPH-1 9/2014 60 8,6 0 0,029 0 0,06 bis heute kein PCa BPH-1 9/2014 60 8.6 0 0.029 0 0.06 until today no PCa
BPH-2 9/2014 73 6,27 18,50 0 0,05 0 0 bis heute kein PCa BPH-2 9/2014 73 6.27 18.50 0 0.05 0 0 until today no PCa
BPH-3 8/2014 75 7,92 0,032 0,003 0 0 bis heute kein PCa BPH-3 8/2014 75 7.92 0.032 0.003 0 0 until today no PCa
BPH-4 8/2014 59 8,56 0,052 0 0 0,009 bis heute kein PCa
BPH-4 8/2014 59 8,56 0,052 0 0 0,009 until today no PCa
BPH-5 8/2014 83 5,2 0,051 0 0,117 0,004 bis heute kein PCa BPH-5 8/2014 83 5.2 0.051 0 0.117 0.004 to date no PCa
BPH-6 8/2014 73 4,19 15,27 0,18 0 0,062 0,168 bis heute kein PCa BPH-6 8/2014 73 4,19 15,27 0,18 0 0,062 0,168 until today no PCa
BPH-7 8/2014 64 6,56 13,72 0,104 0,42 0,066 0 bis heute kein PCa BPH-7 8/2014 64 6,56 13,72 0,104 0,42 0,066 0 until today no PCa
BPH-8 8/2014 66 6,44 15,06 0 0,005 0,04 0,003 bis heute kein PCa BPH-8 8/2014 66 6,44 15,06 0 0,005 0,04 0,003 until today no PCa
BPH-9 7/2014 65 4,84 0 0,017 0,008 1,88 bis heute kein PCa BPH-9 7/2014 65 4.84 0 0.017 0.008 1.88 to date no PCa
BPH-10 7/2014 58 13,2 0 0,028 0,051 0,028 bis heute kein PCa BPH-10 7/2014 58 13,2 0 0,028 0,051 0,028 until today no PCa
BPH-11 7/2014 74 2 0 0 0 0,17 bis heute kein PCa BPH-11 7/2014 74 2 0 0 0 0.17 until today no PCa
BPH-12 10/2014 75 0,33 5,2 2,62 3,24 4,2 10/2014 TU -P (12g) auf Grund obstruktiver BPH-12 10/2014 75 0.33 5.2 2.62 3.24 4.2 10/2014 TU -P (12g) due to obstructive
Prostatahyperplasie; Histologie: Atypische Adematöse Hyperplasie (AAH) [1] prostatic hyperplasia; Histology: Atypical Adematous Hyperplasia (AAH) [1]
BPH-13 10/2014 71 14,23 0 0,009 14,49 0,005 Prostatabiopsie (Pb) 2007 und 2011 negativ, 10/2014 negativ [2]; 2/2016 Pb vom Patienten abgelehnt, aber TUR-P auf Grund Dauerkatheder-pflichtiger BPH-13 10/2014 71 14,23 0 0,009 14,49 0,005 Prostate biopsy (Pb) 2007 and 2011 negative, 10/2014 negative [2]; 2/2016 Pb rejected by the patient, but TUR-P due to permanent catheterization
Prostatahyperplasie: Histologie [3] Prostatic hyperplasia: histology [3]
BPH-14 10/2014 67 6,39 23,63 0 0,83 1,41 0,012 Pb 2010, 2011, 2014 und 8/2016 negativ [4]; 10/2016 BPH-14 10/2014 67 6.39 23.63 0 0.83 1.41 0.012 Pb 2010, 2011, 2014 and 8/2016 negative [4]; 10/2016
PCa-Nachweis Prostate cancer detection
BPH-15 9/2014 66 4,12 0,12 0,061 3,39 0 11/2014 TUR-P bei Prostatakarzinom, pTla, pNx, L0, V0, BPH-15 9/2014 66 4,12 0,12 0,061 3,39 0 11/2014 TUR-P for prostate cancer, pTla, pNx, L0, V0,
Rx, Gleason-Score 3+3=6, Malignitätsgrad IIa mit symptomatischer Prostatahyperplasie Rx, Gleason score 3 + 3 = 6, malignancy grade IIa with symptomatic prostate hyperplasia
BPH-16 9/2014 47 6,53 12,86 1,45 0,75 7,42 1,99 Pb 2012 und 2014 negativ, Pb 3/2016 Nachweis von BPH-16 9/2014 47 6.53 12.86 1.45 0.75 7.42 1.99 Pb 2012 and 2014 negative, Pb 3/2016 Evidence of
HGPIN in einer Biopsiestanze [5]; Rebiopsie in 6 Monaten empfohlen, bisher noch nicht durchgeführt. HGPIN in a biopsy punch [5]; Rebiopsia recommended in 6 months, not yet performed.
BPH-17 8/2014 66 4,75 40,21 0 0,12 9 31,7 Pb 2011 und 7/2014 negativ, hier allerdings Empfehlung einer erneuten Pb auf Grund einer atypischen kleindrüsigen Proliferation in 3-6 Monaten bei PSA: 4,75 ng/ml; Q=40,2%; 11/2014: Nachweis eines PCa (Gleason- Score 3+4=7; Glla) in der Pb [6]; 2/2015: OP des PCa BPH-17 8/2014 66 4,75 40,21 0 0,12 9 31,7 Pb 2011 and 7/2014 negative, here however a recommendation of a renewed Pb due to an atypical small gland proliferation in 3-6 months for PSA: 4 , 75 ng / ml; Q = 40.2%; 11/2014: Demonstration of a PCa (Gleason score 3 + 4 = 7; Glla) in the Pb [6]; 2/2015: OP of the PCa
BPH-18 8/2014 72 6,31 22,50 0,018 0,1 0 11,4 Pb 2013 negativ, 8/2014 PSA-Anstieg auf 6,31 ng/ml, BPH-18 8/2014 72 6.31 22.50 0.018 0.1 0 11.4 Pb 2013 negative, 8/2014 PSA increase to 6.31 ng / ml,
Q=22,5% und Pb [7]; 9/2015 auf Grund PSA-Erhöhung auf 13,9 ng/ml erneute Pb [8]; 7/2016 notfallmäßige Q = 22.5% and Pb [7]; 9/2015 due to PSA increase to 13.9 ng / ml Pb renewed [8]; 7/2016 emergency
Vorstellung bei akutem Harnverhalt; Dauerkatheterpflichtige Prostatahyperplasie; 9/2016: TUR-P mit postoperative Tumorklassifikation Tla; Rx, Gleason-
Presentation in acute urinary retention; Permanent catheter prostate hyperplasia; 9/2016: TUR-P with postoperative tumor classification Tla; Rx, Gleason
Score 3+3=6 [9]. Score 3 + 3 = 6 [9].
BPH-19 8/2014 75 9,31 21,27 1,27 2,26 0,21 0,019 Pb 2006, 2008, 2012 und 2014 negativ; 3/2016 Therapie durch TUR-P (50 g) bei persistierender PSA-Erhöhung von 9,28 ng/ml; Histologie [10]; BPH-19 8/2014 75 9.31 21.27 1.27 2.26 0.21 0.019 Pb 2006, 2008, 2012 and 2014 negative; 3/2016 Therapy by TUR-P (50 g) with persistent PSA elevation of 9.28 ng / ml; Histology [10];
BPH-20 7/2014 73 4,75 1,52 2,16 0 1,6 Pb 2012 und 2013 negativ; 8/2014: Pb bei PSA von 4,75 ng/ml; Histologie [11]; BPH-20 7/2014 73 4.75 1.52 2.16 0 1.6 Pb negative in 2012 and 2013; 8/2014: Pb at PSA of 4.75 ng / ml; Histology [11];
PCal 59 6,35 2,86 0 0 0,08 10/2014: OP des PCa; pT2c, cNO, cMO, LO, VO, Pnl, Rx (im linkseitigen Apex beschriebene Infiltration des Resektionsrandes), Gleason-Score 3+4=7, Malignitätsgrad IIb [12] PCal 59 6,35 2,86 0 0 0,08 10/2014: OP of PCa; pT2c, cNO, cMO, LO, VO, PnI, Rx (infiltration of the resection margin described in the left apex), Gleason score 3 + 4 = 7, degree of malignancy IIb [12]
PCa2 60 9,42 0 0,19 0 0,14 10/2014 OP des PCa; pT2c, pNO (0/10 LK), LO, VO, Pnl, RO PCa2 60 9,42 0 0,19 0 0,14 10/2014 OP of the PCa; pT2c, pNO (0/10 LK), LO, VO, PnI, RO
(lokal), Gleason-Score: 3 + 3 = 6, Malignitätsgrad IIa Pb 04/2014: 3/12 Zylindern positiv (local), Gleason score: 3 + 3 = 6, malignancy grade IIa Pb 04/2014: 3/12 cylinders positive
PCa3 72 8,4 0 0,88 0 0 10/2014 OP des PCa; pT2c, pNO (0/18 LK), cMO, LO, VO, PCa3 72 8,4 0 0,88 0 0 10/2014 OP of the PCa; pT2c, pNO (0/18 LK), cMO, LO, VO,
Pnl, RO (lokal), Gleason-Score: 4+3=7; tertiäres Differenzierungsmuster Gleason 5, Malignitätsgrad lllb 8/2014 Pb: 1/12 Zyl. links positiv Pnl, RO (local), Gleason score: 4 + 3 = 7; tertiary differentiation pattern Gleason 5, degree of malignancy lllb 8/2014 Pb: 1/12 cyl. left positive
PCa4 60 3,53 0 6,5 11,5 0,27 10/2014 OP des PCa; pT2c, pNO (0/19 LK), cMO, LO, VO, PCa4 60 3.53 0 6.5 11.5 0.27 10/2014 OP of PCa; pT2c, pNO (0/19 LK), cMO, LO, VO,
Pnl, RO (lokal), Gleason-Score 3+4=7, Malignitätsgrad IIa 8/2014 Pb: cTlc ( 8/12 Zyl. pos. bds.) Pnl, RO (local), Gleason score 3 + 4 = 7, malignancy grade IIa 8/2014 Pb: cTlc (8/12 cyl. Pos. Bds.)
PCa5 67 13,16 0,012 0,28 1,2 0 9/2014 OP des PCa; pT2c, pNO (0/28 LK), LO, VO, PnO, RO PCa5 67 13.16 0.012 0.28 1.2 0 9/2014 OP of PCa; pT2c, pNO (0/28 LK), LO, VO, PnO, RO
(lokal), Gleason-Score: 3+4=7, Malignitätsgrad IIa (local), Gleason score: 3 + 4 = 7, malignancy grade IIa
PCa6 62 3,6 0 21,6 7,4 0,07 9/2014 OP des PCa; pT2c, pNO (0/11 LK), cMO, LO, VO, PCa6 62 3,6 0 21,6 7,4 0,07 9/2014 OP of PCa; pT2c, pNO (0/11 LK), cMO, LO, VO,
Pnl, RO (lokal) Gleason-Score: 3+4=7, Malignitätsgrad IIa; 5/2014: Pb: 1/12 Zylinder links positiv (5%) Pnl, RO (local) Gleason score: 3 + 4 = 7, malignancy grade IIa; 5/2014: Pb: 1/12 cylinder left positive (5%)
PCa7 68 4,25 1,02 1,28 0 0,011 9/2014 OP des PCa; pT2c pNO (0/20 LK) cMO LO VO Pnl Rl PCa7 68 4,25 1,02 1,28 0 0,011 9/2014 OP of PCa; pT2c pNO (0/20 LK) cMO LO VO Pnl Rl
(dorsal beidseits), Gleason-Score: 3+4=7, tertiäres Differenzierungsmuster Gleason 5, Malignitätsgrad IIa, 7/2014 Pb: 2/12 Zyl. rechts positiv (posterior dorsal), Gleason score: 3 + 4 = 7, tertiary differentiation pattern Gleason 5, degree of malignancy IIa, 7/2014 Pb: 2/12 cyl. right positive
PCa8 60 6,45 0,019 0,4 0,85 0,014 9/2014 MR-fusionierte perineale (6 Zylinder) und TRUS- gestützte transrektale (12 Zylinder) Pb: 1/18 Zylindern rechts positiv; Gleason-Score: 3+3=6 PCa8 60 6.45 0.019 0.4 0.85 0.014 9/2014 MR fused perineal (6 cylinders) and TRUS supported transrectal (12 cylinders) Pb: 1/18 right positive cylinders; Gleason score: 3 + 3 = 6
PCa9 44 8,73 0,79 0,015 0,52 0,045 9/2014 OP des PCa; pT2c, pNO (0/17 LK), cMO, LO, VO,
PCa9 44 8.73 0.79 0.015 0.52 0.045 9/2014 OP of PCa; pT2c, pNO (0/17 LK), cMO, LO, VO,
Pnl, RO (lokal), Gleason-Score: 3+4=7, Malignitätsgrad IIa Pnl, RO (local), Gleason score: 3 + 4 = 7, malignancy grade IIa
6/2014 Pb rechts 1/6 und links 3/6 Zylindern positiv 6/2014 Pb right 1/6 and left 3/6 cylinders positive
PCalO 60 10,86 0,11 0,037 1,36 0,42 9/2014 OP des PCa; pT2c, pNO (0/11 LK), cMO, LO, VO, PCalO 60 10.86 0.11 0.037 1.36 0.42 9/2014 OP of PCa; pT2c, pNO (0/11 LK), cMO, LO, VO,
Pnl, RO (lokal), Gleason-Score 3+4=7; Malignitätsgrad I Ia Pnl, RO (local), Gleason score 3 + 4 = 7; Grade of malignancy I Ia
PCall 67 15,05 0 0 0,51 0,077 8/2014 OP des PCa; pT2c, pNO (0/16 LK), cMO, LO, VO, PCall 67 15,05 0 0 0,51 0,077 8/2014 OP of PCa; pT2c, pNO (0/16 LK), cMO, LO, VO,
PnO, RO (lokal), Gleason-Score: 3+4=7; Malignitätsgrad IIa 12/2013 Pb: 3/20 Zylindern bds. Gleason 3+3=6 PnO, RO (local), Gleason score: 3 + 4 = 7; Malignancy grade IIa 12/2013 Pb: 3/20 cylinders bds. Gleason 3 + 3 = 6
PCal2 70 14,19 0 0,67 0 0,043 8/2014 OP des PCa; pT3b, pNO (0/13 LK), cMO, LO, VO, PCal2 70 14,19 0 0,67 0 0,043 8/2014 OP of the PCa; pT3b, pNO (0/13 LK), cMO, LO, VO,
Pnl, RO (lokal), Gleason-Score 4+3=7, Malignitätsgrad IIb Pnl, RO (local), Gleason score 4 + 3 = 7, grade IIb malignancy
PCal3 73 7,2 0,59 0,6 0 0,0026 8/2014 OP des PCa; pT2c, pNO (0/10 LK), cMO, LO, VO, PCal3 73 7.2 0.59 0.6 0 0.0026 8/2014 OP of PCa; pT2c, pNO (0/10 LK), cMO, LO, VO,
Pnl, RO (lokal), Gleason-Score 3+4=7; Malignitätsgrad IIa Pnl, RO (local), Gleason score 3 + 4 = 7; Malignancy grade IIa
PCal4 64 2,22 0 0,06 0 0 10/2014 OP des PCa; pT2c, pNO (0/14 LK), cMO, LO, VO, PCal4 64 2.22 0 0.06 0 0 10/2014 OP of the PCa; pT2c, pNO (0/14 LK), cMO, LO, VO,
Pnl, RO (lokal), Gleason-Score: 3+4=7, Malignitätsgrad I Ia 06/2014: TUR-P Gleason 3+3 =6 Pnl, RO (local), Gleason score: 3 + 4 = 7, malignancy I Ia 06/2014: TUR-P Gleason 3 + 3 = 6
PCal5 75 10,34 0,005 0,004 0 0,017 9/2014 OP des PCa; pT2c, pNO (0/16 LK), cMO, L0,V0, Pnl, PCal5 75 10,34 0,005 0,004 0 0,017 9/2014 OP of the PCa; pT2c, pNO (0/16 LK), cMO, L0, V0, PnI,
Rl (multifokal dorsoperipher rechts), Gleason-Score 4+3=7, Malignitätsgrad IIb Rl (multifocal dorsoperipher right), Gleason score 4 + 3 = 7, grade IIb malignancy
PCal6 69 5,72 0,044 0,011 0,033 0,133 9/2014 OP des PCa; pT2c, pNO (0/24 LK), cMO, LO, VO, PCal6 69 5.72 0.044 0.011 0.033 0.133 9/2014 OP of PCa; pT2c, pNO (0/24 LK), cMO, LO, VO,
Pnl, RO (lokal), Gleason-Score 3+4=7, Malignitätsgrad I Ib, 07/2014 Pb (5/7 Zylinder links positiv) Pnl, RO (local), Gleason score 3 + 4 = 7, degree of malignancy I Ib, 07/2014 Pb (5/7 cylinder left positive)
PCal7 59 8,52 0 0,054 0 0 9/2014 Pb mit 2/20 Zylinder pos., Gleason-Score 3+3=6; PCal7 59 8,52 0 0,054 0 0 9/2014 Pb with 2/20 cylinder pos., Gleason score 3 + 3 = 6;
Malignitätsgrad I Ia Grade of malignancy I Ia
PCal8 71 0,12 0 0,059 0,096 0,025 8/2014 OP des PCa; pT2a, pNO (0/13 LK), cMO, LO, VO, PCal8 71 0.12 0 0.059 0.096 0.025 8/2014 OP of PCa; pT2a, pNO (0/13 LK), cMO, LO, VO,
Pnl, RO (lokal), Gleason-Score: 4+3=7, drittes Differenzierungsmuster Gleason 5, Malignitätsgrad l i la 02/2014 Pb: 1/6 Zylindern rechts positiv, Gleason-Score: 3+3=6 Pnl, RO (local), Gleason score: 4 + 3 = 7, third differentiation pattern Gleason 5, degree of malignancies l i la 02/2014 Pb: 1/6 right positive cylinders, Gleason score: 3 + 3 = 6
PCa l9 79 4,48 0 0 0 0,01 8/2014 OP des PCa; pT2c, pNO (0/10 LK), cMO, LO, VO, PCa l9 79 4,48 0 0 0 0,01 8/2014 OP of PCa; pT2c, pNO (0/10 LK), cMO, LO, VO,
Pnl, RO (lokal), Gleason-Score: 3+4=7, Malignitätsgrad I Ib 7/2014 Pb: 6/12 Zylindern pos. bds., Gleason 3+4=7 Pnl, RO (local), Gleason score: 3 + 4 = 7, degree of malignancy I Ib 7/2014 Pb: 6/12 cylinders pos. bds., Gleason 3 + 4 = 7
PCa20 60 10,88 0,062 0 0 0,009 8/2014 OP des PCa; pT3a, pNO (0/25 LK), cMO, LO, VO, PCa20 60 10.88 0.062 0 0 0.009 8/2014 OP of PCa; pT3a, pNO (0/25 LK), cMO, LO, VO,
Pnl, RO (lokal), Gleason-Score: 3+4=7, Malignitätsgrad II b
Pnl, RO (local), Gleason score: 3 + 4 = 7, malignancy grade II b
[1 ] 10/2014: TUR-P (12g) infolge obstruktiver Prostatahyperplasie; Histologie: Aufgrund einzelner Drüsenproliferate unklarer Dignität wurden immunhistochemische Zusatzuntersuchungen (mit Antikörpern gegen CK5/14 und Racemase) durchgeführt. Dabei zeigten sich die Drüsen mit inkompletten Verlust basaler Zytokeratine ohne wesentliche Überexpression der Racemase, sodass es sich hier um eine atypische adenomatöse Hyperplasie (AAH) handelte, was ein invasives Karzinom am vorliegenden Material bisher nicht belegen konnte. [1] 10/2014: TUR-P (12g) due to obstructive prostatic hyperplasia; Histology: Immunohistochemical additional studies (with antibodies against CK5 / 14 and racemase) were carried out on the basis of single gland proliferates of unknown dignity. The glands with incomplete loss of basal cytokeratins showed no significant overexpression of the racemase, so this was an atypical adenomatous hyperplasia (AAH), which so far could not prove an invasive carcinoma of the present material.
[2] 10/2014: TRUS-gestützte Sättigungsbiopsie (25 Biopsiezylinder) in Folge einer PSA-Erhöhung auf 14,23 ng/ml. [2] 10/2014: TRUS-assisted satiation biopsy (25 biopsy cylinders) as a result of a PSA increase to 14.23 ng / ml.
1 . bis 13. Prostatastanzzylindermaterial mit einzelnen, teilweise in kleineren Gruppen gelegenen hyperplastischen Drüsen sowie einer überwiegend diffusen Hyperplasie des fibromuskulären Stromas, herdförmig auch mit regressiven Veränderungen mit Atrophie und postatropher Hyperplasie prostatischer Drüsen sowie einer örtlich mäßig ausgeprägten Basalzellhyperplasie, im Übrigen mit einer mäßiggradigen chronischen, fokal gering aktiven Prostatitis, wobei aufgrund einzelner Drüsenproliferate unklarer Dignität in Einsendung 2 und 7 noch immunhistochemische Zusatzuntersuchungen durchgeführt wurden. 1 . to 13th Prostatanzanzzylindermaterial with single, partially in smaller groups located hyperplastic glands and a predominantly diffuse hyperplasia of the fibromuscular stroma, herd-shaped with regressive changes with atrophy and postatropic prostate gland hyperplasia and a locally moderate basal cell hyperplasia, otherwise with a moderate chronic, focal low-grade prostatitis, in which additional immunohistochemical additional examinations were carried out due to single gland proliferates of unclear dignity in submission 2 and 7.
In der Nachuntersuchung zeigte sich im Bereich der beschriebenen Drüsenproliferate überwiegend eine erhaltene Expression basaler Zytokeratine (mit Expression von CK5/14 ohne Nachweis einer Überexpression der Racemase, sodass es sich hier um atrophe Prostatadrüsen handelt. Im vorliegenden Material kein Anhalt für Malignität. In the follow-up study, predominantly expression of basal cytokeratins (with expression of CK5 / 14 without evidence of overexpression of the racemase in the range of the described glandular proliferates) showed that these are atropheous prostate glands in the present material no indication of malignancy.
[3] 2/2016: TUR-P (94 g) in Folge einer Dauerkatheter-pflichtigen Prostatahyperplasie bei weiteren PSA-Anstieg auf 20,5 ng/ml. [3] 2/2016: TUR-P (94 g) as a result of permanent catheter-dependent prostate hyperplasia with further increase in PSA to 20.5 ng / ml.
Aufgrund einzelner Drüsenproliferate unklarer Dignität wurden noch immunhistochemische Untersuchungen (mit Antikörpern gegen CK5/14, Racemase, Calretinin, Panzytokeratin, CK7, Cadherin 17, p63, PAX8, CD34, 34ßE12, Androgen-Rezeptor, EMA, PSA und WT1 ) durchgeführt. Dabei ließ sich in dem beschriebenen auffälligen Drüsenproliferat eine Expression von Panzytokeratin sowie z.T. von CK7 und EMA und nukleär von Androgen-Rezeptor nachweisen bei fehlender Expression von WT1 , PSA, Racemase, Cadherin 17, 34ßE12 und p63 sowie überwiegend fehlender Expression von CD34 und PAX8 sowie auch von Calretinin. Der Ki67-Proliferationsindex gering (ca. 1 %), so dass es sich insgesamt unter Einbeziehung der Immunhistologie und der in der PAS nachweisbaren PAS-positiven intraluminalen Einschlüsse bzw. Sekretionen um ein nephrogenes Adenom handelt. Im vorliegenden Material kein Anhalt für Malignität. Immunohistochemical studies (with antibodies to CK5 / 14, racemase, calretinin, pancytokeratin, CK7, cadherin 17, p63, PAX8, CD34, 34ßE12, androgen receptor, EMA, PSA and WT1) were performed on the basis of single gland proliferates of unknown dignity. It could be in the described conspicuous glandular proliferate expression of pancytokeratin and z.T. of CK7 and EMA and nuclear of androgen receptor in the absence of expression of WT1, PSA, racemase, cadherin 17, 34ßE12 and p63 and predominantly lack of expression of CD34 and PAX8 as well as calretinin. The Ki67 proliferation index is low (about 1%), so that it is a nephrogenic adenoma with the inclusion of immunohistology and PAS-positive intraluminal inclusions or secretions detectable in the PAS. No evidence of malignancy in this material.
[4] 8/2016: MR-fusionierte perineale (4 Biopsiezylinder) und TRUS-gestützte transrektale (12 Biopsiezylinder) Prostatabiopsie [4] 8/2016: MR-fused perineal (4 biopsy cylinders) and TRUS-assisted transrectal (12 biopsy cylinders) prostate biopsy
1 .-16. Prostatastanzzylinder mit fibromuskulärer nodulärer Stromahyperplasie, mit Atrophie der Prostatadrüsen sowie auch hypertrophen 1. -16. Prostate balance cylinder with fibromuscular nodular stromal hyperplasia, with atrophy of the prostate glands as well as hypertrophic
Prostatadrüsen, fokal mit einer chronischen uncharakteristischen Entzündungsreaktion sowie fokal mit Plattenepithelmetaplasie in den größerenProstate glands, focal with a chronic uncharacteristic inflammatory response as well as focal with squamous cell metaplasia in the larger ones
Ausführungsgängen sowie mit Nachweis einer Urothelmetaplasie in größeren Ausführungsgängen. Im vorliegenden Einsendungsmaterial keinExcretory ducts as well as with proof of a urothelium metaplasia in larger excretory ducts. In the submitted submission material no
Anhalt für intraepitheliale Neoplasie/Dysplasie oder Malignität. Der PSA-Wert betrug 10,94 ng/ml. 10/2016: erfolgte dann allerdings der PCa-Persistence for intraepithelial neoplasia / dysplasia or malignancy. The PSA value was 10.94 ng / ml. 10/2016: then, however, the PCa took place
Nachweis proof
[5] 3/2016: 1. -17. Prostatastanzzylinder mit benigner adenomatöser, teils fibromyomatöser Hyperplasie des Parenchyms, stellenweise mit deutlich ausgeprägter Basalzellhyperplasie des Drüsenepithels bzw. Atrophie der Drüsen, stellenweise mit geringer Sekretretention bzw. Nachweis einzelner Corpora amylacea in den Drüsenlumina, in der Einsendung 7 mit kleinherdig nachweisbaren hochgradigen prostatischen
[5] 3/2016: 1. -17. Prostate cylinder with benign adenomatous, partly fibromyomatous hyperplasia of the parenchyma, in places with pronounced basal cell hyperplasia of the glandular epithelium or atrophy of the glands, sometimes with low secretion retention or detection of individual Corpora amylacea in the glandular lumina, in the submission 7 with low-grade detectable high-grade prostatic
intraepithelialen Neoplasieherden (HGPIN) und stellenweise einer nicht mehr frischen, bis mäßiggradig chronischen und floriden unspezifischen Prostatitis. Intraepithelial Neoplasieherden (HGPIN) and in places a no longer fresh, to moderately chronic and florid nonspecific Prostatitis.
[6] 11/2014: 1 von 17 Prostatastanzzylindermaterial (rechts apikal peripher) mit kleinherdiger Infiltration durch ein überwiegend gering drüsig, kleinherdig, konfluierend wachsendes Adenokarzinom der Prostata mit mittelgradiger Kernpleomorphie, etwa 5% der Stammzylinderfläche einnehmend, größte zusammenhängende Karzinomherd dabei 1 ,2 mm messend. Gleason-Score: 3 + 4 = 7 (davon Gleason 3 90%, Gleason 4 10 %). Malignitätsgrad IIa [6] 11/2014: 1 of 17 Prostate dance cylinder material (right apical peripheral) with small focal infiltration by a predominantly low glandular, small-term, confluent adenocarcinoma of the prostate gland with moderate nucleus leomorphism, occupying about 5% of the stem cylinder area, largest contiguous carcinoma focus 1, 2 measuring mm. Gleason score: 3 + 4 = 7 (of which Gleason 3 is 90%, Gleason 4 is 10%). Malignancy grade IIa
[7] 8/2014: MRT-fusionierte, ultraschallgestützte transperineale Prostatabiopsie (6 Biopsiezylinder) und TRUS-gestützte Prostatasbiopsie: 1 .-18. Prostatastanzzylinder mit knotiger Stromahyperplasie, Hyperplasie der Prostatadrüsen und z.T. atrophen Prostatadrüsen, mit mehreren Corpora amylacea in etwas dilatierten Drüsen. Im vorliegenden Einsendungsmaterial kein Anhalt für intraepitheliale Neoplasie/Dysplasie oder Malignität. [8] 8/2014: MRI-fused, ultrasound-assisted transperineal prostate biopsy (6 biopsy cylinders) and TRUS-assisted prostate biopsy: 1.-18. Prostate cylinder with nodular stromal hyperplasia, hyperplasia of the prostate glands and z.T. atrophic prostate glands, with multiple corpora amylacea in somewhat dilated glands. No evidence of intraepithelial neoplasia / dysplasia or malignancy in this submission material.
[8] 9/2015: MRT-fusionierte transperineale Prostatabiopsie (8 Zylinder) und transrektale Prostatabiopsie (12 Zylinder); MRT zeigte eine Pirads 4 Läsionen links basal in der Transitionalzone und rechts im mittleren Prostatadrittel in der Transitionalzone; Die digital-rektale Untersuchung ergab keinen suspekten Tastbefund. Es wurden insgesamt 20 Zylinder entnommen und es ergab sich ein stanzbioptischer Malginitätsausschluss bei erneuter PSA-Messung von 14,2 ng/ml. [8] 9/2015: MRI-fused transperineal prostate biopsy (8 cylinders) and transrectal prostate biopsy (12 cylinders); MRI showed a Pirads 4 lesion on the left basal in the transitional zone and on the right in the middle third of the prostate in the transitional zone; The digital rectal examination revealed no suspicious tactile findings. A total of 20 cylinders were withdrawn and a punch biopsy exclusion of malignancy with a renewed PSA measurement of 14.2 ng / ml resulted.
[9] 9/2016: Histologisch zeigte sich ein kleindrüsig wachsendes Adenokarzinom mit mäßiggradiger Kernpleomorphie in einzelnen Spänen, wobei das Karzinom weiterhin weniger als 5% der untersuchten Fläche einnahm. Therapieempfehlung: aktive Überwachung mit Kontrollbiopsie in 3-6 Monaten oder alternativ Wachtful Waiting. [9] 9/2016: Histologically, a small glandular adenocarcinoma with moderate nuclear leoporphosis was found in individual shavings, with the carcinoma still occupying less than 5% of the examined area. Therapy recommendation: active monitoring with control biopsy in 3-6 months or alternatively Wachtful Waiting.
[10] 3/2016: Prostataresektionsspäne mit nodulären, muskulären und glandulären (adenomyomatösen) Prostatahyperplasie, fokal mit Basalzellhyperplasie und mit zystisch erweiterten Drüsen mit Sekretretention und einer teils chronischen, teils resorptiven Entzündungsreaktion, vermehrt mit Nachweis von Corpora amylacea, fokal mit Kalkinkrustationen im Stroma, miterfasst Anteile der Pars prostatica urethrae mit weitgehend regelhaftem Urothel. Am vorliegenden Material kein Anhalt für intraepitheliale Neoplasie/Dysplasie oder Malignität. [10] 3/2016: prostate resection chips with nodular, muscular and glandular (adenomyomatous) prostate hyperplasia, focal with basal cell hyperplasia and with cystic dilated glands with secretory retention and a partly chronic, sometimes resorptive inflammatory reaction, increased with evidence of Corpora amylacea, focal with lime incrustations in the stroma , also includes parts of the pars prostatica urethrae with largely regular urothelium. No evidence of intraepithelial neoplasia / dysplasia or malignancy on this material.
[1 1 ] 8/2014: MRT-fusionierte, ultraschall-gestützte transperineale (8 Zylinder) Prostatabiopsie und transrektale ultraschallgestützte Prostatabiopsie (12 Zylinder); 1 . bis 20. Prostatastanzzylinder mit knotiger Stromahyperplasie und Atrophie der Prostatadrüsen und z.T. hypertrophen Prostatadrüsen, mit einer fokalen chronischen uncharakteristischen Entzündungsreaktion, in den Einsendungen 9 und 12 jeweils mit auffälligen kleindrüsigen Proliferaten unklarer Dignität (ehemals ASAP). Immunhistologische Nachuntersuchungen zeigten in den Einsendungen 9 und 12 kleindrüsige Proliferate mit unterbrochener CK5/14-positiven Basalzellschicht. Die Reaktion für Racemase verlief negativ und somit kein Anhalt für ein Prostatakarzinom.
[1 1] 8/2014: MRI-fused, ultrasound-assisted transperineal (8-cylinder) prostate biopsy and transrectal ultrasound-guided prostate biopsy (12 cylinders); 1 . to 20. Prostate cylinders with nodular stromal hyperplasia and atrophy of the prostate glands and sometimes hypertrophic prostate glands, with a focal chronic uncharacteristic inflammatory reaction, in Submissions 9 and 12, each with conspicuous small-mouthed proliferates of unclear dignity (formerly ASAP). Immunohistological follow-up examinations in Submissions 9 and 12 showed small-mouthed proliferates with an interrupted CK5 / 14-positive basal cell layer. The reaction for racemase was negative and therefore no evidence of prostate cancer.
[12] 11/2014: Aufgrund des histopathologischen Befundes (Rx-Resektion) empfehlen wir die PSA-gestützte Nachsorge mit frühzeitiger Salvage- Strahlentherapie bei PSA-Rezidiv, alternativ eine adjuvante RTx. Außerdem PSA-Kontrollen (PSA=0,12 ng/ml) zur Bestätigung der postoperativen PSA-Normalisierung.
[12] 11/2014: Due to histopathological findings (Rx resection), we recommend PSA-based follow-up with early salvage radiotherapy for PSA recurrence, alternatively adjuvant RTx. Also, PSA controls (PSA = 0.12 ng / ml) to confirm postoperative PSA normalization.
Ausführungsbeispiel 12: Untersuchung von Serumproben gesunder und an Mamma- und Ovarialkarzinomen erkrankter Patientinnen Exemplary Embodiment 12 Examination of Serum Samples of Healthy Female Patients Affected with Mammary and Ovarian Carcinomas
Die Untersuchungen haben gezeigt, dass vor allem unter Einsatz des GSTP1 -1 16bp- Primerpaares sehr niedrige Methylierungsraten (< 0,05%) in allen Serumproben gesunder Probanden zu finden waren, während in den Serumproben von Probandinnen mit Mamma- und Ovarialkarzinomen deutlich davon zu unterscheidende erhöhte Werte gemessen wurden (Tab. 31 ). Während mit dem Primerpaar-GSTP1 -1 16bp 18 von 23 Proben positiv waren, ließen sich in 5 von 23 Proben unter Verwendung des GSTP1 -120bp-Primerpaares und in 12 von 23 Proben unter Verwendung des RASSF1A-1 17bp-Primerpaares positive Signale finden. Interessant dabei war, dass unter Verwendung des GSTP1 -120bp-Primerpaares erneut in 2 Patientenproben positive Signale gemessen wurden, die unter Einsatz des GSTP1 -1 16bp-Primerpaares negativ waren, so dass die Kombination beider Primerpaare, getrennt oder gleichzeitig in einem Ansatz, zu einer erhöhten diagnostischen Sensitivität führen kann. Eine diagnostische Sensitivität von 100% bei einer diagnostischen Spezifität von 100% wurde erreicht, wenn die Daten, die mit den GSTP1 -Primern erhalten wurden, mit denen der mittels RASSFIA-Primern erhaltenen Daten kombiniert wurden (Tab. 31 ). The studies have shown that, especially with the use of the GSTP1 -1 16bp primer pair, very low methylation rates (<0.05%) were found in all serum samples from healthy volunteers, whereas in the serum samples from test subjects with breast and ovarian carcinomas significantly differing elevated values were measured (Table 31). While 18 of 23 samples were positive with the primer pair GSTP1-1 16bp, positive signals were found in 5 out of 23 samples using the GSTP1 -120bp primer pair and in 12 out of 23 samples using the RASSF1A-1 17bp primer pair. Interestingly, using the GSTP1-120bp primer pair, positive signals were again measured in 2 patient samples that were negative using the GSTP1-1 16bp primer pair, allowing the combination of both primer pairs, separately or simultaneously in one approach may lead to increased diagnostic sensitivity. A diagnostic sensitivity of 100% with a diagnostic specificity of 100% was achieved when the data obtained with the GSTP1 primers were combined with those obtained using RASSFIA primers (Table 31).
Interessant waren auch die Daten, die von einer Patientin mit primär ossär und hepatisch metastasiertem Mamma-CA vor (P8a) und nach 8-wöchiger Chemotherapie (P8b) stammten. Neben dem Abfall des CA-15-3-Wertes von 941 ,4 U/ml auf 133,0 U/ml war ein Abfall der Methylierungswerte für GSTP1 -1 16bp von 0,9% auf 0% und RASSF1A-1 17bp von 18,9% auf 2% zu verzeichnen. Dieser Befund lässt auf eine gute Therapieantwort schließen. Die Methylierungswerte GSTP1 und RASSF1A lagen nach Beendigung der Behandlung bereits im Normbereich, während der CA-15-3-Wert noch erhöht war, was durch eine längere biologische Halbwertzeit begründet sein kann. Diese Ergebnisse verdeutlichen das Potential der BBPA-dPCR-Untersuchungen für die unmittelbare Therapie- und Verlaufskontrolle und dem Nachweis einer MRD, indem die Konzentration von fcT-DNA bei erfolgreicher Therapie wesentlich schneller abfallen als die herkömmlichen Tumormarker wie das CA 15-3. Damit kann dieses Verfahren auch für Therapieentscheidungen wie die Frage nach dem Erfordernis einer anschließenden unmittelbaren Chemo- und/oder Bestrahlungstherapie nach einer erfolgreichen Operation des Tumors unterstützend eingesetzt werden, je nachdem ob die initial erhöht gefundenen fcT-DNA-Konzentrationen in den Normbereich gefallen bzw. im günstigsten Fall nicht mehr nachweisbar sind, so dass eine MRD ausgeschlossen werden kann. Also interesting were the data obtained from a patient with primary osseous and hepatic metastatic mammary CA before (P8a) and after 8 weeks of chemotherapy (P8b). In addition to the decrease in CA-15-3 from 941.4 U / ml to 133.0 U / ml, the methylation values for GSTP1 -1 16bp decreased from 0.9% to 0% and RASSF1A-1 17bp to 18% 9% to 2%. This finding suggests a good response to therapy. The methylation values GSTP1 and RASSF1A were already in the normal range after the end of the treatment, while the CA-15-3 value was still increased, which may be due to a longer biological half-life. These results illustrate the potential of BBPA-dPCR assays for immediate therapy and follow-up and evidence of MRD, as the concentration of fcT DNA decreases significantly faster than traditional tumor markers such as CA 15-3 in successful therapy. Thus, this method can also be used as a supportive aid for therapy decisions such as the question of the requirement for subsequent immediate chemotherapy and / or radiation therapy following successful operation of the tumor, depending on whether the initially elevated fcT DNA concentrations have fallen within the normal range or in the best case, are no longer detectable, so that an MRD can be excluded.
Die Probe (P24) stammte von einer 32-jährigen Patientin, bei der eine pathologische Mutation im BRCA 1-Gen vorlag und die mit einem familiären Risiko für Mamma- und Ovarialkarzinom einhergeht. So erkrankte die Mutter der Patientin bereits mit 33 Jahren an
einem Mamma-Karzinom, die Großmutter mit 56 Jahren. Bei der Patientin wurde auf eigenem Wunsch eine prophylaktische subkutane Mastektomie durchgeführt. Die histologischen Untersuchungen der Operationspräparate ergaben keinen Anhalt für intraepitheliale Neoplasie/Dysplasie oder Malignitat und auch der Tumormarker CA 15-3 war normal. Überraschend zeigten sich jedoch bereits erhöhte Werte beim Einsatz des GSTP1 - 1 16bp-Primers in der BBPA-dPCR (Tab. 31 ). Daraus lässt sich schließen, dass mit Hilfe dieser Technik frühzeitig pathologische Veränderungen z.B. durch eine Blutuntersuchung (Liquid Biopsy) bei Patientinnen mit erhöhtem familiären Risiko für Mamma- und Ovarialkarzinom angezeigt werden können und dieses Verfahren bei der Entscheidung für eine prophylaktische Mastektomie bzw. Ovarektomie unterstützend eingesetzt werden kann, insbesondere wenn die Familienplanungen bei den betroffenen Patientinnen noch nicht abgeschlossen sind. The sample (P24) was from a 32-year-old female patient with a pathological mutation in the BRCA 1 gene and associated with a familial risk for breast and ovarian cancer. Thus, the mother of the patient fell ill at the age of 33 a mammary carcinoma, the grandmother with 56 years. At the patient's request, a prophylactic subcutaneous mastectomy was performed. Histological examination of surgical specimens revealed no evidence of intraepithelial neoplasia / dysplasia or malignancy, and the tumor marker CA 15-3 was also normal. Surprisingly, however, increased levels of the use of the GSTP1 - 1 16bp primer in the BBPA-dPCR (Table 31) were found. From this it can be concluded that with the help of this technique early pathological changes, for example by a blood test (liquid biopsy) in patients with increased familial risk of breast and ovarian cancer can be displayed and this method in the decision for a prophylactic mastectomy or ovariectomy used supportive especially if the family plans for the affected patients have not yet been completed.
Die hier beschriebene neue BBPA-dPCR-Technik kann prinzipiell für alle potentiellen Zielgensequenzen eingesetzt werden, deren Methylierungsgrad sich zwischen Gesund und Krank unterscheidet. Nach Konstruktion von Primern und Sonden entsprechend den beschriebenen Prinzipien wird die Bias für methylierte und nicht-methylierte Zielsequenzen in Abhängigkeit von der Annealingtemperatur und gleichzeitig von der MgCI2-Konzentration, z.B. für Septin-9 (SEPT9, HGNC:HGNC:7323 Ensembl:ENSG00000184640 , SEQ ID No. 140-144, 159-164 und 179-184), als auch die optimale Zyklenanzahl in der BBPA empirisch mit einer Probe mit bekanntem Methylierungsgrad bestimmt. Anhand der erhaltenen Daten werden die Bedingungen für jedes Primerpaar so festgelegt, dass die zu analysierende Zielsequenz (methyliert oder nicht-methyliert) maximal und die Kontrollzielsequenzen (nicht- methlyierte oder methylierte Wildtyp-Sequenzen) noch ausreichend mit vervielfältigt werden. Auf diese Weise können einerseits die ermittelten Werte für die Zielsequenzen mit denen der Wildtyp-DNA-Sequenzen als interne Kontrolle ins Verhältnis gesetzt und damit die Menge der in die BBPA-dPCR eingebrachten Bisulfit-umgewandelten DNA berücksichtigt werden. Andererseits lassen sich auf diese Weise hohe analytische Sensitivitäten ähnlich der MS- PCR-Technik (mit methylspezifischen [MS]-Primern) erreichen, ohne dass dabei verstärkt falsch-positive Signale auftreten, wie das bei der MS-PCR-Technik der Fall ist [4]. Im Vergleich zur MS-HRM-Technik (mit methylunabhängigen [MIP]-Primern), bei der im Gegesatz zur MS-PCR weniger falsch-positive Signale auftreten, weist die BBPA-dPCR- Technik eine wesentlich höhere analytische und damit diagnostische Sensitivität auf. Lassen sich für neue Zielsequenzen auf diese Weise mit der BBPA-dPCR ebenfalls diagnostische Spezifitäten von nahezu 100% erreichen, können diese Zielsequenzen zu dem beschriebenen Panel an Zielgenen (PLA2R1 , RASSF1A, GSTP1 , SERPINE1 , AOX1 , TM und/oder Septin-9) hinzugefügt werden, um die diagnostische Sensititvität zum Nachweis
von malignen Erkrankungen wie dem Prostata-, Mamma-, Ovarial- und Nierenzellkarzinom, aber auch anderer solider Tumoren wie z.B. dem kolorektalem Karzinom weiter zu steigern.
The novel BBPA-dPCR technique described here can in principle be used for all potential target gene sequences whose degree of methylation differs between healthy and unhealthy. After construction of primers and probes according to the principles described, the bias for methylated and unmethylated target sequences is determined as a function of the annealing temperature and simultaneously of the MgCl 2 concentration, eg for Septin-9 (SEPT9, HGNC: HGNC: 7323 Ensembl: ENSG00000184640 , SEQ ID Nos. 140-144, 159-164 and 179-184) as well as the optimal number of cycles in the BBPA are determined empirically with a sample of known methylation degree. Based on the data obtained, the conditions for each primer pair are determined so that the target sequence to be analyzed (methylated or unmethylated) is maximally amplified and the control target sequences (non-methylated or methylated wild-type sequences) are sufficiently duplicated. In this way, on the one hand, the values determined for the target sequences can be compared with those of the wild-type DNA sequences as an internal control, and thus the amount of bisulfite-converted DNA introduced into the BBPA-dPCR can be taken into account. On the other hand, in this way high analytical sensitivities similar to the MS-PCR technique (with methyl-specific [MS] primers) can be achieved without increasing false-positive signals, as is the case with the MS-PCR technique [ 4]. Compared to the MS-HRM technique (with methyl-independent [MIP] primers), which has fewer false-positive signals than MS-PCR, the BBPA-dPCR technique has a much higher analytical and thus diagnostic sensitivity. If it is also possible to achieve diagnostic specificities of almost 100% with BBPA-dPCR for new target sequences, these target sequences can be added to the described panel of target genes (PLA2R1, RASSF1A, GSTP1, SERPINE1, AOX1, TM and / or Septin-9). be added to the diagnostic sensitivity for detection of malignant diseases such as prostate, breast, ovarian and renal cell carcinoma, but also other solid tumors such as colorectal carcinoma on.
Tabelle 20: Kopienanzahl methylierter (met) und nicht-methylierter (unm) PL/^2/?7-Sequenzen ohne BBPA und nach BBPA mit 50 Zyklen bei 63,0°C und 2,5 mM MgCI2-Konzentration in normalen Epithelzellen der Prostata (PrEC), benigner Prostatahyperplasie-Zelllinie (BPH-1 ) und maligenen Prostatazelllinien LNCaP, PC-3 und DU-145. Nach BBPA wurden 1 μΙ der 25 μΙ-PCR-Ansätze in die dPCR eingesetzt, weshalb die Werte nach BBPA zum Vergleich mit 25 multipliziert wurden. Die Bezeichnungen PrEC Ox, BPH-1 Ox, LNCaP Ox, PC-3 Ox und DU-145 Ox in der ersten Spalte zeigen die Daten ohne BBPA und die Bezeichnungen PrEC 50x, BPH-1 50x, LNCaP 50x, PC-3 50x und DU-145 50x nach 50 Zyklen in der BBPA. Table 20: Copy number of methylated (met) and unmethylated (unm) PL / ^ 2 /? 7 sequences without BBPA and after BBPA with 50 cycles at 63.0 ° C and 2.5 mM MgCl 2 concentration in normal epithelial cells the prostate (PrEC), benign prostatic hyperplasia cell line (BPH-1) and malignant prostate cell lines LNCaP, PC-3 and DU-145. After BBPA 1 μΙ of the 25 μΙ PCR approaches were used in the dPCR, which is why the values were multiplied by 25 according to BBPA for comparison. The designations PrEC Ox, BPH-1 Ox, LNCaP Ox, PC-3 Ox and DU-145 Ox in the first column show the data without BBPA and the terms PrEC 50x, BPH-1 50x, LNCaP 50x, PC-3 50x and DU-145 50x after 50 cycles in the BBPA.
Poisson PoissonPoisson Poisson
Akzeptiert Fraktional Fraktional FraktionalAccepts Fractional Fractional Fractional
Kopien/20 Copies / 20
Probe Target Positive Negative Chl+Ch2+ Chl+Ch2- Chl-Ch2+ Chl-Ch2- e e e e μί Well Sample Target Positive Negative Chl + Ch2 + Chl + Ch2- Chl-Ch2 + Chl-Ch2- e e e μί Well
Tröpfchen Häufigkeit Häufigkeit Häufigkeit Droplets Frequency Frequency Frequency
1:25 Min Max1:25 min Max
PLA2R1 PLA2R1
PrEC Ox 34 34 18 12233 0 18 813 11420 12251 2,1 1,1 3,1 met PrEC Ox 34 34 18 12233 0 18 813 11420 12251 2.1 1.1 3.1 met
PLA2R1 PLA2R1
PrEC Ox 1620 1620 813 11438 PrEC Ox 1620 1620 813 11438
unm unm
PLA2R1 PLA2R1
BPH-1 Ox 270 270 157 13568 16 141 1632 11936 13725 8,3 7 9.5 met BPH-1 Ox 270 270 157 13568 16 141 1632 11936 13725 8.3 7 9.5 met
PLA2R1 PLA2R1
BPH-1 Ox 3000 3000 1648 12077 BPH-1 Ox 3000 3000 1648 12077
unm unm
PLA2R1 PLA2R1
LNCaP Ox 1660 1660 961 13172 9 952 116 13056 14133 88,8 86,9 90,7 met LNCaP Ox 1660 1660 961 13172 9 952 116 13056 14133 88.8 86.9 90.7 met
PLA2R1 PLA2R1
LNCaP Ox 210 210 125 14008 LNCaP Ox 210 210 125 14008
unm unm
PLA2R1 PLA2R1
PC-3 Ox 1178 1178 623 12131 38 585 872 11259 12754 40,4 37,9 42,8 met PC-3 Ox 1178 1178 623 12131 38 585 872 11259 12754 40.4 37.9 42.8 met
PLA2R1 PLA2R1
PC-3 Ox 1740 1740 910 11844 PC-3 Ox 1740 1740 910 11844
unm unm
PLA2R1 PLA2R1
DU-145 Ox 3280 3280 1363 9117 0 1363 6 9111 10480 99,59 99,25 99,93 met DU-145 Ox 3280 3280 1363 9117 0 1363 6 9111 10480 99.59 99.25 99.93 met
PLA2R1 PLA2R1
DU-145 Ox 14 14 6 10474 DU-145 Ox 14 14 6 10474
unm unm
PLA2R1 PLA2R1
PrEC 50x 0 0 12402 0 0 12269 133 12402 0 0 0 met 0
PrEC 50x 0 0 12402 0 0 12269 133 12402 0 0 0 met 0
PLA2R1 PLA2R1
PrEC 50x 106800 12269 133 PrEC 50x 106800 12269 133
unm 2670000 about 2670000
PLA2R1 PLA2R1
BPH-1 50x 0 0 11839 0 0 11690 149 11839 0 0 0 met 0 BPH-1 50x 0 0 11839 0 0 11690 149 11839 0 0 0 met 0
PLA2R1 PLA2R1
BPH-1 50x 103000 11690 149 BPH-1 50x 103000 11690 149
unm 2575000 only 2575000
PLA2R1 PLA2R1
LNCaP 50x 115400 11674 87 140 11534 0 87 11761 99,757 99,715 99,798 met 2885000 LNCaP 50x 115400 11674 87 140 11534 0 87 11761 99.757 99.715 99.798 met 2885000
PLA2R1 PLA2R1
LNCaP 50x 282 140 11621 LNCaP 50x 282 140 11621
unm 7050 about 7050
PLA2R1 PLA2R1
PC-3 50x 72600 11867 566 11858 9 229 337 12433 46,3 45,3 47,3 met 1815000 PC-3 50x 72600 11867 566 11858 9 229 337 12433 46.3 45.3 47.3 met 1815000
PLA2R1 PLA2R1
PC-3 50x 84200 12087 346 PC-3 50x 84200 12087 346
unm 2105000 impossible 2105000
DU-145 PLA2R1 DU-145 PLA2R1
186000 13181 5 0 13181 0 5 13186 100 100 100 50x met 4650000 186000 13181 5 0 13181 0 5 13186 100 100 100 50x met 4650000
DU-145 PLA2R1 DU-145 PLA2R1
0 0 13186 0 0 13186
50x unm 0
50x unm 0
Tabelle 21 : Kopienanzahl methylierter (M) und nicht-methylierter (U) RASSF1 Λ-DNA-Fragmente nach 15 Zyklen Prä-Am plifikation bei steigenden Annealingtemperaturen (50-60°C) in Abhängigkeit der MgCI2-Konzentrationen (1 ,5 mM-8,0 mM) mit dem RASSF1 A-Primerpaar 1 17bp (SEQ I D: 3 und 4) und RASSF1 A-Primerpaar 124bp (SEQ I D: 61 und 62) und anschließender dPCR. Table 21: Copy number of methylated (M) and unmethylated (U) RASSF1 Λ DNA fragments after 15 cycles of pre-amplification with increasing annealing temperatures (50-60 ° C) as a function of MgCl 2 concentrations (1, 5 mM -8.0 mM) with RASSF1A primer pair 1 17bp (SEQ ID: 3 and 4) and RASSF1A primer pair 124bp (SEQ ID: 61 and 62) followed by dPCR.
Tm in °C R-1 17 Tm in ° C R-1 17
M U M U M U M U M U M U M U M U M U M U M U M U
60 44 0 1580 0 868 454 3800 402 2520 270 6060 30 60 44 0 1580 0 868 454 3800 402 2520 270 6060 30
59,2 130 3,2 1960 0 942 310 4460 5 3520 26 5340 3859.2 130 3.2 1960 0 942 310 4460 5 3520 26 5340 38
58 664 104 3020 1 18 456 272 3360 92 2680 184 8080 1358 664 104 3020 1 18 456 272 3360 92 2680 184 8080 13
56, 1 2800 1 ,8 1016 46 476 224 1978 532 1352 788 4780 19256, 1 2800 1, 8 1016 46 476 224 1978 532 1352 788 4780 192
53,8 1724 40 392 920 90 194 628 860 980 1258 1892 19653.8 1724 40 392 920 90 194 628 860 980 1258 1892 196
51 ,9 1 142 706 184 572 34 48 78 366 158 258 566 6851, 9 1 142 706 184 572 34 48 78 366 158 258 566 68
50,7 1082 776 70 344 9.6 28 19.4 64 52 78 56 2850.7 1082 776 70 344 9.6 28 19.4 64 52 78 56 28
50 1014 1336 74 154 2.6 9.2 10.4 44 22.8 30 76 1250 1014 1336 74 154 2.6 9.2 10.4 44 22.8 30 76 12
MgCI2 1,5 mM 2,5 mM 3,5 mM 4,5 mM 6,0 mM 8,0 mM MgCl 2 1.5mM 2.5mM 3.5mM 4.5mM 6.0mM 8.0mM
Tm in °C R-124 Tm in ° C R-124
M U M U M U M U M U M U M U M U M U M U M U M U
60 292 0 2240 168 4040 122 6600 0 9460 0 4640 0 60 292 0 2240 168 4040 122 6600 0 9460 0 4640 0
59,2 1232 0 7580 120 5060 8.4 4840 0 1 1720 0 4760 059.2 1232 0 7580 120 5060 8.4 4840 0 1 1720 0 4760 0
58 2230 1 ,6 5380 8 5380 0 8240 0 8340 20 7600 958 2230 1, 6 5380 8 5380 0 8240 0 8340 20 7600 9
56, 1 4840 0 5920 244 5220 10,6 1466 0 5480 0 8100 056, 1 4840 0 5920 244 5220 10,6 1466 0 5480 0 8100 0
53,8 5900 14 1470 514 10780 0 8580 720 5920 3 5560 4753.8 5900 14 1470 514 10780 0 8580 720 5920 3 5560 47
51 ,9 5220 20 470 124 7500 48 7620 58 5460 330 4200 7851, 9 5220 20 470 124 7500 48 7620 58 5460 330 4200 78
50,7 5180 30 202 140 4960 138 2430 234 3180 616 3840 1450.7 5180 30 202 140 4960 138 2430 234 3180 616 3840 14
50 3000 290 136 82 4720 298 2880 472 1906 372 3760 7650 3000 290 136 82 4720 298 2880 472 1906 372 3760 76
MgCI2 1,5 mM 2,5 mM 3,5 mM 4,5 mM 6,0 mM 8,0 mM
MgCl 2 1.5mM 2.5mM 3.5mM 4.5mM 6.0mM 8.0mM
Tabelle 22: Kopienanzahl methylierter (M) und nicht-methylierter (U) GSTPf-DNA-Fragmente nach 15 Zyklen Prä-Amplifikation bei steigenden Annealingtemperaturen (50-60°C) in Abhängigkeit der MgCI2-Konzentrationen (1 ,5 mM-8,0 mM) mit dem GSTP1 -Primerpaar 1 14bp (SEQ ID: 91 und 92), GSTP1 -Primerpaar 1 16bp (SEQ ID: 93 und 94), GSTP1 -Primerpaar 129bp (SEQ ID: 95 und 96) und GSTP1 -Primerpaar 132bp (SEQ ID: 97 und 98) und anschließender dPCR. Table 22: Copy number of methylated (M) and unmethylated (U) GSTPf DNA fragments after 15 cycles of pre-amplification with increasing annealing temperatures (50-60 ° C) versus MgCl 2 concentrations (1, 5 mM-8 , 0 mM) with the GSTP1 primer pair 1 14bp (SEQ ID: 91 and 92), GSTP1 primer pair 1 16bp (SEQ ID: 93 and 94), GSTP1 primer pair 129bp (SEQ ID: 95 and 96) and GSTP1 primer pair 132bp (SEQ ID: 97 and 98) followed by dPCR.
Tm in °C GSTP-1 16bp (3 CpG-Stellen) Tm in ° C GSTP-1 16bp (3 CpG sites)
M U M U M U M U M U M M U M U M U M U M U M
60 284 24 5700 1 ,6 1 1260 2,8 16340 1 ,6 14960 252 7960 60 284 24 5700 1, 6 1 1260 2,8 16340 1, 6 14960 252 7960
59,2 778 2,8 7760 5 13700 1 1 ,4 18920 14 17420 10,2 816059.2 778 2,8 7760 5 13700 1 1, 4 18920 14 17420 10.2 8160
58 1544 6,8 7560 5 22640 16,6 16740 4,4 17560 17,2 1622058 1544 6.8 7560 5 22640 16.6 16740 4.4 17560 17.2 16220
56, 1 4260 6 19880 12,8 25420 100 20640 390 17980 376 1264056, 1 4260 6 19880 12,8 25420 100 20640 390 17980 376 12640
53,8 9040 9,2 23020 108 24540 774 18480 1760 23280 1014 1356053.8 9040 9.2 23020 108 24540 774 18480 1760 23280 1014 13560
51 ,9 10560 262 1 1520 776 16740 2400 15620 5280 15600 4560 874051, 9 10560 262 1 1520 776 16740 2400 15620 5280 15600 4560 8740
50,7 5400 46 16120 1028 12960 4800 10520 5680 13500 4060 620050.7 5400 46 16120 1028 12960 4800 10520 5680 13500 4060 6200
50 9200 86 14800 2300 14900 5100 14720 4800 8480 3660 476050 9200 86 14800 2300 14900 5100 14720 4800 8480 3660 4760
MgCI2 1,5 mM 2,5 mM 3,5 mM 4,5 mM 6,0 mM 8,0 m
MgCl 2 1.5mM 2.5mM 3.5mM 4.5mM 6.0mM 8.0m
Tm in °C GSTP-129bp (4 CpG-Stellen) Tm in ° C GSTP-129bp (4 CpG sites)
M U M U M U M U M U M U M U M U M U M U
60 578 14 8940 16 15220 0 19040 5.4 15140 24 60 578 14 8940 16 15220 0 19040 5.4 15140 24
59,2 450 4.6 7420 22 15900 204 26660 46 18400 15.459.2 450 4.6 7420 22 15900 204 26660 46 18400 15.4
58 1462 9.4 10660 14 22880 10 35400 4.4 15620 3458 1462 9.4 10660 14 22880 10 35400 4.4 15620 34
56, 1 5480 10.8 24640 6 21860 16 25800 44 24880 3056, 1 5480 10.8 24640 6 21860 16 25800 44 24880 30
53,8 12020 1 1.4 17060 22 15820 170 27780 350 16460 21653.8 12020 1 1.4 17060 22 15820 170 27780 350 16460 216
51 ,9 8740 22 20160 254 20480 370 21740 1068 18740 23451, 9 8740 22 20160 254 20480 370 21740 1068 18740 234
50,7 8720 7.8 15960 208 19100 544 22980 1 144 16060 47450.7 8720 7.8 15960 208 19100 544 22980 1 144 16060 474
50 9220 1 10 19480 312 19520 892 16900 962 10440 51650 9220 1 10 19480 312 19520 892 16900 962 10440 516
MgCI2 1,5 mM 2,5 mM 3,5 mM 6,0 mM 8,0 mM MgCl 2 1.5mM 2.5mM 3.5mM 6.0mM 8.0mM
Tabelle 23: Kopienanzahl methylierter (M) und nicht-methylierte PLA2/?f-DNA-Fragmente (U) [Copies/20 μΙ Well), Anteil M/U (Ratio) und relativer Anteil M/M+U (Fractional Abundance) in Proben mit 3000 (Bahn 1 ), 20 (Bahn 2), 10 (Bahn 3), 5 (Bahn 4) und keiner Kopie methylierter PLA2R1 - DNA-Fragmente (Bahn 5) und jeweils einem Anteil von 70.000 Kopien (70K/0-3000), 175.000 (170K/0-3000), 350.000 (350K/0-3000) und 700.000 (700K/0-3000) nicht-methylierter PLA2R1 -DNA-Fragmente mit dem Primerpaar 168 bp (SEQ ID: 1 und 2) ohne Prä-Amplifikation. NTC: NonTemplate-Negativkontrolle. TABLE 23 Number of copies of methylated (M) and non-methylated PLA2 / F DNA fragments (U) [copies / 20 μΙ wells], M / U ratio and relative fraction M / M + U (fractional abundance) in samples with 3000 (lane 1), 20 (lane 2), 10 (lane 3), 5 (lane 4) and no copy of methylated PLA2R1 DNA fragments (lane 5) and a proportion of 70,000 copies (70K / 0 -3000), 175,000 (170K / 0-3000), 350,000 (350K / 0-3000) and 700,000 (700K / 0-3000) non-methylated PLA2R1 DNA fragments with the 168 bp primer pair (SEQ ID: 1 and 2 ) without pre-amplification. NTC: NonTemplate Negative Control.
Ch1- Ch1- Akzeptierte Ch1-Ch1-Accepted
Probe Target Kopien/2(^LWell Positive Negative Ch1 +Ch2+ Ch1 +Ch2- Verhältnis Fraktionale Häufigkeit Sample Target Copies / 2 (^ LWell Positive Negative Ch1 + Ch2 + Ch1 + Ch2 Ratio Fractional frequency
Ch2+ Ch2- Tröpfchen Ch2 + Ch2 droplets
70K 0 M 0 0 14071 0 0 13369 702 14071 0 0 70K 0 M 0 0 14071 0 0 13369 702 14071 0 0
U 70600 13369 702 U 70600 13369 702
70K 5 M 5.4 3 13198 3 0 12584 614 13201 7,00E-05 0.007 70K 5M 5.4 3 13198 3 0 12584 614 13201 7.00E-05 0.007
U 72200 12587 614 U 72200 12587 614
70K 10 M 10 6 14086 4 2 13438 648 14092 0.00014 0.014 70K 10M 10 6 14086 4 2 13438 648 14092 0.00014 0.014
U 72400 13442 650 U 72400 13442 650
70K 20 M 28 13 1 1255 12 1 10718 537 1 1268 0.00038 0.038 70K 20M 28 13 1 1255 12 1 10718 537 1 1268 0.00038 0.038
U 71600 10730 538 U 71600 10730 538
70K 3000 M 2780 1640 13103 1479 161 12415 688 14743 0.0413 3.97 70K 3000 M 2780 1640 13103 1479 161 12415 688 14743 0.0413 3.97
U 67200 13894 849 U 67200 13894 849
175K 0 M 0 0 13938 0 0 13926 12 13938 0 0 175K 0M 0 0 13938 0 0 13926 12 13938 0 0
U 166000 13926 12 U 166000 13926 12
175K 5 M 3.8 2 12554 2 0 12548 6 12556 2.1 E-05 0.0021 175K 5M 3.8 2 12554 2 0 12548 6 12556 2.1 E-05 0.0021
U 180000 12550 6 U 180000 12550 6
175K 10 M 9.4 5 12592 5 0 12585 7 12597 5.3E-05 0.0053 175K 10M 9.4 5 12592 5 0 12585 7 12597 5.3E-05 0.0053
U 176000 12590 7 U 176000 12590 7
175K 20 M 16 9 13287 9 0 13286 1 13296 7,00E-05 0.007 175K 20M 16 9 13287 9 0 13286 1 13296 7,00E-05 0.007
U 224000 13295 1 U 224000 13295 1
175K 3000 M 1968 891 10215 887 4 10210 5 1 1 106 0.01 17 1.16 175K 3000 M 1968 891 10215 887 4 10210 5 1 1 106 0.01 17 1.16
U 168000 1 1097 9 U 168000 1 1097 9
350K 0 M 0 0 14661 0 0 14661 0 14661 0 0 350K 0M 0 0 14661 0 0 14661 0 14661 0 0
U 20000000 14661 0 U 20000000 14661 0
350K 5 M 2 1 12059 1 0 12059 0 12060 1 ,00E-07 1 ,00E-05
350K 5M 2 1 12059 1 0 12059 0 12060 1, 00E-07 1, 00E-05
U 20000000 12060 0 U 20000000 12060 0
350K/10 M 0 0 12984 0 0 12981 3 12984 0 0 350K / 10M 0 0 12984 0 0 12981 3 12984 0 0
U 198000 12981 3 U 198000 12981 3
350K/20 M 6.4 3 10969 3 0 10967 2 10972 3.2E-05 0.0032 350K / 20M 6.4 3 10969 3 0 10967 2 10972 3.2E-05 0.0032
U 202000 10970 2 U 202000 10970 2
350K/3000 M 560 283 11757 283 0 11756 1 12040 0.0025 0.25 350K / 3000 M 560 283 11757 283 0 11756 1 12040 0.0025 0.25
U 222000 12039 1 U 222000 12039 1
700K/0 M 0 0 11327 0 0 11327 0 11327 0 0 700K / 0 M 0 0 11327 0 0 11327 0 11327 0 0
U 20000000 11327 0 U 20000000 11327 0
700K/5 M 0 0 10189 0 0 10189 0 10189 0 0 700K / 5M 0 0 10189 0 0 10189 0 10189 0 0
U 20000000 10189 0 U 20000000 10189 0
700K/10 M 0 0 9889 0 0 9872 17 9889 0 0 700K / 10M 0 0 9889 0 0 9872 17 9889 0 0
U 150000 9872 17 U 150000 9872 17
700K/20 M 0 0 11500 0 0 11499 1 11500 0 0 700K / 20M 0 0 11500 0 0 11499 1 11500 0 0
U 220000 11499 1 U 220000 11499 1
700K/3000 M 114 50 10332 50 0 10328 4 10382 0.00061 0.061 700K / 3000M 114 50 10332 50 0 10328 4 10382 0.00061 0.061
U 184000 10378 4 U 184000 10378 4
NTC M 0 0 12186 0 0 1 12185 12186 0 0 NTC M 0 0 12186 0 0 1 12185 12186 0 0
U 2 1 12185
U 2 1 12185
Tabelle 24: Kopienanzahl methylierter (M) und nicht-methylierte PL^2 ?7-DNA-Fragmente (U) [Copies/20 μΙ Well), Anteil M/U (Ratio) und relativer Anteil M/M+U (Fractional Abundance) in Proben mit 3000 (Bahn 1 ), 20 (Bahn 2), 10 (Bahn 3), 5 (Bahn 4) und keiner Kopie methylierter PLA2R1 - DNA-Fragmente (Bahn 5) und jeweils einem Anteil von 70.000 Kopien (70K/0-3000), 175.000 (170K/0-3000), 350.000 (350K/0-3000) und 700.000 (700K/0-3000) nicht-methylierter PLA2R1 -DNA-Fragmente mit dem Primerpaar 133 bp (SEQ ID: 7 und 8) ohne Prä-Amplifikation. NTC: NonTemplate-Negativkontrolle. Table 24: Copy number of methylated (M) and unmethylated PL ^ 2 -7 DNA fragments (U) [copies / 20 μΙ wells], M / U ratio (ratio) and M / M + U relative fraction (fractional abundance ) in samples containing 3000 (lane 1), 20 (lane 2), 10 (lane 3), 5 (lane 4) and no copy of methylated PLA2R1 DNA fragments (lane 5) and each containing 70,000 copies (70K). 0-3000), 175,000 (170K / 0-3000), 350,000 (350K / 0-3000) and 700,000 (700K / 0-3000) non-methylated PLA2R1 DNA fragments with the primer pair 133 bp (SEQ ID: 7 and 8) without pre-amplification. NTC: NonTemplate Negative Control.
Ch1- Ch1- Akzeptierte Ch1-Ch1-Accepted
Probe Targets Kopien/2(^LWell Positive Negative Ch1 +Ch2+ Ch1 +Ch2- Verhältnis Fraktionale Häufigkeit Sample Targets Copies / 2 (^ LWell Positive Negative Ch1 + Ch2 + Ch1 + Ch2 Ratio Fractional frequency
Ch2+ Ch2- Tröpfchen Ch2 + Ch2 droplets
70K 0 M 0 0 15481 0 0 2 15479 15481 0 0 70K 0 M 0 0 15481 0 0 2 15479 15481 0 0
U 3 2 15479 U 3 2 15479
70K 5 M 1.8 1 13718 0 1 6 13712 13719 0.17 14 70K 5M 1.8 1 13718 0 1 6 13712 13719 0.17 14
U 10.2 6 13713 U 10.2 6 13713
70K 10 M 13 8 14504 0 8 7 14497 14512 1.1 53 70K 10M 13 8 14504 0 8 7 14497 14512 1.1 53
U 1 1.4 7 14505 U 1 1.4 7 14505
70K 20 M 24 13 12954 0 13 8 12946 12967 1.6 62 70K 20M 24 13 12954 0 13 8 12946 12967 1.6 62
U 14 8 12959 U 14 8 12959
70K 3000 M 3320 1585 10455 0 1585 9 10446 12040 190 99.47 70K 3000 M 3320 1585 10455 0 1585 9 10446 12040 190 99.47
U 18 9 12031 U 18 9 12031
175K 0 M 2.6 2 17436 0 2 27 17409 17438 0.07 7 175K 0 M 2.6 2 17436 0 2 27 17409 17438 0.07 7
U 36 27 1741 1 U 36 27 1741 1
175K 5 M 1.4 1 17244 0 1 1 17243 17245 1 50 175K 5M 1.4 1 17244 0 1 1 17243 17245 1 50
U 1.4 1 17244 U 1.4 1 17244
175K 10 M 8 5 14708 0 5 26 14682 14713 0.19 16 175K 10M 8 5 14708 0 5 26 14682 14713 0.19 16
U 42 26 14687 U 42 26 14687
175K 20 M 22 12 12577 0 12 14 12563 12589 0.9 46 175K 20M 22 12 12577 0 12 14 12563 12589 0.9 46
U 26 14 12575 U 26 14 12575
175K 3000 M 3020 1749 12789 1 1748 21 12768 14538 85 98.83 175K 3000M 3020 1749 12789 1 1748 21 12768 14538 85 98.83
U 36 22 14516 U 36 22 14516
350K 0 M 32 20 14348 0 20 19 14329 14368 1.1 51
350K 0M 32 20 14348 0 20 19 14329 14368 1.1 51
U 32 19 14349 U 32 19 14349
350K/5 M 142 71 11757 0 71 28 11729 11828 2.5 72 350K / 5M 142 71 11757 0 71 28 11729 11828 2.5 72
U 56 28 11800 U 56 28 11800
350K/10 M 16 8 11558 0 8 38 11520 11566 0.21 17 350K / 10M 16 8 11558 0 8 38 11520 11566 0.21 17
U 78 38 11528 U 78 38 11528
350K/20 M 20 11 13597 0 11 50 13547 13608 0.22 18 350K / 20M 20 11 13597 0 11 50 13547 13608 0.22 18
U 86 50 13558 U 86 50 13558
350K/3000 M 3160 1553 10816 0 1553 40 10776 12369 41 97.6 350K / 3000M 3160 1553 10816 0 1553 40 10776 12369 41 97.6
U 76 40 12329 U 76 40 12329
700K/0 M 0 0 12883 0 0 62 12821 12883 0 0 700K / 0M 0 0 12883 0 0 62 12821 12883 0 0
U 114 62 12821 U 114 62 12821
700K/5 M 0 0 11231 0 0 66 11165 11231 0 0 700K / 5M 0 0 11231 0 0 66 11165 11231 0 0
U 138 66 11165 U 138 66 11165
700K/10 M 6 3 11863 0 3 40 11823 11866 0.07 7 700K / 10M 6 3 11863 0 3 40 11823 11866 0.07 7
U 80 40 11826 U 80 40 11826
700K/20 M 8 4 11745 0 4 75 11670 11749 0.05 5 700K / 20M 8 4 11745 0 4 75 11670 11749 0.05 5
U 150 75 11674 0 U 150 75 11674 0
700K/3000 M 3140 1360 9515 1 1359 84 9431 10875 17 94.5 700K / 3000M 3140 1360 9515 1 1359 84 9431 10875 17 94.5
U 184 85 10790 U 184 85 10790
NTC M 0 0 16702 0 0 1 16701 16702 0 0 NTC M 0 0 16702 0 0 1 16701 16702 0 0
U 1.4 1 16701 0 0 1 16701 16702
U 1.4 1 16701 0 0 1 16701 16702
Tabelle 25: Kopienanzahl methylierter (M) und nicht-methylierte PL^2 ?7-DNA-Fragmente (U) [Copies/20 μΙ Well), Anteil M/U (Ratio) und relativer Anteil M/M+U (Fractional Abundance) in Proben mit keiner, 5, 10, 20 und 3000 Kopien methylierter PLA2R1 -DNA-Fragmente und jeweils einem Anteil von 70.000 Kopien (70K/0-3000), 175.000 (170K/0-3000), 350.000 (350K/0-3000) und 700.000 (700K/0-3000) nicht-methylierter PLA2R1 - DNA-Fragmente mit dem Primerpaar 168 bp (SEQ ID: 1 und 2, angezeigt in rechter Spalte), Primerpaar 161 bp (SEQ ID: 53 und 10) und Primerpaar 150 bp (SEQ ID: 53 und 9) nach 15 Zyklen Prä-Amplifikation mit 2,5 mM MgCI2-Konzentration und 63°C Annealingtemperatur und anschließender dPCR. NTC: Non-Template-Negativkontrolle. Table 25: Copy number of methylated (M) and unmethylated PL ^ 2 -7 DNA fragments (U) [Copies / 20 μΙ wells], M / U ratio (Ratio) and relative M / M + U (fractional abundance ) in samples containing no, 5, 10, 20, and 3000 copies of methylated PLA2R1 DNA fragments and each containing 70,000 copies (70K / 0-3000), 175,000 (170K / 0-3000), 350,000 (350K / 0- 3000) and 700,000 (700K / 0-3000) non-methylated PLA2R1 DNA fragments with the 168 bp primer pair (SEQ ID: 1 and 2, indicated in the right column), 161 bp primer pair (SEQ ID NOS: 53 and 10) and Primer pair 150 bp (SEQ ID: 53 and 9) after 15 cycles of pre-amplification with 2.5 mM MgCl 2 concentration and 63 ° C annealing temperature followed by dPCR. NTC: Non-Template Negative Control.
Κορίβη/20μΙ_ Ch1 +Ch2 Ch1 +Ch2 Ch1 - Ch1 - Akzeptierte Verhält PLA2RΚορίβη / 20μΙ_ Ch1 + Ch2 Ch1 + Ch2 Ch1 - Ch1 - Accepted behaviors PLA2R
Probe Target Positive Negative Fraktionale Häufigkeit Sample Target Positive Negative Fractional Frequency
Well + Ch2+ Ch2- Tröpfchen nis 1 Well + Ch2 + Ch2 droplets nis 1
1333 1333
70K 0 M 0 0 13332 0 0 1 13332 0 0 70K 0M 0 0 13332 0 0 1 13332 0 0
1 168bp 1 168bp
U 224000 13331 1 U 224000 13331 1
1077 1077
70K 5 M 0 0 10775 0 0 0 10775 0 0 70K 5M 0 0 10775 0 0 0 10775 0 0
5 5
U 20000000 10775 0 U 20000000 10775 0
1 143 1 143
70K 10 M 0 0 1 1431 0 0 0 1 1431 0 0 70K 10M 0 0 1 1431 0 0 0 1 1431 0 0
1 1
U 20000000 1 1431 0 U 20000000 1 1431 0
1382 1382
70K 20 M 1.8 1 13839 1 0 15 13840 1.1 E-05 0.001 1 70K 20M 1.8 1 13839 1 0 15 13840 1.1 E-05 0.001 1
4 4
U 160000 13825 15 U 160000 13825 15
1003 0.0002 1003 0.0002
70K 3000 M 5880 2845 10030 2845 0 0 12875 0.029 70K 3000 M 5880 2845 10030 2845 0 0 12875 0.029
0 9 0 9
U 20000000 12875 0 U 20000000 12875 0
1263 1263
175K 0 M 0 0 12634 0 0 2 12634 0 0 175K 0M 0 0 12634 0 0 2 12634 0 0
2 2
U 206000 12632 2 U 206000 12632 2
1265 1265
175K 5 M 0 0 12656 0 0 0 12656 0 0 175K 5M 0 0 12656 0 0 0 12656 0 0
6 6
U 20000000 12656 0 U 20000000 12656 0
1288 1288
175K 10 M 0 0 12889 0 0 1 12889 0 0 175K 10M 0 0 12889 0 0 1 12889 0 0
8 8th
U 222000 12888 1
U 222000 12888 1
U 222000 12071 1 U 222000 12071 1
1 199 1 199
70K/0 M 252 144 13392 17 127 1400 13536 0.097 8.8 70K / 0 M 252 144 13392 17 127 1400 13536 0.097 8.8
2 161 bp 2 161 bp
U 2600 1417 121 19 U 2600 1417 121 19
70K/5 M 264 142 12622 62 80 5878 6744 12764 0.0179 1.76 70K / 5M 264 142 12622 62 80 5878 6744 12764 0.0179 1.76
U 14740 5940 6824 U 14740 5940 6824
70K/10 M 174 99 13355 36 63 4202 9153 13454 0.0195 1.91 70K / 10M 174 99 13355 36 63 4202 9153 13454 0.0195 1.91
U 8900 4238 9216 U 8900 4238 9216
70K/20 M 1 180 668 12992 262 406 7252 5740 13660 0.0628 5.91 70K / 20 M 1 180 668 12992 262 406 7252 5740 13660 0.0628 5.91
U 18800 7514 6146 U 18800 7514 6146
70K/3000 M 95000 14721 265 17 14704 0 265 14986 3600 99.972 70K / 3000M 95000 14721 265 17 14704 0 265 14986 3600 99.972
U 26 17 14969 U 26 17 14969
1308 1308
175K/0 M 38 23 14359 5 18 1270 14382 0.017 1.7 175K / 0 M 38 23 14359 5 18 1270 14382 0.017 1.7
9 9
U 2180 1275 13107 U 2180 1275 13107
175K/5 M 344 187 12734 96 91 5027 7707 12921 0.0289 2.81 175K / 5M 344 187 12734 96 91 5027 7707 12921 0.0289 2.81
U 1 1880 5123 7798 U 1 1880 5123 7798
175K/10 M 476 263 12886 196 67 9772 31 14 13149 0.0142 1.4 175K / 10M 476 263 12886 196 67 9772 31 14 13149 0.0142 1.4
U 33400 9968 3181 U 33400 9968 3181
175K/20 M 1382 873 14429 535 338 8245 6184 15302 0.0689 6.44 175K / 20M 1382 873 14429 535 338 8245 6184 15302 0.0689 6.44
U 20060 8780 6522 U 20060 8780 6522
175K/300 175K / 300
M 132800 13824 49 743 13081 2 47 13873 102 99.03 0 M 132800 13824 49 743 13081 2 47 13873 102 99.03 0
U 1298 745 13128 U 1298 745 13128
1200 1200
350K/0 M 0 0 14731 0 0 2731 14731 0 0 350K / 0M 0 0 14731 0 0 2731 14731 0 0
0 0
U 4820 2731 12000 U 4820 2731 12000
1003 1003
350K/5 M 48 32 15565 18 14 5530 15597 0.0047 0.47 350K / 5M 48 32 15565 18 14 5530 15597 0.0047 0.47
5 5
U 10340 5548 10049 U 10340 5548 10049
350K/10 M 172 1 16 15774 75 41 7280 8494 15890 0.01 18 1.17 350K / 10M 172 1 16 15774 75 41 7280 8494 15890 0.01 18 1.17
U 14620 7355 8535
U 14620 7355 8535
1319 1319
350K/20 M 994 578 13382 552 26 189 13960 0.0101 1 350K / 20M 994 578 13382 552 26 189 13960 0.0101 1
3 3
U 98200 13745 215 U 98200 13745 215
350K/300 350K / 300
M 104800 15203 179 2323 12880 1 1 168 15382 27.1 96.44 0 M 104800 15203 179 2323 12880 1 1 168 15382 27.1 96.44 0
U 3880 2334 13048 U 3880 2334 13048
700K/0 M 50 28 13360 23 5 8016 5344 13388 0.0023 0.23 700K / 0M 50 28 13360 23 5 8016 5344 13388 0.0023 0.23
U 21580 8039 5349 U 21580 8039 5349
1333 1333
700K/5 M 0 0 13344 0 0 14 13344 0 0 700K / 5M 0 0 13344 0 0 14 13344 0 0
0 0
U 24 14 13330 U 24 14 13330
1076 1076
700K/10 M 312 155 1 1614 154 1 850 1 1769 0.005 0.5 700K / 10M 312 155 1 1614 154 1 850 1 1769 0.005 0.5
4 4
U 61800 10918 851 U 61800 10918 851
1378 1378
700K/20 M 680 417 14213 417 0 430 14630 0.0082 0.81 700K / 20M 680 417 14213 417 0 430 14630 0.0082 0.81
3 3
U 83000 14200 430 U 83000 14200 430
700K/300 700K / 300
M 121600 13316 76 9932 3384 49 27 13392 3.78 79.1 0 M 121600 13316 76 9932 3384 49 27 13392 3.78 79.1 0
U 32180 9981 341 1 U 32180 9981 341 1
1085 1085
70K/0 M 1.8 1 13056 0 1 2201 13057 0.0004 0.04 70K / 0 M 1.8 1 13056 0 1 2201 13057 0.0004 0.04
5 5
U 4340 2201 10856 U 4340 2201 10856
70K/5 M 1 126 597 12181 84 513 2285 9896 12778 0.233 18.9 70K / 5M 1 126 597 12181 84 513 2285 9896 12778 0.233 18.9
U 4820 2369 10409 U 4820 2369 10409
70K/10 M 2214 1 176 1 1914 238 938 2937 8977 13090 0.339 25.3 70K / 10M 2214 1 176 1 1914 238 938 2937 8977 13090 0.339 25.3
U 6540 3175 9915 U 6540 3175 9915
70K/20 M 1954 917 10593 83 834 1273 9320 1 1510 0.66 39.8 70K / 20M 1954 917 10593 83 834 1273 9320 1 1510 0.66 39.8
U 2940 1356 10154 U 2940 1356 10154
70K/3000 M 208000 13610 2 5 13605 0 2 13612 24000 100 70K / 3000 M 208000 13610 2 5 13605 0 2 13612 24000 100
U 8.6 5 13607 U 8.6 5 13607
175K/0 M 336 208 14436 78 130 7291 7145 14644 0.0204 2 175K / 0 M 336 208 14436 78 130 7291 7145 14644 0.0204 2
U 16460 7369 7275
U 16460 7369 7275
700K/300 700K / 300
M 196000 12054 3 271 11783 0 3 12057 370 99.73 0 M 196000 12054 3 271 11783 0 3 12057 370 99.73 0
U 534 271 11786 U 534 271 11786
1156 1156
NTC M 0 0 11564 0 0 1 11564 0 0 NTC M 0 0 11564 0 0 1 11564 0 0
3 3
U 2 1 11563
U 2 1 11563
Tabelle 26: Kopienanzahl methylierter (M) und nicht-methylierte PLA2/?f-DNA-Fragmente (U) [Copies/20 μΙ Well), Anteil M/U (Ratio) und relativer Anteil M/M+U (Fractional Abundance) in Proben mit keiner, 5, 10, 20 und 3000 Kopien methylierter PLA2R1 -DNA-Fragmente und jeweils einem Anteil von 70.000 Kopien (70K/0-3000), 175.000 (170K/0-3000), 350.000 (350K/0-3000) und 700.000 (700K/0-3000) nicht-methylierter PLA2R1- DNA-Fragmente mit dem Primerpaar 168 bp (SEQ ID: 1 und 2, angezeigt in rechter Spalte), Primerpaar 161 bp (SEQ ID: 53 und 10) und Primerpaar 150 bp (SEQ ID: 53 und 9) nach 50 Zyklen Prä-Amplifikation mit 2,5 mM MgCI2-Konzentration und 63°C Annealingtemperatur und anschließender dPCR. NTC: Non-Template-Negativkontrolle. TABLE 26 Number of copies of methylated (M) and non-methylated PLA2 / F DNA fragments (U) [copies / 20 μΙ wells], M / U ratio and relative fraction M / M + U (fractional abundance) in samples containing no, 5, 10, 20, and 3000 copies of methylated PLA2R1 DNA fragments and each containing 70,000 copies (70K / 0-3000), 175,000 (170K / 0-3000), 350,000 (350K / 0-3,000 ) and 700,000 (700K / 0-3000) non-methylated PLA2R1 DNA fragments with the 168 bp primer pair (SEQ ID: 1 and 2, indicated in the right column), primer pair 161 bp (SEQ ID: 53 and 10) and primer pair 150 bp (SEQ ID: 53 and 9) after 50 cycles of pre-amplification with 2.5 mM MgCl 2 concentration and 63 ° C annealing temperature followed by dPCR. NTC: Non-Template Negative Control.
Ch1- Ch1- Akzeptierte Fraktionale Ch1- Ch1- Accepted fractional
Probe Target Kopien/2(^LWell Positive Negative Ch1+Ch2+ Ch1+Ch2- Verhältnis PLA2R1 Sample Target Copies / 2 (^ LWell Positive Negative Ch1 + Ch2 + Ch1 + Ch2 Ratio PLA2R1
Ch2+ Ch2- Tröpfchen Häufigkeit Ch2 + Ch2 droplet frequency
70K0 M 0 0 12316 0 0 12315 1 12316 0 0 168bp 70K0 M 0 0 12316 0 0 12315 1 12316 0 0 168bp
U 222000 12315 1 U 222000 12315 1
70K5 M 1.8 1 12779 1 0 12779 0 12780 9,00E-08 9,00E-06 70K5 M 1.8 1 12779 1 0 12779 0 12780 9,00E-08 9,00E-06
U 20000000 12780 0 U 20000000 12780 0
70K 10 M 0 0 13964 0 0 13964 0 13964 0 0 70K 10M 0 0 13964 0 0 13964 0 13964 0 0
U 20000000 13964 0 U 20000000 13964 0
70K20 M 0 0 11379 0 0 11379 0 11379 0 0 70K20 M 0 0 11379 0 0 11379 0 11379 0 0
U 20000000 11379 0 U 20000000 11379 0
70K3000 M 66400 10448 662 10448 0 661 1 11110 0.3 23.2 70K3000 M 66400 10448 662 10448 0 661 1 11110 0.3 23.2
U 220000 11109 1 U 220000 11109 1
175K0 M 0 0 12717 0 0 12711 6 12717 0 0 175K0 M 0 0 12717 0 0 12711 6 12717 0 0
U 180000 12711 6 U 180000 12711 6
175K5 M 0 0 13886 0 0 13883 3 13886 0 0 175K5 M 0 0 13886 0 0 13883 3 13886 0 0
U 198000 13883 3 U 198000 13883 3
175K 10 M 0 0 13828 0 0 13827 1 13828 0 0 175K 10M 0 0 13828 0 0 13827 1 13828 0 0
U 224000 13827 1 U 224000 13827 1
175K20 M 0 0 13782 0 0 13781 1 13782 0 0 175K20 M 0 0 13782 0 0 13781 1 13782 0 0
U 224000 13781 1 U 224000 13781 1
175K3000 M 1010 560 12764 560 0 12764 0 13324 5.1E-05 0.0051 175K3000 M 1010 560 12764 560 0 12764 0 13324 5.1E-05 0.0051
U 20000000 13324 0 U 20000000 13324 0
350K0 M 2 1 11827 1 0 11827 0 11828 1,00E-07 1,00E-05 350K0 M 2 1 11827 1 0 11827 0 11828 1,00E-07 1,00E-05
U 20000000 11828 0 U 20000000 11828 0
350K5 M 3.8 2 12441 2 0 12441 0 12443 1.9E-07 1.9E-05 350K5 M 3.8 2 12441 2 0 12441 0 12443 1.9E-07 1.9E-05
U 20000000 12443 0 U 20000000 12443 0
350K 10 M 0 0 12247 0 0 12247 0 12247 0 0
350K 10M 0 0 12247 0 0 12247 0 12247 0 0
U 20000000 12247 0 U 20000000 12247 0
350K/20 M 0 0 12760 0 0 12759 1 12760 0 0 350K / 20M 0 0 12760 0 0 12759 1 12760 0 0
U 222000 12759 1 U 222000 12759 1
350K/3000 M 6.2 3 11393 3 0 11393 0 11396 3.1E-07 3.1E-05 350K / 3000 M 6.2 3 11393 3 0 11393 0 11396 3.1E-07 3.1E-05
U 20000000 11396 0 U 20000000 11396 0
700K/0 M 10.6 6 13199 6 0 13199 0 13205 5,00E-07 5,00E-05 700K / 0M 10.6 6 13199 6 0 13199 0 13205 5,00E-07 5,00E-05
U 20000000 13205 0 U 20000000 13205 0
700K/5 M 0 0 11011 0 0 11011 0 11011 0 0 700K / 5M 0 0 11011 0 0 11011 0 11011 0 0
U 20000000 11011 0 U 20000000 11011 0
700K/10 M 0 0 10392 0 0 10392 0 10392 0 0 700K / 10M 0 0 10392 0 0 10392 0 10392 0 0
U 20000000 10392 0 U 20000000 10392 0
700K/20 M 2.4 1 9789 1 0 9789 0 9790 1.2E-07 1.2E-05 700K / 20M 2.4 1 9789 1 0 9789 0 9790 1.2E-07 1.2E-05
U 20000000 9790 0 U 20000000 9790 0
700K/3000 M 2 1 11840 1 0 11839 1 11841 9,00E-06 0.0009 700K / 3000 M 2 1 11840 1 0 11839 1 11841 9,00E-06 0.0009
U 220000 11840 1 U 220000 11840 1
70K/0 M 0 0 16276 0 0 1169 15107 16276 0 0 161bp 70K / 0 M 0 0 16276 0 0 1169 15107 16276 0 0 161bp
U 1760 1169 15107 U 1760 1169 15107
70K/5 M 1.8 1 12665 1 0 12642 23 12666 1.3E-05 0.0013 70K / 5M 1.8 1 12665 1 0 12642 23 12666 1.3E-05 0.0013
U 148400 12643 23 U 148400 12643 23
70K/10 M 1.4 1 16320 1 0 16191 129 16321 1.3E-05 0.0013 70K / 10M 1.4 1 16320 1 0 16191 129 16321 1.3E-05 0.0013
U 113800 16192 129 U 113800 16192 129
70K/20 M 542 315 13509 315 0 13509 0 13824 2.7E-05 0.0027 70K / 20M 542 315 13509 315 0 13509 0 13824 2.7E-05 0.0027
U 20000000 13824 0 U 20000000 13824 0
70K/3000 M 20000000 13433 0 0 13433 0 0 13433 100 70K / 3000M 20000000 13433 0 0 13433 0 0 13433 100
U 0 0 13433 U 0 0 13433
175K/0 M 4 2 12059 2 0 11282 777 12061 6,00E-05 0.006 175K / 0 M 4 2 12059 2 0 11282 777 12061 6,00E-05 0.006
U 64600 11284 777 U 64600 11284 777
175K/5 M 1.8 1 12715 1 0 12706 9 12716 1.1E-05 0.0011 175K / 5M 1.8 1 12715 1 0 12706 9 12716 1.1E-05 0.0011
U 170000 12707 9 U 170000 12707 9
175K/10 M 0 0 12541 0 0 12537 4 12541 0 0 175K / 10M 0 0 12541 0 0 12537 4 12541 0 0
U 190000 12537 4 U 190000 12537 4
175K/20 M 17.6 10 13290 10 0 13288 2 13300 9,00E-05 0.009 175K / 20M 17.6 10 13290 10 0 13288 2 13300 9,00E-05 0.009
U 208000 13298 2 U 208000 13298 2
175K/3000 M 226000 14492 1 362 14130 0 1 14493 380 99.74 175K / 3000M 226000 14492 1 362 14130 0 1 14493 380 99.74
U 596 362 14131 U 596 362 14131
350K/0 M 0 0 14659 0 0 14574 85 14659 0 0 350K / 0 M 0 0 14659 0 0 14574 85 14659 0 0
U 121200 14574 85
U 121200 14574 85
I 350K/5 M 0 0 15066 0 0 15055 1 1 15066 0 0I 350K / 5 M 0 0 15066 0 0 15055 1 1 15066 0 0
U 170000 15055 1 1 U 170000 15055 1 1
350K/10 M 1.8 1 13384 1 0 13383 1 13385 8,00E-06 0.0008 350K / 10M 1.8 1 13384 1 0 13383 1 13385 8,00E-06 0.0008
U 224000 13384 1 U 224000 13384 1
350K/20 M 100 59 13894 59 0 13892 2 13953 0.00048 0.048 350K / 20M 100 59 13894 59 0 13892 2 13953 0.00048 0.048
U 208000 13951 2 U 208000 13951 2
350K/3000 M 206000 12365 2 1741 10624 0 2 12367 58 98.29 350K / 3000M 206000 12365 2 1741 10624 0 2 12367 58 98.29
U 3580 1741 10626 U 3580 1741 10626
700K/0 M 9.8 5 12126 5 0 121 19 7 12131 6,00E-05 0.006 700K / 0M 9.8 5 12126 5 0 121 19 7 12131 6,00E-05 0.006
U 176000 12124 7 U 176000 12124 7
700K/5 M 0 0 13123 0 0 233 12890 13123 0 0 700K / 5M 0 0 13123 0 0 233 12890 13123 0 0
U 422 233 12890 U 422 233 12890
700K/10 M 0 0 14715 0 0 14712 3 14715 0 0 700K / 10M 0 0 14715 0 0 14712 3 14715 0 0
U 200000 14712 3 U 200000 14712 3
700K/20 M 7 4 13428 4 0 13427 1 13432 3.1 E-05 0.0031 700K / 20M 7 4 13428 4 0 13427 1 13432 3.1 E-05 0.0031
U 224000 13431 1 U 224000 13431 1
700K/3000 M 20000000 14850 0 14847 3 0 0 14850 100 99 700K / 3000M 20000000 14850 0 14847 3 0 0 14850 100 99
U 200000 14847 3 U 200000 14847 3
70K/0 M 1.4 1 16313 1 0 16313 0 16314 7,00E-08 7,00E-06 150bp 70K / 0 M 1.4 1 16313 1 0 16313 0 16314 7,00E-08 7,00E-06 150bp
U 20000000 16314 0 U 20000000 16314 0
70K/5 M 136000 12892 40 12838 54 40 0 12932 1.05 51.3 70K / 5 M 136000 12892 40 12838 54 40 0 12932 1.05 51.3
U 129000 12878 54 U 129000 12878 54
70K/10 M 104600 13330 158 13209 121 149 9 13488 0.958 48.9 70K / 10M 104600 13330 158 13209 121 149 9 13488 0.958 48.9
U 109200 13358 130 U 109200 13358 130
70K/20 M 172000 12971 9 131 1 1 1660 0 9 12980 68 98.56 70K / 20M 172000 12971 9 131 1 1 1660 0 9 12980 68 98.56
U 2500 131 1 1 1669 U 2500 131 1 1 1669
70K/3000 M 20000000 13448 0 0 13448 0 0 13448 100 70K / 3000M 20000000 13448 0 0 13448 0 0 13448 100
U 0 0 13448 U 0 0 13448
175K/0 M 4.4 3 15894 3 0 15893 1 15897 2,00E-05 0.002 175K / 0 M 4.4 3 15894 3 0 15893 1 15897 2.00E-05 0.002
U 228000 15896 1 U 228000 15896 1
175K/5 M 19.2 1 1 13482 0 1 1 0 13482 13493 0 0 175K / 5 M 19.2 1 1 13482 0 1 1 0 13482 13493 0 0
U 0 0 13493 U 0 0 13493
175K/10 M 20000000 14399 0 14399 0 0 0 14399 1 50 175K / 10M 20000000 14399 0 14399 0 0 0 14399 1 50
U 20000000 14399 0 U 20000000 14399 0
175K/20 M 20000000 141 18 0 13754 364 0 0 141 18 230 99.57 175K / 20M 20000000 141 18 0 13754 364 0 0 141 18 230 99.57
U 86000 13754 364 U 86000 13754 364
175K/3000 M 206000 12998 2 0 12998 0 2 13000 100
175K / 3000M 206000 12998 2 0 12998 0 2 13000 100
Tabelle 27: Kopienanzahl methylierter (M) und nicht-methylierte PLA2/?f-DNA-Fragmente (U) [Copies/20 μΙ Well), Anteil M/U (Ratio) und relativer Anteil M/M+U (Fractional Abundance) in Proben mit keiner Kopie, 5, 10, 20 und 3000 Kopien methylierter PLA2R1 -DNA-Fragmente und jeweils einem Anteil von 70.000 Kopien (70K/0-3000), 175.000 (170K/0-3000), 350.000 (350K/0-3000) und 700.000 (700K/0-3000) nicht-methylierter PLA2R1 -DNA-Fragmente mit dem Primerpaar 133 bp (SEQ ID: 7 und 8) nach 15 Zyklen Prä-Amplifikation mit 1 ,5 mM bzw. 6,0 mM MgCI2- Konzentration und 50°C Annealingtemperatur und anschließender dPCR. NTC: Non-Template-Negativkontrolle. TABLE 27 Number of copies of methylated (M) and unmethylated PLA2 / F-DNA fragments (U) [copies / 20 μΙ wells], M / U ratio and relative fraction M / M + U (fractional abundance) in samples with no copy, 5, 10, 20, and 3000 copies of methylated PLA2R1 DNA fragments each containing 70,000 copies (70K / 0-3000), 175,000 (170K / 0-3000), 350,000 (350K / 0- 3000) and 700,000 (700K / 0-3000) non-methylated PLA2R1 DNA fragments with primer pair 133 bp (SEQ ID: 7 and 8) after 15 cycles of pre-amplification with 1, 5 mM and 6.0 mM MgCl, respectively 2 - concentration and 50 ° C annealing temperature and subsequent dPCR. NTC: Non-Template Negative Control.
Probe Target Κορίβη/20μΙ_ Positive Negative Ch1 +Ch2+ Ch1 +Ch2- Ch1 - Ch1 - Akzeptierte Verhältnis Fraktionale MgCI2 Sample Target Κορίβη / 20μΙ_ Positive Negative Ch1 + Ch2 + Ch1 + Ch2- Ch1 - Ch1 - Accepted Ratio Fractional MgCl 2
Ch2+ Ch2- Tröpfchen Häufigkeit Ch2 + Ch2 droplet frequency
70K 0 M 7.4 4 12620 1 3 8774 3846 12624 0.00027 0.027 1 ,5mM 70K 0 M 7.4 4 12620 1 3 8774 3846 12624 0.00027 0.027 1, 5mM
U 27940 8775 3849 U 27940 8775 3849
70K 5 M 1938 1081 12592 893 188 10688 1904 13673 0.0439 4.2 70K 5M 1938 1081 12592 893 188 10688 1904 13673 0.0439 4.2
U 44180 1 1581 2092 U 44180 1 1581 2092
70K 10 M 2642 1585 13335 1280 305 1 1016 2319 14920 0.0646 6.07 70K 10M 2642 1585 13335 1280 305 1 1016 2319 14920 0.0646 6.07
U 40900 12296 2624 U 40900 12296 2624
70K 20 M 4980 2716 1 1547 1991 725 8731 2816 14263 0.152 13.17 70K 20M 4980 2716 1 1547 1991 725 8731 2816 14263 0.152 13.17
U 32780 10722 3541 U 32780 10722 3541
70K 3000 M 228000 16143 1 13 16130 0 1 16144 12.7 99.992 70K 3000 M 228000 16143 1 13 16130 0 1 16144 12.7 99.992
U 18 13 16131 U 18 13 16131
175K 0 M 3 2 15991 0 2 15267 724 15993 4,00E-05 0.004 175K 0 M 3 2 15991 0 2 15267 724 15993 4,00E-05 0.004
U 72800 15267 726 U 72800 15267 726
175K 5 M 1374 827 13748 820 7 13599 149 14575 0.0129 1.27 175K 5M 1374 827 13748 820 7 13599 149 14575 0.0129 1.27
U 106800 14419 156 U 106800 14419 156
175K 10 M 2920 1518 1 1463 1504 14 1 1337 126 12981 0.0275 2.67 175K 10M 2920 1518 1 1463 1504 14 1 1337 126 12981 0.0275 2.67
U 106600 12841 140 U 106600 12841 140
175K 20 M 4340 2534 12520 2443 91 12217 303 15054 0.0506 4.82 175K 20M 4340 2534 12520 2443 91 12217 303 15054 0.0506 4.82
U 85800 14660 394 U 85800 14660 394
175K 3000 M 200000 15362 3 1274 14088 0 3 15365 99 99 175K 3000 M 200000 15362 3 1274 14088 0 3 15365 99 99
U 2040 1274 14091 U 2040 1274 14091
350K 0 M 394 249 14709 247 2 14670 39 14958 0.00285 0.284 350K 0 M 394 249 14709 247 2 14670 39 14958 0.00285 0.284
U 138800 14917 41
U 138800 14917 41
350K/5 M 1980 1 101 12543 1095 6 12514 29 13644 0.0141 1.39 350K / 5 M 1980 1 101 12543 1095 6 12514 29 13644 0.0141 1.39
U 140400 13609 35 U 140400 13609 35
350K/10 M 2660 1420 1 1905 1403 17 1 1765 140 13325 0.0254 2.47 350K / 10M 2660 1420 1 1905 1403 17 1 1765 140 13325 0.0254 2.47
U 104400 13168 157 U 104400 13168 157
350K/20 M 6660 3064 9355 3061 3 9340 15 12419 0.0433 4.15 350K / 20M 6660 3064 9355 3061 3 9340 15 12419 0.0433 4.15
U 154000 12401 18 U 154000 12401 18
350K/3000 M 20000000 13089 0 5406 7683 0 0 13089 1600 99.937 350K / 3000M 20000000 13089 0 5406 7683 0 0 13089 1600 99.937
U 12540 5406 7683 U 12540 5406 7683
700K/0 M 4.6 2 10144 2 0 10139 5 10146 2.6E-05 0.0026 700K / 0M 4.6 2 10144 2 0 10139 5 10146 2.6E-05 0.0026
U 180000 10141 5 U 180000 10141 5
700K/5 M 1206 512 9729 512 0 9721 8 10241 0.0072 0.71 700K / 5M 1206 512 9729 512 0 9721 8 10241 0.0072 0.71
U 168000 10233 8 U 168000 10233 8
700K/10 M 1914 954 1 1254 954 0 1 1247 7 12208 0.0109 1.08 700K / 10M 1914 954 1 1254 954 0 1 1247 7 12208 0.0109 1.08
U 176000 12201 7 U 176000 12201 7
700K/20 M 5820 3030 10810 3030 0 10805 5 13840 0.0312 3.02 700K / 20M 5820 3030 10810 3030 0 10805 5 13840 0.0312 3.02
U 186000 13835 5 U 186000 13835 5
700K/3000 M 148800 15035 27 10868 4167 0 27 15062 4.95 83.2 700K / 3000M 148800 15035 27 10868 4167 0 27 15062 4.95 83.2
U 30080 10868 4194 U 30080 10868 4194
70K/0 M 384 166 10081 166 0 10081 0 10247 1.9E-05 0.0019 6 mM 70K / 0M 384 166 10081 166 0 10081 0 10247 1.9E-05 0.0019 6mM
U 20000000 10247 0 U 20000000 10247 0
70K/5 M 4.4 2 10676 2 0 10676 0 10678 2.2E-07 2.2E-05 70K / 5M 4.4 2 10676 2 0 10676 0 10678 2.2E-07 2.2E-05
U 20000000 10678 0 U 20000000 10678 0
70K/10 M 1 1.2 6 12627 6 0 12594 33 12633 8,00E-05 0.008 70K / 10M 1 1.2 6 12627 6 0 12594 33 12633 8,00E-05 0.008
U 140000 12600 33 U 140000 12600 33
70K/20 M 8 4 1 1819 4 0 1 1819 0 1 1823 4,00E-07 4,00E-05 70K / 20M 8 4 1 1819 4 0 1 1819 0 1 1823 4,00E-07 4,00E-05
U 20000000 1 1823 0 U 20000000 1 1823 0
70K/3000 M 20000000 12141 0 12140 1 0 0 12141 90 98.9 70K / 3000M 20000000 12141 0 12140 1 0 0 12141 90 98.9
U 222000 12140 1 U 222000 12140 1
175K/0 M 0 0 13218 0 0 13218 0 13218 0 0 175K / 0 M 0 0 13218 0 0 13218 0 13218 0 0
U 20000000 13218 0 U 20000000 13218 0
175K/5 M 0 0 1 1762 0 0 1 1762 0 1 1762 0 0 175K / 5M 0 0 1 1762 0 0 1 1762 0 1 1762 0 0
U 20000000 1 1762 0 U 20000000 1 1762 0
175K/10 M 2 1 1 1472 1 0 1 1472 0 1 1473 1.00E-07 1.00E-05 175K / 10M 2 1 1 1472 1 0 1 1472 0 1 1473 1.00E-07 1.00E-05
U 20000000 1 1473 0
U 20000000 1 1473 0
175K/20 M 6.2 3 1 1227 3 0 1 1213 14 1 1230 4,00E-05 0.004175K / 20M 6.2 3 1 1227 3 0 1 1213 14 1 1230 4,00E-05 0.004
U 158000 1 1216 14 U 158000 1 1216 14
175K/3000 M 180000 14518 7 14516 2 2 5 14525 1 50 175K / 3000M 180000 14518 7 14516 2 2 5 14525 1 50
U 180000 14518 7 U 180000 14518 7
350K/0 M 3.2 2 14917 2 0 14915 2 14919 1.5E-05 0.0015 350K / 0 M 3.2 2 14917 2 0 14915 2 14919 1.5E-05 0.0015
U 210000 14917 2 U 210000 14917 2
350K/5 M 0 0 16205 0 0 16205 0 16205 0 0 350K / 5M 0 0 16205 0 0 16205 0 16205 0 0
U 20000000 16205 0 U 20000000 16205 0
350K/10 M 0 0 15567 0 0 15567 0 15567 0 0 350K / 10M 0 0 15567 0 0 15567 0 15567 0 0
U 20000000 15567 0 U 20000000 15567 0
350K/20 M 1.4 1 15904 1 0 15904 0 15905 7,00E-08 7,00E-06 350K / 20M 1.4 1 15904 1 0 15904 0 15905 7,00E-08 7,00E-06
U 20000000 15905 0 U 20000000 15905 0
350K/3000 M 98400 13487 209 13487 0 209 0 13696 0.0049 0.49 350K / 3000M 98400 13487 209 13487 0 209 0 13696 0.0049 0.49
U 20000000 13696 0 U 20000000 13696 0
700K/0 M 0 0 121 17 0 0 121 17 0 121 17 0 0 700K / 0M 0 0 121 17 0 0 121 17 0 121 17 0 0
U 20000000 121 17 0 U 20000000 121 17 0
700K/5 M 0 0 15213 0 0 15213 0 15213 0 0 700K / 5M 0 0 15213 0 0 15213 0 15213 0 0
U 20000000 15213 0 U 20000000 15213 0
700K/10 M 3 2 15564 2 0 15563 1 15566 1.3E-05 0.0013 700K / 10M 3 2 15564 2 0 15563 1 15566 1.3E-05 0.0013
U 228000 15565 1 U 228000 15565 1
700K/20 M 18.2 1 1 14274 1 1 0 14272 2 14285 9,00E-05 0.009 700K / 20M 18.2 1 1 14274 1 1 0 14272 2 14285 9,00E-05 0.009
U 208000 14283 2 U 208000 14283 2
700K/3000 M 16840 8103 7752 8103 0 7750 2 15855 0.08 7.4 700K / 3000M 16840 8103 7752 8103 0 7750 2 15855 0.08 7.4
U 212000 15853 2 U 212000 15853 2
NTC M 0 0 16573 0 0 0 16573 16573 0 0 NTC M 0 0 16573 0 0 0 16573 16573 0 0
U 0 0 16573
U 0 0 16573
Tabelle 28: Kopienanzahl methylierter (M) und nicht-methylierte PLA2/?f-DNA-Fragmente (U) [Copies/20 μΙ Well), Anteil M/U (Ratio) und relativer Anteil M/M+U (Fractional Abundance) in Proben mit keiner Kopie, 5, 10, 20 und 3000 Kopien methylierter PLA2R1 -DNA-Fragmente und jeweils einem Anteil von 70.000 Kopien (70K/0-3000), 175.000 (170K/0-3000), 350.000 (350K/0-3000) und 700.000 (700K/0-3000) nicht-methylierter PLA2R1 -DNA-Fragmente mit dem Primerpaar 133 bp (SEQ ID: 7 und 8) nach 15 Zyklen Prä-Amplifikation mit 1 ,5 mM bzw. 6,0 mM MgCI2- Konzentration und 63°C Annealingtemperatur und anschließender dPCR. NTC: Non-Template-Negativkontrolle. TABLE 28 Number of Copies of Methylated (M) and Non-Methylated PLA2 / F DNA Fragments (U) [Copies / 20 μL wells], M / U Ratio and Relative M / M + U (Fractional Abundance) in samples with no copy, 5, 10, 20, and 3000 copies of methylated PLA2R1 DNA fragments each containing 70,000 copies (70K / 0-3000), 175,000 (170K / 0-3000), 350,000 (350K / 0- 3000) and 700,000 (700K / 0-3000) non-methylated PLA2R1 DNA fragments with primer pair 133 bp (SEQ ID: 7 and 8) after 15 cycles of pre-amplification with 1, 5 mM and 6.0 mM MgCl, respectively 2 - Concentration and 63 ° C annealing temperature and subsequent dPCR. NTC: Non-Template Negative Control.
Ch1 - Ch1 - Akzeptierte FraktionaleCh1 - Ch1 - Accepted fractional
Well Probe Target Kopien/20|jLWell Positive Negative Ch1+Ch2+ Ch1+Ch2- Verhältnis M Well Sample Target Copies / 20 | jLWell Positive Negative Ch1 + Ch2 + Ch1 + Ch2 Ratio M
Ch2+ Ch2- Tröpfchen Häufigkeit Ch2 + Ch2 droplet frequency
D03 70K 0 M 0 0 15574 0 0 64 15510 15574 0 0 1 ,5 D03 70K 0 M 0 0 15574 0 0 64 15510 15574 0 0 1, 5
U 96 64 15510 U 96 64 15510
C03 70K 5 M 14 9 15186 0 9 54 15132 15195 0.17 14 C03 70K 5M 14 9 15186 0 9 54 15132 15195 0.17 14
U 84 54 15141 U 84 54 15141
B03 70K 10 M 42 26 14512 0 26 64 14448 14538 0.41 29 B03 70K 10M 42 26 14512 0 26 64 14448 14538 0.41 29
U 104 64 14474 U 104 64 14474
A03 70K 20 M 42 26 14816 0 26 55 14761 14842 0.47 32 A03 70K 20M 42 26 14816 0 26 55 14761 14842 0.47 32
U 88 55 14787 U 88 55 14787
H02 70K 3000 M 3032 2179 15843 2 2177 91 15752 18022 25 96.1 H02 70K 3000 M 3032 2179 15843 2 2177 91 15752 18022 25 96.1
U 122 93 17929 U 122 93 17929
G02 175K/0 M 0 0 14398 0 0 188 14210 14398 0 0 G02 175K / 0 M 0 0 14398 0 0 188 14210 14398 0 0
U 310 188 14210 U 310 188 14210
F02 175K/5 M 7.4 5 15993 0 5 223 15770 15998 0.022 2.2 F02 175K / 5 M 7.4 5 15993 0 5 223 15770 15998 0.022 2.2
U 330 223 15775 U 330 223 15775
E02 175K/10 M 32 22 15991 0 22 260 15731 16013 0.084 7.7 E02 175K / 10 M 32 22 15991 0 22 260 15731 16013 0.084 7.7
U 386 260 15753 U 386 260 15753
D02 175K 20 M 36 24 15674 0 24 237 15437 15698 0.101 9.1 D02 175K 20 M 36 24 15674 0 24 237 15437 15698 0.101 9.1
U 358 237 15461 U 358 237 15461
C02 175K 3000 M 6660 3889 1 1890 5 3884 143 1 1747 15779 30 96.8 C02 175K 3000 M 6660 3889 1 1890 5 3884 143 1 1747 15779 30 96.8
U 222 148 15631 U 222 148 15631
B02 350K 0 M 0 0 13714 0 0 294 13420 13714 0 0 B02 350K 0 M 0 0 13714 0 0 294 13420 13714 0 0
U 510 294 13420 U 510 294 13420
A02 350K 5 M 1.4 1 15766 0 1 387 15379 15767 0.0026 0.25
A02 350K 5M 1.4 1 15766 0 1 387 15379 15767 0.0026 0.25
U 584 387 15380 U 584 387 15380
H01 350K/10 M 7 4 13299 0 4 373 12926 13303 0.01 1 1 H01 350K / 10 M 7 4 13299 0 4 373 12926 13303 0.01 1 1
U 670 373 12930 U 670 373 12930
G01 350K/20 M 16.2 10 14489 0 10 493 13996 14499 0.02 2 G01 350K / 20 M 16.2 10 14489 0 10 493 13996 14499 0.02 2
U 814 493 14006 U 814 493 14006
F01 350K/3000 M 4260 1456 7323 5 1451 286 7037 8779 5.4 84.3 F01 350K / 3000 M 4260 1456 7323 5 1451 286 7037 8779 5.4 84.3
U 794 291 8488 U 794 291 8488
E01 700K/0 M 1.8 1 13385 0 1 616 12769 13386 0.0016 0.16 E01 700K / 0 M 1.8 1 13385 0 1 616 12769 13386 0.0016 0.16
U 1 108 616 12770 U 1 108 616 12770
D01 700K/5 M 1.6 1 13958 0 1 909 13049 13959 0.001 1 0.1 1 D01 700K / 5 M 1.6 1 13958 0 1 909 13049 13959 0.001 1 0.1 1
U 1580 909 13050 U 1580 909 13050
C01 700K/10 M 54 27 1 1833 0 27 765 1 1068 1 1860 0.034 3.3 C01 700K / 10M 54 27 1 1833 0 27 765 1 1068 1 1860 0.034 3.3
U 1560 765 1 1095 U 1560 765 1 1095
B01 700K/20 M 2.2 1 10432 0 1 709 9723 10433 0.0014 0.14 B01 700K / 20 M 2.2 1 10432 0 1 709 9723 10433 0.0014 0.14
U 1660 709 9724 U 1660 709 9724
A01 700K/3000 M 2780 1400 1 1205 7 1393 876 10329 12605 1.62 61.8 A01 700K / 3000 M 2780 1400 1 1205 7 1393 876 10329 12605 1.62 61.8
U 1700 883 1 1722 U 1700 883 1 1722
H05 70K/0 M 0 0 8874 0 0 42 8832 8874 0 0 H05 70K / 0 M 0 0 8874 0 0 42 8832 8874 0 0
U 1 12 42 8832 U 1 12 42 8832
G05 70K/5 M 1990 1039 1 1769 3 1036 47 1 1722 12808 22 95.6 G05 70K / 5M 1990 1039 1 1769 3 1036 47 1 1722 12808 22 95.6
U 92 50 12758 U 92 50 12758
F05 70K/10 M 1866 1039 12595 0 1039 66 12529 13634 16.3 94.2 F05 70K / 10M 1866 1039 12595 0 1039 66 12529 13634 16.3 94.2
U 1 14 66 13568 U 1 14 66 13568
E05 70K/20 M 6060 2669 9102 1 2668 54 9048 1 1771 55 98.21 E05 70K / 20M 6060 2669 9102 1 2668 54 9048 1 1771 55 98.21
U 1 10 55 1 1716 U 1 10 55 1 1716
D05 70K/3000 M 224000 13388 1 3 13385 0 1 13389 42000 100 D05 70K / 3000 M 224000 13388 1 3 13385 0 1 13389 42000 100
U 5.2 3 13386 U 5.2 3 13386
C05 175K/0 M 5.6 3 12577 1 2 123 12454 12580 0.024 2.4 C05 175K / 0 M 5.6 3 12577 1 2 123 12454 12580 0.024 2.4
U 234 124 12456 U 234 124 12456
B05 175K/5 M 770 432 12989 1 431 189 12800 13421 2.29 69.6 B05 175K / 5M 770 432 12989 1 431 189 12800 13421 2.29 69.6
U 336 190 13231 U 336 190 13231
A05 175K/10 M 3820 1801 10204 2 1799 134 10070 12005 14.3 93.4 A05 175K / 10M 3820 1801 10204 2 1799 134 10070 12005 14.3 93.4
U 268 136 1 1869 U 268 136 1 1869
H04 175K/20 M 4980 2559 10837 2 2557 153 10684 13396 18.2 94.8
H04 175K / 20M 4980 2559 10837 2 2557 153 10684 13396 18.2 94.8
U 274 155 13241 U 274 155 13241
G04 175K/3000 M 20000000 15139 0 0 15139 0 0 15139 100 G04 175K / 3000 M 20000000 15139 0 0 15139 0 0 15139 100
U 0 0 15139 U 0 0 15139
F04 350K/0 M 9.4 6 14969 0 6 289 14680 14975 0.021 2 F04 350K / 0 M 9.4 6 14969 0 6 289 14680 14975 0.021 2
U 458 289 14686 U 458 289 14686
E04 350K/5 M 976 588 13876 7 581 429 13447 14464 1.36 57.6 E04 350K / 5 M 976 588 13876 7 581 429 13447 14464 1.36 57.6
U 720 436 14028 U 720 436 14028
D04 350K/10 M 1270 71 1 12815 2 709 344 12471 13526 2.08 67.6 D04 350K / 10M 1270 71 1 12815 2 709 344 12471 13526 2.08 67.6
U 610 346 13180 U 610 346 13180
C04 350K/20 M 4700 2644 1 1951 15 2629 312 1 1639 14595 8.8 89.8 C04 350K / 20 M 4700 2644 1 1951 15 2629 312 1 1639 14595 8.8 89.8
U 534 327 14268 U 534 327 14268
B04 350K/3000 M 20000000 15336 0 2 15334 0 0 15336 100 B04 350K / 3000 M 20000000 15336 0 2 15334 0 0 15336 100
U 3 2 15334 U 3 2 15334
A04 700K/0 M 1.6 1 14278 0 1 538 13740 14279 0.0018 0.18 A04 700K / 0 M 1.6 1 14278 0 1 538 13740 14279 0.0018 0.18
U 904 538 13741 U 904 538 13741
H03 700K/5 M 584 337 13425 12 325 976 12449 13762 0.333 25 H03 700K / 5M 584 337 13425 12 325 976 12449 13762 0.333 25
U 1760 988 12774 U 1760 988 12774
G03 700K/10 M 1536 1093 16213 22 1071 1076 15137 17306 1 49.9 G03 700K / 10M 1536 1093 16213 22 1071 1076 15137 17306 1 49.9
U 1542 1098 16208 U 1542 1098 16208
F03 700K/20 M 4760 2541 1 1344 28 2513 496 10848 13885 5.25 84 F03 700K / 20M 4760 2541 1 1344 28 2513 496 10848 13885 5.25 84
U 906 524 13361 U 906 524 13361
E03 700K/3000 M 20000000 14373 0 0 14373 0 0 14373 100 E03 700K / 3000M 20000000 14373 0 0 14373 0 0 14373 100
U 0 0 14373 U 0 0 14373
H1 1 NTC M 0 0 12407 0 0 0 12407 12407 0 0 H1 1 NTC M 0 0 12407 0 0 0 12407 12407 0 0
U 0 0 12407
U 0 0 12407
Tabelle 29: Kopienanzahl methylierter (M) und nicht-methylierte PLA2/?7-DNA-Fragmente (U) [Copies/20 μΙ Well), Anteil M/U (Ratio) und relativer Anteil M/M+U (Fractional Abundance) in Proben mit keiner Kopie, 5, 10, 20 und 3000 Kopien methylierter PLA2R1 -DNA-Fragmente und jeweils einem Anteil von 70.000 Kopien (70K/0-3000), 175.000 (170K/0-3000), 350.000 (350K/0-3000) und 700.000 (700K/0-3000) nicht-methylierter PLA2R1 -DNA-Fragmente mit dem Primerpaar 133 bp (SEQ ID: 7 und 8) nach 50 Zyklen Prä-Amplifikation mit 1 ,5 mM bzw. 6,0 mM MgCI2- Konzentration und 50°C Annealingtemperatur und anschließender dPCR. NTC: Non-Template-Negativkontrolle. Table 29: Copy number of methylated (M) and unmethylated PLA2 /? 7 DNA fragments (U) [copies / 20 μΙ wells], proportion M / U (ratio) and relative fraction M / M + U (fractional abundance) in samples with no copy, 5, 10, 20, and 3000 copies of methylated PLA2R1 DNA fragments each containing 70,000 copies (70K / 0-3000), 175,000 (170K / 0-3000), 350,000 (350K / 0- 3000) and 700,000 (700K / 0-3000) non-methylated PLA2R1 DNA fragments with primer pair 133 bp (SEQ ID: 7 and 8) after 50 cycles of pre-amplification with 1, 5 mM and 6.0 mM MgCl, respectively 2 - concentration and 50 ° C annealing temperature and subsequent dPCR. NTC: Non-Template Negative Control.
Ch1- Ch1- Akzeptierte FraktionaleCh1- Ch1- Accepted fractional
Well Probe Target Kopien/20|jLWell Positive Negative Ch1+Ch2+ Ch1+Ch2- Verhältnis M Well Sample Target Copies / 20 | jLWell Positive Negative Ch1 + Ch2 + Ch1 + Ch2 Ratio M
Ch2+ Ch2- Tröpfchen Häufigkeit Ch2 + Ch2 droplet frequency
D08 70K/0 M 1.6 1 14934 1 0 14933 1 14935 7,00E-06 0.0007 1 , D08 70K / 0 M 1.6 1 14934 1 0 14933 1 14935 7,00E-06 0.0007 1,
U 226000 14934 1 U 226000 14934 1
C08 70K/5 M 2800 161 1 12708 161 1 0 12708 0 14319 0.00014 0.014 C08 70K / 5 M 2800 161 1 12708 161 1 0 12708 0 14319 0.00014 0.014
U 20000000 14319 0 U 20000000 14319 0
B08 70K/10 M 101800 16700 223 16700 0 223 0 16923 0.0051 0.51 B08 70K / 10M 101800 16700 223 16700 0 223 0 16923 0.0051 0.51
U 20000000 16923 0 U 20000000 16923 0
A08 70K/20 M 176000 14400 8 14400 0 6 2 14408 0.84 45.8 A08 70K / 20M 176000 14400 8 14400 0 6 2 14408 0.84 45.8
U 208000 14406 2 U 208000 14406 2
H07 70K/3000 M 20000000 14647 0 0 14647 0 0 14647 100 H07 70K / 3000M 20000000 14647 0 0 14647 0 0 14647 100
U 0 0 14647 U 0 0 14647
G07 175K/0 M 0 0 15079 0 0 15079 0 15079 0 0 G07 175K / 0 M 0 0 15079 0 0 15079 0 15079 0 0
U 20000000 15079 0 U 20000000 15079 0
F07 175K/5 M 1.4 1 15751 1 0 15751 0 15752 7,00E-08 7,00E-06 F07 175K / 5 M 1.4 1 15751 1 0 15751 0 15752 7,00E-08 7,00E-06
U 20000000 15752 0 U 20000000 15752 0
E07 175K/10 M 1458 847 13258 847 0 13258 0 14105 7.3E-05 0.0073 E07 175K / 10M 1458 847 13258 847 0 13258 0 14105 7.3E-05 0.0073
U 20000000 14105 0 U 20000000 14105 0
D07 175K/20 M 2192 1482 15175 1482 0 15174 1 16657 0.0096 0.95 D07 175K / 20M 2192 1482 15175 1482 0 15174 1 16657 0.0096 0.95
U 228000 16656 1 U 228000 16656 1
C07 175K/3000 M 20000000 14743 0 4 14739 0 0 14743 100 C07 175K / 3000M 20000000 14743 0 4 14739 0 0 14743 100
U 6.4 4 14739 U 6.4 4 14739
B07 350K/0 M 0 0 15783 0 0 15779 4 15783 0 0 B07 350K / 0 M 0 0 15783 0 0 15779 4 15783 0 0
U 194000 15779 4 U 194000 15779 4
A07 350K/5 M 430 318 17265 318 0 17239 26 17583 0.0028 0.279
A07 350K / 5M 430 318 17265 318 0 17239 26 17583 0.0028 0.279
U 153400 17557 26 U 153400 17557 26
H06 350K/10 M 286 1 19 9764 1 19 0 9763 1 9883 0.00132 0.132 H06 350K / 10 M 286 1 19 9764 1 19 0 9763 1 9883 0.00132 0.132
U 216000 9882 1 U 216000 9882 1
G06 350K/20 M 33680 9971 3131 9971 0 3131 0 13102 0.0017 0.17 G06 350K / 20 M 33680 9971 3131 9971 0 3131 0 13102 0.0017 0.17
U 20000000 13102 0 U 20000000 13102 0
F06 350K/3000 M 20000000 1 1525 0 367 1 1 158 0 0 1 1525 26000 100 F06 350K / 3000 M 20000000 1 1525 0 367 1 1 158 0 0 1 1525 26000 100
U 762 367 1 1 158 U 762 367 1 1 158
E06 700K/0 M 0 0 13798 0 0 13798 0 13798 0 0 E06 700K / 0 M 0 0 13798 0 0 13798 0 13798 0 0
U 20000000 13798 0 U 20000000 13798 0
D06 700K/5 M 22 1 1 12214 1 1 0 12212 2 12225 0.0001 0.01 D06 700K / 5 M 22 1 1 12214 1 1 0 12212 2 12225 0.0001 0.01
U 206000 12223 2 U 206000 12223 2
C06 700K/10 M 5.8 3 12099 3 0 12098 1 12102 2.6E-05 0.0026 C06 700K / 10 M 5.8 3 12099 3 0 12098 1 12102 2.6E-05 0.0026
U 222000 12101 1 U 222000 12101 1
B06 700K/20 M 856 470 12694 470 0 12694 0 13164 4.3E-05 0.0043 B06 700K / 20M 856 470 12694 470 0 12694 0 13164 4.3E-05 0.0043
U 20000000 13164 0 U 20000000 13164 0
A06 700K/3000 M 20000000 1 1920 0 7202 4718 0 0 1 1920 920 99.89 A06 700K / 3000M 20000000 1 1920 0 7202 4718 0 0 1 1920 920 99.89
U 21800 7202 4718 U 21800 7202 4718
H10 70K/0 M 0 0 16220 0 0 16216 4 16220 0 0 H10 70K / 0 M 0 0 16220 0 0 16216 4 16220 0 0
U 196000 16216 4 U 196000 16216 4
G10 70K/5 M 0 0 15609 0 0 15609 0 15609 0 0 G10 70K / 5M 0 0 15609 0 0 15609 0 15609 0 0
U 20000000 15609 0 U 20000000 15609 0
F10 70K/10 M 1.6 1 15284 1 0 15284 0 15285 8,00E-08 8,00E-06 F10 70K / 10M 1.6 1 15284 1 0 15284 0 15285 8,00E-08 8,00E-06
U 20000000 15285 0 U 20000000 15285 0
E10 70K/20 M 0 0 16842 0 0 16841 1 16842 0 0 E10 70K / 20M 0 0 16842 0 0 16841 1 16842 0 0
U 228000 16841 1 U 228000 16841 1
D10 70K/3000 M 20000000 15099 0 15089 10 0 0 15099 120 99.15 D10 70K / 3000M 20000000 15099 0 15089 10 0 0 15099 120 99.15
U 172000 15089 10 U 172000 15089 10
C10 175K/0 M 1.6 1 14131 1 0 14127 4 14132 9,00E-06 0.0009 C10 175K / 0 M 1.6 1 14131 1 0 14127 4 14132 9,00E-06 0.0009
U 192000 14128 4 U 192000 14128 4
B10 175K/5 M 0 0 14404 0 0 14400 4 14404 0 0 B10 175K / 5 M 0 0 14404 0 0 14400 4 14404 0 0
U 192000 14400 4 U 192000 14400 4
A10 175K/10 M 0 0 14134 0 0 14129 5 14134 0 0 A10 175K / 10M 0 0 14134 0 0 14129 5 14134 0 0
U 186000 14129 5 U 186000 14129 5
H09 175K/20 M 0 0 12685 0 0 12684 1 12685 0 0
H09 175K / 20 M 0 0 12685 0 0 12684 1 12685 0 0
U 222000 12684 1 U 222000 12684 1
G09 175K/3000 M 1 16000 13858 101 13847 1 1 79 22 13959 0.82 44.9 G09 175K / 3000 M 1 16000 13858 101 13847 1 1 79 22 13959 0.82 44.9
U 142200 13926 33 U 142200 13926 33
F09 350K/0 M 0 0 13733 0 0 13733 0 13733 0 0 F09 350K / 0 M 0 0 13733 0 0 13733 0 13733 0 0
U 20000000 13733 0 U 20000000 13733 0
E09 350K/5 M 1.6 1 14852 1 0 14851 1 14853 7,00E-06 0.0007 E09 350K / 5 M 1.6 1 14852 1 0 14851 1 14853 7.00E-06 0.0007
U 226000 14852 1 U 226000 14852 1
D09 350K/10 M 3.2 2 14367 2 0 14367 0 14369 1.6E-07 1.6E-05 D09 350K / 10 M 3.2 2 14367 2 0 14367 0 14369 1.6E-07 1.6E-05
U 20000000 14369 0 U 20000000 14369 0
C09 350K/20 M 0 0 13833 0 0 13833 0 13833 0 0 C09 350K / 20 M 0 0 13833 0 0 13833 0 13833 0 0
U 20000000 13833 0 U 20000000 13833 0
B09 350K/3000 M 137200 13956 41 13956 0 41 0 13997 0.0069 0.68 B09 350K / 3000 M 137200 13956 41 13956 0 41 0 13997 0.0069 0.68
U 20000000 13997 0 U 20000000 13997 0
A09 700K/0 M 1.6 1 13937 1 0 13937 0 13938 8,00E-08 8,00E-06 A09 700K / 0 M 1.6 1 13937 1 0 13937 0 13938 8,00E-08 8,00E-06
U 20000000 13938 0 U 20000000 13938 0
H08 700K/5 M 1.4 1 16530 1 0 16528 2 16531 7,00E-06 0.0007 H08 700K / 5 M 1.4 1 16530 1 0 16528 2 16531 7,00E-06 0.0007
U 212000 16529 2 U 212000 16529 2
G08 700K/10 M 7.4 5 16058 5 0 16053 5 16063 3.9E-05 0.0039 G08 700K / 10M 7.4 5 16058 5 0 16053 5 16063 3.9E-05 0.0039
U 190000 16058 5 U 190000 16058 5
F08 700K/20 M 0 0 16236 0 0 16221 15 16236 0 0 F08 700K / 20M 0 0 16236 0 0 16221 15 16236 0 0
U 164000 16221 15 U 164000 16221 15
E08 700K/3000 M 7760 4538 1 1614 4538 0 1 1614 0 16152 0.00039 0.039 E08 700K / 3000 M 7760 4538 1 1614 4538 0 1 1614 0 16152 0.00039 0.039
U 20000000 16152 0 U 20000000 16152 0
G1 1 NTC M 0 0 16573 0 0 0 16573 16573 0 0 G1 1 NTC M 0 0 16573 0 0 0 16573 16573 0 0
U 0 0 16573
U 0 0 16573
Tabelle 30: Kopienanzahl methylierter (M) und nicht-methylierte PLA2/?f-DNA-Fragmente (U) [Copies/20 μΙ Well), Anteil M/U (Ratio) und relativer Anteil M/M+U (Fractional Abundance) in Proben mit keiner Kopie, 5, 10, 20 und 3000 Kopien methylierter PLA2R1 -DNA-Fragmente und jeweils einem Anteil von 70.000 Kopien (70K/0-3000), 175.000 (170K/0-3000), 350.000 (350K/0-3000) und 700.000 (700K/0-3000) nicht-methylierter PLA2R1 -DNA-Fragmente mit dem Primerpaar 133 bp (SEQ ID: 7 und 8) nach 50 Zyklen Prä-Amplifikation mit 1 ,5 mM bzw. 6,0 mM MgCI2- Konzentration und 63°C Annealingtemperatur und anschließender dPCR. NTC: Non-Template-Negativkontrolle. TABLE 30 Number of Copies of Methylated (M) and Non-Methylated PLA2 / F DNA Fragments (U) [Copies / 20 μL wells], M / U Ratio and Relative M / M + U (Fractional Abundance) in samples with no copy, 5, 10, 20, and 3000 copies of methylated PLA2R1 DNA fragments each containing 70,000 copies (70K / 0-3000), 175,000 (170K / 0-3000), 350,000 (350K / 0- 3000) and 700,000 (700K / 0-3000) non-methylated PLA2R1 DNA fragments with primer pair 133 bp (SEQ ID: 7 and 8) after 50 cycles of pre-amplification with 1, 5 mM and 6.0 mM MgCl, respectively 2 - Concentration and 63 ° C annealing temperature and subsequent dPCR. NTC: Non-Template Negative Control.
Ch1 - Ch1 - Akzeptierte Fraktionale Ch1 - Ch1 - Accepted fractional
Well Probe Target Kopien/20|jLWell Positive Negative Ch1+Ch2+ Ch1+Ch2- Verhältnis Well Sample Target Copies / 20 | jLWell Positive Negative Ch1 + Ch2 + Ch1 + Ch2 Ratio
Ch2+ Ch2- Tröpfchen Häufigkeit Ch2 + Ch2 droplet frequency
D08 70K 0 M 0 0 12948 0 0 12947 1 12948 0 0 D08 70K 0 M 0 0 12948 0 0 12947 1 12948 0 0
U 222000 12947 1 U 222000 12947 1
C08 70K 5 M 20000000 12682 0 2227 10455 0 0 12682 4400 99.977 C08 70K 5M 20000000 12682 0 2227 10455 0 0 12682 4400 99.977
U 4540 2227 10455 U 4540 2227 10455
B08 70K 10 M 20000000 14665 0 5625 9040 0 0 14665 1800 99.943 B08 70K 10M 20000000 14665 0 5625 9040 0 0 14665 1800 99.943
U 1 1380 5625 9040 U 1 1380 5625 9040
A08 70K 20 M 190000 12963 4 568 12395 0 4 12967 180 99.45 A08 70K 20M 190000 12963 4 568 12395 0 4 12967 180 99.45
U 1054 568 12399 U 1054 568 12399
H07 70K 3000 M 20000000 14373 0 0 14373 0 0 14373 100 H07 70K 3000 M 20000000 14373 0 0 14373 0 0 14373 100
U 0 0 14373 U 0 0 14373
G07 175K 0 M 7.4 5 15986 5 0 15978 8 15991 4.1 E-05 0.0041 G07 175K 0 M 7.4 5 15986 5 0 15978 8 15991 4.1 E-05 0.0041
U 178000 15983 8 U 178000 15983 8
F07 175K/5 M 224000 13736 1 13735 1 1 0 13737 1 50 F07 175K / 5 M 224000 13736 1 13735 1 1 0 13737 1 50
U 224000 13736 1 U 224000 13736 1
E07 175K 10 M 20000000 13236 0 3441 9795 0 0 13236 2800 99.965 E07 175K 10M 20000000 13236 0 3441 9795 0 0 13236 2800 99.965
U 7080 3441 9795 U 7080 3441 9795
D07 175K 20 M 20000000 13433 0 4918 8515 0 0 13433 1900 99.946 D07 175K 20M 20000000 13433 0 4918 8515 0 0 13433 1900 99.946
U 10720 4918 8515 U 10720 4918 8515
C07 175K 3000 M 226000 14414 1 1 14413 0 1 14415 140000 99.993 C07 175K 3000 M 226000 14414 1 1 14413 0 1 14415 140000 99.993
U 1.6 1 14414 U 1.6 1 14414
B07 350K 0 M 0 0 14207 0 0 14207 0 14207 0 0 B07 350K 0 M 0 0 14207 0 0 14207 0 14207 0 0
U 20000000 14207 0 U 20000000 14207 0
A07 350K 5 M 58600 12525 1 133 12525 0 996 137 13658 0.541 35.1 A07 350K 5 M 58600 12525 1 133 12525 0 996 137 13658 0.541 35.1
U 108200 13521 137 U 108200 13521 137
H06 350K 10 M 20000000 13957 0 13957 0 0 0 13957 1 50
H06 350K 10M 20000000 13957 0 13957 0 0 0 13957 1 50
U 20000000 13957 0 U 20000000 13957 0
G06 350K/20 M 20000000 13838 0 13838 0 0 0 13838 1 50 G06 350K / 20 M 20000000 13838 0 13838 0 0 0 13838 1 50
U 20000000 13838 0 U 20000000 13838 0
F06 350K/3000 M 20000000 13946 0 0 13946 0 0 13946 100 F06 350K / 3000 M 20000000 13946 0 0 13946 0 0 13946 100
U 0 0 13946 U 0 0 13946
E06 700K/0 M 0 0 13541 0 0 13538 3 13541 0 0 E06 700K / 0 M 0 0 13541 0 0 13538 3 13541 0 0
U 198000 13538 3 U 198000 13538 3
D06 700K/5 M 0 0 13368 0 0 13368 0 13368 0 0 D06 700K / 5 M 0 0 13368 0 0 13368 0 13368 0 0
U 20000000 13368 0 U 20000000 13368 0
C06 700K/10 M 20000000 1 1725 0 1 1724 1 0 0 1 1725 90 98.9 C06 700K / 10M 20000000 1 1725 0 1 1724 1 0 0 1 1725 90 98.9
U 220000 1 1724 1 U 220000 1 1724 1
B06 700K/20 M 224000 13323 1 13323 0 1 0 13324 0.01 1 1.1 B06 700K / 20 M 224000 13323 1 13323 0 1 0 13324 0.01 1 1.1
U 20000000 13324 0 U 20000000 13324 0
A06 700K/3000 M 224000 13197 1 0 13197 0 1 13198 100 A06 700K / 3000 M 224000 13197 1 0 13197 0 1 13198 100
U 0 0 13198 U 0 0 13198
H10 70K/0 M 0 0 13306 0 0 13306 0 13306 0 0 H10 70K / 0 M 0 0 13306 0 0 13306 0 13306 0 0
U 20000000 13306 0 U 20000000 13306 0
G10 70K/5 M 20000000 16759 0 1 16758 0 0 16759 1000000 100 G10 70K / 5 M 20000000 16759 0 1 16758 0 0 16759 1000000 100
U 1.4 1 16758 U 1.4 1 16758
F10 70K/10 M 226000 14386 1 0 14386 0 1 14387 100 F10 70K / 10M 226000 14386 1 0 14386 0 1 14387 100
U 0 0 14387 U 0 0 14387
E10 70K/20 M 228000 15578 1 2 15576 0 1 15579 80000 100 E10 70K / 20 M 228000 15578 1 2 15576 0 1 15579 80000 100
U 3 2 15577 U 3 2 15577
D10 70K/3000 M 20000000 14384 0 1 1 14373 0 0 14384 1000000 100 D10 70K / 3000M 20000000 14384 0 1 1 14373 0 0 14384 1000000 100
U 18 1 1 14373 U 18 1 1 14373
C10 175K/0 M 0 0 14344 0 0 14288 56 14344 0 0 C10 175K / 0 M 0 0 14344 0 0 14288 56 14344 0 0
U 130400 14288 56 U 130400 14288 56
B10 175K/5 M 20000000 16380 0 10788 5592 0 0 16380 790 99.87 B10 175K / 5M 20000000 16380 0 10788 5592 0 0 16380 790 99.87
U 25280 10788 5592 U 25280 10788 5592
A10 175K/10 M 20000000 14283 0 0 14283 0 0 14283 100 A10 175K / 10M 20000000 14283 0 0 14283 0 0 14283 100
U 0 0 14283 U 0 0 14283
H09 175K/20 M 20000000 12692 0 0 12692 0 0 12692 100 H09 175K / 20 M 20000000 12692 0 0 12692 0 0 12692 100
U 0 0 12692 U 0 0 12692
G09 175K/3000 M 20000000 15891 0 2 15889 0 0 15891 1000000 100
G09 175K / 3000 M 20000000 15891 0 2 15889 0 0 15891 1000000 100
U 3 2 15889 U 3 2 15889
F09 350K/0 M 1.4 1 16234 1 0 16220 14 16235 9,00E-06 0.0009 F09 350K / 0 M 1.4 1 16234 1 0 16220 14 16235 9,00E-06 0.0009
U 166000 16221 14 U 166000 16221 14
E09 350K/5 M 20000000 14935 0 1 1316 3619 0 0 14935 600 99.83 E09 350K / 5 M 20000000 14935 0 1 1316 3619 0 0 14935 600 99.83
U 33360 1 1316 3619 U 33360 1 1316 3619
D09 350K/10 M 20000000 15498 0 682 14816 0 0 15498 19000 100 D09 350K / 10 M 20000000 15498 0 682 14816 0 0 15498 19000 100
U 1058 682 14816 U 1058 682 14816
C09 350K/20 M 20000000 1 1865 0 21 1 1844 0 0 1 1865 480000 100 C09 350K / 20 M 20000000 1 1865 0 21 1 1844 0 0 1 1865 480000 100
U 42 21 1 1844 U 42 21 1 1844
B09 350K/3000 M 20000000 13551 0 0 13551 0 0 13551 100 B09 350K / 3000 M 20000000 13551 0 0 13551 0 0 13551 100
U 0 0 13551 U 0 0 13551
A09 700K/0 M 0 0 14046 0 0 14046 0 14046 0 0 A09 700K / 0 M 0 0 14046 0 0 14046 0 14046 0 0
U 20000000 14046 0 U 20000000 14046 0
H08 700K/5 M 20000000 13431 0 13427 4 0 0 13431 100 99.05 H08 700K / 5 M 20000000 13431 0 13427 4 0 0 13431 100 99.05
U 192000 13427 4 U 192000 13427 4
G08 700K/10 M 20000000 12296 0 1472 10824 0 0 12296 6700 99.985 G08 700K / 10M 20000000 12296 0 1472 10824 0 0 12296 6700 99.985
U 3000 1472 10824 U 3000 1472 10824
F08 700K/20 M 188000 14635 5 8 14627 0 5 14640 15000 100 F08 700K / 20M 188000 14635 5 8 14627 0 5 14640 15000 100
U 12.8 8 14632 U 12.8 8 14632
E08 700K/3000 M 20000000 14344 0 0 14344 0 0 14344 100 E08 700K / 3000M 20000000 14344 0 0 14344 0 0 14344 100
U 0 0 14344 U 0 0 14344
H1 1 NTC M 0 0 12407 0 0 0 12407 12407 0 0 H1 1 NTC M 0 0 12407 0 0 0 12407 12407 0 0
U 0 0 12407
U 0 0 12407
Tabelle 31 : Bestimmung der GSTP1- und fl^SSFlA-Methylierung mit der BBPA-dPCR- Methode unter Verwendung der GSTP1 -1 16bp- Primer (SEQ ID No: 93 und 94; 4,5 mM MgCI2-Konzentration; 53,7°C Annealingtemperatur und 15x Zyklen in der BBPA), GSTP1 - 120bp-Primer (SEQ ID No: 5 und 6; 2,5 mM MgCI2-Konzentration; 50,7°C Annealingtemperatur und 15x Zyklen in der BBPA) und RASSF1A-1 17bp-Primer (SEQ ID No: 3 und 4; 2,5 mM MgCI2-Konzentration; 55,7°C Annealingtemperatur und 15x Zyklen in der BBPA) in Serumproben gesunder Frauen (K1 -K25) und Patientinnen mit Mamma-CA (P1 -P16) und Ovarial-CA (P17-P23), einer Serumprobe der Patientin P8a nach 8-wöchiger Chemotherapie (P8b) und einer Patientin (P24) mit pathogener BRCA1 -Mutation. Pathologische Werte für die Methylierungen sind dick gedruckt. Die ct/i-off-Werte für die jeweiligen Gene sind in der ersten Zeile angegeben. Table 31: Determination of GSTP1 and fl ^ SSFIA methylation by the BBPA-dPCR method using the GSTP1-1 16bp primers (SEQ ID No: 93 and 94; 4.5 mM MgCl 2 concentration; 53.7 ° C annealing temperature and 15x cycles in the BBPA), GSTP1 - 120bp primer (SEQ ID No: 5 and 6, 2.5mM MgCl 2 concentration, 50.7 ° C annealing temperature and 15x cycles in BBPA) and RASSF1A- 1 17bp primer (SEQ ID No: 3 and 4, 2.5 mM MgCl 2 concentration, 55.7 ° C annealing temperature and 15x cycles in the BBPA) in serum samples from healthy women (K1-K25) and patients with mammary CA. (P1 -P16) and ovarian CA (P17-P23), a serum sample from patient P8a after 8 weeks of chemotherapy (P8b) and one patient (P24) with pathogenic BRCA1 mutation. Pathological values for the methylations are printed thick. The ct / i-off values for the respective genes are given in the first line.
ID Alter CA15-3 GSTP1- GSTP1- RASSF1A- Klinische Befunde ID Age CA15-3 GSTP1- GSTP1- RASSF1A- Clinical findings
bzw. 116bp 120bp 117bp or 116bp 120bp 117bp
CA125 in <0,05% <0,067% <3,0% CA125 in <0.05% <0.067% <3.0%
U/ml U / ml
Kl 21 0 0 1,1 Kl 21 0 0 1,1
K2 21 0 0 1 K2 21 0 0 1
K3 29 0 0 0,94 K3 29 0 0 0.94
K4 23 0 0 0,9 K4 23 0 0 0.9
K5 20 0 0,0022 0,63 K5 20 0 0.0022 0.63
K6 18 0 0 0,4 K6 18 0 0 0.4
K7 26 0 0 1,5 K7 26 0 0 1.5
K8 20 0 0 2,7 K8 20 0 0 2,7
K9 31 0,029 0 1,26 K9 31 0.029 0 1.26
K10 45 0 0 1,6 K10 45 0 0 1.6
KU 48 0 0 0,7 KU 48 0 0 0.7
K12 34 0 0 0,8 K12 34 0 0 0.8
K13 16 0 0 0,8 K13 16 0 0 0.8
K14 23 0 0 1,6 K14 23 0 0 1.6
K15 20 0 0 0,9 K15 20 0 0 0.9
K16 43 0,05 0 1,1 K16 43 0.05 0 1.1
K17 41 0 0,017 0 K17 41 0 0.017 0
K18 22 0 0 1 K18 22 0 0 1
K19 71 0 0,014 3 K19 71 0 0.014 3
K20 36 0 0,055 0,4 K20 36 0 0.055 0.4
K21 25 0 0 1,3 K21 25 0 0 1,3
K22 34 0 0,067 0,6 K22 34 0 0.067 0.6
K23 46 0,03 0 1,4 K23 46 0.03 0 1.4
K24 19 0 0 0,9 K24 19 0 0 0.9
K25 49 0 0 0 K25 49 0 0 0
CA15-3 CA15-3
PI 57 28,5 0,19 0 3,4 bifokales invasives Mamma-CA PI 57 28.5 0.19 0 3.4 bifocal invasive mammary CA.
P2 67 27,8 0,54 0 0,88 Invasives Mamma-CA links P2 67 27,8 0,54 0 0,88 Invasive breast CA left
P3 42 25,4 7,9 0 1 lymphogen, ossär, pulmonal und P3 42 25.4 7.9 0 1 lymphoid, osseous, pulmonary and
hepatisch metastasierendes Mamma- CA rechts hepatic metastatic mamma CA right
P4 71 99,7 0,65 0 5,7 Mamma-CA bei bekannter BRCA1- Mutation
P5 75 59,0 27,6 0 1,4 sekundär ossär, lymphogen, pleural und pulmonal metastasiertes Mamma- CA P4 71 99.7 0.65 0 5.7 Mammary CA with known BRCA1 mutation P5 75 59.0 27.6 0 1.4 secondary osseous, lymphoid, pleural and pulmonary metastatic mamma-CA
P6 76 73,0 1,9 0 7,6 sekundär cutan, ossär und in den P6 76 73,0 1,9 0 7,6 secondary cutane, osseous and in the
Magen metastasiertes invasiv-lobuläres Mamma-CA Gastric metastatic invasive-lobular mammary CA.
P7 47 504,3 37,7 0,15 10,0 sekundär ossär metastasiertes P7 47 504.3 37.7 0.15 10.0 secondary osseous metastatic
Mamma-CA mit Tumorprogression Breast CA with tumor progression
P8a 63 941,3 0,9 0 18,0 primär ossär und hepatisch P8a 63 941,3 0,9 0 18,0 primary osseous and hepatic
metastasiertes Mamma-CA metastatic mamma CA.
P9 58 120,5 0,04 0 6,2 ossär, lymphogen, pleural und P9 58 120.5 0.04 0 6.2 osseous, lymphoid, pleural and
pulmonal metastasiertes Mamma-CA pulmonary metastatic mamma CA.
P10 87 1098 3,6 0,12 1,5 sekundär ossär metastasiertes P10 87 1098 3.6 0.12 1.5 secondary osseous metastatic
Mamma-CA mit Tumorprogression Breast CA with tumor progression
Pll 73 106,8 0 0,011 6,7 sekundär ossär, lymphogen, pleural und pulmonal metastasiertes Mamma- CA Pll 73 106.8 0 0.011 6.7 secondary osseous, lymphoid, pleural and pulmonary metastatic mamma-CA
P12 64 130,7 11,6 0 0,69 sekundär ossär und hepatisch P12 64 130.7 11.6 0 0.69 secondary osseous and hepatic
metastasiertes Mamma-CA metastatic mamma CA.
P13 60 157,5 5,3 0 3,4 sekundär pulmonal, pleural und ossär metastasiertes Mamma-CA P13 60 157.5 5.3 0 3.4 secondary pulmonary, pleural and osseous metastatic mammary CA.
P14 76 145,2 8,8 0 0,32 sekundär lymphogen, pleural und in die P14 76 145.2 8,8 0 0,32 secondary lymphoid, pleural and in the
Nebeniere metastasiertes Mamma-CA Adrenal Metastatic Mammary-CA
P15 30 178,5 18,4 0,005 50,1 sekundär ossär, lymphogen, pleural, hepatisch und meningeal P15 30 178.5 18.4 0.005 50.1 secondary osseous, lymphoid, pleural, hepatic and meningeal
metastasiertes Mamma-CA metastatic mamma CA.
P16 56 650 1,39 0 2,3 sekundär pleural und hepatisch P16 56 650 1,39 0 2,3 secondary pleural and hepatic
metastasiertes Mamma-CA metastatic mamma CA.
CA125 CA125
P17 70 57,2 1,12 0 1,02 seröses high-grade Ovarial-CA P17 70 57.2 1.12 0 1.02 serous high-grade ovarian CA.
P18 76 1871 2,7 0 1,1 lymphogen und hepatisch P18 76 1871 2,7 0 1,1 lymphogenous and hepatic
metastasiertes Ovarialkarzinom metastatic ovarian carcinoma
P19 57 23,8 0 6,1 9,0 maligne mesodermale Mischtumor im P19 57 23,8 0 6,1 9,0 malignant mesodermal mixed tumor im
Bereich des Ovars Area of the ovary
P20 51 188,6 0 0 6,0 spätrezidivierendes Ovarialkarzinom mit hepatischer und lymphogener Metastasierung P20 51 188,6 0 0 6,0 late recurrent ovarian carcinoma with hepatic and lymphogenic metastases
P21 54 903,2 0 1,3 7,0 lymphogen und peritoneal P21 54 903.2 0 1.3 7.0 lymphogenous and peritoneal
metastasiertes Ovarialkarzinom metastatic ovarian carcinoma
P22 73 56,2 0,12 0,005 2,5 frührezidivierendes Ovarialkarzinom mit Lebermetastasen P22 73 56.2 0.12 0.005 2.5 Pre-recurrent ovarian carcinoma with liver metastases
P23 49 196,7 1,1 5,8 0 spätrezidivierendes Ovarialkarzinom P23 49 196.7 1.1 5.8 0 late recurrent ovarian carcinoma
CA15-3 CA15-3
P8b 63 133 0 0 2 Serumprobe der Patientin P8a nach 8- wöchiger Chemotherapie P8b 63 133 0 0 2 Serum sample of patient P8a after 8 weeks of chemotherapy
P24 32 9,8 0,54 0 1,1 pathogene B CAl-Mutation, P24 32 9.8 0.54 0 1.1 pathogenic B CAl mutation,
prophylaktische Mastektomie
Literaturverzeichnis prophylactic mastectomy bibliography
[I ] Mikeska T, Candiloro IL, Dobrovic A. Epigenomics. 2010; 2:561 -73. [I] Mikeska T, Candiloro II, Dobrovic A. Epigenomics. 2010; 2: 561-73.
[2] Kristensen LS and Hansen LL. Clin Chem. 2009; 8: 1471-83. [2] Kristensen LS and Hansen LL. Clin Chem. 2009; 8: 1471-83.
[3] Shen L and Waterland RA. Curr Opin Clin Nutr Metab Care 2007; 5: 576-81 . [3] Shen L and Waterland RA. Curr Opin Clin Nutr Metab Care 2007; 5: 576-81.
[4] Hernändez HG, Tse MY, Pang SC, et al. BioTechniques. 2013; 4: 181-97. [Hernandez HG, Tse MY, Pang SC, et al. BioTechniques. 2013; 4: 181-97.
[5] Herman JG, Graff JR, Myöhänen S, et al. Proc Nat Acad Sci USA. 1996; 18: 9821-26. [5] Herman JG, Graff JR, Myöhänen S, et al. Proc Nat Acad Sci USA. 1996; 18: 9821-26.
[6] Kristensen LS, Wojdacz TK, Thestrup BB, et al. BMC Cancer 2009; 9: 453. [6] Kristensen LS, Wojdacz TK, Thestrup BB, et al. BMC Cancer 2009; 9: 453.
[7] Candiloro IL, Mikeska T, Hokland P, et al. Epigenetics Chromatin. 2008; 1 : 7. [7] Candiloro II, Mikeska T, Hokland P, et al. Epigenetic Chromatin. 2008; 1: 7.
[8] Kraytsberg Y and Khrapko K. Expert Review of Molecular Diagnostics. 2005; 5: 809-15. [8] Kraytsberg Y and Khrapko K. Expert Review of Molecular Diagnostics. 2005; 5: 809-15.
[9] Applications Guide dPCR, Biorad. http://www.bio- rad.com/webroot/web/pdf/lsr/literature/Bulletin_6407.pdf [9] Applications Guide dPCR, Biorad. http: //www.bio- rad.com/webroot/web/pdf/lsr/literature/Bulletin_6407.pdf
[10] Grützmann R, Molnar B, Pilarsky C, et al. PLoS one. 2008; 3:e3759. [10] Grützmann R, Molnar B, Pilarsky C, et al. PLoS one. 2008; 3: e3759.
[I I ] How Kit A, Nielsen HM, Tost J. Biochimie. 2012 Nov;94(1 1 ):2314-37. [I] How Kit A, Nielsen HM, Tost J. Biochemistry. 2012 Nov; 94 (11): 2314-37.
[12] Stewart GD, Van Neste L, Delvenne P, et al. J Urol. 2013; 189: 1 10-1 1 16. [12] Stewart GD, Van Neste L, Delvenne P, et al. J Urol. 2013; 189: 1 10-1 1 16.
[13] Tombai B. EurUrol. 2012;62:997-8. [13] Tombai B. EurUrol. 2012; 62: 997-8.
[14] Tombai B. Eur Urology Suppl. 2006; 5:51 1 -513. [14] Tombai B. Eur Urology Suppl. 2006; 5:51 1 -513.
[15] Castellanos-Rizaldos E, Milbury CA, Karatza E, et al., PLoS One. 2014; 9(4):e94103. [15] Castellanos-Rizaldos E, Milbury CA, Karatza E, et al., PLoS One. 2014; 9 (4): e94103.
[16] Warnecke PM, Stirzaker C, Melki JR, Miliar DS, Paul CL, Clark SJ. Nucleic Acids Res. 1997 Nov 1 ;25(21 ):4422-6. [16] Warnecke PM, Stirzaker C, Melki JR, Miliar DS, Paul CL, Clark SJ. Nucleic Acids Res. 1997 Nov 1; 25 (21): 4422-6.
[17] Wojdacz TK, Dobrovic A, Hansen LL. Nat Protoc. 2008;3(12):1903-8. doi: 10.1038/nprot.2008.191 . [17] Wojdacz TK, Dobrovic A, Hansen LL. Nat protoc. 2008; 3 (12): 1903-8. doi: 10.1038 / nprot.2008.191.
[18] Wojdacz TK, Hansen LL, Dobrovic A. BMC Res Notes. 2008 Jul 28;1 :54. doi: 10.1 186/1756-0500-1 -54. [18] Wojdacz TK, Hansen LL, Dobrovic A. BMC Res Notes. 2008 Jul 28; 1: 54. doi: 10.1 186 / 1756-0500-1 -54.
[19] Wojdacz TK, Hansen LL: BioTechnique. 2006; 41 : 274-8. [19] Wojdacz TK, Hansen LL: BioTechnique. 2006; 41: 274-8.
[20] Hubbard RA. Annais of Internal Medicine. 201 1 ; 155: 481 -92.
[20] Hubbard RA. Annais of Internal Medicine. 201 1; 155: 481-92.