WO2017018796A1 - 바이러스 기반 변색 센서에 의한 농작물의 원산지 판별 방법 및 바이러스 기반 변색 센서를 포함하는 농작물의 원산지 판별 장치 - Google Patents
바이러스 기반 변색 센서에 의한 농작물의 원산지 판별 방법 및 바이러스 기반 변색 센서를 포함하는 농작물의 원산지 판별 장치 Download PDFInfo
- Publication number
- WO2017018796A1 WO2017018796A1 PCT/KR2016/008196 KR2016008196W WO2017018796A1 WO 2017018796 A1 WO2017018796 A1 WO 2017018796A1 KR 2016008196 W KR2016008196 W KR 2016008196W WO 2017018796 A1 WO2017018796 A1 WO 2017018796A1
- Authority
- WO
- WIPO (PCT)
- Prior art keywords
- color
- space element
- sample
- origin
- sensor
- Prior art date
- Legal status (The legal status is an assumption and is not a legal conclusion. Google has not performed a legal analysis and makes no representation as to the accuracy of the status listed.)
- Ceased
Links
Images


Classifications
-
- G—PHYSICS
- G01—MEASURING; TESTING
- G01N—INVESTIGATING OR ANALYSING MATERIALS BY DETERMINING THEIR CHEMICAL OR PHYSICAL PROPERTIES
- G01N21/00—Investigating or analysing materials by the use of optical means, i.e. using sub-millimetre waves, infrared, visible or ultraviolet light
- G01N21/75—Systems in which material is subjected to a chemical reaction, the progress or the result of the reaction being investigated
- G01N21/77—Systems in which material is subjected to a chemical reaction, the progress or the result of the reaction being investigated by observing the effect on a chemical indicator
- G01N21/78—Systems in which material is subjected to a chemical reaction, the progress or the result of the reaction being investigated by observing the effect on a chemical indicator producing a change of colour
-
- G—PHYSICS
- G01—MEASURING; TESTING
- G01N—INVESTIGATING OR ANALYSING MATERIALS BY DETERMINING THEIR CHEMICAL OR PHYSICAL PROPERTIES
- G01N33/00—Investigating or analysing materials by specific methods not covered by groups G01N1/00 - G01N31/00
- G01N33/02—Food
-
- G—PHYSICS
- G01—MEASURING; TESTING
- G01N—INVESTIGATING OR ANALYSING MATERIALS BY DETERMINING THEIR CHEMICAL OR PHYSICAL PROPERTIES
- G01N33/00—Investigating or analysing materials by specific methods not covered by groups G01N1/00 - G01N31/00
- G01N33/48—Biological material, e.g. blood, urine; Haemocytometers
- G01N33/50—Chemical analysis of biological material, e.g. blood, urine; Testing involving biospecific ligand binding methods; Immunological testing
- G01N33/53—Immunoassay; Biospecific binding assay; Materials therefor
Definitions
- the present invention relates to a method for determining the origin of a crop by a virus-based discoloration sensor and a device for determining the origin of a crop including a virus-based discoloration sensor. More specifically, the present invention relates to a virus-based method for determining the origin of a crop using color change. The present invention relates to a method for determining the origin of crops by a color fading sensor and a device for determining the origin of a crop including a virus-based color fading sensor.
- the general procedure for identifying the origin is to collect the sample for analysis and then go through the pretreatment process such as drying, cutting, grinding, and acid treatment to meet the analysis conditions for each analysis equipment, and then analyzing the sample using the analysis equipment. Is performed.
- a near infrared spectrometer, an X-ray fluorescence analyzer, a mass spectrometer, an element analyzer, an electronic nose, an image magnifier, etc. are used, each of which is used alone or two or more analysis equipments are used. After the analysis, the result is synthesized and the origin is determined.
- An object of the present invention is to provide a method for determining the origin of a crop by a virus-based discoloration sensor, which can be analyzed in a short time and to determine the origin of the crop in real time.
- Another object of the present invention is to provide a device for determining the origin of a crop by a virus-based discoloration sensor as a real-time field analyzer that can be analyzed in a short time in a short time by a high portability and simple method.
- a method for determining the origin of a crop by a virus-based discoloration sensor for one purpose of the present invention is that a nanofiber bundle formed by M13 bacteriophages is exposed to a component included in a sample crop of each country of origin. Preparing a sample color change value between the changed change color and the intrinsic color of the color fading sensor, obtaining an analysis color change value between the change color and the intrinsic color of the analysis crop, and for the sample color change value And determining an origin of the analytical crop according to the similarity of the analytical color change value.
- the color change value in each of the sample color change value and the analysis color change value, includes a color space element value of color code data, and the color code data includes an RGB method, a CMYK method, a CMY method, and
- the color space element value is a value corresponding to the color space element of the color model, and the similarity may be a difference between the sample color space element value and the analysis color space element value.
- the sample color change value is a sample color space element value selected as having a high degree of origin classification according to multivariate analysis among sample color space element values
- the analysis color change value is a degree of origin classification May be an analysis color space element value corresponding to the same color space element as the sample color space element selected as large.
- the multivariate analysis may be by a principal component analysis (PCA) method.
- the color fading sensor includes at least two or more areas representing different colors, and the color change value in each of the sample color change value and the analysis color change value is a color change appearing for each area of the color change sensor. May contain values.
- each of the color change values appearing for each region of the color fading sensor includes a color space element value of color code data
- the color code data includes any one of RGB, CMYK, CMY, and HSV methods.
- the color space element value is determined according to a model, and the color space element value corresponds to a color space element of the color model, and the similarity may be a difference between a sample color space element value and an analysis color space element value.
- the sample color change value is a sample color space element value selected as having a high degree of origin classification according to multivariate analysis among sample color space element values for each region of the color fading sensor
- the analysis color change value is It may be an analysis color space element value corresponding to the same color space element as the sample color space element selected as having a high level of origin classification among analysis color space element values for each region of the color fading sensor.
- the M13 bacteriophage may be a protein containing an amino acid sequence WHWQ is expressed on its surface.
- the step of obtaining the analysis color change value is a step of heating the analytical crop to expose the discoloration sensor to the vapor emitted from the analytical crop, obtaining an image of the color change sensor changed by the analytical crop And deriving an analysis color change value between the change color of the change sensor and the intrinsic color of the color fading sensor using the image.
- the crop may be red pepper powder, onion, perilla or sesame seeds.
- An apparatus for determining the origin of crops by a virus-based discoloration sensor for another object of the present invention includes a sensing unit having a virus-based discoloration sensor arranged on a base substrate of nanofiber bundles formed by M13 bacteriophages, and connected to the sensing unit.
- the sample color change value between the changed color changed by exposure to a component included in and the intrinsic color of the color fading sensor is stored, and the sample color is obtained by obtaining the analysis color change value of the analysis crop in the same way as the sample color change value is obtained. Determining the origin of the analytical crop according to the similarity of the analytical color change value to the change value It comprises an end portion.
- the sample unit may include a heating unit for heating the analysis crop.
- the color change value in each of the sample color change value and the analysis color change value, includes a color space element value of color code data, and the color code data includes an RGB method, a CMYK method, a CMY method, and
- the color space component value is a value corresponding to the color space component of the color model, and the sample color change value is determined by multivariate analysis among sample color space component values. Accordingly, the sample color space element value selected as having a high degree of origin classification, and the analysis color change value is an analysis color space element value corresponding to the same color space element as the sample color space element selected as having a high degree of origin classification.
- the similarity may be a difference between a sample color space element value and an analysis color space element value.
- the color fading sensor includes at least two divided areas, each of the fiber bands disposed in the different thickness of the nanofiber bundle, the sample color change value and the analysis color change
- the color change values include color change values appearing for each area of the color fading sensor.
- Each of the color change values appearing for each area of the color fading sensor includes a color space element value of color code data.
- the color space element value is a value corresponding to a color space element of a color model, and the sample color change value is determined by a color model of any one of an RGB method, a CMYK method, a CMY method, and an HSV method.
- the sample color space element value selected as having a high degree of origin classification according to multivariate analysis is The color change value for analysis is an analysis color space element value corresponding to the same color space element as the sample color space element selected as having a high degree of origin classification among the analysis color space element values for each region of the color fading sensor.
- the similarity may be a difference between the sample color space element value and the analysis color space element value.
- the origin of the crop can be analyzed directly in the field in a short time by a high portability and simple method. . It is possible to improve the reliability of the analysis results of origin using the country of origin determination device of crops.
- 1 is a view for explaining the country of origin determination device of the crop according to the present invention.
- FIG. 2 is a diagram for describing a color fading sensor included in a sensor unit of FIG. 1.
- FIG. 3 is a conceptual diagram illustrating an M13 bacteriophage constituting the color fading sensor of FIG. 2.
- FIG. 4 is a conceptual diagram illustrating a sensor for deriving a sample color change value of each crop origin in the present invention.
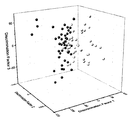
- 5 to 9 are graphs showing a sample color change graph according to the country of origin for each crop type.
- 1 is a view for explaining the country of origin determination device of the crop according to the present invention.
- the apparatus 700 for determining the origin of a crop includes a sample unit 100, a sensing unit 200, an image acquisition unit 300, and a determination unit 500.
- the sample unit 100 is an area in which the crop for analysis is disposed, and the sample unit 100 may be disposed in the chamber CH sealed together with the sensing unit 200.
- the component included in the analytical crop in the sample unit 100 is provided to the sensing unit 200, and the color of the color fading sensor 210 (see FIG. 2) of the sensing unit 200 is provided by the component included in the analytical crop. Can change.
- the component included in the analytical crop provided from the sample unit 100 to the sensing unit 200 may be “vapor”.
- the steam is generated from the analytical crop, and may be a volatile component that the analytical crop itself has, or a vapor obtained from the analytical crop through an operation of gasifying the analytical crop.
- vapor is defined in terms including both of the above.
- the sample unit 100 may include a heating unit 110 for gasifying the components contained in the analytical crop or to promote the release of volatile components.
- the heating unit 110 may be a hot plate for heating the analytical crop.
- the sensing unit 200 includes a color fading sensor 210.
- the color fading sensor 210 of the sensing unit 200 will be described in detail with reference to FIGS. 2 and 3.
- FIG. 2 is a view for explaining a color fading sensor included in the sensor unit of FIG. 1
- FIG. 3 is a conceptual view for explaining an M13 bacteriophage constituting the color fading sensor of FIG. 2.
- the discoloration sensor 210 is a virus-based discoloration sensor in which nanofiber bundles formed by M13 bacteriophages (VNP) are arranged on a base substrate.
- VNP M13 bacteriophages
- the discoloration sensor 210 includes a M13 bacteriophage (VNP), wherein the M13 bacteriophage (VNP) is arranged in a smetic (smetic) to form a plurality of nanofiber bundles (nanofiber bundle), these nanofiber bundles It shows the nanofiber structure connected to each other in a spiral structure in the direction.
- VNP M13 bacteriophage
- M13 bacteriophage is a tubular bacteriophage having a diameter of about 6.6 nm and a length of about 880 nm, and is a protein particle expressed through a constant gene. Because of this, the size shape and distribution are constant, that is, almost all M13 bacteriophages (VNPs) have the same size and shape.
- M13 bacteriophage (VNP) comprises about 2700 pairs of proteins (protein VIII, hereinafter pVIII) per one and four to five pairs of proteins (pIII, pVI, pVII, pIX) at both ends, respectively.
- the M13 bacteriophage may be a bacteriophage in which a receptor (RCT) containing at least one of the components included in the analytical crop is expressed on the surface thereof.
- RCT receptor
- the receptor (RCT) of the M13 bacteriophage (VNP) is a modified version of the protein pVIII of the circular bacteriophage, and may include a protein comprising the amino acid sequence WHWQ.
- a specific base sequence is introduced into the circular bacteriophage to express the amino acid sequence as described above, thereby becoming a protein including the amino acid sequence, and may be an M13 bacteriophage (VNP) included in the discoloration sensor 210 of the present invention.
- a component of the analytical crop that binds to the receptor (RCT) containing the protein may be an aromatic compound.
- the nanofiber structure of the discoloration sensor 210 is represented by a structure in which nanofiber bundles of M13 bacteriophage (VNP) are connected to each other while being helically pulled in one direction.
- VNP M13 bacteriophage
- the color fading sensor 210 may be implemented in a form representing different colors for each region as shown in FIG. That is, by setting the thicknesses of the nanofiber bundles differently in at least two areas of the color fading sensor 210, the viewer can recognize different colors for each area of the color fading sensor 210.
- the thickness of the nanofiber bundle can be determined by adjusting the pulling speed, the concentration of the preparation solution, and the like in the process of manufacturing the discoloration sensor 210.
- the color fading sensor 210 When the color fading sensor 210 is exposed to the components included in the analytical crop in the sample unit 100, the arrangement of the nanofiber bundles formed by the M13 bacteriophage (VNP) constituting the color fading sensor 210 is changed. The change of the arrangement changes the length of the wavelength reflecting the incident light, and the color of the color fading sensor 210 changes. However, although the color change of the color fading sensor 210 actually occurs, the naked eye cannot identify the difference.
- the discoloration sensor 210 having such characteristics is steam when it is exposed to steam containing volatile components or components vaporizing the crops of the crop itself, such as red pepper powder, garlic, onion, sesame seeds, and perilla. It was confirmed that the components contained in the color change of the discoloration sensor 210 by binding to the receptor (RCT) of the M13 bacteriophage (VNP), this color change is different depending on the country of origin, for example, Korea and China Found what appeared.
- RCT receptor
- VNP M13 bacteriophage
- the receptor (RCT) contained in the M13 bacteriophage (VNP) of the present invention is characterized by reacting with at least some of the components contained in each of the red pepper powder, garlic, onion, sesame and perilla even without special manipulation for each crop 1
- RCT receptor
- VNP M13 bacteriophage
- the image acquisition unit 300 obtains an image of the color change sensor 210 whose color is changed in the sensing unit 200.
- the image acquisition unit 300 may include a digital camera.
- the image photographed by the image acquisition unit 300 is transmitted to the determination unit 500 connected to the image acquisition unit 300.
- the determination unit 500 is connected to the image acquisition unit 300, and determines the origin of the crop for analysis using the image received from the image acquisition unit 300.
- the determination unit 500 stores a sample color change value for the sample crop according to the crop origin as a population, and obtains the analysis color change value of the analysis crop based on the image to obtain the sample color change value.
- the origin of the analytical crop is determined according to the similarity of the analytical color change value with respect to.
- the sample color change value of the sample crop according to the crop origin already stored in the determination unit 500 is a change in which the inventors of the present application change the color change of the color change sensor 210 from the intrinsic color to the crop origin for the same kind of crop. Based on the finding that the color changes, the color change is quantified and converted.
- the sample color change value for the sample crop according to the crop origin already stored in the determination unit 500 may include a color space element value of color code data.
- the color code data is determined according to a color model of any one of an RGB method, a CMYK method, a CMY method, and an HSV method.
- the color space element value may be a value corresponding to the color space element of the color model. .
- the RGB method, the CMY method and the HSY method are three color space elements, and the CMYK method is four color space elements.
- the color code may be represented as "E 1 , E 2 , E 3 ", where each of E 1 , E 2, and E 3 is a color space.
- the values corresponding to the elements R, G, and B are represented, and each of E 1 , E 2, and E 3 may be one or more natural numbers.
- the maximum value may be determined as the color model is represented by 8 bits, 16 bits, and the like. .
- the sample color change value of the sample crop according to the crop origin already stored in the determination unit 500 may be a sample color space element value selected as having a high degree of origin classification according to multivariate analysis among sample color space element values.
- the multivariate analysis may be by a principal component analysis (PCA) method.
- the color change of the color fading sensor 210 which is different for each country of origin of the crop, can be derived mathematically by considering the correlation between these color changes without considering the color change of each individual.
- the origin of crops having an unknown origin can be discriminated based on the established relationship.
- FIG. 4 is a conceptual diagram illustrating a sensor for deriving a sample color change value of each crop origin in the present invention.
- the color fading sensor 210 to obtain a sample color change value for the sample crop according to the crop origin is not a single band, each of two or more bands of different thickness of each other nanofiber bundle
- the image corresponding to the number of regions of the sensor may be obtained for one sensor, and color code data may be generated for each of the images.
- n areas where n is a natural number of 2 or more
- m appears clearly in each of the n areas.
- the color code data for the sub-areas may be selected, and in this case, m ⁇ n color code data may be generated for one analysis crop.
- These color code data may each independently use m ⁇ n pieces, and may use average data of color changes appearing in m sub-areas in each area.
- each of the color change values appearing for each area of the color fading sensor 210 may include a color space element value of color code data, and the color space element value may be a value corresponding to the color space element of the color model.
- the sample color change value may be a sample color space element value selected as having a high degree of origin classification according to multivariate analysis among sample color space element values for each region of the color fading sensor.
- the color change of 20 kinds from Korea and 19 kinds from China for red pepper powder is shown in Table 1 and Table 2 below.
- Table 1 is for 20 kinds of Korean red pepper powder
- Table 2 is for 20 kinds of Chinese red pepper powder.
- ⁇ RGB for the samples of domestic red pepper powder calculated as shown in Table 1 and the Chinese red pepper powder calculated as shown in Table 2 may be (R, G, B) which is color code data of an RGB color model.
- the color code data is an independent value for each color space element of the color model, and values corresponding to the color space element of the color model are respectively used as color space element values. That is, one color code data is converted into independent data for each color space element of the color code data, and the converted independent data is a variable between the color space elements of the color code data and the intrinsic color of the color fading sensor. .
- a sample color space element value selected as having a high degree of origin classification according to multivariate analysis is used as a sample color change value for a population.
- multivariate analysis uses Principal component analysis (PCA).
- each sample crop included in the population through Principal Component Analysis at least one affecting the color change according to the crop origin through the variables between the color space components of the color code data and the intrinsic color of the sensor Principal components can be derived.
- variables corresponding to the main component may be converted into coordinate data, and the coordinate data may be set as a sample color change value according to the crop origin. That is, two-dimensional coordinate data using one of the derived principal components as x coordinates and the other as y coordinates, or three-dimensional coordinate data using x, y and z coordinates as the sample color change values according to the crop origin. Can be.
- the sample color change value is a sample color space element selected as having a high degree of origin classification according to multivariate analysis among sample color space element values for each area of the color fading sensor 210.
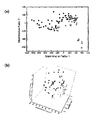
- 5 to 9 are graphs showing a sample color change graph according to the country of origin for each crop type.
- FIG. 5 (a) is a graph obtained by calculating two principal components as two-dimensional coordinate data for pepper powder, and (b) is a graph obtained by calculating three principal components as three-dimensional coordinate data for pepper powder.
- black dots are made in Korea, and white dots are made in China.
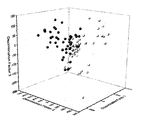
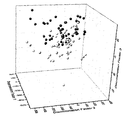
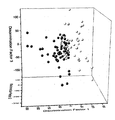
- FIG. 6 relates to garlic, FIG. 7 to onions, FIG. 8 to sesame seeds, and FIG. 9 to sesame seeds.
- the 3D coordinate data of FIG. 6 is derived by PCA analysis using the data of Tables 3 and 4 below.
- Table 3 is for 30 kinds of domestic garlic and Table 4 is for 29 kinds of Chinese garlic.
- the 3D coordinate data of FIG. 7 is derived by PCA analysis using the data of Tables 5 and 6 below.
- Table 5 is for 23 domestic onions and Table 4 is for 22 Chinese onions.
- the 3D coordinate data of FIG. 8 is derived by PCA analysis using the data of Tables 7 and 8 below.
- Table 7 is for 30 domestic sesame seeds and Table 8 is for 30 Chinese sesame seeds.
- 3D coordinate data of FIG. 9 are derived by PCA analysis using the data of Tables 9 and 10.
- Table 9 is for 30 Korean perilla and Table 10 is for 30 Chinese perilla.
- the determination unit 500 includes all of the information on the plurality of crops, and can be analyzed and determined by loading the corresponding information according to the type of crop placed in the sample unit 100, 1
- the dog discrimination apparatus 700 can be used to determine the origin of various kinds of crops.
- the determination unit 500 includes only information on one type of crop, so the origin determination device 700 of the crop may be limited to an analysis device for a specific crop.
- the color change value of the sample described above is stored in the determination unit 500, and the discoloration sensor of the sensing unit 200 is generated by steam generated from the analytical crop disposed in the sample unit 100.
- the image acquirer 300 photographs an image, and the obtained image is transmitted to the determiner 500.
- the analysis color change value between the change color of the image based on the intrinsic color of the color fading sensor 210 by the image transmitted to the determination unit 500 Can be obtained.
- the analysis color change value between the change color of the color change sensor 210 and the change color of the color change sensor 210 exposed to the components included in the analysis crop is substantially the same as the sample color change value stored in the determination unit 500. Can be determined.
- An analysis color change value by an analysis crop includes a color space element value of color code data, and the color code data is determined according to a color model, and the color space element value corresponds to a color space element of a color model. Value, the analytical color change value is determined based on the same color model as the color model used to determine the sample color change value.
- the analysis color change value is an analysis color space element value corresponding to the same color space element as the sample color space element selected as having a high degree of origin classification. That is, when the sample color change value is multivariate analysis, for example, principal component analysis, when a specific sample color space element has a large degree of origin classification, the specific sample color space element becomes the main component for the origin classification.
- values corresponding to the main component are selected to be an analysis color change value according to the present invention.
- the origin of the analytical crop is determined by comparing the analytical color change value for the designated analytical crop with the sample color change value. The determination of origin is based on how similar the analysis color change value is to the sample color change value, and the analysis color change value is similar to the sample color change value indicating the specific origin by using the fact that the sample color change value is divided by the origin. It can then be determined that the analytical crop corresponds to its origin.
- the analytical color change value if the sample color change value includes a sample color space element value, the analytical color change value also includes an analysis color space element value, such that the similarity between the sample color space element value and the analysis color space element value The country of origin of the crop for analysis can be determined by comparing.
- the sample color change value includes a sample color space element value, wherein the selected three-dimensional coordinate data based on three principal components derived as principal components using principal component analysis for the sample color space component values (FIG. 5 to 9), an analysis color change value is determined using an analysis color space element value corresponding to three principal components derived for the sample color space element value, and the analysis color change value at this time is also determined. It may be three-dimensional coordinate data. At this time, by comparing the three-dimensional coordinate data derived from the analysis color change value with the three-dimensional coordinate data corresponding to the sample color change value, it is judged whether it is close to the Korean crop group or the Chinese crop group. It can be determined that the origin corresponds to a group close to the data.
- the color model is described using the RGB method as an example.
- the origin of the crop may be determined using the same color model as the same result.
- the apparatus for determining the origin of such crops is compact and has good portability, and has the advantage of determining the origin of the analytical crop in real time based on data stored in the determination unit 500 in the field.
Landscapes
- Health & Medical Sciences (AREA)
- Life Sciences & Earth Sciences (AREA)
- Engineering & Computer Science (AREA)
- Chemical & Material Sciences (AREA)
- Immunology (AREA)
- Physics & Mathematics (AREA)
- Pathology (AREA)
- Food Science & Technology (AREA)
- Biochemistry (AREA)
- General Health & Medical Sciences (AREA)
- General Physics & Mathematics (AREA)
- Analytical Chemistry (AREA)
- Urology & Nephrology (AREA)
- Biomedical Technology (AREA)
- Hematology (AREA)
- Molecular Biology (AREA)
- Medicinal Chemistry (AREA)
- Biotechnology (AREA)
- Cell Biology (AREA)
- Microbiology (AREA)
- Chemical Kinetics & Catalysis (AREA)
- Plasma & Fusion (AREA)
- Apparatus Associated With Microorganisms And Enzymes (AREA)
- Measuring Or Testing Involving Enzymes Or Micro-Organisms (AREA)
Abstract
바이러스 기반 변색 센서에 의한 농작물의 원산지 판별 방법 및 바이러스 기반 변색 센서에 의한 농작물의 원산지 판별 장치에서, 바이러스 기반 변색 센서에 의한 농작물의 원산지 판별 방법은 M13 박테리오파지들이 형성하는 나노섬유다발이 베이스 기재 상에 배열된 바이러스 기반 변색 센서가 원산지별 샘플 농작물에 포함된 성분에 노출되어 변화된 변화색과 상기 변색 센서의 고유색 간의 샘플 색변화 값을 준비하는 단계, 분석용 농작물의 상기 변색 센서에 대한 변화색과 고유색 간의 분석용 색변화 값을 얻는 단계 및 상기 샘플 색변화 값에 대한 상기 분석용 색변화 값의 유사도에 따라 상기 분석용 농작물의 원산지를 판별하는 단계를 포함한다.
Description
본 발명은 바이러스 기반 변색 센서에 의한 농작물의 원산지 판별 방법 및 바이러스 기반 변색 센서를 포함하는 농작물의 원산지 판별 장치에 관한 것으로, 보다 구체적으로는 컬러 변화를 이용하여 농작물의 원산지를 판별할 수 있는 바이러스 기반 변색 센서에 의한 농작물의 원산지 판별 방법 및 바이러스 기반 변색 센서를 포함하는 농작물의 원산지 판별 장치에 관한 것이다.
세계 각국의 FTA 체결로 인해 농작물 수입 개방이 활발해져, 한국산 농작물보다 저가의 수입 농작물, 특히 중국산 농작물들이 공급되고 있어 국내의 농업 여건은 점차 악화되고 있는 실정이다. 한국산 농작물과 수입 농작물의 가격 차이를 이용하여 상업적 이윤을 얻기 위해서 원산지를 허위로 표시하거나 표기하지 않은 경우가 증가하고 있어 농작물 원산지에 대한 소비자들의 불신도 커져가고 있다.
원산지의 식별을 위한 일반적인 과정은, 분석을 위한 시료를 수집한 후에 분석 장비별 분석 조건에 적합하도록 시료를 건조, 절단, 분쇄, 산처리 등의 전처리 공정을 거친 후에 분석 장비를 이용하여 시료를 분석함으로써 수행된다. 원산지의 식별을 위한 분석 장치로서는 근적외선 분광분석기, X선 형광분석기, 질량분석기, 원소 분석기, 전자 코(electronic nose), 영상 확대경 등을 이용하고 있고, 이들 각각을 단독으로 이용하거나 2 이상의 분석 장비를 이용하여 분석한 후 그 결과를 종합하여 원산지를 판정한다.
그러나 상기와 같은 원산지의 식별 방법에 의한 결과에 대한 신뢰성이 높지 않고, 현장에서 직접 분석할 수 없으며 분석 시간이 오래 걸리는 단점이 있다. 따라서 원산지 판별을 위해 휴대성이 높고 간단한 방법으로 단시간에 분석 가능하며 현장에서 직접 분석할 수 있는 실시간 현장 분석기가 절실히 필요한 실정이다.
본 발명의 일 목적은 단시간에 분석 가능하며 실시간으로 농작물의 원산지를 판별하기 위한, 바이러스 기반 변색 센서에 의한 농작물의 원산 판별 방법을 제공하는 것이다.
본 발명의 다른 목적은 휴대성이 높고 간단한 방법으로 단시간에 분석 가능하며 현장에서 직접 분석할 수 있는 실시간 현장 분석기로서, 바이러스 기반 변색 센서에 의한 농작물의 원산지 판별 장치를 제공하는 것이다.
본 발명의 일 목적을 위한 바이러스 기반 변색 센서에 의한 농작물의 원산지 판별 방법은 M13 박테리오파지들이 형성하는 나노섬유다발이 베이스 기재 상에 배열된 바이러스 기반 변색 센서가 원산지별 샘플 농작물에 포함된 성분에 노출되어 변화된 변화색과 상기 변색 센서의 고유색 간의 샘플 색변화 값을 준비하는 단계, 분석용 농작물의 상기 변색 센서에 대한 변화색과 고유색 간의 분석용 색변화 값을 얻는 단계, 및 상기 샘플 색변화 값에 대한 상기 분석용 색변화 값의 유사도에 따라 상기 분석용 농작물의 원산지를 판별하는 단계를 포함한다.
일 실시예에서, 상기 샘플 색변화 값과 상기 분석용 색변화 값 각각에서, 색변화 값은 색상코드 데이터의 색공간 요소 값을 포함하고, 상기 색상코드 데이터는 RGB 방식, CMYK 방식, CMY 방식 및 HSV 방식 중 어느 하나의 컬러 모델에 따라 결정되고, 상기 색공간 요소 값은 컬러 모델의 색공간 요소에 대응하는 값이며, 상기 유사도는 샘플 색공간 요소 값과 분석용 색공간 요소 값 간의 차이일 수 있다.
일 실시예에서, 상기 샘플 색변화 값은 샘플 색공간 요소 값들 중에서 다변량 분석(multivariate analysis)에 따라 원산지 구분 정도가 큰 것으로 선정된 샘플 색공간 요소 값이고, 상기 분석용 색변화 값은 원산지 구분 정도가 큰 것으로 선정된 샘플 색공간 요소와 동일한 색공간 요소에 해당하는 분석용 색공간 요소 값일 수 있다. 이때, 상기 다변량 분석은 주성분 분석(Principal component analysis, PCA) 방법에 의한 것일 수 있다.
일 실시예에서, 상기 변색 센서는 서로 다른 컬러를 나타내는 적어도 2개 이상의 영역들을 포함하고, 상기 샘플 색변화 값과 상기 분석용 색변화 값 각각에서 색변화 값은 상기 변색 센서의 영역별로 나타나는 색변화 값들을 포함할 수 있다.
일 실시예에서, 상기 변색 센서의 영역별로 나타나는 색변화 값들 각각은 색상코드 데이터의 색공간 요소 값을 포함하고, 상기 색상코드 데이터는 RGB 방식, CMYK 방식, CMY 방식 및 HSV 방식 중 어느 하나의 컬러 모델에 따라 결정되고, 상기 색공간 요소 값은 컬러 모델의 색공간 요소에 대응하는 값이며, 상기 유사도는 샘플 색공간 요소 값과 분석용 색공간 요소 값 간의 차이일 수 있다. 이때, 상기 샘플 색변화 값은 상기 변색 센서의 영역별 샘플 색공간 요소 값들 중에서 다변량 분석(multivariate analysis)에 따라 원산지 구분 정도가 큰 것으로 선정된 샘플 색공간 요소 값이고, 상기 분석용 색변화 값은 상기 변색 센서의 영역별 분석용 색공간 요소 값들 중에서 원산지 구분 정도가 큰 것으로 선정된 샘플 색공간 요소와 동일한 색공간 요소에 해당하는 분석용 색공간 요소 값일 수 있다.
일 실시예에서, 상기 M13 박테리오파지는 그 표면에 아미노산 서열 WHWQ를 포함하는 단백질이 발현된 것일 수 있다.
일 실시예에서, 상기 분석용 색변화 값을 얻는 단계는 분석용 농작물을 가열하여 분석용 농작물이 방출하는 증기에 변색 센서를 노출시키는 단계, 분석용 농작물에 의해 변화한 변색 센서의 이미지를 얻는 단계 및 상기 이미지를 이용하여 상기 변화 센서에 대한 변화색과 변색 센서의 고유색 간의 분석용 색변화 값을 도출하는 단계를 포함할 수 있다.
일 실시예에서, 농작물은 고춧가루, 양파, 들깨 또는 참깨일 수 있다.
본 발명의 다른 목적을 위한 바이러스 기반 변색 센서에 의한 농작물의 원산지 판별 장치는 M13 박테리오파지들이 형성하는 나노섬유다발이 베이스 기재 상에 배열된 바이러스 기반 변색 센서가 구비된 센싱부, 상기 센싱부와 연결되고, 분석용 농작물이 제공되는 시료부, 상기 센싱부와 연결되어 상기 분석용 농작물에 포함된 성분에 노출된 변색 센서에 대한 이미지를 얻는 이미지 획득부, 및 상기 변색 센서와 동일한 센서에 원산지별 샘플 농작물에 포함된 성분에 노출되어 변화된 변화색과 변색 센서의 고유색 간의 샘플 색변화 값이 저장되고, 상기 샘플 색변화 값을 얻는 방법과 동일하게 상기 분석용 농작물의 분석용 색변화 값을 얻어 상기 샘플 색변화 값에 대한 상기 분석용 색변화 값의 유사도에 따라 상기 분석용 농작물의 원산지를 판별하는 판단부를 포함한다.
일 실시예에서, 상기 시료부는 상기 분석용 농작물을 가열하기 위한 가열부를 포함할 수 있다.
일 실시예에서, 상기 샘플 색변화 값과 상기 분석용 색변화 값 각각에서, 색변화 값은 색상코드 데이터의 색공간 요소 값을 포함하고, 상기 색상코드 데이터는 RGB 방식, CMYK 방식, CMY 방식 및 HSV 방식 중 어느 하나의 컬러 모델에 따라 결정되고, 상기 색공간 요소 값은 컬러 모델의 색공간 요소에 대응하는 값이며, 상기 샘플 색변화 값은 샘플 색공간 요소 값들 중에서 다변량 분석(multivariate analysis)에 따라 원산지 구분 정도가 큰 것으로 선정된 샘플 색공간 요소 값이고, 상기 분석용 색변화 값은 원산지 구분 정도가 큰 것으로 선정된 샘플 색공간 요소와 동일한 색공간 요소에 해당하는 분석용 색공간 요소 값이고, 상기 유사도는 샘플 색공간 요소 값과 분석용 색공간 요소 값 간의 차이일 수 있다.
일 실시예에서, 상기 변색 센서는 적어도 2 이상으로 구분된 영역들을 포함하고, 상기 영역들 각각에 배치된 섬유밴드는 나노섬유다발의 굵기가 서로 다르고, 상기 샘플 색변화 값과 상기 분석용 색변화 값 각각에서 색변화 값은 상기 변색 센서의 영역별로 나타나는 색변화 값들을 포함하되, 상기 변색 센서의 영역별로 나타나는 색변화 값들 각각은 색상코드 데이터의 색공간 요소 값을 포함하고, 상기 색상코드 데이터는 RGB 방식, CMYK 방식, CMY 방식 및 HSV 방식 중 어느 하나의 컬러 모델에 따라 결정되고, 상기 색공간 요소 값은 컬러 모델의 색공간 요소에 대응하는 값이며, 상기 샘플 색변화 값은 상기 변색 센서의 영역별 샘플 색공간 요소 값들 중에서 다변량 분석(multivariate analysis)에 따라 원산지 구분 정도가 큰 것으로 선정된 샘플 색공간 요소 값이고, 상기 분석용 색변화 값은 상기 변색 센서의 영역별 분석용 색공간 요소 값들 중에서 원산지 구분 정도가 큰 것으로 선정된 샘플 색공간 요소와 동일한 색공간 요소에 해당하는 분석용 색공간 요소 값이며, 상기 유사도는 샘플 색공간 요소 값과 분석용 색공간 요소 값 간의 차이일 수 있다.
본 발명의 바이러스 기반 변색 센서에 의한 농작물의 원산지 판별 방법 및 바이러스 기반 변색 센서를 포함하는 농작물의 원산지 판별 장치에 따르면, 휴대성이 높고 간단한 방법으로 농작물의 원산지를 단시간에 현장에서 직접 분석할 수 있다. 농작물의 원산지 판별 장치를 이용한 원산지 분석 결과의 신뢰성을 향상시킬 수 있다.
도 1은 본 발명에 따른 농작물의 원산지 판별 장치를 설명하기 위한 도면이다.
도 2는 도 1의 센서부에 포함된 변색 센서를 설명하기 위한 도면이다.
도 3은 도 2의 변색 센서를 구성하는 M13 박테리오파지를 설명하기 위한 개념도이다.
도 4는 본 발명에서 농작물 원산지별 샘플 색변화 값을 도출하기 위한 센서를 설명하기 위한 개념도이다.
도 5 내지 도 9는 농작물 종류별 원산지에 따른 샘플 색변화 그래프를 도시한 도면들이다.
이하, 첨부한 도면을 참조하여 본 발명의 실시예에 대해 상세히 설명한다. 본 발명은 다양한 변경을 가할 수 있고 여러 가지 형태를 가질 수 있는 바, 특정 실시예들을 도면에 예시하고 본문에 상세하게 설명하고자 한다. 그러나 이는 본 발명을 특정한 개시 형태에 대해 한정하려는 것이 아니며, 본 발명의 사상 및 기술 범위에 포함되는 모든 변경, 균등물 내지 대체물을 포함하는 것으로 이해되어야 한다. 각 도면을 설명하면서 유사한 참조부호를 유사한 구성요소에 대해 사용하였다.
본 출원에서 사용한 용어는 단지 특정한 실시 예를 설명하기 위해 사용된 것으로서 본 발명을 한정하려는 의도가 아니다. 단수의 표현은 문맥상 명백하게 다르게 뜻하지 않는 한, 복수의 표현을 포함한다. 본 출원에서, "포함하다" 또는 "가지다" 등의 용어는 명세서 상에 기재된 특징, 단계, 동작, 구성요소, 부분품 또는 이들을 조합한 것이 존재함을 지정하려는 것이지, 하나 또는 그 이상의 다른 특징들이나 단계, 동작, 구성요소, 부분품 또는 이들을 조합한 것들의 존재 또는 부가 가능성을 미리 배제하지 않는 것으로 이해되어야 한다.
다르게 정의되지 않는 한, 기술적이거나 과학적인 용어를 포함해서 여기서 사용되는 모든 용어들은 본 발명이 속하는 기술 분야에서 통상의 지식을 가진 자에 의해 일반적으로 이해되는 것과 동일한 의미를 가지고 있다. 일반적으로 사용되는 사전에 정의되어 있는 것과 같은 용어들은 관련 기술의 문맥 상 가지는 의미와 일치하는 의미를 가지는 것으로 해석되어야 하며, 본 출원에서 명백하게 정의하지 않는 한, 이상적이거나 과도하게 형식적인 의미로 해석되지 않는다.
도 1은 본 발명에 따른 농작물의 원산지 판별 장치를 설명하기 위한 도면이다.
도 1을 참조하면, 농작물의 원산지 판별 장치(700)는 시료부(100), 센싱부(200), 이미지 획득부(300) 및 판단부(500)를 포함한다.
시료부(100)는 분석용 농작물이 배치되는 영역으로서, 시료부(100)는 센싱부(200)와 함께 밀봉된 챔버(CH) 내에 배치될 수 있다. 시료부(100)에서의 분석용 농작물에 포함된 성분이 센싱부(200)로 제공되고, 분석용 농작물에 포함된 성분에 의해서 센싱부(200)의 변색 센서(210, 도 2 참조)의 컬러가 변화할 수 있다.
시료부(100)에서 센싱부(200)로 제공되는 분석용 농작물에 포함되는 성분은 "증기"일 수 있다. 이때의 증기는 분석용 농작물로부터 생성된 것으로서, 분석용 농작물 그 자체가 갖고 있는 휘발성 성분이거나, 분석용 농작물에 대해 기체화하는 조작을 통해서 분석용 농작물로부터 얻은 증기일 수 있다. 이하에서, "증기"는 상기 2가지 모두를 포함하는 용어로 정의한다.
일 실시예에서, 시료부(100)는 분석용 농작물이 포함하고 있는 성분들을 기체화하거나 휘발성 성분의 방출을 촉진시키기 위한 가열부(110)를 포함할 수 있다. 가열부(110)는 분석용 농작물을 가열하는 핫-플레이트일 수 있다.
센싱부(200)는 변색 센서(210)를 포함한다. 센싱부(200)의 변색 센서(210)에 대해서는 도 2 및 도 3을 참조하여 구체적으로 설명하기로 한다.
도 2는 도 1의 센서부에 포함된 변색 센서를 설명하기 위한 도면이고, 도 3은 도 2의 변색 센서를 구성하는 M13 박테리오파지를 설명하기 위한 개념도이다.
도 2 및 도 3을 도 1과 함께 참조하면, 변색 센서(210)는 M13 박테리오파지들(VNP)이 형성하는 나노섬유다발이 베이스 기재 상에 배열된 바이러스 기반 변색 센서이다.
변색 센서(210)는 M13 박테리오파지(VNP)를 포함하고, 이때의 M13 박테리오파지(VNP)는 스메틱(smetic)으로 배열되어 다수의 나노섬유다발(nanofiber bundle)을 형성하고, 이러한 나노섬유다발들이 일 방향으로 나선형 구조로 서로 연결된 나노섬유구조를 나타낸다.
구체적으로, M13 박테리오파지(VNP)는 약 880 nm의 길이에 약 6.6 nm의 직경을 갖는 튜브형의 박테리오파지로서, 일정한 유전자를 통해 발현되는 단백질 입자이다. 이 때문에 크기 형태와 분포가 일정한, 즉 거의 모든 M13 박테리오파지(VNP)는 동일한 크기와 형태를 갖는다. M13 박테리오파지(VNP)는 1개당 약 2700 쌍의 단백질(protein VIII, 이하 pVIII)과 양 말단에 각각 4 내지 5 쌍의 단백질들(pIII, pVI, pVII, pIX)을 포함한다.
본 발명에서의 M13 박테리오파지(VNP)는 그 표면에 분석용 농작물에 포함된 성분 중에서 적어도 어느 하나를 수용하는 수용체(RCT)가 표면에 발현된 박테리오파지일 수 있다.
M13 박테리오파지(VNP)의 수용체(RCT)는 원형 박테리오파지의 단백질 pVIII가 변형된 것으로서, 아미노산 서열 WHWQ를 포함하는 단백질을 포함할 수 있다. 원형 박테리오파지에 특정 염기서열을 도입하여 상기와 같은 아미노산 서열이 발현되어, 상기 아미노산 서열을 포함하는 단백질이 되며, 본 발명의 변색 센서(210)에 포함되는 M13 박테리오파지(VNP)가 될 수 있다. 예를 들어, 상기 단백질을 포함하는 수용체(RCT)와 결합하는 분석용 농작물의 성분은 방향족 화합물일 수 있다.
상기와 같은 변색 센서(210)의 나노섬유구조는 M13 박테리오파지(VNP)의 나노섬유다발들이 일 방향으로 나선형으로 풀링(pulling)되면서 서로 연결된 구조에 의해서 나타나는 것이다.
일 실시예에서, 본 발명에 따른 변색 센서(210)는 도 2에 나타난 것과 같이 영역별로 서로 다른 컬러를 나타내는 형태로 구현될 수 있다. 즉, 변색 센서(210)의 적어도 2개의 영역들에서 상기 나노섬유다발의 굵기를 서로 다르게 설정함으로써 관찰자는 변색 센서(210)의 영역별로 다른 컬러를 시인할 수 있게 된다. 상기 나노섬유다발의 굵기는 변색 센서(210)를 제조하는 공정 중에서, 풀링 속도, 제조 용액의 농도 등을 조절함으로써 결정할 수 있다.
변색 센서(210)가 시료부(100)에서 분석용 농작물에 포함된 성분에 노출되는 경우, 변색 센서(210)를 구성하는 M13 박테리오파지(VNP)에 의해 형성된 나노섬유다발의 배열이 변화하게 된다. 이러한 배열의 변화는 입사되는 광을 반사하는 파장의 길이를 변화시키고, 변색 센서(210)의 컬러가 변화하게 된다. 다만, 이러한 변색 센서(210)의 컬러 변화는 실제로 일어나기는 하지만, 육안으로 확인하고 그 차이를 구분해낼 수 없다.
본 발명자들은 이러한 특성을 갖고 있는 변색 센서(210)가, 고춧가루, 마늘, 양파, 참깨, 들깨 등의 농작물 자체가 갖고 있는 휘발성 성분이나 농작물을 기체화한 성분을 포함하는 증기에 노출되는 경우에 증기에 포함된 성분들이 M13 박테리오파지(VNP)의 수용체(RCT)에 결합함으로써 변색 센서(210)의 컬러를 변화시키는 것을 확인하였으며, 이러한 컬러변화는 농작물별로 원산지, 예를 들어, 한국과 중국에 따라 다르게 나타나는 것을 발견하였다. 특히, 본 발명의 M13 박테리오파지(VNP)에 포함된 수용체(RCT)는 농작물별로 특별한 조작을 하지 않더라도 고춧가루, 마늘, 양파, 참께 및 들깨 각각에 포함된 성분들 중 적어도 일부와 반응하는 특성이 있으므로 1종의 변색 센서(210)만으로 다양한 농작물에 대한 원산지를 판별하는데 이용할 수 있는 장점이 있고, 1종의 변색 센서(210)만으로 원산지별로 다른 컬러 변화가 나타나는 것을 확인할 수 있는 장점이 있다. 본 발명자들은 이와 같은 결과에 기반하여 변색 센서(210)의 컬러 변화를 정량화하여 농작물의 원산지 판별 장치(700)를 발명하였다.
다시 도 1을 참조하면, 이미지 획득부(300)는 센싱부(200)에서 컬러가 변화한 변색 센서(210)에 대한 이미지를 얻는다. 이미지 획득부(300)는 디지털 카메라를 포함할 수 있다. 이미지 획득부(300)가 촬영한 이미지는, 이미지 획득부(300)와 연결된 판단부(500)로 전송된다.
판단부(500)는 이미지 획득부(300)와 연결되고, 이미지 획득부(300)로부터 전송받은 이미지를 이용하여 분석용 농작물의 원산지를 판단한다.
구체적으로, 판단부(500)에는 모집단으로서 농작물 원산지에 따른 샘플 농작물에 대한 샘플 색변화 값이 저장되어 있고, 상기 이미지를 기반으로 하여 분석용 농작물의 분석용 색변화 값을 얻어 상기 샘플 색변화 값에 대한 상기 분석용 색변화 값의 유사도에 따라 분석용 농작물의 원산지를 판별하게 된다.
판단부(500)에 이미 저장된 농작물 원산지에 따른 샘플 농작물에 대한 샘플 색변화 값은 본 출원의 발명자들이 동일한 종류의 농작물에 대해서 변색 센서(210)가 고유색에서부터 농작물 원산지에 따라 다른 컬러 변화를 나타내는 변화색으로 변화한다는 것을 발견한 것에 기초하여 컬러 변화를 정량화하여 변환한 데이터이다.
일 실시예에서, 판단부(500)에 이미 저장된 농작물 원산지에 따른 샘플 농작물에 대한 샘플 색변화 값은 색상코드(color code) 데이터의 색공간 요소 값을 포함할 수 있다. 상기 색상코드 데이터는 RGB 방식, CMYK 방식, CMY 방식 및 HSV 방식 중 어느 하나의 컬러 모델(color model)에 따라 결정되는 것으로서, 상기 색공간 요소 값은 컬러 모델의 색공간 요소에 대응하는 값일 수 있다.
RGB 방식이나, CMY 방식 및 HSY 방식은 색공간 요소가 3개인 경우이고, CMYK 방식은 색공간 요소가 4개인 경우이다. 일례로, 컬러 모델이 RGB와 같이 3개의 색공간 요소를 포함하는 경우의 색상코드는 "E1, E2, E3"으로 나타낼 수 있고, 이때 E1, E2 및 E3 각각이 색공간 요소인 R, G 및 B에 해당하는 값을 나타내며 이때 E1, E2 및 E3 각각은 1 이상의 자연수일 수 있는데 컬러 모델이 8비트, 16비트 등으로 표현됨에 따라 최대값이 정해질 수 있다.
이때, 판단부(500)에 이미 저장된 농작물 원산지에 따른 샘플 농작물에 대한 샘플 색변화 값은 샘플 색공간 요소 값들 중에서 다변량 분석(multivariate analysis)에 따라 원산지 구분 정도가 큰 것으로 선정된 샘플 색공간 요소 값일 수 있다. 상기 다변량 분석은 주성분 분석(Principal component analysis, PCA) 방법에 의한 것일 수 있다.
다변량 분석은 농작물의 원산지별로 다르게 나타나는 변색 센서(210)의 컬러 변화를 개개로 독립시키지 않고 이들 컬러 변화 간의 상호 관계를 고려하면서 수학적으로 처리하여 컬러 변화 상호간의 관계를 도출할 수 있는데, 이와 같이 도출된 관계를 기초로 하여 미지의 원산지를 갖는 농작물의 원산지를 판별할 수 있게 된다.
도 4는 본 발명에서 농작물 원산지별 샘플 색변화 값을 도출하기 위한 센서를 설명하기 위한 개념도이다.
일 실시예에서, 도 4와 같이, 농작물 원산지에 따른 샘플 농작물에 대한 샘플 색변화 값을 얻기 위한 변색 센서(210)가 단일 밴드가 아니라, 서로 나노섬유다발의 굵기가 다른 2개 이상의 밴드들 각각으로 이루어진 2개 이상의 영역들로 구획된 경우, 1개의 센서에 대해서 센서의 영역들 개수와 대응하는 이미지를 얻을 수 있고, 이미지들 각각에 대해서 색상코드 데이터가 생성될 수 있다. 다만, 데이터의 신뢰성을 확보하기 위해서, 센서가 서로 다른 밴드들로 구성되어 n개의 영역들로 구분되는 경우(이때, n은 2이상의 자연수)에, n개 영역들 각각에서도 컬러가 선명하게 나타나는 m개의 서브 영역들을 선택하여 이에 대한 색상코드 데이터를 도출할 수 있는데, 이 경우에는 1개의 분석용 농작물에 대해서 m×n개의 색상코드 데이터가 생성될 수 있다. 이들 색상코드 데이터는 m×n개 전체를 각각 독립적으로 이용할 수 있고, 각 영역에서의 m개의 서브 영역들에서 나타나는 컬러 변화의 평균 데이터를 이용할 수도 있다.
이때, 변색 센서(210)의 영역별로 나타나는 색변화 값들 각각은 색상코드 데이터의 색공간 요소 값을 포함하고, 상기 색공간 요소 값은 컬러 모델의 색공간 요소에 대응하는 값일 수 있다. 이때, 상기 샘플 색변화 값은 상기 변색 센서의 영역별 샘플 색공간 요소 값들 중에서 다변량 분석(multivariate analysis)에 따라 원산지 구분 정도가 큰 것으로 선정된 샘플 색공간 요소 값일 수 있다.
3개의 영역들로 구획된 변색 센서(210)의 3개의 영역들 각각에 대응하는 제1 밴드, 제2 밴드 및 제3 밴드에 있어서, 고춧가루에 대해서 한국산 20종과 중국산 19종에 대해서, 컬러변화의 이미지를 획득하고, 이미지를 RGB 컬러모델을 이용하여 컬러 변화를 계산한 결과는 하기 표 1 및 표 2로 나타낸다.
하기 표 1은 한국산 고춧가루 20종에 대한 것이고, 표 2는 중국산 고춧가루 20종에 대한 것이다.
하기 표 1 및 표 2에서, 각 샘플에 대해서 제1 내지 제3 밴드들 각각에서 3개의 서브 영역들을 선정하였으나, 각 밴드에서 1개의 ΔRGB값이 도출되는 것은, 밴드들 각각에서의 서브 영역들에 대한 값을 평균한 값이기 때문이다.
| 샘플 No. | 제1 밴드 | 제2 밴드 | 제3 밴드 | ||||||
| ΔR | ΔG | ΔB | ΔR | ΔG | ΔB | ΔR | ΔG | ΔB | |
| 1 | 19.66 | 57.64 | -67.48 | 59.98 | -18.31 | 50.92 | -57.21 | -33.15 | 40.76 |
| 2 | 1.66 | 26.52 | -124.12 | -0.98 | -55.47 | 46.14 | -79.67 | -61.99 | 10.98 |
| 3 | 0.23 | 28.44 | -97.84 | 20.23 | -43.89 | 24.01 | -52.22 | -42.69 | 4.84 |
| 4 | 7.92 | 17.75 | -80.86 | 28.03 | -41.67 | 8.45 | -61.30 | -45.33 | 15.78 |
| 5 | 0.69 | 25.27 | -91.68 | 13.73 | -41.09 | 34.11 | -54.41 | -45.95 | 8.87 |
| 6 | 30.36 | 50.56 | -92.67 | 43.49 | -15.28 | 60.30 | -83.32 | -37.38 | 50.48 |
| 7 | 33.71 | 30.27 | -107.17 | 37.51 | -42.40 | 34.86 | -101.57 | -47.21 | 29.96 |
| 8 | 5.95 | 33.68 | -152.34 | -16.07 | -69.52 | 101.34 | -112.16 | -72.61 | 33.68 |
| 9 | 2.72 | 34.56 | -135.74 | 6.48 | -60.96 | 55.51 | -100.36 | -54.32 | 34.54 |
| 10 | 26.78 | 85.40 | -55.07 | -36.22 | -27.30 | 83.44 | -69.49 | -19.85 | 106.16 |
| 11 | 10.44 | 64.14 | -58.79 | -22.33 | -46.68 | 57.33 | -68.74 | -46.93 | 59.82 |
| 12 | -8.77 | 29.47 | -5.63 | -2.01 | -36.87 | 25.38 | -26.37 | -35.20 | 4.41 |
| 13 | 1.26 | 45.39 | -24.21 | -2.78 | -38.20 | 53.03 | -16.97 | -16.02 | 22.21 |
| 14 | -6.63 | 63.73 | 0.90 | -10.82 | -42.59 | 69.90 | -55.68 | -46.20 | 51.75 |
| 15 | 9.85 | 56.81 | 2.76 | 10.54 | -24.14 | 60.39 | -17.94 | -20.90 | 34.19 |
| 16 | 0.23 | 54.27 | 8.21 | 10.82 | -34.06 | 55.78 | -25.14 | -29.63 | 33.92 |
| 17 | 12.38 | 53.06 | -19.01 | -31.59 | -42.30 | 49.69 | -23.74 | -21.46 | 34.83 |
| 18 | 5.45 | 23.10 | -146.04 | -0.63 | -62.50 | 71.60 | -92.18 | -60.51 | 24.39 |
| 19 | -10.42 | 38.42 | -3.99 | -8.75 | -46.53 | 40.27 | -43.18 | -45.83 | 18.38 |
| 20 | -12.70 | 30.19 | -5.03 | -6.00 | -41.45 | 31.38 | -32.51 | -39.03 | 10.47 |
| 샘플 No. | 제1 밴드 | 제2 밴드 | 제3 밴드 | ||||||
| ΔR | ΔG | ΔB | ΔR | ΔG | ΔB | ΔR | ΔG | ΔB | |
| 1 | 0.05 | 36.22 | -106.56 | 32.42 | -39.62 | 26.21 | -42.27 | -19.61 | 8.79 |
| 2 | 32.68 | -18.81 | -7.50 | 1.76 | 13.48 | -43.01 | -29.43 | -26.80 | 2.96 |
| 3 | 0.22 | 19.66 | -78.26 | 16.04 | -28.28 | 20.97 | -46.74 | -21.27 | 8.76 |
| 4 | 11.44 | 35.58 | -31.66 | 47.75 | -4.73 | 20.61 | -14.87 | -10.99 | 21.41 |
| 5 | 0.05 | 23.10 | -67.37 | 8.01 | -33.32 | 19.37 | -52.60 | -25.94 | 12.60 |
| 6 | 35.61 | -32.21 | 27.16 | 15.57 | 13.11 | -89.91 | -73.03 | -50.51 | 23.22 |
| 7 | 1.36 | 34.53 | -130.68 | 6.78 | -57.75 | 52.54 | -86.33 | -59.07 | 21.85 |
| 8 | 8.17 | 22.03 | -79.89 | 51.39 | -33.00 | 9.42 | -55.84 | -43.20 | 10.30 |
| 9 | 1.85 | 38.28 | -144.34 | 3.81 | -66.18 | 59.19 | -99.97 | -72.01 | 25.69 |
| 10 | 8.51 | 31.45 | -1.72 | 8.00 | -17.01 | 35.23 | 1.45 | -2.49 | 12.83 |
| 11 | 10.68 | 28.90 | -3.36 | 18.71 | -15.92 | 19.91 | 6.97 | -0.98 | 8.91 |
| 12 | 6.03 | 41.54 | 2.72 | 9.99 | -35.97 | 29.60 | 2.69 | -7.80 | 13.32 |
| 13 | 3.23 | 34.85 | 1.43 | 13.31 | -26.84 | 29.32 | 0.25 | -8.01 | 11.36 |
| 14 | 4.22 | 40.22 | 2.47 | 14.68 | -33.84 | 31.03 | 1.18 | -11.93 | 14.24 |
| 15 | -8.57 | 22.17 | 8.15 | 5.07 | -38.38 | 23.11 | -5.96 | -22.64 | 8.07 |
| 16 | -15.14 | 23.91 | 17.57 | 0.97 | -42.84 | 28.04 | -6.57 | -29.92 | 4.77 |
| 17 | 1.93 | 30.39 | -134.76 | -7.48 | -57.80 | 77.12 | -91.67 | -56.07 | 29.12 |
| 18 | 15.83 | 44.79 | -8.55 | 8.41 | -27.80 | 54.12 | 0.11 | -12.99 | 26.51 |
| 19 | -18.05 | 22.94 | 15.73 | 5.65 | -45.45 | 17.16 | -7.00 | -31.20 | -0.39 |
상기 표 1과 같이 계산된 국산 고춧가루와 상기 표 2와 같이 계산된 중국산 고춧가루의 샘플들에 대한 ΔRGB가 RGB 컬러모델의 색상코드 데이터인 (R,G,B)가 될 수 있다.
이어서, 상기 색상코드 데이터를 상기 컬러 모델의 색공간 요소별로 독립적인 값으로 하여 컬러 모델의 색공간 요소에 대응하는 값들을 각각 색공간 요소 값으로 한다. 즉, 1개의 색상코드 데이터에서, 색상코드 데이터의 색공간 요소별로 독립적인 데이터로 변환하고, 이렇게 변환된 독립적인 데이터를 상기 색상코드 데이터의 색공간 요소들과 변색 센서의 고유색 사이의 변수로 한다.
이와 같이 도출된 샘플 색공간 요소 값들 중에서 다변량 분석(multivariate analysis)에 따라 원산지 구분 정도가 큰 것으로 선정된 샘플 색공간 요소 값을 모집단에 대한 샘플 색변화 값으로 한다. 일례로, 다변량 분석은 주성분 분석(Principal component analysis, PCA)을 이용한다.
본 발명에서는, 주성분 분석(PCA)을 통해서 모집단에 포함되는 샘플 농작물 각각에 대해서 색상코드 데이터의 색공간 요소들과 센서의 고유색 사이의 변수들을 통해서 농작물 원산지에 따라 컬러 변화에 영향을 주는 적어도 1개의 주성분이 도출될 수 있다. 이와 같이 도출된 모집단에 포함되는 샘플 농작물 각각에서 주성분에 해당하는 변수들을 좌표 데이터로 변환하고, 이러한 좌표 데이터를 농작물 원산지에 따른 모집단 샘플 색변화 값으로 할 수 있다. 즉, 도출된 주성분들 중 1개를 x 좌표, 다른 하나를 y 좌표로 한 2차원 좌표 데이터 또는 각각을 x, y 및 z 좌표로 하는 3차원 좌표 데이터를 농작물 원산지에 따른 샘플 색변화 값으로 할 수 있다.
변색 센서(210)가 2개 이상의 영역들을 포함하는 경우, 샘플 색변화 값은 변색 센서(210)의 영역별 샘플 색공간 요소 값들 중에서 다변량 분석에 따라 원산지 구분 정도가 큰 것으로 선정된 샘플 색공간 요소 값일 수 있다.
구체적으로, 본 출원의 발명자들이 M13 박테리오파지(VPN)를 포함하는 3개의 밴드로 구획된 센서를 이용하고, 컬러 모델을 RGB 방식으로 이용하여, 한국산 고춧가루 20종과 중국산 고춧가루 19종 각각에 대해서 상기에서 설명한 컬러 변화를 주성분 분석(PCA)을 수행하여 주성분을 도출하고 이를 토대로 하여 2차원 좌표 데이터로 산출하여 한국산 고춧가루와 중국산 고춧가루의 선별력이 있음을 확인하였다. 그 결과를 5에 나타낸다.
도 5 내지 도 9는 농작물 종류별 원산지에 따른 샘플 색변화 그래프를 도시한 도면들이다.
도 5의 (a)는 2개의 주성분을 도출하여 고춧가루에 대하여 2차원 좌표 데이터로 산출한 그래프이고, (b)는 3개의 주성분을 도출하여 고춧가루에 대하여 3차원 좌표 데이터로 산출한 그래프이다.
도 5의 (a) 및 (b) 각각에서 검정 도트들이 한국산에 대한 것이고, 흰색 도트들이 중국산에 대한 것이다.
도 5에 나타난 고춧가루에 대한 것 뿐 만 아니라, 도 6 내지 도 9를 참조하면 마늘, 양파, 참깨 및 들깨 각각에서도 한국산과 중국산을 구별할 수 있는 선별력이 있는 결과로서 농작물 원산지에 따른 샘플 색변화 값이 도출되는 것을 확인하였다.
도 6 내지 도 9 각각에서도 검정 도트들이 한국산에 대한 것이고 흰색 도트들이 중국산에 대한 것이다. 도 6은 마늘에 대한 것이고, 도 7은 양파에 대한 것이며, 도 8은 참깨, 도 9는 들깨에 관한 것이다.
도 6 내지 도 9를 참조하면, 샘플 색변화 값으로서 샘플 색공간 요소 값을 포함하는 경우, 이들을 좌표 데이터로 하여 그래프로 나타낸 경우에 각각의 농작물에 있어서 한국산과 중국산 농작물 간의 선별력이 있는 것을 확인할 수 있다. 즉, 한국산 농작물의 샘플 색변화 값끼리 서로 유사한 값을 나타내는 것을 확인할 수 있고, 중국산 농작물의 샘플 색변화 값끼리 서로 유사한 값을 나타내는 것을 확인할 수 있다.
도 6의 3차원 좌표 데이터들은 하기 표 3 및 표 4의 데이터들을 이용하여 PCA 분석하여 도출한 것이다.
표 3은 국산 마늘 30종에 대한 것이고 표 4는 중국산 마늘 29종에 대한 것이다.
| 샘플 No. | 제1 밴드 | 제2 밴드 | 제3 밴드 | ||||||
| ΔR | ΔG | ΔB | ΔR | ΔG | ΔB | ΔR | ΔG | ΔB | |
| 1 | 60.13 | 0.00 | -66.70 | -14.57 | -23.76 | 53.65 | -8.32 | 21.07 | 32.72 |
| 2 | 25.63 | 0.03 | -19.38 | 0.57 | 4.21 | 14.27 | -5.46 | 7.73 | 22.50 |
| 3 | 46.13 | -4.58 | -25.13 | 3.36 | 9.14 | 7.56 | -5.98 | 10.11 | 21.08 |
| 4 | 22.85 | -27.63 | -27.78 | -32.33 | -28.81 | 24.60 | -28.62 | -5.66 | 7.83 |
| 5 | 62.58 | -15.24 | -21.36 | -16.94 | -38.14 | 59.22 | -11.78 | 18.35 | 38.94 |
| 6 | -1.24 | 1.54 | -27.83 | 34.21 | 8.13 | -43.58 | -5.82 | 17.89 | 26.72 |
| 7 | 34.39 | 1.20 | -65.18 | 3.95 | 23.50 | -1.19 | -4.91 | 10.51 | 15.22 |
| 8 | 25.11 | 6.92 | -42.33 | 5.69 | 4.26 | -0.91 | -18.67 | -13.57 | 22.01 |
| 9 | 44.03 | -0.78 | -95.94 | 10.53 | 40.92 | 2.46 | -7.48 | 13.16 | 32.18 |
| 10 | 27.33 | -6.02 | -6.54 | 25.30 | 13.89 | -12.45 | -3.81 | 16.45 | 16.56 |
| 11 | 54.02 | -0.52 | -76.54 | -18.40 | -26.76 | 78.28 | -12.56 | 12.98 | 24.98 |
| 12 | 37.79 | -3.76 | -117.96 | -39.59 | -48.91 | 36.92 | -31.69 | 1.91 | 20.75 |
| 13 | 34.26 | 6.08 | -58.36 | 8.29 | 28.25 | 4.69 | -7.49 | 7.13 | 24.20 |
| 14 | -0.61 | 1.49 | -31.38 | 23.65 | -14.68 | -16.73 | -3.94 | 21.56 | 27.89 |
| 15 | -5.36 | -0.55 | -1.27 | 0.67 | -1.88 | 0.50 | -2.92 | -2.01 | -3.34 |
| 16 | 2.37 | -2.41 | 5.18 | 4.62 | -0.02 | -0.21 | 0.87 | -0.06 | -1.08 |
| 17 | 1.08 | 0.00 | -6.52 | 2.36 | 0.25 | 1.53 | -0.86 | -0.18 | -0.76 |
| 18 | -11.13 | -0.06 | 6.27 | 0.91 | 4.71 | -4.24 | -0.89 | -2.70 | -5.09 |
| 19 | 5.75 | -3.75 | 2.71 | 0.11 | 21.43 | 20.57 | -1.23 | 2.30 | 4.36 |
| 20 | -22.44 | -6.49 | 58.34 | 3.98 | 15.14 | -16.57 | 2.01 | -7.32 | -13.14 |
| 21 | -29.71 | 0.00 | 59.85 | 5.03 | 16.62 | -51.40 | 2.85 | -8.74 | -14.99 |
| 22 | 18.81 | 0.00 | -55.64 | -0.33 | -1.78 | 25.36 | -2.33 | 8.38 | 11.75 |
| 23 | 19.15 | 0.00 | -49.42 | 0.10 | -3.10 | 19.94 | -2.49 | 7.56 | 11.23 |
| 24 | 10.01 | 0.13 | -29.26 | -0.61 | -3.21 | 10.94 | -1.65 | 4.83 | 6.73 |
| 25 | 1.73 | 0.00 | -7.62 | 1.94 | -1.93 | 4.53 | 0.31 | 1.99 | 0.80 |
| 26 | 18.35 | 0.00 | -44.68 | -0.45 | -2.11 | 30.42 | -4.02 | 7.93 | 11.26 |
| 27 | 7.02 | -1.60 | -14.99 | 1.46 | 4.62 | 6.74 | 0.39 | 4.13 | 8.40 |
| 28 | 13.28 | -16.66 | 21.24 | 10.79 | 35.30 | 0.39 | 6.05 | 31.72 | 6.74 |
| 29 | -43.52 | 1.27 | 34.51 | 15.60 | 21.06 | -50.45 | -22.14 | -34.05 | 5.46 |
| 30 | 13.16 | -0.08 | -12.34 | -5.92 | -1.76 | 10.33 | -3.21 | 21.42 | 15.80 |
| 샘플 No. | 제1 밴드 | 제2 밴드 | 제3 밴드 | ||||||
| ΔR | ΔG | ΔB | ΔR | ΔG | ΔB | ΔR | ΔG | ΔB | |
| 1 | 40.00 | -39.21 | -44.85 | -40.94 | -56.22 | 29.56 | -31.01 | -2.42 | 17.83 |
| 2 | 54.48 | -16.22 | 17.70 | -12.06 | -25.31 | 57.94 | -8.19 | 18.92 | 33.08 |
| 3 | 8.66 | 3.69 | -2.58 | 4.74 | 8.70 | 7.94 | -3.19 | 4.14 | 12.50 |
| 4 | 33.56 | -0.12 | -17.62 | 8.82 | 2.97 | 15.65 | -8.17 | 16.28 | 32.17 |
| 5 | -12.80 | -2.33 | 12.63 | 2.00 | 13.18 | 11.28 | 0.75 | -0.42 | -3.96 |
| 6 | 41.83 | -0.97 | -40.27 | -1.01 | -7.87 | 3.77 | -6.65 | 10.35 | 29.78 |
| 7 | -4.64 | -17.68 | -4.77 | -14.92 | 17.98 | 12.57 | -20.74 | -8.52 | -4.39 |
| 8 | 82.30 | 0.69 | -92.39 | -27.36 | -39.87 | 92.65 | -10.63 | 26.02 | 45.17 |
| 9 | -12.11 | 13.56 | -47.50 | 40.19 | 2.67 | 11.09 | 20.34 | -21.20 | -1.60 |
| 10 | 52.61 | -2.06 | -27.94 | -5.67 | -17.11 | 40.67 | -9.11 | 15.69 | 31.57 |
| 11 | 16.94 | 0.00 | -34.29 | -0.96 | -1.71 | 24.84 | -2.17 | 5.75 | 8.60 |
| 12 | 16.62 | 1.08 | -29.93 | -2.66 | -10.58 | 18.88 | -2.93 | 5.47 | 10.81 |
| 13 | 19.13 | 2.94 | -38.99 | -0.71 | -10.91 | 12.48 | -4.42 | 8.09 | 14.19 |
| 14 | 9.64 | -0.36 | -24.79 | 0.25 | -5.47 | 19.26 | -1.83 | 4.99 | 7.35 |
| 15 | 16.70 | 0.09 | -34.36 | -0.65 | -8.24 | 21.98 | -3.78 | 8.19 | 11.50 |
| 16 | -4.05 | -0.16 | 5.24 | 3.03 | 4.15 | -0.05 | 0.25 | -2.36 | -4.49 |
| 17 | 14.78 | 0.00 | -35.17 | -2.33 | -1.15 | 19.80 | -2.99 | 4.01 | 5.88 |
| 18 | 11.74 | -0.43 | -13.49 | -0.93 | -12.03 | 12.43 | -2.89 | 3.22 | 4.83 |
| 19 | -5.20 | -0.10 | 12.30 | 2.99 | 4.31 | -2.06 | 2.41 | -1.49 | -6.87 |
| 20 | 13.00 | 0.00 | -20.47 | -0.94 | -5.78 | 3.53 | -0.19 | 2.30 | 6.50 |
| 21 | 9.67 | 0.96 | -18.75 | -1.14 | -12.58 | -1.63 | -2.55 | 2.74 | 8.89 |
| 22 | 5.06 | 0.50 | -34.58 | -11.35 | 44.88 | 44.00 | -4.01 | -1.00 | 3.98 |
| 23 | 14.55 | -3.05 | -26.58 | 0.03 | 3.12 | 7.69 | -1.54 | 5.30 | 5.12 |
| 24 | 9.42 | -3.21 | -21.21 | -2.41 | -9.78 | 8.07 | -4.10 | 4.40 | 8.23 |
| 25 | 4.91 | 0.17 | -12.64 | -1.30 | 4.29 | 3.47 | -3.61 | 2.73 | 6.36 |
| 26 | 7.27 | -16.94 | 1.69 | 0.69 | -1.47 | 3.14 | -2.83 | 4.61 | 8.02 |
| 27 | 21.67 | -0.11 | -33.85 | -5.84 | -8.44 | 20.08 | -1.19 | 14.55 | 14.00 |
| 28 | 11.23 | -1.12 | -15.49 | -2.87 | -2.32 | 15.36 | 8.02 | 20.00 | -0.90 |
| 29 | 4.58 | -0.24 | -29.52 | -3.02 | -15.27 | 17.83 | -3.55 | 18.30 | 21.72 |
도 7의 3차원 좌표 데이터들은 하기 표 5 및 표 6의 데이터들을 이용하여 PCA 분석하여 도출한 것이다.
표 5는 국산 양파 23종에 대한 것이고 표 4는 중국산 양파 22종에 대한 것이다.
| 샘플 No. | 제1 밴드 | 제2 밴드 | 제3 밴드 | ||||||
| ΔR | ΔG | ΔB | ΔR | ΔG | ΔB | ΔR | ΔG | ΔB | |
| 1 | 19.69 | 67.61 | -95.41 | 79.58 | -11.53 | -107.03 | -8.48 | 25.70 | 45.32 |
| 2 | -13.08 | 41.56 | -16.94 | 36.99 | 5.39 | -48.03 | -3.99 | 5.87 | 21.03 |
| 3 | -0.82 | 50.20 | -45.30 | 42.71 | 1.94 | -94.01 | -7.20 | 8.85 | 24.31 |
| 4 | -13.88 | 41.45 | -17.12 | 33.18 | 4.55 | -51.07 | -4.86 | 6.51 | 19.22 |
| 5 | -9.99 | 29.10 | -11.29 | 32.47 | 10.51 | -40.26 | -4.24 | 4.85 | 17.42 |
| 6 | -3.23 | 59.86 | -47.61 | 57.78 | 6.17 | -103.89 | -7.11 | 14.20 | 30.93 |
| 7 | -10.48 | 53.00 | -53.39 | 42.31 | 0.03 | -88.44 | -6.66 | 11.22 | 28.87 |
| 8 | -7.17 | 34.06 | -25.41 | 29.88 | 4.61 | -58.73 | -5.23 | 6.95 | 15.01 |
| 9 | -4.51 | 37.03 | -27.12 | 30.53 | -0.03 | -60.15 | -3.20 | 8.17 | 15.13 |
| 10 | -6.03 | 50.61 | -34.47 | 51.94 | 2.00 | -91.92 | -4.28 | 8.14 | 20.13 |
| 11 | 13.06 | 61.06 | -74.89 | 57.75 | -6.42 | -108.88 | -9.56 | 20.31 | 39.12 |
| 12 | 1.44 | 54.97 | -49.69 | 52.04 | -6.04 | -77.46 | -7.74 | 14.65 | 32.76 |
| 13 | -1.27 | 54.52 | -55.46 | 47.68 | 4.82 | -78.93 | -6.96 | 9.29 | 31.12 |
| 14 | 4.56 | 64.97 | -71.76 | 60.83 | 3.39 | -110.65 | -9.01 | 13.72 | 30.17 |
| 15 | -4.97 | 36.92 | -29.91 | 31.06 | -0.06 | -85.50 | -3.25 | 9.05 | 17.04 |
| 16 | 14.09 | 49.61 | -71.72 | 54.36 | -3.78 | -94.23 | -9.08 | 17.03 | 30.03 |
| 17 | -9.30 | 42.24 | -24.01 | 38.08 | 4.78 | -74.99 | -5.76 | 8.33 | 22.02 |
| 18 | 5.48 | 45.05 | -52.51 | 38.55 | -6.54 | -67.70 | -6.82 | 13.43 | 24.17 |
| 19 | 14.10 | 37.88 | -63.88 | 37.46 | -13.14 | -53.27 | -8.30 | 14.48 | 23.41 |
| 20 | 7.83 | 66.01 | -73.93 | 65.32 | -5.59 | -97.04 | -8.82 | 20.65 | 37.47 |
| 21 | 31.09 | 52.76 | -97.75 | 58.13 | -17.00 | -79.76 | -12.10 | 23.22 | 37.71 |
| 22 | -7.06 | 58.25 | -42.04 | 53.86 | -0.16 | -105.21 | -9.30 | 15.34 | 30.96 |
| 23 | 6.83 | 50.02 | -60.94 | 46.81 | -3.96 | -91.82 | -8.00 | 17.13 | 27.23 |
| 샘플 No. | 제1 밴드 | 제2 밴드 | 제3 밴드 | ||||||
| ΔR | ΔG | ΔB | ΔR | ΔG | ΔB | ΔR | ΔG | ΔB | |
| 1 | -9.08 | 16.99 | 31.48 | -9.08 | 16.99 | 31.48 | -9.08 | 16.99 | 31.48 |
| 2 | -7.98 | 12.41 | 31.06 | -7.98 | 12.41 | 31.06 | -7.98 | 12.41 | 31.06 |
| 3 | -3.43 | 8.83 | 18.47 | -3.43 | 8.83 | 18.47 | -3.43 | 8.83 | 18.47 |
| 4 | -6.12 | 8.15 | 20.86 | -6.12 | 8.15 | 20.86 | -6.12 | 8.15 | 20.86 |
| 5 | -6.09 | 9.80 | 17.43 | -6.09 | 9.80 | 17.43 | -6.09 | 9.80 | 17.43 |
| 6 | -3.79 | 6.84 | 14.35 | -3.79 | 6.84 | 14.35 | -3.79 | 6.84 | 14.35 |
| 7 | -4.51 | 9.95 | 23.51 | -4.51 | 9.95 | 23.51 | -4.51 | 9.95 | 23.51 |
| 8 | -10.36 | 20.80 | 40.55 | -10.36 | 20.80 | 40.55 | -10.36 | 20.80 | 40.55 |
| 9 | -9.58 | 11.41 | 28.33 | -9.58 | 11.41 | 28.33 | -9.58 | 11.41 | 28.33 |
| 10 | -5.60 | 4.86 | 14.99 | -5.60 | 4.86 | 14.99 | -5.60 | 4.86 | 14.99 |
| 11 | -4.90 | 8.31 | 18.97 | -4.90 | 8.31 | 18.97 | -4.90 | 8.31 | 18.97 |
| 12 | -7.22 | 6.57 | 21.30 | -7.22 | 6.57 | 21.30 | -7.22 | 6.57 | 21.30 |
| 13 | -8.18 | 14.87 | 33.47 | -8.18 | 14.87 | 33.47 | -8.18 | 14.87 | 33.47 |
| 14 | -10.77 | 13.02 | 27.81 | -10.77 | 13.02 | 27.81 | -10.77 | 13.02 | 27.81 |
| 15 | -6.46 | 4.03 | 15.36 | -6.46 | 4.03 | 15.36 | -6.46 | 4.03 | 15.36 |
| 16 | -9.81 | 9.01 | 22.05 | -9.81 | 9.01 | 22.05 | -9.81 | 9.01 | 22.05 |
| 17 | -5.18 | 9.60 | 21.49 | -5.18 | 9.60 | 21.49 | -5.18 | 9.60 | 21.49 |
| 18 | -4.67 | 9.10 | 15.98 | -4.67 | 9.10 | 15.98 | -4.67 | 9.10 | 15.98 |
| 19 | -3.74 | 6.62 | 11.60 | -3.74 | 6.62 | 11.60 | -3.74 | 6.62 | 11.60 |
| 20 | -5.43 | 8.10 | 18.21 | -5.43 | 8.10 | 18.21 | -5.43 | 8.10 | 18.21 |
| 21 | -7.83 | 14.01 | 29.53 | -7.83 | 14.01 | 29.53 | -7.83 | 14.01 | 29.53 |
| 22 | -5.72 | 10.19 | 17.77 | -5.72 | 10.19 | 17.77 | -5.72 | 10.19 | 17.77 |
도 8의 3차원 좌표 데이터들은 하기 표 7 및 표 8의 데이터들을 이용하여 PCA 분석하여 도출한 것이다.
표 7은 국산 참깨 30종에 대한 것이고 표 8은 중국산 참깨 30종에 대한 것이다.
| 샘플 No. | 제1 밴드 | 제2 밴드 | 제3 밴드 | ||||||
| ΔR | ΔG | ΔB | ΔR | ΔG | ΔB | ΔR | ΔG | ΔB | |
| 1 | -2.53 | -5.29 | 2.69 | 5.11 | 0.75 | -7.35 | -3.09 | 1.54 | 0.06 |
| 2 | -4.48 | -5.33 | -2.19 | -2.73 | -2.36 | -3.40 | -4.15 | -2.66 | -2.26 |
| 3 | -6.26 | -9.53 | -4.57 | -4.25 | -3.91 | -4.79 | -5.01 | -3.62 | -2.67 |
| 4 | -4.07 | -4.95 | -2.01 | -2.51 | -2.55 | -4.22 | -3.58 | -1.50 | -1.20 |
| 5 | -3.73 | -4.03 | -1.93 | -2.15 | -1.99 | -4.50 | -3.36 | -0.83 | -0.68 |
| 6 | -5.06 | -6.88 | -2.86 | -2.66 | -2.34 | -2.87 | -3.73 | -1.83 | -1.04 |
| 7 | -3.42 | -8.04 | -3.45 | 3.04 | 1.95 | -9.74 | -9.23 | -0.63 | -0.29 |
| 8 | -1.47 | -24.07 | -7.96 | -6.89 | -0.26 | -8.90 | -10.27 | -9.50 | -3.72 |
| 9 | -3.13 | -5.13 | -0.15 | 0.25 | -1.49 | -5.56 | -2.25 | -0.65 | -0.98 |
| 10 | -3.56 | -4.74 | -1.58 | -0.20 | -2.27 | -6.33 | -1.84 | 1.23 | 0.11 |
| 11 | -6.21 | -7.77 | -1.95 | -3.56 | -4.40 | -4.70 | -5.63 | -1.59 | 0.09 |
| 12 | -2.89 | -3.91 | -1.93 | -1.19 | -1.99 | -2.83 | -1.52 | 0.55 | -0.17 |
| 13 | -2.55 | -4.27 | -1.95 | -1.79 | -2.00 | -2.90 | -1.35 | 0.53 | -0.55 |
| 14 | -2.53 | -2.86 | -3.07 | -0.93 | -2.07 | -3.95 | -1.74 | 0.57 | -0.46 |
| 15 | -2.54 | -3.23 | -3.10 | -0.17 | -1.81 | -4.52 | -1.66 | 0.74 | -0.52 |
| 16 | -2.05 | -4.80 | -0.21 | -0.17 | -1.70 | -4.11 | -0.82 | 2.48 | 0.58 |
| 17 | -3.09 | -4.97 | 0.24 | -0.24 | -1.77 | -4.62 | -1.68 | 0.03 | -0.38 |
| 18 | -6.00 | -8.75 | -0.89 | -2.29 | -3.66 | -7.51 | -1.37 | 2.65 | -0.07 |
| 19 | -3.51 | -6.43 | 0.43 | 0.71 | -2.77 | -7.44 | -1.31 | 2.52 | 1.68 |
| 20 | -9.90 | -11.88 | -4.98 | -4.86 | -6.20 | -11.40 | -7.23 | -3.42 | -4.79 |
| 21 | -3.31 | -5.19 | -2.01 | -3.54 | -3.12 | -3.31 | -2.03 | 1.17 | -0.20 |
| 22 | -9.25 | -12.64 | 2.62 | -1.19 | -7.38 | -16.60 | -2.47 | 3.30 | -0.97 |
| 23 | -10.14 | -12.95 | 1.93 | -2.81 | -6.72 | -15.00 | -4.41 | 1.26 | -0.86 |
| 24 | -3.56 | -6.09 | 3.47 | 1.67 | -3.14 | -10.26 | 0.32 | 4.64 | 2.31 |
| 25 | -2.78 | -3.58 | -1.93 | 2.86 | -1.20 | -7.31 | -1.16 | 2.02 | 1.13 |
| 26 | -3.83 | -5.52 | -1.10 | -0.91 | -2.46 | -4.55 | -1.26 | 2.09 | 1.14 |
| 27 | -3.21 | -5.47 | -1.03 | -0.11 | -2.30 | -5.35 | -0.43 | 2.11 | -0.28 |
| 28 | -1.32 | -2.61 | 0.28 | 0.19 | -0.94 | -2.75 | 0.98 | 3.31 | 1.83 |
| 29 | -2.23 | -3.81 | -2.43 | 0.82 | -1.49 | -7.07 | -1.37 | 2.79 | 0.30 |
| 30 | -1.01 | -2.91 | 0.98 | 3.14 | -0.83 | -8.23 | -0.30 | 4.50 | 1.90 |
| 샘플 No. | 제1 밴드 | 제2 밴드 | 제3 밴드 | ||||||
| ΔR | ΔG | ΔB | ΔR | ΔG | ΔB | ΔR | ΔG | ΔB | |
| 1 | 0.98 | -4.64 | 8.93 | 11.34 | 3.36 | -9.63 | 0.58 | 0.33 | 0.60 |
| 2 | -3.87 | -4.16 | -2.07 | -2.46 | -1.95 | -2.66 | -3.00 | -2.19 | -2.67 |
| 3 | -3.91 | -4.15 | -2.57 | -1.89 | -2.24 | -3.59 | -3.45 | -1.72 | -2.13 |
| 4 | 2.36 | -14.19 | -8.48 | -6.59 | -3.15 | -0.76 | -5.81 | -3.76 | -0.65 |
| 5 | -3.61 | -8.42 | -2.45 | -1.30 | 0.98 | -3.44 | -3.28 | -2.15 | -1.77 |
| 6 | -5.95 | -9.99 | -4.30 | -5.18 | -1.47 | -5.20 | -6.08 | -4.06 | -4.14 |
| 7 | 0.29 | -5.10 | -1.63 | 2.47 | 0.98 | -4.79 | -2.97 | 0.62 | 1.15 |
| 8 | -3.15 | -3.94 | -2.59 | -1.84 | -2.38 | -4.61 | -2.43 | 0.69 | -0.79 |
| 9 | -2.72 | -3.97 | -0.27 | -0.65 | -1.86 | -4.27 | -2.14 | 0.17 | -0.55 |
| 10 | -5.66 | -7.16 | -0.30 | -1.52 | -3.30 | -6.20 | -4.15 | -0.89 | -0.79 |
| 11 | 0.50 | -3.75 | 3.03 | 2.27 | 3.14 | 2.86 | 1.70 | 7.33 | 10.09 |
| 12 | -2.81 | -3.56 | -1.30 | -1.03 | -2.40 | -4.60 | -2.63 | -0.53 | -0.27 |
| 13 | -3.40 | -3.58 | -2.52 | -0.25 | -2.18 | -6.44 | -2.24 | 0.45 | -0.24 |
| 14 | -3.50 | -4.44 | -0.85 | -1.49 | -1.85 | -3.36 | -2.12 | -1.20 | -1.48 |
| 15 | -1.74 | -3.02 | -1.44 | 1.57 | -1.76 | -6.96 | -1.16 | 1.65 | 0.27 |
| 16 | -0.93 | -2.44 | -1.32 | 0.07 | -1.88 | -5.59 | -2.19 | -0.69 | -0.93 |
| 17 | -4.04 | -8.11 | -0.34 | 1.11 | -3.05 | -9.59 | -2.43 | 2.03 | -1.30 |
| 18 | -2.70 | -6.13 | -0.32 | 1.41 | -4.22 | -10.19 | -1.00 | 1.97 | 0.27 |
| 19 | -6.90 | -8.56 | -2.22 | -2.90 | -5.43 | -8.34 | -5.19 | -1.33 | -1.11 |
| 20 | -2.87 | -4.77 | -0.35 | 1.10 | -1.60 | -6.80 | -0.25 | 2.86 | 0.40 |
| 21 | -3.54 | -5.58 | -1.80 | -0.56 | -2.55 | -6.55 | -1.90 | 0.63 | -0.39 |
| 22 | -5.87 | -10.10 | 4.18 | 0.89 | -5.06 | -14.00 | -0.59 | 4.30 | 1.21 |
| 23 | -5.75 | -7.95 | -1.47 | 1.83 | -5.37 | -16.23 | -0.71 | 4.34 | -0.42 |
| 24 | -2.74 | -4.79 | 0.18 | 0.54 | -1.65 | -6.05 | 0.08 | 3.17 | 1.62 |
| 25 | -2.07 | -2.17 | -3.91 | -0.66 | -1.85 | -5.70 | -1.58 | 2.13 | 1.12 |
| 26 | -2.89 | -2.05 | -1.98 | 1.28 | -1.73 | -6.28 | -1.44 | 1.60 | 0.83 |
| 27 | -1.69 | -3.22 | -3.04 | -0.71 | -1.81 | -3.49 | -0.19 | 1.98 | -0.14 |
| 28 | -2.18 | -3.31 | -1.67 | -0.22 | -1.72 | -4.16 | -0.09 | 2.18 | 0.85 |
| 29 | -1.59 | -2.35 | -2.17 | -0.28 | -1.68 | -6.17 | 0.51 | 2.66 | 0.61 |
| 30 | -1.53 | -2.86 | -0.20 | -0.16 | -2.22 | -6.41 | -0.31 | 2.17 | 0.67 |
도 9의 3차원 좌표 데이터들은 하기 표 9 및 표 10의 데이터들을 이용하여 PCA 분석하여 도출한 것이다.
표 9는 국산 들깨 30종에 대한 것이고 표 10은 중국산 들깨 30종에 대한 것이다.
| 샘플 No. | 제1 밴드 | 제2 밴드 | 제3 밴드 | ||||||
| ΔR | ΔG | ΔB | ΔR | ΔG | ΔB | ΔR | ΔG | ΔB | |
| 1 | -8.44 | -17.18 | 12.86 | 0.68 | -1.45 | -4.18 | 5.62 | 12.49 | 8.69 |
| 2 | -9.83 | -16.82 | 5.08 | 0.06 | -3.02 | -9.87 | 1.64 | 6.18 | 0.49 |
| 3 | -7.41 | -13.70 | 1.25 | -5.20 | -2.76 | -2.76 | 2.55 | 5.32 | 0.50 |
| 4 | 0.94 | -5.67 | 6.83 | 6.49 | 7.56 | 3.43 | 7.97 | 10.30 | 11.51 |
| 5 | -4.37 | -8.61 | -1.35 | -1.88 | -2.23 | -4.32 | -1.99 | -0.16 | -1.32 |
| 6 | -7.99 | -10.20 | 1.12 | -1.72 | -1.15 | -2.94 | -2.12 | -0.75 | -0.21 |
| 7 | -5.15 | -8.27 | -3.43 | -4.40 | -2.26 | -0.29 | -3.33 | 1.33 | -0.73 |
| 8 | -2.33 | -6.14 | 5.30 | 5.76 | 0.65 | -8.51 | -0.89 | 2.59 | 2.85 |
| 9 | -2.27 | -4.74 | -2.87 | 0.38 | -1.37 | -6.07 | -3.21 | 0.87 | 0.67 |
| 10 | -3.30 | -4.16 | -2.68 | -2.29 | -2.76 | -7.20 | -3.28 | 0.29 | 1.10 |
| 11 | -3.96 | -8.06 | -4.91 | 0.54 | 0.45 | -5.87 | -2.66 | 1.08 | 0.23 |
| 12 | -1.31 | -3.18 | -6.49 | 3.86 | -0.54 | -6.92 | -2.90 | -1.15 | 0.54 |
| 13 | 5.09 | -2.28 | 16.30 | 15.12 | 6.66 | -10.11 | 12.60 | 19.83 | 17.49 |
| 14 | 7.34 | -3.90 | 15.41 | 17.02 | 9.86 | -7.68 | 13.23 | 25.85 | 23.04 |
| 15 | 2.50 | -4.81 | 8.58 | 12.41 | 4.23 | -10.03 | 6.21 | 11.92 | 10.46 |
| 16 | 4.90 | -3.87 | 12.81 | 14.65 | 6.82 | -8.77 | 10.33 | 17.67 | 17.28 |
| 17 | 4.75 | -3.35 | 4.90 | 12.87 | 6.44 | -10.01 | 4.71 | 12.13 | 14.23 |
| 18 | 7.10 | 2.30 | 10.09 | 9.04 | 3.52 | -8.96 | 12.99 | 19.88 | 13.04 |
| 19 | 9.35 | -0.36 | 14.28 | 18.30 | 11.25 | -4.58 | 14.85 | 24.46 | 21.10 |
| 20 | -5.02 | -10.91 | 4.22 | -1.01 | -3.95 | -10.80 | 0.28 | 4.83 | 0.07 |
| 21 | -2.26 | -8.10 | 6.43 | 8.08 | 2.45 | -9.81 | 1.01 | 6.96 | 5.09 |
| 22 | -2.28 | -6.91 | -0.07 | 5.50 | -3.32 | -16.46 | 0.03 | 7.77 | 2.08 |
| 23 | -3.22 | -6.64 | -3.36 | 2.44 | -7.41 | -19.08 | -1.61 | 1.23 | -5.97 |
| 24 | 0.05 | -7.89 | 5.92 | 3.92 | 0.60 | -6.99 | 2.18 | 5.79 | 2.67 |
| 25 | -1.38 | -2.80 | -2.74 | 2.31 | -1.21 | -7.87 | -2.11 | 2.19 | 0.02 |
| 26 | 0.23 | -1.73 | -7.10 | 6.45 | 1.37 | -10.62 | -3.61 | 2.21 | -0.59 |
| 27 | -3.41 | -2.85 | -4.77 | 2.10 | -1.86 | -10.48 | -0.99 | 0.07 | -1.10 |
| 28 | -3.67 | -3.10 | -5.98 | 1.08 | -2.78 | -9.87 | -4.90 | -0.54 | -1.41 |
| 29 | -1.29 | 0.50 | -6.83 | 1.72 | -1.95 | -6.15 | -4.35 | -2.21 | -0.24 |
| 30 | 1.78 | 2.78 | -5.19 | 3.11 | 0.59 | -4.87 | 0.36 | 2.15 | 0.36 |
| 샘플 No. | 제1 밴드 | 제2 밴드 | 제3 밴드 | ||||||
| ΔR | ΔG | ΔB | ΔR | ΔG | ΔB | ΔR | ΔG | ΔB | |
| 1 | -10.75 | -14.09 | -2.08 | -6.28 | -8.63 | -10.31 | -3.06 | 0.25 | -6.45 |
| 2 | -3.81 | -8.78 | 1.13 | -2.01 | -2.09 | -4.97 | 1.15 | 6.69 | 4.26 |
| 3 | -2.49 | -7.18 | 5.22 | -0.80 | 0.87 | -0.78 | 3.80 | 8.57 | 4.03 |
| 4 | -2.65 | -5.49 | 2.74 | -3.47 | -0.96 | -1.64 | -0.87 | 5.09 | 1.01 |
| 5 | -5.45 | -10.02 | 2.78 | -1.08 | -1.79 | -3.17 | -0.86 | 2.21 | 3.23 |
| 6 | -3.84 | -8.08 | 2.65 | -1.55 | -0.70 | -1.87 | -1.66 | 2.34 | 2.31 |
| 7 | -0.37 | -2.30 | -0.93 | -1.24 | -1.48 | -0.52 | -2.08 | 1.75 | 2.77 |
| 8 | -4.08 | -5.16 | -10.22 | -10.48 | -8.85 | -7.92 | -4.08 | -4.20 | 7.08 |
| 9 | 2.57 | 0.90 | -8.30 | 8.24 | 3.65 | -7.16 | 0.50 | 3.72 | 4.58 |
| 10 | -2.68 | -4.06 | -5.86 | 7.81 | 1.00 | -10.71 | -1.64 | 2.56 | 2.55 |
| 11 | -2.84 | -4.45 | -4.91 | 0.24 | -1.07 | -5.56 | -4.32 | 0.14 | 0.17 |
| 12 | -2.97 | -5.65 | 0.43 | -0.38 | 0.29 | -2.83 | -1.61 | 2.62 | 3.30 |
| 13 | -0.38 | -8.28 | 8.27 | 6.58 | 2.14 | -6.04 | 5.86 | 10.88 | 8.27 |
| 14 | -9.25 | -12.35 | -0.92 | -4.19 | -9.94 | -14.45 | -4.13 | 0.04 | -5.71 |
| 15 | 2.76 | -3.25 | 6.29 | 9.92 | 2.92 | -8.93 | 4.96 | 10.49 | 10.33 |
| 16 | 5.54 | -1.05 | 7.21 | 13.40 | 5.20 | -10.81 | 6.49 | 13.49 | 15.30 |
| 17 | 0.55 | -5.91 | 1.45 | 8.72 | 2.56 | -11.33 | 1.54 | 8.05 | 6.02 |
| 18 | 2.89 | -0.65 | 6.00 | 8.23 | 1.30 | -10.48 | 4.46 | 9.25 | 4.36 |
| 19 | 13.24 | 4.37 | 18.32 | 15.91 | 9.71 | -6.44 | 17.17 | 26.30 | 19.45 |
| 20 | -1.65 | -7.29 | 5.60 | 5.85 | -3.23 | -11.64 | 1.71 | 4.10 | 1.67 |
| 21 | 4.00 | -1.69 | 4.88 | 10.89 | 4.59 | -6.89 | 4.06 | 8.82 | 9.06 |
| 22 | 5.75 | -5.22 | 7.27 | 9.86 | 6.11 | -5.81 | 5.91 | 13.16 | 12.23 |
| 23 | 11.49 | 0.49 | 15.42 | 20.50 | 10.30 | -11.95 | 17.41 | 25.53 | 16.90 |
| 24 | 3.34 | -1.16 | 3.32 | 7.14 | 2.22 | -11.02 | 2.73 | 6.33 | 2.03 |
| 25 | -3.16 | -5.99 | -1.59 | 1.20 | -1.35 | -5.80 | -1.53 | 1.59 | -0.20 |
| 26 | -2.79 | -3.03 | -2.70 | 6.76 | 1.59 | -7.35 | -3.05 | 1.10 | 0.71 |
| 27 | -2.45 | -1.11 | -10.24 | -2.38 | -1.71 | -8.01 | -5.36 | -3.47 | -2.46 |
| 28 | -1.94 | -2.16 | -5.25 | -2.61 | -2.10 | -2.70 | -5.14 | -2.07 | -1.65 |
| 29 | 1.36 | 0.98 | -1.84 | -0.86 | 0.32 | -0.19 | -0.54 | 2.11 | 0.74 |
| 30 | -5.32 | -8.68 | -0.84 | -0.04 | -6.23 | -13.77 | -1.76 | 3.17 | -1.99 |
상기에서 설명한 바와 같이, 판단부(500)은 다수의 농작물들에 대한 정보를 모두 포함하고, 시료부(100)에 놓이는 농작물의 종류에 따라서 해당 정보를 불러와서 분석 및 판단할 수 있음으로써, 1개의 판별 장치(700)를 가지고 여러 종류의 농작물에 대한 원산지 판별에 이용할 수 있다. 이와 달리, 판단부(500)는 1종의 농작물에 대한 정보만 포함하고 있어 농작물의 원산지 판별 장치(700)가 특정한 농작물에 대한 분석 장치로 한정될 수도 있다.
다시 도 1을 참조하면, 상기에서 설명한 샘플 색변화 값이 판단부(500)에 저장되어 있고, 시료부(100)에 배치된 분석용 농작물에서 발생한 증기에 의해서 센싱부(200)의 변색 센서(210)의 컬러가 변화한 경우, 이미지 획득부(300)에서 이미지를 촬영하고, 얻어진 이미지는 판단부(500)에 전송된다.
분석용 농작물에 의한 변색 센서(210)의 변화색에 있어서, 판단부(500)로 전송된 이미지에 의해, 변색 센서(210)의 고유색을 기초로 하여 상기 이미지의 변화색 간의 분석용 색변화 값을 얻을 수 있다. 분석용 농작물에 포함된 성분에 노출되어 변화된 변색 센서(210)의 변화색과 변색 센서(210)의 고유색 간의 분석용 색변화 값은 판단부(500)에 저장된 샘플 색변화 값과 실질적으로 동일한 방식으로 결정될 수 있다.
분석용 농작물에 의한 분석용 색변화 값은 색상코드 데이터의 색공간 요소 값을 포함하고, 상기 색상코드 데이터는 컬러 모델에 따라 결정되되, 상기 색공간 요소 값은 컬러 모델의 색공간 요소에 대응하는 값이며, 분석용 색변화 값은 샘플 색변화 값을 결정하는데 이용된 컬러 모델과 동일한 컬러 모델에 기반하여 결정된다. 분석용 색변화 값은 원산지 구분 정도가 큰 것으로 선정된 샘플 색공간 요소와 동일한 색공간 요소에 해당하는 분석용 색공간 요소 값이다. 즉, 샘플 색변화 값이 다변량 분석, 예를 들어, 주성분 분석을 통해서 특정 샘플 색공간 요소가 원산지 구분 정도가 큰 경우에 그 특정 샘플 색공간 요소가 원산지 구분에 대한 주성분이 되는데, 분석용 색공간 요소 값들 중에서 상기 주성분에 해당하는 값들이 선택되어 본 발명에 따른 분석용 색변화 값이 된다.
상기에서 설명한 것과 같이 정해진 분석용 농작물에 대한 분석용 색변화 값을, 샘플 색변화 값과 비교함으로써 분석용 농작물의 원산지를 판별한다. 분석용 색변화 값이 샘플 색변화 값과 얼마나 유사한지가 원산지의 판단 기준이 되는데, 샘플 색변화 값이 원산지별로 구분된다는 점을 이용하여 분석용 색변화 값이 특정 원산지를 나타내는 샘플 색변화 값과 유사하면 분석용 농작물이 해당 원산지에 해당하는 것으로 판별할 수 있다.
일 실시예에서, 샘플 색변화 값이 샘플 색공간 요소 값을 포함하는 경우, 분석용 색변화 값 또한 분석용 색공간 요소 값을 포함함으로써, 샘플 색공간 요소 값과 분석용 색공간 요소 값의 유사도를 비교하여 분석용 농작물의 원산지를 판별할 수 있다.
일 실시예에서, 샘플 색변화 값이 샘플 색공간 요소 값을 포함하되, 샘플 색공간 요소 값에 대해서 주성분 분석을 이용하여 주성분으로 도출된 3개의 주성분으로 기반으로 하여 선정된 3차원 좌표 데이터(도 5 내지 도 9 참조)인 경우, 샘플 색공간 요소 값에 대해서 도출된 3개의 주성분에 해당하는 분석용 색공간 요소 값을 이용하여 분석용 색변화 값을 결정하고, 이때의 분석용 색변화 값 또한 3차원 좌표 데이터일 수 있다. 이때 분석용 색변화 값으로 도출된 3차원 좌표 데이터를 샘플 색변화 값에 해당하는 3차원 좌표 데이터와 비교하여 한국산 농작물 그룹과 가까운지 중국산 농작물 그룹과 가까운지를 판단하게 되고, 분석용 농작물은 해당 좌표 데이터와 가까운 그룹에 해당하는 원산지로 판단할 수 있다.
상기에서는 컬러 모델을 RGB 방식을 이용한 것을 예로 들어 설명하였으나, 다른 컬러 모델을 이용하여도 동일한 결과로서 농작물의 원산지를 판별할 수 있다. 이러한 농작물의 원산지 판별 장치는 소형으로 휴대성이 좋고, 현장에서 판단부(500)에 저장된 데이터를 기반으로 하여 실시간으로 분석용 농작물의 원산지를 판별할 수 있는 장점이 있다.
상기에서는 본 발명의 바람직한 실시예를 참조하여 설명하였지만, 해당 기술 분야의 숙련된 당업자는 하기의 특허 청구 범위에 기재된 본 발명의 사상 및 영역으로부터 벗어나지 않는 범위 내에서 본 발명을 다양하게 수정 및 변경시킬 수 있음을 이해할 수 있을 것이다.
Claims (14)
- M13 박테리오파지들이 형성하는 나노섬유다발이 베이스 기재 상에 배열된 바이러스 기반 변색 센서가 원산지별 샘플 농작물에 포함된 성분에 노출되어 변화된 변화색과 상기 변색 센서의 고유색 간의 샘플 색변화 값을 준비하는 단계;분석용 농작물의 상기 변색 센서에 대한 변화색과 고유색 간의 분석용 색변화 값을 얻는 단계; 및상기 샘플 색변화 값에 대한 상기 분석용 색변화 값의 유사도에 따라 상기 분석용 농작물의 원산지를 판별하는 단계를 포함하는,바이러스 기반 변색 센서에 의한 농작물의 원산지 판별 방법.
- 제1항에 있어서,상기 샘플 색변화 값과 상기 분석용 색변화 값 각각에서, 색변화 값은 색상코드 데이터의 색공간 요소 값을 포함하고,상기 색상코드 데이터는 RGB 방식, CMYK 방식, CMY 방식 및 HSV 방식 중 어느 하나의 컬러 모델에 따라 결정되고, 상기 색공간 요소 값은 컬러 모델의 색공간 요소에 대응하는 값이며,상기 유사도는 샘플 색공간 요소 값과 분석용 색공간 요소 값 간의 차이인 것을 특징으로 하는,바이러스 기반 변색 센서에 의한 농작물의 원산지 판별 방법.
- 제2항에 있어서,상기 샘플 색변화 값은 샘플 색공간 요소 값들 중에서 다변량 분석(multivariate analysis)에 따라 원산지 구분 정도가 큰 것으로 선정된 샘플 색공간 요소 값이고,상기 분석용 색변화 값은 원산지 구분 정도가 큰 것으로 선정된 샘플 색공간 요소와 동일한 색공간 요소에 해당하는 분석용 색공간 요소 값인 것을 특징으로 하는,바이러스 기반 변색 센서에 의한 농작물의 원산지 판별 방법.
- 제3항에 있어서,상기 다변량 분석은 주성분 분석(Principal component analysis, PCA) 방법에 의한 것을 특징으로 하는,바이러스 기반 변색 센서에 의한 농작물의 원산지 판별 방법.
- 제1항에 있어서,상기 변색 센서는 서로 다른 컬러를 나타내는 적어도 2개 이상의 영역들을 포함하고,상기 샘플 색변화 값과 상기 분석용 색변화 값 각각에서 색변화 값은상기 변색 센서의 영역별로 나타나는 색변화 값들을 포함하는 것을 특징으로 하는,바이러스 기반 변색 센서에 의한 농작물의 원산지 판별 방법.
- 제5항에 있어서,상기 변색 센서의 영역별로 나타나는 색변화 값들 각각은 색상코드 데이터의 색공간 요소 값을 포함하고,상기 색상코드 데이터는 RGB 방식, CMYK 방식, CMY 방식 및 HSV 방식 중 어느 하나의 컬러 모델에 따라 결정되고, 상기 색공간 요소 값은 컬러 모델의 색공간 요소에 대응하는 값이며,상기 유사도는 샘플 색공간 요소 값과 분석용 색공간 요소 값 간의 차이인 것을 특징으로 하는,바이러스 기반 변색 센서에 의한 농작물의 원산지 판별 방법.
- 제6항에 있어서,상기 샘플 색변화 값은 상기 변색 센서의 영역별 샘플 색공간 요소 값들 중에서 다변량 분석(multivariate analysis)에 따라 원산지 구분 정도가 큰 것으로 선정된 샘플 색공간 요소 값이고,상기 분석용 색변화 값은 상기 변색 센서의 영역별 분석용 색공간 요소 값들 중에서 원산지 구분 정도가 큰 것으로 선정된 샘플 색공간 요소와 동일한 색공간 요소에 해당하는 분석용 색공간 요소 값인 것을 특징으로 하는,바이러스 기반 변색 센서에 의한 농작물의 원산지 판별 방법.
- 제1항에 있어서,상기 M13 박테리오파지는 그 표면에 아미노산 서열 WHWQ를 포함하는 단백질이 발현된 것을 특징으로 하는,바이러스 기반 변색 센서에 의한 농작물의 원산지 판별 방법.
- 제1항에 있어서,상기 분석용 색변화 값을 얻는 단계는분석용 농작물을 가열하여 분석용 농작물이 방출하는 증기에 변색 센서를 노출시키는 단계;분석용 농작물에 의해 변화한 변색 센서의 이미지를 얻는 단계; 및상기 이미지를 이용하여 상기 변화 센서에 대한 변화색과 변색 센서의 고유색 간의 분석용 색변화 값을 도출하는 단계를 포함하는 것을 특징으로 하는,바이러스 기반 변색 센서에 의한 농작물의 원산지 판별 방법.
- 제1항에 있어서,농작물은 고춧가루, 양파, 들깨 또는 참깨인 것을 특징으로 하는,바이러스 기반 변색 센서에 의한 농작물의 원산지 판별 방법.
- M13 박테리오파지들이 형성하는 나노섬유다발이 베이스 기재 상에 배열된 바이러스 기반 변색 센서가 구비된 센싱부;상기 센싱부와 연결되고, 분석용 농작물이 제공되는 시료부;상기 센싱부와 연결되어 상기 분석용 농작물에 포함된 성분에 노출된 변색 센서에 대한 이미지를 얻는 이미지 획득부; 및상기 변색 센서와 동일한 센서에 원산지별 샘플 농작물에 포함된 성분에 노출되어 변화된 변화색과 변색 센서의 고유색 간의 샘플 색변화 값이 저장되고, 상기 샘플 색변화 값을 얻는 방법과 동일하게 상기 분석용 농작물의 분석용 색변화 값을 얻어 상기 샘플 색변화 값에 대한 상기 분석용 색변화 값의 유사도에 따라 상기 분석용 농작물의 원산지를 판별하는 판단부를 포함하는,바이러스 기반 변색 센서에 의한 농작물의 원산지 판별 장치.
- 제11항에 있어서,상기 시료부는 상기 분석용 농작물을 가열하기 위한 가열부를 포함하는 것을 특징으로 하는,바이러스 기반 변색 센서에 의한 농작물의 원산지 판별 장치.
- 제11항에 있어서,상기 샘플 색변화 값과 상기 분석용 색변화 값 각각에서, 색변화 값은 색상코드 데이터의 색공간 요소 값을 포함하고,상기 색상코드 데이터는 RGB 방식, CMYK 방식, CMY 방식 및 HSV 방식 중 어느 하나의 컬러 모델에 따라 결정되고, 상기 색공간 요소 값은 컬러 모델의 색공간 요소에 대응하는 값이며,상기 샘플 색변화 값은 샘플 색공간 요소 값들 중에서 다변량 분석(multivariate analysis)에 따라 원산지 구분 정도가 큰 것으로 선정된 샘플 색공간 요소 값이고,상기 분석용 색변화 값은 원산지 구분 정도가 큰 것으로 선정된 샘플 색공간 요소와 동일한 색공간 요소에 해당하는 분석용 색공간 요소 값이고,상기 유사도는 샘플 색공간 요소 값과 분석용 색공간 요소 값 간의 차이인 것을 특징으로 하는,바이러스 기반 변색 센서에 의한 농작물의 원산지 판별 장치.
- 제11항에 있어서,상기 변색 센서는 적어도 2 이상으로 구분된 영역들을 포함하고, 상기 영역들 각각에 배치된 섬유밴드는 나노섬유다발의 굵기가 서로 다르고,상기 샘플 색변화 값과 상기 분석용 색변화 값 각각에서 색변화 값은 상기 변색 센서의 영역별로 나타나는 색변화 값들을 포함하되, 상기 변색 센서의 영역별로 나타나는 색변화 값들 각각은 색상코드 데이터의 색공간 요소 값을 포함하고,상기 색상코드 데이터는 RGB 방식, CMYK 방식, CMY 방식 및 HSV 방식 중 어느 하나의 컬러 모델에 따라 결정되고, 상기 색공간 요소 값은 컬러 모델의 색공간 요소에 대응하는 값이며,상기 샘플 색변화 값은 상기 변색 센서의 영역별 샘플 색공간 요소 값들 중에서 다변량 분석(multivariate analysis)에 따라 원산지 구분 정도가 큰 것으로 선정된 샘플 색공간 요소 값이고,상기 분석용 색변화 값은 상기 변색 센서의 영역별 분석용 색공간 요소 값들 중에서 원산지 구분 정도가 큰 것으로 선정된 샘플 색공간 요소와 동일한 색공간 요소에 해당하는 분석용 색공간 요소 값이며,상기 유사도는 샘플 색공간 요소 값과 분석용 색공간 요소 값 간의 차이인 것을 특징으로 하는,바이러스 기반 변색 센서에 의한 농작물의 원산지 판별 장치.
Applications Claiming Priority (4)
| Application Number | Priority Date | Filing Date | Title |
|---|---|---|---|
| KR10-2015-0105529 | 2015-07-27 | ||
| KR20150105529 | 2015-07-27 | ||
| KR1020160094584A KR101825821B1 (ko) | 2015-07-27 | 2016-07-26 | 바이러스 기반 변색 센서에 의한 농작물의 원산지 판별 방법 및 바이러스 기반 변색 센서를 포함하는 농작물의 원산지 판별 장치 |
| KR10-2016-0094584 | 2016-07-26 |
Publications (1)
| Publication Number | Publication Date |
|---|---|
| WO2017018796A1 true WO2017018796A1 (ko) | 2017-02-02 |
Family
ID=57884932
Family Applications (1)
| Application Number | Title | Priority Date | Filing Date |
|---|---|---|---|
| PCT/KR2016/008196 Ceased WO2017018796A1 (ko) | 2015-07-27 | 2016-07-27 | 바이러스 기반 변색 센서에 의한 농작물의 원산지 판별 방법 및 바이러스 기반 변색 센서를 포함하는 농작물의 원산지 판별 장치 |
Country Status (1)
| Country | Link |
|---|---|
| WO (1) | WO2017018796A1 (ko) |
Cited By (3)
| Publication number | Priority date | Publication date | Assignee | Title |
|---|---|---|---|---|
| CN110222633A (zh) * | 2019-06-04 | 2019-09-10 | 北京工业大学 | 基于火焰图像颜色特征提取的城市固废焚烧过程燃烧工况识别方法 |
| CN115112641A (zh) * | 2021-03-18 | 2022-09-27 | 三星显示有限公司 | 显示装置 |
| WO2024053903A1 (ko) * | 2022-09-07 | 2024-03-14 | 주식회사 젠라이프 | 폐암 진단용 전자코 센서 및 이를 이용한 폐암 진단용 전자코 시스템 |
Citations (3)
| Publication number | Priority date | Publication date | Assignee | Title |
|---|---|---|---|---|
| KR20090107904A (ko) * | 2008-04-10 | 2009-10-14 | 한양대학교 산학협력단 | 농작물 역병 감염에 대한 진단 탐침으로서의 펩타이드를 스크리닝하는 방법, 및 이로부터 얻어진 신규한 펩타이드 |
| KR20100107648A (ko) * | 2009-03-26 | 2010-10-06 | 한양대학교 산학협력단 | 표면증강 라만 산란 복합 프로브 및 이를 이용하여 표적 물질을 검출하는 방법 |
| KR20130127365A (ko) * | 2012-05-14 | 2013-11-22 | 서울대학교산학협력단 | 나노프로브 및 이를 이용한 표적 물질 검출방법 |
-
2016
- 2016-07-27 WO PCT/KR2016/008196 patent/WO2017018796A1/ko not_active Ceased
Patent Citations (3)
| Publication number | Priority date | Publication date | Assignee | Title |
|---|---|---|---|---|
| KR20090107904A (ko) * | 2008-04-10 | 2009-10-14 | 한양대학교 산학협력단 | 농작물 역병 감염에 대한 진단 탐침으로서의 펩타이드를 스크리닝하는 방법, 및 이로부터 얻어진 신규한 펩타이드 |
| KR20100107648A (ko) * | 2009-03-26 | 2010-10-06 | 한양대학교 산학협력단 | 표면증강 라만 산란 복합 프로브 및 이를 이용하여 표적 물질을 검출하는 방법 |
| KR20130127365A (ko) * | 2012-05-14 | 2013-11-22 | 서울대학교산학협력단 | 나노프로브 및 이를 이용한 표적 물질 검출방법 |
Non-Patent Citations (2)
| Title |
|---|
| KIM, CHUN TAE ET AL.: "Understanding and Applications of M13 Bacteriophage Based Self-Assembly Structures", POLYMER SCIENCE AND TECHNOLOGY, vol. 25, no. 4, August 2014 (2014-08-01) * |
| OH, JIN WOO ET AL.: "Biomimetic Virus-Based Colourimetric Sensors", NATURE COMMUNICATIONS, 21 January 2014 (2014-01-21), XP055349614 * |
Cited By (4)
| Publication number | Priority date | Publication date | Assignee | Title |
|---|---|---|---|---|
| CN110222633A (zh) * | 2019-06-04 | 2019-09-10 | 北京工业大学 | 基于火焰图像颜色特征提取的城市固废焚烧过程燃烧工况识别方法 |
| CN110222633B (zh) * | 2019-06-04 | 2021-04-27 | 北京工业大学 | 基于火焰图像颜色特征提取的城市固废焚烧过程燃烧工况识别方法 |
| CN115112641A (zh) * | 2021-03-18 | 2022-09-27 | 三星显示有限公司 | 显示装置 |
| WO2024053903A1 (ko) * | 2022-09-07 | 2024-03-14 | 주식회사 젠라이프 | 폐암 진단용 전자코 센서 및 이를 이용한 폐암 진단용 전자코 시스템 |
Similar Documents
| Publication | Publication Date | Title |
|---|---|---|
| Zhang et al. | Tongue color analysis for medical application | |
| Villafuerte et al. | Digital imaging for colour measurement in ecological research | |
| Stevens et al. | Using digital photography to study animal coloration | |
| Ristivojević et al. | Pattern recognition methods and multivariate image analysis in HPTLC fingerprinting of propolis extracts | |
| Cao et al. | Spectral reflectance reconstruction from RGB images based on weighting smaller color difference group | |
| WO2003029811A1 (en) | Assessing colour fastiness | |
| WO2011028000A2 (ko) | 카메라를 이용한 검체 정량 측정 기기, 방법 및 시스템 | |
| WO2017018796A1 (ko) | 바이러스 기반 변색 센서에 의한 농작물의 원산지 판별 방법 및 바이러스 기반 변색 센서를 포함하는 농작물의 원산지 판별 장치 | |
| WO2010011026A2 (ko) | 이미지를 이용한 검색 시스템 | |
| WO2016043397A1 (ko) | 초분광영상화 기법을 이용한 글라스 결함 검출 방법 및 장치 | |
| US8817123B2 (en) | Method for authenticating a charge-coupled device (CCD) | |
| CN112033542A (zh) | 亮度色度测量方法、装置、设备及可读存储介质 | |
| Dayrell et al. | Automated extraction of seed morphological traits from images | |
| Wang et al. | Optimized light source spectral power distribution for RGB camera based spectral reflectance recovery | |
| WO2019066296A1 (ko) | 전자 장치 및 그 제어 방법 | |
| Ornés et al. | A standardized method for quantifying eggshell spot patterns | |
| CN111886492B (zh) | 用于翡翠的颜色分级工艺及系统 | |
| US20070014460A1 (en) | Method and apparatus for detecting various cell types of cells in a biological sample | |
| KR101825821B1 (ko) | 바이러스 기반 변색 센서에 의한 농작물의 원산지 판별 방법 및 바이러스 기반 변색 센서를 포함하는 농작물의 원산지 판별 장치 | |
| KR101901812B1 (ko) | 전자눈 분석을 이용한 쌀 신곡과 구곡의 판별 방법 | |
| WO2019093741A1 (ko) | 미세조류 이미지분석 프로그램이 탑재된 생태독성평가 분석장치 및 그 방법 | |
| Le Moan et al. | A database for spectral image quality | |
| Saafin et al. | Pre-processing techniques for colour digital pathology image analysis | |
| US10229495B2 (en) | Method for unsupervised stain separation in pathological whole slide images | |
| JPH06288936A (ja) | 異物検査方法 |
Legal Events
| Date | Code | Title | Description |
|---|---|---|---|
| 121 | Ep: the epo has been informed by wipo that ep was designated in this application |
Ref document number: 16830829 Country of ref document: EP Kind code of ref document: A1 |
|
| NENP | Non-entry into the national phase |
Ref country code: DE |
|
| 122 | Ep: pct application non-entry in european phase |
Ref document number: 16830829 Country of ref document: EP Kind code of ref document: A1 |