WO2016189791A1 - 表示装置、情報処理システム及び制御方法 - Google Patents
表示装置、情報処理システム及び制御方法 Download PDFInfo
- Publication number
- WO2016189791A1 WO2016189791A1 PCT/JP2016/001912 JP2016001912W WO2016189791A1 WO 2016189791 A1 WO2016189791 A1 WO 2016189791A1 JP 2016001912 W JP2016001912 W JP 2016001912W WO 2016189791 A1 WO2016189791 A1 WO 2016189791A1
- Authority
- WO
- WIPO (PCT)
- Prior art keywords
- display
- distribution
- objects
- display device
- distribution display
- Prior art date
- Legal status (The legal status is an assumption and is not a legal conclusion. Google has not performed a legal analysis and makes no representation as to the accuracy of the status listed.)
- Ceased
Links
Images


Classifications
-
- G—PHYSICS
- G06—COMPUTING OR CALCULATING; COUNTING
- G06F—ELECTRIC DIGITAL DATA PROCESSING
- G06F3/00—Input arrangements for transferring data to be processed into a form capable of being handled by the computer; Output arrangements for transferring data from processing unit to output unit, e.g. interface arrangements
- G06F3/01—Input arrangements or combined input and output arrangements for interaction between user and computer
- G06F3/048—Interaction techniques based on graphical user interfaces [GUI]
- G06F3/0481—Interaction techniques based on graphical user interfaces [GUI] based on specific properties of the displayed interaction object or a metaphor-based environment, e.g. interaction with desktop elements like windows or icons, or assisted by a cursor's changing behaviour or appearance
-
- A—HUMAN NECESSITIES
- A63—SPORTS; GAMES; AMUSEMENTS
- A63F—CARD, BOARD, OR ROULETTE GAMES; INDOOR GAMES USING SMALL MOVING PLAYING BODIES; VIDEO GAMES; GAMES NOT OTHERWISE PROVIDED FOR
- A63F13/00—Video games, i.e. games using an electronically generated display having two or more dimensions
- A63F13/50—Controlling the output signals based on the game progress
- A63F13/52—Controlling the output signals based on the game progress involving aspects of the displayed game scene
- A63F13/525—Changing parameters of virtual cameras
-
- G—PHYSICS
- G06—COMPUTING OR CALCULATING; COUNTING
- G06F—ELECTRIC DIGITAL DATA PROCESSING
- G06F3/00—Input arrangements for transferring data to be processed into a form capable of being handled by the computer; Output arrangements for transferring data from processing unit to output unit, e.g. interface arrangements
- G06F3/01—Input arrangements or combined input and output arrangements for interaction between user and computer
- G06F3/011—Arrangements for interaction with the human body, e.g. for user immersion in virtual reality
- G06F3/012—Head tracking input arrangements
-
- G—PHYSICS
- G06—COMPUTING OR CALCULATING; COUNTING
- G06T—IMAGE DATA PROCESSING OR GENERATION, IN GENERAL
- G06T19/00—Manipulating 3D models or images for computer graphics
-
- G—PHYSICS
- G06—COMPUTING OR CALCULATING; COUNTING
- G06T—IMAGE DATA PROCESSING OR GENERATION, IN GENERAL
- G06T19/00—Manipulating 3D models or images for computer graphics
- G06T19/006—Mixed reality
-
- G—PHYSICS
- G06—COMPUTING OR CALCULATING; COUNTING
- G06T—IMAGE DATA PROCESSING OR GENERATION, IN GENERAL
- G06T7/00—Image analysis
- G06T7/70—Determining position or orientation of objects or cameras
-
- G—PHYSICS
- G02—OPTICS
- G02B—OPTICAL ELEMENTS, SYSTEMS OR APPARATUS
- G02B27/00—Optical systems or apparatus not provided for by any of the groups G02B1/00 - G02B26/00, G02B30/00
- G02B27/01—Head-up displays
- G02B27/0101—Head-up displays characterised by optical features
- G02B2027/0123—Head-up displays characterised by optical features comprising devices increasing the field of view
-
- G—PHYSICS
- G02—OPTICS
- G02B—OPTICAL ELEMENTS, SYSTEMS OR APPARATUS
- G02B27/00—Optical systems or apparatus not provided for by any of the groups G02B1/00 - G02B26/00, G02B30/00
- G02B27/01—Head-up displays
- G02B27/0101—Head-up displays characterised by optical features
- G02B2027/014—Head-up displays characterised by optical features comprising information/image processing systems
Definitions
- the present technology relates to a display device capable of grouping and displaying a plurality of images displayed in the field of view, an information processing system using the display device, and a control method.
- AR augmented reality
- Patent Document 1 is configured to display additional information of an object whose hierarchical information is the highest hierarchy among a plurality of objects in an image, or to display additional information according to the priority of the object. An information processing apparatus is described.
- an object of the present technology is to provide a display device capable of providing simple and highly visible information on a plurality of objects, an information processing system using the display device, and a control method.
- a display device includes a control unit and a display unit.
- the control unit groups a plurality of objects distributed in a real space or a virtual space around the user, and generates a distribution display that displays a region in which the plurality of grouped objects are distributed.
- the display unit presents the distribution display in the field of view of the user.
- the distribution display can represent the distribution of a plurality of grouped objects. Therefore, it is possible to provide simple and highly visible information about a plurality of objects.
- the control unit may generate the distribution display near a region where the plurality of grouped objects are distributed. Thereby, the area where the object is distributed can be expressed by the arrangement of the distribution display.
- the control unit may generate the distribution display having a shape related to a shape of a region in which the plurality of grouped objects are distributed. Thereby, the area where the object is distributed can be expressed by the shape of the distribution display.
- control unit may generate the distribution display having a shape representing the distribution bias of the plurality of objects. Thereby, it is possible to express the uneven distribution of the object by the shape of the distribution display.
- the control unit may generate the distribution display having transparency that allows the plurality of objects to be visually recognized. Accordingly, the plurality of objects can be visually recognized, and visibility in the visual field can be improved.
- the control unit may generate the distribution display so as to change at least one of hue, lightness, and saturation based on the density of the plurality of grouped objects. For example, the control unit may generate the distribution display having a color tone with a higher brightness or a color tone with a lower brightness in a region where the density of the plurality of grouped objects is higher. Thereby, the distribution display can express the density of a plurality of objects.
- control unit may generate the distribution display using a probability density function having a variable indicating coordinates indicating positions in the visual field of each of the plurality of grouped objects.
- the probability density function may be a Gaussian function. Thereby, the distribution of the object can be accurately expressed.
- control unit derives the probability density function and superimposes it on the region in the field of view where the distribution probability of the object becomes a predetermined value when the derived probability density function is integrated with the variable.
- the distribution display may be generated. Thereby, the distribution of the object can be expressed more accurately in consideration of the distribution probability of the object.
- the control unit may group a plurality of objects having related additional information among a plurality of objects distributed in the field of view. Thereby, a distribution display for an object having additional information such as a related attribute can be generated.
- the control unit may group a plurality of objects having a density equal to or higher than a predetermined reference among the plurality of objects distributed in the visual field. As a result, it is possible to prevent the AR icons and the like from being overly arranged.
- control unit A first mode for executing a drawing process on a group including the plurality of objects;
- the second mode for executing the drawing process on each of the grouped objects may be switched. Thereby, detailed information can be provided for each object as necessary.
- the control unit When it is determined that the density of the grouped objects in the field of view is equal to or higher than a predetermined reference, the first mode may be selected. As a result, it is possible to prevent the AR icons and the like from being overly arranged.
- the control unit may be configured to switch from the first mode to the second mode when it is determined that the user is gazing at the distribution display. For example, the control unit may determine that the user is gazing at the distribution display when it is determined that the distribution display is displayed at the center of the visual field. Thereby, based on a user's intention, detailed information about each grouped object can be provided.
- the control unit may reduce the distribution display to the predetermined ratio or less when determining that the ratio of the area occupied by the distribution display in the visual field is larger than the predetermined ratio. Thereby, a highly visible distribution display having a shape corresponding to the size of the visual field can be presented.
- the display unit may be configured to be attachable to a user.
- a display apparatus can be comprised as a wearable display.
- An information processing system includes a control device and a display device.
- the control device is configured to store information about a plurality of objects distributed in a real space or a virtual space around the user and to output information about the plurality of objects.
- the display device includes a control unit and a display unit.
- the control unit groups the plurality of objects, and generates a distribution display for displaying a region where the plurality of grouped objects are distributed.
- the display unit presents the distribution display in the field of view of the user.
- a control method includes a step of grouping a plurality of objects distributed in a real space or a virtual space around the user; Generating a distribution display for displaying a region in which the plurality of grouped objects are distributed; Presenting the distribution display in the user's field of view.
- the present technology it is possible to provide a display device capable of providing simple and highly visible information on a plurality of objects, an information processing system using the display device, and a control method.
- the effects described here are not necessarily limited, and may be any of the effects described in the present disclosure.
- FIG. 1 is a schematic diagram illustrating a configuration of an AR system (information processing system) according to a first embodiment of the present technology. It is a figure which shows the example of the visual field of HMD (display apparatus) of the said AR system. It is a block diagram which shows the structure of the said AR system. It is a block diagram of HMD for demonstrating the functional structure of the said HMD controller. It is a schematic diagram explaining cylindrical coordinates and a visual field. It is a development view of cylindrical coordinates showing a field of view on the cylindrical coordinates. It is a figure explaining the conversion method from a cylindrical coordinate to a visual field (local coordinate). It is a flowchart which shows the flow of the process in the said AR system.
- FIG. 1 It is a flowchart which shows the flow of the drawing process of the distribution display and AR icon shown in FIG. It is a figure which shows the visual field before drawing process execution. It is a figure which shows the visual field by which the drawing process was performed in 1st mode. It is a figure which shows the visual field by which the drawing process was performed in 2nd mode. It is a graph which shows the example of a Gaussian function, a vertical axis
- FIG. 1 is a schematic diagram illustrating a configuration of an AR system (information processing system) according to the first embodiment of the present technology.
- the X-axis direction and the Z-axis direction indicate horizontal directions orthogonal to each other
- the Y-axis direction indicates the vertical axis direction.
- These XYZ orthogonal coordinate systems represent the coordinate system of the real space to which the user belongs
- the X-axis arrow indicates the right direction viewed from the user
- the Y-axis arrow indicates the downward direction viewed from the user.
- An arrow on the Z axis indicates the forward direction as viewed from the user.
- the AR system 100 includes a head mounted display (HMD) 10, a portable information terminal 30, and an AR server 40.
- the AR server 40 is a server device on the Internet 50.
- the AR server 40 stores information related to objects to be described later, and functions as a “control device” in the present embodiment.
- the portable information terminal 30 is typically a smartphone, but is configured by an information processing apparatus such as a mobile phone, a tablet terminal, a personal computer (PC), a tablet PC, or a PDA (Personal Digital Assistant).
- the portable information terminal 30 can acquire the current position of the user by a GPS (Global Positioning System) function.
- the portable information terminal 30 is connected to the AR server 40 via the Internet 50, and can acquire information related to the AR display processing and the like from the AR server 40.
- the portable information terminal 30 is connected to the controller 20 by a short-range wireless communication system such as Bluetooth (registered trademark), and can transmit information related to the AR display processing and the like and information related to the current position of the user to the controller 20.
- the HMD 10 includes a display unit 11 configured as a see-through display having a glasses shape, and a controller 20, and functions as a “display device” in the present embodiment.
- HMD10 of FIG. 1 has shown the shape typically.
- the controller 20 controls the operation of the HMD 10 based on an input operation by the user.
- the controller 20 is connected to the display unit 11 by a cable corresponding to a predetermined standard, and executes processing based on information acquired from the portable information terminal 30.
- the HMD 10 can provide a user wearing the HMD 10 with a field of view in which an image associated therewith is superimposed on an object distributed in the real space via a see-through display.
- an image related to an object is referred to as an AR icon.
- the “object distributed in the real space” here may be an object that exists in the real space, or a virtual object that does not exist in the real space and is displayed so as to be superimposed on the real space. It may be.
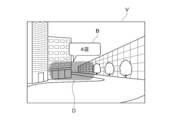
- FIG. 2 is a diagram illustrating an example of the field of view V of the HMD 10.
- the field of view V is formed on a see-through display.
- two buildings existing in the real space are transparently displayed, and two stores included in one building and two stores included in another building are objects.
- an AR icon B indicating additional information can be displayed superimposed on an object existing in the real space.
- the distribution display D has a shape related to the shape of a region where a plurality of grouped objects are distributed, and is displayed near these distributed regions. Further, the AR icon B is not displayed for each object, but for example, one AR icon B is displayed for the group. Thus, according to the distribution display D, the distribution of a plurality of objects is presented intuitively.
- FIG. 3 is a block diagram showing the configuration of the AR system 100. Hereinafter, each element of the AR system 100 will be described with reference to FIG.
- the AR server 40 includes a CPU 401, a memory 402, and a network communication unit 403.
- the AR server 40 is configured to store information on a plurality of objects distributed in a real space around the user and to output information on the plurality of objects.
- the AR server 40 may have a configuration such as an input device, a display device, and a speaker as necessary.
- the CPU 401 controls the overall operation of the AR server 40.
- the memory 402 includes nonvolatile memories such as a ROM (Read Only Memory) and a RAM (Random Access Memory), an HDD (Hard Disk Drive), and a flash memory (SSD; Solid State Drive). Stores programs for executing control, various parameters, and other necessary data.
- the network communication unit 403 communicates with the portable information terminal 30 via the Internet 50.
- the communication method is not particularly limited, and may be wired communication using a NIC (Network Interface Card) for Ethernet (registered trademark), wireless LAN (IEEE802.11, etc.) such as WiFi (Wireless Fidelity), or mobile Wireless communication using a 3G or 4G network for communication may be used.
- NIC Network Interface Card
- IEEE802.11, etc. such as WiFi (Wireless Fidelity)
- mobile Wireless communication using a 3G or 4G network for communication may be used.
- the memory 402 also holds an object database 404.
- the object database 404 stores information such as object attributes, object positions, and the like for each object.
- the object database 404 may be a collection of databases including objects having the same attribute.
- information on new objects is additionally registered as appropriate by the portable information terminal 30 connected to the AR server 40 via the Internet 50, another portable information terminal, an information processing apparatus, or the like.
- the portable information terminal 30 includes a CPU 301, a memory 302, a network communication unit 303, a short-range communication unit 304, a GPS communication unit 305, a display unit 306 on which a touch panel is mounted, And a power source 307.
- the CPU 301 controls the operation of the mobile information terminal 30 as a whole.
- the memory 302 includes a ROM, a RAM, a non-volatile memory, and the like, and stores application programs and various parameters for executing control of the portable information terminal 30 by the CPU 301, object information transmitted to the controller 20, and other necessary data.
- the network communication unit 303 communicates with the AR server 40 or the like using a wireless LAN (IEEE802.11 or the like) such as WiFi (Wireless Fidelity) or a 3G or 4G network for mobile communication.
- the portable information terminal 30 downloads information on an object to be transmitted to the controller 20 from the AR server 40 via the network communication unit 303 and stores it in the memory 302.
- the near field communication unit 304 communicates with the controller 20 and other portable information terminals using a near field communication system such as Bluetooth (registered trademark) and infrared communication.
- the GPS communication unit 305 acquires the current position of the user carrying the portable information terminal 30 by receiving a signal from a GPS satellite.
- the display unit 306 includes, for example, an LCD (Liquid Crystal Display) or an OELD (Organic ElectroLuminescence Display), and displays various menus, GUIs of applications, and the like.
- the display unit 306 is equipped with a touch panel and can accept a user's touch operation.
- the internal power supply 307 supplies power necessary for driving the portable information terminal 30.
- the HMD 10 includes a display unit 11, a detection unit 12, and a controller 20.
- the display unit 11 is configured to be able to present a distribution display in the user's visual field, and is configured to be worn on the user's head.
- the display unit 11 presents a real space that is transmitted from the visual field and displays an AR icon in a superimposed manner in the real space.
- the display unit 11 includes first and second display surfaces 111R and 111L, first and second image generation units 112R and 112L, and a support body 113.
- the 1st and 2nd display surfaces 111R and 111L are comprised with the optical element which has transparency which can provide real space (external field visual field) to the right eye and left eye of the user U, respectively.
- the first and second image generation units 112R and 112L are configured to be able to generate images to be presented to the user U via the first and second display surfaces 111R and 111L, respectively.
- the support 113 supports the display surfaces 111R and 111L and the image generation units 112R and 112L, and the user's head so that the first and second display surfaces 111R and 111L face the right eye and the left eye of the user U, respectively. It has an appropriate shape that can be attached to the part.
- the display unit 11 configured as described above can provide the user U with a field of view V in which a predetermined image (or virtual image) is superimposed on the real space via the display surfaces 111R and 111L. Is done.
- the detection unit 12 can detect a change in posture of the display unit 11.
- the detection unit 12 is configured to detect posture changes around the X, Y, and Z axes.
- the detection part 12 can be comprised by motion sensors, such as an angular velocity sensor and an acceleration sensor, or these combination.
- the detection unit 12 may be configured by a sensor unit in which each of the angular velocity sensor and the acceleration sensor is arranged in the three-axis direction, or a sensor to be used may be different depending on each axis.
- an integrated value of the output of the angular velocity sensor can be used as the posture change of the display unit 11, the direction of the change, the amount of the change, and the like.
- a geomagnetic sensor may be employed for detecting the orientation of the display unit 11 around the vertical axis (Z axis).
- the geomagnetic sensor and the motion sensor may be combined. Thereby, it is possible to detect a change in orientation or posture with high accuracy.
- the detection unit 12 is disposed at an appropriate position on the display unit 11.
- the position of the detection unit 12 is not particularly limited.
- the detection unit 12 may be arranged in one of the image generation units 112R and 112L or may be arranged in a part of the support 113.
- the controller 20 functions as a control unit of the HMD 10 and groups a plurality of objects distributed in the real space or virtual space around the user to generate a distribution display.
- the controller 20 includes a CPU 201, a memory 202, a communication unit 203, an input operation unit 204, and an internal power source 205.
- the CPU 201 controls the operation of the entire controller 20.
- the memory 202 includes a ROM, a RAM, and the like, and stores a program for executing control of the controller 20 by the CPU 201, various parameters, object information, and other necessary data.
- the communication unit 203 constitutes an interface for short-range communication with the portable information terminal 30.
- the input operation unit 204 is for controlling an image displayed on the HMD 10 by a user operation.
- the input operation unit 204 can be composed of a mechanical switch and / or a touch sensor.
- the internal power supply 205 supplies power necessary for driving the HMD 10.
- the HMD 10 may further include a sound output unit such as a speaker, a camera, and the like.
- the audio output unit and the camera are typically provided in the display unit 11.
- the controller 20 may be provided with a display device that displays an input operation screen or the like of the display unit 11.
- the input operation unit 204 may be configured with a touch panel provided in the display device.
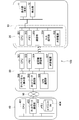
- FIG. 4 is a block diagram of the HMD 10 for explaining the functional configuration of the controller.
- the controller 20 includes a field of view setting unit 21, an object information management unit 22, an object extraction unit 23, an object distribution calculation unit 24, a group management unit 25, a mode switching unit 26, and a distribution.
- a display generation unit 27 and an AR icon display processing unit 28 are included.
- Each of these elements is mainly executed by the CPU 201 in accordance with an application program stored in the memory 202. Hereinafter, each element will be described.
- the visual field setting unit 21 sets a visual field range based on the attitude of the display unit 11 calculated from the detection result of the detection unit 12.
- the setting of the visual field range by the visual field setting unit 21 uses a virtual cylindrical coordinate C0 centering on the vertical axis Az and surrounding the user U.
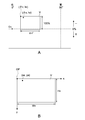
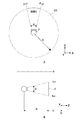
- FIG. 5 is a schematic diagram illustrating the cylindrical coordinates C0 and the field of view V.
- the cylindrical coordinate C0 has a vertical axis Az at the position of the user U (display unit 11), and a virtual peripheral surface disposed at a position of a distance (radius) R from the vertical axis Az.
- the cylindrical coordinate C0 is a height in the height direction that represents a vertical coordinate axis ( ⁇ ) that represents an angle around the vertical axis with the north direction being 0 °, and a horizontal line of sight Lh of the user U. Coordinate axis (h).
- the coordinate axis ( ⁇ ) has a positive direction around the east, and the coordinate axis (h) has a depression angle as a positive direction and an elevation angle as a negative direction.
- the radius R and height H of the cylindrical coordinates C0 can be arbitrarily set.
- the position of the user U that defines the vertical axis Az is defined by the position of the user U acquired by the portable information terminal 30.
- the visual field setting unit 21 calculates the posture change of the display unit 11 based on the output of the detection unit 12, and determines which region on the cylindrical coordinate C0 the user's U visual field V belongs to.
- the region to which the visual field V belongs in the cylindrical coordinate C0 is defined by the ranges of ⁇ and h.
- the visual field V moves on the cylindrical coordinates C0 due to the change in the posture of the user U, and the moving direction and moving amount thereof are calculated based on the output of the detection unit 12.
- FIG. 6 is a development view of the cylindrical coordinates C0 indicating the visual field V on the cylindrical coordinates C0.
- the symbol Oc in the figure indicates the origin of the cylindrical coordinates C0.
- the visual field V has a substantially rectangular shape.
- the range of the visual field V in the circumferential direction is represented by the following formula (1). ⁇ v1 ⁇ ⁇ v ⁇ ⁇ v2 (1)
- the range of the visual field V in the height direction is represented by the following formula (2). hv1 ⁇ hv ⁇ hv2 (2)
- the visual field V has xy coordinates (local coordinates) with the upper left corner as an origin OP.
- the x-axis is an axis extending in the horizontal direction from the origin OP
- the y-axis is an axis extending in the vertical direction from the origin OP. Details will be described later.
- the object information management unit 22 acquires information on a predetermined object from the portable information terminal 30 via the communication unit 203 and manages the acquired object information.
- the object acquisition timing by the object information management unit 22 can be a timing at which it is determined that the current position has changed by a predetermined distance or more, as will be described later.
- the object information management unit 22 can acquire information on a plurality of objects from the object database 404 via the portable information terminal 30.
- the object information includes, for example, information such as an object attribute, an object name, and an object position.
- the information on the position of the object typically includes information on the absolute position (latitude, longitude, etc.) of the object.
- the object extraction unit 23 Based on the processing result of the visual field setting unit 21, the object extraction unit 23 extracts objects distributed in the visual field V among the objects whose information has been acquired.
- the object extraction unit 23 first calculates the coordinates ( ⁇ a, ha) of the object at the cylindrical coordinates C0 based on the absolute position of the object and the current position of the user.
- the current position of the user can be acquired from the portable information terminal 30.
- the object extraction unit 23 can extract objects whose coordinates ( ⁇ a, ha) are included in the range of the field of view V within the cylindrical coordinates C0 (the ranges of the formulas (1) and (2)).
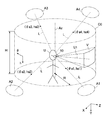
- the coordinates ( ⁇ a, ha) in the cylindrical coordinates C0 of the object will be described.
- the objects A1 to A4 exist in the real space, and typically exist at positions farther from the user U than the radius R of the cylindrical coordinates C0. Therefore, the positions of the objects A1 to A4 in the cylindrical coordinates C0 can be defined by the intersection positions of the user's eye line L watching the objects A1 to A4 and the cylindrical coordinates C0 as shown in FIG.
- the positions of the objects A1 to A4 in the cylindrical coordinate C0 are represented by coordinates ( ⁇ a, ha) on the cylindrical coordinate C0.
- the center position of each of the objects A1 to A4 is made to coincide with the intersection position, but this is not restrictive, and a part of the periphery of the object (for example, part of the four corners) is made to coincide with the intersection position. May be.
- the positions of the objects A1 to A4 may be associated with any position away from the intersection position.
- the object distribution calculation unit 24 calculates the distribution of the extracted object.
- the object distribution calculation unit 24 executes processing for converting the position ( ⁇ a, ha) of each object determined to be displayed in the field of view V into local coordinates (xa, ya) in the field of view V.
- the distribution of objects can be calculated.
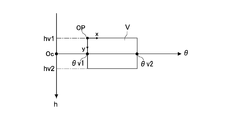
- FIG. 7A and 7B are diagrams illustrating a method for converting the cylindrical coordinates C0 to the visual field V (local coordinates).
- the coordinates of the reference point of the visual field V on the cylindrical coordinates C0 are ( ⁇ v, hv), and the coordinates of the reference point of the object A located in the visual field V are ( ⁇ a, ha).
- the reference point of the field of view V and the object A may be set to any point, and in this example, the reference point is set to the corner portion at the upper left of the field of view V and the object A which are rectangular.
- ⁇ v [°] is the width angle of the visual field V on the cylindrical coordinates, and its value is determined by the design or specification of the display unit 11.
- the object distribution calculation unit 24 determines the position of the object A in the visual field V by converting the cylindrical coordinate system ( ⁇ , h) to the local coordinate system (x, y). As shown in FIG. 7B, if the height and width of the field of view V in the local coordinate system are Hv and Wv, respectively, and the coordinates of the reference point of the object A in the local coordinate system (x, y) are (xa, ya), conversion is performed.
- the formula is as follows.
- the object distribution calculation unit 24 can calculate the coordinates (xa, ya) of each object in the field of view V based on the conversion formula.
- the group management unit 25 groups a plurality of objects distributed in the real space around the user and manages group information.
- the objects to be grouped can be objects distributed in the visual field V direction, for example.
- the group information includes, for example, information such as the number of objects included in the group and common attributes of the objects acquired from the object information management unit 22.
- the group management unit 25 groups a plurality of objects based on a predetermined condition. Examples of the predetermined condition include conditions such as density in the field of view V of a plurality of objects, commonality of object attributes, and the like.
- the group management unit 25 determines that the density in the field of view V of the plurality of grouped objects has decreased below a predetermined reference due to, for example, the user approaching the object, the group management unit 25 reorganizes the group. You can also.
- the mode switching unit 26 can switch between a first mode in which drawing processing is performed on a group including a plurality of objects and a second mode in which drawing processing is performed on each of the grouped objects. Configured.
- the “drawing process for a group” here refers to, for example, a drawing process of a distribution display for the group and a drawing process of an AR icon for displaying additional information of the group.
- “Drawing process corresponding to each of a plurality of objects” indicates, for example, a drawing process of an AR icon that displays additional information of each object.
- the mode switching unit 26 switches between the first mode and the second mode based on a predetermined condition. For example, when it is determined that the user operation corresponding to the mode switching is accepted by the input operation unit 204, the mode switching unit 26 may switch between the first mode and the second mode.
- the distribution display generation unit 27 generates a distribution display for displaying a region where a plurality of grouped objects are distributed.
- the distribution display has a shape related to the shape of a region where a plurality of grouped objects are distributed, and generates a distribution display displayed in the vicinity of these distributed regions.
- the distribution display generation unit 27 can generate a distribution display using a probability density function with coordinates (xa, ya) indicating positions in the field of view of each of a plurality of grouped objects as variables. Details will be described later.
- the distribution display generation unit 27 may generate the distribution display in both the first mode and the second mode, or may generate the distribution display only in the first mode.
- the AR icon display processing unit 28 executes a process of displaying an AR icon that provides additional information on objects distributed in the visual field V.
- the AR icon is an image that displays additional information of the objects A1 to A4, and may be an image including characters, pictures, or an animation image.
- the AR icon may be a two-dimensional image or a three-dimensional image.
- the shape of the AR icon may be rectangular, circular, or other geometric shape, and can be set as appropriate depending on the type of AR icon.
- the AR icon display processing unit 28 displays an AR icon for each of a plurality of grouped objects in the second mode.
- the AR icon display processing unit 28 can display, for example, one AR icon for the group in the first mode.
- the AR icon can display the number of objects belonging to the group, attributes common to a plurality of objects belonging to the group, and the like.
- the AR icon display processing unit 28 can display an AR icon in a predetermined area in the visual field V based on the distribution of the objects. For example, the AR icon display processing unit 28 may display the AR icon at a position separated by a predetermined distance from the position of each object (intersection position between the user's line of sight L and the cylindrical coordinates C0). Alternatively, the AR icon display processing unit 28 may calculate an area occupied by the object or the distribution display and display the AR icon in the vicinity of the area.
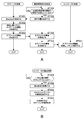
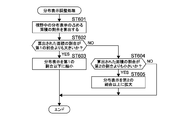
- FIG. 8A is a flowchart showing the flow of object information acquisition processing in the controller 20.
- the controller 20 executes object information acquisition processing when the current position of the user changes by, for example, 50 m or more.
- the processing from ST101 to ST104 is executed by the portable information terminal 30.
- the processing of ST201 to ST203 is executed by the AR server 40
- the processing of ST301 is executed by the controller 20 of the HMD10.
- the CPU 301 of the portable information terminal 30 determines whether or not an acquisition condition for information of an AR display object candidate is satisfied (ST101). Specifically, the CPU 301 may determine whether or not the user's current position has changed by 50 m or more based on the current position information acquired from the GPS communication unit 305. In addition to the above, or in place of the above, the CPU 301 may determine whether or not a notification regarding the state change of the AR display object candidate has been received from the AR server 40. When it is determined that the information acquisition condition for the AR display object candidate is satisfied (Yes in ST101), the network communication unit 303 determines the current position acquired from the GPS communication unit 305 based on the control of the CPU 301 as the AR server 40. (ST102).
- the network communication unit 403 of the AR server 40 receives the current position transmitted from the portable information terminal 30 based on the control of the CPU 401 (ST201). Subsequently, the CPU 401 acquires object information corresponding to the acquired current position from the object database 404 (ST202). Then, based on the control of CPU 401, network communication unit 403 transmits the object information acquired to portable information terminal 30 to portable information terminal 30 (ST203).
- the network communication unit 303 of the portable information terminal 30 acquires the object information transmitted from the AR server 40 based on the control of the CPU 301 (ST103). Subsequently, the short-range communication unit 304 transmits the acquired object information to the controller 20 based on the control of the CPU 301 (ST104).
- the communication unit 203 of the controller 20 receives the object information transmitted from the portable information terminal 30 based on the control of the CPU 201, and the CPU 201 stores the information in the memory 202 (ST301).
- the object information management unit 22 of the controller 202 can acquire information on a plurality of objects included in the object database 404.
- the controller 20 executes drawing processing at a predetermined timing using the acquired object information.
- FIG. 8B is a flowchart showing the flow of the drawing process of the controller.
- the CPU 201 determines whether or not the drawing timing is 1/30 sec. When it is determined that the drawing timing has come (Yes in ST401), the CPU 201 acquires the detection result of the detection unit 12 (ST402). Subsequently, the CPU 201 acquires object information from the memory 202 (ST403). Specifically, the CPU 201 (object information management unit 22) acquires a plurality of objects included in each database shown in ST301 in FIG. 8A. Subsequently, the CPU 201 executes distribution display and AR icon drawing processing in cooperation with the memory 202 (ST404). Thereby, the display unit 11 can output the display result of the drawing process from the visual field V. Details of the distribution display and AR icon drawing processing will be described below.
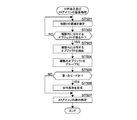
- FIG. 9 is a flowchart showing the flow of the distribution display and AR icon drawing processing of the controller 20.
- the CPU 201 executes processing according to the restaurant search application program stored in the memory 202.
- the visual field setting unit 21 sets the range of the visual field V based on the attitude of the display unit 11 calculated from the detection result of the detection unit 12 (ST501).
- the range of the visual field V is expressed by the above formulas (1) and (2) using the cylindrical coordinates C0.
- the object extraction unit 23 determines whether there is an object distributed in the field of view V based on the processing result of the field of view setting unit 21 (ST502). If it is determined that there is an object (Yes in ST502), Objects distributed in the visual field V are extracted (ST503).
- the object extraction unit 23 determines each object on the cylindrical coordinate C0 based on the current position information acquired by the GPS communication unit 305 and the absolute position of each object as described in FIG. The coordinates ( ⁇ a, ha) are calculated. Then, the object extraction unit 23 determines whether or not there is an object having the coordinates ( ⁇ a, ha) included in the range of the visual field V within the cylindrical coordinates C0 (the ranges of the expressions (1) and (2)) (ST502). If it is determined that there is, all the coordinates ( ⁇ a, ha) of the objects included in this range are extracted (ST503).
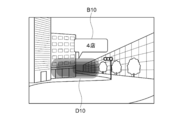
- FIG. 10 is a diagram illustrating the visual field V before the drawing process is executed.
- the object extraction unit 23 extracts a restaurant A11, a restaurant A12, a restaurant A13, a restaurant A14, and a building A21, a building A22, a building A23, and an intersection A31.
- the object distribution calculation unit 24 calculates the distribution of objects distributed in the visual field V (ST503).
- the object distribution calculation unit 24 calculates local coordinates (xa, ya) in the visual field V from the coordinates ( ⁇ a, ha) in the cylindrical coordinates C0 for each extracted object.
- the positions of the objects A11 to A14 in the local coordinates are calculated as local coordinates (xa11, ya11), (xa12, ya12), (xa13, ya13), (xa14, ya14), respectively.
- group management unit 25 groups a plurality of objects distributed in visual field V (ST504).
- the group management unit 25 groups four objects A11 to A14 in the field of view V having related additional information “restaurant” as a group G10.
- the related additional information is an attribute of the object.
- the group management unit 25 does not group the building A21, the building A22, the building A23, and the intersection A31.
- the mode switching unit 26 determines whether or not it is the first mode (ST505).
- the mode switching unit 26 can determine the current mode in consideration of the mode at the start of processing and the presence / absence of an input operation corresponding to mode switching by the user via the input operation unit 204. .
- the distribution display generation unit 27 When it is determined that the mode is the first mode (No in ST505), the distribution display generation unit 27 has a shape related to the shape of the area where the plurality of grouped objects are distributed, and the vicinity of these distributed areas A distribution display to be displayed is generated (ST506). Thereby, the controller 20 controls the display unit 11 to present the distribution display to the user.
- the AR icon display processing unit 28 executes a process of displaying an AR icon for the group G1, the building A21, the building A22, the building A23, and the intersection A31 distributed in the visual field V (ST507).
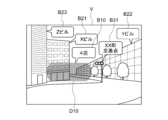
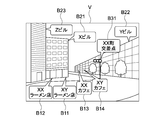
- FIG. 11 is a diagram illustrating the visual field V on which the drawing process has been executed in the first mode.
- a distribution display D10 is superimposed on the grouped objects A11 to A14.
- the AR icon display processing unit 28 calculates the area occupied by the distribution display D10, and displays the AR icon B10 related to the group G10 at a position along the top of the distribution display D10.
- the AR icon B10 may display the number of stores as shown in the figure, or may display attributes common to each object included in the group. Further, although there is no attribute common to all objects, if there is a statistically significant attribute, the attribute may be displayed.
- the AR icon display processing unit 28 displays AR icons B21, B22, B23, B24, and B31 related to the buildings A21, A22, A23, and the intersection A31 at appropriate positions.
- the names of buildings and intersections can be displayed on the AR icons B21, B22, B23, B24, and B31 as shown in FIG.
- the AR icon display processing unit 28 determines that it is in the second mode and displays an AR icon for each of the grouped objects.
- the display process is executed (ST507).
- FIG. 12 is a diagram illustrating the visual field V on which the drawing process has been executed in the second mode.
- the AR icon display processing unit 28 can generate and display AR icons B11, B12, B13, and B14 related to the grouped objects A11 to A14.
- Each of these AR icons B11 to B14 can display the store name of each object, as shown in FIG. Further, the AR icon display processing unit 28 may adjust the position of the AR icon so that the AR icons B11 to B14 do not overlap each other.
- the distribution display can be displayed on the grouped objects in the first mode, and the grouped objects can be broken down and displayed in the second mode. Can be made. Next, detailed generation processing of the distribution display will be described.
- the distribution display generation unit 27 can generate a distribution display using a probability density function with coordinates indicating positions in the field of view of the grouped objects as variables.
- the probability density function can be a Gaussian function.
- FIG. 13 is a graph showing an example of a Gaussian function, where the vertical axis represents x and the horizontal axis represents distribution probability ⁇ (x).
- the Gaussian function shown in the figure is a normal distribution function which is one of Gaussian functions, and is represented by the following formula (5).
- the distribution display generation unit 27 first calculates an average value ⁇ and a standard deviation ⁇ from the values of x (xa11, xa12, xa13, xa14) in local coordinates of the objects A11 to A14.
- the value of ⁇ (xa) is the relative likelihood when xa is a probability density variable. In other words, the virtual density of an object in a minute section including xa is shown.
- the density of the object means a degree indicating the degree of congestion of the object.
- the object density is a concept including the number of objects per unit area (actual density) and the distribution of coordinates indicating the position of the object in the field of view.
- the coordinates of the object are distributed in a discrete manner, and it is not realistic to calculate the actual density. Therefore, in this example, it is assumed that the density of the object is defined by the value of variance ( ⁇ 2 ). Referring to FIG. 13, as ⁇ 2 , that is, the variance is smaller, the curve of the graph becomes steeper, and the value of ⁇ near the average value ⁇ increases. Thus, the graph also shows that the variance correlates with the density.
- the distribution display generation unit 27 similarly derives the normal distribution function ⁇ (y) in the y-axis direction. That is, the distribution display generation unit 27 calculates the average value ⁇ and the standard deviation ⁇ from the y values (ya11, ya12, ya13, ya14) in the local coordinates of the objects A11 to A14, and the normal distribution function ⁇ in the axial direction. (Y) is obtained.
- the distribution display generation unit 27 when each of the derived ⁇ (x) and ⁇ (y) is integrated with a variable, near the region in the field of view where the distribution probability (existence probability) of the object is a predetermined value or more. Generate the distribution display to be displayed.
- the distribution probability of the object can be derived by integrating the probability density function ⁇ (x) in a predetermined range with respect to the variable x. Therefore, the region can be extracted by obtaining the integration ranges [xd1, xd2] and [yd1, yd2] corresponding to a predetermined distribution probability.
- this integration range can be defined as a range such as the following equation (6).
- the distribution display generation unit 27 extracts ranges of variables x and y corresponding to ⁇ (x) and ⁇ (y) that are greater than or equal to a predetermined value, for example. A distribution display displayed near the region in the field of view corresponding to the range may be generated.
- the distribution display is a figure superimposed on the extracted range of x and y.
- the distribution display may be a rectangle, but for example, as shown in the figure, all or a part of the periphery can be constituted by a smooth curve.
- the distribution display generation unit 27 can generate a distribution display having transparency that allows a plurality of objects to be visually recognized. Thereby, it is possible to generate a distribution display expressed like fog or clouds covering the object.
- FIG. 14 is a diagram illustrating another example of the distribution display.
- the distribution display generation unit 27 may change at least one of hue, brightness, and saturation in the distribution display based on the value of ⁇ and the range of the value of k in Expression (6).
- the distribution display can be configured to have a color tone with a high brightness or a color tone with a low brightness in a region where the value of ⁇ is large, that is, a region where the density is high, or the hue changes according to the value of ⁇ . You may let them.
- the distribution display generation unit 27 can generate the distribution display so as to change the color tone based on the density of the plurality of grouped objects.
- the color tone of the distribution display may change stepwise as shown in the figure, or may change continuously.
- FIG. 15 is a diagram showing still another example of the distribution display.
- the distribution display generation unit 27 can generate a distribution display for each group.
- the group G20 includes objects having restaurant attributes
- the group G30 includes objects having convenience store attributes.
- Distribution displays D20 and D30 are superimposed on each of these groups.
- AR icons B10 and B20 are added to the groups G20 and G30.
- FIG. 16 is a diagram showing still another example of the distribution display. Reference numerals A41 to A44 shown in FIG.
- the distribution display generation unit 27 can generate a distribution display D40 having a shape representing the distribution bias of the objects in the group. More specifically, the distribution display generation unit 27 may determine whether there is a small group having a plurality of objects each having a density equal to or higher than a predetermined reference among the plurality of grouped objects.
- a probability density function is derived with the coordinates indicating the position in the field of view of each of the plurality of objects belonging to each small group as variables.
- a distribution display can be generated using a probability density function obtained by summing a plurality of probability density functions.
- the distribution display generation unit 27 has a small group each having a plurality of objects whose variance is equal to or less than a predetermined value among the plurality of grouped objects, as in Modification 1-1 described later. It may be determined whether or not. As a result, as shown in the figure, it is possible to generate a distribution display having a shape that matches the object distribution.
- the information provided by the AR icon that displays the content of the object by characters or the like cannot sufficiently recognize the content of the AR icon.
- the proportion of the AR icon in the field of view increases, gaze on the real space is hindered, and when the user is gazing at the AR icon, attention to the real space may be distracted.
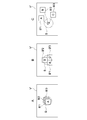
- FIGS. 17 and 18 are diagrams schematically illustrating a visual field according to a reference example of the present embodiment.
- the visual field V ′ shown in FIGS. 17 and 18 three objects (not shown) are arranged in the region S, and the AR icons B′1, B′2, and B′3 related to these objects are arranged. Is displayed.
- the AR icons B′1, B′2, and B′3 are displayed in an overlapping manner, and the user can grasp the contents of the AR icons B′2 and B′3. Can not. Therefore, in the visual field V ′ shown in FIG. 17B, the AR icons B′1, B′2, and B′3 are displayed so as not to overlap.
- the proportion of the AR icons B′1, B′2, and B′3 in the visual field V ′ increases. For this reason, when the user wants to gaze at an object or the like that exists in the real space, the AR icons B′1, B′2, and B′3 may be superimposed on the object and hinder gaze.
- the distribution of objects related to the AR icons B′1, B′2, and B′3 and the correspondence between the AR icons and the objects may become unclear.
- the visual field V ′ shown in FIG. 17C the objects and the AR icons B′1, B′2, and B′3 related to the objects are connected by lines, and the correspondence between these becomes clear and the arrangement of the objects is also made. It is clear.
- the gaze may be hindered due to the presence of the AR icons B′1, B′2, and B′3.
- the AR icons B′1, B′2, and B′3 are switched at a predetermined timing. In this case, the AR icons B′1, B′2, and B′3 cannot be visually recognized by the user unless sufficient switching timing is ensured.
- the AR icon in order to visually recognize all the AR icons B′1, B′2, and B′3, the AR icon must be continuously watched for a certain period of time.
- the distribution display since the distribution display is displayed in a superimposed manner on a plurality of objects, there is no need to display an AR icon for each object. Therefore, the proportion of the AR display in the visual field is reduced, and gaze on the real space is not hindered. Further, since the distribution display can indicate the distribution of the object by its shape or the like, it can be configured to have transparency. Thereby, the visibility of real space can be improved more. In addition, since the distribution display can express the distribution and density of a plurality of objects by the shape and color tone, it is possible for the user to intuitively and simply grasp the existence of the object and its distribution state. Therefore, the user can grasp the minimum necessary information about the object in a short time by the distribution display. Furthermore, since the distribution display can vaguely grasp the distribution of objects without the user's attention, attention to the real space can be maintained.
- the user since the first mode can be switched to the second mode, the user can acquire more detailed information of the object as necessary.
- FIG. 19 is a diagram schematically illustrating a field of view according to another reference example of the present embodiment.
- an AR icon B′41 related to the building A′4 including a restaurant store is displayed.
- AR icons B′42 and B′43 that display store names such as restaurants are displayed as lower information. That is, in the example shown in FIG. 19, when the AR icon is displayed for each object and the AR icon is densely overlaid or overlaid, the AR icon B′41 for the information of the upper hierarchy is displayed, and the AR is displayed.
- the AR icons B′42 and B′43 are displayed for information on lower layers as the density of icons is reduced. In this case, it is necessary for the controller 20 to acquire information related to the object hierarchy, and it is necessary to maintain the object hierarchy.
- the present embodiment even when information such as an object newly registered in the AR server 40 or the like, such as an object hierarchy, is not sufficient, it can be a grouping target. As a result, it is possible to quickly provide information on more objects and reduce the processing amount for hierarchization.
- the AR system 100 (controller 20) is applied to a restaurant search application program (hereinafter also referred to as an application).
- the AR system 100 according to the present embodiment can be Can also be applied.
- the AR system 100 can be applied to a crowd spot search application, for example. It is assumed that the crowd spot search application can present to the user in real time a place where people who are out are concentrated.
- the object is a person who is out.
- the AR server 40 stores an outing population database as the object database 404.
- the AR server 40 acquires each person's current position and registered home position information from portable information terminals owned by a plurality of people, for example, and calculates the distance from each person's home. Further, the AR server 40 acquires each person's behavior analysis result analyzed by a behavior analysis program or the like installed in each person's portable information terminal. The AR server 40 determines whether each person has gone out based on the acquired information.
- the outing population database stores a current position and an outing situation associated with each person.
- the controller 20 acquires information about a person who is out of the AR server 40 via the portable information terminal 30.
- the object extraction unit 23 extracts people who are out in the field of view V, and the object distribution calculation unit 24 calculates these distributions.
- the group management unit 25 groups people who are out, and the distribution display generation unit 27 generates a distribution display.
- the distribution display generation unit 27 may have a different color tone depending on the density, for example.
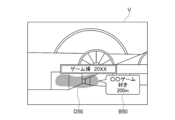
- FIG. 20 is a diagram illustrating an example of the visual field V presented by the processing of this application.
- a certain event venue is presented, and a distribution display D50 is displayed.
- the distribution display D50 can be displayed in a region where these objects are distributed.
- the AR icon B50 presents information about the user's attribute “like a certain game” and information about the distance to the group.
- the AR icon display processing unit 28 can display the attribute as the AR icon B50.
- the AR icon display processing unit 28 may display the distance from the user wearing the HMD 10 to the group. In this case, the distance to the group can be an average distance from the user wearing the HMD 10 to each grouped person.
- the user wearing the HMD 10 can easily search for places where there are many users who have a lot of people or who have a common hobby even in an event venue that is visited for the first time. Furthermore, the user can also act by avoiding the crowded part according to his / her intention.
- the group management unit 25 can group persons having the registered attribute “like a game”. This makes it possible to provide more effective information to the user.
- the AR system 100 can be applied to, for example, a photography spot search application. It is assumed that the photo shooting spot search application can present a direction and a distance viewed from a user in a place suitable for taking a photo. In this case, the object is a place where the photograph is taken.
- the AR server 40 stores a shooting spot database as the object database 404. Image data (hereinafter referred to as photo data) taken with a digital camera or a portable information terminal is uploaded to a photo sharing site on the Internet 50, a blog on the Internet 50, or the like. The AR server 40 acquires shooting position information added as metadata to these pieces of photo data.
- the photographing position information is acquired at the time of photographing by a photographing device having the GPS communication unit 305, for example.
- the AR server 40 holds the acquired shooting position information as a shooting spot database.
- the controller 20 acquires shooting position information from the AR server 40 via the portable information terminal 30.
- the object extraction unit 23 extracts shooting spots distributed in the visual field V, and the object distribution calculation unit 24 calculates these distributions.
- the group management unit 25 groups these shooting spots, and the distribution display generation unit 27 generates a distribution display.
- the distribution display generation unit 27 may have a different color tone depending on the density, for example.
- FIG. 21 is a diagram illustrating an example of the visual field V presented by the processing of this application.
- a distribution display D60 representing the distribution of the photographing spots is displayed.
- information indicating the content of the subject of the shooting spot “Sakura” and information on the distance to the spot are presented by the AR icon B60.
- Information indicating the contents of the subject at the shooting spot can be obtained by image analysis of photographic data. Thereby, the user can grasp
- the group management unit 25 selects a photographing spot whose processing time is close to the significant photographing time. Can be grouped.
- the shooting time can be specified from the metadata added to the photo data. For example, referring to the example of FIG. 21, it is assumed that the shooting time with cherry blossoms as the subject is concentrated mainly in the shooting area from the end of March to the beginning of April. In this case, if the processing time is at the beginning of April, the controller 20 can group the imaging spots having cherry as a subject and generate the distribution display D60 shown in FIG.
- the controller 20 does not have to group the imaging spots having cherry as a subject, and does not have to generate the distribution display D60. Thereby, the user can grasp
- the AR system 100 can be applied to, for example, a sightseeing spot guidance application. It is assumed that the tourist spot guidance application can present the direction and distance viewed from the user of the tourist spot near the current location.
- the object is a tourist spot.
- the AR server 40 stores a tourist spot database as the object database 404.
- the AR server 40 acquires information uploaded to a homepage created by a local government, a tourism association, or the like, or information uploaded to a blog, as information about a tourist spot.
- the controller 20 acquires tourist spot information from the AR server 40 via the portable information terminal 30.
- the object extraction unit 23 extracts sightseeing spots distributed in the visual field V, and the object distribution calculation unit 24 calculates these distributions.
- the group management unit 25 groups these sightseeing spots, and the distribution display generation unit 27 generates a distribution display.
- the distribution display generation unit 27 may have a different color tone depending on the density, for example.
- FIG. 22 is a diagram illustrating an example of the visual field V presented by the processing of this application.
- distribution displays D70 and D80 representing the distribution of tourist spots are displayed.
- AR icons B70 and B80 are displayed above the distribution displays D70 and D80, respectively.
- information indicating the attribute of the tourist spot “Tera” and information on the distance to the spot are presented. Thereby, the user can grasp
- the AR icon display processing unit 28 can display the attribute as an AR icon.
- the AR icon display processing unit 28 sets the temple gates, main halls, etc.
- the common attribute “Tera” can be displayed as a statistically significant attribute.
- the group management unit 25 can group sightseeing spots whose processing time is close to that time. Thereby, the user can grasp
- the AR system 100 can be applied to, for example, a traffic jam information providing application.
- the traffic information providing application can present to the user in real time the location where the car is congested.
- the object is a car.
- the AR server 40 stores a traffic jam information database as the object database 404.
- the AR server 40 uses, for example, driving information transmitted by a car, a system for monitoring the flow of a car installed on a road, or a portable information terminal owned by a driver, etc. Get distribution information.
- the controller 20 acquires vehicle distribution information from the AR server 40 via the portable information terminal 30.
- the object extraction unit 23 extracts slow speed cars distributed in the field of view V, and the object distribution calculation unit 24 calculates these distributions.
- the group management unit 25 groups the extracted cars, and the distribution display generation unit 27 generates a distribution display.
- the distribution display generation unit 27 may have a different color tone depending on the density, for example.
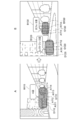
- FIG. 23 is a diagram illustrating an example of the visual field V presented by the processing of this application.
- distribution displays D90 and D100 representing the distribution of slow speed cars are displayed.
- AR icons B90 and B100 are displayed above the distribution displays D90 and D100, respectively.
- information “congestion” and information on the distance to the traffic jam start position are presented. Thereby, the user can grasp the direction and distance of the traffic jam location, or the degree of the traffic jam, and can avoid such traffic jam location.
- the AR system 100 can also be applied to an application that searches for an empty section of a parking lot.
- the controller 20 can generate a distribution display related to the distribution of vehicles in a certain parking lot by the same processing as that for the traffic information providing application. Thereby, the user can grasp
- the group management unit 25 has been described as grouping a plurality of objects having additional information such as related attributes.
- the grouping condition is not limited to this.
- the group management unit 25 may group a plurality of objects constituting a density equal to or higher than a predetermined reference among a plurality of objects distributed in the field of view.
- the group management unit 25 derives a probability density function using the coordinates (xa, ya) indicating the position of each object in the field of view as a variable, a plurality of objects whose variance value is equal to or smaller than a predetermined size. Can be grouped.
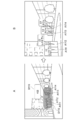
- FIGS. 24A and 24B are views showing examples of the field of view V.
- Objects A111 to A114 are two restaurants A111 and A112 included in one building and two cafes A113 and A114 included in another building.
- FIG. 24A four objects A111 to A114 are concentrated in a narrow range of the field of view V, and these four objects A111 to A114 are grouped as one group G110, and a distribution display D110 is displayed.
- FIG. 24A four objects A111 to A114 are concentrated in a narrow range of the field of view V, and these four objects A111 to A114 are grouped as one group G110, and a distribution display D110 is displayed.
- FIG. 24A four objects A111 to A114 are concentrated in a narrow range of the field of view V, and these four objects A111 to A114 are grouped as one group G110, and a distribution display D110 is displayed.
- FIG. 24A four objects A111 to A114 are concentrated in a narrow range of the field of view V, and these four objects A111
- the group management unit 25 searches for a set of objects whose distribution is less than or equal to the reference value, and, as shown in FIG. Reorganize as groups G120 and G130. Further, the distribution display generation unit 27 generates distribution displays D120 and D130 for each of the groups G120 and G130.
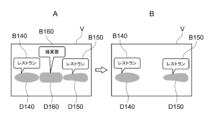
- the distribution display generation unit 27 and the AR icon display processing unit 28 can perform processing so that some of the generated AR icons and distribution display are not displayed.
- FIG. 25A shows an example in which the distribution display generation unit 27 and the AR icon display processing unit 28 generate a distribution display and an AR icon for a general store.
- distribution displays D140 and D150 for displaying the distribution of restaurants a distribution display D160 for displaying the distribution of general stores
- AR icons B140, B150 and 160 corresponding to the distribution displays, respectively are displayed.
- the distribution display generation unit 27 and the AR icon display processing unit 28 may remove the AR icon or the distribution display having an attribute other than the predetermined attribute such as a restaurant by filtering.
- the removal of the AR icon and the distribution display may be performed based on a user input operation, or may be automatically performed by an application. This makes it possible to provide the minimum necessary information in a simpler style.
- the object extraction unit 23 may extract only objects having a predetermined attribute. Thereby, the processing amount in the controller 20 can be reduced.
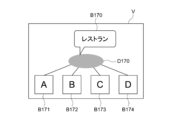
- FIG. 26 is a diagram illustrating an example of the visual field V in the second mode. As shown in the figure, an AR icon B170 and a distribution display D170 are displayed for the group, and AR icons B171, B172, B173, and B174 corresponding to each object in the group are also displayed. Thereby, the presence of a group can be indicated also in the second mode.
- the mode switching unit 26 has been described as switching between the first mode and the second mode when it is determined that the user operation corresponding to the mode switching has been received by the input operation unit 204. It is not limited to.
- the mode switching unit 26 may be configured to switch from the first mode to the second mode when it is determined that the user is watching the distribution display. More specifically, when it is determined that a distribution display described later is displayed at the center of the visual field V, the mode switching unit 26 may determine that the user is watching the distribution display.
- FIG. 27 is a view of the field of view V showing an example of mode switching by the mode switching unit 26.
- the symbol Ov in the figure indicates the center of the visual field V.
- the mode switching unit 26 may be configured to switch from the first mode to the second mode after a predetermined time has elapsed after the distribution display D170 is displayed at the center Ov.
- the mode switching unit 26 may determine whether or not the user is gazing at the visual field V using an action recognition engine installed in the portable information terminal 30 or a line-of-sight detection system mounted on the display unit 11. .
- the mode switching unit 26 may switch to the second mode when it is determined that the density of the grouped objects in the field of view V is equal to or lower than a predetermined reference.
- the mode switching unit 26 may switch to the second mode when it is determined that the density of the grouped objects in the field of view V is equal to or lower than a predetermined reference.
- the distribution of the object distribution in the field of view V becomes large, the density decreases, and the mode can be switched to the second mode.
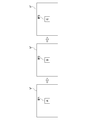
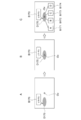
- 28A and 28B are diagrams showing examples of the visual field V, and show an example in which the object is four restaurants.
- FIG. 28A shows an example in which the density of the four objects A111 to A114 is determined to be larger than a predetermined reference and the first mode is maintained.
- a dispersion value can be applied in the same manner as in Modification 1-1.
- a distribution display D110 and an AR icon B110 are displayed for the four grouped objects A111 to A114.
- FIG. 28B shows an example in which the density of the four objects A111 to A114 is determined to be equal to or lower than a predetermined reference, and the mode is switched to the second mode.
- AR icons B111, B112, B113, and B114 are displayed for each of the four objects A111 to A114.
- the density of the objects decreases, the objects A111 to A114 are distributed over a wider area in the field of view V. Therefore, it is easy to secure a space for displaying the AR icons B111 to B114 for each object. Become. Therefore, according to the present modification, the mode can be switched while maintaining the visibility of the AR icon in the visual field V.
- the distribution display generation unit 27 may generate, for example, the following distribution display without using the probability density function.
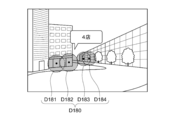
- FIG. 29 is a diagram illustrating another example of the distribution display.
- the distribution display D180 may be formed of, for example, a plurality of circles D181 to D184 centered on the coordinate position of the object.
- the size of one circle is not particularly limited. For example, it can be set to a size that overlaps with the circle of another grouped object. For example, the diameter may increase as the distance between the user wearing the display unit 11 and the object decreases.
- a region where a plurality of circles overlap may have a color tone with low brightness.
- a plurality of circles may be integrated to form one distribution display. Thereby, a group can be emphasized. Even with such a distribution display, the distribution state of the object can be expressed by the shape and the arrangement.
- the distribution display may be configured as a collection of points corresponding to one object. Even in this case, an area where the density of objects in the distribution display is high is drawn with overlapping points, so that it can be expressed in a dark color tone, and the color tone is changed based on the density of a plurality of grouped objects. be able to.
- the controller 20 may not be configured to be switched to the first and second modes, but may be configured to have only the first mode described above.
- FIG. 30 is a block diagram of the HMD for explaining the functional configuration of the controller according to the second embodiment of the present technology.
- the HMD 10A according to the present embodiment includes a display unit 11 and a controller 20A, and the functional configuration of the controller 20A is different from that of the first embodiment.
- the hardware configuration of the controller 20 is the same as that of the controller 20 shown in FIG. Note that, in the following modified examples, the same components as those in the above-described embodiment are denoted by the same reference numerals and description thereof is omitted.
- the controller 20A includes a field-of-view setting unit 21, an object information management unit 22, an object extraction unit 23, an object distribution calculation unit 24, a group management unit 25, a mode switching unit 26, and a distribution.
- a display generation unit 27, an AR icon display processing unit 28, and a distribution display adjustment unit 29 are further provided.
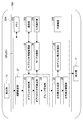
- FIG. 31 is a flowchart illustrating an operation example of the distribution display adjustment unit 29. After the distribution display is generated, distribution display adjustment unit 29 calculates the ratio of the area occupied by the distribution display in the visual field (ST601).
- the distribution display adjustment unit 29 determines whether or not the calculated area ratio is larger than the first ratio (ST602). When it is determined that the ratio is larger than the first ratio (Yes in ST602), the distribution display adjustment unit 29 executes a process of reducing the distribution display to be equal to or less than the first ratio (ST603). On the other hand, when it is determined that the ratio is equal to or less than the first ratio (No in ST602), distribution display adjustment unit 29 determines whether the calculated area ratio is smaller than the second ratio (ST604). When it is determined that the ratio is smaller than the second ratio (Yes in ST604), the distribution display adjustment unit 29 executes a process of enlarging the distribution display to the second ratio or more (ST605).
- the distribution display adjustment unit 29 ends the process without executing any reduction or enlargement of the distribution display.
- the distribution display adjustment unit 29 reduces the distribution display by using, for example, a variance (ie, ⁇ 2 ) of a value smaller than the actually calculated value. be able to.
- the distribution display adjustment unit 29 can enlarge the distribution display by using a variance of values larger than the actually calculated values.
- the distribution display adjustment unit 29 may execute the distribution display adjustment processing continuously after the distribution display and AR icon drawing processing executed at each 1/30 sec drawing timing described with reference to FIG. 8B, for example. it can. Alternatively, the distribution display adjustment unit 29 can execute the distribution display adjustment process at a predetermined timing different from the drawing timing.
- the distribution display adjustment criteria by the distribution display adjustment unit 29 will be described.
- the first ratio and the second ratio can be appropriately set according to the angle of view of the field of view V of the display unit 11.
- 32A and 32B are diagrams for explaining the angle of view of the visual field V.
- FIG. 32A shows the angle of view ⁇ in the circumferential direction ( ⁇ direction)
- FIG. 32B shows the angle of view ⁇ in the height direction (h direction).
- ⁇ ⁇ v2 ⁇ v1
- the angle of view ⁇ indicates a range of angles that the user U desires from the lower end hv2 to the upper end hv1 of the field of view V on the cylindrical coordinates C0, and can be defined by Expression (7).
- ⁇ 2 ⁇ tan ⁇ 1 ((hv2-hv1) / 2R) (7)
- the first ratio can be 50% and the second ratio can be 10%.
- the field of view V having an angle of view ⁇ of 40 ° and an angle of view ⁇ of 20 ° is relatively more relative to the user's field of view than the field of view V having an angle of view ⁇ of 20 ° and an angle of view ⁇ of 10 °.
- the first ratio can be set to 30% and the second ratio can be set to 5%.
- the distribution display adjustment unit 29 may reduce the ratio to the first ratio or the second ratio.
- the relationship between the angle of view of the field of view V and the values of the first and second ratios may be stored, for example, in the memory 202 of the AR server 40 or may be determined by an application program for executing the distribution display generation process. It may be determined. Alternatively, the first and second ratios may be determined for each HMD 10.
- the visibility of the distribution display can be further improved.
- the AR system includes the AR server, the portable information terminal, the controller, and the HMD, but is not limited thereto.
- the AR system does not have a portable information terminal, and the AR server and the controller may directly communicate with each other.
- the controller may be comprised integrally with HMD, and may be comprised by the portable information terminal.
- a controller may be comprised by several apparatuses, such as AR server and a portable information terminal, for example.
- the controller HMD
- the portable information terminal may collectively acquire information on objects necessary for the AR display process and the tactile feedback process from the AR server and hold them in the memory when they are activated.
- an example of an HMD configured to present an image via the display surfaces 111R and 111L has been described.
- the present technology is also applicable to, for example, a retinal projection type HMD.
- the example which has a transmissive display was given as an example of HMD, you may have a non-transmissive display, for example.
- the object may be an object distributed in a virtual space that can be displayed on a non-transmissive display instead of an object distributed in the real space.
- the virtual space may be a virtual space constructed around the user by a game application provided by an AR server or the like.
- this technique is applicable also to a contact lens type
- the controller of the HMD may display a distribution display above the field of view when the object is arranged above the field of view.
- the shape of the distribution display may be a predetermined shape such as an ellipse having a center at the distribution center of the object or a circle without being related to the shape of the region in which the object is distributed.
- a distribution display having a color tone with a higher brightness in a region where the density of the plurality of grouped objects is higher may be generated as generating, it is not limited to this.
- the HMD controller may generate a distribution display having a color tone with lower lightness in a region where the density of the plurality of objects is higher.
- the HMD controller may generate a distribution display in which the internal color tone distribution and the lightness distribution are changed based on, for example, the density distribution of a plurality of grouped objects.
- the controller can generate a distribution display in which the dense areas of the store are expressed in white and the other areas are expressed in gray.
- the controller of the HMD can generate a distribution display whose shape is changed based on the density distribution of a plurality of grouped objects. Thereby, the controller can delete a part of the distribution display, for example, in an area where there are few or no objects in the generated distribution display.
- this technique can also take the following structures.
- a control unit that groups a plurality of objects distributed in a real space or a virtual space around the user and generates a distribution display that displays a region in which the plurality of grouped objects are distributed; A display unit that presents the distribution display in the field of view of the user.
- the display device according to (1) above The control unit generates the distribution display near a region where the plurality of grouped objects are distributed.
- the display device according to (1) or (2) above, The control unit generates the distribution display having a shape related to a shape of a region in which the plurality of grouped objects are distributed.
- the control unit generates the distribution display having a shape representing a distribution bias of the plurality of objects.
- the display device according to any one of (1) to (4), The said control part produces
- the display device according to any one of (1) to (5), The control unit generates the distribution display so as to change at least one of hue, brightness, and saturation based on the density of the plurality of grouped objects.
- the display device according to (6) above, The said control part produces
- the display device according to any one of (1) to (7), The said control part produces
- the display device The display device according to (8) above, The control unit derives the probability density function, and when the derived probability density function is integrated with the variables, the distribution display is superimposed on the region in the visual field where the distribution probability of the object becomes a predetermined value. Generate a display device.
- the probability density function is a Gauss function.
- the display device according to any one of (1) to (10), The control unit groups a plurality of objects having related additional information among a plurality of objects distributed in the visual field. (12) The display device according to any one of (1) to (10), The said control part groups the some object which comprises the density more than a predetermined reference
- the display device (14) The display device according to (13), The control unit The display device that selects the first mode when it is determined that the density of the grouped objects in the visual field is equal to or higher than a predetermined reference. (15) The display device according to (13) above, The control unit switches from the first mode to the second mode when it is determined that the user is gazing at the distribution display. (16) The display device according to (15) above, The control unit determines that the user is gazing at the distribution display when it is determined that the distribution display is superimposed on the center of the visual field. (17) The display device according to any one of (1) to (16), The control unit reduces the distribution display to the predetermined ratio or less when the ratio of the area occupied by the distribution display in the visual field is larger than a predetermined ratio.
- the display device is configured to be attachable to a user.
- a control device capable of storing information about a plurality of objects distributed in a real space or a virtual space around the user and outputting information about the plurality of objects;
- a display having a control unit that groups the plurality of objects and generates a distribution display that displays a region in which the plurality of grouped objects are distributed, and a display unit that presents the distribution display in the field of view of the user And an information processing system.
Landscapes
- Engineering & Computer Science (AREA)
- Theoretical Computer Science (AREA)
- General Engineering & Computer Science (AREA)
- Physics & Mathematics (AREA)
- General Physics & Mathematics (AREA)
- Human Computer Interaction (AREA)
- Computer Graphics (AREA)
- Computer Hardware Design (AREA)
- Software Systems (AREA)
- Multimedia (AREA)
- Computer Vision & Pattern Recognition (AREA)
- User Interface Of Digital Computer (AREA)
- Processing Or Creating Images (AREA)
Priority Applications (4)
| Application Number | Priority Date | Filing Date | Title |
|---|---|---|---|
| DE112016002350.2T DE112016002350T5 (de) | 2015-05-26 | 2016-04-05 | Anzeigevorrichtung, Informationsverarbeitungssystem und Steuerverfahren |
| EP16799509.1A EP3306456A4 (en) | 2015-05-26 | 2016-04-05 | DISPLAY DEVICE, INFORMATION PROCESSING SYSTEM AND CONTROL PROCESS |
| CN201680028918.4A CN107615227B (zh) | 2015-05-26 | 2016-04-05 | 显示装置、信息处理系统以及控制方法 |
| US15/575,131 US10878629B2 (en) | 2015-05-26 | 2016-04-05 | Display apparatus, information processing system, and control method |
Applications Claiming Priority (2)
| Application Number | Priority Date | Filing Date | Title |
|---|---|---|---|
| JP2015106767A JP6344311B2 (ja) | 2015-05-26 | 2015-05-26 | 表示装置、情報処理システム及び制御方法 |
| JP2015-106767 | 2015-05-26 |
Publications (1)
| Publication Number | Publication Date |
|---|---|
| WO2016189791A1 true WO2016189791A1 (ja) | 2016-12-01 |
Family
ID=57392648
Family Applications (1)
| Application Number | Title | Priority Date | Filing Date |
|---|---|---|---|
| PCT/JP2016/001912 Ceased WO2016189791A1 (ja) | 2015-05-26 | 2016-04-05 | 表示装置、情報処理システム及び制御方法 |
Country Status (6)
| Country | Link |
|---|---|
| US (1) | US10878629B2 (enExample) |
| EP (1) | EP3306456A4 (enExample) |
| JP (1) | JP6344311B2 (enExample) |
| CN (1) | CN107615227B (enExample) |
| DE (1) | DE112016002350T5 (enExample) |
| WO (1) | WO2016189791A1 (enExample) |
Cited By (1)
| Publication number | Priority date | Publication date | Assignee | Title |
|---|---|---|---|---|
| WO2019130708A1 (ja) * | 2017-12-25 | 2019-07-04 | ソニー株式会社 | 情報処理装置、情報処理方法及びプログラム |
Families Citing this family (15)
| Publication number | Priority date | Publication date | Assignee | Title |
|---|---|---|---|---|
| JP6742760B2 (ja) * | 2016-02-29 | 2020-08-19 | キヤノン株式会社 | 情報処理装置、情報処理方法、及びプログラム |
| EP3438789A4 (en) * | 2016-03-29 | 2019-03-27 | Sony Corporation | INFORMATION PROCESSING DEVICE, INFORMATION PROCESSING PROCESS AND PROGRAM |
| JP7092028B2 (ja) * | 2016-04-26 | 2022-06-28 | ソニーグループ株式会社 | 情報処理装置、情報処理方法、及びプログラム |
| JP2018005091A (ja) * | 2016-07-06 | 2018-01-11 | 富士通株式会社 | 表示制御プログラム、表示制御方法および表示制御装置 |
| DE112016007015T5 (de) * | 2016-07-29 | 2019-03-21 | Mitsubishi Electric Corporation | Anzeigevorrichtung, anzeigesteuervorrichtung und anzeigesteuerverfahren |
| US11880909B2 (en) * | 2017-03-17 | 2024-01-23 | Maxell, Ltd. | AR display apparatus and AR display method |
| JP7110738B2 (ja) * | 2018-06-05 | 2022-08-02 | 大日本印刷株式会社 | 情報処理装置、プログラム及び情報処理システム |
| TWI691891B (zh) | 2018-09-07 | 2020-04-21 | 財團法人工業技術研究院 | 多重目標物資訊顯示方法及裝置 |
| CN109582134B (zh) * | 2018-11-09 | 2021-07-23 | 北京小米移动软件有限公司 | 信息显示的方法、装置及显示设备 |
| WO2020208804A1 (ja) * | 2019-04-12 | 2020-10-15 | 三菱電機株式会社 | 表示制御装置、表示制御方法、及び表示制御プログラム |
| CN112292726B (zh) * | 2019-05-22 | 2022-02-22 | 谷歌有限责任公司 | 用于沉浸式环境中对象分组和操纵的方法、系统和介质 |
| US11470017B2 (en) * | 2019-07-30 | 2022-10-11 | At&T Intellectual Property I, L.P. | Immersive reality component management via a reduced competition core network component |
| US11176751B2 (en) * | 2020-03-17 | 2021-11-16 | Snap Inc. | Geospatial image surfacing and selection |
| KR20220114336A (ko) * | 2021-02-08 | 2022-08-17 | 현대자동차주식회사 | 사용자 단말 및 그 제어 방법 |
| CN116402990A (zh) * | 2022-01-05 | 2023-07-07 | 财团法人工业技术研究院 | 主动式互动导览系统以及主动式互动导览方法 |
Citations (4)
| Publication number | Priority date | Publication date | Assignee | Title |
|---|---|---|---|---|
| JP2010238098A (ja) * | 2009-03-31 | 2010-10-21 | Ntt Docomo Inc | 端末装置、情報提示システム及び端末画面表示方法 |
| JP2012059011A (ja) * | 2010-09-08 | 2012-03-22 | Namco Bandai Games Inc | プログラム、情報記憶媒体、及び、画像生成装置 |
| WO2014043353A2 (en) * | 2012-09-12 | 2014-03-20 | Objectvideo, Inc. | Methods, devices and systems for detecting objects in a video |
| JP2015072607A (ja) * | 2013-10-03 | 2015-04-16 | キヤノン株式会社 | 情報処理装置、情報処理方法、及びプログラム |
Family Cites Families (43)
| Publication number | Priority date | Publication date | Assignee | Title |
|---|---|---|---|---|
| US7594194B2 (en) * | 2003-09-24 | 2009-09-22 | Nokia Corporation | Portrayal of navigation objects |
| JP4875843B2 (ja) * | 2004-10-20 | 2012-02-15 | オリンパス株式会社 | 情報端末装置 |
| US7574409B2 (en) * | 2004-11-04 | 2009-08-11 | Vericept Corporation | Method, apparatus, and system for clustering and classification |
| US20070097143A1 (en) * | 2005-10-28 | 2007-05-03 | Mutsuya Ii | Application of variable opacity (image alpha) to power and probability distributions superimposed on cartographic displays |
| US8165808B2 (en) * | 2007-07-17 | 2012-04-24 | Yahoo! Inc. | Techniques for representing location information |
| US8339399B2 (en) * | 2007-10-31 | 2012-12-25 | Microsoft Corporation | Declustering point-of-interest icons |
| US9191238B2 (en) * | 2008-07-23 | 2015-11-17 | Yahoo! Inc. | Virtual notes in a reality overlay |
| CN101551732A (zh) * | 2009-03-24 | 2009-10-07 | 上海水晶石信息技术有限公司 | 带有交互功能的增强现实的方法及其系统 |
| DE102009037835B4 (de) * | 2009-08-18 | 2012-12-06 | Metaio Gmbh | Verfahren zur Darstellung von virtueller Information in einer realen Umgebung |
| JP2011081556A (ja) | 2009-10-06 | 2011-04-21 | Sony Corp | 情報処理装置、情報処理方法、プログラムおよびサーバ |
| US20110161875A1 (en) * | 2009-12-29 | 2011-06-30 | Nokia Corporation | Method and apparatus for decluttering a mapping display |
| CN101826129A (zh) | 2010-04-17 | 2010-09-08 | 中山大学 | 基于增强现实的虚拟测量原理及方法 |
| JP5651386B2 (ja) * | 2010-06-23 | 2015-01-14 | ソフトバンクモバイル株式会社 | 眼鏡型表示装置 |
| US9710554B2 (en) * | 2010-09-23 | 2017-07-18 | Nokia Technologies Oy | Methods, apparatuses and computer program products for grouping content in augmented reality |
| KR101266198B1 (ko) * | 2010-10-19 | 2013-05-21 | 주식회사 팬택 | 증강현실 객체정보의 가시성을 높이는 디스플레이 장치 및 디스플레이 방법 |
| KR101350033B1 (ko) * | 2010-12-13 | 2014-01-14 | 주식회사 팬택 | 증강 현실 제공 단말기 및 방법 |
| JP2012174116A (ja) * | 2011-02-23 | 2012-09-10 | Ntt Docomo Inc | オブジェクト表示装置、オブジェクト表示方法及びオブジェクト表示プログラム |
| US9600933B2 (en) * | 2011-07-01 | 2017-03-21 | Intel Corporation | Mobile augmented reality system |
| US9672049B2 (en) * | 2011-09-22 | 2017-06-06 | Qualcomm Incorporated | Dynamic and configurable user interface |
| US9087412B2 (en) * | 2011-09-26 | 2015-07-21 | Nokia Technologies Oy | Method and apparatus for grouping and de-overlapping items in a user interface |
| CN102495947A (zh) * | 2011-11-15 | 2012-06-13 | 中国计量科学研究院 | 一种基于虚拟现实技术的表达和分析不确定度的方法 |
| EP2820576A4 (en) * | 2012-02-29 | 2015-11-18 | Nokia Technologies Oy | METHOD AND DEVICE FOR PRESENTING OBJECTS AT A USER INTERFACE |
| US20140053099A1 (en) * | 2012-08-14 | 2014-02-20 | Layar Bv | User Initiated Discovery of Content Through an Augmented Reality Service Provisioning System |
| EP2888876A4 (en) * | 2012-08-27 | 2016-04-20 | Empire Technology Dev Llc | GENERATION OF EXEMPLARY EXTENDED REALITY |
| US20140074395A1 (en) * | 2012-09-13 | 2014-03-13 | Michael Brown | Method of displaying points of interest and related portable electronic device |
| CN102929391B (zh) * | 2012-10-23 | 2015-11-04 | 中国石油化工股份有限公司 | 增强现实的分布式控制系统人机交互设备及方法 |
| JP6050518B2 (ja) * | 2012-12-21 | 2016-12-21 | メタイオ ゲゼルシャフト ミット ベシュレンクテル ハフツングmetaio GmbH | 実環境に仮想情報を表現する方法 |
| US9709806B2 (en) * | 2013-02-22 | 2017-07-18 | Sony Corporation | Head-mounted display and image display apparatus |
| US9829997B2 (en) * | 2013-02-22 | 2017-11-28 | Sony Corporation | Head-mounted display system, head-mounted display, and head-mounted display control program |
| US10229415B2 (en) * | 2013-03-05 | 2019-03-12 | Google Llc | Computing devices and methods for identifying geographic areas that satisfy a set of multiple different criteria |
| US9047703B2 (en) * | 2013-03-13 | 2015-06-02 | Honda Motor Co., Ltd. | Augmented reality heads up display (HUD) for left turn safety cues |
| EP3004803B1 (en) * | 2013-06-07 | 2021-05-05 | Nokia Technologies Oy | A method and apparatus for self-adaptively visualizing location based digital information |
| JP5705279B2 (ja) * | 2013-08-27 | 2015-04-22 | ヤフー株式会社 | 位置特定サーバ、位置特定方法および位置特定プログラム |
| US9582516B2 (en) * | 2013-10-17 | 2017-02-28 | Nant Holdings Ip, Llc | Wide area augmented reality location-based services |
| US20150262428A1 (en) * | 2014-03-17 | 2015-09-17 | Qualcomm Incorporated | Hierarchical clustering for view management augmented reality |
| US10564714B2 (en) * | 2014-05-09 | 2020-02-18 | Google Llc | Systems and methods for biomechanically-based eye signals for interacting with real and virtual objects |
| CN105096375B (zh) * | 2014-05-09 | 2020-03-13 | 三星电子株式会社 | 图像处理方法和设备 |
| CN104331155B (zh) * | 2014-10-27 | 2017-02-15 | 北京理工大学 | 一种利用电刺激实现触觉再现装置 |
| US11232466B2 (en) * | 2015-01-29 | 2022-01-25 | Affectomatics Ltd. | Recommendation for experiences based on measurements of affective response that are backed by assurances |
| CN104571532B (zh) * | 2015-02-04 | 2018-01-30 | 网易有道信息技术(北京)有限公司 | 一种实现增强现实或虚拟现实的方法及装置 |
| US9652896B1 (en) * | 2015-10-30 | 2017-05-16 | Snap Inc. | Image based tracking in augmented reality systems |
| US10078919B2 (en) * | 2016-03-31 | 2018-09-18 | Magic Leap, Inc. | Interactions with 3D virtual objects using poses and multiple-DOF controllers |
| JP7130368B2 (ja) * | 2017-01-13 | 2022-09-05 | キヤノン株式会社 | 情報処理装置および情報処理システム |
-
2015
- 2015-05-26 JP JP2015106767A patent/JP6344311B2/ja active Active
-
2016
- 2016-04-05 CN CN201680028918.4A patent/CN107615227B/zh active Active
- 2016-04-05 DE DE112016002350.2T patent/DE112016002350T5/de active Pending
- 2016-04-05 US US15/575,131 patent/US10878629B2/en active Active
- 2016-04-05 EP EP16799509.1A patent/EP3306456A4/en not_active Ceased
- 2016-04-05 WO PCT/JP2016/001912 patent/WO2016189791A1/ja not_active Ceased
Patent Citations (4)
| Publication number | Priority date | Publication date | Assignee | Title |
|---|---|---|---|---|
| JP2010238098A (ja) * | 2009-03-31 | 2010-10-21 | Ntt Docomo Inc | 端末装置、情報提示システム及び端末画面表示方法 |
| JP2012059011A (ja) * | 2010-09-08 | 2012-03-22 | Namco Bandai Games Inc | プログラム、情報記憶媒体、及び、画像生成装置 |
| WO2014043353A2 (en) * | 2012-09-12 | 2014-03-20 | Objectvideo, Inc. | Methods, devices and systems for detecting objects in a video |
| JP2015072607A (ja) * | 2013-10-03 | 2015-04-16 | キヤノン株式会社 | 情報処理装置、情報処理方法、及びプログラム |
Non-Patent Citations (1)
| Title |
|---|
| See also references of EP3306456A4 * |
Cited By (1)
| Publication number | Priority date | Publication date | Assignee | Title |
|---|---|---|---|---|
| WO2019130708A1 (ja) * | 2017-12-25 | 2019-07-04 | ソニー株式会社 | 情報処理装置、情報処理方法及びプログラム |
Also Published As
| Publication number | Publication date |
|---|---|
| EP3306456A4 (en) | 2019-01-09 |
| EP3306456A1 (en) | 2018-04-11 |
| US10878629B2 (en) | 2020-12-29 |
| US20180144552A1 (en) | 2018-05-24 |
| CN107615227A (zh) | 2018-01-19 |
| JP6344311B2 (ja) | 2018-06-20 |
| DE112016002350T5 (de) | 2018-04-05 |
| JP2016218981A (ja) | 2016-12-22 |
| CN107615227B (zh) | 2021-08-27 |
Similar Documents
| Publication | Publication Date | Title |
|---|---|---|
| JP6344311B2 (ja) | 表示装置、情報処理システム及び制御方法 | |
| JP7268692B2 (ja) | 情報処理装置、制御方法及びプログラム | |
| CN106662988B (zh) | 显示控制装置、显示控制方法及存储介质 | |
| JP6450779B2 (ja) | ストリートビュー目的地への案内を提供する方法およびデバイス | |
| US9766712B2 (en) | Systems and methods for orienting a user in a map display | |
| EP3036619B1 (en) | User terminal device for displaying map and method thereof | |
| US9488488B2 (en) | Augmented reality maps | |
| EP2541201B1 (en) | Map view | |
| US9069440B2 (en) | Method, system and apparatus for providing a three-dimensional transition animation for a map view change | |
| JP5622510B2 (ja) | 画像生成システム、プログラム及び情報記憶媒体 | |
| US20180005425A1 (en) | System and Method for Displaying Geographic Imagery | |
| US9909878B2 (en) | Method and apparatus for triggering conveyance of guidance information | |
| US20150032771A1 (en) | System and method for sharing geo-localized information in a social network environment | |
| ES2706824T3 (es) | Un indicador de región de vídeo que indica que hay disponible contenido de vídeo | |
| US10650037B2 (en) | Enhancing information in a three-dimensional map | |
| CN118786466A (zh) | 基于地理数据提供增强现实视图 |
Legal Events
| Date | Code | Title | Description |
|---|---|---|---|
| 121 | Ep: the epo has been informed by wipo that ep was designated in this application |
Ref document number: 16799509 Country of ref document: EP Kind code of ref document: A1 |
|
| WWE | Wipo information: entry into national phase |
Ref document number: 15575131 Country of ref document: US |
|
| WWE | Wipo information: entry into national phase |
Ref document number: 112016002350 Country of ref document: DE |
|
| WWE | Wipo information: entry into national phase |
Ref document number: 2016799509 Country of ref document: EP |