WO2016175342A2 - Ocean meteorological data sampling method performed by computer - Google Patents
Ocean meteorological data sampling method performed by computer Download PDFInfo
- Publication number
- WO2016175342A2 WO2016175342A2 PCT/KR2015/004194 KR2015004194W WO2016175342A2 WO 2016175342 A2 WO2016175342 A2 WO 2016175342A2 KR 2015004194 W KR2015004194 W KR 2015004194W WO 2016175342 A2 WO2016175342 A2 WO 2016175342A2
- Authority
- WO
- WIPO (PCT)
- Prior art keywords
- data
- meteorological
- sampling
- zone
- weather
- Prior art date
Links
Images
Classifications
-
- G—PHYSICS
- G01—MEASURING; TESTING
- G01W—METEOROLOGY
- G01W1/00—Meteorology
- G01W1/02—Instruments for indicating weather conditions by measuring two or more variables, e.g. humidity, pressure, temperature, cloud cover or wind speed
-
- G—PHYSICS
- G01—MEASURING; TESTING
- G01W—METEOROLOGY
- G01W1/00—Meteorology
- G01W1/10—Devices for predicting weather conditions
-
- G—PHYSICS
- G06—COMPUTING; CALCULATING OR COUNTING
- G06F—ELECTRIC DIGITAL DATA PROCESSING
- G06F17/00—Digital computing or data processing equipment or methods, specially adapted for specific functions
- G06F17/10—Complex mathematical operations
- G06F17/16—Matrix or vector computation, e.g. matrix-matrix or matrix-vector multiplication, matrix factorization
-
- G—PHYSICS
- G06—COMPUTING; CALCULATING OR COUNTING
- G06N—COMPUTING ARRANGEMENTS BASED ON SPECIFIC COMPUTATIONAL MODELS
- G06N20/00—Machine learning
-
- G—PHYSICS
- G16—INFORMATION AND COMMUNICATION TECHNOLOGY [ICT] SPECIALLY ADAPTED FOR SPECIFIC APPLICATION FIELDS
- G16Z—INFORMATION AND COMMUNICATION TECHNOLOGY [ICT] SPECIALLY ADAPTED FOR SPECIFIC APPLICATION FIELDS, NOT OTHERWISE PROVIDED FOR
- G16Z99/00—Subject matter not provided for in other main groups of this subclass
Definitions
- the present invention relates to a marine meteorological sampling method performed by a computer, and more specifically, a sample weather condition extracted for analysis of a physical phenomenon having a characteristic sensitive to the meteorological environment, including an infrared signal analysis of a ship.
- the present invention relates to a new concept of marine meteorological sampling, which is to get as close as possible to the statistical distribution characteristics of (Marine Meteorological Observation Data) and to reflect the correlations between marine meteorological variables.
- the ship's InfraRed stealth performance is greatly influenced by ocean weather conditions.
- Application of sea weather data (temperature, water temperature, relative humidity, wind speed, wind direction) on which the ship can operate for the analysis of ship IR signatures and detection ranges (for anti-ship missiles). Only by analyzing them can we reasonably predict the signal characteristics of the target box.
- estimating the maximum value (or range of change) of the signal value the target ship will have is a very important reference in determining the signal requirements for a built ship. Therefore, accurate signal prediction is required, and how to set up the weather condition that has the greatest influence on the signal prediction result is the most important part of the signal prediction.
- the weather condition setting method for the conventional infrared signal analysis is as follows. First, the monthly average and standard deviation are calculated for each weather variable (temperature, water temperature, etc.), and the signals for each of the 12 months are analyzed, and then the month representing the largest signal (or range) is checked (eg, January). And we consider the change characteristics of the signal according to the change of each weather element (sensitivity analysis). For example, the temperature condition for analyzing the case where the signal decreases as the temperature rises (inversely related) is "January average temperature-standard temperature deviation", and when the signal increases as the water temperature rises (proportional relationship). The water temperature conditions applied to "January average temperature + standard temperature deviation" apply.
- the weather variables five of temperature, water temperature, relative humidity, wind speed, wind direction, etc.
- the weather variables five of temperature, water temperature, relative humidity, wind speed, wind direction, etc.
- it is assumed to represent the largest signal value among the signal analysis results of the target signal analysis results using the 'reference environmental conditions' (no comparison with the test results, because the actual ocean weather cannot be changed for the test). Because).
- the conventional method of setting marine weather conditions includes the following serious problems.
- the signal analysis is performed only on a few weather conditions extracted, and thus the analysis result is not close to the statistical distribution characteristic of the population (ocean meteorological observation data).
- the present invention has been proposed to solve the above problems, the sample weather conditions extracted for the analysis of physical phenomena having characteristics sensitive to the weather environment, including the analysis of the infrared signal of the ship is a population (ocean meteorological observation data) It is an object of the present invention to provide a new concept of marine meteorological sampling, which is to be as close as possible to the statistical distribution characteristics of the system and to reflect the correlations between the meteorological variables.
- the present invention provides a computer-based marine meteorological sampling method, to obtain a cumulative distribution function for each meteorological variable of the temperature, water temperature, relative humidity, wind speed, wind direction forming a population and to calculate the cumulative distribution function Dividing the number of slots into the number of slots to be extracted (4-1); Obtaining a probability of occurrence of the combined meteorological variables correlated with each other using principal component analysis, and setting a high priority of sampling to the data with low probability of occurrence; And dividing the zones between the weather variables and sampling the zones according to the priorities for each zone (4-3).
- the cumulative distribution function is characterized in that evenly divided.
- the priority is characterized by having a relation that is proportional to the number of slots and inversely proportional to the probability of occurrence.
- the number of zones is characterized in that greater than the number of samples to be extracted.
- the number of zones is characterized in that the product of the number of zones divided by the weather variable.
- the division criteria of the zone is characterized in that based on the cumulative distribution function value for each weather variable.
- the sampling procedure comprises the steps of: (1) checking the number of data included for each zone and obtaining the data ratio for each zone; The data ratio is sorted in ascending order and the data ratio is divided into the upper 50% region (large region) and the lower 50% region (small region), and the sampling is alternately made between the large region and the small region. Selecting a region to be done (2); Sorting by using different priority values for each data included in each of the selected zones, and sampling the data having the highest priority as a sample (3); Updating (4) the priority value between all remaining data each time a sample is extracted; And repeating the processes of 3 to 4 until a desired number of samples are extracted (5).
- the data ratio is characterized by having a relation of n / S when the number of data for each zone is n and the number of data of the population is S.
- the present invention enables the analysis by extracting the appropriate number of samples from the actual observed weather data for the analysis of physical phenomena having characteristics sensitive to the weather environment, including the infrared signal analysis of the ship. The various characteristics that can occur can be interpreted.
- the analysis can be performed using a small number of samples and the results can be used to predict phenomena that may occur under actual marine weather conditions. .
- the principal component analysis method was applied as a method to calculate the probability of occurrence of observation data when each weather variable has a correlation with each other, and the marine weather sampling method that can cover a wide range of weather change phenomenon is used. Implemented. In addition, by establishing zones and sampling in each zone according to the change range between each weather variable, a procedure was established to extract a sample corresponding to a wide population without being concentrated in a specific zone.
- Ta air temperature
- Ts water temperature
- RH relative humidity
- Ws wind speed
- Wd wind direction
- Ta temperature distribution
- Ts water temperature
- Ta temperature
- RH relative humidity
- Ta temperature distribution
- Wd wind direction
- FIG. 11 is a priority adjustment interval after the first sample is extracted in FIG. 10.
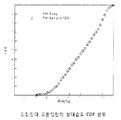
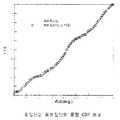
- 13 is a temperature CDF distribution of a population and a sample in the present invention.
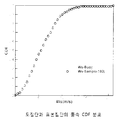
- 15 is a water temperature CDF distribution of a population and a sample in the present invention.
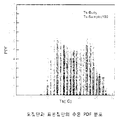
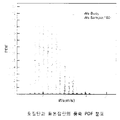
- 16 is a relative humidity PDF distribution of a population and a sample in the present invention.
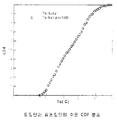
- 17 is a distribution of relative humidity CDF of a population and a sample in the present invention.
- 19 is a wind speed CDF distribution of a population and a sample in the present invention.
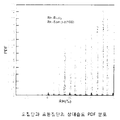
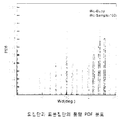
- 20 is a wind direction PDF distribution of a population and a sample population in the present invention.
- 21 is a wind direction CDF distribution of a population and a sample in the present invention.
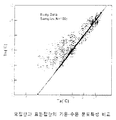
- FIG. 23 is a comparison of temperature-relative humidity distribution characteristics of a population and a sample in the present invention.
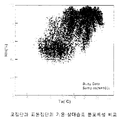
- 25 is a comparison of the wind speed-relative humidity distribution characteristics of the population and the sample population in the present invention.
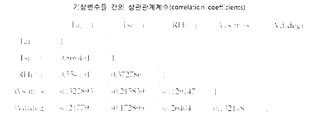
- FIG. 26 shows correlation coefficients between weather variables.
- the marine meteorological sampling method according to the present invention needs to be preceded by the following steps (1) to (3) before it is implemented.
- the data acquired through the process (1) may include data contaminated due to observation equipment error, etc., the data contaminated through the process is filtered out.
- Meteorological Administration data observed bureau technical note 2006-2, "How to use the real-time quality management system for weather observation data", 2006) for quality inspection methods.
- the amount of monthly data is analyzed and the number of monthly data is as similar as possible.
- the meteorological data show little change of weather variables according to time changes (day / night), but the change of weather variables according to monthly changes is very large. Because of this, if data is concentrated or lacking in a given month, it may not be appropriate to serve as an appropriate population to represent the year-round weather characteristics of the sea.
- the monthly data number based on the month with the smallest data number, the remaining month data is selected and removed using a random number.
- the marine meteorological sampling method (corresponding to process (4)) according to the present invention may be implemented.
- the marine meteorological sampling method according to the present invention will be described in detail by dividing step by step.
- all processes of the marine meteorological sampling method according to the present invention can be performed through a computer.
- the weather conditions to be applied for analysis in the present invention is not a weather condition (eg, mean value + standard deviation) generated by the assumption, but using a method of sampling from actual observed data.
- the following three requirements apply to sampling.
- the weather variables temperature, water temperature, relative humidity, wind speed, wind direction
- the weather variables are as close as possible to the distribution characteristics of the population weather variables.
- high priority for sampling is applied to data with low probability of occurrence in order to analyze various weather conditions as much as possible.
- the extracted sample data can be distributed evenly without being concentrated in a specific area.
- the principle is to divide the zones and to take one sample from each zone, taking into account the correlation between the variables.
- sampling can be repeated in the same zone.
- N the number of samples to be extracted
- it should be appropriately limited by increasing the number of infrared signal analysis cases (and calculation time) to be performed later, and if it is too small, it may be difficult to reflect the statistical characteristics of the population. It is based on N 100 and can be changed to about 40 to 200).
- PDF Probability Density Function
- CDF Cumulative Distribution Function
- Number of samples (N) the number of sample data extracted from the population, set to 100 in an embodiment of the present invention
- a CDF is calculated for each variable of the population: the embodiment of FIG. 1 shows a CDF distribution for temperature Ta, water temperature Ts, and relative humidity RH, and the embodiment of FIG. (Ws), CDF distribution for wind direction (Wd).
- CDF F (Xi)
- Xi temperature Ta, water temperature Ts, relative humidity (RH), wind speed (Ws), wind direction (Wd)
- X 1 temperature Ta
- X 2 water temperature Ts
- the CDF is an integral value of the PDF
- the slope of the CDF means PDF
- the uniformly divided CDF has the same meaning as the interval having the same probability. That is, the X value is divided into N sections so as to have a narrow X interval in a section having a high probability of occurrence and a wide X interval in a section having a low probability of occurrence (see FIGS. 3 and 5). Each of the divided sections is called a 'slot'.
- the number of slots for each weather variable such as temperature (Ta), water temperature (Ts), relative humidity (RH), wind speed (Ws), and wind direction (Wd) becomes equal to the number of samples to be extracted. That is, if only one sample is extracted without overlapping or missing in each slot section for each variable (temperature, water temperature, etc.), the probability distribution of the extracted samples becomes equal to the probability distribution of the population. For example, in FIG. 3, if one sample corresponding to -9.3 ⁇ Ta ⁇ 3.6 slots is extracted, a sample corresponding to this slot can no longer be extracted, and a sample corresponding to 21.1 ⁇ Ta ⁇ 23.1 intervals is extracted. Once extracted, the sample corresponding to this slot can no longer be extracted. That is, the probability of occurrence of the two sections is equal to 10%, respectively.
- each weather variable (Xk) can be converted into independent variables (Yk) by using Principal Component Analysis (PCA).
- PCA Principal Component Analysis
- the joint probability of the i-th data can be obtained as the following equation (Y variables are independent, so the joint probability can be obtained by multiplying each probability).
- This combined probability means the probability of occurrence of each observation data. That is, in the present invention, using the principal component analysis method, it is possible to obtain the probability of occurrence of the combined variables having correlation with each other.
- all points basically have 5 available slots (temperature, water temperature, relative humidity, wind speed, wind direction).
- the points belonging to the same slot as A will reduce the number of available slots.
- the point C (see FIG. 11) belonging to the same temperature slot as A has a sample (point A) corresponding to the temperature slot, and thus the available slot of the temperature is reduced from 1 to 0. Therefore, if the weather variables are two (temperature, water temperature) as in the above example, the N slots are reduced from 2 to 1 (generally, the weather variables are five, such as temperature, water temperature, relative humidity, wind speed, and wind direction, N slots will be reduced from 5 to 4 if the available slots of the other weather variables do not overlap A).
- point D which belongs to the same water temperature slot as A, also reduces the available slot of water temperature from 1 to 0. That is, as shown in FIG. 11, the samples (dots) corresponding to the corresponding slots are first reduced by decreasing the number of available slots.
- priority is determined by the number of available slots and the probability of occurrence in each observation data consisting of five variables such as temperature, water temperature, relative humidity, wind speed, and wind direction, and a sample is extracted. Each time you update the priority of all the remaining points.
- priority (Rank, Ri) may be expressed as the following equation. However, the priority does not have to be in the form of the following equation, and may be a relation that is proportional to N slot (number of slots) and inversely proportional to P Ji (probability).
- a block is set in consideration of correlations between various variables: As shown in FIGS. 6 to 8, there is a correlation between all weather variables.
- each variable should be divided into three zones.
- the total number of zones is 9 (3 2 ), and each zone can be marked as shown in FIG. At this time, the number of observation data located in all zones is not the same. In FIG.
- Zone 10 the same number of data exists in all three horizontally divided zones (water temperature reference division), and the same number of data exists in all three vertically divided zones (temperature reference division), but horizontal and vertical
- the present invention can be performed by extracting an appropriate number of samples from the actual observed weather data for the analysis of physical phenomena having characteristics sensitive to the weather environment, including the analysis of the infrared signal of the ship. By doing so, it is possible to analyze various characteristics that may occur in a real environment. In addition, by making it possible to extract a sample that retains the characteristics similar to those of the population, the analysis can be performed using a small number of samples and the results can be used to predict phenomena that may occur under actual marine weather conditions. .
- the principal component analysis method was applied as a method to calculate the probability of occurrence of observation data when each weather variable has a correlation with each other, and the marine weather sampling method that can cover a wide range of weather change phenomenon is used. Implemented. In addition, by establishing zones and sampling in each zone according to the change range between each weather variable, a procedure was established to extract a sample corresponding to a wide population without being concentrated in a specific zone.
- the sample weather conditions for the analysis of the physical phenomena having characteristics sensitive to the weather environment, including the infrared signal analysis of the ship, to be as close as possible to the statistical distribution characteristics of the population It provides a new marine weather sampling method reflecting the correlation, the present invention is a technology that can be widely used in the shipbuilding and marine industry to realize its practical and economic value.
Abstract
The present invention relates to an ocean meteorological data sampling method performed by a computer, and the purpose of the present invention is to provide an ocean meteorological data sampling method on the basis of a new concept, wherein meteorological condition data sampled for the analysis of a physical phenomenon having characteristics sensitive to a meteorological environment, including the infrared signature analysis of a ship, can be as close to statistical distribution characteristics possessed by a population (ocean meteorological observation data) as possible, and the correlations between ocean meteorological variables can be reflected in the meteorological condition data. The present invention provides an ocean meteorological data sampling method performed by a computer, comprising the steps of: obtaining a cumulative distribution function for each of meteorological variables constituting a population, including atmospheric temperature, water temperature, relative humidity, wind speed, and wind direction, and dividing the cumulative distribution function into as many slots as the number of data to be sampled; obtaining the probabilities of occurrence of the associated meteorological variables having correlations therebetween, using a principal component analysis method, and assigning a higher sampling priority to data having a lower probability of occurrence; and dividing blocks between the meteorological variables and sampling data for each block according to the priority.
Description
본 발명은 컴퓨터가 수행하는 해양 기상 표본 추출 방법에 관한 것으로, 보다 구체적으로는, 함정의 적외선신호 해석을 포함하여 기상환경에 민감한 특성을 갖는 물리적 현상에 대한 해석을 위해 추출된 표본 기상조건이 모집단(해양기상 관측데이터)이 갖는 통계적 분포특성에 최대한 근접하도록 하고, 해양기상 변수들 간의 상관관계를 반영할 수 있도록 하는 새로운 개념의 해양 기상 표본 추출 방법에 관한 것이다.The present invention relates to a marine meteorological sampling method performed by a computer, and more specifically, a sample weather condition extracted for analysis of a physical phenomenon having a characteristic sensitive to the meteorological environment, including an infrared signal analysis of a ship. The present invention relates to a new concept of marine meteorological sampling, which is to get as close as possible to the statistical distribution characteristics of (Marine Meteorological Observation Data) and to reflect the correlations between marine meteorological variables.
함정의 적외선(IR: InfraRed) 스텔스 성능은 해양의 기상조건에 매우 큰 영향을 받는다. 함정 적외선신호(IR signature) 및 (대함 미사일에 대한) 피탐거리(detection range) 등의 해석을 위해서는 대상함이 운용될 수 있는 해상의 기상데이터(기온, 수온, 상대습도, 풍속, 풍향)를 적용하여 해석해야만 대상함의 신호특성을 합리적으로 예측할 수 있다. 설계 중인 함정의 경우 설계 대상함이 가질 신호값의 최대값(또는 변화범위)을 예측하는 것은 건조된 함정에 대한 신호요구성능(signature requirement)을 결정하는 데 매우 중요한 참고자료로 활용될 수 있다. 따라서 정확한 신호예측이 필요하며 신호예측결과에 가장 큰 영향을 미치는 기상조건의 설정법은 함의 신호예측에서 가장 중요한 부분이다.The ship's InfraRed stealth performance is greatly influenced by ocean weather conditions. Application of sea weather data (temperature, water temperature, relative humidity, wind speed, wind direction) on which the ship can operate for the analysis of ship IR signatures and detection ranges (for anti-ship missiles). Only by analyzing them can we reasonably predict the signal characteristics of the target box. For ships under design, estimating the maximum value (or range of change) of the signal value the target ship will have is a very important reference in determining the signal requirements for a built ship. Therefore, accurate signal prediction is required, and how to set up the weather condition that has the greatest influence on the signal prediction result is the most important part of the signal prediction.
종래의 적외선 신호해석을 위한 기상조건 설정법은 다음과 같다. 먼저 기상변수(기온, 수온 등)별로 월별 평균, 표준편차를 구하고 12개월 각각에 대한 신호를 해석한 후 가장 큰 신호(또는 피탐거리)를 나타내는 월을 확인한다(예, 1월). 그리고 각 기상요소별 변화에 따라 신호의 변화 특성을 고찰한다(민감도(sensitivity) 해석). 예를 들어, 기온이 상승함에 따라 함의 신호가 감소하는 경우(반비례 관계) 해석을 위한 기온조건은 "1월평균기온-기온표준편차", 수온이 상승함에 따라 신호가 증가하는 경우(정비례 관계) 해석에 적용하는 수온조건은 "1월평균기온+수온표준편차"를 적용한다. 이와 같은 방법으로 해석에 적용되는 기상변수(기온, 수온, 상대습도, 풍속, 풍향 등 5개)를 설정한다('기준환경조건' 설정). 이와 같이 '기준환경조건'을 이용한 신호해석결과를 대상함의 신호해석 결과 중 가장 큰 신호값을 나타내는 것으로 가정한다(시험 결과와 비교 검증 된 바 없음. 왜냐하면 시험을 위해 실제 해양기상을 변화시킬 수 없기 때문). 하지만, 위와 같은 종래의 해양 기상조건 설정법은 다음과 같은 중대한 문제점을 내포하고 있다.The weather condition setting method for the conventional infrared signal analysis is as follows. First, the monthly average and standard deviation are calculated for each weather variable (temperature, water temperature, etc.), and the signals for each of the 12 months are analyzed, and then the month representing the largest signal (or range) is checked (eg, January). And we consider the change characteristics of the signal according to the change of each weather element (sensitivity analysis). For example, the temperature condition for analyzing the case where the signal decreases as the temperature rises (inversely related) is "January average temperature-standard temperature deviation", and when the signal increases as the water temperature rises (proportional relationship). The water temperature conditions applied to "January average temperature + standard temperature deviation" apply. In this way, the weather variables (five of temperature, water temperature, relative humidity, wind speed, wind direction, etc.) applied to the analysis are set ('reference environmental conditions'). As such, it is assumed to represent the largest signal value among the signal analysis results of the target signal analysis results using the 'reference environmental conditions' (no comparison with the test results, because the actual ocean weather cannot be changed for the test). because). However, the conventional method of setting marine weather conditions includes the following serious problems.
첫째, 종래의 해양 기상조건 설정법에 따르면 추출된 몇 가지 기상조건에만 의지하여 신호해석을 수행하므로 그 해석결과가 모집단(해양기상 관측데이터)이 갖는 통계적 분포특성에 근접하지 않는다.First, according to the conventional marine meteorological condition setting method, the signal analysis is performed only on a few weather conditions extracted, and thus the analysis result is not close to the statistical distribution characteristic of the population (ocean meteorological observation data).
둘째, 모든 기상변수들이 독립적으로 변화할 수 있다고 가정하고 있다. 즉, 기온, 수온, 상대습도, 풍속, 풍향 등의 해양 기상변수들 중 특정변수의 변화가 다른 변수들의 변화특성과 무관하게 변화할 수 있다고 가정하고 있다. 하지만, 이러한 가정은 실제 해양기상 관측데이터를 분석해 보면 각 기상변수들이 서로 상관관계를 맺으면서 변화하고 있으므로 사실과 다른 것이다. 즉, 종래의 해양 기상조건 설정법에 따르면 사실과 다른 기상조건으로 해석을 수행하므로 그 해석결과를 신뢰하기가 어렵다.Second, it is assumed that all weather variables can change independently. That is, it is assumed that the change of certain variables among the oceanic weather variables such as temperature, water temperature, relative humidity, wind speed, and wind direction can be changed irrespective of the change characteristics of other variables. However, this assumption is different from the fact that the analysis of actual ocean meteorological data shows that each weather variable is correlated with each other. That is, according to the conventional marine meteorological condition setting method, the analysis is performed under a different weather condition than the fact, so it is difficult to trust the analysis result.
본 발명은 상기와 같은 문제점을 해결하기 위해 제안된 것으로, 함정의 적외선신호 해석을 포함하여 기상환경에 민감한 특성을 갖는 물리적 현상에 대한 해석을 위해 추출된 표본 기상조건이 모집단(해양기상 관측데이터)이 갖는 통계적 분포특성에 최대한 근접하도록 하고, 해양기상 변수들 간의 상관관계를 반영할 수 있도록 하는 새로운 개념의 해양 기상 표본 추출 방법을 제공하는 것을 목적으로 한다.The present invention has been proposed to solve the above problems, the sample weather conditions extracted for the analysis of physical phenomena having characteristics sensitive to the weather environment, including the analysis of the infrared signal of the ship is a population (ocean meteorological observation data) It is an object of the present invention to provide a new concept of marine meteorological sampling, which is to be as close as possible to the statistical distribution characteristics of the system and to reflect the correlations between the meteorological variables.
상기한 목적을 달성하기 위하여 본 발명은, 컴퓨터가 수행하는 해양 기상 표본 추출 방법으로서, 모집단을 이루는 기온, 수온, 상대습도, 풍속, 풍향의 각 기상변수별로 누적분포함수를 구하고 상기 누적분포함수를 추출하고자 하는 표본의 수만큼의 슬롯으로 분할하는 단계(4-1); 주성분분석법을 이용하여 서로 상관관계를 가지면서 결합된 상기 기상변수들의 발생확률을 구하고 상기 발생확률이 낮은 데이터에 표본 추출의 높은 우선순위를 설정하는 단계(4-2) 및; 상기 기상변수들 간의 구역을 분할하고 상기 구역별로 상기 우선순위에 따라 표본을 추출하는 단계(4-3);를 포함하는 컴퓨터가 수행하는 해양 기상 표본 추출 방법을 제공한다.In order to achieve the above object, the present invention provides a computer-based marine meteorological sampling method, to obtain a cumulative distribution function for each meteorological variable of the temperature, water temperature, relative humidity, wind speed, wind direction forming a population and to calculate the cumulative distribution function Dividing the number of slots into the number of slots to be extracted (4-1); Obtaining a probability of occurrence of the combined meteorological variables correlated with each other using principal component analysis, and setting a high priority of sampling to the data with low probability of occurrence; And dividing the zones between the weather variables and sampling the zones according to the priorities for each zone (4-3).
본 발명에 있어서, 상기 누적분포함수는 균일하게 분할하는 것을 특징으로 한다.In the present invention, the cumulative distribution function is characterized in that evenly divided.
본 발명에 있어서, 상기 우선순위는 상기 슬롯의 개수에 비례하고 상기 발생확률에 반비례하는 관계식을 갖는 것을 특징으로 한다.In the present invention, the priority is characterized by having a relation that is proportional to the number of slots and inversely proportional to the probability of occurrence.
본 발명에 있어서, 상기 구역의 수는 추출하고자 하는 표본의 수보다 큰 것을 특징으로 한다.In the present invention, the number of zones is characterized in that greater than the number of samples to be extracted.
본 발명에 있어서, 상기 구역의 수는 상기 기상변수별로 분할된 구역의 수의 곱으로 나타나는 것을 특징으로 한다.In the present invention, the number of zones is characterized in that the product of the number of zones divided by the weather variable.
본 발명에 있어서, 상기 구역의 분할 기준은 상기 기상변수별 누적분포함수 값을 기준으로 하는 것을 특징으로 한다.In the present invention, the division criteria of the zone is characterized in that based on the cumulative distribution function value for each weather variable.
본 발명에 있어서, 표본 추출 절차는, 상기 구역별로 포함된 데이터 수를 확인하고 상기 구역별 데이터 비를 구하는 단계(①); 상기 데이터 비를 큰 순으로 정렬하고 상기 데이터 비가 상위 50%에 속하는 구역(큰 구역)과 하위 50%에 속하는 구역(작은 구역)으로 분류하여 상기 데이터 비가 큰 구역과 작은 구역을 번갈아가며 표본을 추출할 구역을 선택하는 단계(②); 선택된 각 구역에 포함된 데이터들 별로 상이한 우선순위 값을 이용하여 정렬하고 우선순위가 가장 상위인 데이터를 표본으로 추출하는 단계(③); 표본이 추출될 때마다 나머지 모든 데이터들 간의 우선순위 값을 갱신하는 단계(④) 및; 원하는 개수의 표본이 추출될 때까지 상기 ③ 내지 ④의 과정을 반복하는 단계(⑤);에 따라 이루어지는 것을 특징으로 한다.In the present invention, the sampling procedure comprises the steps of: (1) checking the number of data included for each zone and obtaining the data ratio for each zone; The data ratio is sorted in ascending order and the data ratio is divided into the upper 50% region (large region) and the lower 50% region (small region), and the sampling is alternately made between the large region and the small region. Selecting a region to be done (②); Sorting by using different priority values for each data included in each of the selected zones, and sampling the data having the highest priority as a sample (③); Updating (4) the priority value between all remaining data each time a sample is extracted; And repeating the processes of ③ to ④ until a desired number of samples are extracted (⑤).
본 발명에 있어서, 상기 데이터 비는, 각 구역별 데이터 수를 n이라 하고 모집단의 데이터 수를 S라 할 때, n/S의 관계식을 갖는 것을 특징으로 한다.In the present invention, the data ratio is characterized by having a relation of n / S when the number of data for each zone is n and the number of data of the population is S.
본 발명은, 함정의 적외선신호 해석을 포함하여 기상환경에 민감한 특성을 갖는 물리적 현상에 대한 해석을 위해 실제 관측된 기상데이터에서 적정한 수의 표본을 추출하여 해석을 수행할 수 있도록 함으로써, 실제 환경에서 발생할 수 있는 다양한 특성들을 해석할 수 있도록 하였다.The present invention enables the analysis by extracting the appropriate number of samples from the actual observed weather data for the analysis of physical phenomena having characteristics sensitive to the weather environment, including the infrared signal analysis of the ship. The various characteristics that can occur can be interpreted.
또한, 모집단이 갖는 통계적 특성과 유사한 특성을 유지하는 표본을 추출할 수 있도록 함으로써, 적은 수의 표본을 이용한 해석을 수행하고 그 결과를 이용하여 실제 해양기상 조건에서 나타날 수 있는 현상을 예측할 수 있도록 하였다. In addition, by making it possible to extract a sample that retains the characteristics similar to those of the population, the analysis can be performed using a small number of samples and the results can be used to predict phenomena that may occur under actual marine weather conditions. .
또한, 각각의 기상변수들이 서로 상관관계를 가질 때 관측데이터들의 발생확률을 계산할 수 있는 방법으로써 주성분분석법을 적용하였으며, 이를 이용하여 광범위한 범위의 기상변화현상을 포함할 수 있는 해양 기상 표본 추출 방법을 구현하였다. 또한, 각 기상변수들 간의 변화범위에 따라 구역을 설정하고 각 구역 내에서 표본을 추출하도록 함으로써 특정 구역에 집중되지 않고 광범위한 모집단에 상응하는 표본을 추출할 수 있는 절차를 확립하였다.In addition, the principal component analysis method was applied as a method to calculate the probability of occurrence of observation data when each weather variable has a correlation with each other, and the marine weather sampling method that can cover a wide range of weather change phenomenon is used. Implemented. In addition, by establishing zones and sampling in each zone according to the change range between each weather variable, a procedure was established to extract a sample corresponding to a wide population without being concentrated in a specific zone.
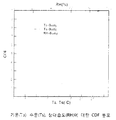
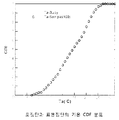
도 1은 기온(Ta), 수온(Ts), 상대습도(RH)에 대한 CDF 분포.1 is a CDF distribution for air temperature (Ta), water temperature (Ts), relative humidity (RH).
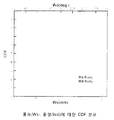
도 2는 풍속(Ws), 풍향(Wd)에 대한 CDF 분포.2 is a CDF distribution for wind speed (Ws), wind direction (Wd).
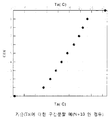
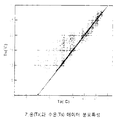
도 3은 본 발명에서, 기온(Ta)에 대한 구간분할 예(N=10 인 경우).3 is an example of segmentation for temperature Ta in the present invention (when N = 10).
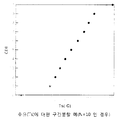
도 4는 본 발명에서, 수온(Ts)에 대한 구간분할 예(N=10 인 경우).Figure 4 is, in the present invention, the interval division example for the water temperature (Ts) (when N = 10).
도 5는 기온(Ta)에 대한 구간별 확률분포.5 is a probability distribution for each section of the temperature Ta.
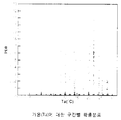
도 6은 기온(Ta)과 수온(Ts) 데이터 분포특성.6 is a temperature distribution (Ta) and water temperature (Ts) data distribution characteristics.
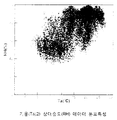
도 7은 기온(Ta)과 상대습도(RH) 데이터 분포특성.7 is a temperature (Ta) and relative humidity (RH) data distribution characteristics.
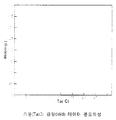
도 8은 기온(Ta)과 풍향(Wd) 데이터 분포특성.8 is a temperature distribution (Ta) and a wind direction (Wd) data distribution characteristics.
도 9는 본 발명에서, 기온(Ta)에 대한 구간분할 예(B=3인 경우).9 is an example of segmentation for temperature Ta in the present invention (when B = 3).
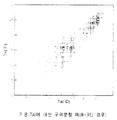
도 10은 본 발명에서, 기온(Ta)과 수온(Ts)에 대한 구역분할 예(B=3인 경우).FIG. 10 is an example of zoning for air temperature Ta and water temperature Ts in the present invention (when B = 3). FIG.
도 11은 도 10에서, 첫 번째 표본이 추출된 이후 우선순위 조정 구간.FIG. 11 is a priority adjustment interval after the first sample is extracted in FIG. 10.
도 12는 본 발명에서, 모집단과 표본집단의 기온 PDF 분포.12 is a temperature PDF distribution of the population and the sample population in the present invention.
도 13은 본 발명에서, 모집단과 표본집단의 기온 CDF 분포.13 is a temperature CDF distribution of a population and a sample in the present invention.
도 14는 본 발명에서, 모집단과 표본집단의 수온 PDF 분포.14 is a water temperature PDF distribution of the population and the sample population in the present invention.
도 15는 본 발명에서, 모집단과 표본집단의 수온 CDF 분포.15 is a water temperature CDF distribution of a population and a sample in the present invention.
도 16은 본 발명에서, 모집단과 표본집단의 상대습도 PDF 분포.16 is a relative humidity PDF distribution of a population and a sample in the present invention.
도 17은 본 발명에서, 모집단과 표본집단의 상대습도 CDF 분포.17 is a distribution of relative humidity CDF of a population and a sample in the present invention.
도 18은 본 발명에서, 모집단과 표본집단의 풍속 PDF 분포.18 is a wind speed PDF distribution of a population and a sample population in the present invention.
도 19는 본 발명에서, 모집단과 표본집단의 풍속 CDF 분포.19 is a wind speed CDF distribution of a population and a sample in the present invention.
도 20은 본 발명에서, 모집단과 표본집단의 풍향 PDF 분포.20 is a wind direction PDF distribution of a population and a sample population in the present invention.
도 21은 본 발명에서, 모집단과 표본집단의 풍향 CDF 분포.21 is a wind direction CDF distribution of a population and a sample in the present invention.
도 22는 본 발명에서, 모집단과 표본집단의 기온-수온 분포특성 비교.22 is a comparison of the temperature-water temperature distribution characteristics of the population and the sample population in the present invention.
도 23은 본 발명에서, 모집단과 표본집단의 기온-상대습도 분포특성 비교.FIG. 23 is a comparison of temperature-relative humidity distribution characteristics of a population and a sample in the present invention. FIG.
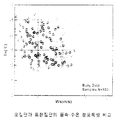
도 24는 본 발명에서, 모집단과 표본집단의 풍속-수온 분포특성 비교.24 is a comparison of the wind-water temperature distribution characteristics of the population and the sample population in the present invention.
도 25는 본 발명에서, 모집단과 표본집단의 풍속-상대습도 분포특성 비교.25 is a comparison of the wind speed-relative humidity distribution characteristics of the population and the sample population in the present invention.
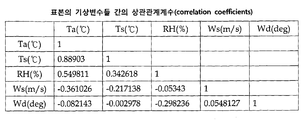
도 26은 기상변수들 간 상관관계계수(correlation coefficients).FIG. 26 shows correlation coefficients between weather variables. FIG.
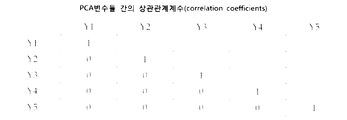
도 27은 PCA변수들 간 상관관계계수(correlation coefficients).27 shows correlation coefficients between PCA variables.
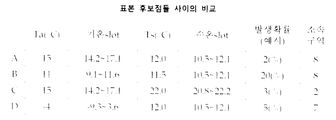
도 28은 본 발명에서, 표본 후보점들 사이의 비교.28 is a comparison between sample candidate points in the present invention.
도 29는 본 발명에서, 표본의 기상변수들 간 상관관계계수(correlation coefficients).29 shows correlation coefficients between weather variables of a sample in the present invention.
이하, 첨부된 도면들을 참조하여 본 발명에 대하여 상세히 설명한다. 한편, 본 발명을 설명함에 있어, 관련된 공지 구성 또는 기능에 대한 구체적인 설명이 본 발명의 요지를 흐릴 수 있다고 판단되는 경우에는 그 상세한 설명은 생략한다.Hereinafter, with reference to the accompanying drawings will be described in detail with respect to the present invention. Meanwhile, in describing the present invention, when it is determined that a detailed description of a related known configuration or function may obscure the gist of the present invention, the detailed description thereof will be omitted.
본 발명에 따른 해양 기상 표본 추출 방법은 그것이 구현되기에 앞서 다음과 같은 (1) 내지 (3)의 과정이 선행될 필요가 있다.The marine meteorological sampling method according to the present invention needs to be preceded by the following steps (1) to (3) before it is implemented.
(1) 데이터 획득(1) data acquisition
해양기상을 관측한 데이터를 획득한다. 해양기상 관측용 부이(buoy)를 기상청에서 운용하고 있으며, 연안에 설치된 등대에서도 유사한 기상관측자료를 얻을 수 있다. 관측된 기상자료는 데이터베이스화해서 일반에 제공되고 있으며 현재 국내 연안에서는 10개의 해양기상관측용 부이가 운용되고 있다.Acquire data from ocean weather. Buoys for marine meteorological observations are operated by the Meteorological Administration, and similar meteorological data can be obtained from lighthouses installed offshore. Observed meteorological data are provided to the public in a database. Currently, 10 marine meteorological buoys are in operation.
(2) 품질검사(2) quality inspection
관측 데이터에 대한 품질검사를 수행한다. 상기 과정 (1)을 통해 획득된 데이터들 중 관측 장비 오류 등으로 인해 오염된 자료가 포함될 수 있으므로 이 과정을 통해 오염된 자료 등을 걸러낸다. 품질검사를 위한 방법은 기상청 자료(관측국 기술 노트 2006-2, "기상관측자료 실시간 품질관리시스템 활용법", 2006)를 참고한다.Perform a quality check on the observed data. Since the data acquired through the process (1) may include data contaminated due to observation equipment error, etc., the data contaminated through the process is filtered out. Refer to the Meteorological Administration data (observation bureau technical note 2006-2, "How to use the real-time quality management system for weather observation data", 2006) for quality inspection methods.
(3) 데이터 후처리(3) data post-processing
상기 과정 (2)를 통해 얻어진 자료에서 월별 데이터양을 분석하고 가급적 월별 데이터의 수를 유사하게 갖도록 한다. 일반적으로 해양기상 데이터는 시간변화(주간/야간)에 따른 기상변수의 변화는 크지 않으나 월별변화에 따른 기상변수의 변화는 매우 크게 나타난다. 이 때문에 특정 월에 데이터가 집중되거나 부족한 경우 해당 해상의 연중 기상특성을 대표하는 적절한 모집단으로 활용되기 부적절할 수 있다. 월별 데이터 수를 비교하여 가장 적은 데이터 수를 갖는 월을 기준으로 나머지 월의 데이터는 난수(random number)를 이용하여 선택하여 제거한다.In the data obtained through the above process (2), the amount of monthly data is analyzed and the number of monthly data is as similar as possible. In general, the meteorological data show little change of weather variables according to time changes (day / night), but the change of weather variables according to monthly changes is very large. Because of this, if data is concentrated or lacking in a given month, it may not be appropriate to serve as an appropriate population to represent the year-round weather characteristics of the sea. By comparing the monthly data number, based on the month with the smallest data number, the remaining month data is selected and removed using a random number.
상기 설명한 바와 같은 (1) 내지 (3)의 과정이 경과하면 본 발명에 따른 해양 기상 표본 추출 방법(과정 (4)에 해당)이 구현될 수 있다. 이하, 본 발명에 따른 해양 기상 표본 추출 방법을 단계별로 구분하여 구체적으로 설명한다. 참고로, 본 발명에 따른 해양 기상 표본 추출 방법의 모든 과정은 컴퓨터를 통하여 수행될 수 있다.When the processes (1) to (3) as described above have elapsed, the marine meteorological sampling method (corresponding to process (4)) according to the present invention may be implemented. Hereinafter, the marine meteorological sampling method according to the present invention will be described in detail by dividing step by step. For reference, all processes of the marine meteorological sampling method according to the present invention can be performed through a computer.
(4) 해양 기상 표본 추출(4) marine meteorological sampling
본 발명에서 해석에 적용하기 위해 구하는 기상조건은 가정 등을 통해 생성된 기상조건(예, 평균값+표준편차 등)이 아니고 실제 관측된 자료에서 표본을 추출하는 방식을 이용한다. 그리고 표본 추출을 위해 다음과 같은 세 가지 요구조건을 적용한다.The weather conditions to be applied for analysis in the present invention is not a weather condition (eg, mean value + standard deviation) generated by the assumption, but using a method of sampling from actual observed data. The following three requirements apply to sampling.
첫째, 추출된 표본 데이터들의 기상변수(기온, 수온, 상대습도, 풍속, 풍향)들은 모집단 기상변수들의 분포특성에 최대한 근접하도록 한다.First, the weather variables (temperature, water temperature, relative humidity, wind speed, wind direction) of the extracted sample data are as close as possible to the distribution characteristics of the population weather variables.
둘째, 가급적 다양한 기상조건에 대한 해석을 위해 발생확률이 낮은 데이터에 (표본 추출을 위한) 높은 우선순위를 적용한다.Second, high priority (for sampling) is applied to data with low probability of occurrence in order to analyze various weather conditions as much as possible.
셋째, 추출된 표본 데이터들이 특정 구역에 집중되지 않고 고루 분포할 수 있도록 한다. 이를 위해 여러 변수들 간의 상관관계를 고려하여 구역을 나누고 각 구역에서 하나의 표본을 추출함을 원칙으로 한다. 단, 위의 첫 번째 요구조건을 만족시키기 어려운 경우 동일 구역에서 반복적으로 표본을 추출할 수 있다. 이때 추출할 표본의 수(N)는 지나치게 많은 경우 추후 수행할 적외선 신호해석 경우의 수(와 계산시간)를 늘리게 됨으로 적절히 제한되어야 하며, 너무 적은 경우 모집단의 통계적 특성을 반영하기 어려울 수 있다(통상 N=100개를 기준으로 하며, 40∼200 정도로 변화시킬 수 있다).Third, the extracted sample data can be distributed evenly without being concentrated in a specific area. To this end, the principle is to divide the zones and to take one sample from each zone, taking into account the correlation between the variables. However, if it is difficult to meet the first requirement above, sampling can be repeated in the same zone. If the number of samples to be extracted (N) is too large, it should be appropriately limited by increasing the number of infrared signal analysis cases (and calculation time) to be performed later, and if it is too small, it may be difficult to reflect the statistical characteristics of the population. It is based on N = 100 and can be changed to about 40 to 200).
이하, 상기 세 가지 요구조건을 만족시키기 위하여 본 발명이 적용한 방법은 다음과 같다.Hereinafter, the method applied by the present invention to satisfy the three requirements are as follows.
(4-1) 표본과 모집단간의 분포특성 유지(4-1) Maintain distribution characteristics between sample and population
본 발명을 설명함에 있어서 사용되는 기본 용어를 정의하면 다음과 같다.When defining the basic terms used in describing the present invention are as follows.
- 확률밀도함수(PDF, Probability Density Function):Probability Density Function (PDF):

- 누적분포함수(CDF, Cumulative Distribution Function):Cumulative Distribution Function (CDF):

- 모집단(S): 해양기상 관측용 부이에서 관측한 모집단의 데이터 수로, 본 발명의 실시 예에서는 56,675개로 설정Population (S): The number of data of the population observed from the buoy for ocean meteorological observation, set to 56,675 in the embodiment of the present invention.
- 표본수(N): 모집단에서 추출한 표본 데이터의 수로, 본 발명의 실시 예에서는 100개로 설정Number of samples (N): the number of sample data extracted from the population, set to 100 in an embodiment of the present invention
(4-1-1) 모집단의 각 변수별로 CDF를 구한다: 도 1의 실시 예는 기온(Ta), 수온(Ts), 상대습도(RH)에 대한 CDF 분포를, 도 2의 실시 예는 풍속(Ws), 풍향(Wd)에 대한 CDF 분포를 보여준다. (4-1-1) A CDF is calculated for each variable of the population: the embodiment of FIG. 1 shows a CDF distribution for temperature Ta, water temperature Ts, and relative humidity RH, and the embodiment of FIG. (Ws), CDF distribution for wind direction (Wd).
(4-1-2) CDF를 N개로 분할한다: 즉, CDF( =F(Xi) ) = 0, 1/N, 2/N, ... , N/N(=1)값에 대응하는 Xi(=기온(Ta), 수온(Ts), 상대습도(RH), 풍속(Ws), 풍향(Wd))를 구한다. 이때 CDF는 반드시 균일하게 분할해야 하며 대응되는 X(예, X1 = 기온 (Ta), X2 = 수온(Ts))의 분포는 불균일한 값들을 가지게 된다(도 3, 도 4 참조). 이때 CDF의 기울기가 클수록 X의 간격은 좁아지게 된다. 이러한 현상은 CDF는 PDF의 적분값이므로 CDF의 기울기는 PDF를 의미하고, 균일하게 분할된 CDF는 동일한 확률을 갖는 구간과 동일한 의미가 된다. 즉, 발생확률이 높은 구간에는 좁은 X간격을, 발생확률이 낮은 구간에는 넓은 X간격을 갖도록 X값이 N개의 구간으로 나눠진다(도 3, 도 5 참조). 이와 같이 나눠진 각 구간들을 '슬롯(slot)'이라고 칭한다. (4-1-2) Divide the CDF into N: that is, CDF (= F (Xi)) = 0, corresponding to 1 / N, 2 / N, ..., N / N (= 1) Xi (= temperature Ta, water temperature Ts, relative humidity (RH), wind speed (Ws), wind direction (Wd)) is obtained. At this time, the CDF must be divided evenly and the distribution of corresponding X (eg, X 1 = temperature Ta, X 2 = water temperature Ts) has non-uniform values (see FIGS. 3 and 4). At this time, the larger the slope of the CDF, the narrower the interval of X. Since the CDF is an integral value of the PDF, the slope of the CDF means PDF, and the uniformly divided CDF has the same meaning as the interval having the same probability. That is, the X value is divided into N sections so as to have a narrow X interval in a section having a high probability of occurrence and a wide X interval in a section having a low probability of occurrence (see FIGS. 3 and 5). Each of the divided sections is called a 'slot'.
즉, Slot(Xj) = Xj - Xj-1 (j=1,2, ..., N)That is, Slot (Xj) = Xj-Xj-1 (j = 1,2, ..., N)
여기서, F(Xj) = j/NWhere F (Xj) = j / N
따라서 기온(Ta), 수온(Ts), 상대습도(RH), 풍속(Ws), 풍향(Wd)과 같은 각 기상변수별 slot의 수는 추출할 표본의 수와 같아진다. 즉, 각 변수별(기온, 수온 등)로 각 slot 구간에서 중복되거나 빠뜨림 없이 하나씩의 표본만을 추출하면 추출된 표본들이 갖는 확률분포는 모집단이 갖는 확률분포와 같아지게 되는 것이다. 예를 들어, 도 3에서 -9.3 ≤ Ta < 3.6 구간(slot)에 해당되는 표본을 하나 추출하면 이 slot에 해당되는 표본은 더 이상 추출할 수 없으며, 21.1 ≤ Ta < 23.1 구간에 해당되는 표본을 하나 추출하면 마찬가지로 이 slot에 해당되는 표본은 더 이상 추출할 수 없다. 즉, 두 구간의 발생확률은 각각 10%로 동일하게 되는 것이다.Therefore, the number of slots for each weather variable such as temperature (Ta), water temperature (Ts), relative humidity (RH), wind speed (Ws), and wind direction (Wd) becomes equal to the number of samples to be extracted. That is, if only one sample is extracted without overlapping or missing in each slot section for each variable (temperature, water temperature, etc.), the probability distribution of the extracted samples becomes equal to the probability distribution of the population. For example, in FIG. 3, if one sample corresponding to -9.3 ≤ Ta <3.6 slots is extracted, a sample corresponding to this slot can no longer be extracted, and a sample corresponding to 21.1 ≤ Ta <23.1 intervals is extracted. Once extracted, the sample corresponding to this slot can no longer be extracted. That is, the probability of occurrence of the two sections is equal to 10%, respectively.
(4-2) 표본 추출을 위한 우선순위 적용(4-2) Apply priorities for sampling
(4-2-1) 상관관계를 갖는 관측 데이터의 발생확률을 계산한다: 일반적으로 기상변수들은 서로 상관관계(correlation)를 갖는다. 예를 들어, 기온과 수온의 경우 매우 강한 상관관계를 가지며(도 6 참조), 기온과 상대습도는 중간 정도의 상관관계를 가지며(도 7 참조), 기온과 풍향은 매우 낮은 상관관계를 가진다(도 8 참조). 참고로, 본 발명의 실시 예에서 해석에 적용한 데이터(동해 부이 관측데이터)의 기상변수들 간 상관관계(correlation coefficient)를 정리하면 도 26에서 보는 것과 같다. (4-2-1) Calculate the probability of occurrence of correlated observation data: in general, weather variables have correlations with each other. For example, temperature and water temperature have a very strong correlation (see FIG. 6), temperature and relative humidity have a moderate correlation (see FIG. 7), and temperature and wind direction have a very low correlation (see FIG. 7). 8). For reference, a correlation coefficient between weather variables of data (East Sea buoy observation data) applied to an analysis according to an embodiment of the present invention is shown in FIG. 26.
따라서 관측된 기상데이터들의 발생확률을 계산하기 위해서는 기상변수들 간의 상관관계를 고려한 발생확률을 계산해야 한다. 그러나 각 기상변수들은 서로 상관관계를 가지므로(즉, 서로 독립이 아니므로) 아래 식과 같이 각 변수들 간의 발생확률을 구한 후 각각을 곱하여 구할 수 없다.Therefore, in order to calculate the probability of occurrence of observed weather data, it is necessary to calculate the probability of occurrence considering the correlation between weather variables. However, since the weather variables are correlated with each other (that is, they are not independent of each other), the probability of occurrence between each variable cannot be obtained by multiplying them by the following equation.
이 경우, 이와 같이 서로 상관관계를 가지면서 결합된 변수들의 발생확률을 구하기 위해서는 주성분분석법(PCA: Principal Component Analysis)을 이용하여 각 기상변수(Xk)를 서로 독립인 변수(Yk)로 변환시킬 수 있으며, 이 때 서로 독립인 변수(Yk)에 대한 상관관계계수를 구하면 도 27에서 보는 것과 같이 얻어진다.In this case, in order to calculate the probability of occurrence of the combined variables having correlation with each other, each weather variable (Xk) can be converted into independent variables (Yk) by using Principal Component Analysis (PCA). In this case, the correlation coefficients for the variables Yk independent of each other are obtained as shown in FIG. 27.
이처럼 변수 Yk를 구하면 각각의 Yk(k=1~5)에 대한 F(Yk)( = CDF(Yk) )를 구할 수 있으며, 그 과정은 상기 X에 대한 CDF를 구하는 과정과 동일하다. 참고로, CDF(Yk)를 이용하여 PDF(Yk)를 구하는 과정은 아래와 같이 PDF와 CDF에 대한 정의식으로부터 구할 수 있다.Thus, if the variable Yk is obtained, F (Yk) (= CDF (Yk)) for each Yk (k = 1-5) can be obtained, and the process is the same as the process of obtaining the CDF for X. For reference, the process of obtaining PDF (Yk) using CDF (Yk) can be obtained from the following formulas for PDF and CDF.
위 식을 이용하면 i-번째 데이터의 결합확률(joint probability)은 다음 식과 같이 구할 수 있다(Y 변수는 모두 독립이므로 각각의 확률을 곱하여 결합확률을 구할 수 있다).Using the above equation, the joint probability of the i-th data can be obtained as the following equation (Y variables are independent, so the joint probability can be obtained by multiplying each probability).
그리고 위의 결합확률은 전체 값을 이용하여 다음과 같이 표준화(normalize)해서 사용하는 것이 편리하다. 이러한 결합확률은 각 관측데이터들의 발생확률을 의미한다. 즉, 본 발명에서 주성분분석법을 이용하면 서로 상관관계를 가지면서 결합된 변수들의 발생확률을 구할 수 있는 것이다.In addition, it is convenient to normalize the above combined probability using the whole value as follows. This combined probability means the probability of occurrence of each observation data. That is, in the present invention, using the principal component analysis method, it is possible to obtain the probability of occurrence of the combined variables having correlation with each other.

(4-2-2) 표본 추출의 우선순위를 설정한다: 상술한 (4-1-2)와 (4-2-1)의 내용을 참조하면, 추출 후보가 되는 모든 관측데이터는 각각 처음에 5개의 기상변수(기온, 수온, 상대습도, 풍속, 풍향)에 관한 slot들과 각각의 발생확률(Pji)을 가진다. 예를 들어, 기상변수가 2개(기온, 수온)인 경우에 대해 도 10 및 이와 연계한 도 28의 네 점(A, B, C, D)을 비교하여 설명하면 다음과 같다. 이 경우, 기온 slot과 관련하여서는 도 3을 참조하고 수온 slot과 관련하여서는 도 4를 참조한다. (4-2-2) Setting the Priority of Sampling: Referring to (4-1-2) and (4-2-1) above, all observation data that are candidates for extraction are initially set. It has slots for five weather variables (temperature, water temperature, relative humidity, wind speed, wind direction) and their probability of occurrence (P ji ). For example, the case of two weather variables (temperature, water temperature) will be described by comparing four points (A, B, C, D) of FIG. 10 and FIG. 28 associated with this as follows. In this case, reference is made to FIG. 3 in relation to the air temperature slot, and FIG. 4 in relation to the water temperature slot.
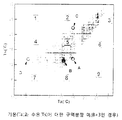
도 10 및 도 28의 네 점들 중 먼저 구역-8(여기서, '구역(block)'의 의미 및 그 설정방법에 대해서는 후술함)에 속해 있는 점 A와 점 B를 비교하면 A보다 B의 발생확률이 높다(일반적으로 점들의 분포에서 가장자리에 위치할수록 그 발생확률이 낮은 특징을 갖는다). 이 때, 본 발명에서는 가급적 넓은 범위의 데이터를 활용하기 위해서(= 추출된 표본들이 가급적 다양한 기상조건을 구성할 수 있도록 하기 위해서 = 추출된 표본들이 가급적 광범위한 분포특성을 갖도록 하기 위해서) 발생확률이 낮은 데이터에 높은 우선순위를 부여한다. 즉, 발생확률이 낮은 점들에 표본 추출의 우선순위를 높게 설정하는 것이다. 따라서 상기 예에서는 B보다 발생확률이 낮은 A가 표본으로 추출된다.The probability of occurrence of B is greater than A when comparing the points A and B belonging to Zone-8 (where the meaning of 'block' and how to set them will be described later) among the four points of FIGS. 10 and 28. This is high (generally located at the edge of the distribution of points has a lower probability of occurrence). In this case, in the present invention, the probability of occurrence is low in order to utilize a wide range of data (= so that the extracted samples can configure various weather conditions as possible = so that the extracted samples have broad distribution characteristics as much as possible). Give the data a high priority. In other words, the sampling priority is set to high points with low probability of occurrence. Therefore, in the above example, A having a lower probability of occurrence than B is sampled.
표본이 하나도 추출되지 않은 단계에서는 모든 점들이 기본적으로 5개(기온, 수온, 상대습도, 풍속, 풍향)의 가용(available) slot을 갖는다. 그러나 첫 번째 추출한 점이 A인 경우, A와 동일한 slot에 속한 점들은 가용 slot의 수가 줄어들게 된다. 예를 들어, A와 동일한 기온 slot에 속한 점 C(도 11 참조)는 해당 기온 slot에 해당되는 표본(점 A)이 이미 추출되었기 때문에 기온의 가용 slot이 1에서 0으로 줄어들게 된다. 따라서 기상변수가 상기 예처럼 2개(기온, 수온)인 경우에는 Nslot이 2에서 1로 줄어들게 된다(일반적으로 볼 때, 기상변수가 기온, 수온, 상대습도, 풍속, 풍향 등 5개이고 기온을 제외한 다른 기상변수들의 가용 slot이 A와 겹치지 않는다면 Nslot이 5에서 4로 줄어들게 된다). 이와 유사하게 A와 동일한 수온 slot에 속한 점 D도 수온의 가용 slot이 1에서 0으로 줄어들게 된다. 즉, 도 11에 나타낸 것과 같이 먼저 추출된 표본에 의해 해당 구간(slot)에 해당되는 표본(점)들은 가용 slot의 수가 줄어들어 우선순위가 낮아지게 되는 것이다.In the stage where no sample is extracted, all points basically have 5 available slots (temperature, water temperature, relative humidity, wind speed, wind direction). However, if the first extracted point is A, the points belonging to the same slot as A will reduce the number of available slots. For example, the point C (see FIG. 11) belonging to the same temperature slot as A has a sample (point A) corresponding to the temperature slot, and thus the available slot of the temperature is reduced from 1 to 0. Therefore, if the weather variables are two (temperature, water temperature) as in the above example, the N slots are reduced from 2 to 1 (generally, the weather variables are five, such as temperature, water temperature, relative humidity, wind speed, and wind direction, N slots will be reduced from 5 to 4 if the available slots of the other weather variables do not overlap A). Similarly, point D, which belongs to the same water temperature slot as A, also reduces the available slot of water temperature from 1 to 0. That is, as shown in FIG. 11, the samples (dots) corresponding to the corresponding slots are first reduced by decreasing the number of available slots.
이와 같은 과정을 통해 기온, 수온, 상대습도, 풍속, 풍향 등 5개의 변수로 구성된 각각의 관측데이터들에 가용한 slot의 수와 발생확률로 결정되는 우선순위를 부여하고, 표본(점)을 추출할 때마다 나머지 모든 점들의 우선순위를 갱신한다. 참고로, 우선순위(Rank, Ri)는 다음의 식과 같이 표현될 수 있다. 하지만, 우선순위는 반드시 아래 식의 형태를 가질 필요는 없으며, Nslot(슬롯의 개수)에 비례하고 PJi(발생확률)에 반비례할 수 있는 관계식이면 무방하다.Through this process, priority is determined by the number of available slots and the probability of occurrence in each observation data consisting of five variables such as temperature, water temperature, relative humidity, wind speed, and wind direction, and a sample is extracted. Each time you update the priority of all the remaining points. For reference, priority (Rank, Ri) may be expressed as the following equation. However, the priority does not have to be in the form of the following equation, and may be a relation that is proportional to N slot (number of slots) and inversely proportional to P Ji (probability).

위의 예에서 점 A가 표본으로 추출된 경우 위와 같은 우선순위 조정을 통해 도 11의 경우 구역 2, 5, 7에서 회색구간(slot)에 포함되어 있는 점들은 동일 구역 내의 다른 점들에 비해 우선순위가 낮아지게 된다. 따라서 구역 2, 5, 7에서 다음 번째 표본을 추출하는 경우 회색구간(slot) 바깥의 점들이 표본으로 추출될 수 있게 된다.In the example above, if point A is sampled, the points included in the gray slots in zones 2, 5, and 7 in FIG. 11 have priority over other points in the same zone. Will be lowered. Therefore, when the next sample is taken in zones 2, 5, and 7, the points outside the gray slot can be sampled.
(4-3) 구역 설정 및 각 구역에서의 표본 추출(4-3) Zoning and Sampling in Each Zoning
(4-3-1) 여러 변수들 간의 상관관계를 고려하여 구역(block)을 설정한다: 도 6 내지 도 8에서 보는 바와 같이 모든 기상변수들 간에는 상관관계가 존재한다. 추출된 표본을 이용한 해석결과가 광범위한 기상조건에 대한 해석결과를 대표하기 위해서는 다양한 조합에 해당되는 표본을 추출하는 것이 바람직하다. 이를 위하여 각 기상변수들 간의 구역을 분할하고 각 구역별로 표본을 추출한다. 따라서 분할되는 전체 구역의 수는 추출하고자 하는 표본의 수(N)보다 커야 하며, 전체 구역의 수(Btot)는 각 변수(기온, 수온, 상대습도, 풍속, 풍향 등 5개의 변수)별로 분할된 구역의 수의 곱으로 나타난다. 즉, 다음과 같다. (4-3-1) A block is set in consideration of correlations between various variables: As shown in FIGS. 6 to 8, there is a correlation between all weather variables. In order for the analysis results using the extracted samples to represent the analysis results for a wide range of weather conditions, it is desirable to extract samples corresponding to various combinations. To do this, we divide the zones between each weather variable and sample each zone. Therefore, the total number of zones to be divided must be larger than the number of samples to be extracted (N), and the total number of zones (B tot ) is divided by each variable (five variables including temperature, water temperature, relative humidity, wind speed, and wind direction). It is represented by the product of the number of sections that have been set That is as follows.
이 때, 각 변수별로 분할된 구역의 수를 동일하게 하는 경우 Btot=B5
X가 된다. 따라서 N=100인 경우 N<Btot=B5
X이므로 BX≥3이 된다. 즉, 각 변수별로 3개의 구역으로 분할해야 한다. 이 때 분할 기준은 각 변수별 CDF값을 기준으로 한다. 즉, BX=3인 경우 CDF(X) = 0.33, 0.67을 기준으로 구역을 분할한다. 이와 같이 분할하면 각 구역 내에 위치하는 관측데이터의 수가 동일해진다. 예를 들어 도 1에서 기온(Ta)의 CDF = 0.33, 0.67에 해당되는 Ta = 9.9(℃), 18.8(℃)이다. 이에 해당되는 구역을 나누면 도 9과 같이 나타날 수 있으며, 각 구역에 위치한 관측데이터(모집단)의 수는 동일하게 된다.At this time, when the number of divided zones for each variable is the same, B tot = B 5 X. Therefore, when N = 100, N <B tot = B 5 X, so B X ≥ 3. In other words, each variable should be divided into three zones. At this time, the division criteria are based on CDF values for each variable. That is, when B X = 3, the zone is divided based on CDF (X) = 0.33, 0.67. This division makes the same number of observation data located in each zone. For example, Ta = 9.9 (° C) and 18.8 (° C) corresponding to CDF = 0.33 and 0.67 of the temperature Ta in FIG. Dividing the corresponding zone can be shown as shown in Figure 9, the number of observation data (population) located in each zone is the same.
이와 같은 방식으로 다른 기상변수(수온, 상대습도 등)에 대해서도 구역을 나눌 수 있고 모든 기상변수들에 대해 구역을 나누면 5차원적 구역으로 설정되고, 전체 구역의 수는 35=243개가 된다. 이해를 돕기 위해 만일 기온과 수온만을 고려하는 것으로(2차원 문제)로 단순화시키면 전체 구역의 수는 9개(32)가 되며 도 10에 나타낸 것과 같이 각 구역을 표시할 수 있다. 이 때 모든 구역에 위치하는 관측데이터의 수가 동일한 것은 아니다. 도 10에서 수평으로 분할된 구역들(수온 기준 분할) 3개에는 모두 같은 수의 데이터가 존재하고, 수직으로 분할된 구역들(기온 기준 분할) 3개도 같은 수의 데이터가 존재하지만, 수평과 수직으로 모두 분할된 9개 구역들은 동일한 수의 데이터가 아니라 각 구역별로 다른 데이터 수가 존재하게 된다. 이러한 현상은 차원의 수를 2차원(기온, 수온)에서 5차원(기온, 수온, 상대습도, 풍속, 풍향)까지 올리는 경우도 동일하게 나타난다. 즉, 243개(35)의 구역들에는 서로 다른 개수(n)의 관측데이터들이 포함되어 있으며, 관측데이터를 전혀 포함하지 않는 경우(n=0)도 다수 생길 수 있다(예, 도 10에서 구역-9).In this way, the zones can be divided for other weather variables (water temperature, relative humidity, etc.), and if the zones are divided for all weather variables, it is set as a five-dimensional zone, and the total number of zones is 3 5 = 243. For the sake of understanding, if only the temperature and water temperature are taken into consideration (two-dimensional problem), the total number of zones is 9 (3 2 ), and each zone can be marked as shown in FIG. At this time, the number of observation data located in all zones is not the same. In FIG. 10, the same number of data exists in all three horizontally divided zones (water temperature reference division), and the same number of data exists in all three vertically divided zones (temperature reference division), but horizontal and vertical Nine zones divided into two regions are not the same number of data, but different data numbers exist for each zone. This phenomenon is the same when raising the number of dimensions from 2 dimensions (temperature, water temperature) to 5 dimensions (temperature, water temperature, relative humidity, wind speed, wind direction). That is, 243 (3 5 ) zones contain a different number (n) of observation data, and may include many cases where no observation data is included (n = 0) (eg, in FIG. 10). Zone-9).
(4-3-2) 각 구역별로 표본을 추출한다: 상기한 바와 같이 구역을 설정하고 나면 각 구역별로 표본을 추출한다. 표본 추출 절차는 다음과 같다. (4-3-2) Sampling in Each Zone: Once the zones have been set up as described above, take samples in each zone. The sampling procedure is as follows.
① 각 구역(B1∼B243)별로 포함된 데이터 수(n)를 확인하고 각 구역별 데이터 비(D = 데이터 수(n) / 전체 데이터 수(S))를 구한다.① Check the number of data (n) included in each zone (B1 ~ B243) and find the data ratio (D = number of data (n) / total number of data (S)) for each zone.
② 데이터 비(D=n/S)를 큰 순으로 정렬하고, 데이터 비가 상위 50%에 속하는 구역(큰 구역)과 하위 50%에 속하는 구역(작은 구역)으로 분류하여, 난수(random number) 발생기를 이용하여 데이터 비가 큰 구역과 작은 구역을 번갈아가며 표본을 추출할 구역을 선택한다. 이 과정을 생략하면 먼저 선택된 구역(임의 선택 구역)에서 우선적으로 표본이 추출됨으로 인하여 추출된 표본이 특정 방향으로 치우칠 수 있다.② Random number generator by sorting the data ratio (D = n / S) in ascending order and classifying the data ratio into the upper 50% (large) and the lower 50% (small). Use to select the area from which the data ratio will be sampled alternately between the large and small areas. If this step is omitted, the sample may be biased in a specific direction because the sample is first sampled from the selected zone (any zone).
③ 선택된 각 구역에 포함된 관측데이터들 별로 상이한 우선순위 값을 이용하여 정렬하고 우선순위가 가장 상위인 데이터를 표본으로 추출한다.③ Sort by using different priority values for each observation data included in each selected zone and sample the data with the highest priority.
④ 표본이 추출될 때마다 나머지 모든 데이터들이 가진 가용 slot의 수가 줄어들 수 있으므로 나머지 모든 데이터들 간의 우선순위 값을 갱신한다.4. Whenever a sample is taken, the number of available slots in all the remaining data may be reduced, so update the priority value among all remaining data.
⑤ 원하는 개수의 표본이 추출될 때까지 ③∼④의 과정을 반복한다.⑤ Repeat the process of ③ ~ ④ until the desired number of samples are extracted.
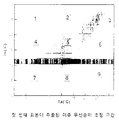
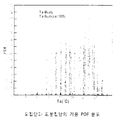
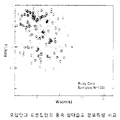
이와 같이 추출된 표본(본 발명의 실시 예에서, N=100)과 모집단(본 발명의 실시 예에서, S=56,675)에 대한 통계적 특성을 비교하면 도 12 내지 도 21와 같다. 모집단의 PDF는 1/S(=0.0000176)의 간격으로 표시되지만 표본집단의 PDF는 1/N(=0.01)의 간격으로만 표시되므로 두 그래프가 정확하게 일치할 수는 없다. 하지만 추출된 표본데이터들이 각 기상변수들 간의 상관관계에 따라 모집단의 특성과 유사한 분포 특성을 가짐을 확인할 수 있다. 그리고 추출된 표본데이터들이 특정 구역에 집중되지 않고 고루 분포된 특성을 확인하기 위해 도 22 내지 도 25에 추출된 표본데이터와 모집단 데이터를 함께 나타내었다. 추출된 표본(N=100)에서 기상변수들 간의 상관관계 계수를 정리하면 도 29와 같다.12 to 21 compare the statistical characteristics of the sample thus extracted (in the embodiment of the present invention, N = 100) and the population (in the embodiment of the present invention, S = 56,675). The PDFs of the population are displayed at intervals of 1 / S (= 0.0000176), but the PDFs of the sample are displayed only at intervals of 1 / N (= 0.01), so the two graphs cannot match exactly. However, it can be seen that the extracted sample data have similar distribution characteristics as the population characteristics according to the correlations between the weather variables. In addition, the sample data extracted in FIG. 22 to FIG. 25 together with the population data are shown together to confirm the evenly distributed characteristics of the extracted sample data without being concentrated in a specific area. The correlation coefficients between the weather variables in the extracted sample (N = 100) are summarized in FIG. 29.
이상에서 설명한 바와 같이 본 발명은, 함정의 적외선신호 해석을 포함하여 기상환경에 민감한 특성을 갖는 물리적 현상에 대한 해석을 위해 실제 관측된 기상데이터에서 적정한 수의 표본을 추출하여 해석을 수행할 수 있도록 함으로써, 실제 환경에서 발생할 수 있는 다양한 특성들을 해석할 수 있도록 하였다. 또한, 모집단이 갖는 통계적 특성과 유사한 특성을 유지하는 표본을 추출할 수 있도록 함으로써, 적은 수의 표본을 이용한 해석을 수행하고 그 결과를 이용하여 실제 해양기상 조건에서 나타날 수 있는 현상을 예측할 수 있도록 하였다. 또한, 각각의 기상변수들이 서로 상관관계를 가질 때 관측데이터들의 발생확률을 계산할 수 있는 방법으로써 주성분분석법을 적용하였으며, 이를 이용하여 광범위한 범위의 기상변화현상을 포함할 수 있는 해양 기상 표본 추출 방법을 구현하였다. 또한, 각 기상변수들 간의 변화범위에 따라 구역을 설정하고 각 구역 내에서 표본을 추출하도록 함으로써 특정 구역에 집중되지 않고 광범위한 모집단에 상응하는 표본을 추출할 수 있는 절차를 확립하였다.As described above, the present invention can be performed by extracting an appropriate number of samples from the actual observed weather data for the analysis of physical phenomena having characteristics sensitive to the weather environment, including the analysis of the infrared signal of the ship. By doing so, it is possible to analyze various characteristics that may occur in a real environment. In addition, by making it possible to extract a sample that retains the characteristics similar to those of the population, the analysis can be performed using a small number of samples and the results can be used to predict phenomena that may occur under actual marine weather conditions. . In addition, the principal component analysis method was applied as a method to calculate the probability of occurrence of observation data when each weather variable has a correlation with each other, and the marine weather sampling method that can cover a wide range of weather change phenomenon is used. Implemented. In addition, by establishing zones and sampling in each zone according to the change range between each weather variable, a procedure was established to extract a sample corresponding to a wide population without being concentrated in a specific zone.
이상의 설명은 본 발명의 기술 사상을 예시적으로 설명한 것에 불과한 것으로서, 본 발명이 속하는 기술 분야에서 통상의 지식을 가진 자라면 본 발명의 본질적인 특성에서 벗어나지 않는 범위 내에서 다양한 수정, 변경 및 치환이 가능할 것이다. 따라서 본 발명에 개시된 실시 예 및 첨부된 도면들은 본 발명의 기술 사상을 한정하기 위한 것이 아니라 설명하기 위한 것이고, 이러한 실시 예 및 첨부된 도면에 의하여 본 발명의 기술 사상의 범위가 한정되는 것은 아니다. 본 발명의 보호 범위는 아래의 청구범위에 의하여 해석되어야 하며, 그와 동등한 범위 내에 있는 모든 기술 사상은 본 발명의 권리범위에 포함되는 것으로 해석되어야 할 것이다.The above description is merely illustrative of the technical idea of the present invention, and various modifications, changes, and substitutions may be made by those skilled in the art without departing from the essential characteristics of the present invention. will be. Therefore, the embodiments disclosed in the present invention and the accompanying drawings are not intended to limit the technical spirit of the present invention, but to explain, and the scope of the technical idea of the present invention is not limited by the embodiments and the accompanying drawings. The protection scope of the present invention should be interpreted by the following claims, and all technical ideas within the equivalent scope should be interpreted as being included in the scope of the present invention.
본 발명에 따르면, 함정의 적외선신호 해석을 포함하여 기상환경에 민감한 특성을 갖는 물리적 현상에 대한 해석을 위해 추출된 표본 기상조건이 모집단이 갖는 통계적 분포특성에 최대한 근접하도록 하고, 해양기상 변수들 간의 상관관계를 반영한 새로운 해양 기상 표본 추출 방법을 제공하는바, 본 발명은 조선해양 산업분야에서 널리 이용하여 그 실용적이고 경제적인 가치를 실현할 수 있는 기술이다.According to the present invention, the sample weather conditions for the analysis of the physical phenomena having characteristics sensitive to the weather environment, including the infrared signal analysis of the ship, to be as close as possible to the statistical distribution characteristics of the population, It provides a new marine weather sampling method reflecting the correlation, the present invention is a technology that can be widely used in the shipbuilding and marine industry to realize its practical and economic value.
Claims (8)
- 컴퓨터가 수행하는 해양 기상 표본 추출 방법으로서,A computerized marine meteorological sampling method,모집단을 이루는 기온, 수온, 상대습도, 풍속, 풍향의 각 기상변수별로 누적분포함수를 구하고 상기 누적분포함수를 추출하고자 하는 표본의 수만큼의 슬롯으로 분할하는 단계(4-1);Obtaining a cumulative distribution function for each meteorological variable such as temperature, water temperature, relative humidity, wind speed, and wind direction forming a population, and dividing the cumulative distribution function into as many slots as the number of samples to be extracted;주성분분석법을 이용하여 서로 상관관계를 가지면서 결합된 상기 기상변수들의 발생확률을 구하고 상기 발생확률이 낮은 데이터에 표본 추출의 높은 우선순위를 설정하는 단계(4-2) 및;Obtaining a probability of occurrence of the combined meteorological variables correlated with each other using principal component analysis, and setting a high priority of sampling to the data with low probability of occurrence;상기 기상변수들 간의 구역을 분할하고 상기 구역별로 상기 우선순위에 따라 표본을 추출하는 단계(4-3);Dividing a zone between the weather variables and sampling the zone according to the priority for each zone (4-3);를 포함하는, 컴퓨터가 수행하는 해양 기상 표본 추출 방법.Comprising a computer-implemented marine meteorological sampling method.
- 청구항 1에 있어서,The method according to claim 1,4-1 단계에서, 상기 누적분포함수는 균일하게 분할하는 것을 특징으로 하는, 컴퓨터가 수행하는 해양 기상 표본 추출 방법.In step 4-1, the cumulative distribution function, characterized in that to divide evenly, the computer-implemented marine meteorological sampling method.
- 청구항 1에 있어서,The method according to claim 1,4-2 단계에서, 상기 우선순위는 상기 슬롯의 개수에 비례하고 상기 발생확률에 반비례하는 관계식을 갖는 것을 특징으로 하는, 컴퓨터가 수행하는 해양 기상 표본 추출 방법.Wherein in step 4-2, the priority has a relation proportional to the number of slots and inversely proportional to the probability of occurrence.
- 청구항 1에 있어서,The method according to claim 1,4-3 단계에서, 상기 구역의 수는 추출하고자 하는 표본의 수보다 큰 것을 특징으로 하는, 컴퓨터가 수행하는 해양 기상 표본 추출 방법.Wherein in step 4-3, the number of zones is greater than the number of samples to be extracted.
- 청구항 1에 있어서,The method according to claim 1,4-3 단계에서, 상기 구역의 수는 상기 기상변수별로 분할된 구역의 수의 곱으로 나타나는 것을 특징으로 하는, 컴퓨터가 수행하는 해양 기상 표본 추출 방법.In step 4-3, wherein the number of zones is represented by the product of the number of zones divided by the weather variable, the computer-implemented marine meteorological sampling method.
- 청구항 1에 있어서,The method according to claim 1,4-3 단계에서, 상기 구역의 분할 기준은 상기 기상변수별 누적분포함수 값을 기준으로 하는 것을 특징으로 하는, 컴퓨터가 수행하는 해양 기상 표본 추출 방법.In step 4-3, the partitioning criteria of the zone is characterized in that based on the cumulative distribution function value for each weather variable, computer-implemented marine meteorological sampling method.
- 청구항 1에 있어서,The method according to claim 1,4-3 단계에서, 표본 추출 절차는,In step 4-3, the sampling procedure,상기 구역별로 포함된 데이터 수를 확인하고 상기 구역별 데이터 비를 구하는 단계(①);Checking the number of data included for each zone and obtaining a data ratio for each zone (1);상기 데이터 비를 큰 순으로 정렬하고 상기 데이터 비가 상위 50%에 속하는 구역(큰 구역)과 하위 50%에 속하는 구역(작은 구역)으로 분류하여 상기 데이터 비가 큰 구역과 작은 구역을 번갈아가며 표본을 추출할 구역을 선택하는 단계(②);The data ratio is sorted in ascending order and the data ratio is divided into the upper 50% region (large region) and the lower 50% region (small region), and the sampling is alternately made between the large region and the small region. Selecting a region to be done (②);선택된 각 구역에 포함된 데이터들 별로 상이한 우선순위 값을 이용하여 정렬하고 우선순위가 가장 상위인 데이터를 표본으로 추출하는 단계(③);Sorting by using different priority values for each data included in each of the selected zones, and sampling the data having the highest priority as a sample (③);표본이 추출될 때마다 나머지 모든 데이터들 간의 우선순위 값을 갱신하는 단계(④) 및;Updating (4) the priority value between all remaining data each time a sample is extracted;원하는 개수의 표본이 추출될 때까지 상기 ③ 내지 ④의 과정을 반복하는 단계(⑤);Repeating the above processes (3) to (4) until a desired number of samples are extracted;에 따라 이루어지는 것을 특징으로 하는, 컴퓨터가 수행하는 해양 기상 표본 추출 방법.Computer-implemented marine meteorological sampling method, characterized in that according to.
- 청구항 7에 있어서,The method according to claim 7,① 단계에서, 상기 데이터 비는, 각 구역별 데이터 수를 n이라 하고 모집단의 데이터 수를 S라 할 때, n/S의 관계식을 갖는 것을 특징으로 하는, 컴퓨터가 수행하는 해양 기상 표본 추출 방법.In step ①, the data ratio is a marine meteorological sampling method, characterized in that when the number of data of each zone is n and the number of data of the population is S, has a relationship of n / S.
Priority Applications (1)
| Application Number | Priority Date | Filing Date | Title |
|---|---|---|---|
| PCT/KR2015/004194 WO2016175342A2 (en) | 2015-04-27 | 2015-04-27 | Ocean meteorological data sampling method performed by computer |
Applications Claiming Priority (1)
| Application Number | Priority Date | Filing Date | Title |
|---|---|---|---|
| PCT/KR2015/004194 WO2016175342A2 (en) | 2015-04-27 | 2015-04-27 | Ocean meteorological data sampling method performed by computer |
Publications (2)
| Publication Number | Publication Date |
|---|---|
| WO2016175342A2 true WO2016175342A2 (en) | 2016-11-03 |
| WO2016175342A3 WO2016175342A3 (en) | 2017-05-18 |
Family
ID=57199141
Family Applications (1)
| Application Number | Title | Priority Date | Filing Date |
|---|---|---|---|
| PCT/KR2015/004194 WO2016175342A2 (en) | 2015-04-27 | 2015-04-27 | Ocean meteorological data sampling method performed by computer |
Country Status (1)
| Country | Link |
|---|---|
| WO (1) | WO2016175342A2 (en) |
Family Cites Families (4)
| Publication number | Priority date | Publication date | Assignee | Title |
|---|---|---|---|---|
| US7584081B2 (en) * | 2005-11-21 | 2009-09-01 | Chevron U.S.A. Inc. | Method, system and apparatus for real-time reservoir model updating using ensemble kalman filter |
| US9196009B2 (en) * | 2009-06-22 | 2015-11-24 | Johnson Controls Technology Company | Systems and methods for detecting changes in energy usage in a building |
| US8805659B2 (en) * | 2011-02-17 | 2014-08-12 | Chevron U.S.A. Inc. | System and method for uncertainty quantification in reservoir simulation |
| US8832497B2 (en) * | 2012-02-07 | 2014-09-09 | A.L.D. Advanced Logistics Development Ltd | Methods, apparatus and systems for performing dynamic fault tree analysis |
-
2015
- 2015-04-27 WO PCT/KR2015/004194 patent/WO2016175342A2/en active Application Filing
Also Published As
| Publication number | Publication date |
|---|---|
| WO2016175342A3 (en) | 2017-05-18 |
Similar Documents
| Publication | Publication Date | Title |
|---|---|---|
| CN103940824B (en) | A kind of aerial electric transmission line isolator detection method | |
| CN107728234B (en) | Thunder and lightning strength value prediction method based on atmospheric electric field data | |
| CN106790019B (en) | Encryption method for recognizing flux and device based on feature self study | |
| CN110569738B (en) | Natural scene text detection method, equipment and medium based on densely connected network | |
| CN108600135A (en) | A kind of recognition methods of signal modulation mode | |
| WO2020209704A1 (en) | Method for generating high-resolution marine data, and device using same | |
| CN110263834B (en) | Method for detecting abnormal value of new energy power quality | |
| CN116612098B (en) | Insulator RTV spraying quality evaluation method and device based on image processing | |
| CN114360030A (en) | Face recognition method based on convolutional neural network | |
| CN113111786B (en) | Underwater target identification method based on small sample training diagram convolutional network | |
| WO2016175343A1 (en) | Marine weather sample extraction performed by computer, and statistical signal analysis method using same | |
| WO2016175342A2 (en) | Ocean meteorological data sampling method performed by computer | |
| CN116758081B (en) | Unmanned aerial vehicle road and bridge inspection image processing method | |
| CN112329791A (en) | Automatic extraction method for hyperspectral image water area | |
| CN110569764B (en) | Mobile phone model identification method based on convolutional neural network | |
| CN112651849A (en) | Voltage monitoring abnormal data identification method and system based on unbalanced data set | |
| CN110009035B (en) | Wind measuring station cluster space clustering method based on image matching | |
| WO2023120811A1 (en) | Rainfall pattern-responsive real-time localized heavy rain prediction system | |
| CN112434685B (en) | Remote sensing image information fine extraction method based on earth surface elements | |
| CN112966710B (en) | FY-3D infrared hyperspectral cloud detection method based on linear discriminant analysis | |
| KR101475625B1 (en) | statistical signature analysis method using ocean climatic sample data by computer | |
| CN114970601A (en) | Power equipment partial discharge type identification method, equipment and storage medium | |
| CN111047079B (en) | Wind power plant wind speed time series prediction method and system | |
| WO2012102437A1 (en) | System and method for searching for similar weather maps through the analysis of a main component | |
| CN114359716A (en) | Multi-remote-sensing fire index automatic integration-based burned area mapping method |
Legal Events
| Date | Code | Title | Description |
|---|---|---|---|
| 121 | Ep: the epo has been informed by wipo that ep was designated in this application |
Ref document number: 15890783 Country of ref document: EP Kind code of ref document: A2 |
|
| NENP | Non-entry into the national phase in: |
Ref country code: DE |
|
| 32PN | Ep: public notification in the ep bulletin as address of the adressee cannot be established |
Free format text: NOTING OF LOSS OF RIGHTS PURSUANT TO RULE 112(1) EPC (EPO FORM 1205A DATED 12/03/2018) |
|
| 122 | Ep: pct application non-entry in european phase |
Ref document number: 15890783 Country of ref document: EP Kind code of ref document: A2 |