WO2016171220A1 - リード化合物の抽出方法、創薬ターゲットの選択方法及び散布図生成装置並びにデータの可視化方法及び可視化装置 - Google Patents
リード化合物の抽出方法、創薬ターゲットの選択方法及び散布図生成装置並びにデータの可視化方法及び可視化装置 Download PDFInfo
- Publication number
- WO2016171220A1 WO2016171220A1 PCT/JP2016/062659 JP2016062659W WO2016171220A1 WO 2016171220 A1 WO2016171220 A1 WO 2016171220A1 JP 2016062659 W JP2016062659 W JP 2016062659W WO 2016171220 A1 WO2016171220 A1 WO 2016171220A1
- Authority
- WO
- WIPO (PCT)
- Prior art keywords
- compound
- scatter diagram
- compounds
- symbol
- drug discovery
- Prior art date
- Legal status (The legal status is an assumption and is not a legal conclusion. Google has not performed a legal analysis and makes no representation as to the accuracy of the status listed.)
- Ceased
Links
Images








Classifications
-
- G—PHYSICS
- G16—INFORMATION AND COMMUNICATION TECHNOLOGY [ICT] SPECIALLY ADAPTED FOR SPECIFIC APPLICATION FIELDS
- G16B—BIOINFORMATICS, i.e. INFORMATION AND COMMUNICATION TECHNOLOGY [ICT] SPECIALLY ADAPTED FOR GENETIC OR PROTEIN-RELATED DATA PROCESSING IN COMPUTATIONAL MOLECULAR BIOLOGY
- G16B15/00—ICT specially adapted for analysing two-dimensional [2D] or three-dimensional [3D] molecular structures, e.g. structural or functional relations or structure alignment
- G16B15/30—Drug targeting using structural data; Docking or binding prediction
-
- G—PHYSICS
- G16—INFORMATION AND COMMUNICATION TECHNOLOGY [ICT] SPECIALLY ADAPTED FOR SPECIFIC APPLICATION FIELDS
- G16B—BIOINFORMATICS, i.e. INFORMATION AND COMMUNICATION TECHNOLOGY [ICT] SPECIALLY ADAPTED FOR GENETIC OR PROTEIN-RELATED DATA PROCESSING IN COMPUTATIONAL MOLECULAR BIOLOGY
- G16B15/00—ICT specially adapted for analysing two-dimensional [2D] or three-dimensional [3D] molecular structures, e.g. structural or functional relations or structure alignment
-
- A—HUMAN NECESSITIES
- A61—MEDICAL OR VETERINARY SCIENCE; HYGIENE
- A61P—SPECIFIC THERAPEUTIC ACTIVITY OF CHEMICAL COMPOUNDS OR MEDICINAL PREPARATIONS
- A61P43/00—Drugs for specific purposes, not provided for in groups A61P1/00-A61P41/00
-
- G—PHYSICS
- G16—INFORMATION AND COMMUNICATION TECHNOLOGY [ICT] SPECIALLY ADAPTED FOR SPECIFIC APPLICATION FIELDS
- G16B—BIOINFORMATICS, i.e. INFORMATION AND COMMUNICATION TECHNOLOGY [ICT] SPECIALLY ADAPTED FOR GENETIC OR PROTEIN-RELATED DATA PROCESSING IN COMPUTATIONAL MOLECULAR BIOLOGY
- G16B45/00—ICT specially adapted for bioinformatics-related data visualisation, e.g. displaying of maps or networks
-
- C—CHEMISTRY; METALLURGY
- C12—BIOCHEMISTRY; BEER; SPIRITS; WINE; VINEGAR; MICROBIOLOGY; ENZYMOLOGY; MUTATION OR GENETIC ENGINEERING
- C12Q—MEASURING OR TESTING PROCESSES INVOLVING ENZYMES, NUCLEIC ACIDS OR MICROORGANISMS; COMPOSITIONS OR TEST PAPERS THEREFOR; PROCESSES OF PREPARING SUCH COMPOSITIONS; CONDITION-RESPONSIVE CONTROL IN MICROBIOLOGICAL OR ENZYMOLOGICAL PROCESSES
- C12Q1/00—Measuring or testing processes involving enzymes, nucleic acids or microorganisms; Compositions therefor; Processes of preparing such compositions
- C12Q1/48—Measuring or testing processes involving enzymes, nucleic acids or microorganisms; Compositions therefor; Processes of preparing such compositions involving transferase
- C12Q1/485—Measuring or testing processes involving enzymes, nucleic acids or microorganisms; Compositions therefor; Processes of preparing such compositions involving transferase involving kinase
Definitions
- the present invention relates to a lead compound extraction method, a drug discovery target selection method, and an apparatus for generating a scatter diagram used in those methods.
- the present invention also relates to a data visualization method and visualization apparatus.
- the success rate of drug development is very low. Now, it is said that the probability of success of a compound that has been studied as a drug candidate in the world as a new drug is 1 in 3591. In order to increase the success rate and launch a new drug as soon as possible, it is important to acquire a good lead compound.
- a lead compound is a “drug” like ”compound that shows activity and pharmacological action against a drug discovery target (hereinafter also referred to as“ drug discovery target ”), and can be a starting point for further optimization (Lead Optimization) .
- a compound having a high expectation value for the possibility of synthetic development can be called a high-quality lead compound.
- the lead compound is selected from compounds (hit compounds) that exhibit an activity exceeding a certain set standard by compound screening against a drug discovery target.
- the result obtained by the compound screening is visualized in a format such as a heat map, and can be used for selection of the lead compound.
- a method of creating a two-dimensional scatter diagram for activity and selectivity and selecting a compound having high activity and high selectivity is also known (Non-Patent Document 1, Non-Patent Document 2).
- the heat map is a convenient display system for viewing the relationship between the compound and the activity value on a single sheet, but it is difficult to view the data from a bird's-eye view, especially when the number of data points is enormous. Moreover, although a group of compounds having high activity and high selectivity can be selected from a two-dimensional scatter diagram, it has not been possible to determine whether the group can be expected to develop a synthesis.
- the object of the present invention is to provide a method for extracting / selecting a high-quality lead compound and a drug discovery target that can be expected to develop synthesis. Moreover, an object of this invention is to provide the scatter diagram production
- the present inventors have prepared high-quality lead compounds by creating a four-dimensional scatter diagram using the values of activity, selectivity, molecular weight and ligand efficiency obtained by screening. I found that I can choose. That is, the present inventors have completed the present invention by finding a visualization method using a four-dimensional scatter diagram of enormous data points for selecting a high-quality lead compound, which allows a comprehensive overview of the possibility of synthesis development.
- this 4D scatter diagram can the candidate drug target be obtained by synthesizing and developing the target drug discovery target in the future without having to find a good quality lead compound at the time of creating the 4D scatter diagram? It can be determined whether or not.
- this four-dimensional scatter diagram it is possible to determine whether or not synthesis development should be performed from a compound library for a certain drug discovery target. That is, the suitability of the compound library for a drug discovery target can be determined.
- a method for extracting lead compounds includes a step of arranging a symbol representing a compound according to a plurality of characteristics of the compound for a plurality of compounds to create a scatter diagram, and a symbol disposed in a predetermined area on the scatter diagram. Extracting a lead compound from the compounds represented by: In the scatter diagram, the arrangement position of the symbol is determined based on the first and second characteristics of the compound, and the attribute of the symbol is determined based on the third and fourth characteristics of the compound.
- the drug discovery target selection method includes a step of creating a scatter diagram by arranging symbols indicating compounds according to a plurality of characteristics of a compound for a plurality of compounds for a predetermined molecular target, and a method for selecting a drug target. Selecting a predetermined molecular target as a drug discovery target based on the distribution of the symbols. In the scatter diagram, the arrangement position of the symbol is determined based on the first and second characteristics of the compound, and the attribute of the symbol is determined based on the third characteristic of the compound.
- the compounds are classified into a plurality of groups based on a predetermined condition relating to the third characteristic, and the selecting step creates a predetermined molecular target based on the direction of change in the distribution of symbols of the compounds belonging to each group. Decide whether to select as a drug target.
- a scatter diagram generating device for generating a scatter diagram showing characteristics of a plurality of compounds with respect to a predetermined drug discovery target.
- the scatter diagram generation device generates a scatter diagram by arranging, for a plurality of compounds, an acquisition means for acquiring characteristic information regarding various characteristics of the compound, and a symbol indicating each compound according to the acquired property information for the plurality of compounds.
- a scatter diagram creating means for outputting.
- the scatter diagram creating means determines, for each compound, the symbol placement position on the scatter diagram based on the first and second feature values of the compound, and determines the symbol attributes based on the third and fourth feature values of the compound.
- the symbol indicating the compound is arranged on the scatter diagram based on the determined position and attribute.
- a visualization method for visualizing a tendency of data having at least first to fourth characteristics determines a position where a symbol indicating each data is arranged based on the first and second characteristics, and determines and determines an attribute of the symbol indicating each data based on the third and fourth characteristics. Based on the position and attributes, symbols indicating each data are arranged on the scatter diagram.
- a visualization device that visualizes a tendency of data having at least first to fourth characteristics.
- the visualization apparatus includes an acquisition unit that acquires characteristic information regarding the characteristics of each data for a plurality of data, and a scatter diagram generation unit that generates a scatter diagram based on the acquired characteristic information of the data.
- the scatter diagram generating means determines a position where a symbol indicating each data is arranged based on the first and second characteristics, determines an attribute of the symbol indicating each data based on the third and fourth characteristics, A symbol indicating each data is arranged on the scatter diagram based on the determined position and attribute.
- a second extraction method for extracting a lead compound from a plurality of compounds with respect to a drug discovery target for a plurality of compounds, a step of creating a scatter diagram by arranging symbols indicating compounds in accordance with a plurality of characteristics of the compound, and symbols arranged in a predetermined region on the scatter diagram include Extracting lead compounds from the indicated compounds.
- the symbol arrangement position is determined based on the first and second characteristics of the compound. The first characteristic is the selectivity of the compound for a given drug discovery target, and the second characteristic is the activity of the compound for a given drug discovery target.
- the predetermined region is a region where both the selectivity of the compound and the activity of the compound are equal to or greater than a predetermined value.
- a compound having a ligand efficiency of 0.3 or more is extracted from the compounds indicated by the symbols arranged in the predetermined region.
- a second visualization method for visualizing trends of a plurality of data having at least first to third characteristics determines a position where a symbol indicating each data is arranged based on the first and second characteristics, and arranges a symbol indicating each data on the scatter diagram based on the determined position,
- the data is classified into a plurality of groups under a predetermined condition with respect to the third characteristic, and an arrow connecting the centroids of the distribution of the symbols of the data belonging to the plurality of classified groups is arranged on the scatter diagram.
- the lead compound extraction method of the present invention by extracting lead compound candidates from a predetermined region on a scatter diagram, it is possible to extract a high-quality lead compound that can be expected to develop a synthesis. Become.
- the drug discovery target that uses the predetermined target for drug discovery. Select as a drug target. Thereby, it is possible to select a drug discovery target that can be expected to be synthetically developed.
- the scatter diagram generation apparatus of the present invention can provide a scatter diagram suitable for the extraction of the lead compound or selection of a drug discovery target.
- the position of the symbol of the compound plotted in the scatter diagram is set based on the first and second characteristics of the compound, and the symbol attributes (color, size, etc.) are the third and fourth characteristics of the compound. It is set based on. This makes it possible to visually grasp the four characteristics of the compound simultaneously. In addition, it is possible to capture data from a bird's-eye view, and it is possible to predict the possibility of composition development.
- the four characteristics of the analysis target data can be visually recognized simultaneously, and the tendency of the analysis target data can be easily grasped.
- Diagram showing a four-dimensional scatter plot with arrows to predict the possibility of synthetic expansion Figure with only arrows to predict the possibility of synthetic expansion
- the figure which showed the aspect where the four-dimensional scatter diagram for each of five kinds of kinases (drug discovery target) was displayed side by side A diagram showing only the arrows for predicting the possibility of synthetic development, generated from each of the four-dimensional scatter plots for five types of kinases (drug discovery targets).
- FIG. 1 showing the results of evaluating tens of thousands of compounds against target
- C Diagram showing the hardware configuration of the 4D scatter plot generator Flowchart showing display operation of 4D scatter diagram in 4D scatter diagram generator The figure explaining the frame for distinguishing and showing the 1st priority area and the 2nd priority area in the area of high activity and high selectivity
- the flowchart which shows the production
- a molecular target is in vivo and is deeply related to a cause causing a clinical disorder or disease, and the disease is prevented and / or treated by controlling it in some way.
- a functional polymer that can be produced.
- receptors for example, cell surface receptors such as ion channel-coupled receptors, tyrosine kinase-coupled receptors, and G protein-coupled receptors, nuclei such as retinoic acid receptors and steroid hormone receptors) Receptors
- enzymes for example, redox enzymes such as dehydrogenase, reductase, oxidase, oxygenase, hydroperoxidase, methyltransferase, hydroxymethyltransferase, formyltransferase, carboxyltransferase, carbamoyltransferase, amide transferase, acyltransferase, aminoacyltransferase, Glycosyltransfer
- the drug discovery target means a target for drug discovery among molecular targets.
- the drug discovery target is preferably an enzyme, more preferably a transferase, and particularly preferably a kinase.
- drug discovery targets may be receptor or transporter proteins.
- a lead compound is a compound that has an activity in a drug discovery target and has a weaker activity in a molecular target other than the drug discovery target than the activity in the drug discovery target, and can be converted into a drug by structural transformation. means.
- the activity in drug discovery targets may not yet be strong enough.
- a lead compound having activity in two or more drug discovery targets may be desired.
- a scatter diagram is a diagram in which data is plotted as symbols with the vertical axis and horizontal axis corresponding to two items (characteristics) corresponding to the amount and size. That is, each data has a quantity, a size, etc. for two items (characteristics).
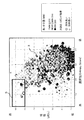
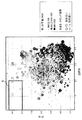
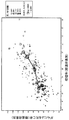
- FIG. 1 is a diagram showing an example of a four-dimensional scatter diagram in the present embodiment.
- the four-dimensional scatterplot shown in the figure shows a compound activity value (for example, pIC 50 ), selectivity (for example, entropy core), ligand efficiency, and molecular weight for a target kinase (an example of a drug target or molecular target).
- It is a scatter diagram which plotted a plurality of compounds based on one parameter.
- the horizontal axis (X-axis) is selectivity
- the vertical axis (Y-axis) is the activity value
- the symbol indicating the compound on the two-dimensional plane of selectivity-activity value 3 (circle mark) is generated by plotting.
- the color and size of the symbol 3 indicating a compound are determined based on the molecular weight of the compound and the ligand efficiency (details will be described later). According to such a four-dimensional scatter diagram, it is possible to visually grasp the four characteristics of the compound at the same time, and it is possible to grasp the data from a bird's-eye view and predict the possibility of synthesis development. It becomes.
- the activity of a lead compound against a drug discovery target includes receptor binding activity, receptor control activity, receptor signal transduction activation activity, receptor signal transduction inhibition activity, enzyme control activity, enzyme activation.
- the notation method of the activity value is not particularly limited. For example, activation rate, inhibition rate, control rate, half activation concentration (EC 50 ), pEC 50 , half inhibition concentration (IC 50 ), pIC 50 , estimated half inhibition Concentration (eIC 50 ), peIC 50 , half lethal concentration (LC 50 ), pLC 50 , activation constant (K a ), pK a , inhibition constant (K i ), pK i , dissociation constant (K d ), pK d , Half effective dose (ED 50 ), pED 50 , half inhibitory dose (ID 50 ), pID 50 , half lethal dose (LD 50 ), pLD 50 , association rate constant (k on ), dissociation rate constant (k off ), Examples include residence time, free energy ( ⁇ G), enthalpy ( ⁇ H), entropy ( ⁇ S), and melting temperature (Tm).
- the half-inhibitory concentration IC 50 (pIC 50 ) is used as an example of a method for expressing the activity value.
- IC 50 (pIC 50 ) a method for calculating the half-inhibitory concentration (IC 50 (pIC 50 )) of the enzyme inhibitory activity will be described.
- Termination Buffer Quality of Service
- the average signal of control wells containing all reaction components was 0% Inhibition, the average signal of background wells (no enzyme added) was 100% Inhibition, and the inhibition rate (%) was calculated from the signal of each test substance test well.
- the compound concentration that inhibits phosphorylation of the substrate by 50% was defined as IC 50 .
- the IC 50 value was calculated by the least square method by putting the obtained inhibition rate into the following logistic equation.
- Y Bottom + (Top-Bottom) / (1 + 10 ⁇ (HillSlope ⁇ (logIC 50 -log 10 (X)))
- Y inhibition rate (%)
- X concentration
- Top maximum inhibition rate (100 in this experiment)
- Bottom minimum inhibition rate (0 in this experiment)
- HillSlope slope (1 in this experiment)
- the inhibition rate (%) at the maximum evaluation concentration was 20% or less, that is, when the activity was not shown, it was set to a constant value because it was used for calculation of entropy core as an index of selectivity later.
- the IC 50 values at the maximum rating levels if the current is 10 ⁇ M is 4,000MyuM, an IC 50 value at the maximum rated density 100 ⁇ M was 40,000MyuM.
- IC 50 values were calculated by the method, into a -log IC 50 values in the pIC 50 values i.e. molar concentrations, which were the active value.
- the selectivity of the lead compound means the ratio of the activity of the lead compound in the target drug discovery target to the activity of the lead compound in the molecular target other than the target drug discovery target.
- the index of selectivity of the lead compound for the drug discovery target is not particularly limited.
- entropy core, selectivity entropy, information entropy, Shannon entropy, selection Examples include sex score (selectivity score), selectivity index (selectivity index), Gini coefficient (Gini coefficient), Gini score (Gini score), and partition coefficient (partition coefficient).
- the entropy core, the selectivity score, the selectivity index, the Gini coefficient, and the distribution coefficient are preferable, the Gini coefficient and the entropy core are more preferable, and the entropy core is particularly preferable.
- an entropy score is used as an index of selectivity.
- the entropy core was calculated according to non-patent literature (BMC Bioinformatics, 2011, 12, 94) from the IC 50 value calculated by the above method.
- selectivity score (Nature Biotechnology, 2008, 26, 1, 127), Gini coefficient (J. Med. Chem., 2007, 50, 23, 5773), partition coefficient ( J. Med. Chem., 2010, 53, 11, 4502) may be used.
- Ligand efficiency means an evaluation index of a compound that estimates the strength of activity per molecular size.
- the ligand efficiency index is not particularly limited.
- ligand efficiency ligand efficiency
- percent inhibition efficiency index percentage efficiency index
- binding efficiency index binding efficiency index
- surface binding efficiency index surface-binding efficiency index
- Fit quality score fitting quality score
- percent inhibition efficiency Percent Ligand Efficiency
- group efficiency group efficiency, GE
- ligand lipophilicity efficiency LLE
- the ligand efficiency, the percent inhibition efficiency index, the binding efficiency index, and the surface binding efficiency index are preferred, the ligand efficiency and the percentage inhibition efficiency index are more preferred, and the ligand efficiency is particularly preferred.
- the ligand efficiency is calculated in the literature (Drug Discovery Today, 2005, 10, 987) using the IC 50 value calculated by the above method and the number of atoms (heavy atoms) excluding hydrogen of the compound. Calculated according to the method described.
- FIG. 1 Four-dimensional as shown in FIG. 1 using the four characteristics of activity value (pIC 50 ), selectivity (entropy score), ligand efficiency, and molecular weight calculated by the above method for each drug discovery target.
- a scatter plot was created. That is, the symbol 3 representing a compound was plotted with the vertical axis (Y axis) of the four-dimensional scatter diagram as the activity value and the horizontal axis (X axis) as the selectivity. Further, the color of the symbol 3 to be plotted was varied depending on the molecular weight.
- pIC 50 activity value
- selectivity entropy score
- ligand efficiency molecular weight calculated by the above method for each drug discovery target.
- the compounds are classified into three groups: a first group having a molecular weight of less than 300, a second group having a molecular weight of 300 to 350 and a third group having a molecular weight of 350 or more.
- the color of the symbol 3 indicating the compound (for example, red, yellow, blue) is different.
- the size of symbol 3 was varied according to the ligand efficiency.
- the size of the symbol 3 when the value of the ligand efficiency is large, the size of the symbol 3 is set to a larger size, and when the value of the ligand efficiency is small, the size of the symbol 3 is set to a smaller size.
- the size of the symbol 3 when the value of the ligand efficiency is larger than a certain value, the size of the symbol 3 is represented as a certain size, and when the value of the ligand efficiency is smaller than the certain value, the size of the symbol 3 is represented as a certain small size. Expressed as a sasage.
- the pIC 50 of lead compound When using the pIC 50 as the active value, the pIC 50 of lead compound, preferably 4 or more, more preferably 5 or more, particularly preferably 6 or more.
- the entropy core of the lead compound When an entropy core is used as selectivity, the entropy core of the lead compound is preferably 4 or less, more preferably 3 or less, and particularly preferably 2 or less.
- the molecular weight of the lead compound is preferably 500 or less, more preferably 400 or less, and particularly preferably 350 or less.
- the ligand efficiency of the lead compound is preferably 0.25 or more, more preferably 0.3 or more, and particularly preferably 0.35 or more.
- the activity value shown on the vertical axis shows a stronger activity as the value is larger, and the selectivity shown on the horizontal axis shows a compound with better selectivity as the value is smaller.
- the pIC 50 is preferably 6 or more, and The entropy core is 4 or less, more preferably, the pIC 50 is 7 or more and the entropy core is 3 or less, and particularly preferably, the pIC 50 is 8 or more and the entropy core is 2 or less.
- a region having an activity of 8 or more and a selectivity of 2 or less indicates a region containing a compound particularly preferable as a lead compound. Therefore, a frame showing the highly active / highly selective region 5 was arranged on the four-dimensional scatter diagram.
- the highly active / highly selective region 5 is a region containing a compound more preferable as a lead compound. By paying attention to the compound contained in this region 5, a compound preferable as a lead compound can be easily recognized.
- the lead compound has a lower molecular weight, higher activity and higher selectivity.
- the activity and selectivity are improved as the molecular weight changes by changing the color of the symbol according to the molecular weight.
- the ligand efficiency is expressed by the symbol size according to the value. This makes it possible to understand at a glance an efficient compound that exhibits activity even with a compound having a low molecular weight. The larger the symbol ( ⁇ mark), the more efficiently the compound has acquired activity (see FIG. 1).
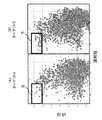
- FIGS. 2 (A) and 2 (B) show two-dimensional scatter diagrams using activity and selectivity, which are existing visualization forms, for two types of kinases (drug targets) A and B, respectively.
- kinases drug targets
- FIGS. 2 (A) and 2 (B) show two-dimensional scatter diagrams using activity and selectivity, which are existing visualization forms, for two types of kinases (drug targets) A and B, respectively.
- the compounds are plotted in the highly active and highly selective region 5.
- the existing visualization form it is unclear whether a highly active and highly selective compound can be a good lead compound.
- FIG. 3 is a diagram showing a four-dimensional scatter diagram which is an embodiment of the present invention for kinases (drug discovery targets) A and B.
- the distribution of molecular weight which is an important factor as a good lead compound, can be understood, and the ligand efficiency can be recognized at a glance.
- FIG. 3 (A) a plurality of compounds having a molecular weight of less than 300 and 300 or more and less than 350 and having high ligand efficiency exist in the region 5 for kinase A.
- FIG. 3 (A) a plurality of compounds having a molecular weight of less than 300 and 300 or more and less than 350 and having high ligand efficiency exist in the region 5 for kinase A.
- FIG. 3 (A) a plurality of compounds having a molecular weight of less than 300 and 300 or more and less than 350 and having high ligand efficiency exist in the region 5 for kinase A.
- FIG. 3 (A) a plurality of compounds having a mo
- kinase A can obtain a better quality lead compound than kinase B.
- the highly active and highly selective region 5 in the four-dimensional scatter diagram is a region containing compounds more preferable as lead compounds. Therefore, a compound is extracted from the compound group included in this region 5. Thereby, a compound preferable as a lead compound can be extracted.
- a compound satisfying a predetermined condition in terms of molecular weight and / or ligand efficiency may be further selected from the compound group included in the highly active / highly selective region 5.
- the predetermined condition for example, the molecular weight may be a predetermined value or less, and the ligand efficiency may be a predetermined value or more.
- compounds having a ligand efficiency of 0.3 or more among compounds contained in the highly active / highly selective region 5 may be extracted as lead compounds.
- a compound having a molecular weight of 350 or less and a ligand efficiency of 0.3 or more among the compounds contained in the highly active / highly selective region 5 may be extracted as a lead compound.
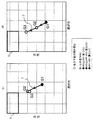
- FIG. 4 is a diagram showing a four-dimensional scatter diagram in which arrows 7 for predicting the possibility of synthetic development are further arranged.
- FIG. 5 shows an arrow 7 for predicting the possibility of synthesis development by eliminating the plotted symbols in the diagram shown in FIG. 4, centroids G1, G2, G3 of the compound distribution, and centroids of the compound distribution. It is the figure which showed the preferable area
- the possibility of synthesizing the target kinase shown in the four-dimensional scatter diagram (in other words, the molecular target that is a drug discovery target candidate) from the lead compound is predicted. It is possible to determine whether the target kinase (molecular target) is appropriate as a drug discovery target.
- the centroids G1, G2, G3 of the distribution of the compound in the two-dimensional plane of selectivity-activity value are calculated in each of the three classification groups of molecular weight, and as shown in FIG. 4 and FIG.
- the centers of gravity G1, G2, and G3 are connected by arrows 7 between groups having adjacent ranges. That is, the arrows 7 connect the center of gravity G1-G2 and the center of gravity G2-G3.
- This arrow 7 indicates the direction of change in the center of gravity of the distribution when the molecular weight changes from the smaller one to the larger one (that is, the distribution change direction).
- the center of gravity G1 indicates the starting point of the distribution change
- the center of gravity G3 indicates the end point of the distribution change.
- the centroids G1, G2, and G3 are the centroids of the distribution of the selectivity-activity values on the two-dimensional plane in the first to third groups classified by molecular weight, respectively.
- Each characteristic value is obtained by the following formula.
- Gx (X1 + X2 + ... + Xn) / n (1)
- Xn activity value (Y coordinate value) or selectivity value (X coordinate value)
- n compounds belonging to each group classified based on molecular weight Number of.
- the activity value and selectivity data are weighted with the ligand efficiency data, and then each centroid of activity value and selectivity for each molecular weight classification in each kinase. And a weighted arrow 7 may be obtained from the calculated center of gravity.
- Wz (Wi-Wmin) / (Wmax-Wmin) (3)
- Wz characteristic value after standardization
- Wmin minimum value
- Wmax maximum value.
- G'x ⁇ (S1 ⁇ W1) + (S2 ⁇ W2) + ... + (Sn ⁇ Wn) ⁇ / ⁇ Wi (4)
- Drug discovery target selection method Based on the position of the center of gravity G1, G2, G3 and the direction of the arrows between the centers of gravity G1-G2 and G2-G3 as determined for a molecular target as described above. Determine whether is suitable as a drug discovery target. Specifically, when the condition A shown below is satisfied and at least one of the conditions B1, B2, and B3 is satisfied, it is determined that the molecular target is suitable as a drug discovery target.
- An arrow between the centroids G1 and G2 an arrow heading from the centroid G1 to the centroid G2 points in a region direction (upper left direction in the scatter diagram, hereinafter also referred to as “highly active / highly selective region 5”).
- Condition B1 The center of gravity G2 is included in the high activity / high selectivity region 5.
- Condition B2) An arrow between the centroids G2 and G3 (an arrow heading from the centroid G2 to the centroid G3) points in a region direction (upper left direction in the scatter diagram).
- the center of gravity G3 indicated as the end point of the distribution change is included in the high activity / high selectivity region 5.
- Condition B3) The arrow between the centroids G2-G3 points in the direction of the region (upper left direction in the scatter diagram).
- the center of gravity G3 indicated as the end point of the change in distribution is included in the range of the predetermined activity value (pIC 50 is 5 or more).
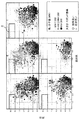
- FIG. 6 shows an example of a four-dimensional scatter diagram for five types of molecular targets (kinases) A to E.
- FIG. 7 shows the arrows 7 for predicting the possibility of synthesis development, the centroids G1, G2, G3 of the compound distribution, and the centroids of the compound distribution generated from the four-dimensional scatter diagrams of the molecular targets A to E. It is the figure which showed the area
- the highly active / highly selective region 5 is a region where activity (pIC 50 )> 7.0 and selectivity (entropy core) ⁇ 2.5
- a predetermined activity value range is a region where pIC 50 is 5 or more. .
- Molecular target A The centroid G2 of the compound group having a molecular weight of 300 to 350 is plotted on the upper left with respect to the centroid G1 of the compound group having a molecular weight of less than 300 (Condition A), and the centroid G3 is the highly active / highly selective region 5 (Activity (pIC 50 )> 7.0, selectivity (entropy core) ⁇ 2.5) (Condition B1). That is, since the condition A and the condition B1 are satisfied, the molecular target A can be determined as a promising drug discovery target.
- Molecular target B centroid G2 with respect to centroid G1 and centroid G3 of a compound group having a molecular weight of 350 or more are plotted on the upper left (Condition A), and centroid G2 is included in highly active / highly selective region 5 (Condition B2). That is, since the conditions A and B2 are satisfied, the molecular target B can be determined as a promising drug discovery target.
- Molecular target C The centroid G2 and the centroid G3 are plotted on the upper left with respect to the centroid G1 (condition A), but the centroid G2 and the centroid G3 are not included in the high activity / high selectivity region 5. That is, the condition A is satisfied, but the condition B1 is not satisfied. However, as the molecular weight increases, the arrow p 7 from the center of gravity G2 to the center of gravity G3 points in the direction of the highly active / highly selective region 5, and the activity pIC 50 determined to be necessary for the center of gravity G3 to develop the synthesis p> 50 > 5.0 (Condition B3) is satisfied. That is, since the conditions A and B3 are satisfied, it can be determined that the molecular target C is a promising drug target.
- Molecular target D The center of gravity G2 is plotted on the upper left side with respect to the center of gravity G1, but the center of gravity G3 is not on the upper left side, but is plotted on the lower left side where the activity decreases (conditions B2 and B3 are not satisfied). That is, the activity does not increase despite the increase in molecular weight.
- the center of gravity G3 is not included in the high activity / high selectivity region 5 (does not satisfy the condition B1). That is, although the condition A is satisfied but none of the conditions B1 to B3 is satisfied, it can be determined that the molecular target D is not preferable as a promising drug discovery target.
- Molecular target E The center of gravity G2 and the center of gravity G3 are plotted on the upper left with respect to the center of gravity G1, but the center of gravity G3 is not included in the high activity / high selectivity region 5 (conditions B1 and B2 are not satisfied)
- the active pIC 50 > 5.0 determined to be necessary for the synthesis development is not satisfied (the condition B3 is not satisfied). That is, since the condition A is satisfied but none of the conditions B1 to B3 is satisfied, it can be determined that the molecular target E is not preferable as a promising drug discovery target.
- a certain molecular target is a promising drug discovery target can be determined by the arrow 7 for predicting the possibility of synthesis development. That is, by referring to the arrow 7 and the center of gravity, a promising drug discovery target can be selected from a plurality of molecular targets.
- the molecular target C has no compound in the highly active / highly selective region 5, so that a good lead compound could not be obtained at that time.
- the molecular target C can be determined as a promising drug discovery target.
- the molecular target C can be predicted to be a molecular target capable of obtaining a high-quality lead compound by screening and synthesizing more compounds (for example, tens of thousands of compounds).
- IC 50 value 100 x X / Y-X Where Y: inhibition rate (%), X: concentration ( ⁇ M)
- the IC 50 value is set to a constant value for use in calculating the entropy core as an index of selectivity later. did. Further, IC 50 values when the maximum evaluation concentration of 0.1 ⁇ M are 40 [mu] M, IC 50 value when the maximum evaluation concentration 1 ⁇ M was 400 [mu] M. The IC 50 value was also set to a constant value when the inhibition rate (%) at the minimum evaluation concentration was 99% or more. In this case, the IC 50 value was 0.001 ⁇ M when the minimum evaluation concentration was 0.1 ⁇ M, and the IC 50 value was 0.01 ⁇ M when the minimum evaluation concentration was 1 ⁇ M.
- the activity value (pIC 50 ), selectivity (entropy core), and ligand efficiency were calculated.
- symbols ( ⁇ marks) indicating several tens of compounds are plotted on the four-dimensional scatter diagram of the target C shown in FIG.
- a plurality of compounds were arranged in the highly active / highly selective region 5. That is, it was shown that target C is a drug discovery target from which a compound having high activity and high selectivity can be obtained by synthetic development.
- Four-dimensional scatter diagram generation device The configuration and operation of a four-dimensional scatter diagram generation device (an example of a visualization device) that generates and displays the above-described four-dimensional scatter diagram will be described below.
- FIG. 9 is a diagram showing a hardware configuration of a four-dimensional scatter diagram generation device that generates and displays a four-dimensional scatter diagram.
- the four-dimensional scatter diagram generation apparatus 100 is configured by an information processing apparatus such as a personal computer.
- the four-dimensional scatter diagram generation apparatus 100 includes a control unit 11 that controls the overall operation, a display unit 17 that performs screen display, an operation unit 19 that is operated by a user, and a data storage unit 21 that stores data and programs. Is provided.
- the display unit 17 is composed of, for example, a liquid crystal display or an organic EL display.
- the operation unit 19 includes a keyboard, a mouse, a touch panel, and the like.
- the four-dimensional scatter diagram generation apparatus 100 includes an interface unit 25 for connecting to an external device or a network.
- the interface unit 25 can connect various devices (printers, communication devices, input devices, etc.) conforming to interfaces such as USB and HDMI (registered trademark), and between the connected devices and the four-dimensional scatter diagram generation device 100. Enables communication of data and control commands.
- the control unit 11 controls the overall operation of the four-dimensional scatter diagram generation apparatus 100, and includes a CPU and an MPU that realize a predetermined function by executing a program.
- the program executed by the control unit 11 may be provided via a communication line or a recording medium such as a CD, DVD, or memory card.
- the control unit 11 may be configured by a dedicated hardware circuit (FPGA, ASIC, etc.) designed to realize a predetermined function.
- the data storage unit 21 is a device that stores data and programs, and can be configured by, for example, a hard disk (HDD), an SSD, a semiconductor memory device, or an optical disk.
- the data storage unit 21 includes a control program 31 for generating and displaying a four-dimensional scatter diagram, a compound library database (hereinafter referred to as “compound library DB”) 32 for storing compound data, and a generated four-dimensional scatter diagram. Etc. are stored.
- the compound library DB 32 is a database that manages information related to the characteristics of each compound for a plurality of compounds. Specifically, the compound library DB 32 stores, for each compound, at least characteristic values relating to activity values and selectivity for a plurality of kinases, molecular weight of the compound, and ligand efficiency of the compound.
- the compound library DB32 has the following format, for example.
- the compound library DB 32 stores, for each of a plurality of compounds, activity values and selectivities with respect to a plurality of kinases, molecular weights of the compounds, and characteristic values regarding the ligand efficiency of the compounds.
- the compound library DB 32 may be provided from an external server through a recording medium such as a CD, a DVD, a memory card, or a communication line.
- FIG. 10 is a flowchart showing the display operation of the four-dimensional scatter diagram in the four-dimensional scatter diagram generation apparatus 100. With reference to FIG. 10, the display operation of the four-dimensional scatter diagram in the four-dimensional scatter diagram generation apparatus 100 will be described.
- the control unit 11 acquires information on the characteristic values of various compounds from the compound library DB 32 for the molecular target from which the lead compound is to be extracted (S11). Specifically, the control unit 11 acquires at least information on the activity value and selectivity with respect to the molecular target, molecular weight, and ligand efficiency for each compound from the compound library DB 32. At this time, the control unit 11 may select and acquire only compounds that satisfy a predetermined condition (for example, the inhibition rate of the maximum evaluation concentration is 20% or more) from the compounds included in the compound library DB32. Good.
- a predetermined condition for example, the inhibition rate of the maximum evaluation concentration is 20% or more
- control unit 11 determines the position on the four-dimensional scatter diagram for plotting a symbol indicating the compound based on the activity and selectivity of the compound with respect to the molecular target for one compound in the acquired compound group. (S12).
- control unit 11 determines the color of the symbol indicating the compound based on the molecular weight of the compound (S13). Specifically, if the molecular weight is less than 300, the symbol color is set to red, if the molecular weight is 300 or more and less than 350, the symbol color is set to yellow, and if the molecular weight is 350 or more, the symbol Set the color of to blue.
- the control unit 11 determines the size of the symbol indicating the compound based on the ligand efficiency of the compound (S14). Specifically, the symbol size is determined according to the value of the ligand efficiency. That is, when the ligand efficiency value is large, the symbol size is set to a larger size, and when the ligand efficiency value is small, the symbol size is set to a smaller size. When the ligand efficiency value is larger than a certain value, the symbol size is expressed as a certain size. When the ligand efficiency value is smaller than the certain value, the symbol size is defined as a certain small size. May be represented.
- the symbol arrangement position and attributes are determined for one compound (S12 to S14). Thereafter, the control unit 11 determines the positions and attributes (colors and sizes) of symbols to be arranged in the four-dimensional scatter diagram for all the compounds acquired from the compound library DB 32 (S15).
- the control unit 11 determines the positions and attributes of the determined symbols.
- a symbol indicating each compound based on (color, size) is arranged on a two-dimensional plane of selectivity-activity value to generate a four-dimensional scatter diagram (that is, image data indicating a four-dimensional scatter diagram), This is displayed on the display unit 17 (S16).
- a four-dimensional scatter diagram as shown in FIG. 1 is displayed on the display unit 17.
- the control unit 11 displays the generated four-dimensional scatter diagram instead of or on the display unit 17, stores the image data indicating the four-dimensional scatter diagram in the data storage unit 21, or the interface unit Or may be output to an external device via 25.
- the control unit 11 displays a frame indicating the highly active / highly selective region 5 on the four-dimensional scatter diagram.
- the highly active / highly selective region 5 is a region containing a compound more preferable as a lead compound, for example, a region where activity (pIC 50 )> 8.0 and selectivity (entropy core) ⁇ 2.0, or It is set in a region where activity (pIC 50 )> 7.0 and selectivity (entropy core) ⁇ 3.0.
- the control unit 11 extracts compounds included in the highly active / highly selective region 5, extracts them as lead compound candidates, and associates information (such as compound names) on the extracted compounds with molecular targets.
- the data may be stored in the data storage unit 21 or displayed on the display unit 17.
- the control unit 11 may extract only compounds that satisfy a predetermined condition in terms of molecular weight and / or ligand efficiency from among the compounds included in the highly active / highly selective region 5.
- a compound more preferable as a lead compound can be easily recognized.
- the control unit 11 includes a region (second priority region) 5B containing a promising compound and a region (first) containing a more promising compound in a highly active / highly selective region.
- (Priority area) 5A may be further displayed.
- the first priority region 5A has an activity (pIC 50 ) of 8 or more and a selectivity (entrope core) of 2 or less
- the second priority region 5B has an activity (pIC 50 ) of 7 or more and less than 8
- the selectivity (entrope core) is set to be greater than 2 and 3 or less.
- the flowchart of FIG. 10 demonstrated the display process of the four-dimensional scatter diagram with respect to one molecular target. As shown in FIGS. 3 and 6, when a plurality of four-dimensional scatter diagrams for a plurality of molecular targets are displayed simultaneously, the processing of the flowchart of FIG. 10 may be executed a plurality of times for each molecular target.
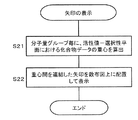
- FIG. 12 is a flowchart showing the generation processing of the arrow 7 for predicting the possibility of synthetic expansion shown in FIGS. .
- the generation process of the arrow 7 for predicting the possibility of composition development in the four-dimensional scatter diagram generation apparatus 100 will be described.
- the control unit 11 divides the compound into three groups with respect to the molecular weight: a first group having a molecular weight of less than 300, a second group having a molecular weight of 300 or more and less than 350, and a third group having a molecular weight of 350 or more. They are classified and managed. Then, the control unit 11 calculates the centroids G1, G2, and G3 of the distribution of each symbol in the two-dimensional plane of selectivity-activity value (the distribution of the selectivity-activity value in the two-dimensional plane) for each group of molecular weights. (S21).
- control unit 11 calculates an average value for each of the activity value and the selectivity for each compound belonging to the first group using the formula (1), so that in the distribution of the compounds belonging to the first group.
- the center of gravity G1 is calculated.
- control unit 11 calculates the center of gravity G2 in the distribution of the compounds belonging to the second group by calculating an average value for each of the activity value and the selectivity for the compounds belonging to the second group using the formula (1).
- the center of gravity G3 in the distribution of the compounds belonging to the third group is calculated by calculating an average value for each of the activity value and selectivity for the compounds belonging to the third group.
- the centroids G1, G2, and G3 may be calculated using the weighted expression (3).
- the controller 11 connects the centroids G1-G2 and the centroids G2-G3 between the groups having adjacent molecular weight ranges with arrows, and displays them on the four-dimensional scatter diagram (S22). Thereby, for example, as shown in FIGS. 4A and 4B, an arrow 7 indicating a change in distribution is displayed on the four-dimensional scatter diagram.
- the control unit 11 may display only the arrow 7 without showing the plotted symbols as shown in FIGS. 5 (a) and 5 (b).
- arrows for a plurality of molecular targets may be displayed side by side. In this case, the process of the flowchart in FIG. 12 may be executed for each of a plurality of molecular targets.
- control unit 11 determines whether or not the molecular target is a promising drug discovery target according to the calculated position of the center of gravity G1 to G3 and the direction (inclination) of the arrow 7, and the determination result is stored in the data storage unit. It may be stored in 21 or displayed on the display unit 17. Thereby, it can be shown to the user of an apparatus whether the molecular target shown by the four-dimensional scatter diagram is a promising drug discovery target.
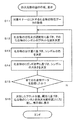
- FIG. 13 is a flowchart of the determination operation of the control unit 11.
- the control unit 11 determines whether or not the arrow between the centroids G1 and G2 (an arrow from the centroid G1 to the centroid G2) is directed toward the high activity / high selectivity region 5 (condition A) (S31). . Specifically, the control unit 11 determines whether or not the arrow between the centroids G1 and G2 is directed in the upper left direction on the two-dimensional plane of selectivity-activity value. When the arrow between the centers of gravity G1 and G2 is not directed toward the high activity / high selectivity region 5 (NO in S31), the control unit 11 determines that the molecular target is not a promising drug target (S37). .
- the control unit 11 determines whether the centroid G2 is included in the high activity / high selectivity region 5 It is determined whether or not (condition B1) (S32). When the center of gravity G2 is included in the high activity / high selectivity region 5 (YES in S32), the control unit 11 determines that the molecular target is a promising drug target (S36).
- the control unit 11 When the center of gravity G2 is not included in the high activity / high selectivity region 5 (NO in S32), the control unit 11 indicates that the arrow between the centers of gravity G2 and G3 (the arrow from the center of gravity G2 to the center of gravity G3) is highly active and high. It is determined whether or not the direction is toward the selectivity region 5 (S33). When the arrow between the centers of gravity G2-G3 is not directed toward the highly active / highly selective region 5 (NO in S33), the control unit 11 determines that the molecular target is not a promising drug target (S37). .
- the control unit 11 determines whether the centroid G3 is included in the high activity / high selectivity region 5 It is determined whether or not (condition B2) (S34).
- condition B2 the control unit 11 determines that the molecular target is a promising drug discovery target (S36).
- the control unit 11 When the center of gravity G3 is not included in the high activity / high selectivity region 5 (NO in S34), the control unit 11 includes the center of gravity G3 in a region where the center of gravity G3 is equal to or higher than a predetermined activity value (for example, pIC 50 is 5 or higher). Whether or not (condition B3) is determined (S35). When the center of gravity G3 is included in a region having a predetermined activity value or more (YES in S35), the control unit 11 determines that the molecular target is a promising drug target (S36). When the center of gravity G3 is not included in the region having the predetermined activity value or more (NO in S35), the control unit 11 determines that the molecular target is not a promising drug target (S37).
- a predetermined activity value for example, pIC 50 is 5 or higher.
- control unit 11 determines whether or not the molecular target is a promising drug target based on the position of the center of gravity and the direction of the arrow, and the determination result is stored in the data storage unit 21 or displayed. Or display on part 17 (S38).
- the highly active / highly selective region 5 is a more preferable region where the center of gravity is arranged, for example, a region where activity (pIC 50 )> 5.0 and selectivity (entropy core) ⁇ 4.0, activity Region where (pIC 50 )> 6.0 and selectivity (entropy core) ⁇ 3.0, activity (pIC 50 )> 7.0 and region where selectivity (entropy core) ⁇ 2.5, or activity (pIC 50 ) It may be set in a region where> 7.0 and selectivity (entropy core) ⁇ 2.0.
- the display mode when displaying the arrows for predicting the possibility of synthesis development for each of a plurality of molecular targets is not limited to the mode of displaying side by side as shown in FIG. Absent.
- the images may be displayed side by side in the horizontal direction as shown in FIG. 14, or may be displayed in the vertical direction as shown in FIG.
- the tendency of the arrow of each molecular target can be grasped, and it can be determined whether or not each molecular target is a promising drug target based on the position and orientation of the arrow.
- the arrangement position of the symbol is determined based on the selectivity of the compound with respect to the molecular target (an example of the first characteristic) and the activity value (second characteristic), and the molecular weight of the compound ( Based on the third characteristic) and the ligand efficiency (fourth characteristic), the symbol attributes (color, size) are determined.
- the symbol attributes color, size
- the lead compound extraction method disclosed in the present embodiment extracts a lead compound from compounds indicated by symbols arranged in a predetermined region (highly active / highly selective region) 5 on a four-dimensional scatter diagram. Thereby, it is possible to extract a high-quality lead compound that can be expected to develop a synthesis.
- an arrow indicating a change in the distribution of the symbol of the compound classified based on the molecular weight may be displayed on the four-dimensional scatter diagram.
- the drug discovery target selection method disclosed in the present embodiment creates a predetermined target based on the direction of change in the distribution of the symbol of the compound classified based on the molecular weight on such a four-dimensional scatter diagram. Decide whether or not to select as a drug discovery target for use in medicine. In this way, the target drug discovery target can be synthesized and developed in the future by determining whether or not it is a drug discovery target based on the direction of change in the distribution of the symbol of the compound distinguished by molecular weight. It can be determined whether or not a drug candidate compound is obtained.
- a four-dimensional scatter diagram generation apparatus 100 that generates a four-dimensional scatter diagram showing characteristics of a plurality of compounds with respect to a predetermined drug discovery target and / or molecular target.
- the four-dimensional scatter diagram generation apparatus 100 includes a control unit 11.
- the control unit 11 obtains characteristic information regarding various characteristics of the compound for a plurality of compounds (S11), and arranges symbols indicating the respective compounds according to the acquired characteristic information for the plurality of compounds. It functions as a scatter diagram creation means (S12-S16) for generating and outputting a dimensional scatter diagram.
- This four-dimensional scatter diagram generation apparatus 100 can generate a four-dimensional scatter diagram.
- activity an example of the first characteristic
- selectivity an example of the second characteristic
- molecular weight the third characteristic
- ligand efficiency an example of the fourth characteristic
- activity for example, activity, selectivity, molecular weight, ligand efficiency, lipophilicity (logP, logD, clogP, AlogP, MlogP, etc.), number of heavy atoms, hydrogen bonding Donor number, hydrogen bond acceptor number, rotatable bond number, polar surface area (PSA, TPSA, etc.), aromatic ring number, repellent structure number, acid dissociation constant, QED (quantitative estimate of drug-likeness), CNS MPO ( central nervous system multiparameter optimization), solubility, heat stability, humidity stability, light stability, membrane permeability, oral absorption, human intestinal absorption (HIA), blood-brain barrier (BBB) transferability, cytochrome P450 ( CYP3A4, CYP2D6, etc.) Metabolic stability, cytochrome P450 inhibition (CYP3A4, etc.) activity, carcinogenicity, mutagenicity (Ames test, etc.), skin sensitization, accumulation, hERG inhibition, chromosomal abnormal
- the characteristic for example, the ligand fat solubility efficiency etc. which are the characteristics shown combining activity and fat solubility etc.
- a combination of activity, selectivity, molecular weight and ligand efficiency is a preferred combination.
- the symbol color is set based on the molecular weight of the compound and the symbol size is set based on the ligand efficiency.
- the symbol size is set based on the molecular weight of the compound, and based on the ligand efficiency.
- the color of the symbol may be set.
- the symbol shape is not limited to that shape.
- the symbol can be represented by an arbitrary shape such as a triangle, square, star, or x.
- colors and sizes were used as symbol attributes, and they were changed according to the characteristics of the compound (molecular weight, ligand efficiency).
- shape and three-dimensional coordinates are shown as symbol attributes.
- a coordinate on the Z axis perpendicular to a plane defined by the X axis and the Y axis indicating activity) may be added. That is, two attributes selected from the color, size, shape, and three-dimensional coordinates may be changed according to the characteristics of the compound (molecular weight, ligand efficiency).
- the four-dimensional scatter diagram is expressed three-dimensionally.
- one attribute of the symbol is changed based on one characteristic of the compound
- a plurality of attributes of the symbol may be changed based on one characteristic of the compound.
- the color and shape of the symbol may be combined and changed according to the molecular weight of the compound.
- a four-dimensional scatter diagram is created in which each of the four characteristics of the target data is reflected in attributes such as symbol positions and colors.
- the scatter diagram is not limited to this.
- the scatter diagram may be generated by changing the attribute of the symbol to be plotted so that five or more characteristics can be visually recognized simultaneously.
- a scatter diagram may be generated by determining the symbol position (X-axis, Y-axis), symbol color, size, and shape according to each of the five characteristics.
- the data visualization method using the four-dimensional scatter diagram disclosed in the above embodiment is not limited to visualization of characteristic data of compound candidates used for lead compound extraction and drug discovery target selection.
- the data visualization method disclosed in the above embodiment can also be applied to a visualization method for visualizing data having general four-dimensional or more characteristics. Such a visualization method can be effectively applied to analysis of big data and policy determination based on the result.
- the present invention can be applied to visualization of various data in the following fields.
- -Medical care for example, medical data analysis, medication information analysis, test result analysis, vital data analysis, morbidity risk analysis, infection prediction analysis, regional information analysis, etc.
- -Finance and insurance eg fraud analysis, transaction analysis, risk analysis, location information analysis
- -Communication and broadcasting for example, communication log analysis, network analysis, audience rating analysis, content analysis, etc.
- -Distribution and retail for example, POS data analysis, purchase log analysis, royalty analysis, promotion analysis, call center analysis, eye tracking analysis, repeat rate analysis, service usage status analysis, point usage status analysis, click stream analysis, etc.
- -Manufacturing eg quality analysis, demand analysis, traceability, pre-failure detection, failure time prediction, etc.
- -Media such as the web (eg access analysis, content analysis, social media analysis, etc.)
- -Public and public interest eg weather data analysis, earthquake data analysis, energy consumption analysis, risk analysis (defense
- a position where a symbol indicating each data is arranged is determined based on the first and second characteristics. Further, the attribute of the symbol indicating each data is determined based on the third and fourth characteristics. Then, a four-dimensional scatter diagram is generated by arranging symbols indicating each data based on the determined position and attribute.
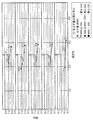
- a four-dimensional scatter diagram as shown in FIG. 16 can be obtained based on four characteristics of weather data, such as temperature, humidity, observation year, and precipitation.
- weather data we used Japanese meteorological data, and we used average temperature, humidity, and precipitation data from 1900 to 2015 for Kyoto, Sapporo, Tokyo, and Okinawa.
- “temperature” is assigned to the horizontal axis
- “humidity” to the vertical axis “observation year” (newer as the brightness is lower) to the symbol color
- precipitation” to the symbol size.
- FIG. 16 it can be seen that in each city, the temperature rises as it approaches in recent years. That is, the tendency of global warming can be read. Furthermore, it can be understood that the humidity is decreasing as the temperature rises.
- the four-dimensional scatter diagram related to the weather it is possible to easily and intuitively grasp the tendency of the environmental change.
- a four-dimensional scatter diagram as shown in FIG. 17 can be obtained based on the four characteristics of medical data such as cancer mortality, smoking rate, survey year, and population.
- the data is medical data of Japan.
- cancer-specific mortality rates from 2001 to 2013 every 3 years (age-adjusted mortality, malignant neoplasm under 75 years old, population 100,000 pairs), smoking rates by population, and population data.
- the horizontal axis is “smoking rate”
- the vertical axis is “cancer mortality”
- the symbol color is “survey year” (lower the brightness)
- the symbol size is “population”. Assigned. Referring to FIG. 17, first, there is a correlation between the smoking rate and the death rate from cancer.
- control unit 11 of the four-dimensional scatter diagram generation apparatus 100 may be configured to realize the following functions. That is, the control unit 11 determines the positions where the symbols indicating the respective data are arranged based on the first and second characteristics for the plurality of analysis target data having the first to fourth characteristics of the analysis target data. That's fine. Furthermore, the control unit 11 may determine the attribute of the symbol indicating each data based on the third and fourth characteristics. And the control part 11 should just produce
- control unit 11 classifies the data into a plurality of groups under a predetermined condition with respect to the third characteristic, and arranges an arrow connecting the centroids of the distribution of the symbols of the data belonging to the plurality of classified groups on the scatter diagram. Also good. By referring to the direction of the arrow and the position of the center of gravity, it is possible to easily visually recognize the change tendency of the distribution of data to be analyzed classified with respect to the third characteristic.
- a method of extracting a lead compound from a plurality of compounds for a drug discovery target is For a plurality of compounds, creating a scatter plot by arranging symbols indicating compounds according to a plurality of characteristics of the compound; Extracting a lead compound from compounds indicated by symbols arranged in a predetermined area on the scatter diagram. In the scatter diagram, the arrangement position of the symbol is determined based on the first and second characteristics of the compound, and the attribute of the symbol is determined based on the third and fourth characteristics of the compound.
- the attribute of the symbol is a three-dimensional coordinate indicating the position of the symbol in the direction perpendicular to the plane on which the symbol is arranged based on the color, shape, size, and the first and second characteristics. At least two of them.
- the first characteristic is the selectivity of the compound with respect to the predetermined drug discovery target
- the second characteristic is the activity of the compound with respect to the predetermined drug discovery target
- the third characteristic is The molecular weight of the compound and the fourth property may be the ligand efficiency of the compound.
- the predetermined region may be a region where both the selectivity of the compound and the activity of the compound are equal to or greater than a predetermined value.
- a compound having a ligand efficiency of 0.3 or more may be extracted from the compounds indicated by the symbols arranged in the predetermined region.
- the drug discovery target may be an enzyme, a receptor, or a transporter protein.
- a method of extracting a lead compound from a plurality of compounds for a drug discovery target is For a plurality of compounds, creating a scatter plot by arranging symbols indicating compounds according to a plurality of characteristics of the compound; Extracting a lead compound from compounds indicated by symbols arranged in a predetermined area on the scatter diagram.
- the symbol arrangement position is determined based on the first and second characteristics of the compound.
- the first characteristic is the selectivity of the compound for a given drug discovery target
- the second characteristic is the activity of the compound for a given drug discovery target.
- the predetermined region is a region where both the selectivity of the compound and the activity of the compound are equal to or higher than a predetermined value, and a compound having a ligand efficiency of 0.3 or higher is extracted from the compounds indicated by the symbols arranged in the predetermined region.
- the selection method includes a step of arranging a symbol indicating a compound according to a plurality of characteristics of the compound for a plurality of compounds for a predetermined molecular target to create a scatter diagram, Selecting the predetermined molecular target as a drug discovery target based on a distribution of symbols arranged on a scatter diagram.
- the arrangement position of the symbol is determined based on the first and second characteristics of the compound, and the attribute of the symbol is determined based on the third and fourth characteristics of the compound.
- the compounds are classified into a plurality of groups under a predetermined condition with respect to the third characteristic.
- the selecting step determines whether or not to select a predetermined molecular target as a drug discovery target based on the direction of change in the distribution of the symbols of the compounds belonging to each group and the end point of the change.
- the attribute of the symbol is a three-dimensional coordinate indicating the position of the symbol in the direction perpendicular to the plane on which the symbol is arranged based on the color, shape, size, and the first and second characteristics. At least two of them.
- the first characteristic is the selectivity of the compound with respect to the predetermined molecular target
- the second characteristic is the activity of the compound with respect to the predetermined molecular target
- the third characteristic is the compound's activity.
- Molecular weight and the fourth property is the ligand efficiency of the compound.
- a plurality of compounds may be classified into a plurality of groups based on the molecular weight.
- An arrow connecting the centroids of the symbol distributions of the compounds belonging to each group may be arranged on the scatter diagram.
- the molecular target when the arrow connecting the centroids of the distribution of the symbols of the compounds belonging to each group goes to a predetermined region on the scatter diagram, the molecular target may be selected as a drug discovery target.
- a molecular target may be selected as a drug discovery target.
- the drug discovery target and / or molecular target may be an enzyme, a receptor, or a transporter protein.
- a scatter diagram generating device for generating a scatter diagram showing characteristics of a plurality of compounds with respect to a predetermined drug discovery target.
- Scatter plot generator Obtaining means for obtaining characteristic information on various characteristics of the compound for a plurality of compounds; Scatter diagram creating means for generating and outputting a scatter diagram by arranging symbols indicating the respective compounds according to the acquired characteristic information for a plurality of compounds. For each compound, the scatter diagram creation means determines the symbol placement position on the scatter diagram based on the first and second characteristics of the compound, and determines the symbol attributes based on the third and fourth characteristics of the compound. Then, a symbol indicating a compound is arranged on the scatter diagram based on the determined position and attribute.
- the attribute of the symbol is a three-dimensional coordinate indicating the position of the symbol in the direction perpendicular to the plane on which the symbol is arranged based on the color, shape, size, and first and second characteristics. At least two of them may be included.
- the first characteristic may be selectivity of a compound with respect to a predetermined drug discovery target.
- the second property may be the activity of the compound against a given drug discovery target.
- the third property may be the molecular weight of the compound.
- the fourth property may be the ligand efficiency of the compound.
- the scatter diagram creating means may arrange information indicating a region where the compound selectivity is a predetermined value or more and the compound activity is a predetermined value or more on the scatter diagram.
- an extracting means for extracting at least one of compounds having symbols arranged in the region as a lead compound.
- the scatter diagram creating means classifies the plurality of compounds into a plurality of groups based on the molecular weight, and arranges arrows on the scatter diagram connecting the centroids of the symbol distributions of the compounds belonging to each group. Also good.
- the drug discovery target may be an enzyme, a receptor, or a transporter protein.
- the program is a computer, As acquisition means for acquiring characteristic information regarding various properties of a compound for a plurality of compounds, and as a scatter diagram creation means for generating a scatter diagram by arranging symbols indicating the respective compounds according to the acquired characteristic information for a plurality of compounds Make it work. For each compound, the scatter diagram creation means determines the symbol placement position on the scatter diagram based on the first and second characteristics of the compound, and determines the symbol attributes based on the third and fourth characteristics of the compound. Then, a symbol indicating the compound is arranged on the scatter diagram based on the determined arrangement position and attribute.
- a first method for visualizing a tendency of a plurality of data having at least first to fourth characteristics is Based on the first and second characteristics, determine a position where a symbol indicating each data is arranged, Based on the third and fourth characteristics, determine the attribute of the symbol indicating each data, Based on the determined position and attribute, symbols indicating each data are arranged on the scatter diagram.
- the data is classified under a predetermined condition with respect to the third characteristic, and an arrow connecting the centroids of the distribution of the symbols of the data belonging to the plurality of classified groups is arranged on the scatter diagram. Also good.
- a second method for visualizing a tendency of a plurality of data having at least first to third characteristics is Based on the first and second characteristics, determine a position where a symbol indicating each data is arranged, Based on the determined position, place a symbol indicating each data on the scatter plot, The data is classified into a plurality of groups under a predetermined condition with respect to the third characteristic, and an arrow connecting the centroids of the distribution of the symbols of the data belonging to the plurality of classified groups is arranged on the scatter diagram.
- the visualization device is For a plurality of data, an acquisition means for acquiring characteristic information related to characteristics for each data, Scatter diagram generation means for generating a scatter diagram based on the characteristic information of the acquired data.
- the scatter diagram generating means determines a position where a symbol indicating each data is arranged based on the first and second characteristics, determines an attribute of the symbol indicating each data based on the third and fourth characteristics, A symbol indicating each data is arranged on the scatter diagram based on the determined position and attribute.
Landscapes
- Life Sciences & Earth Sciences (AREA)
- Physics & Mathematics (AREA)
- Engineering & Computer Science (AREA)
- Health & Medical Sciences (AREA)
- Spectroscopy & Molecular Physics (AREA)
- Bioinformatics & Cheminformatics (AREA)
- General Health & Medical Sciences (AREA)
- Chemical & Material Sciences (AREA)
- Theoretical Computer Science (AREA)
- Medical Informatics (AREA)
- Bioinformatics & Computational Biology (AREA)
- Evolutionary Biology (AREA)
- Biotechnology (AREA)
- Biophysics (AREA)
- Crystallography & Structural Chemistry (AREA)
- Medicinal Chemistry (AREA)
- Pharmacology & Pharmacy (AREA)
- Data Mining & Analysis (AREA)
- Nuclear Medicine, Radiotherapy & Molecular Imaging (AREA)
- Veterinary Medicine (AREA)
- Public Health (AREA)
- Animal Behavior & Ethology (AREA)
- Organic Chemistry (AREA)
- General Chemical & Material Sciences (AREA)
- Chemical Kinetics & Catalysis (AREA)
- Medicines That Contain Protein Lipid Enzymes And Other Medicines (AREA)
- Measuring Or Testing Involving Enzymes Or Micro-Organisms (AREA)
- Apparatus Associated With Microorganisms And Enzymes (AREA)
- Image Generation (AREA)
- Medical Treatment And Welfare Office Work (AREA)
Abstract
Description
1.四次元散布図
最初に、リード化合物の抽出または創薬ターゲットの選択に使用する四次元散布図について説明する。
創薬ターゲットに対するリード化合物の活性としては、受容体結合活性、受容体制御活性、受容体シグナル伝達活性化活性、受容体シグナル伝達阻害活性、酵素制御活性、酵素活性化活性、酵素阻害活性、チャネル結合活性、チャネル制御活性、チャネル活性化活性、チャネル阻害活性、ポンプ結合活性、ポンプ制御活性、ポンプ活性化活性、ポンプ阻害活性、タンパク‐タンパク相互作用の阻害剤等が挙げられる。
Y=Bottom+(Top-Bottom)/(1+10^(HillSlope×(logIC50-log10 (X)))
ここで、Y:阻害率(%)、X:濃度、Top:最大の阻害率(当実験では100)、Bottom:最小の阻害率(当実験では0)、HillSlope:傾き(当実験では1)
IC50= 100×X/Y-X
ここで、Y:阻害率(%)、X:濃度(μM)
リード化合物の選択性とは、対象とする創薬ターゲット以外の分子ターゲットにおけるリード化合物の活性に対する、対象とする創薬ターゲットにおけるリード化合物の活性の比率を意味する。
リガンド効率とは、分子の大きさ当たりの活性の強さを見積もった化合物の評価指標を意味する。
四次元散布図における高活性・高選択性の領域5は、リード化合物としてより好ましい化合物が含まれる領域である。よって、この領域5に含まれる化合物群の中から化合物を抽出する。これによりリード化合物として好ましい化合物を抽出することができる。なお、高活性・高選択性の領域5に含まれる化合物群の中から、さらに、分子量及び/またはリガンド効率が所定の条件を満たす化合物を選択するようにしてもよい。所定の条件として、例えば、分子量については所定値以下であり、リガンド効率について所定値以上としてもよい。例えば、高活性・高選択性の領域5に含まれる化合物のうち、リガンド効率が0.3以上のものをリード化合物として抽出してもよい。または、高活性・高選択性の領域5に含まれる化合物のうち、分子量が350以下でかつリガンド効率が0.3以上のものをリード化合物として抽出してもよい。
図4は、合成展開の可能性を予測するための矢印7をさらに配置した四次元散布図を示した図である。図5は、図4に示す図において、プロットされたシンボルを排除して合成展開の可能性を予測するための矢印7、化合物の分布の重心G1,G2,G3、及び化合物の分布の重心の好ましい領域を示した図である。四次元散布図に配置された矢印7を参照することにより、四次元散布図に示す対象キナーゼ(換言すれば、創薬ターゲット候補である分子ターゲット)についてリード化合物からの合成展開の可能性を予測することができ、その対象キナーゼ(分子ターゲット)が創薬ターゲットとして適切か否かを判断することが可能となる。
Gx=(X1+X2+…+Xn)/ n (1)
ここで、Xn:活性値(Y座標値)または選択性の値(X座標値)、Gx:特性値の重心(x=1~3)、n:分子量に基づき分類された各グループに属する化合物の数。
Sx=(Xi-Xmin)/(Xmax-Xmin) (2)
ここで、Xi:活性値(Y座標値)または選択性の値(X座標値)(i=1~n)、Sx:標準化後の特性値の値、Xmin:最小値、Xmax:最大値。
Wz=(Wi-Wmin)/(Wmax-Wmin) (3)
ここで、Wi:リガンド効率の値(i=1~n)、Wz:標準化後の特性値の値、Wmin:最小値、Wmax:最大値。
G'x={(S1×W1)+(S2×W2)+…+(Sn×Wn)}/ΣWi (4)
ここで、G'x:重み付けした特性値の重心(x=1~3)。
以上のようにして、ある分子ターゲットに対して求めた重心G1,G2,G3の位置及び重心G1-G2間、G2-G3間の矢印の方向に基づいて、その分子ターゲットが創薬ターゲットとして適しているか否かを判断する。具体的には、以下に示す条件Aを満たすとともに、条件B1、B2及びB3の少なくともいずれか一方を満たす場合に、その分子ターゲットが創薬ターゲットとして適していると判断する。
条件A)重心G1-G2間の矢印(重心G1から重心G2へ向かう矢印)が領域の方向(散布図における左上方向、以下「高活性・高選択性領域5」ともいう)を向いている。
条件B1)重心G2が高活性・高選択性領域5内に含まれる。
条件B2)重心G2-G3間の矢印(重心G2から重心G3へ向かう矢印)が領域の方向(散布図における左上方向)を向いている。かつ、分布の変化の終点として示される重心G3が、高活性・高選択性領域5内に含まれる。
条件B3)重心G2-G3間の矢印が領域の方向(散布図における左上方向)を向いている。かつ、分布の変化の終点として示される重心G3が所定の活性値(pIC50が5以上)の範囲に含まれる。
IC50= 100×X/Y-X
ここで、Y:阻害率(%)、X:濃度(μM)
上述した四次元散布図を生成して表示する四次元散布図生成装置(可視化装置の一例)の構成、動作について以下に説明する。
図9は、四次元散布図を生成して表示する四次元散布図生成装置のハードウェア構成を示した図である。四次元散布図生成装置100は、パーソナルコンピュータのような情報処理装置で構成される。四次元散布図生成装置100は、その全体動作を制御する制御部11と、画面表示を行う表示部17と、ユーザが操作を行う操作部19と、データやプログラムを記憶するデータ格納部21とを備える。

5.2.1 四次元散布図の表示
四次元散布図生成装置100の動作を説明する。図10は、四次元散布図生成装置100における、四次元散布図の表示動作を示すフローチャートである。図10を参照して、四次元散布図生成装置100における四次元散布図の表示動作を説明する。
図12は、図4、図5等に示す合成展開の可能性を予測するための矢印7の生成処理を示すフローチャートである。図12を参照して、四次元散布図生成装置100における合成展開の可能性を予測するための矢印7の生成処理を説明する。
以上説明した四次元散布図は、分子ターゲットに対する化合物の選択性(第1の特性の一例)及び活性値(第2の特性)に基づきシンボルの配置位置が決定され、化合物の分子量(第3の特性の一例)及びリガンド効率(第4の特性の一例)に基づきシンボルの属性(色、大きさ)が決定される。この四次元散布図によれば、データを俯瞰的に捉えることが可能となり、合成展開の可能性の予測が可能となる。また、四次元散布図により、良質なリード化合物として重要な因子である分子量の分布が理解でき、さらにリガンド効率も一目で認識できる。また、四次元散布図における所定の領域(高活性・高選択性の領域5)に着目することにより、リード化合物としてより好ましい化合物を容易に認識することができる。
上記の実施の形態は本発明の一実施形態を開示したものであり、本発明の思想は上記の実施の形態に限定されるものではない。開示した技術に対して、適宜、変更、修正、置換、付加、省略等を行うことも可能である。以下、それらの変形例をいくつか説明する。
-医療(例えば、診療データ分析、投薬情報分析、検査結果分析、バイタルデータ分析、罹患リスク分析、感染予測分析、地域情報分析等)
-金融や保険(例えば、不正解析、取引分析、リスク分析、位置情報分析等)、
-通信や放送(例えば、通信ログ分析、ネットワーク解析、視聴率分析、コンテンツ分析等)
-流通や小売(例えば、POSデータ分析、購買ログ分析、ロイヤリティ分析、プロモーション分析、コールセンター分析、アイトラッキング分析、リピート率分析、サービス利用状況分析、ポイント活用状況分析、クリックストリーム分析等)、
-製造(例えば、品質分析、需要分析、トレーサビリティ、故障事前検知、故障時期予測等)
-Web等のメディア(例えば、アクセス分析、コンテンツ分析、ソーシャルメディア分析等)、
-公共や公益(例えば、気象データ分析、地震データ分析、エネルギー消費分析、リスク分析(防衛、犯罪等)、橋脚異常検知、社会インフラの効率的運用等)、
-交通(例えば、自動車走行データ分析、渋滞予測、事故原因分析、CO2排出量分析等)、
-観光(例えば、観光客のニーズ分析等)、
-農業や水産業(例えば、動態分析、生育状況分析、漁場予測等)
上記の実施の形態において下記の思想が開示されている。
その抽出する方法は、
複数の化合物に対して、化合物の複数の特性にしたがい化合物を示すシンボルを配置して散布図を作成するステップと、
散布図上の所定領域内に配置されたシンボルが示す化合物の中からリード化合物を抽出するステップと、を含む。
散布図において、化合物の第1及び第2の特性に基づきシンボルの配置位置が決定され、化合物の第3及び第4の特性に基づきシンボルの属性が決定されている。
その抽出する方法は、
複数の化合物に対して、化合物の複数の特性にしたがい化合物を示すシンボルを配置して散布図を作成するステップと、
散布図上の所定領域内に配置されたシンボルが示す化合物の中からリード化合物を抽出するステップと、を含む。
散布図において、化合物の第1及び第2の特性に基づきシンボルの配置位置が決定される。第1の特性は、所定の創薬ターゲットに対する化合物の選択性であり、第2の特性は、所定の創薬ターゲットに対する化合物の活性である。所定領域は、化合物の選択性及び化合物の活性の双方が所定値以上となる領域であり、所定領域に配置されたシンボルが示す化合物のうちリガンド効率が0.3以上である化合物を抽出する。
その選択方法は、所定の分子ターゲットについて、複数の化合物に対して、化合物の複数の特性にしたがい化合物を示すシンボルを配置して散布図を作成するステップと、
散布図上に配置されたシンボルの分布に基づいて、前記所定の分子ターゲットを創薬ターゲットとして選択するステップと、を含む。
散布図において、化合物の第1及び第2の特性に基づきシンボルの配置位置が決定され、化合物の第3及び第4の特性に基づきシンボルの属性が決定される。化合物は、第3の特性に関して所定の条件で複数のグループに分類されている。選択するステップは、各グループに属する化合物のシンボルの分布の変化の方向及び変化の終点に基づいて、所定の分子ターゲットを創薬ターゲットとして選択するか否かを決定する。
複数の化合物について、化合物の種々の特性に関する特性情報を取得する取得手段と、
複数の化合物について、取得した特性情報にしたがい各化合物を示すシンボルを配置して散布図を生成して出力する散布図作成手段と、を備える。
散布図作成手段は、化合物毎に、化合物の第1及び第2の特性に基づき散布図上のシンボルの配置位置を決定し、化合物の第3及び第4の特性に基づきシンボルの属性を決定して、決定した位置及び属性に基づき化合物を示すシンボルを散布図上に配置する。
そのプログラムはコンピュータを、
複数の化合物について、化合物の種々の特性に関する特性情報を取得する取得手段、及び複数の化合物について、取得した特性情報にしたがい各化合物を示すシンボルを配置して散布図を生成する散布図作成手段として動作させる。
散布図作成手段は、化合物毎に、化合物の第1及び第2の特性に基づき散布図上のシンボルの配置位置を決定し、化合物の第3及び第4の特性に基づき、シンボルの属性を決定し、決定した配置位置及び属性に基づき化合物を示すシンボルを散布図上に配置する。
第1及び第2の特性に基づき、各データを示すシンボルを配置する位置を決定し、
第3及び第4の特性に基づき、各データを示すシンボルの属性を決定し、
決定した位置及び属性に基づいて、各データを示すシンボルを散布図上に配置する。
第1及び第2の特性に基づき、各データを示すシンボルを配置する位置を決定し、
決定した位置に基づいて、各データを示すシンボルを散布図上に配置し、
第3の特性に関して所定の条件でデータを複数のグループに分類し、分類した複数のグループに属するデータのシンボルの分布の重心を結ぶ矢印を前記散布図上に配置する。
その可視化する装置は、
複数のデータについて、データ毎の特性に関する特性情報を取得する取得手段と、
取得したデータの特性情報に基づいて散布図を生成する散布図生成手段と、を備える。
散布図生成手段は、第1及び第2の特性に基づき、各データを示すシンボルを配置する位置を決定し、第3及び第4の特性に基づき、各データを示すシンボルの属性を決定し、決定した位置及び属性に基づき各データを示すシンボルを散布図上に配置する。
Claims (26)
- 創薬ターゲットに対して複数の化合物の中からリード化合物を抽出する方法であって、
複数の化合物に対して、化合物の複数の特性にしたがい化合物を示すシンボルを配置して散布図を作成するステップと、
散布図上の所定領域内に配置されたシンボルが示す化合物の中からリード化合物を抽出するステップと、を含み、
前記散布図において、化合物の第1及び第2の特性に基づきシンボルの配置位置が決定され、化合物の第3及び第4の特性に基づきシンボルの属性が決定された、
リード化合物の抽出方法。 - シンボルの属性は、シンボルに関する、色、形状、大きさ及び前記第1及び第2の特性に基づきシンボルが配置される平面に垂直な方向の位置を示す3次元座標のうちの少なくとも2つを含む、請求項1に記載のリード化合物の抽出方法。
- 前記第1の特性は、所定の創薬ターゲットに対する化合物の選択性であり、前記第2の特性は、所定の創薬ターゲットに対する化合物の活性であり、前記第3の特性は化合物の分子量であり、前記第4の特性は化合物のリガンド効率である、
請求項1に記載のリード化合物の抽出方法。 - 前記所定領域は、化合物の選択性及び化合物の活性の双方が所定値以上となる領域である、請求項3に記載のリード化合物の抽出方法。
- 前記所定領域に配置されたシンボルが示す化合物のうちリガンド効率が0.3以上である化合物を抽出する、請求項4に記載のリード化合物の抽出方法。
- 前記創薬ターゲットは、酵素、受容体または輸送体タンパク質である、請求項1ないし5のいずれかに記載のリード化合物の抽出方法。
- 創薬ターゲットに対して複数の化合物の中からリード化合物を抽出する方法であって、
複数の化合物に対して、化合物の複数の特性にしたがい化合物を示すシンボルを配置して散布図を作成するステップと、
散布図上の所定領域内に配置されたシンボルが示す化合物の中からリード化合物を抽出するステップと、を含み、
前記散布図において、化合物の第1及び第2の特性に基づきシンボルの配置位置が決定され、
前記第1の特性は、所定の創薬ターゲットに対する化合物の選択性であり、前記第2の特性は、所定の創薬ターゲットに対する化合物の活性であり、
前記所定領域は、化合物の選択性及び化合物の活性の双方が所定値以上となる領域であり、
前記所定領域に配置されたシンボルが示す化合物のうちリガンド効率が0.3以上である化合物を抽出する、リード化合物の抽出方法。 - 創薬ターゲットの選択方法であって、
所定の分子ターゲットについて、複数の化合物に対して、化合物の複数の特性にしたがい化合物を示すシンボルを配置して散布図を作成するステップと、
散布図上に配置されたシンボルの分布に基づいて、前記所定の分子ターゲットを創薬ターゲットとして選択するステップと、を含み、
前記散布図において、化合物の第1及び第2の特性に基づきシンボルの配置位置が決定され、化合物の第3及び第4の特性に基づきシンボルの属性が決定され、
化合物は、第3の特性に関して所定の条件で複数のグループに分類されており、
前記選択するステップは、各グループに属する化合物のシンボルの分布の変化の方向及び変化の終点に基づいて、前記所定の分子ターゲットを創薬ターゲットとして選択するか否かを決定する、
創薬ターゲットの選択方法。 - 前記シンボルの属性は、シンボルに関する、色、形状、大きさ及び前記第1及び第2の特性に基づきシンボルが配置される平面に垂直な方向の位置を示す3次元座標のうちの少なくとも2つを含む、請求項8記載の創薬ターゲットの選択方法。
- 前記第1の特性は、所定の分子ターゲットに対する化合物の選択性であり、前記第2の特性は、所定の分子ターゲットに対する化合物の活性であり、前記第3の特性は化合物の分子量であり、前記第4の特性は化合物のリガンド効率である、
請求項8に記載の創薬ターゲットの選択方法。 - 前記複数の化合物が分子量に基づき複数のグループに分類され、
各グループに属する化合物のシンボルの分布の重心を結ぶ矢印が前記散布図上に配置された、請求項10に記載の創薬ターゲットの選択方法。 - 各グループに属する化合物のシンボルの分布の重心を結ぶ矢印が、散布図上の所定領域に向かう場合に、当該分子ターゲットを創薬ターゲットとして選択する、請求項11に記載の創薬ターゲットの選択方法。
- 散布図上の変化の終点となる分布についてその分布の重心の位置が、選択性が所定値以上となりかつ活性が所定値以上となる領域に含まれる場合に、当該分子ターゲットを創薬ターゲットとして選択する、請求項12記載の創薬ターゲットの選択方法。
- 前記創薬ターゲットおよび/または分子ターゲットは、酵素、受容体または輸送体タンパク質である、請求項8ないし13のいずれかに記載の創薬ターゲットの選択方法。
- 所定の創薬ターゲットに対する複数の化合物の特性を示す散布図を生成する散布図生成装置であって、
複数の化合物について、化合物の種々の特性に関する特性情報を取得する取得手段と、
複数の化合物について、取得した特性情報にしたがい各化合物を示すシンボルを配置して散布図を生成して出力する散布図作成手段と、
を備え、
散布図作成手段は、化合物毎に、化合物の第1及び第2の特性に基づき散布図上のシンボルの配置位置を決定し、化合物の第3及び第4の特性に基づきシンボルの属性を決定して、決定した位置及び属性に基づき化合物を示すシンボルを散布図上に配置する、
散布図生成装置。 - 前記シンボルの属性は、前記シンボルに関する、色、形状、大きさ及び前記第1及び第2の特性に基づきシンボルが配置される平面に垂直な方向の位置を示す3次元座標のうちの少なくとも2つを含む、請求項15記載の散布図生成装置。
- 前記第1の特性は、所定の創薬ターゲットに対する化合物の選択性であり、前記第2の特性は、所定の創薬ターゲットに対する化合物の活性であり、前記第3の特性は化合物の分子量であり、前記第4の特性は化合物のリガンド効率である、
請求項15に記載の散布図生成装置。 - 前記散布図作成手段は、化合物の選択性が所定値以上で、かつ、化合物の活性が所定値以上となる領域を示す情報を散布図上に配置する、請求項17に記載の散布図生成装置。
- 前記領域内にシンボルが配置された化合物の中の少なくとも1つをリード化合物として抽出する抽出手段をさらに備えた、請求項18に記載の散布図生成装置。
- 前記散布図作成手段は、複数の化合物を分子量に基づき複数のグループに分類し、各グループに属する化合物のシンボルの分布の重心を結ぶ矢印を前記散布図上に配置する、請求項17に記載の散布図生成装置。
- 前記創薬ターゲットは、酵素、受容体または輸送体タンパク質である、請求項15ないし20のいずれかに記載の散布図生成装置。
- コンピュータに、所定の創薬ターゲットに対する複数の化合物の特性を示す散布図を生成させるプログラムであって、
コンピュータを、
複数の化合物について、化合物の種々の特性に関する特性情報を取得する取得手段、及び
複数の化合物について、取得した特性情報にしたがい各化合物を示すシンボルを配置して散布図を生成する散布図作成手段として動作させ、
前記散布図作成手段は、化合物毎に、化合物の第1及び第2の特性に基づき散布図上のシンボルの配置位置を決定し、化合物の第3及び第4の特性に基づき、シンボルの属性を決定し、
決定した配置位置及び属性に基づき化合物を示すシンボルを散布図上に配置する、
プログラム。 - 少なくとも第1ないし第4の特性を有する複数のデータの傾向を可視化する方法であって、
第1及び第2の特性に基づき、各データを示すシンボルを配置する位置を決定し、
第3及び第4の特性に基づき、各データを示すシンボルの属性を決定し、
決定した位置及び属性に基づいて、各データを示すシンボルを散布図上に配置する、
可視化方法。 - 第3の特性に関して所定の条件でデータが分類されており、
分類された複数のグループに属するデータのシンボルの分布の重心を結ぶ矢印が前記散布図上に配置された、請求項23に記載の可視化方法。 - 少なくとも第1ないし第3の特性を有する複数のデータの傾向を可視化する方法であって、
第1及び第2の特性に基づき、各データを示すシンボルを配置する位置を決定し、
決定した位置に基づいて、各データを示すシンボルを散布図上に配置し、
第3の特性に関して所定の条件でデータを複数のグループに分類し、分類した複数のグループに属するデータのシンボルの分布の重心を結ぶ矢印を前記散布図上に配置する、
可視化方法。 - 少なくとも第1ないし第4の特性を有するデータの傾向を可視化する装置であって、
複数のデータについて、データ毎の特性に関する特性情報を取得する取得手段と、
取得したデータの特性情報に基づいて散布図を生成する散布図生成手段と、
を備え、
散布図生成手段は、第1及び第2の特性に基づき、各データを示すシンボルを配置する位置を決定し、第3及び第4の特性に基づき、各データを示すシンボルの属性を決定し、決定した位置及び属性に基づき各データを示すシンボルを散布図上に配置する、
可視化装置。
Priority Applications (2)
| Application Number | Priority Date | Filing Date | Title |
|---|---|---|---|
| GB1717613.2A GB2555252A (en) | 2015-04-22 | 2016-04-21 | Method for extracting lead compound, method for selecting drug discovery target, device for generating scatter diagram, and data visualization method |
| US15/567,741 US20180089363A1 (en) | 2015-04-22 | 2016-04-21 | Method for extracting lead compound, method for selecting drug discovery target, device for creating scatter diagram, and data visualization method and visualization device |
Applications Claiming Priority (2)
| Application Number | Priority Date | Filing Date | Title |
|---|---|---|---|
| JP2015087915 | 2015-04-22 | ||
| JP2015-087915 | 2015-04-22 |
Publications (1)
| Publication Number | Publication Date |
|---|---|
| WO2016171220A1 true WO2016171220A1 (ja) | 2016-10-27 |
Family
ID=57143978
Family Applications (1)
| Application Number | Title | Priority Date | Filing Date |
|---|---|---|---|
| PCT/JP2016/062659 Ceased WO2016171220A1 (ja) | 2015-04-22 | 2016-04-21 | リード化合物の抽出方法、創薬ターゲットの選択方法及び散布図生成装置並びにデータの可視化方法及び可視化装置 |
Country Status (4)
| Country | Link |
|---|---|
| US (1) | US20180089363A1 (ja) |
| JP (2) | JP6135795B2 (ja) |
| GB (1) | GB2555252A (ja) |
| WO (1) | WO2016171220A1 (ja) |
Families Citing this family (1)
| Publication number | Priority date | Publication date | Assignee | Title |
|---|---|---|---|---|
| KR20260042054A (ko) | 2024-09-19 | 2026-03-30 | 가부시키가이샤 프론테오 | 타겟 탐색 장치 및 타겟 탐색 방법 |
Citations (3)
| Publication number | Priority date | Publication date | Assignee | Title |
|---|---|---|---|---|
| WO2007010677A1 (ja) * | 2005-07-22 | 2007-01-25 | Kazusa Dna Research Institute Foundation | パスウェイ表示方法、情報処理装置及びパスウェイ表示プログラム |
| US20090221617A1 (en) * | 2008-02-28 | 2009-09-03 | Hsin-Hsien Wu | Lead compound of anti-hypertensive drug and method for screening the same |
| JP2014534809A (ja) * | 2011-10-04 | 2014-12-25 | ミトラ バイオテック プライベート リミテッドMitra Biotech Private Limited | Ecm組成物、腫瘍微小環境プラットフォームおよびその方法 |
Family Cites Families (2)
| Publication number | Priority date | Publication date | Assignee | Title |
|---|---|---|---|---|
| EP1114320A2 (en) * | 1998-09-18 | 2001-07-11 | Cellomics, Inc. | A system for cell-based screening |
| JP2003323454A (ja) * | 2001-11-16 | 2003-11-14 | Nippon Telegr & Teleph Corp <Ntt> | メタ情報を有するコンテンツをマッピングする方法、装置、及びコンピュータプログラム |
-
2016
- 2016-04-21 GB GB1717613.2A patent/GB2555252A/en not_active Withdrawn
- 2016-04-21 JP JP2016085433A patent/JP6135795B2/ja active Active
- 2016-04-21 WO PCT/JP2016/062659 patent/WO2016171220A1/ja not_active Ceased
- 2016-04-21 US US15/567,741 patent/US20180089363A1/en not_active Abandoned
-
2017
- 2017-01-31 JP JP2017015924A patent/JP6191791B2/ja active Active
Patent Citations (3)
| Publication number | Priority date | Publication date | Assignee | Title |
|---|---|---|---|---|
| WO2007010677A1 (ja) * | 2005-07-22 | 2007-01-25 | Kazusa Dna Research Institute Foundation | パスウェイ表示方法、情報処理装置及びパスウェイ表示プログラム |
| US20090221617A1 (en) * | 2008-02-28 | 2009-09-03 | Hsin-Hsien Wu | Lead compound of anti-hypertensive drug and method for screening the same |
| JP2014534809A (ja) * | 2011-10-04 | 2014-12-25 | ミトラ バイオテック プライベート リミテッドMitra Biotech Private Limited | Ecm組成物、腫瘍微小環境プラットフォームおよびその方法 |
Non-Patent Citations (2)
| Title |
|---|
| MAJUMDER BISWANATH ET AL.: "Predicting clinical response to anticancer drugs using an ex vivo platform that captures tumour heterogeneity", NATURE COMMUNICATIONS, vol. 6, no. 6169, 27 February 2015 (2015-02-27), pages 1 - 14, XP055178650, ISSN: 2041-1723 * |
| PEREZ-VILLANUEVA JAIME ET AL.: "CASE Plots for the Chemotype-Based Activity and Selectivity Analysis:A CASE Study of Cyclooxygenase Inhibitors", CHEM BIOL DRUG DES, vol. 80, 2012, pages 752 - 762, XP055324044, ISSN: 1747-0227 * |
Also Published As
| Publication number | Publication date |
|---|---|
| US20180089363A1 (en) | 2018-03-29 |
| JP2017130207A (ja) | 2017-07-27 |
| JP2016204376A (ja) | 2016-12-08 |
| JP6135795B2 (ja) | 2017-05-31 |
| GB201717613D0 (en) | 2017-12-13 |
| JP6191791B2 (ja) | 2017-09-06 |
| GB2555252A (en) | 2018-04-25 |
| GB2555252A8 (en) | 2018-05-30 |
Similar Documents
| Publication | Publication Date | Title |
|---|---|---|
| Porras et al. | Towards a unified open access dataset of molecular interactions | |
| Gimeno et al. | The light and dark sides of virtual screening: what is there to know? | |
| Abbas et al. | Integrating Hi-C and FISH data for modeling of the 3D organization of chromosomes | |
| May et al. | Advanced multidimensional separations in mass spectrometry: navigating the big data deluge | |
| Gaulton et al. | ChEMBL: a large-scale bioactivity database for drug discovery | |
| Campbell et al. | Single-particle EM reveals the higher-order domain architecture of soluble guanylate cyclase | |
| Mortier et al. | Truly target-focused pharmacophore modeling: a novel tool for mapping intermolecular surfaces | |
| Uehara et al. | AutoDock-GIST: Incorporating thermodynamics of active-site water into scoring function for accurate protein-ligand docking | |
| Stumpfe et al. | Computational method for the systematic identification of analog series and key compounds representing series and their biological activity profiles | |
| Hu et al. | Exploring compound promiscuity patterns and multi-target activity spaces | |
| Artese et al. | Molecular interaction fields in drug discovery: recent advances and future perspectives | |
| US20160210337A1 (en) | A data processing system for adaptive visualisation of faceted search results | |
| Kuenemann et al. | Imbalance in chemical space: How to facilitate the identification of protein-protein interaction inhibitors | |
| Hou et al. | SeRenDIP-CE: sequence-based interface prediction for conformational epitopes | |
| Huang et al. | Computational tools for allosteric drug discovery: site identification and focus library design | |
| Astolfi et al. | p38α MAPK and type I inhibitors: binding site analysis and use of target ensembles in virtual screening | |
| Rana et al. | In silico study probes potential inhibitors of human dihydrofolate reductase for cancer therapeutics | |
| Alov et al. | In silico identification of multi-target ligands as promising hit compounds for neurodegenerative diseases drug development | |
| Zhou et al. | kinCSM: Using graph‐based signatures to predict small molecule CDK2 inhibitors | |
| JP6191791B2 (ja) | 可視化用画像データの生成方法及び可視化装置 | |
| Protopopov et al. | The freedom space–a new set of commercially available molecules for hit discovery | |
| Wang et al. | Predicted networks of protein-protein interactions in Stegodyphus mimosarum by cross-species comparisons | |
| Chen et al. | Docking to multiple pockets or ligand fields for screening, activity prediction and scaffold hopping | |
| Wassermann et al. | Comprehensive analysis of single‐and multi‐target activity cliffs formed by currently available bioactive compounds | |
| Danuser et al. | Probing f-actin flow by tracking shape fluctuations of radial bundles in lamellipodia of motile cells |
Legal Events
| Date | Code | Title | Description |
|---|---|---|---|
| 121 | Ep: the epo has been informed by wipo that ep was designated in this application |
Ref document number: 16783241 Country of ref document: EP Kind code of ref document: A1 |
|
| WWE | Wipo information: entry into national phase |
Ref document number: 15567741 Country of ref document: US |
|
| NENP | Non-entry into the national phase |
Ref country code: DE |
|
| ENP | Entry into the national phase |
Ref document number: 201717613 Country of ref document: GB Kind code of ref document: A Free format text: PCT FILING DATE = 20160421 |
|
| 122 | Ep: pct application non-entry in european phase |
Ref document number: 16783241 Country of ref document: EP Kind code of ref document: A1 |