WO2016151336A1 - Battery model comprising plurality of equivalent circuit networks and interface element coupling them - Google Patents
Battery model comprising plurality of equivalent circuit networks and interface element coupling them Download PDFInfo
- Publication number
- WO2016151336A1 WO2016151336A1 PCT/GB2016/050852 GB2016050852W WO2016151336A1 WO 2016151336 A1 WO2016151336 A1 WO 2016151336A1 GB 2016050852 W GB2016050852 W GB 2016050852W WO 2016151336 A1 WO2016151336 A1 WO 2016151336A1
- Authority
- WO
- WIPO (PCT)
- Prior art keywords
- battery
- ecn
- model
- overpotential
- electrode
- Prior art date
- Legal status (The legal status is an assumption and is not a legal conclusion. Google has not performed a legal analysis and makes no representation as to the accuracy of the status listed.)
- Ceased
Links
Classifications
-
- G—PHYSICS
- G01—MEASURING; TESTING
- G01R—MEASURING ELECTRIC VARIABLES; MEASURING MAGNETIC VARIABLES
- G01R31/00—Arrangements for testing electric properties; Arrangements for locating electric faults; Arrangements for electrical testing characterised by what is being tested not provided for elsewhere
- G01R31/36—Arrangements for testing, measuring or monitoring the electrical condition of accumulators or electric batteries, e.g. capacity or state of charge [SoC]
- G01R31/367—Software therefor, e.g. for battery testing using modelling or look-up tables
-
- G—PHYSICS
- G06—COMPUTING OR CALCULATING; COUNTING
- G06F—ELECTRIC DIGITAL DATA PROCESSING
- G06F30/00—Computer-aided design [CAD]
- G06F30/30—Circuit design
- G06F30/36—Circuit design at the analogue level
- G06F30/367—Design verification, e.g. using simulation, simulation program with integrated circuit emphasis [SPICE], direct methods or relaxation methods
-
- G—PHYSICS
- G06—COMPUTING OR CALCULATING; COUNTING
- G06F—ELECTRIC DIGITAL DATA PROCESSING
- G06F2119/00—Details relating to the type or aim of the analysis or the optimisation
- G06F2119/06—Power analysis or power optimisation
Definitions
- the present disclosure relates to the analysis of battery performance.
- the disclosure concerns the provision of battery management systems that enable users of battery powered devices or systems to be provided with information regarding battery characteristics.
- BMS battery management systems
- SOC state of charge
- SOH state of health
- SUBSTITUTE SHEET RULE 26 Accordingly, current methodologies are generally inadequate for assessing true battery performance characteristics. This can not only lead to providing misleading information of a battery's capabilities to the user (potentially under- or overestimating a vehicle's range, for example) but it also limits the ability of battery management systems to decide the optimum battery use to maximise lifetime. For example, many battery management systems are designed to prevent charge beyond 90% or discharge below 10% (or similar figures) on the basis that battery operation in these ranges is deleterious to battery longevity. These fixed control thresholds are simplistic operational limits which do not take account of the true dynamic characteristics of the battery.
- ECNs equivalent circuit networks
- a physical system is modelled by a hypothetical circuit designed to display the same properties, where the hypothetical, so-called “equivalent”, circuit can be readily computationally resolved.
- ECNs have been designed with the aim of describing battery behaviour. The elements of these circuits are not based on any underlying principle of the battery's operation but are designed iteratively based on outcomes. However, while these approaches can be relatively quick in computing overall battery cell voltage, they will at best reflect cumulative effects on battery performance without distinguishing the underlying causes of battery degradation.
- a method for determining a characteristic of a battery within a system comprising:
- the proposed method can operate a plurality of equivalent circuit networks (ECNs) in order to model a battery within a system. It is computationally possible to calculate solutions for the ECNs individually, while the interface element can introduce in the model non-linear effects and other effects which cannot find ready electrical analogs for handling via the ECNs themselves.
- the interface element may define the charge transfer reaction between the ECNs. In this way, the speed and efficiency of ECN modelling can be harnessed while at the same time enabling an accurate representation of electrochemical processes within the model.
- the model comprises at least three ECNs.
- at least one ECN represents chemical transport at the battery electrodes, such as diffusion within the electrodes.
- at least one ECN represents ionic transport (such as diffusion) between electrodes through the electrolyte in the battery.
- One or more further ECNs may represent an electrical circuit coupled to a battery cell. Accordingly, three distinct species are defined according to their electrochemical reaction state, metal atoms, metal ions and electrons, prior and post a reduction or oxidation reaction; all of which are associated with distinct transport circuits. These can represent the entire circuit within the system, emulating dynamic battery behaviour.
- the interface element is termed a triple species element as it defines the interface between the three species of ECN.
- each parameter defining the ECNs, and particularly ECNs representing chemical behaviour at battery electrodes and/or ion transport between electrodes, is associated with an underlying physical property of the system.
- the interface element compensates for charge-transfer overpotential at the reaction sites of each electrode.
- the charge-transfer overpotential may comprise one or more of: an activation overpotential, a diffusion overpotential, and a passivating layer overpotential.
- Activation overpotential is due to the energy barrier for a chemical reaction to take place.
- Diffusion overpotential is due to mass transport limitations.
- the passivating layer overpotential is due to irreversible reaction products on the surface of the electrode, potentially consuming active material and increasing resistance to ionic flow.
- This passivating layer resistance value is locally variable and a function of the local model states, such as for example, but not exclusively, reaction current density, layer thickness and temperature. The layer's capacitive response is accounted for due to this dependence on local side reaction current density.
- Double layer overpotential is accounted for, in some preferred embodiments, by a capacitance provided in parallel to the interface element.
- a double layer overpotential is established due to local polarisation at the interface between electrodes and ionically conducting electrolyte, manifested in the voltage drop across the double layer capacitor.
- This double layer capacitor value is locally variable and a function of the local model states, such as for example, but not exclusively, concentration, potential and temperature.
- the battery characteristic is state of charge (SOC) and state of health (SOH). These characteristics provide clear indications of battery performance.
- the battery is a lithium ion battery.
- the approach presented finds particular applicability for a battery of this type.
- the battery may be any other type of battery involving Faradaic reactions at an electrode and hence requiring more than two ECNs to be linked by an interface element.
- the one or more ECNs representing chemical species transport behaviour within a battery electrode comprise an RC ladder.
- the RC ladder has been shown to be an appropriate representation of diffusion through a porous medium, making
- SUBSTITUTE SHEET RULE 26 it suitable for the modelling of behaviour in the chemical domain. Diffusion of ions between the electrodes can also be modelled using RC circuits and so in preferred embodiments, ECNs representing ion transport may alternatively or additionally comprise an RC ladder. It can also be appreciated that aspects of the disclosure can be implemented using computer program code. Indeed, according to a further aspect of the present disclosure, there is therefore provided a computer program product comprising computer executable instructions for carrying out the method of the first aspect.
- the computer program product may be a physical / tangible storage medium.
- the storage medium may be a Read Only Memory (ROM) or other memory chip. Alternatively, it may be a disk such as a Digital Versatile Disk (DVD-ROM) or other data carrier.
- ROM Read Only Memory
- DVD-ROM Digital Versatile Disk
- Figure 1 illustrates a system comprising a battery management system operating according to a preferred embodiment
- Figure 2 schematically shows equivalent circuit networks within the model coupled by a triple species element
- Figure 3 shows further details of the circuits of Figure 2;
- Figure 4 shows an overview of the modelling domains within the battery;
- Figure 5A illustrates a capacitor electrical equivalent within an equivalent circuit network;
- Figure 5B illustrates a resistor electrical equivalent within an equivalent circuit network;
- Figure 6 shows potential variations across three cell domains;
- Figure 7 illustrates a single particle triple species element implementation;
- Figure 8 provides a further representative view of elements of the triple species element;
- Figure 10 illustrates thermodynamic potential equations for anode and cathode over their stoichiometric ranges
- Figure 11 illustrates a comparison of model predictions of cell voltage compared with experimental data
- Figure 12 shows a comparison of predicted cell voltage according to a preferred embodiment in comparison with experimental data
- Figure 13A shows a comparison of the predictions of the time evolution of lithium concentration at an anode according to a preferred embodiment with the alternative COMSOL model
- Figure 13B shows a comparison of the predictions of the time evolution of lithium concentration at a cathode according to a preferred embodiment with the alternative COMSOL model
- Figure 14A shows a comparison of the predictions of the time evolution of electrolyte concentration during a discharge pulse according to a preferred embodiment with the alternative COMSOL model
- Figure 14B shows a comparison of the predictions of the time evolution of electrolyte concentration during a charge pulse according to a preferred embodiment with the alternative COMSOL model
- Figure 15 illustrates temperature increase exhibited by the cell during 10C, 5C, 2C and 1 C discharge
- Figure 16 shows various diffusion overpotential contributions during a full 1C discharge
- Figure 17 illustrates an Electrochemical Impedance Spectroscopy analysis
- Figure 18 illustrates heat generation associated with the overpotentials during a 1C discharge
- Figure 19 shows a comparison of experimental data of a 2C discharge to simulation results
- Figure 20 shows a comparison with Electrochemical Impedance Spectroscopy analysis for diffusion resistances
- Figure 22 shows a comparison with Electrochemical Impedance Spectroscopy analysis for passivating layer resistance
- Figure 23 shows a comparison of simulation output and experimental data of a constant current - constant voltage charge procedure
- Figure 24 shows a comparison of the ECN cell voltage prediction to COMSOL simulation results
- Figure 25 illustrates a comparison of ECN model results compared to cell voltage recordings during a test period.
- an apparatus 10 comprising a battery 12, an operational circuit 14 and a battery management system (BMS) 16.
- the apparatus 10 may be any electrically-powered apparatus in which a battery is provided.
- the apparatus may be an electric vehicle.
- the apparatus 10 may be a portable computing device such as a tablet computer or a smart phone.
- the apparatus 10 may be provided with one or more inputs for receiving user commands and may further comprise one or more outputs for conveying information to a user.
- the apparatus may comprise one or more displays.
- the information conveyed to the user may contain information about one or more battery characteristics such as state of health (SOH) or state of charge (SOC).
- SOH state of health
- SOC state of charge
- the information may further comprise parameters calculated in dependence on such characteristics, such as the anticipated range of an electric vehicle.
- the battery 12 is a lithium-ion battery.
- the battery 12 may comprise one or more battery cells. Besides electrolyte, each cell may comprise an anode, a cathode and a separator between the anode and cathode which is ionically conducting and electrically insulating.
- the operational circuit 14 is used to carry out the primary task of the apparatus 10. For example, it may include an electric motor in the case of an electric vehicle or a processing
- the operational circuit will comprise control circuitry to control the operation of the apparatus 10.
- the battery management system (BMS) 16 comprises a processing unit and a memory unit and is provided to allow reporting on battery characteristics.
- the BMS 16 may further optimise operation of the apparatus to improve battery usage.
- the BMS 16 operates to monitor one or more observable parameters and to calculate a battery characteristic based on these parameters and a model of the system.
- Observable parameters may comprise, for example, battery cell voltage and/or temperature. These parameters may be monitored across a period of time in order to allow parameters of the model to be optimised. Such monitoring may be continuous or discrete.
- the model 20 operated by the BMS 16 is illustrated schematically in Figure 2.
- the model comprises a plurality of equivalent circuit networks (ECNs) 22, 24, 26, each representing the behaviour of a particle species within the system 10.
- the species are electrons, ions and atoms.
- the ions and atoms are Lithium ions and Lithium atoms.
- Figure 2 illustrates intercalated Lithium ECNs 22, Lithium ion ECN 24 and an electron ECN 26.
- the intercalated Lithium ECNs 22 represent chemical transport within the electrodes within the battery 12.
- the Lithium ion ECN 24 represents the diffusion across the electrolyte separating the electrodes within the battery 12.
- the electron ECN 26 represents electron transport, including that through the operational circuit 14.
- Triple species elements 28 are provided to couple the ECNs of different species together.
- the triple species elements 28 mediate the modelled charge and mass transfer between the ECNs, and can account for electrochemical processes not modelled within the ECNs themselves. In particular, the triple species elements 28 impose charge transfer overpotentials.
- the operation of the model of the preferred embodiment will be described below.
- the battery management system 16 applies a lithium-ion battery model in Simulink/Matlab and predicts cell performance based on first principles.
- the model can allow for concentration gradients and transport of chemical species obeying charge and mass conservation in electrodes and electrolyte, local variations in internal impedance, electrochemical double layer capacitance, temperature as well as various forms of degradation. All processes are translated into electrical analogies enabling the model to be easily integrated into the BMS of electrical systems comprising
- a battery allows the conversion of chemical energy stored by electroactive constituents into electrical energy.
- the reaction from one electroactive species to another occurs in the vicinity of the interface between the ionically conductive electrolyte and the electronically conductive electrodes.
- FIG. 3 shows a pseudo-2D schematic of the battery 12 within apparatus 10.
- the solid electrodes (anode 330 and cathode 340) of the battery 12 are represented by an array of spherical particles 300, spanning the distance between a separator 310 and the current collectors 320 also provided by battery 12.
- the entire volume between the current collectors 320 is flooded with electrolyte, which allows li-ion transport through the pores of the electrodes 330,340.
- the bottom half of Figure 3 illustrates the ECNs of the model within an overall circuit.
- the top section 350 of the circuit represents the electron transport network in the external circuit (the equivalent circuit network 26 of Figure 2) with ohmic resistances of the current collectors.
- the electrolyte phase is represented by the section 360 below section 350, which corresponds to ECN 24 of Figure 2 and represents Li-ion transport with resistive
- SUBSTITUTE SHEET RULE 26 elements representing transport limitations in the ionic flux-direction, and capacitive elements representing local accumulation of ions within a spatial discretisation in the ionic flux- direction.
- the circuitry 370 shown at the bottom of Figure 3 corresponds to ECN 22 of Figure 2 and represents the transport of the intercalated lithium atoms inside each solid electrode particle 300, again with resistive elements representing transport limitation to diffusion in the radial direction, and capacitive elements representing local accumulation of ions within discretised shells.
- ECNs there are therefore three distinct electrical circuits modelled as ECNs: the electrical circuit 350; the lithium-ion transport circuit 360; and the lithium-metal circuit 370.
- Each interface between these circuits is governed by triple species elements 400 (corresponding to triple species elements 28 of Figure 2).
- Further possible discretisations within the particle 300 (r-direction) and along the electrode pair domains and separator domain (x-direction) can be incorporated in a similar manner.
- the equations governing the conservation and transport of each species in a standard electrochemical model can be reformulated in such a way that they can be represented by electrical circuit equivalents.
- Intercalated lithium-atoms are present only in the electrode phase, and are therefore represented solely within the chemical domain, while electrons flow in the outside circuit and are therefore modelled in the electrical domain.
- Lithium-ions are present in the electrolyte phase which is ionically conducting and electrically insulating.
- This ion transport network is integrated into the electrical modelling domain, enabling the model to balance the amount of Li generated/consumed in each reaction with the amount of electrons participating in the reaction.
- the link between the three networks is an important feature of this model, coupling information related to the electrical potential of the interacting species due to their electrochemical potential changes during a reaction.
- SUBSTITUTE SHEET RULE 26 Upon discharge lithium-atoms oxidise (leave) the solid electrode phase of the anode 300 and diffuse through the separator 310 to the cathode 340 (as can be understood with reference to the upper section of Figure 3, for example). In this process, lithium-atoms closer to the reaction location at the electrode surface can oxidise sooner than Li deeper in the electrode bulk. Mass transport limitation to the diffusion of Li atoms through the electrode material 300 towards the surface (anode) and from the surface to the core (cathode) leads to concentration gradients in the radial direction in both electrodes.
- Figure 4 illustrates the chemical and electrical dimensions of the model.
- the chemical domain is within each electrode particle 300.
- the electrolyte 410 is integrated in the electrical domain as the species contained has a charge (Li + ), while the current collectors 320 are also in the electrical domain as the species contained also has a charge (e " ).
- Figure 4 also schematically illustrates the double layer/passivating layer at the electrode particle 300 surface.
- the charge on a capacitor corresponds to the molar amount m, of a species, while the potential drop across a capacitor corresponds to the species' normal chemical potential ⁇ stored within a particular control volume V y .
- the normal chemical potential is formed by an electric potential as a result of the electrode electric field and the chemical potential as a result of species concentration.
- Equation 5 which allows for a general expression of chemical capacitance C as a function of concentration in a control volume.
- the expression for the electrical capacitance of discretised electrolyte volum with lithium-ions can be derived in Cartesian coordinates in [F] in the electrical domain.
- D is a diffusion coefficient (function of temperature). According to Fick's first law, a chemical flux occurs though a chemical resistance, resulting in a loss of normal chemical potential
- Equating Equation 8 and Equation 9 allows the derivation of a general expression of R ch (x) as the resistance in [J.s mol '2 ] to lithium-atom flux in the chemical domain inside the electrodes. This analogy is visualised in Figure 5B. For lithium-ion transport in the electrolyte this leads to
- the chemical modelling domain is connected to the electrical modelling domain.
- the two domains are linked via a conversion factor of 1/nF, where n is the number of electrons (equal to the number of lithium-ions and that of lithium-atoms) participating in the reaction and F is the Boltzmann constant in [m 2 kg s '2 K '1 ].
- the TSE hereby enables the relating of electrochemical quantities to electrical quantities by a conversion factor of 1/nF.
- Electric potential ⁇ is related to electrochemical potential ⁇ by
- Electric current is related to species current (flux) by
- Electric resistance is related to resistance to chemical species diffusion by
- lithium atoms are oxidised from the solid electrode phase of each particle and enter the electrolyte 410 they are effectively transformed into a different 'species' as defined in this methodology. This conversion is accounted for by the source/sink term j n connecting the two domains (see Equation 15).
- j n the number of lithium-atoms, lithium-ions and electrons are equal, meaning each lithium-atom yields one lithium-ion and one electron during discharge. Similarly, one lithium-ion and one electron are required to reduce to a lithium-atom during the charge process.
- This description corresponds to processes taking place at the anode. At the cathode, the reverse processes take place upon charge/discharge.
- the region closest to the de-lithiating electrode (represented by the source term) will first increase locally in lithium-ion concentration.
- Mass transport limitations in ionic diffusion towards the opposite electrode lead to local concentration non-homogeneities and concentration gradients opposite to the direction of ionic flux.
- Fick's law of diffusion can be modified with a source/sink term in order to capture this phenomenon for lithium- ion transport in the electrolyte.
- the resistor-capacitor analogy derived earlier can be applied, herein the direction of diffusion in Cartesian coordinates.
- the conversion factor of 1/nF between the chemical and the electrical domains is applied to each of the expressions.
- the resistance representing diffusion limitations to lithium-ion transport and the capacitance of species flux due to the species accumulation in a volume result in their electrical modelling domain expressions. Note the different (electrical domain) units of both expressions.
- the three networks contained in the system are linked, ensuring mass and charge conservation at all times, while converting information from the electrochemical (LT) network into information for the electrical (Li and e " ) network, and evaluating energy losses in the charge-transfer reaction process.
- the so called charge transfer overpotential which represents a reduction of the useful potential provided by the cell, is discussed in the following.
- electrode kinetics are described by solving the current- overpotential relation (Equation 18) self-consistently. Omitting mass transport (diffusion) limitations represents a common simplification of this relation, leading to what is known as the Butler-Volmer equation.
- the voltage drop over a triple species element is the electric potential difference across the electrode/electrolyte interface, and can be expressed in terms of the electrode equilibrium potential E q and the charge transfer overpotential.
- Equation 21 The overall cell potential V a t can therefore be expressed as the difference between the electrode potentials less the potential drop due to lithium-ion transport through the electrolyte and the potential losses due to contact resistances in the current collectors. , Equation 22 with the potential drop across the electrolyte being
- the complete system is assembled (as shown in Figure 1 , for example), in this implementation comprising three particles in each electrode and three discretisation elements in the separator. All circuit equations are implemented as derived below.
- the cathode electrode is shown on the right of the model, the anode electrode is shown on the left, with the separator region in-between.
- Ohmic contact resistances represent the current loss from ohmic heating caused by electron flow though the positive aluminium and the negative copper electrodes.
- the electrolyte part of the model is implemented in the electrical domain, which allows an easy comparison of simulation outputs with experimental data, while the electrode lithium-atom transport circuit is integrated in the chemical domain.
- the model can easily be completely converted to the chemical domain by applying the coupling factor 1/nF for each potential, resistance and capacitance.
- each TSE therefore forms the electrical potential experienced by the oxidised species while the bottom end represents the chemical potential of the reduced species.
- concentration imbalances lead to re-balancing chemical fluxes through species transport resistances, whereby giving rise to diffusion overpotentials.
- each corner of the TSE is figuratively connected to one of the three species connected to it. While the left-hand side is connected to the electron circuit, the right-hand side is connected to the electrolyte transport system and the double-layer region and the bottom corner is connected to the transport network inside the electrode. Inside each electrode particle, species transport is modelled by an RC ladder network which allows the discretisation of each particle into p shells and a central core.
- SUBSTITUTE SHEET RULE 26 Referring to Figure 4, the direction of current flow is indicated for discharge, resulting in concentration gradients and species fluxes in the radial direction, as indicated. In this case lithium-atoms de-lithiate from the negative electrode, as indicated by the chemical flux arrow and lithiate into the cathode, again shown by the flux arrow into the particles of the positive electrode. Information on each electrode's apparent equilibrium potential, and overpotential contribution can be extracted at any time and operating condition in the form of virtual voltmeters. The only positive potential contribution stems from the potential difference between the positive and negative electrode; all other potentials are negative and represent reductions of the useful cell potential.
- Equation 22 reduces to the cell open circuit potential. This concept is visualised in Figure 6. i ⁇ _ . /. «s _ /. ⁇ ” ⁇ " ⁇ Equation 24
- Figure 7 illustrates the operating principles described above applied at a local level, where the electrode structure is approximated to a pseudo-2D multi-particle system immersed in electrolyte. The relevant terms for one of these particles is shown.
- TSE serves as the link between the electrical and the chemical domains
- SUBSTITUTE SHEET RULE 26 connecting the separate transport circuits of electrons, the reduced species (lithium- atoms) in the electrodes and the oxidized species (lithium-ions) in the electrolyte.
- the information of electrode surface lithium-atom concentration c[ u and electrolyte lithium-ion concentration c u l + serve as input to the evaluation of electrochemical potential, charge transfer overpotentials and the resulting electrical potentials.
- the electrical potentials define the rate of electrochemical species flux and therefore the associated electron flux; useful as a current through the external circuit.
- the potential across each TSE can be formulated mathematically, constituting of chemical potential coupled to diffusion overpotentials, activation overpotential and the potential drop due to the presence of the passivating layer.
- the ECN system is solved self-consistently at any point in time.
- the current -voltage relation is affected by the presence of a double layer at the electrode/electrolyte interface, where a higher ion concentration is present, associated with a localised potential drop.
- the effect of the double layer is mimicked by double layer capacitors arranged in parallel with the charge transfer reaction. The resistance to deplete/replenish each reaction site's double layer is dependent on the local concentration.
- Equation 21 into the TSEs and the link between the Lf, Li and e " networks can be further understood with reference to Figure 8.
- a variable double-layer capacitor C dl is arranged in parallel with the TSE.
- the potential drop due to the double layer at the electrode/electrolyte interface is a function of layer thickness, which in turn is a function of electrolyte lithium concentration c + and applied load.
- the capacitance of the double layer capacitor C is composed of an inner capacitance and an outer capacitance. It is formulated as a function of lithium concentration available in the electrolyte as well as the layer's thickness. According to the Stern-Gouy-Chapman theory, it is calculated as a function of particle size r A , and a thickness ⁇ . I Equation 30
- Equation 32 The TSE linked to the electrode phase RC-system 370 operates in parallel with the electrical double layer capacitor C dl and in series with the electrolyte RC-system 360 as shown in Figure 7.
- the model as described above is inherently flexible, allowing additional features to be incorporated, through modification of the triple species element and by adding further triple species elements in parallel with the already existing one.
- the electrochemical processes inside the cell cause various types of heat generation leading to a local temperature change; in turn affecting various material properties.
- the temperature dependence of a reaction rate and related physiochemical property ⁇ is commonly formulated with an Arrhenius equation.
- each property ⁇ operating at temperature (7) in [ ] is a function of its reference value ref at its reference temperature (T ref ) and of its activation energy E ⁇ ct
- SUBSTITUTE SHEET RULE 26 representing the temperature sensitivity of the property in [J mol "1 ].
- Heat generation in a cell during operation is due to a combination of reaction heat (q r ), ohmic heat from ionic transport through the matrix and electrolyte phase ((3 ⁇ 4), ohmic heat due to the contact resistance between the electrodes and the respective current collectors (q c ) and entropic heating due to phase changes of the electrode matrices during intercalation/de- intercalation, (q e ).
- the latter can also lead to heat absorption, as it is reversible. Conservation of thermal energy in the cell therefore balances heat accumulation, convective dissipation and heat generation.
- Equation 36 where p is the density in [kg m "1 ], C p is the heat capacity in [J kg '1 K ⁇ 1 ], k is the thermal conductivity in [W m '1 K '1 ], h is the convective heat transfer coefficient [W m '2 K '1 ], a s is the convective area exposed to the cooling medium in [m 2 ] and T am is the free stream temperature of the immediate surroundings in [K]. For a cell made of multiple electrode pairs thermal boundaries can be adjusted accordingly.
- the electrochemical reaction itself gives rise to a heat term, which is function of the overpotential generated in converting chemical potential into electrical potential.
- Ohmic resistance to ionic transport through the electrolyte as well as the diffusion limitations to species transport in the electrodes causes local potential gradients in the electrodes and electrolyte leading to local ohmic heat generation.
- Equation 38 The contact resistance between electrodes and current collectors gives rise to a further heat term, which is applicable only at those locations in the electrode pair.
- phase transition during lithiation and de-lithiation in both electrodes gives rise to a reversible heating term, the entropic heat. It is the only heat term which in itself is a function of temperature.
- the lithium-ion insertion/de-insertion in the active materials occurs through a surface reaction that takes place at the interface between the graphite and the passivating layer (PL).
- the total exchange current density can be differentiated in useful electrochemical current and parasitic side-reaction reaction current density occurring at the passivating layer and producing irreversible precipitation adding to the layer.
- Equation 41 where j t [A m "2 ] denotes the total current density in the electrode and i mt stands for the part of current density that takes part in the intercalation process. Due to the proportion of side exchange current density being so small, the dependency on overpotential of the side reaction current density is modelled according to
- SUBSTITUTE SHEET RULE 26 The rate of growth of the passivating layer thickness is related to the side-reaction current density, the layer's density and its molar weight.
- Equation 45 dt c3 ⁇ 4F p l
- the parasitic side reaction renders electroactive material in the interfacial region inactive. As it can no longer participates in the electrochemical shuttle between anode and cathode, it presents a quantifiable capacity loss to the system. The capacity loss is calculated from the total passivating layer side reaction current. Equation 46
- Exemplary embodiments can enable real-time (or faster) performance prediction in modern portable electronics systems and automotive applications using the already existing basic infrastructure of current/voltage measurements only. This can help to quantify state of health and remaining battery capacity.
- Figure 9 demonstrates the ease of adaptation of the model according to the above-described principle.
- the inputs in Figure 9 represent the observable parameters of the system which can be monitored.
- the bold system variables denote the sole two states commonly monitored on a battery management system in previous approaches.
- the other outputs represent characteristics of the battery among those which can be calculated using the approach described herein.
- the wealth of additional information relating to the electrochemical state to be obtained using preferred embodiments is shown, given some commonly available material/geometry characteristics of the cell in
- SUBSTITUTE SHEET RULE 26 question This allows the observer to make accurate SOC and state of health predictions, as well as monitor thermal conditions in order to prevent or mitigate thermal runaway while in operation.
- the model allows easy modifications by control engineers, BMS designers and vehicle system platform engineers without costly experimental work and macroscopic analysis. For battery materials commonly used by the automotive and portable electronics industry the parameters required tend to be easily available in the academic literature.
- the cell evaluated in this study was a commercial LiNiMnCoO-graphite pouch cell SLPB 11043140H (4.8 Ah) by Dow Kokam.
- the C/10, 1C, 2C and 10C discharges were conducted in a thermally controlled environment at room temperature using a potentiostat (HCP/1005 Bio-Logic) with a 100 A booster.
- the simulation solver is based on the finite element method with each domain discretised at the same coordinate values as the preferred embodiment (ECN) and the Newman model implementation. Both the ECN simulation and the COMSOL evaluation were run on the same machine with an Intel (R) core i5- 3317CPU and 8.00GB Ram.
- thermodynamic potential as a function of the anode stoichiometry was obtained from the literature, whereas the equation for the cathode was calculated as the difference of an OCV measurement (conducted at C/20 on the same cell) and the anode thermodynamic potential ( Figure 10).
- the equations above can be used for the equilibrium potential of each electrode.
- Electrode electronic conductivity of the bulk [7] Out Sm "1 - 100 1 .3 10 -
- Electrolyte diffusion coefficient [4] Di_i+ mV 1 - 1 .7 ⁇ -10 1 .7 ⁇ -10 1 .7 ⁇ -10 -
- ECN simulation predictions according to the preferred embodiment versus experimental discharges at C/4, 0.5C, 1C, 5C, 10C and 20C and charges at 0.5C, 1C and 2C can be seen in Figure 1 1 , for a controlled temperature procedure.
- the simulation results match the experimental results to within 5.2% over the entire SOC range from 20C discharge to 2C charge.
- the deviations occur predominantly at the highest tested discharge C-rate (20C discharge (5.2% error) and 2C charge (2.6%)), which can be attributed to an overestimation of heat dissipation away from the cell in the model.
- Electrochemical Impedance Spectroscopy testing of a cell allows the parametrisation of simple equivalent circuits with elements representing lumped electrochemical processes.
- the ECN model of the preferred embodiment was subjected to the Northern European Driving Cycle (NEDC), scaled to an example load-cycle for a single electrode pair cell.
- NEDC Northern European Driving Cycle
- test data current, voltage, time
- a 25 minute (Figure 25) extract was used as input to the ECN model and the results compared to the cell voltage recordings made during the run.
- the vehicle in this case was a PHEV with relatively low C-rates.
- the cell measurements ( ⁇ ) were recorded from the BMS via the vehicle CAN (Controller Area Network) bus at discrete time steps (0.1s).
- the cell in the vehicle is integrated in a pack and likely subject to unequal loading and cell balancing, while only the current/voltage at the pack connectors is conventionally measured for range estimation. Knowledge of the pack configuration allowed scaling of load and cell response to a single cell.
Landscapes
- Engineering & Computer Science (AREA)
- Computer Hardware Design (AREA)
- Physics & Mathematics (AREA)
- General Physics & Mathematics (AREA)
- Theoretical Computer Science (AREA)
- Microelectronics & Electronic Packaging (AREA)
- Evolutionary Computation (AREA)
- Geometry (AREA)
- General Engineering & Computer Science (AREA)
- Secondary Cells (AREA)
Abstract
The disclosure provides a method and apparatus for determining a characteristic of a battery within a system. The method comprises: defining a model comprising a plurality of equivalent circuit networks and an interface element through which the equivalent circuit networks are coupled; monitoring at least one observable parameter of the system; and calculating a battery characteristic based on the observable parameter and the model.
Description
BATTERY MODEL COMPRISING PLURALITY OF EQUIVALENT CIRCUIT NETWORKS AND INTERFACE ELEMENT COUPLING THEM
1 Field
The present disclosure relates to the analysis of battery performance. In particular, but not exclusively, the disclosure concerns the provision of battery management systems that enable users of battery powered devices or systems to be provided with information regarding battery characteristics.
2 Background
As portable devices are provided with additional functionality, and as electrical power is adopted in place of alternative power sources (such as in electric vehicles), battery performance is becoming a key limiting factor on device adoption. In order to provide users with a satisfactory experience, there is a desire not only to enhance fundamental battery life but also to ensure accurate information is provided in order to manage expectations. To this end, battery management systems (BMS) are provided to allow indications of battery characteristics to device users. For example, the user of an electric vehicle may be provided with information regarding the expected range of the vehicle and the user of a mobile phone may be provided with an estimated percentage of battery life remaining.
To estimate the range of a vehicle, for example, it is desirable to have an understanding not only of the battery's state of charge (SOC) but also state of health (SOH). An accurate estimation of these properties is not trivial and requires more than mere knowledge of cell voltage.
In practice, most in-situ battery management systems use a look-up table or simple algebraic expressions to estimate SOC on the basis of a measured voltage, using predefined algorithms and a preset discharge curve interpolation. The primary benefit of this approach is speed; No significant processing overhead is required in carrying out the looking-up process or solving algebraic equations. However, any such model will only reflect battery performance under the specific conditions under which it was parametrised, such that it cannot account for any extra factors, such as those encountered in the complex operating conditions of the application. While it is theoretically possible to provide matrices reflecting the depth and variety of operating conditions (such as voltage, temperature or cycle number) the cost of populating such tables with reliable data for a sufficient variety of conditions is prohibitive.
1
SUBSTITUTE SHEET RULE 26
Accordingly, current methodologies are generally inadequate for assessing true battery performance characteristics. This can not only lead to providing misleading information of a battery's capabilities to the user (potentially under- or overestimating a vehicle's range, for example) but it also limits the ability of battery management systems to decide the optimum battery use to maximise lifetime. For example, many battery management systems are designed to prevent charge beyond 90% or discharge below 10% (or similar figures) on the basis that battery operation in these ranges is deleterious to battery longevity. These fixed control thresholds are simplistic operational limits which do not take account of the true dynamic characteristics of the battery. Alternatively these simplistic operational limits may not prevent operation under complex deleterious conditions (such as at high or low temperatures which may cause excessive degradation and or failure) which cannot be encapsulated in the simplistic control algorithm. There may as a result be untapped potential within the battery which is not utilised due to overcautious limits. With a full understanding of battery behaviour, more sophisticated control of battery usage for desired longevity could be achieved. At present, battery management systems based on simple models are not well placed to take advantage of these opportunities.
In studying battery capabilities and performance, full electromechanical models have been developed. These solve the scientifically understood coupled partial differential equations and can be used in battery design processes and indeed in the production of battery management systems. However, implementation of these models in situ is prohibited by the significant processing power required to run these models. This high required computational intensity leads to a low simulation speed so that even if they could be implemented in situ they would not provide results in adequate time. Thus, while useful for cell design and system optimisation, models of this kind remain inappropriate for implementation in battery management systems themselves.
An alternative approach is based on the principle of equivalent circuit networks (ECNs). Here, a physical system is modelled by a hypothetical circuit designed to display the same properties, where the hypothetical, so-called "equivalent", circuit can be readily computationally resolved. ECNs have been designed with the aim of describing battery behaviour. The elements of these circuits are not based on any underlying principle of the battery's operation but are designed iteratively based on outcomes. However, while these approaches can be relatively quick in computing overall battery cell voltage, they will at best reflect cumulative effects on battery performance without distinguishing the underlying causes of battery degradation.
SUBSTITUTE SHEET RULE 26
ECN models are also typically limited in the frequencies they are able to represent. However, in predicting cell degradation it is desirable to represent both fast electrochemical processes as well as slow diffusion characteristics. Previous approaches have been limited in their ability to manage these. 3 Summary
According to a first aspect of the present disclosure, there is provided a method for determining a characteristic of a battery within a system, comprising:
• defining a model comprising a plurality of equivalent circuit networks and an interface element through which the equivalent circuit networks are coupled;
· monitoring at least one observable parameter of the system; and
• calculating a battery characteristic based on the observable parameter and the model.
The proposed method can operate a plurality of equivalent circuit networks (ECNs) in order to model a battery within a system. It is computationally possible to calculate solutions for the ECNs individually, while the interface element can introduce in the model non-linear effects and other effects which cannot find ready electrical analogs for handling via the ECNs themselves. For example, the interface element may define the charge transfer reaction between the ECNs. In this way, the speed and efficiency of ECN modelling can be harnessed while at the same time enabling an accurate representation of electrochemical processes within the model.
In preferred embodiments, the model comprises at least three ECNs. Typically, at least one ECN represents chemical transport at the battery electrodes, such as diffusion within the electrodes. Furthermore, in the preferred embodiments, at least one ECN represents ionic transport (such as diffusion) between electrodes through the electrolyte in the battery. One or more further ECNs may represent an electrical circuit coupled to a battery cell. Accordingly, three distinct species are defined according to their electrochemical reaction state, metal atoms, metal ions and electrons, prior and post a reduction or oxidation reaction; all of which are associated with distinct transport circuits. These can represent the entire circuit within the system, emulating dynamic battery behaviour. In such preferred embodiments, the interface element is termed a triple species element as it defines the interface between the three species of ECN.
3
SUBSTITUTE SHEET RULE 26
Preferably, each parameter defining the ECNs, and particularly ECNs representing chemical behaviour at battery electrodes and/or ion transport between electrodes, is associated with an underlying physical property of the system.
Preferably, the interface element compensates for charge-transfer overpotential at the reaction sites of each electrode. In particular, the charge-transfer overpotential may comprise one or more of: an activation overpotential, a diffusion overpotential, and a passivating layer overpotential. Activation overpotential is due to the energy barrier for a chemical reaction to take place. Diffusion overpotential is due to mass transport limitations. The passivating layer overpotential is due to irreversible reaction products on the surface of the electrode, potentially consuming active material and increasing resistance to ionic flow. This passivating layer resistance value is locally variable and a function of the local model states, such as for example, but not exclusively, reaction current density, layer thickness and temperature. The layer's capacitive response is accounted for due to this dependence on local side reaction current density.
Double layer overpotential is accounted for, in some preferred embodiments, by a capacitance provided in parallel to the interface element. A double layer overpotential is established due to local polarisation at the interface between electrodes and ionically conducting electrolyte, manifested in the voltage drop across the double layer capacitor. This double layer capacitor value is locally variable and a function of the local model states, such as for example, but not exclusively, concentration, potential and temperature.
In preferred embodiments, the battery characteristic is state of charge (SOC) and state of health (SOH). These characteristics provide clear indications of battery performance.
In preferred embodiments, the battery is a lithium ion battery. The approach presented finds particular applicability for a battery of this type. Alternatively, the battery may be any other type of battery involving Faradaic reactions at an electrode and hence requiring more than two ECNs to be linked by an interface element. In preferred embodiments, the one or more ECNs representing chemical species transport behaviour within a battery electrode comprise an RC ladder. The RC ladder has been shown to be an appropriate representation of diffusion through a porous medium, making
4
SUBSTITUTE SHEET RULE 26
it suitable for the modelling of behaviour in the chemical domain. Diffusion of ions between the electrodes can also be modelled using RC circuits and so in preferred embodiments, ECNs representing ion transport may alternatively or additionally comprise an RC ladder. It can also be appreciated that aspects of the disclosure can be implemented using computer program code. Indeed, according to a further aspect of the present disclosure, there is therefore provided a computer program product comprising computer executable instructions for carrying out the method of the first aspect. The computer program product may be a physical / tangible storage medium. For example, the storage medium may be a Read Only Memory (ROM) or other memory chip. Alternatively, it may be a disk such as a Digital Versatile Disk (DVD-ROM) or other data carrier. It could also be a signal such as an electronic signal over wires, an optical signal or a radio signal such as to a satellite or the like. The disclosure also extends to a processor running the software or code, e.g. a computer configured to carry out the method described above. 4 Brief description of the drawings
Preferred embodiments will be further described with reference to the accompanying drawings, in which:
Figure 1 illustrates a system comprising a battery management system operating according to a preferred embodiment; Figure 2 schematically shows equivalent circuit networks within the model coupled by a triple species element;
Figure 3 shows further details of the circuits of Figure 2; Figure 4 shows an overview of the modelling domains within the battery; Figure 5A illustrates a capacitor electrical equivalent within an equivalent circuit network; Figure 5B illustrates a resistor electrical equivalent within an equivalent circuit network; Figure 6 shows potential variations across three cell domains; Figure 7 illustrates a single particle triple species element implementation; Figure 8 provides a further representative view of elements of the triple species element;
5
SUBSTITUTE SHEET RULE 26
Figure 9 shows exemplary inputs to the model, parameters of the model and outputs of the model;
Figure 10 illustrates thermodynamic potential equations for anode and cathode over their stoichiometric ranges; Figure 11 illustrates a comparison of model predictions of cell voltage compared with experimental data
Figure 12 shows a comparison of predicted cell voltage according to a preferred embodiment in comparison with experimental data;
Figure 13A shows a comparison of the predictions of the time evolution of lithium concentration at an anode according to a preferred embodiment with the alternative COMSOL model;
Figure 13B shows a comparison of the predictions of the time evolution of lithium concentration at a cathode according to a preferred embodiment with the alternative COMSOL model; Figure 14A shows a comparison of the predictions of the time evolution of electrolyte concentration during a discharge pulse according to a preferred embodiment with the alternative COMSOL model;
Figure 14B shows a comparison of the predictions of the time evolution of electrolyte concentration during a charge pulse according to a preferred embodiment with the alternative COMSOL model;
Figure 15 illustrates temperature increase exhibited by the cell during 10C, 5C, 2C and 1 C discharge;
Figure 16 shows various diffusion overpotential contributions during a full 1C discharge;
Figure 17 illustrates an Electrochemical Impedance Spectroscopy analysis; Figure 18 illustrates heat generation associated with the overpotentials during a 1C discharge;
Figure 19 shows a comparison of experimental data of a 2C discharge to simulation results;
Figure 20 shows a comparison with Electrochemical Impedance Spectroscopy analysis for diffusion resistances;
6
SUBSTITUTE SHEET RULE 26
Figure 21 shows a comparison with Electrochemical Impedance Spectroscopy analysis for charge transfer and total resistances;
Figure 22 shows a comparison with Electrochemical Impedance Spectroscopy analysis for passivating layer resistance; Figure 23 shows a comparison of simulation output and experimental data of a constant current - constant voltage charge procedure;
Figure 24 shows a comparison of the ECN cell voltage prediction to COMSOL simulation results; and
Figure 25 illustrates a comparison of ECN model results compared to cell voltage recordings during a test period.
5 Detailed description
Referring to Figure 1 , there is provided an apparatus 10 comprising a battery 12, an operational circuit 14 and a battery management system (BMS) 16. The apparatus 10 may be any electrically-powered apparatus in which a battery is provided. For example, the apparatus may be an electric vehicle. Alternatively, the apparatus 10 may be a portable computing device such as a tablet computer or a smart phone.
The apparatus 10 may be provided with one or more inputs for receiving user commands and may further comprise one or more outputs for conveying information to a user. For example, the apparatus may comprise one or more displays. The information conveyed to the user may contain information about one or more battery characteristics such as state of health (SOH) or state of charge (SOC). The information may further comprise parameters calculated in dependence on such characteristics, such as the anticipated range of an electric vehicle.
In the preferred embodiment shown in Figure 1 , the battery 12 is a lithium-ion battery. The battery 12 may comprise one or more battery cells. Besides electrolyte, each cell may comprise an anode, a cathode and a separator between the anode and cathode which is ionically conducting and electrically insulating. The operational circuit 14 is used to carry out the primary task of the apparatus 10. For example, it may include an electric motor in the case of an electric vehicle or a processing
7
SUBSTITUTE SHEET RULE 26
unit in the case of a portable computing device. Typically, the operational circuit will comprise control circuitry to control the operation of the apparatus 10.
The battery management system (BMS) 16 comprises a processing unit and a memory unit and is provided to allow reporting on battery characteristics. The BMS 16 may further optimise operation of the apparatus to improve battery usage. In particular, the BMS 16 operates to monitor one or more observable parameters and to calculate a battery characteristic based on these parameters and a model of the system. Observable parameters may comprise, for example, battery cell voltage and/or temperature. These parameters may be monitored across a period of time in order to allow parameters of the model to be optimised. Such monitoring may be continuous or discrete.
The model 20 operated by the BMS 16 is illustrated schematically in Figure 2. The model comprises a plurality of equivalent circuit networks (ECNs) 22, 24, 26, each representing the behaviour of a particle species within the system 10. The species are electrons, ions and atoms. In this case, the ions and atoms are Lithium ions and Lithium atoms. Figure 2 illustrates intercalated Lithium ECNs 22, Lithium ion ECN 24 and an electron ECN 26. The intercalated Lithium ECNs 22 represent chemical transport within the electrodes within the battery 12. The Lithium ion ECN 24 represents the diffusion across the electrolyte separating the electrodes within the battery 12. The electron ECN 26 represents electron transport, including that through the operational circuit 14. Triple species elements 28 are provided to couple the ECNs of different species together. The triple species elements 28 mediate the modelled charge and mass transfer between the ECNs, and can account for electrochemical processes not modelled within the ECNs themselves. In particular, the triple species elements 28 impose charge transfer overpotentials. The operation of the model of the preferred embodiment will be described below. Although technically applicable to any electrochemical reaction system where the user wishes to monitor variable states, the battery management system 16 applies a lithium-ion battery model in Simulink/Matlab and predicts cell performance based on first principles. The model can allow for concentration gradients and transport of chemical species obeying charge and mass conservation in electrodes and electrolyte, local variations in internal impedance, electrochemical double layer capacitance, temperature as well as various forms of degradation. All processes are translated into electrical analogies enabling the model to be easily integrated into the BMS of electrical systems comprising
8
SUBSTITUTE SHEET RULE 26
lithium-ion batteries, for example. Further degradation mechanisms can easily be added within the framework of the model.
1. 1 Operating principle
A battery allows the conversion of chemical energy stored by electroactive constituents into electrical energy. The reaction from one electroactive species to another occurs in the vicinity of the interface between the ionically conductive electrolyte and the electronically conductive electrodes.
As a load is connected in-between the terminals the cell discharges, as an oxidation reaction takes place at the anode and a reduction reaction takes place at the cathode; the direction of reactions reverses during charge. In the oxidation reaction an electron is freed and is conducted through the external circuit as it is unable to permeate the electrically insulating separator. The reduction reaction at the cathode (during discharge) results in electrons being absorbed from the external circuit, resulting in the formation of lithium-atoms in the electrode. The oxidation process is formally expressed in Equation 1. The reduction process is formally expressed in Equation 2; n number of each species participate in the two reactions. discharge Equation 1
LinC6 ^ LiC6 + nLi+ + ne~
charge discharge Equation 2
LiM02 + nLi+ + ne~ ( ^ίηΜ02
charge
Figure 3 shows a pseudo-2D schematic of the battery 12 within apparatus 10. The solid electrodes (anode 330 and cathode 340) of the battery 12 are represented by an array of spherical particles 300, spanning the distance between a separator 310 and the current collectors 320 also provided by battery 12. The entire volume between the current collectors 320 is flooded with electrolyte, which allows li-ion transport through the pores of the electrodes 330,340.
The bottom half of Figure 3 illustrates the ECNs of the model within an overall circuit. The top section 350 of the circuit represents the electron transport network in the external circuit (the equivalent circuit network 26 of Figure 2) with ohmic resistances of the current collectors. The electrolyte phase is represented by the section 360 below section 350, which corresponds to ECN 24 of Figure 2 and represents Li-ion transport with resistive
9
SUBSTITUTE SHEET RULE 26
elements representing transport limitations in the ionic flux-direction, and capacitive elements representing local accumulation of ions within a spatial discretisation in the ionic flux- direction.
The circuitry 370 shown at the bottom of Figure 3 corresponds to ECN 22 of Figure 2 and represents the transport of the intercalated lithium atoms inside each solid electrode particle 300, again with resistive elements representing transport limitation to diffusion in the radial direction, and capacitive elements representing local accumulation of ions within discretised shells.
As mentioned in relation to Figure 2, there are therefore three distinct electrical circuits modelled as ECNs: the electrical circuit 350; the lithium-ion transport circuit 360; and the lithium-metal circuit 370. Each interface between these circuits is governed by triple species elements 400 (corresponding to triple species elements 28 of Figure 2). Further possible discretisations within the particle 300 (r-direction) and along the electrode pair domains and separator domain (x-direction) can be incorporated in a similar manner. The equations governing the conservation and transport of each species in a standard electrochemical model can be reformulated in such a way that they can be represented by electrical circuit equivalents.
1.2 Species transport networks
A distinction is made between two domains (electrical and chemical), and the three species networks (Li+ 360, Li-ion 370 and e" 350). The model contains equivalent definitions of flux, energy and power in each of these networks, allowing electrochemical processes to be transformed into the electrical modelling domain. This ultimately allows the comparison of simulation outputs to experimentally measurable quantities.
Intercalated lithium-atoms are present only in the electrode phase, and are therefore represented solely within the chemical domain, while electrons flow in the outside circuit and are therefore modelled in the electrical domain. Lithium-ions are present in the electrolyte phase which is ionically conducting and electrically insulating. This ion transport network is integrated into the electrical modelling domain, enabling the model to balance the amount of Li generated/consumed in each reaction with the amount of electrons participating in the reaction. The link between the three networks is an important feature of this model, coupling information related to the electrical potential of the interacting species due to their electrochemical potential changes during a reaction.
1.3 Electrode domain - Lithium-atom transport
10
SUBSTITUTE SHEET RULE 26
Upon discharge lithium-atoms oxidise (leave) the solid electrode phase of the anode 300 and diffuse through the separator 310 to the cathode 340 (as can be understood with reference to the upper section of Figure 3, for example). In this process, lithium-atoms closer to the reaction location at the electrode surface can oxidise sooner than Li deeper in the electrode bulk. Mass transport limitation to the diffusion of Li atoms through the electrode material 300 towards the surface (anode) and from the surface to the core (cathode) leads to concentration gradients in the radial direction in both electrodes.
This phenomenon is described by Fick's law of diffusion. As species leaves the domain at the particle surface (r = rs) and enters the electrolyte network, an intercalation species flux term jint is applied at that boundary. In the present embodiment, it is assumed that there will be no concentration gradient across the centre of each particle, making this network spherically symmetric within each particle. Equation 3
Equation 4

ln terms of equivalent circuit modelling, an RC ladder has been shown as an appropriate representation of diffusion through a porous medium. In the present embodiment, each electrical analogy retains its physical meaning, hence the values of all resistors and capacitors are functions of fundamental electrochemical parameters.
Figure 4 illustrates the chemical and electrical dimensions of the model. The chemical domain is within each electrode particle 300. The electrolyte 410 is integrated in the electrical domain as the species contained has a charge (Li+), while the current collectors 320 are also in the electrical domain as the species contained also has a charge (e"). Figure 4 also schematically illustrates the double layer/passivating layer at the electrode particle 300 surface.
In the chemical domain the charge on a capacitor corresponds to the molar amount m, of a species, while the potential drop across a capacitor corresponds to the species' normal chemical potential { stored within a particular control volume Vy. The normal chemical potential is formed by an electric potential as a result of the electrode electric field and the chemical potential as a result of species concentration.
11
SUBSTITUTE SHEET RULE 26
To derive the analogous definition of chemical capacitance in [mol2J1] in the chemical domain, the definition of a capacitor is considered, with reference to Figure 5A. Activity a, of species / is proportional to molar content m, by = 7mi(x/)/mre (x/) enabling m, to be substituted for a, in Equation 4 below. Finally, a substitution for molar amount (ml) can be made, using the fact that a species concentration can be expressed as a function of molar content in a volume
Equation 5
 which allows for a general expression of chemical capacitance C as a function of concentration in a control volume.
Equation 6

This methodology is applied to the capacitance in [mol2 J"1] in the electrode lithium-atom transport network, which is in this case in polar coordinates; resulting in the chemical capacitance of a shell-shaped volume at distance η from the particle centre. This equation is valid for transport through both electrodes (i = C6 , M02). The temperature around and inside a particle is considered homogeneous.
Equation 7

Similarly, the expression for the electrical capacitance of discretised electrolyte volum with lithium-ions can be derived in Cartesian coordinates in [F] in the electrical domain.
Equation 7A
The local species concentration variations lead to species fluxes, as discussed before. Diffusion from a high normal electrochemical potential region to a low normal electrochemical potential region can be expressed as

12
SUBSTITUTE SHEET RULE 26
Here, D is a diffusion coefficient (function of temperature). According to Fick's first law, a chemical flux occurs though a chemical resistance, resulting in a loss of normal chemical potential
dx
On, Equation 9

Equating Equation 8 and Equation 9 allows the derivation of a general expression of Rch(x) as the resistance in [J.s mol'2] to lithium-atom flux in the chemical domain inside the electrodes. This analogy is visualised in Figure 5B. For lithium-ion transport in the electrolyte this leads to
Equation 10

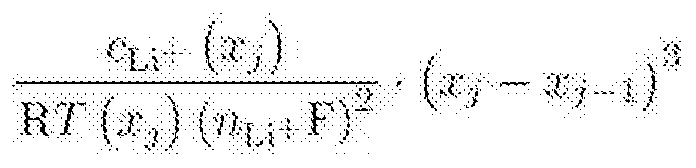
Analogous to the methodology applied for deriving chemical capacitances, the expression can be obtained for resistance in [Ω] to a flux of lithium-ions though electrolyte in the electrical domain and in Cartesian coordinates:
,≠ fT , ∞- (¾) ■ ("u-F)' ,,. ,. , EqUati0n 1 1
1.4 Electrolyte domain - Li-ion and electron transport and conservation
In moving from the electrodes to the electrolyte phase, the chemical modelling domain is connected to the electrical modelling domain. The two domains are linked via a conversion factor of 1/nF, where n is the number of electrons (equal to the number of lithium-ions and that of lithium-atoms) participating in the reaction and F is the Boltzmann constant in [m2 kg s'2 K'1].
The TSE hereby enables the relating of electrochemical quantities to electrical quantities by a conversion factor of 1/nF. Electric potential φ is related to electrochemical potential μ by
Equation 12

Electric current is related to species current (flux) by
13
SUBSTITUTE SHEET RULE 26
Equation 13

Electric resistance is related to resistance to chemical species diffusion by
Equation 14

As lithium atoms are oxidised from the solid electrode phase of each particle and enter the electrolyte 410 they are effectively transformed into a different 'species' as defined in this methodology. This conversion is accounted for by the source/sink term jn connecting the two domains (see Equation 15). As mass and charge have to be conserved it is assumed that the number n of lithium-atoms, lithium-ions and electrons are equal, meaning each lithium-atom yields one lithium-ion and one electron during discharge. Similarly, one lithium-ion and one electron are required to reduce to a lithium-atom during the charge process. This description corresponds to processes taking place at the anode. At the cathode, the reverse processes take place upon charge/discharge.
Similar to species transport inside the electrodes, the region closest to the de-lithiating electrode (represented by the source term) will first increase locally in lithium-ion concentration. Mass transport limitations in ionic diffusion towards the opposite electrode lead to local concentration non-homogeneities and concentration gradients opposite to the direction of ionic flux. In fundamental electrochemistry modelling, Fick's law of diffusion can be modified with a source/sink term in order to capture this phenomenon for lithium- ion transport in the electrolyte.
Equation 15
Equation 16

Again, the resistor-capacitor analogy derived earlier can be applied, herein the direction of diffusion in Cartesian coordinates. The conversion factor of 1/nF between the chemical and the electrical domains is applied to each of the expressions. The resistance representing diffusion limitations to lithium-ion transport and the capacitance of species flux due to the species accumulation in a volume result in their electrical modelling domain expressions. Note the different (electrical domain) units of both expressions.
14
SUBSTITUTE SHEET RULE 26
Equation 17

Other electrical quantities (energy, power etc.) can be related to their corresponding electrochemical quantities, a summary of which is given in Table 1. In the electron network of the present embodiment capacitative or inductive effects are not accounted for; only ohmic resistances of the current collectors. These are simply integrated in the form of ohmic resistors in the network.
Table 1 : Analogy between the electrical and chemical domains

1.5 The triple species element
As mentioned before, the three networks contained in the system are linked, ensuring mass and charge conservation at all times, while converting information from the electrochemical (LT) network into information for the electrical (Li and e") network, and evaluating energy losses in the charge-transfer reaction process. The so called charge transfer overpotential, which represents a reduction of the useful potential provided by the cell, is discussed in the following. In fundamental electrochemistry, electrode kinetics are described by solving the current- overpotential relation (Equation 18) self-consistently. Omitting mass transport (diffusion) limitations represents a common simplification of this relation, leading to what is known as the Butler-Volmer equation. This assumption of negligible effect of mass transport limitations on the reaction current is only valid at low current densities and ceases validity at high currents, where cell response to a load becomes mainly dominated by diffusion limitations. This means models based on the Butler-Volmer description of the charge transfer reaction are inadequate for predictions of cell behaviour under high loads. High currents are particularly important for modern high-performance applications, which is why this proposed model is designed to cater for these applications. The full current-overpotential relation defining charge transfer in a Faradaic reaction is therefore implemented.
15
SUBSTITUTE SHEET RULE 26
Equation 18 iiia

Equation 19
 and the bulk and surface concentrations of reduced species C ed , C^ED and of oxidised species are CQX, CQX are included. Furthermore, the charge transfer overpotential is expressed as = Α Ι + 4Ϊ÷ if Equation 20
It consists of
1. Diffusion overpotential due to lithium-atom diffusion to the reaction site η^η
2. Diffusion overpotential due to lithium-ion diffusion to the reaction site
3. Activation overpotential required for the reaction to occur rf
4. Passivating overpotential specific to the electrode

The voltage drop over a triple species element is the electric potential difference across the electrode/electrolyte interface, and can be expressed in terms of the electrode equilibrium potential E q and the charge transfer overpotential.
-: if* i +ψ Equation 21
 The overall cell potential V at can therefore be expressed as the difference between the electrode potentials less the potential drop due to lithium-ion transport through the electrolyte and the potential losses due to contact resistances in the current collectors. , Equation 22
 with the potential drop across the electrolyte being
16
SUBSTITUTE SHEET RULE 26
Equation 23
The complete system is assembled (as shown in Figure 1 , for example), in this implementation comprising three particles in each electrode and three discretisation elements in the separator. All circuit equations are implemented as derived below. The cathode electrode is shown on the right of the model, the anode electrode is shown on the left, with the separator region in-between. Ohmic contact resistances represent the current loss from ohmic heating caused by electron flow though the positive aluminium and the negative copper electrodes. The electrolyte part of the model is implemented in the electrical domain, which allows an easy comparison of simulation outputs with experimental data, while the electrode lithium-atom transport circuit is integrated in the chemical domain. The model can easily be completely converted to the chemical domain by applying the coupling factor 1/nF for each potential, resistance and capacitance.
In the electrode phase chemical resistances oppose the species flux to or from each shell to the next, including to and from the surface where the reaction takes place. The chemical potential contained in each shell is represented by its chemical capacitance. Similarly, the resistance to species flux in the electrolyte from one electrode to the other though the separator is modelled by resistances, here in the electrical domain, while the potential stored in each discretisation element is represented by a chemical capacitance in the electrical domain. The TSE links the two domains as information from the electrode potential and species flux rate just inside the particle is linked to the electrolyte potential and species flux rate just outside the particle. It is in this element that the conversion rate of 1/nF is applied to link the chemical to the electrical modelling domain. The top edge of each TSE therefore forms the electrical potential experienced by the oxidised species while the bottom end represents the chemical potential of the reduced species. Under non-equilibrium conditions local concentration imbalances lead to re-balancing chemical fluxes through species transport resistances, whereby giving rise to diffusion overpotentials.
As indicated by the schematic of Figure 3, for example, each corner of the TSE is figuratively connected to one of the three species connected to it. While the left-hand side is connected to the electron circuit, the right-hand side is connected to the electrolyte transport system and the double-layer region and the bottom corner is connected to the transport network inside the electrode. Inside each electrode particle, species transport is modelled by an RC ladder network which allows the discretisation of each particle into p shells and a central core.
SUBSTITUTE SHEET RULE 26
Referring to Figure 4, the direction of current flow is indicated for discharge, resulting in concentration gradients and species fluxes in the radial direction, as indicated. In this case lithium-atoms de-lithiate from the negative electrode, as indicated by the chemical flux arrow and lithiate into the cathode, again shown by the flux arrow into the particles of the positive electrode. Information on each electrode's apparent equilibrium potential, and overpotential contribution can be extracted at any time and operating condition in the form of virtual voltmeters. The only positive potential contribution stems from the potential difference between the positive and negative electrode; all other potentials are negative and represent reductions of the useful cell potential. Under equilibrium conditions, there are no concentration gradients within each domain, each electrode potential reduces to its equilibrium, there are no ohmic losses at the current collectors and no ionic losses across the electrolyte. Therefore Equation 22 reduces to the cell open circuit potential. This concept is visualised in Figure 6. i · _ . /. «s _ /.·"■"< Equation 24
These equilibrium potentials, £cathode and Ea^ode of each electrode are a function of the standard reduction/oxidation potential and their stoichiometric state, x„ defined as the ratio of concentration or activity of the intercalated species with the total active species (both reduced and oxidized)
Equation 25
It is furthermore a function of intercalation species interaction energy. The attractive/repulsive forces due to neighbouring lattice site occupants is accounted for by a stoichiometry-dependent attraction energy term ffT^ and a stoichiometry-independent attraction term RTt/j. Equilibrium electrical potential can therefore be expressed for each electrode /'
Equation 26

Figure 7 illustrates the operating principles described above applied at a local level, where the electrode structure is approximated to a pseudo-2D multi-particle system immersed in electrolyte. The relevant terms for one of these particles is shown. The Triple Species
Element (TSE) serves as the link between the electrical and the chemical domains,
18
SUBSTITUTE SHEET RULE 26
connecting the separate transport circuits of electrons, the reduced species (lithium- atoms) in the electrodes and the oxidized species (lithium-ions) in the electrolyte. The information of electrode surface lithium-atom concentration c[u and electrolyte lithium-ion concentration cu l + serve as input to the evaluation of electrochemical potential, charge transfer overpotentials and the resulting electrical potentials. The electrical potentials define the rate of electrochemical species flux and therefore the associated electron flux; useful as a current through the external circuit.
Referring back to Equation 21 , the potential across each TSE can be formulated mathematically, constituting of chemical potential coupled to diffusion overpotentials, activation overpotential and the potential drop due to the presence of the passivating layer. The ECN system is solved self-consistently at any point in time.
The current -voltage relation is affected by the presence of a double layer at the electrode/electrolyte interface, where a higher ion concentration is present, associated with a localised potential drop. The effect of the double layer is mimicked by double layer capacitors arranged in parallel with the charge transfer reaction. The resistance to deplete/replenish each reaction site's double layer is dependent on the local concentration.
The implementation of Equation 21 into the TSEs and the link between the Lf, Li and e" networks can be further understood with reference to Figure 8. As can be seen from Figure 8, for example, a variable double-layer capacitor Cdl is arranged in parallel with the TSE.
The activation overpotential at each electrode /' is obtained as follows
Equation 27

The potential drop due to the double layer at the electrode/electrolyte interface is a function of layer thickness, which in turn is a function of electrolyte lithium concentration c + and applied load.
Equation 28 ,<li ...... λ
19
SUBSTITUTE SHEET RULE 26

The capacitance of the double layer capacitor C is composed of an inner capacitance and an outer capacitance. It is formulated as a function of lithium concentration available in the electrolyte as well as the layer's thickness. According to the Stern-Gouy-Chapman theory, it is calculated as a function of particle size rA, and a thickness Δ. I Equation 30

Equation 31
Equation 32
 The TSE linked to the electrode phase RC-system 370 operates in parallel with the electrical double layer capacitor Cdl and in series with the electrolyte RC-system 360 as shown in Figure 7.
2 Model Extensions
The model as described above is inherently flexible, allowing additional features to be incorporated, through modification of the triple species element and by adding further triple species elements in parallel with the already existing one.
2. 1 Local heat generation
The electrochemical processes inside the cell cause various types of heat generation leading to a local temperature change; in turn affecting various material properties. The temperature dependence of a reaction rate and related physiochemical property Ψ is commonly formulated with an Arrhenius equation.
Equation 34

In this case, each property Ψ operating at temperature (7) in [ ] is a function of its reference value refat its reference temperature (Tref) and of its activation energy E^ct
20
SUBSTITUTE SHEET RULE 26
representing the temperature sensitivity of the property in [J mol"1]. Heat generation in a cell during operation is due to a combination of reaction heat (qr), ohmic heat from ionic transport through the matrix and electrolyte phase ((¾), ohmic heat due to the contact resistance between the electrodes and the respective current collectors (qc) and entropic heating due to phase changes of the electrode matrices during intercalation/de- intercalation, (qe). The latter can also lead to heat absorption, as it is reversible. Conservation of thermal energy in the cell therefore balances heat accumulation, convective dissipation and heat generation.
Equation 35
Equation 36
 where p is the density in [kg m"1], Cp is the heat capacity in [J kg'1 K~1], k is the thermal conductivity in [W m'1 K'1], h is the convective heat transfer coefficient [W m'2 K'1], as is the convective area exposed to the cooling medium in [m2] and Tam is the free stream temperature of the immediate surroundings in [K]. For a cell made of multiple electrode pairs thermal boundaries can be adjusted accordingly.
The electrochemical reaction itself gives rise to a heat term, which is function of the overpotential generated in converting chemical potential into electrical potential.
Equation 37

Ohmic resistance to ionic transport through the electrolyte as well as the diffusion limitations to species transport in the electrodes causes local potential gradients in the electrodes and electrolyte leading to local ohmic heat generation.
Equation 38
 The contact resistance between electrodes and current collectors gives rise to a further heat term, which is applicable only at those locations in the electrode pair.
21
SUBSTITUTE SHEET RULE 26
Equation 39

The phase transition during lithiation and de-lithiation in both electrodes gives rise to a reversible heating term, the entropic heat. It is the only heat term which in itself is a function of temperature.
Equation 40

2.2 Passivating layer growth leading to capacity loss
As described previously, the lithium-ion insertion/de-insertion in the active materials occurs through a surface reaction that takes place at the interface between the graphite and the passivating layer (PL). The total exchange current density can be differentiated in useful electrochemical current and parasitic side-reaction reaction current density occurring at the passivating layer and producing irreversible precipitation adding to the layer.
Equation 41
 where jt [A m"2] denotes the total current density in the electrode and imt stands for the part of current density that takes part in the intercalation process. Due to the proportion of side exchange current density being so small, the dependency on overpotential of the side reaction current density is modelled according to
Equation 42

The side reaction exchange current through the passivating layer gives rise to the passivating layer overpotential
> ≠ Equation 43

22
SUBSTITUTE SHEET RULE 26
The rate of growth of the passivating layer thickness is related to the side-reaction current density, the layer's density and its molar weight.
Equation 44

ώϊ»] ≠ AP) Equation 45 dt c¾F p l The parasitic side reaction renders electroactive material in the interfacial region inactive. As it can no longer participates in the electrochemical shuttle between anode and cathode, it presents a quantifiable capacity loss to the system. The capacity loss is calculated from the total passivating layer side reaction current. Equation 46

6 Examples of implementation
Exemplary embodiments can enable real-time (or faster) performance prediction in modern portable electronics systems and automotive applications using the already existing basic infrastructure of current/voltage measurements only. This can help to quantify state of health and remaining battery capacity. Figure 9 demonstrates the ease of adaptation of the model according to the above-described principle. The inputs in Figure 9 represent the observable parameters of the system which can be monitored. Of the outputs shown in Figure 9, the bold system variables denote the sole two states commonly monitored on a battery management system in previous approaches. The other outputs represent characteristics of the battery among those which can be calculated using the approach described herein. The wealth of additional information relating to the electrochemical state to be obtained using preferred embodiments is shown, given some commonly available material/geometry characteristics of the cell in
23
SUBSTITUTE SHEET RULE 26
question. This allows the observer to make accurate SOC and state of health predictions, as well as monitor thermal conditions in order to prevent or mitigate thermal runaway while in operation. The model allows easy modifications by control engineers, BMS designers and vehicle system platform engineers without costly experimental work and macroscopic analysis. For battery materials commonly used by the automotive and portable electronics industry the parameters required tend to be easily available in the academic literature.
7 Results
The pseudo 2D equivalent circuit analogy model of the lithium-ion battery described above was implemented in Matlab/Simulink and compared to solutions provided by a multiphysics modelling solution of Doyle, Newman et al in COMSOL Multiphysics (currently regarded as state-of-the-art in high-fidelity modelling) and to experimental data (described for example in "Modeling of Galvanostatic Charge and Discharge of the Lithium/Polymer/lnsertion Cell", Marc Doyle, Journal of the Electrochemical Society, 140(6): 1526, June 1993 and "Comparison of Modeling Predictions with Experimental Data from Plastic Lithium Ion Cells", Marc Doyle, Journal of the Electrochemical Society, 143(6): 1890, June 1996). Different operating regimes were investigated: charge/discharge under constant current (CC), transient regimes and relaxation under pulse load and a real-world load cycle in a vehicle application.
The cell evaluated in this study was a commercial LiNiMnCoO-graphite pouch cell SLPB 11043140H (4.8 Ah) by Dow Kokam. The C/10, 1C, 2C and 10C discharges were conducted in a thermally controlled environment at room temperature using a potentiostat (HCP/1005 Bio-Logic) with a 100 A booster. The procedure before each experimental discharge was a charge up to 4.2 V (SOC=100%) with a constant current of 1 C, followed by a Constant Voltage charge until the charge current reached C/20, and by a rest period of two hours.
In the COMSOL 4.3b implementation, the simulation solver is based on the finite element method with each domain discretised at the same coordinate values as the preferred embodiment (ECN) and the Newman model implementation. Both the ECN simulation and the COMSOL evaluation were run on the same machine with an Intel (R) core i5- 3317CPU and 8.00GB Ram.
24
SUBSTITUTE SHEET RULE 26
The example parameter values of the real cell are also common to both simulations and are listed in Table 2. The thermodynamic potential as a function of the anode stoichiometry was obtained from the literature, whereas the equation for the cathode was calculated as the difference of an OCV measurement (conducted at C/20 on the same cell) and the anode thermodynamic potential (Figure 10). Alternatively, the equations above can be used for the equilibrium potential of each electrode.
25
SUBSTITUTE SHEET RULE 26
Symbol Unit Negative Negative Separator Positive Positive current electrode electrode current collector collector
Design Specifications
Particle radius [7] Γρ,ια m
1 .00e-6 1 .00e-6
Active material fraction [8] - - 0.58 0.55 0.50 -
Conductive filler volume fraction [8] f - - 0.33 0.55 0.33 -
Electrolyte volume fraction [8] fLi+ - - 0.04 - 0.06 -
Maximum electrode lithium-atom concentration [3] Cl_i/,max mol m"3 - 16.10 - 23.9 -
Stoichiometry at 0% SOC [7] Xo% - - 0.126 - 0.978 -
Stoichiometry at 100% SOC [7] - - 0.676 - 0.393 -
Equilibrium electrolyte concentration [6] mol m"3 - 1 .20e3 1 .20e3 1 .20e3 -
Kinetic and transport properties
Charge-transfer coefficient [6] - - 0.5 - 0.5 -
Passivating layer resistance (initial) [9] A* Qm"2 - 1 e-4 - 1 e-5 -
Passivating layer ionic conductivity [1 ] S m"1 - 5e-6 - 5e-6 -
Passivating layer molar mass [1] NP kg mol"1 - 0.162 - 0.162 -
Passivating layer density [1] i
P kg m"3 - 1690 - 1690 -
Electrode diffusion coefficient Li/ [4] Due mV - 4.0Θ-14 - 8.0Θ-18 -
Electrode electronic conductivity of the bulk [7] Out Sm"1 - 100 1 .3 10 -
Bruggeman porosity exponent [7] Brugg - - 1 .5 1 .5 1 .5 -
Electrolyte diffusion coefficient [4] Di_i+ mV1 - 1 .7Θ-10 1 .7Θ-10 1 .7Θ-10 -
Electrolyte activity coefficient [4] f± - - 1 .0 1 .0 1 .0 -
Li+ transference number [7] ¾ - - 0.363 0.363 0.363 -
Exchange current density activation energy [6] Jmol"1 - 3E4 - 3E4 -
Solid phase diffusion activation energy [6] Jmol"1 - 4e3 - 2e4 -
Electrolyte phase activation energy [6] ¾,t. Jmol"1 - 1 e4 1 e4 1 e4 -
Electrolyte conductivity activation energy [6]
¾> Jmol"1 - 2e4 2e4 2e4 -
Geometric parameters
Domain thickness [7] δ m 1 .2e-5 40e-6 20.32e-6 29.12e-6 2.1 e-:
Electrode plate area [7] A m2 1 .0452
Area specific current collector resistance [5] Rc Urn2 1 e-3 1 e-3 x-direction length of cell (measurements) m 0.140
z-direction length of cell (measurements) m 0.041
Thermal parameters
Thermal conductivity [2] kt WrrfV 398 1 .04 0.334 1 .58 238
Density [2] P kgm"3 8440 1347 1009 2329 2610
Heat capacity [2] Jkg' "1 385 1438 1979 1269 904
Table 2: Battery Simulation Parameters
26
SUBSTITUTE SHEET RULE 26
2.3 Constant charge/discharge
ECN simulation predictions according to the preferred embodiment versus experimental discharges at C/4, 0.5C, 1C, 5C, 10C and 20C and charges at 0.5C, 1C and 2C can be seen in Figure 1 1 , for a controlled temperature procedure. The simulation results match the experimental results to within 5.2% over the entire SOC range from 20C discharge to 2C charge. The deviations occur predominantly at the highest tested discharge C-rate (20C discharge (5.2% error) and 2C charge (2.6%)), which can be attributed to an overestimation of heat dissipation away from the cell in the model.
2.4 Temperature increase during constant charge The temperature increase exhibited by the cell during the 10C, 5C, 2C and 1 C discharge of the procedure described above is shown in Figure 15 with model prediction shown for comparison. All data traces exhibit non-linear temperature increases which are partly due to entropic heat contributions as well as the non-linear increase of charge transfer resistances, as will be shown later. 2.5 Overpotential contributions during discharge
The various diffusion overpotential contributions during a full 1 C discharge are shown in Figure 16. It can be seen that the diffusion overpotential contributions become dominant at low SoC. This is in line with the sudden major increase in internal impedance observed at low states of charge, as noted in an Electrochemical Impedance Spectroscopy (EIS) analysis (Figure 17).
2.6 Heat generation contributions during discharge
The heat generation associated with the overpotentials during a 1 C discharge are shown in Figure 18.
2.7 Chemical phase transitions during discharge Changes in chemical phases of the electrode materials can be detected as an abrupt change in heat generation over a cell potential range. In this technique a galvanostatic charge/discharge is performed while measuring cell temperature and voltage. In Figure 19 experimental data of a 2C discharge is compared to simulation results.
2.8 Impedance Spectroscopy Electrochemical Impedance Spectroscopy testing of a cell allows the parametrisation of simple equivalent circuits with elements representing lumped electrochemical processes.
27
SUBSTITUTE SHEET RULE 26
(Figure 17). The fitted circuit parameters are compared to simulation outputs; the results of which are shown in Figures 20-22 at the example outputs of diffusion resistances, charge transfer resistance, passivating layer resistance and total resistance for a full 1 C discharge. 2.9 Open circuit potential relaxation
Simulation output and experimental data of a constant current - constant voltage charge procedure is compared in Figure 23. Upon 1C charge to 4.2V (100% SOC) the relaxation period of 760s was simulated until the charge current reduced to less than 0.01 C.
2. 10 Cell voltage analysis under pulse load Figure 12 shows a comparison between experimental data, the cell voltage predictions of the ECN model of the preferred embodiment with a COMSOL model for a charge/discharge pulse test procedure pulse of 170s duration: a 5C discharge (20s) is followed by an open-circuit relaxation period (90s), a 5C charge (20s) and an open-circuit relaxation period (30s). The results of the ECN and COMSOL can be seen to be in relatively good agreement with the experimental data.
Both the ECN and the COMSOL simulation were run isothermally, and the underestimations of 13.06mV during the discharge pulse and 10.35mV underestimation during the charge pulse are ascribed to the lack of the electrochemical double-layer in the COMSOL model. Ensuring the same spatial and time discretisation, the simulation run- time for the COMSOL model is 62.34s, while for the ECN it is 4.45s.
The ability to predict lithium concentration and distribution through the system under application of the pulse regime (Figure 12) is demonstrated in Figures 13A and 13B in a 3- particle anode 3-particle cathode setup. Lithium concentration evens out upon load removal due to diffusion and that fact that the inner regions replenish the surface regions in both anode (Figure 13A) and cathode (Figure 13B). Although localised concentration inside the cell cannot be experimentally measured one can test their accuracy by their effect on cell performance. For example, the model predicts well the minimum resting period for the cell to reach equilibrium conditions upon load-removal.
Employing the same pulse test (Figure 12) and discretisation, lithium concentrations in the electrolyte were investigating and compared to results obtained from COMSOL; shown in Figures 14A and 14B. During the 5C discharge pulse lithium concentration deviation by 2.75mol/m3 from the COMSOL prediction, cathode concentration predictions by 2.59mol/m3 and separator by 5A2mol/m3. Similarly, during the charge pulse lithium
28
SUBSTITUTE SHEET RULE 26
concentration deviations of 3.82mol/m3 (anode), 1.52mo//m3 (cathode) and 6.35mol/m3 (separator) were found. When compared to the initial (equilibrium) conditions of 1200mo//m3 these are very small, representing less than 0.5% error.
4.5 Pulse charge/discharge procedure at various SOC The same pulse procedure (Figure 10) was applied to a 4.8 Ah Kokam battery cell at various SOC levels (80%, 65%, 50%, 35% and 20% SOC); with the aim to compare the accuracy of the model predictions for dynamic inputs over the whole range of SOCs. The experimental voltage response and the ECN simulation results are presented in Figure 17.
The errors were largest at high SOC and low SOC: a maximum difference of 4.62mV between the experimental data and the ECN predictions was found for the highest SOC pulse procedure (80% SOC) and a 1 1.44mV difference was found for the lowest SOC pulse procedure (20% SOC). These errors can be attributed to inaccuracies in the values of stoichiometry at 100% SOC and 0% SOC in anode and cathode (Table 2). Slight variations of θ- ί00%, θ+ ί00%, θ- 0%, θ+ 0%, result in significantly different thermodynamic potentials at both extremes of SOC (see Figure 1 1). In principle, the initial values of stoichiometry depend on cycling and storage history of the cell; an effect known as 'stoichiometric drift', which we will be exploring in further work and can be incorporated in the ECN model.
4.5 New European Drive Cycle application
To demonstrate its capabilities at an increased level of load complexity, the ECN model of the preferred embodiment was subjected to the Northern European Driving Cycle (NEDC), scaled to an example load-cycle for a single electrode pair cell.
Using the vehicle parameters and vehicle simulation employed by Srbik et al in "The 2012 RAC future car challenge: the impact of hybridisation on energy consumption", Hybrid and Electric Vehicles Conference 2013 (HEVC 2013), pages 8.1-8.1 , Institution of Engineering and Technology 2013; the NEDC was chosen due to its popularity in industry. In Figure 24 the ECN cell voltage prediction is compared to COMSOL simulation results. Both simulations were run with the same discretisation and initial conditions. The largest deviation from the COMSOL results occurred at the highest C-rate event at 1 115.1 s (51.5mV difference, 1.29% error) with an error of less than 0.1 % at all other times.
29
SUBSTITUTE SHEET RULE 26
4.6 Real-world drive cycle application
To demonstrate a real-world application, test data (current, voltage, time) was collected from a vehicle participating in the Future Car Challenge in 2012. Of this, a 25 minute (Figure 25) extract was used as input to the ECN model and the results compared to the cell voltage recordings made during the run. The vehicle in this case was a PHEV with relatively low C-rates. The cell measurements (·) were recorded from the BMS via the vehicle CAN (Controller Area Network) bus at discrete time steps (0.1s). The cell in the vehicle is integrated in a pack and likely subject to unequal loading and cell balancing, while only the current/voltage at the pack connectors is conventionally measured for range estimation. Knowledge of the pack configuration allowed scaling of load and cell response to a single cell. Information about cell imbalances, internal resistance variations and individual cell load balancing by the BMS is, however, not available. Assuming these are not dominant effects in the brand-new battery pack of this test vehicle under investigation, the error between test data and ECN results is attributed mostly to wire shielding (errors in current/voltage recordings of the test data) and temperature impact, possibly from neighbouring cells (error in simulation results). Those errors (average 2.35% - 91.65mV) were found to occur in the most aggressive 5% of discharge events whilst all remaining events were found to deviate by less than 0.12% from the collected data.
Conclusion/Further Potential for Model Variation
Variations and modifications will be apparent to the skilled person. Such variations and modifications may involve equivalent and other features which are already known and which may be used instead of, or in addition to, features described herein. Features that are described in the context of separate embodiments may be provided in combination in a single embodiment. Conversely, features which are described in the context of a single embodiment may be also provided separately or in any suitable sub-combination.
30
SUBSTITUTE SHEET RULE 26
Claims
1. A method for determining a characteristic of a battery within an apparatus, comprising: defining a model comprising a plurality of equivalent circuit networks and an interface element through which the equivalent circuit networks are coupled; monitoring at least one observable parameter of the apparatus; and calculating a battery characteristic based on the observable parameter and the model.
2. A method according to claim 1 , wherein the interface element defines a charge transfer reaction between equivalent circuit networks.
3. A method according to either claim 1 or claim 2, wherein the model comprises at least three ECNs.
4. A method according to any one of the preceding claims, wherein at least one ECN represents chemical transport at a battery electrode.
5. A method according to any one of the preceding claims, wherein at least one ECN represents ionic transport between electrodes in the battery.
6. A method according to any one of the preceding claims, wherein one or more ECNs represent an electrical circuit coupled to a battery cell.
7. A method according to any one of the preceding claims, comprising a plurality of different species of ECN, wherein different species of ECN are coupled through the interface element.
8. A method according to any one of the preceding claims, wherein the interface element compensates for charge transfer overpotential within the battery.
9. A method according to claim 8, wherein the charge-transfer overpotential may comprise one or more of: an activation overpotential, a concentration overpotential, a passivating layer overpotential and a double layer overpotential.
10. A method according to any one of the preceding claims, wherein at least one ECN comprises an RC ladder.
11. A method according to claim 10, wherein an ECN representing ion transport and/or and ECN representing chemical behaviour at an electrode of the battery comprises an RC ladder.
12. A method according to any one of the preceding claims, wherein the battery characteristic is state of charge (SOC) or state of health (SOH).
13. A method according to any one of the preceding claims, wherein the battery is a lithium ion battery.
14. A computer program product comprising computer executable instructions for carrying out the method of any one of the preceding claims.
15. A method according to any one of the preceding claims, wherein a battery characteristic which cannot be measured but is predicted by the model is used in a control algorithm to improve performance or extend life.
Applications Claiming Priority (2)
| Application Number | Priority Date | Filing Date | Title |
|---|---|---|---|
| GB1505211.1 | 2015-03-26 | ||
| GBGB1505211.1A GB201505211D0 (en) | 2015-03-26 | 2015-03-26 | Triple species element |
Publications (1)
| Publication Number | Publication Date |
|---|---|
| WO2016151336A1 true WO2016151336A1 (en) | 2016-09-29 |
Family
ID=53178166
Family Applications (1)
| Application Number | Title | Priority Date | Filing Date |
|---|---|---|---|
| PCT/GB2016/050852 Ceased WO2016151336A1 (en) | 2015-03-26 | 2016-03-24 | Battery model comprising plurality of equivalent circuit networks and interface element coupling them |
Country Status (2)
| Country | Link |
|---|---|
| GB (1) | GB201505211D0 (en) |
| WO (1) | WO2016151336A1 (en) |
Cited By (10)
| Publication number | Priority date | Publication date | Assignee | Title |
|---|---|---|---|---|
| WO2020149288A1 (en) * | 2019-01-15 | 2020-07-23 | ゴイク電池株式会社 | Soh/soc detecting device for power storage element, and power storage element managing unit |
| JP2020112535A (en) * | 2019-01-15 | 2020-07-27 | ゴイク電池株式会社 | Device for detecting degree of deterioration and energy accumulation remaining amount of power storage element |
| US11480616B2 (en) | 2020-10-02 | 2022-10-25 | Univerza V Ljubljani | Computer-implemented method and data processing system for modelling and/or simulating and/or emulating a battery |
| CN115470742A (en) * | 2022-10-31 | 2022-12-13 | 中南大学 | Lithium-ion battery modeling method, system, device and storage medium |
| US11568102B2 (en) * | 2019-11-27 | 2023-01-31 | Toyota Motor Engineering & Manufacturing North America, Inc. | Systems and methods for optimizing battery designs in multiple dimensions |
| CN115667962A (en) * | 2020-05-11 | 2023-01-31 | 矽致微有限公司 | Battery charging state estimation device and method based on coulomb counter |
| WO2023148506A1 (en) * | 2022-02-07 | 2023-08-10 | Breathe Battery Technologies Limited | Intelligent battery management system and method |
| US11728549B2 (en) | 2019-11-27 | 2023-08-15 | Toyota Motor Engineering & Manufacturing North America, Inc. | Battery design in multiple dimensions |
| US12051932B2 (en) | 2020-11-10 | 2024-07-30 | Tata Consultancy Services Limited | Method and system for optimizing operation of battery pack of an electric vehicle |
| DE102024123502A1 (en) * | 2024-06-21 | 2025-12-24 | GM Global Technology Operations LLC | BATTERY MONITORING OF ANODES, CATHODES AND SEPARATORS |
Families Citing this family (1)
| Publication number | Priority date | Publication date | Assignee | Title |
|---|---|---|---|---|
| CN115389940B (en) * | 2022-08-05 | 2025-01-21 | 重庆长安新能源汽车科技有限公司 | Method for predicting internal resistance of power battery, method, system and storage medium for predicting power |
Citations (5)
| Publication number | Priority date | Publication date | Assignee | Title |
|---|---|---|---|---|
| EP0987555A2 (en) * | 1998-09-18 | 2000-03-22 | Matsushita Electric Industrial Co., Ltd. | Method of measuring quantities indicating state of electrochemical device and apparatus for the same |
| US20020120906A1 (en) * | 2000-07-17 | 2002-08-29 | Lei Xia | Behavioral modeling and analysis of galvanic devices |
| US20060145702A1 (en) * | 2003-01-20 | 2006-07-06 | Eberhard Schoch | Method and device for determining the charge that can be drawn from an energy accumulator |
| US20080054848A1 (en) * | 2006-08-29 | 2008-03-06 | Samsung Sdi Co., Ltd. | Battery management system and method of driving the same |
| US20090096459A1 (en) * | 2007-10-12 | 2009-04-16 | Fujitsu Limited | Method of measuring characteristics regarding safety of battery |
-
2015
- 2015-03-26 GB GBGB1505211.1A patent/GB201505211D0/en not_active Ceased
-
2016
- 2016-03-24 WO PCT/GB2016/050852 patent/WO2016151336A1/en not_active Ceased
Patent Citations (5)
| Publication number | Priority date | Publication date | Assignee | Title |
|---|---|---|---|---|
| EP0987555A2 (en) * | 1998-09-18 | 2000-03-22 | Matsushita Electric Industrial Co., Ltd. | Method of measuring quantities indicating state of electrochemical device and apparatus for the same |
| US20020120906A1 (en) * | 2000-07-17 | 2002-08-29 | Lei Xia | Behavioral modeling and analysis of galvanic devices |
| US20060145702A1 (en) * | 2003-01-20 | 2006-07-06 | Eberhard Schoch | Method and device for determining the charge that can be drawn from an energy accumulator |
| US20080054848A1 (en) * | 2006-08-29 | 2008-03-06 | Samsung Sdi Co., Ltd. | Battery management system and method of driving the same |
| US20090096459A1 (en) * | 2007-10-12 | 2009-04-16 | Fujitsu Limited | Method of measuring characteristics regarding safety of battery |
Cited By (11)
| Publication number | Priority date | Publication date | Assignee | Title |
|---|---|---|---|---|
| WO2020149288A1 (en) * | 2019-01-15 | 2020-07-23 | ゴイク電池株式会社 | Soh/soc detecting device for power storage element, and power storage element managing unit |
| JP2020112535A (en) * | 2019-01-15 | 2020-07-27 | ゴイク電池株式会社 | Device for detecting degree of deterioration and energy accumulation remaining amount of power storage element |
| US11568102B2 (en) * | 2019-11-27 | 2023-01-31 | Toyota Motor Engineering & Manufacturing North America, Inc. | Systems and methods for optimizing battery designs in multiple dimensions |
| US11728549B2 (en) | 2019-11-27 | 2023-08-15 | Toyota Motor Engineering & Manufacturing North America, Inc. | Battery design in multiple dimensions |
| CN115667962A (en) * | 2020-05-11 | 2023-01-31 | 矽致微有限公司 | Battery charging state estimation device and method based on coulomb counter |
| US11480616B2 (en) | 2020-10-02 | 2022-10-25 | Univerza V Ljubljani | Computer-implemented method and data processing system for modelling and/or simulating and/or emulating a battery |
| US12051932B2 (en) | 2020-11-10 | 2024-07-30 | Tata Consultancy Services Limited | Method and system for optimizing operation of battery pack of an electric vehicle |
| WO2023148506A1 (en) * | 2022-02-07 | 2023-08-10 | Breathe Battery Technologies Limited | Intelligent battery management system and method |
| CN115470742A (en) * | 2022-10-31 | 2022-12-13 | 中南大学 | Lithium-ion battery modeling method, system, device and storage medium |
| CN115470742B (en) * | 2022-10-31 | 2023-03-14 | 中南大学 | Lithium ion battery modeling method, system, equipment and storage medium |
| DE102024123502A1 (en) * | 2024-06-21 | 2025-12-24 | GM Global Technology Operations LLC | BATTERY MONITORING OF ANODES, CATHODES AND SEPARATORS |
Also Published As
| Publication number | Publication date |
|---|---|
| GB201505211D0 (en) | 2015-05-13 |
Similar Documents
| Publication | Publication Date | Title |
|---|---|---|
| WO2016151336A1 (en) | Battery model comprising plurality of equivalent circuit networks and interface element coupling them | |
| Torchio et al. | Lionsimba: a matlab framework based on a finite volume model suitable for li-ion battery design, simulation, and control | |
| EP3812778B1 (en) | Method and apparatus with battery state estimation | |
| US10302704B2 (en) | Method and battery system predicting state of charge of a battery | |
| EP3961232B1 (en) | Method and apparatus for battery state estimation | |
| Bizeray et al. | Lithium-ion battery thermal-electrochemical model-based state estimation using orthogonal collocation and a modified extended Kalman filter | |
| US10539621B2 (en) | Method and apparatus for identifying a battery model | |
| CN108604713B (en) | Secondary battery pack management system | |
| Cugnet et al. | A mathematical model for the simulation of new and aged automotive lead-acid batteries | |
| JP2019512858A (en) | Battery management system with multiple observers | |
| Arunachalam et al. | Full homogenized macroscale model and pseudo-2-dimensional model for lithium-ion battery dynamics: comparative analysis, experimental verification and sensitivity analysis | |
| KR101282687B1 (en) | Method for estimating battery SOC of vehicle | |
| JP2014522548A (en) | Optimized method for thermal management of electrochemical storage equipment | |
| CN109946622A (en) | A kind of the lithium deposition prediction technique and device of lithium ion battery | |
| Zhang et al. | Real-time estimation of negative electrode potential and state of charge of lithium-ion battery based on a half-cell-level equivalent circuit model | |
| Zhang et al. | An electrochemical aging-informed data-driven approach for health estimation of lithium-ion batteries with parameter inconsistency | |
| Pande et al. | Electrical models for EV’s batteries: an overview and mathematical design of RC network | |
| CN116068408B (en) | Battery aging data determination method, device, computer equipment and storage medium | |
| Parmananda et al. | Underpinnings of Multiscale Interactions and Heterogeneities in Li‐Ion Batteries: Electrode Microstructure to Cell Format | |
| Kashkooli et al. | Effect of convective mass transfer on lead-acid battery performance | |
| Vaghela et al. | Analysis of State‐of‐Health Estimation Approaches and Constraints for Lithium‐Ion Batteries in Electric Vehicles | |
| Xu et al. | Parameter identification and sensitivity analysis for zero-dimensional physics-based lithium-sulfur battery models | |
| Priimägi et al. | Thermal simulations of polymer electrolyte 3D Li-microbatteries | |
| Darcovich et al. | Coupled numerical approach for automotive battery pack lifetime estimates with thermal management | |
| EP4106134A1 (en) | Method and device with charging control |
Legal Events
| Date | Code | Title | Description |
|---|---|---|---|
| 121 | Ep: the epo has been informed by wipo that ep was designated in this application |
Ref document number: 16713044 Country of ref document: EP Kind code of ref document: A1 |
|
| NENP | Non-entry into the national phase |
Ref country code: DE |
|
| 122 | Ep: pct application non-entry in european phase |
Ref document number: 16713044 Country of ref document: EP Kind code of ref document: A1 |