WO2016143062A1 - Sequence data analyzer, dna analysis system and sequence data analysis method - Google Patents
Sequence data analyzer, dna analysis system and sequence data analysis method Download PDFInfo
- Publication number
- WO2016143062A1 WO2016143062A1 PCT/JP2015/056964 JP2015056964W WO2016143062A1 WO 2016143062 A1 WO2016143062 A1 WO 2016143062A1 JP 2015056964 W JP2015056964 W JP 2015056964W WO 2016143062 A1 WO2016143062 A1 WO 2016143062A1
- Authority
- WO
- WIPO (PCT)
- Prior art keywords
- data
- data analysis
- sequence
- analysis apparatus
- sample
- Prior art date
Links
Images


Classifications
-
- G—PHYSICS
- G16—INFORMATION AND COMMUNICATION TECHNOLOGY [ICT] SPECIALLY ADAPTED FOR SPECIFIC APPLICATION FIELDS
- G16B—BIOINFORMATICS, i.e. INFORMATION AND COMMUNICATION TECHNOLOGY [ICT] SPECIALLY ADAPTED FOR GENETIC OR PROTEIN-RELATED DATA PROCESSING IN COMPUTATIONAL MOLECULAR BIOLOGY
- G16B30/00—ICT specially adapted for sequence analysis involving nucleotides or amino acids
Landscapes
- Physics & Mathematics (AREA)
- Life Sciences & Earth Sciences (AREA)
- Chemical & Material Sciences (AREA)
- Analytical Chemistry (AREA)
- Biophysics (AREA)
- Proteomics, Peptides & Aminoacids (AREA)
- Health & Medical Sciences (AREA)
- Engineering & Computer Science (AREA)
- Bioinformatics & Cheminformatics (AREA)
- Bioinformatics & Computational Biology (AREA)
- Biotechnology (AREA)
- Evolutionary Biology (AREA)
- General Health & Medical Sciences (AREA)
- Medical Informatics (AREA)
- Spectroscopy & Molecular Physics (AREA)
- Theoretical Computer Science (AREA)
- Measuring Or Testing Involving Enzymes Or Micro-Organisms (AREA)
- Apparatus Associated With Microorganisms And Enzymes (AREA)
Abstract
In the present invention, a sample DNA is analyzed by mapping read sequences, said read sequences being obtained from sequencing data, on two-dimensional genome reference coordinates wherein genome reference coordinates are two-dimensionally arranged.
Description
本発明は、配列データ解析装置、DNA解析システムおよび配列データ解析方法に関する。
The present invention relates to a sequence data analysis apparatus, a DNA analysis system, and a sequence data analysis method.
ゲノムDNA(deoxyribonucleic acid)は、その塩基配列がDNA全体ですでにシーケンシングされ(読み取られ)、その塩基文字列はインターネット上のサーバなどに公開されている。研究者は、そのゲノムDNAをお手本(参照データ)として、シーケンサ装置が読み取った被験者のサンプルDNA断片の塩基位置と照合(ゲノムマッピング)することにより、サンプルDNA断片内の変異を検出する。変異とは、例えば一塩基多型(SNP:Single Nucleotide Polymorphism)や構造変異(SA:Structural Alteration)などのゲノムDNAの塩基文字列とサンプルDNA断片の塩基文字列との相違箇所である。なお、サンプルDNA断片は、1本のサンプルDNAがシーケンサ装置内のフラグメント処理により多数に断片化され複製されたものである。
Genomic DNA (deoxyribonucleic acid) has its base sequence already sequenced (read) throughout the DNA, and its base character string is made public on servers on the Internet. The researcher detects a mutation in the sample DNA fragment by using the genomic DNA as a model (reference data) and collating (genome mapping) with the base position of the sample DNA fragment of the subject read by the sequencer device. The mutation is, for example, a difference between a base character string of genomic DNA such as a single nucleotide polymorphism (SNP: Single Nucleotide Polymorphism) or a structural mutation (SA) and a base character string of a sample DNA fragment. The sample DNA fragment is obtained by fragmenting and replicating one sample DNA into a large number by fragment processing in the sequencer apparatus.
癌患者の腫瘍組織の細胞のDNAには、遺伝的に継承したのではないSAが後天的に生じることが多い。それらのSAが病状の進行や治療薬の効き方などに関わりがあることは一般によく知られている。
In many cases, SA, which is not inherited genetically, is acquired in the DNA of cells of tumor tissue of cancer patients. It is generally well known that these SAs are related to the progression of disease states and the effectiveness of therapeutic agents.
SAでは、ゲノム上の離れた位置で分断されたDNAが繋ぎ合わされる(融合される)。この分断された位置をブレークポイント(BP:Break Point)とよぶ。断片化されたサンプルDNAから、分断と融合の全貌を再現することは不可能である。そのため、シーケンスされた大量の配列データを解析することによって、間接的にBPを検出することが広く行われている。
In SA, DNA fragmented at distant positions on the genome is joined (fused). This divided position is called a break point (BP). It is impossible to reproduce the entire picture of fragmentation and fusion from fragmented sample DNA. Therefore, it is widely performed to indirectly detect BP by analyzing a large amount of sequenced sequence data.
シーケンサ装置では、サンプルDNA断片の全体を塩基文字列化する代わりに、1本のサンプルDNA断片の両端からそれぞれほぼ一定の長さ(サンプルDNA断片の一部だけ)を読み取った2本の(ペアの)リード配列を扱うペアドエンド(PE)法が用いられる。一般に、PE法では、サンプルDNA断片の中央部に、どちらのペアのリード配列にも属さない、シーケンシング対象外の区間が存在する。
In the sequencer device, instead of converting the entire sample DNA fragment into a base character string, two (pairs) of a substantially constant length (only part of the sample DNA fragment) are read from both ends of one sample DNA fragment. The paired end (PE) method is used to handle the read sequence. In general, in the PE method, there is a non-sequencing section that does not belong to either pair of read sequences at the center of a sample DNA fragment.
一般に、PE法で読み取られたペアのリード配列を、参照ゲノム上にマッピングすると、サンプルDNAの断片の長さに相当する距離だけ離れた位置に、互いに内向きに向かうような条件でマッピングされる。このようなペアを整合ペアとよぶ。
In general, when a pair of read sequences read by the PE method is mapped onto a reference genome, they are mapped to a position that is separated by a distance corresponding to the length of a sample DNA fragment under such a condition that they are directed inward from each other. . Such a pair is called a matched pair.
これに対して、サンプルDNA断片の中央部にBPが含まれている場合は、ペアのリード配列に対する参照ゲノム上のマッピング位置は、そのような条件を満たさない。このようなペアを不整合ペア(DP:Discordant Pair)とよぶ。
On the other hand, when BP is included in the center of the sample DNA fragment, the mapping position on the reference genome with respect to the paired read sequence does not satisfy such a condition. Such a pair is called a mismatched pair (DP: Discordant Pair).
大量のマッピングデータの中から不整合ペアを選び出して解析することにより、BPの大体の位置を決めることができる(例えば非特許文献1を参照)。その誤差は、サンプルDNA断片の長さ程度である。
By selecting and analyzing inconsistent pairs from a large amount of mapping data, the approximate position of the BP can be determined (for example, see Non-Patent Document 1). The error is about the length of the sample DNA fragment.
また、リード配列の内部にBPが含まれている場合は、リード配列を全長にわたってゲノムマッピングすることは不可能となる。このとき、リード配列の一部だけをゲノムマッピングして、残りの部分を別の場所にゲノムマッピングできることがある。このようなリードをスプリットリード(SR:Split Read)とよぶ。SRは、頻度が少なく、検出が難しい。SRが見つかれば、BPの位置を正確に決めることができるが(例えば非特許文献2を参照)、それは偶然の一致が原因で生じた誤検出である可能性も高い。また、SRを見つけること自体が難しいため、SRを利用してBPの位置を正確に決める方法の感度は低い。
In addition, when BP is included in the read sequence, it is impossible to perform genome mapping of the read sequence over the entire length. At this time, only a part of the lead sequence may be genome-mapped, and the remaining part may be genome-mapped to another location. Such a read is called a split read (SR). SR is infrequent and difficult to detect. If the SR is found, the position of the BP can be accurately determined (see, for example, Non-Patent Document 2), but it is highly possible that the detection is a false detection caused by a coincidence. In addition, since it is difficult to find the SR itself, the sensitivity of the method for accurately determining the position of the BP using the SR is low.
公知の技術として、一方の軸に参照ゲノム座標を取り、他方の軸にcDNA(complementary DNA)の配列座標を取って、cDNAのマッピング結果を2次元表示してエクソン・イントロン構造を可視化する技術が知られている(例えば特許文献1を参照)。また、一方の軸に、あるバクテリアのゲノム座標をとり、他方の軸に、別の種類のバクテリアのゲノム座標を取り、それらバクテリアのゲノム配列どうしの相同性を2次元にプロットして、相同性領域を可視化する技術が知られている(例えば非特許文献3を参照)。
As a known technique, a reference genome coordinate is taken on one axis, a sequence coordinate of cDNA (complementary DNA) is taken on the other axis, and the exon-intron structure is visualized by displaying the cDNA mapping result two-dimensionally. It is known (see, for example, Patent Document 1). In addition, the genome coordinates of a certain bacterium are taken on one axis, the genome coordinates of another kind of bacterium are taken on the other axis, and the homology between these bacterial genome sequences is plotted in two dimensions. A technique for visualizing a region is known (see, for example, Non-Patent Document 3).
ところが、いずれの公知の技術にも、「ゲノム参照座標を2次元に配置した2次元ゲノム参照座標にシーケンシングデータから得られるリード配列をマッピングして試料DNAを解析することにより、未知の事象の発生位置を推定する」という技術思想は記載されていない。
However, in any known technique, the analysis of the sample DNA by mapping the read sequence obtained from the sequencing data to the two-dimensional genome reference coordinates in which the genome reference coordinates are two-dimensionally arranged is performed. The technical idea of “estimating the occurrence position” is not described.
上記解題を解決する発明の代表例として、ゲノム参照座標を2次元に配置した2次元ゲノム参照座標にシーケンシングデータから得られるリード配列をマッピングして試料DNAを解析する手法を提案する。
As a representative example of the invention for solving the above problem, a method is proposed in which sample DNA is analyzed by mapping a read sequence obtained from sequencing data to a two-dimensional genome reference coordinate in which genome reference coordinates are arranged in two dimensions.
本発明によれば、例えばブレークポイントBPの発生位置(存在領域)を高感度に推定することできる。前述した以外の課題、構成及び効果は、以下の実施の形態の説明により明らかにされる。
According to the present invention, for example, the occurrence position (existing region) of the breakpoint BP can be estimated with high sensitivity. Problems, configurations, and effects other than those described above will become apparent from the following description of embodiments.
以下、図面に基づいて、本発明の実施の形態を説明する。なお、本発明の実施の態様は、後述する実施例に限定されるものではなく、その技術思想の範囲において、種々の変形が可能である。
Hereinafter, embodiments of the present invention will be described with reference to the drawings. The embodiment of the present invention is not limited to the examples described later, and various modifications are possible within the scope of the technical idea.
[実施例1]
(1)全体構成
図1に、実施例1に係るDNA解析システムの全体構成を示す。配列データ解析装置1は、通常の計算機の構成を有するサーバ等のコンピュータによって実現される。 [Example 1]
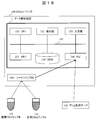
(1) Overall Configuration FIG. 1 shows the overall configuration of the DNA analysis system according to Example 1. The arraydata analysis apparatus 1 is realized by a computer such as a server having a normal computer configuration.
(1)全体構成
図1に、実施例1に係るDNA解析システムの全体構成を示す。配列データ解析装置1は、通常の計算機の構成を有するサーバ等のコンピュータによって実現される。 [Example 1]
(1) Overall Configuration FIG. 1 shows the overall configuration of the DNA analysis system according to Example 1. The array
配列データ解析装置1は、中央処理部(CPU:Central Processing Unit)101、プログラムなどを記憶するメモリ102、操作のためのGUI(Graphical User Interface)や解析結果などを表示する表示部103、全マッピングデータ(図2の212)や配列辞書(図2の腫瘍サンプルリード配列辞書222、正常サンプル配列辞書223)などを記憶するハードディスクドライブ(HDD)104、パラメータの入力などに用いるキーボード等の入力部105、ネットワークインタフェース(NIF)106がバス107に接続された構成を備えている。
The sequence data analyzing apparatus 1 includes a central processing unit (CPU: Central Processing Unit) 101, a memory 102 for storing programs, a display unit 103 for displaying GUI (Graphical User Interface) for operation and analysis results, all mappings, and the like. A hard disk drive (HDD) 104 for storing data (212 in FIG. 2) and a sequence dictionary (tumor sample lead sequence dictionary 222, normal sample sequence dictionary 223 in FIG. 2) and the like, and an input unit 105 such as a keyboard used for parameter input A network interface (NIF) 106 is connected to a bus 107.
配列データ解析装置1は、ネットワークインタフェース(NIF)106が接続するLAN(Local Area Network)やインターネット等を通じて外部装置と接続する。HDD104に記憶される配列辞書は、配列データ解析装置1に外部接続された記憶装置に記憶してもよいし、ネットワークを介して接続されたデータセンタなどに記憶してもよい。以下で説明する各種の処理は、CPU101によるプログラムの実行を通じて実現される。図1の場合、NIF106には、ゲノム配列サーバ108とDNAシーケンサ109がネットワークを介して接続されている。
The sequence data analysis device 1 is connected to an external device through a LAN (Local Area Network) connected to the network interface (NIF) 106 or the Internet. The array dictionary stored in the HDD 104 may be stored in a storage device externally connected to the array data analyzing apparatus 1, or may be stored in a data center connected via a network. Various processes described below are realized through execution of programs by the CPU 101. In the case of FIG. 1, a genome sequence server 108 and a DNA sequencer 109 are connected to the NIF 106 via a network.
DNAシーケンサ109は、患者の腫瘍組織と正常組織から抽出された腫瘍DNAサンプル110と正常DNAサンプル111のそれぞれから、各サンプルに含まれるサンプルDNA断片の両端(5’末側のリード配列と、3’末側のリード配列)のペアをシーケンシングし(読み取り)、その結果を配列データ解析装置1に提供する。リード配列(塩基配列)の表記法として、5’末側の塩基文字を左側に記載し、3’末側の塩基文字を右側に記載する方法が一般的であるため、以下では、5’末側を「左方」とし、3’末側を「右方」とする。
The DNA sequencer 109 detects both ends of the sample DNA fragment contained in each sample from the tumor DNA sample 110 and the normal DNA sample 111 extracted from the tumor tissue and normal tissue of the patient (the 5 ′ terminal lead sequence and 3 The pair ('read-side read sequence) is sequenced (read), and the result is provided to the sequence data analyzer 1. The notation of the lead sequence (base sequence) is generally a method in which the base character at the 5 ′ end is written on the left side, and the base character at the 3 ′ end side is written on the right side. The side is “left” and the 3 ′ end is “right”.
DNAシーケンサ109は、超並列型(いわゆる次世代型)DNAシーケンサとして構成され、多数の(例えば、1億本の)サンプルDNA断片を並列にシーケンシングすることができる。ここで、左方配列および右方配列の長さは、例えば100塩基程度であり、サンプルDNA断片が1,000塩基程度であるとすると、中央の800塩基程度は左方配列にも右方配列にも含まれないシーケンシング対象外の箇所である。同様に、ゲノム配列サーバ108は、ゲノムDNAをシーケンシングした結果であるゲノム配列を、配列データ解析装置1に提供する。
The DNA sequencer 109 is configured as a massively parallel (so-called next generation) DNA sequencer, and can sequence a large number (for example, 100 million pieces) of sample DNA fragments in parallel. Here, when the length of the left sequence and the right sequence is, for example, about 100 bases, and the sample DNA fragment is about 1,000 bases, the center sequence of about 800 bases is not limited to the left sequence and the right sequence. This is a part that is not included in Sequencing. Similarly, the genome sequence server 108 provides the sequence data analysis apparatus 1 with a genome sequence that is a result of sequencing the genomic DNA.
(2)配列データ解析装置内のデータの流れ
図2に、配列データ解析装置1内のデータの流れを示す。配列データ解析装置1は、参照ゲノム配列データ201をゲノム配列サーバ108から受け付けると共に、腫瘍サンプルリード配列データ202と正常サンプルリード配列データ203をDNAシーケンサ109から受け付ける。参照ゲノム配列データ201は、ゲノムマッピング処理部211とクラスタ評価部235に与えられる。腫瘍サンプルリード配列データ202と正常サンプルリード配列データ203は、いずれもゲノムマッピング処理部211とリード配列辞書作成部221に与えられる。 (2) Data Flow in Sequence Data Analysis Device FIG. 2 shows the data flow in the sequencedata analysis device 1. The sequence data analysis apparatus 1 accepts reference genome sequence data 201 from the genome sequence server 108 and accepts tumor sample lead sequence data 202 and normal sample lead sequence data 203 from the DNA sequencer 109. The reference genome sequence data 201 is given to the genome mapping processing unit 211 and the cluster evaluation unit 235. Both the tumor sample lead sequence data 202 and the normal sample lead sequence data 203 are given to the genome mapping processing unit 211 and the lead sequence dictionary creation unit 221.
図2に、配列データ解析装置1内のデータの流れを示す。配列データ解析装置1は、参照ゲノム配列データ201をゲノム配列サーバ108から受け付けると共に、腫瘍サンプルリード配列データ202と正常サンプルリード配列データ203をDNAシーケンサ109から受け付ける。参照ゲノム配列データ201は、ゲノムマッピング処理部211とクラスタ評価部235に与えられる。腫瘍サンプルリード配列データ202と正常サンプルリード配列データ203は、いずれもゲノムマッピング処理部211とリード配列辞書作成部221に与えられる。 (2) Data Flow in Sequence Data Analysis Device FIG. 2 shows the data flow in the sequence
ゲノムマッピング処理部211は、腫瘍サンプルリード配列データ202と正常サンプルリード配列データ203に含まれる全てのペアドエンドのリード配列に対して、参照ゲノム配列データ201上へのマッピング処理を行い、全マッピングデータ212を作成する。DP抽出部231は、全マッピングデータ212の中から不整合ペア(DP)の条件を満たすものを選び出し、DPの2次元プロットデータ232を作成する。クラスタリング処理部233は、2次元プロットデータ232のクラスタリングを行い、2次元クラスタデータ234を作成する。クラスタ評価部235は、2次元クラスタデータ234に含まれる各クラスタを評価し、腫瘍特異的なBPが存在すると推定されるクラスタを選び出し、参照ゲノム配列データ201を参照して、そのBPが存在する領域の配列データ(BP存在領域配列データ)236を生成する。
The genome mapping processing unit 211 performs a mapping process on the reference genome sequence data 201 for all the paired-end read sequences included in the tumor sample lead sequence data 202 and the normal sample read sequence data 203 to obtain all mapping data 212. Create The DP extraction unit 231 selects one that satisfies the condition of the inconsistent pair (DP) from all the mapping data 212 and creates DP two-dimensional plot data 232. The clustering processing unit 233 performs clustering of the two-dimensional plot data 232 and creates two-dimensional cluster data 234. The cluster evaluation unit 235 evaluates each cluster included in the two-dimensional cluster data 234, selects a cluster that is presumed to have a tumor-specific BP, refers to the reference genome sequence data 201, and exists that BP. Area array data (BP existence area array data) 236 is generated.
リード配列辞書作成部221は、腫瘍サンプルリード配列データ202と正常サンプルリード配列データ203の各々を読み込んで、腫瘍サンプルリード配列辞書222と正常サンプル配列辞書223を作成する。最小不一致率計算部241は、BP存在領域配列データ236内の配列をクエリーとして、腫瘍サンプルリード配列辞書222と正常サンプル配列辞書223内を検索し、腫瘍サンプル不一致率データ242と正常サンプル不一致率データ243を作成する。BP位置推定部244は、腫瘍サンプル不一致率データ242と正常サンプル不一致率データ243を解析してBPの位置を推定し、BP位置推定結果245を出力する。2次元プロット表示出力部251は、BPの推定に用いたクラスタの情報を、2次元クラスタデータ234から取り出して表示出力する。不一致率プロット表示出力部252は、BPの位置の推定に用いた腫瘍サンプル不一致率データ242と正常サンプル不一致率データ243を表示出力する。これらの表示出力は、推定結果の妥当性をユーザに目視確認して貰うためである。
The lead sequence dictionary creation unit 221 reads the tumor sample lead sequence data 202 and the normal sample lead sequence data 203, and creates a tumor sample lead sequence dictionary 222 and a normal sample sequence dictionary 223. The minimum mismatch rate calculation unit 241 searches the tumor sample lead sequence dictionary 222 and the normal sample sequence dictionary 223 using the sequence in the BP existing region sequence data 236 as a query, and the tumor sample mismatch rate data 242 and the normal sample mismatch rate data. Create 243. The BP position estimation unit 244 analyzes the tumor sample mismatch rate data 242 and the normal sample mismatch rate data 243, estimates the position of the BP, and outputs a BP position estimation result 245. The two-dimensional plot display output unit 251 takes out the cluster information used for BP estimation from the two-dimensional cluster data 234 and displays and outputs it. The mismatch rate plot display output unit 252 displays and outputs the tumor sample mismatch rate data 242 and the normal sample mismatch rate data 243 used for estimating the position of the BP. These display outputs are used to visually confirm the validity of the estimation result to the user.
(3)配列データ解析処理の内容
以下、図3を参照し、配列データ解析装置1がBPを検出して、その正確な位置を求めるために実行する処理内容を詳細に説明する。なお、後述する各処理は、中央処理部101によるプログラムの実行を通じて実現される。 (3) Details of Sequence Data Analysis Processing Hereinafter, with reference to FIG. 3, details of processing executed by the sequencedata analysis apparatus 1 to detect BP and determine its exact position will be described in detail. Each process described later is realized through execution of a program by the central processing unit 101.
以下、図3を参照し、配列データ解析装置1がBPを検出して、その正確な位置を求めるために実行する処理内容を詳細に説明する。なお、後述する各処理は、中央処理部101によるプログラムの実行を通じて実現される。 (3) Details of Sequence Data Analysis Processing Hereinafter, with reference to FIG. 3, details of processing executed by the sequence
(パラメータ入力処理301)
この処理では、後述するp0, m0, m1, d, L, σ,k, r, s, e等のパラメータが、入力部105を通じて中央処理部101に入力される。 (Parameter input processing 301)
In this processing, parameters such as p0, m0, m1, d, L, σ, k, r, s, and e described later are input to thecentral processing unit 101 through the input unit 105.
この処理では、後述するp0, m0, m1, d, L, σ,k, r, s, e等のパラメータが、入力部105を通じて中央処理部101に入力される。 (Parameter input processing 301)
In this processing, parameters such as p0, m0, m1, d, L, σ, k, r, s, and e described later are input to the
(配列データ入力処理302)
この処理では、参照ゲノム配列データ201が、ゲノム配列サーバ108から中央処理部101に入力される。また、腫瘍サンプルリード配列データ202と正常サンプルリード配列データ203が、DNAシーケンサ109から中央処理部101に入力される。 (Sequence data input processing 302)
In this process, referencegenome sequence data 201 is input from the genome sequence server 108 to the central processing unit 101. Tumor sample lead sequence data 202 and normal sample lead sequence data 203 are input from the DNA sequencer 109 to the central processing unit 101.
この処理では、参照ゲノム配列データ201が、ゲノム配列サーバ108から中央処理部101に入力される。また、腫瘍サンプルリード配列データ202と正常サンプルリード配列データ203が、DNAシーケンサ109から中央処理部101に入力される。 (Sequence data input processing 302)
In this process, reference
(配列辞書作成処理303)
この処理では、リード配列辞書作成部221が、腫瘍サンプルリード配列データ202と正常サンプルリード配列データ203を読み込み、腫瘍サンプルリード配列辞書222と正常サンプルリード配列辞書223を作成する。リード配列辞書とは、全てのリード配列の全ての接尾辞(suffix)をアルファベット順にソートしたものと等価なデータ構造であって、例えば「Li H. and Durbin R. Fast and accurate short read alignment with Burrows-Wheeler Transform. Bioinformatics, 25:1754-60 (2009)」(以下、「先行技術1」という。)に記載のBW変換(Burrows-Wheeler Transform)を用いて効率的に実装したものである。 (Sequence dictionary creation process 303)
In this process, the lead sequence dictionary creation unit 221 reads the tumor samplelead sequence data 202 and the normal sample lead sequence data 203, and creates the tumor sample lead sequence dictionary 222 and the normal sample lead sequence dictionary 223. The read sequence dictionary is a data structure equivalent to an alphabetical order of all suffixes of all read sequences. For example, “Li H. and Durbin R. Fast and accurate short read alignment with Burrows” -Wheeler Transform. Bioinformatics, 25: 1754-60 (2009) "(hereinafter referred to as" Prior Art 1 ").
この処理では、リード配列辞書作成部221が、腫瘍サンプルリード配列データ202と正常サンプルリード配列データ203を読み込み、腫瘍サンプルリード配列辞書222と正常サンプルリード配列辞書223を作成する。リード配列辞書とは、全てのリード配列の全ての接尾辞(suffix)をアルファベット順にソートしたものと等価なデータ構造であって、例えば「Li H. and Durbin R. Fast and accurate short read alignment with Burrows-Wheeler Transform. Bioinformatics, 25:1754-60 (2009)」(以下、「先行技術1」という。)に記載のBW変換(Burrows-Wheeler Transform)を用いて効率的に実装したものである。 (Sequence dictionary creation process 303)
In this process, the lead sequence dictionary creation unit 221 reads the tumor sample
図4を用いて、リード配列辞書について説明する。リスト401には、リード配列辞書が表現している全てのリード配列の全ての接尾辞がアルファベット順にソートされ、縦方向に並べられている。各行がリード配列の接尾辞に対応している。リード配列辞書を用いれば、任意のi(402)に対してソート順位がi番目となる(リード配列の)接尾辞403を効率的に求めることができる(先行技術1)。ここで、0≦i<Nとし、Nは全てのリード配列の全ての接尾辞の総数とし、ソート順位は0番から数えるものとする。Nの値は、リード配列データに含まれる総塩基数とリード配列本数の和に等しい。また、任意に与えられた塩基文字列w(404)に対して、S(w)(405)とT(w)(406)は、wで始まる接尾辞のソート順位の最小値と最大値+1と表す。特にwが空文字列εであるときは、S(ε)=0,T(ε)=Nとなる。
The lead sequence dictionary will be described with reference to FIG. In the list 401, all suffixes of all the lead arrays expressed by the lead array dictionary are sorted in alphabetical order and arranged in the vertical direction. Each row corresponds to the suffix of the lead sequence. If the read sequence dictionary is used, it is possible to efficiently obtain the suffix 403 (in the read sequence) having the i-th sort order for any i (402) (prior art 1). Here, it is assumed that 0 ≦ i <N, N is the total number of all suffixes of all read arrays, and the sort order is counted from 0th. The value of N is equal to the sum of the total number of bases included in the read sequence data and the number of read sequences. Also, for an arbitrarily given base character string w (404), S (w) (405) and T (w) (406) are the minimum and maximum values of the suffix sort order starting with w + 1. It expresses. In particular, when w is an empty character string ε, S (ε) = 0 and T (ε) = N.
ここで、ある文字列wに対してS(w)とT(w)が与えられれば、任意の塩基文字n=A,C,G,Tに対してS(nw)とT(nw)を効率的に求めることができる(先行技術1)。従って、w=εから開始して、wを1文字ずつ左方に延長しながらこの計算を繰り返すことにより、任意に与えられた文字列wに対して、wで始まる接尾辞のソート順位の範囲、S(w)とT(w)、を効率的に求めることができる。なお、wで始まる接尾辞が存在しないときは、S(w)=T(w)となる。
Here, if S (w) and T (w) are given for a certain character string w, S (nw) and T (nw) are set for any base character n = A, C, G, T. It can be obtained efficiently (prior art 1). Therefore, starting from w = ε and repeating this calculation while extending w to the left by one character, the range of the suffix sort order starting with w for any given string w , S (w) and T (w) can be obtained efficiently. When there is no suffix starting with w, S (w) = T (w).
(ゲノムマッピング処理311)
この処理では、ゲノムマッピング処理部211が、腫瘍サンプルリード配列データ202と正常サンプルリード配列データ203に含まれる全てのペアドエンドのリード配列に対して、参照ゲノム配列データ201上へのマッピング処理を行い、全マッピングデータ212を作成する。マッピング処理は、既知の方法、例えば、先行技術1に記載の方法を用いて行う。 (Genome mapping process 311)
In this processing, the genome mapping processing unit 211 performs mapping processing on the referencegenome sequence data 201 for all paired-end read sequences included in the tumor sample lead sequence data 202 and the normal sample lead sequence data 203, All mapping data 212 is created. The mapping process is performed using a known method, for example, the method described in Prior Art 1.
この処理では、ゲノムマッピング処理部211が、腫瘍サンプルリード配列データ202と正常サンプルリード配列データ203に含まれる全てのペアドエンドのリード配列に対して、参照ゲノム配列データ201上へのマッピング処理を行い、全マッピングデータ212を作成する。マッピング処理は、既知の方法、例えば、先行技術1に記載の方法を用いて行う。 (Genome mapping process 311)
In this processing, the genome mapping processing unit 211 performs mapping processing on the reference
(DP抽出処理312)
この処理では、DP抽出部231により、全マッピングデータ212の中から不整合の条件を満たすもの(DP)を選び出す。不整合の判定法は、図5を用いて説明する。図5は、全マッピングデータのデータ形式を説明するための説明図である。各行はリード配列のペアに対応し、そのペアを識別するためのID、そのペアが腫瘍(Tumor)サンプル、正常(Normal)サンプルのどちらに由来するかを示すソース情報(TまたはN)、5’末側と3‘末側のマッピング位置情報、整合的か否かの判定結果(YesまたはNo)からなる。リードの末端のマッピング位置情報は、染色体名、リード末端の染色体内での塩基位置座標、及びマッピングの向き(+または-)からなる。 (DP extraction process 312)
In this process, the DP extraction unit 231 selects (DP) that satisfies the inconsistency condition from all themapping data 212. A method for determining inconsistency will be described with reference to FIG. FIG. 5 is an explanatory diagram for explaining the data format of all mapping data. Each row corresponds to a pair of read sequences, an ID for identifying the pair, source information (T or N) indicating whether the pair is derived from a tumor sample or a normal sample, 5 Consists of mapping position information of “end side and 3” end, and determination result (Yes or No) of consistency. The mapping information on the end of the lead consists of the chromosome name, the base position coordinates in the chromosome at the lead end, and the mapping direction (+ or-).
この処理では、DP抽出部231により、全マッピングデータ212の中から不整合の条件を満たすもの(DP)を選び出す。不整合の判定法は、図5を用いて説明する。図5は、全マッピングデータのデータ形式を説明するための説明図である。各行はリード配列のペアに対応し、そのペアを識別するためのID、そのペアが腫瘍(Tumor)サンプル、正常(Normal)サンプルのどちらに由来するかを示すソース情報(TまたはN)、5’末側と3‘末側のマッピング位置情報、整合的か否かの判定結果(YesまたはNo)からなる。リードの末端のマッピング位置情報は、染色体名、リード末端の染色体内での塩基位置座標、及びマッピングの向き(+または-)からなる。 (DP extraction process 312)
In this process, the DP extraction unit 231 selects (DP) that satisfies the inconsistency condition from all the
ペアのマッピング結果が整合的であるか否かは、次のように判定する。5’末側と3’末側のマッピング位置情報を、(cL, x, sL)および(cR, y, sR)とする。ここで、cL,cRは染色体名、x,yは塩基位置座標、sL,sRは向き(+または-)である。cLとcRが異なるか、または、sLとsRが一致するときは、直ちにNo(不整合的)と判定する。また、x<yかつsL=“-”かつsR=“+”、または、x>yかつsL=“+”かつsR=“-”のときもNo(不整合的)と判定する。それ以外の場合は、xとyの差の絶対値を計算し、その値がL±3σの範囲に収まればYes(整合的)、そうでなければNo(不整合的)と判定する。ここで、Lとσは、それぞれ、サンプルDNA断片の平均長と標準偏差を表すパラメータである。このように、DP抽出処理312では、全マッピングデータ212の中から整合的と判定されたペアも選び出される。
Whether or not the pair mapping result is consistent is determined as follows. The mapping position information on the 5 ′ end side and the 3 ′ end side is (cL, x, sL) and (cR, y, sR). Here, cL and cR are chromosome names, x and y are base position coordinates, and sL and sR are directions (+ or-). When cL and cR are different or sL and sR match, it is immediately determined No (inconsistent). In addition, when x <y and sL = “−” and sR = “+”, or x> y, sL = “+”, and sR = “−”, it is also determined as No (inconsistent). In other cases, the absolute value of the difference between x and y is calculated, and if the value falls within the range of L ± 3σ, it is determined as Yes (consistent), otherwise it is determined as No (inconsistent). Here, L and σ are parameters representing the average length and standard deviation of the sample DNA fragment, respectively. In this way, in the DP extraction process 312, a pair determined to be consistent is selected from all the mapping data 212.
(2次元プロット処理313)
図6を用い、DPに対する2次元プロット処理313を説明する。601と602は、DPの5’末端と3’末端のマッピング位置座標を表すためのゲノム座標である。ここで、ゲノム座標とは、全染色体を1本に繋いだ配列(ゲノム配列)上の塩基位置座標である。今、あるDPの5’末端L1(603)と3’末端R1(604)のゲノム座標がそれぞれx1(605)、y1(606)であるとする。このとき、x1<y1であれば、DPに座標平面上の点(x1,y1)を対応させ(623)、x1≧y1であればDPに座標平面上の点(y1,x1)を対応させる。x1とy1の大小関係により対応のさせ方を変えた理由は、同じDNA断片を逆向きに読んだときの結果を一致させるためである。621と622は座標平面のx軸とy軸であり、DPの各々の端点のゲノム座標を示す。座標平面上のこれらの点623の位置座標は、2次元プロットデータ232に一時保存される。 (2D plot processing 313)
The two-dimensional plot process 313 for DP will be described with reference to FIG. Reference numerals 601 and 602 denote genome coordinates for representing the mapping position coordinates of the 5 ′ end and 3 ′ end of the DP. Here, the genome coordinates are base position coordinates on a sequence (genome sequence) connecting all chromosomes into one. Now, assume that the genomic coordinates of the 5 ′ end L1 (603) and 3 ′ end R1 (604) of a DP are x1 (605) and y1 (606), respectively. At this time, if x1 <y1, the point (x1, y1) on the coordinate plane is made to correspond to DP (623), and if x1 ≧ y1, the point (y1, x1) on the coordinate plane is made to correspond to DP. . The reason for changing the correspondence depending on the magnitude relationship between x1 and y1 is to match the results when reading the same DNA fragment in the opposite direction. Reference numerals 621 and 622 denote the x-axis and y-axis of the coordinate plane, and indicate the genome coordinates of each end point of DP. The position coordinates of these points 623 on the coordinate plane are temporarily stored in the two-dimensional plot data 232.
図6を用い、DPに対する2次元プロット処理313を説明する。601と602は、DPの5’末端と3’末端のマッピング位置座標を表すためのゲノム座標である。ここで、ゲノム座標とは、全染色体を1本に繋いだ配列(ゲノム配列)上の塩基位置座標である。今、あるDPの5’末端L1(603)と3’末端R1(604)のゲノム座標がそれぞれx1(605)、y1(606)であるとする。このとき、x1<y1であれば、DPに座標平面上の点(x1,y1)を対応させ(623)、x1≧y1であればDPに座標平面上の点(y1,x1)を対応させる。x1とy1の大小関係により対応のさせ方を変えた理由は、同じDNA断片を逆向きに読んだときの結果を一致させるためである。621と622は座標平面のx軸とy軸であり、DPの各々の端点のゲノム座標を示す。座標平面上のこれらの点623の位置座標は、2次元プロットデータ232に一時保存される。 (2D plot processing 313)
The two-
サンプルDNA断片の長さはほぼLに等しい(±3σ)ため、座標平面上にプロットしたこれらの点は斜め45度の方向に伸びた帯状領域内に並ぶ。BPの一方の側でゲノムの反転が生じている場合(即ち、図5で5‘末側と3’末側の向きが一致する場合)は、DPは右下がりの45度で並び、そうでない場合は、右上がりの45度で並ぶ。このようなプロット図を、図3のフローチャートの「クラスタCの2次元プロット出力」ステップ342で表示出力することにより、ユーザはBPの存在を示す証拠となるDPが多数ある状況を確認することができる。
Since the length of the sample DNA fragment is almost equal to L (± 3σ), these points plotted on the coordinate plane are arranged in a band-like region extending in the direction of 45 degrees obliquely. When genome inversion occurs on one side of the BP (ie, when the orientation of the 5 ′ end and the 3 ′ end coincides in FIG. 5), the DPs are aligned at 45 degrees to the right, otherwise If it is, line up at 45 degrees. By displaying such a plot diagram in the “two-dimensional plot output of cluster C” step 342 in the flowchart of FIG. 3, the user can confirm a situation in which there are many DPs as evidence indicating the existence of BP. it can.
(2次元クラスタリング処理314)
図7は、2次元クラスタリング処理314で実行される処理動作の詳細を示す。まず、クラスタリング処理部233が2次元プロットデータ232を入力し(701)、全ての点をy軸上に射影して(702)、互いに距離L以上離れたクラスタY(1),Y(2),…に分類する(703)。ここで、LはサンプルDNA断片の平均長を表すパラメータである。各クラスタY(j)に対して、以下の繰り返し処理を行う(711,712,713)。クラスタY(j)上に射影される全ての点をx軸上に射影して(722)、互いに距離L以上離れたクラスタX(1,j),X(2,j),…に分類する(723)。各クラスタX(i,j)に対して、以下の繰り返し処理を行う(731,732,733)。X(i,j) 上に射影される全ての点の集合をクラスタC(i,j)として出力する(741)。これにより2次元クラスタデータ234を得る。 (Two-dimensional clustering process 314)
FIG. 7 shows details of processing operations executed in the two-dimensional clustering processing 314. First, the clustering processing unit 233 inputs the two-dimensional plot data 232 (701), projects all points on the y-axis (702), and clusters Y (1), Y (2) separated from each other by a distance L or more. ,... (703). Here, L is a parameter representing the average length of the sample DNA fragment. The following iterative process is performed for each cluster Y (j) (711, 712, 713). All points projected onto the cluster Y (j) are projected onto the x-axis (722) and classified into clusters X (1, j), X (2, j),. (723). The following repetitive processing is performed for each cluster X (i, j) (731,732,733). The set of all points projected onto X (i, j) is output as cluster C (i, j) (741). As a result, two-dimensional cluster data 234 is obtained.
図7は、2次元クラスタリング処理314で実行される処理動作の詳細を示す。まず、クラスタリング処理部233が2次元プロットデータ232を入力し(701)、全ての点をy軸上に射影して(702)、互いに距離L以上離れたクラスタY(1),Y(2),…に分類する(703)。ここで、LはサンプルDNA断片の平均長を表すパラメータである。各クラスタY(j)に対して、以下の繰り返し処理を行う(711,712,713)。クラスタY(j)上に射影される全ての点をx軸上に射影して(722)、互いに距離L以上離れたクラスタX(1,j),X(2,j),…に分類する(723)。各クラスタX(i,j)に対して、以下の繰り返し処理を行う(731,732,733)。X(i,j) 上に射影される全ての点の集合をクラスタC(i,j)として出力する(741)。これにより2次元クラスタデータ234を得る。 (Two-dimensional clustering process 314)
FIG. 7 shows details of processing operations executed in the two-
図8は、2次元クラスタリング処理314の方法を説明するための補助的説明図である。621と622はDPの端点のゲノム座標を表す座標平面のx軸とy軸である。全てのDPに対応する点623はy軸622上の点801に射影される。y軸622上に射影されたこれらの点801の全体は、距離L以上離れたクラスタY(1),Y(2),…(802)に分類される。
FIG. 8 is an auxiliary explanatory diagram for explaining the method of the two-dimensional clustering process 314. Reference numerals 621 and 622 denote the x-axis and y-axis of the coordinate plane representing the genome coordinates of the DP endpoints. A point 623 corresponding to all DPs is projected to a point 801 on the y-axis 622. All of these points 801 projected on the y-axis 622 are classified into clusters Y (1), Y (2),.
クラスタY(j)(802)に射影される点623は、x軸621上の点811に射影される。x軸621上に射影されたこれらの点811の全体は、距離L以上離れたクラスタX(1,j),X(2,j),…(812)に分類される。クラスタX(i,j)(812)に射影される点623の全体はクラスタC(i,j)(623)として出力される。
The point 623 projected onto the cluster Y (j) (802) is projected onto the point 811 on the x-axis 621. The whole of these points 811 projected on the x-axis 621 is classified into clusters X (1, j), X (2, j),. The entire point 623 projected onto the cluster X (i, j) (812) is output as the cluster C (i, j) (623).
(次のクラスタCの有無の判定処理321)
この処理では、各クラスタC=C(i,j)に対して以下の処理が実行され、全てのクラスタに対する処理が完了したとき全処理を終了する。まず、あるクラスタCに含まれる点の数を数え、それがs未満であれば次のクラスタの処理に進む。ここで、sは最小のクラスタサイズを指定するパラメータである(322)。また、クラスタCに含まれる点に対応するDPが腫瘍サンプル、正常サンプルのどちらに由来するかを調べ、腫瘍サンプル由来のものの割合がr未満であれば次のクラスタの処理に進む(323)。ここで、rは腫瘍特異性の程度を表すパラメータで1以下の正の数である。また、図6で説明したようにプロットした点が斜め45度に並ぶような分布が、BPに因らずに偶然生じる確率pを計算し(324)、その値が指定されたパラメータp0以上であれば次のクラスタの処理に進む(325)。 (Next cluster C existence determination process 321)
In this processing, the following processing is executed for each cluster C = C (i, j), and when processing for all clusters is completed, all processing is terminated. First, the number of points included in a certain cluster C is counted, and if it is less than s, the processing proceeds to the next cluster. Here, s is a parameter for designating the minimum cluster size (322). Further, it is examined whether the DP corresponding to the point included in the cluster C is derived from the tumor sample or the normal sample. If the ratio of the tumor sample-derived DP is less than r, the process proceeds to the next cluster (323). Here, r is a parameter representing the degree of tumor specificity and is a positive number of 1 or less. Further, as described with reference to FIG. 6, the probability p that the distribution in which the plotted points are arranged at an angle of 45 degrees occurs by chance regardless of BP is calculated (324), and the value is greater than or equal to the specified parameter p0. If so, the process proceeds to the next cluster (325).
図9は、プロット点が斜め45度に並ぶ分布が偶然生じる確率pの計算法を説明するための説明図である。621と622はDPの端点のゲノム座標を表す座標平面のx軸とy軸である。DPに対応する点623は、一つのクラスタCに含まれるもののみを表示している。縦の長さが6σで横の長さが幅L+6σの長方形を右または左に45度回転した領域B(901)を、クラスタC内の点623を最も多く含む位置に取る。また、一辺の長さがL+6σの45度回転した正方形領域W(902)を、Bを含み、かつ、クラスタC内の点623を最も多く含む位置に取る。Bの中に含まれる点の数をmとし、Wの中に含まれる点の総数をnとし、q=6σ/(L+6σ)とする。点がランダムに偏りなく分布すると仮定すれば、mは二項分布B(n,q)に従う筈である。一方、BPにより生じたDPに対応する点をプロットした場合は、mはそれよりも大きな値を取る。そこで、二項分布B(n,q)の下でmがそのような大きな値をとる確率を計算し、その確率値をpとする。
FIG. 9 is an explanatory diagram for explaining a calculation method of the probability p in which a distribution in which plot points are arranged obliquely at 45 degrees occurs by chance. Reference numerals 621 and 622 denote the x-axis and y-axis of the coordinate plane representing the genome coordinates of the DP endpoints. A point 623 corresponding to DP displays only those included in one cluster C. A region B (901) obtained by rotating a rectangle having a vertical length of 6σ and a horizontal length of L + 6σ to the right or left by 45 degrees is taken as a position including the most points 623 in the cluster C. Also, a square area W (902) rotated by 45 degrees with a side length of L + 6σ is taken as a position including B and including the most points 623 in the cluster C. The number of points included in B is m, the total number of points included in W is n, and q = 6σ / (L + 6σ). Assuming that the points are randomly distributed without bias, m should follow the binomial distribution B (n, q). On the other hand, when a point corresponding to DP generated by BP is plotted, m takes a larger value. Therefore, the probability that m takes such a large value under the binomial distribution B (n, q) is calculated, and the probability value is set as p.
(2次元の存在領域Mの計算処理326)
この処理を、図10を用いて説明する。図10は、2次元の存在領域Mを計算する方法を説明するための説明図である。621と622はDPの端点のゲノム座標を表す座標平面のx軸とy軸である。DPに対応する点623は、一つのクラスタCに含まれるもののみを表示している。これらの点623は、図5において、sL=“+”かつsR=“-”の条件を満たすDPに対応していると仮定する。これ以外の条件を満たしている場合については、後述する。 (Calculation process 326 of two-dimensional existence area M)
This process will be described with reference to FIG. FIG. 10 is an explanatory diagram for explaining a method of calculating the two-dimensional existence region M. Reference numerals 621 and 622 denote the x-axis and y-axis of the coordinate plane representing the genome coordinates of the DP endpoints. A point 623 corresponding to DP displays only those included in one cluster C. These points 623 are assumed to correspond to the DP satisfying the conditions of sL = “+” and sR = “−” in FIG. The case where other conditions are satisfied will be described later.
この処理を、図10を用いて説明する。図10は、2次元の存在領域Mを計算する方法を説明するための説明図である。621と622はDPの端点のゲノム座標を表す座標平面のx軸とy軸である。DPに対応する点623は、一つのクラスタCに含まれるもののみを表示している。これらの点623は、図5において、sL=“+”かつsR=“-”の条件を満たすDPに対応していると仮定する。これ以外の条件を満たしている場合については、後述する。 (
This process will be described with reference to FIG. FIG. 10 is an explanatory diagram for explaining a method of calculating the two-dimensional existence region
DPに対応する点623のx座標とy座標をx1、y1とする。前記の条件の下では、x1の後方とy1の前方にそれぞれBPが存在する。すなわち、それらのBPの座標をx0、y0とすると、次式が成り立つ。
x0>x1かつy0<y1 …(式1)
このとき、サンプルDNA断片の長さはx0-x1+y1-y0となるので、これの値は概ねL±3σの範囲に収まる。 Assume that the x and y coordinates of thepoint 623 corresponding to DP are x1 and y1. Under the above conditions, BP exists behind x1 and in front of y1, respectively. That is, if the coordinates of those BPs are x0 and y0, the following equation is established.
x0> x1 and y0 <y1 (Formula 1)
At this time, since the length of the sample DNA fragment is x0−x1 + y1−y0, this value is generally within the range of L ± 3σ.
x0>x1かつy0<y1 …(式1)
このとき、サンプルDNA断片の長さはx0-x1+y1-y0となるので、これの値は概ねL±3σの範囲に収まる。 Assume that the x and y coordinates of the
x0> x1 and y0 <y1 (Formula 1)
At this time, since the length of the sample DNA fragment is x0−x1 + y1−y0, this value is generally within the range of L ± 3σ.
すなわち、次式が成り立つ。
L-3σ<x0-x1+y1-y0<L+3σ …(式2)
ここで、Lとσは、それぞれ、サンプルDNA断片の平均長と標準偏差を表すパラメータである。 That is, the following equation holds.
L-3σ <x0−x1 + y1−y0 <L + 3σ (Formula 2)
Here, L and σ are parameters representing the average length and standard deviation of the sample DNA fragment, respectively.
L-3σ<x0-x1+y1-y0<L+3σ …(式2)
ここで、Lとσは、それぞれ、サンプルDNA断片の平均長と標準偏差を表すパラメータである。 That is, the following equation holds.
L-3σ <x0−x1 + y1−y0 <L + 3σ (Formula 2)
Here, L and σ are parameters representing the average length and standard deviation of the sample DNA fragment, respectively.
このようにDPに対応する一つの点(x1,y1)が与えられれば、BPの座標(x0,y0)の存在領域が、式1と式2に示したようなx0とy0の一次不等式で与えられる。このように定義した存在領域の形状は正確には台形であるが(凡その位置を示すことが目的であるため)、その正確な形状にはあまり意味が無い。そこで、図10では簡略化して楕円領域1002で近似して表現している。存在領域1002は、点623の右斜め下45度の方向(1001)にある。クラスタC内にはDPに対応する点が複数あるので、それらが示す存在領域の重なりが最大となる領域を2次元の存在領域M(1003)とする。
Thus, if one point (x1, y1) corresponding to DP is given, the existence area of the BP coordinates (x0, y0) is a linear inequality of x0 and y0 as shown in equations 1 and 2. Given. The shape of the existence area defined in this way is exactly a trapezoid (because the purpose is to show the approximate position), but the exact shape has little meaning. Therefore, in FIG. 10, the expression is simplified and approximated by an elliptical region 1002. The existence area 1002 is in the direction (1001) at 45 degrees diagonally below and to the right of the point 623. Since there are a plurality of points corresponding to DP in the cluster C, a region where the overlapping of the existing regions indicated by them is the maximum is defined as a two-dimensional existing region M (1003).
DPに対応する点623が、図5において、sL=“+”かつsR=“-”以外の条件を満たしている場合も同様である。但し、sL=“-”かつsR=“+”のときはBPの存在領域1002はDPに対応する点623の左斜め上45度の方向に現れ、また、sL=“+”かつsR=“+”のときはBPの存在領域1002はDPに対応する点623の右斜め上45度の方向に現れ、sL=“-”かつsR=“-”のときはBPの存在領域1002はDPに対応する点623の左斜め下45度の方向に現れる。何れの場合も、これらの重なり領域を同様に求めて、2次元の存在領域Mが得られる。
The same applies when the point 623 corresponding to the DP satisfies the conditions other than sL = “+” and sR = “−” in FIG. However, when sL = “−” and sR = “+”, the BP existence region 1002 appears in the direction of 45 degrees diagonally to the upper left of the point 623 corresponding to DP, and sL = “+” and sR = “ When “+”, the BP existence region 1002 appears in the direction of 45 degrees diagonally to the upper right of the point 623 corresponding to DP, and when sL = “−” and sR = “−”, the BP existence region 1002 becomes DP. The corresponding point 623 appears in the direction of 45 degrees diagonally to the left. In any case, these overlapping regions are obtained in the same manner, and a two-dimensional existence region M is obtained.
2次元の存在領域Mをx軸方向とy軸方向に射影してそれぞれの座標範囲を定め、参照ゲノム配列データ201を参照して、その座標範囲にある参照ゲノムの部分配列A(1004)とB(1005)を求める。ただし、sL=“-”のとき、Aは相補鎖をとり、sR=“+”のとき、Bは相補鎖をとる。
The two-dimensional existence region M is projected in the x-axis direction and the y-axis direction to determine the respective coordinate ranges. With reference to the reference genome sequence data 201, the reference genome partial sequence A (1004) in the coordinate range Find B (1005). However, when sL = “−”, A takes a complementary strand, and when sR = “+”, B takes a complementary strand.
(Mの射影先の配列Aと配列Bの取得処理327)
以上の処理により、Mの射影先の配列Aと配列Bが求められる。 (M-projection destination array A and array B acquisition processing 327)
Through the above processing, the array A and the array B of M projection destinations are obtained.
以上の処理により、Mの射影先の配列Aと配列Bが求められる。 (M-projection destination array A and array B acquisition processing 327)
Through the above processing, the array A and the array B of M projection destinations are obtained.
(腫瘍サンプルについて配列A内にあるBP位置の推定処理331)
この処理では、腫瘍サンプルに対して、配列A内にあるBP位置を推定する。 (Estimation process 331 of BP position in sequence A for tumor sample)
In this process, the BP position within sequence A is estimated for the tumor sample.
この処理では、腫瘍サンプルに対して、配列A内にあるBP位置を推定する。 (
In this process, the BP position within sequence A is estimated for the tumor sample.
(推定成功の判定処理332)
この処理では、腫瘍サンプルについて求められた配列A内にあるBP位置の推定が成功したか否かが判定される。推定に失敗した場合(No)は現在のクラスタCの処理を中止して次のクラスタの処理321に進み、そうでない場合((Yes)は処理を継続する。 (Estimation success judgment process 332)
In this process, it is determined whether or not the estimation of the BP position in the sequence A obtained for the tumor sample is successful. If the estimation fails (No), the process of the current cluster C is stopped and the process proceeds to theprocess 321 of the next cluster, and if not ((Yes), the process is continued.
この処理では、腫瘍サンプルについて求められた配列A内にあるBP位置の推定が成功したか否かが判定される。推定に失敗した場合(No)は現在のクラスタCの処理を中止して次のクラスタの処理321に進み、そうでない場合((Yes)は処理を継続する。 (Estimation success judgment process 332)
In this process, it is determined whether or not the estimation of the BP position in the sequence A obtained for the tumor sample is successful. If the estimation fails (No), the process of the current cluster C is stopped and the process proceeds to the
(腫瘍サンプルについて配列B内にあるBP位置の推定処理333)
この処理では、腫瘍サンプルに対して、配列B内にあるBP位置を推定する。 (Estimation process 333 of BP position in sequence B for tumor sample)
In this process, the BP position within the sequence B is estimated for the tumor sample.
この処理では、腫瘍サンプルに対して、配列B内にあるBP位置を推定する。 (
In this process, the BP position within the sequence B is estimated for the tumor sample.
(推定成功の判定処理334)
この処理では、腫瘍サンプルについて求められた配列B内にあるBP位置の推定が成功したか否かが判定される。推定に失敗した場合(No)は現在のクラスタCの処理を中止して次のクラスタの処理321に進み、そうでない場合は(Yes)は処理を継続する。 (Estimation success judgment process 334)
In this process, it is determined whether or not the estimation of the BP position in the sequence B obtained for the tumor sample is successful. If the estimation fails (No), the processing of the current cluster C is stopped and the processing proceeds to theprocessing 321 of the next cluster. If not (Yes), the processing is continued.
この処理では、腫瘍サンプルについて求められた配列B内にあるBP位置の推定が成功したか否かが判定される。推定に失敗した場合(No)は現在のクラスタCの処理を中止して次のクラスタの処理321に進み、そうでない場合は(Yes)は処理を継続する。 (Estimation success judgment process 334)
In this process, it is determined whether or not the estimation of the BP position in the sequence B obtained for the tumor sample is successful. If the estimation fails (No), the processing of the current cluster C is stopped and the processing proceeds to the
(正常サンプルについて配列A内にあるBP位置の推定処理335)
この処理では、正常サンプルに対して、配列A内にあるBP位置を推定する。 (Estimation process 335 of BP position in array A for normal sample)
In this process, the BP position in the array A is estimated with respect to the normal sample.
この処理では、正常サンプルに対して、配列A内にあるBP位置を推定する。 (
In this process, the BP position in the array A is estimated with respect to the normal sample.
(推定成功の判定処理336)
この処理では、正常サンプルについて求められた配列A内にあるBP位置の推定が成功したか否かが判定される。推定に成功した場合(Yes)は現在のクラスタCの処理を中止して次のクラスタの処理321に進み、そうでない場合(No)は処理を継続する。 (Estimation success judgment process 336)
In this process, it is determined whether or not the estimation of the BP position in the array A obtained for the normal sample is successful. If the estimation is successful (Yes), the process of the current cluster C is stopped and the process proceeds to theprocess 321 of the next cluster. If not (No), the process is continued.
この処理では、正常サンプルについて求められた配列A内にあるBP位置の推定が成功したか否かが判定される。推定に成功した場合(Yes)は現在のクラスタCの処理を中止して次のクラスタの処理321に進み、そうでない場合(No)は処理を継続する。 (Estimation success judgment process 336)
In this process, it is determined whether or not the estimation of the BP position in the array A obtained for the normal sample is successful. If the estimation is successful (Yes), the process of the current cluster C is stopped and the process proceeds to the
(正常サンプルについて配列B内にあるBP位置の推定処理337)
この処理では、正常サンプルに対して、配列B内にあるBP位置を推定する。 (A process for estimating a BP position in the sequence B for a normal sample 337)
In this process, the BP position in the array B is estimated for the normal sample.
この処理では、正常サンプルに対して、配列B内にあるBP位置を推定する。 (A process for estimating a BP position in the sequence B for a normal sample 337)
In this process, the BP position in the array B is estimated for the normal sample.
(推定成功の判定処理338)
この処理では、正常サンプルについて求められた配列B内にあるBP位置の推定が成功したか否かが判定される。推定に成功した場合(Yes)は現在のクラスタCの処理を中止して次のクラスタの処理321に進み、そうでない場合(No)は処理を継続する。 (Estimation success judgment process 338)
In this process, it is determined whether or not the estimation of the BP position in the array B obtained for the normal sample is successful. If the estimation is successful (Yes), the process of the current cluster C is stopped and the process proceeds to theprocess 321 of the next cluster. If not (No), the process is continued.
この処理では、正常サンプルについて求められた配列B内にあるBP位置の推定が成功したか否かが判定される。推定に成功した場合(Yes)は現在のクラスタCの処理を中止して次のクラスタの処理321に進み、そうでない場合(No)は処理を継続する。 (Estimation success judgment process 338)
In this process, it is determined whether or not the estimation of the BP position in the array B obtained for the normal sample is successful. If the estimation is successful (Yes), the process of the current cluster C is stopped and the process proceeds to the
(推定結果の出力処理341)
この処理では、以上のようにして得られた配列A及び配列B内のBPの位置の推定結果を出力する。 (Estimation result output processing 341)
In this process, the estimation results of the positions of the BPs in the arrays A and B obtained as described above are output.
この処理では、以上のようにして得られた配列A及び配列B内のBPの位置の推定結果を出力する。 (Estimation result output processing 341)
In this process, the estimation results of the positions of the BPs in the arrays A and B obtained as described above are output.
(クラスタCの2次元プロット出力処理342)
この処理では、前述の推定を行った根拠となる状況をユーザに示すために、クラスタCの2次元プロットを出力する。 (Cluster C two-dimensional plot output process 342)
In this process, a two-dimensional plot of cluster C is output in order to show the user the situation that is the basis for the above estimation.
この処理では、前述の推定を行った根拠となる状況をユーザに示すために、クラスタCの2次元プロットを出力する。 (Cluster C two-dimensional plot output process 342)
In this process, a two-dimensional plot of cluster C is output in order to show the user the situation that is the basis for the above estimation.
(D(x,A),D(x,B)のプロット出力処理343)
この処理では、最小不一致率を与える多価関数のグラフのプロットを出力する。なお、プロット出力は、一旦、HDD(104)に保存して、後で、ユーザの求めに応じて表示部103に出力してもよい。このようにして現在のクラスタCの処理が完了し、次のクラスタの処理321に進む。処理331、処理333、処理335、処理337の推定処理にも同様の方法を用いる。 (D (x, A), D (x, B) plot output processing 343)
In this process, a graph plot of a multivalent function giving the minimum mismatch rate is output. Note that the plot output may be temporarily stored in the HDD (104) and later output to the display unit 103 in response to a user request. In this way, the process for the current cluster C is completed, and the process proceeds to theprocess 321 for the next cluster. A similar method is used for the estimation processing of the processing 331, the processing 333, the processing 335, and the processing 337.
この処理では、最小不一致率を与える多価関数のグラフのプロットを出力する。なお、プロット出力は、一旦、HDD(104)に保存して、後で、ユーザの求めに応じて表示部103に出力してもよい。このようにして現在のクラスタCの処理が完了し、次のクラスタの処理321に進む。処理331、処理333、処理335、処理337の推定処理にも同様の方法を用いる。 (D (x, A), D (x, B) plot output processing 343)
In this process, a graph plot of a multivalent function giving the minimum mismatch rate is output. Note that the plot output may be temporarily stored in the HDD (104) and later output to the display unit 103 in response to a user request. In this way, the process for the current cluster C is completed, and the process proceeds to the
(推定処理331の詳細)
以下では、推定処理331の詳細について説明する。なお、推定処理331の配列Aと配列Bを交換すれば、推定処理333の内容となる。また、これら推定処理で用いる腫瘍サンプルを正常サンプルに置き換えれば、推定処理335と337の内容となる。 (Details of the estimation process 331)
Hereinafter, details of theestimation process 331 will be described. If the array A and the array B in the estimation process 331 are exchanged, the contents of the estimation process 333 are obtained. If the tumor samples used in these estimation processes are replaced with normal samples, the contents of the estimation processes 335 and 337 are obtained.
以下では、推定処理331の詳細について説明する。なお、推定処理331の配列Aと配列Bを交換すれば、推定処理333の内容となる。また、これら推定処理で用いる腫瘍サンプルを正常サンプルに置き換えれば、推定処理335と337の内容となる。 (Details of the estimation process 331)
Hereinafter, details of the
図11は、腫瘍サンプルに対する配列A内にあるBP位置の推定処理331を説明するフローチャートである。
FIG. 11 is a flowchart for explaining the estimation process 331 of the BP position in the array A with respect to the tumor sample.
まず、配列Aを走査して(1101,1104,1105)、座標xの位置で長さkの部分配列Q=A(x,k)を取り出す(1102)。次に、部分配列Qの延長配列Ext(Q)を配列A及び配列Bと比較して、その最小不一致率(minimum discrepancy ratio)を計算する(1103)。
First, the array A is scanned (1101, 1104, 1105), and a partial array Q = A (x, k) having a length k at the position of the coordinate x is taken out (1102). Next, the extended sequence Ext (Q) of the partial sequence Q is compared with the sequences A and B, and the minimum mismatch rate (minimum (discrepancy ratio) is calculated (1103).
一般に、配列Eと配列Fの不一致率d(E,F)は、配列Eと配列Fの最適なアラインメントを行ったときの塩基の不一致率(置換、挿入、欠失を生じる塩基の割合)として定義される。また、配列Eと配列Wの最小不一致率D(E,W)は、配列Wの中の部分配列Fをd(E,F)が最小となるようにFを選んだときの最小値とする。これらの値は、特許5528249号に記載の動的計画法を用いることにより効率的に計算することができる。Qの延長配列Ext(Q)は後述するように複数通りあるため、Qの延長配列Ext(Q)と配列A及び配列Bとの最小不一致率は多価関数となる。それらをD(x,A),D(x,B)とする。すなわち、以下の値を計算する(1103)。
D(x,A)=D(Ext(Q),A) …(式3)
D(x,B)=D(Ext(Q),B) …(式4)
これらの計算方法は後述する。 In general, the mismatch rate d (E, F) between the sequence E and the sequence F is the base mismatch rate (ratio of bases that cause substitution, insertion, or deletion) when the sequence E and the sequence F are optimally aligned. Defined. Further, the minimum mismatch rate D (E, W) between the array E and the array W is set to the minimum value when the partial array F in the array W is selected so that d (E, F) is minimized. . These values can be calculated efficiently by using the dynamic programming described in Japanese Patent No. 5528249. Since there are a plurality of Q extended sequences Ext (Q) as described later, the minimum mismatch rate between the Q extended sequence Ext (Q) and the sequences A and B is a multivalent function. Let them be D (x, A) and D (x, B). That is, the following values are calculated (1103).
D (x, A) = D (Ext (Q), A) (Formula 3)
D (x, B) = D (Ext (Q), B) (Formula 4)
These calculation methods will be described later.
図14は、多価関数D(x,A),D(x,B)のプロット図の説明図である。横軸1401にx軸をとり、縦軸1402に不一致率Dの値をとる。これらのグラフは多価であるため、枝分かれして、一つのxに対して複数のD値をとる。このようなグラフを図3のフローチャートの「D(x,A),D(x,B)のプロット出力」ステップ343で表示出力することにより、ユーザはBPがあると推定される周辺の状況を確認することが出来るようになる。
FIG. 14 is an explanatory diagram of plot diagrams of the multivalent functions D (x, A) and D (x, B). The horizontal axis 1401 is the x axis, and the vertical axis 1402 is the value of the mismatch rate D. Since these graphs are multivalent, they branch and take a plurality of D values for one x. By displaying and displaying such a graph in the “D (x, A), D (x, B) plot output” step 343 in the flowchart of FIG. It becomes possible to confirm.
多価関数D(y,A)の最大値を与えるyと、多価関数D(z,B)の最大値を与えるzとを求める(1111)。このとき、最大値がm0より大きく、かつ、最小値がm1より小さく、かつ、yとzの差の絶対値がd以下の条件が満たされるか否かを調べる(1112)。ここで、m0、m1、dは与えられたパラメータである。この条件1112が満たされない場合は、配列A内にはBPは存在しないと推定し(1113)、推定は失敗した(1114)として処理を終える。一方、この条件1112が満たされた場合、y=zであれば(1115)、配列A内のBPの位置はyであると推定し(1116)、y≠zであれば(1115)、配列A内のBPの位置はyとzの間の範囲にあると推定し(1117)、この何れの場合も推定は成功した(1118)として処理を終える。y=zとならないようなケースは、BPの位置に何らかの別の短い配列が挿入された場合などに生じる。
Suppose y that gives the maximum value of the multivalent function D (y, A) and z that gives the maximum value of the multivalent function D (z, B) (1111). At this time, it is examined whether or not the condition that the maximum value is larger than m0, the minimum value is smaller than m1, and the absolute value of the difference between y and z is d or less is satisfied (1112). Here, m0, m1, and d are given parameters. If this condition 1112 is not satisfied, it is estimated that there is no BP in the array A (1113), and the processing is terminated because the estimation has failed (1114). On the other hand, when this condition 1112 is satisfied, if y = z (1115), the position of the BP in the array A is estimated to be y (1116), and if y ≠ z (1115), the array The position of the BP in A is estimated to be in the range between y and z (1117), and in either case, the estimation is successful (1118) and the process ends. The case where y = z does not occur occurs when some other short sequence is inserted at the position of BP.
図12は、Qの延長配列Ext(Q)を求める方法を示すフローチャートである。図13は、その部分処理P(b,E,Q,S(EQ),T(EQ))を示すフローチャートである。これらの図を用いて、Qの延長配列Ext(Q)を求める方法を説明する。
FIG. 12 is a flowchart showing a method for obtaining the Q extended array Ext (Q). FIG. 13 is a flowchart showing the partial processing P (b, E, Q, S (EQ), T (EQ)). A method for obtaining the extended array Ext (Q) of Q will be described with reference to these drawings.
図12において、クエリー配列Qを入力し(1201)、Qの長さLen(Q)をkとし、wを空文字列(empty string)εとする(1202)。1203で、腫瘍サンプルリード配列辞書222を用いて、S(w)とT(w)を計算する。Nを全ての腫瘍サンプルのリード配列の全ての接尾辞の総数とすれば、最初に、w=εであるときは、前述したように、S(ε)=0,T(ε)=Nとなる。S(w)<T(w)でなければ直ちに処理を終了し、そうでなければ次に進む(1204)。k>0であれば(1205)、Qのk番目の文字Q(k)をnとして、文字列wを左方にnを付加して一文字延長し、kを1減じて(1206)、1203の処理に戻る。左方に1文字だけ延長したwに対して1203を効率的に計算できることは、図4で前述した通りである。
In FIG. 12, a query sequence Q is input (1201), the length Len (Q) of Q is set to k, and w is set to an empty string ε (1202). At 1203, S (w) and T (w) are calculated using the tumor sample lead sequence dictionary 222. If N is the total number of all suffixes in the read sequence of all tumor samples, first, when w = ε, as described above, S (ε) = 0, T (ε) = N Become. If S (w) <T (w), the process is immediately terminated, otherwise proceeds to the next (1204). If k> 0 (1205), the k-th character Q (k) of Q is set to n, the character string w is added to the left by adding n, and one character is extended, and k is decreased by 1 (1206), 1203 Return to the process. As described above with reference to FIG. 4, 1203 can be efficiently calculated for w extended by one character to the left.
k=0であれば(1205)、Eを空文字列εとして(1211)、bをA,C,G,Tの何れかの塩基として、部分処理P(b,E,Q,S(EQ),T(EQ))(1213)を繰り返し(1212)、それが完了すれば終了する。このとき、w=Q,E=εであるから、部分処理P(1213)に渡される引数b,E,Q,S(EQ),T(EQ)の値は全て計算済みである。部分処理P(1213)の中では、Qの延長配列が複数個求まる場合もあれば、一つも求まらない場合もある。従って、図11の全体処理で出力されるQの延長配列の数は0以上の整数となり、Ext(Q)は多価となる。
If k = 0 (1205), E is the empty string ε (1211), b is any base of A, C, G, T, and partial processing P (b, E, Q, S (EQ) , T (EQ)) (1213) is repeated (1212), and when it is completed, the process ends. At this time, since w = Q and E = ε, the values of the arguments b, E, Q, S (EQ), and T (EQ) passed to the partial process P (1213) have been calculated. In the partial process P (1213), a plurality of extended sequences of Q may be obtained, or none may be obtained. Therefore, the number of extended arrays of Q output in the overall processing of FIG. 11 is an integer greater than or equal to 0, and Ext (Q) is multivalent.
次に、図13を用いて、部分処理P(b,E,Q,S(EQ),T(EQ))(1213)を説明する。この部分処理(1213)に対しては、括弧の中に並んだ引数、b,E,Q,S(EQ),T(EQ)の値が渡される。
Next, the partial process P (b, E, Q, S (EQ), T (EQ)) (1213) will be described with reference to FIG. For this partial process (1213), the arguments, b, E, Q, S (EQ), and T (EQ) values in parentheses are passed.
1301でEの左方にbを付加して、Eを左方に一文字だけ延長する。一文字だけ左方に延長されたEQに対して、S(EQ)とT(EQ)を計算する(1302)。このような計算を効率的に行うことが出来るのは、図4を用いて前述した通りである。
In 1301, add b to the left of E and extend E by one character to the left. S (EQ) and T (EQ) are calculated for the EQ extended to the left by one character (1302). Such calculation can be efficiently performed as described above with reference to FIG.
S(EQ)<T(EQ)でなければ直ちに処理を終了し、そうでなければ次に進む(1303)。Eの長さLen(E)が与えられたパラメータeより小さければ(1304)、bをA,C,G,Tの何れかの塩基として、再帰的に部分処理P(b,E,Q,S(EQ),T(EQ))(1307)行うことを繰り返し(1306)、それが完了すれば終了する。再帰的に部分処理を行う際にEは一文字だけ延長しているので、1304の判定条件により、再帰がネストする深さはパラメータe以下に抑えられており、無限ループに陥ることは無い。1304の判定条件がNoとなるのは、Len(E)=eとなる場合であるが、このときはQの一つの延長配列としてEを出力して(1305)、処理を終了する。
If S (EQ) <T (EQ), the process is immediately terminated, otherwise proceeds to the next (1303). If the length Len (E) of E is smaller than the given parameter e (1304), the partial processing P (b, E, Q, S (EQ), T (EQ)) (1307) is repeated (1306), and when it is completed, the process ends. Since E is extended by one character when performing partial processing recursively, the depth at which the recursion is nested is suppressed to the parameter e or less according to the determination condition of 1304 and does not fall into an infinite loop. The judgment condition of 1304 is No when Len (E) = e. At this time, E is output as one extended array of Q (1305), and the process is terminated.
以上で説明した実施例の変形として、図1において、正常DNAサンプル111が与えられず腫瘍DNAサンプル110のみが与えられた場合に、変異解析を行う方法がある。但し、親から遺伝的に引き継いだ変異と、癌化に伴い後天的に生じた体細胞変異の両者が解析される。この場合、腫瘍サンプルDNA110に関わるデータが無いため、処理が簡略化される。
As a modification of the embodiment described above, there is a method of performing mutation analysis in FIG. 1 when the normal DNA sample 111 is not given and only the tumor DNA sample 110 is given. However, both genetically inherited mutations from the parent and somatic mutations that have been acquired with canceration are analyzed. In this case, since there is no data related to the tumor sample DNA 110, the processing is simplified.
図15に、本発明の一実施形態の変形に関するデータの流れを示す。参照ゲノム配列データ1501は、図2の参照ゲノム配列データ201と同一のものであり、また、サンプルリード配列データ1502は図2の腫瘍サンプル配列データ202と同一のものである。以降のデータの流れは、図2で同じ符号を付けられている対応する部分と同一である。
FIG. 15 shows a data flow related to the modification of the embodiment of the present invention. Reference genome sequence data 1501 is the same as reference genome sequence data 201 in FIG. 2, and sample lead sequence data 1502 is the same as tumor sample sequence data 202 in FIG. The subsequent flow of data is the same as the corresponding parts denoted by the same reference numerals in FIG.
図16に、本発明の一実施形態の変形に関する処理の流れを表すフローチャートを示す。その各ステップの処理は、図3で同じ符号を付けられている対応する部分と同一である。
FIG. 16 is a flowchart showing the flow of processing relating to the modification of the embodiment of the present invention. The processing of each step is the same as the corresponding part denoted by the same reference numeral in FIG.
(4)まとめ
以上の通り、本実施例に係る配列データ解析装置1(DNA解析システム)を用いれば、試料DNAを解析してブレークポイントBPなど未知の事象の発生位置(存在領域)を高感度に推定することできる。また、リード配列辞書(腫瘍リード配列辞書222、正常サンプルリード配列辞書223)を利用して、前記発生位置(存在領域)を通るリード配列を集めて解析することにより、効率的に、ブレークポイントBPなど未知の事象の発生位置(存在領域)を推定できる。 (4) Summary As described above, when the sequence data analysis apparatus 1 (DNA analysis system) according to the present embodiment is used, the sample DNA is analyzed and the occurrence position (existing region) of an unknown event such as a breakpoint BP is highly sensitive. Can be estimated. Further, by utilizing the lead sequence dictionary (tumorlead sequence dictionary 222, normal sample lead sequence dictionary 223) and collecting and analyzing the lead sequences that pass through the occurrence position (existing region), the breakpoint BP can be efficiently analyzed. The occurrence position (existing area) of an unknown event can be estimated.
以上の通り、本実施例に係る配列データ解析装置1(DNA解析システム)を用いれば、試料DNAを解析してブレークポイントBPなど未知の事象の発生位置(存在領域)を高感度に推定することできる。また、リード配列辞書(腫瘍リード配列辞書222、正常サンプルリード配列辞書223)を利用して、前記発生位置(存在領域)を通るリード配列を集めて解析することにより、効率的に、ブレークポイントBPなど未知の事象の発生位置(存在領域)を推定できる。 (4) Summary As described above, when the sequence data analysis apparatus 1 (DNA analysis system) according to the present embodiment is used, the sample DNA is analyzed and the occurrence position (existing region) of an unknown event such as a breakpoint BP is highly sensitive. Can be estimated. Further, by utilizing the lead sequence dictionary (tumor
[実施例2]
(1)概要
ところで、異種のバクテリア間でも、遺伝子の一部が一方から他方へ移動する遺伝子の水平伝搬(horizontal transfer)が生じることがある。また、病原性をもたないバクテリアであっても、有害な遺伝因子を他のバクテリアから水平伝搬を通じて受け取ることによって、病原性を獲得することがある。また、病原性のバクテリアが、他のバクテリアから薬剤耐性の遺伝因子を受け取ることにより、新たな薬剤耐性を獲得することもある。そこで、本実施例においては、バクテリア間の遺伝子の水平伝搬を解析する方法について説明する。 [Example 2]
(1) Outline By the way, horizontal transfer of a gene in which a part of a gene moves from one to the other may occur between different types of bacteria. In addition, even a non-pathogenic bacterium may acquire pathogenicity by receiving harmful genetic factors from other bacteria through horizontal transmission. Pathogenic bacteria may also acquire new drug resistance by receiving drug-resistant genetic factors from other bacteria. Therefore, in this example, a method for analyzing horizontal propagation of genes between bacteria will be described.
(2)全体構成
本実施例に係るDNA解析システムの基本構成は実施例1(図1)と同様である。ただし、本実施例におけるDNAシーケンサ109は、腫瘍DNAサンプル110と正常DNAサンプル111の代わりに、バクテリア感染した検体のサンプルを解析し、その解析結果であるサンプルリード配列データ1502(図15)を配列データ解析装置1に提供する。 (2) Overall Configuration The basic configuration of the DNA analysis system according to this example is the same as that of Example 1 (FIG. 1). However, the DNA sequencer 109 in this embodiment analyzes a sample of a specimen infected with bacteria instead of thetumor DNA sample 110 and the normal DNA sample 111, and arranges the sample lead sequence data 1502 (FIG. 15) as the analysis result. The data analysis apparatus 1 is provided.
本実施例に係るDNA解析システムの基本構成は実施例1(図1)と同様である。ただし、本実施例におけるDNAシーケンサ109は、腫瘍DNAサンプル110と正常DNAサンプル111の代わりに、バクテリア感染した検体のサンプルを解析し、その解析結果であるサンプルリード配列データ1502(図15)を配列データ解析装置1に提供する。 (2) Overall Configuration The basic configuration of the DNA analysis system according to this example is the same as that of Example 1 (FIG. 1). However, the DNA sequencer 109 in this embodiment analyzes a sample of a specimen infected with bacteria instead of the
(3)配列データ解析装置内のデータの流れ
図15を用い、本実施例の用途に配列データ解析装置1を用いる場合のデータの流れを説明する。なお、図15には図2との対応部分に同一符号を付して示している。配列データ解析装置1は、参照配列データ1501をゲノム配列サーバ108から受け付けると共に、サンプルリード配列データ1502をDNAシーケンサ109から受け付ける。参照ゲノム配列データ1501は、解析対象となる複数のバクテリアの参照ゲノム配列を集めたものである。サンプルリード配列データ1502は、検体をDNAシーケンサ109で解析して得られたものである。以降のデータの流れは、図2で同じ符号を付けられている対応する部分と同一である。 (3) Data Flow in Sequence Data Analysis Device With reference to FIG. 15, the data flow when the sequencedata analysis device 1 is used for the application of this embodiment will be described. In FIG. 15, parts corresponding to those in FIG. The sequence data analysis apparatus 1 accepts reference sequence data 1501 from the genome sequence server 108 and accepts sample read sequence data 1502 from the DNA sequencer 109. Reference genome sequence data 1501 is a collection of reference genome sequences of a plurality of bacteria to be analyzed. The sample lead sequence data 1502 is obtained by analyzing the specimen with the DNA sequencer 109. The subsequent flow of data is the same as the corresponding parts denoted by the same reference numerals in FIG.
図15を用い、本実施例の用途に配列データ解析装置1を用いる場合のデータの流れを説明する。なお、図15には図2との対応部分に同一符号を付して示している。配列データ解析装置1は、参照配列データ1501をゲノム配列サーバ108から受け付けると共に、サンプルリード配列データ1502をDNAシーケンサ109から受け付ける。参照ゲノム配列データ1501は、解析対象となる複数のバクテリアの参照ゲノム配列を集めたものである。サンプルリード配列データ1502は、検体をDNAシーケンサ109で解析して得られたものである。以降のデータの流れは、図2で同じ符号を付けられている対応する部分と同一である。 (3) Data Flow in Sequence Data Analysis Device With reference to FIG. 15, the data flow when the sequence
(4)配列データ解析処理の内容
以下、図16を参照し、本実施例に係る配列データ解析処理の内容を詳細に説明する。なお、図16には図3との対応部分に同一符号を付して示している。従って、本実施例の処理動作は、処理対象の違いを除き、図3で同じ符号を付けられている対応する部分と同一である。 (4) Contents of Sequence Data Analysis Processing Hereinafter, details of the sequence data analysis processing according to the present embodiment will be described in detail with reference to FIG. In FIG. 16, the same reference numerals are given to the portions corresponding to those in FIG. 3. Therefore, the processing operation of the present embodiment is the same as the corresponding part denoted by the same reference numeral in FIG.
以下、図16を参照し、本実施例に係る配列データ解析処理の内容を詳細に説明する。なお、図16には図3との対応部分に同一符号を付して示している。従って、本実施例の処理動作は、処理対象の違いを除き、図3で同じ符号を付けられている対応する部分と同一である。 (4) Contents of Sequence Data Analysis Processing Hereinafter, details of the sequence data analysis processing according to the present embodiment will be described in detail with reference to FIG. In FIG. 16, the same reference numerals are given to the portions corresponding to those in FIG. 3. Therefore, the processing operation of the present embodiment is the same as the corresponding part denoted by the same reference numeral in FIG.
本実施例による解析処理の結果として得られるブレークポイントBPを、BP1、BP2、BPtとする。また、BPiにより繋ぎ合わされる配列をAi、Biとする。これらは、何れかのバクテリアの参照ゲノム配列の部分配列である。そこで、AiはバクテリアViの参照ゲノムの部分配列、BiはバクテリアWiの参照ゲノムの部分配列であるとする。ViとWiが等しくない場合は、バクテリアViとWiの間で遺伝因子の水平伝搬が生じたと判定される。また、水平伝搬された遺伝因子は、ブレークポイントBPに隣接する位置にある。一方、何れのi=1,2,…,tに対してもVi=Wiならば、バクテリア間の遺伝子の水平伝搬は生じていないと判定される。
Suppose break points BP obtained as a result of the analysis processing according to the present embodiment are BP1, BP2, and BPt. Also, let the arrays connected by BPi be Ai and Bi. These are partial sequences of any bacterial reference genome sequence. Therefore, it is assumed that Ai is a partial sequence of the reference genome of bacteria Vi, and Bi is a partial sequence of the reference genome of bacteria Wi. If Vi and Wi are not equal, it is determined that horizontal propagation of the genetic factor has occurred between bacteria Vi and Wi. In addition, the genetic factor propagated horizontally is located adjacent to the breakpoint BP. On the other hand, if Vi = Wi for any i = 1, 2,..., T, it is determined that no horizontal propagation of genes between bacteria occurs.
(5)まとめ
以上の通り、本実施例に係る配列データ解析装置1(DNA解析システム)を用いれば、バクテリア間の遺伝子の水平伝搬の有無を解析することができる。 (5) Summary As described above, by using the sequence data analysis apparatus 1 (DNA analysis system) according to the present embodiment, it is possible to analyze the presence or absence of horizontal propagation of genes between bacteria.
以上の通り、本実施例に係る配列データ解析装置1(DNA解析システム)を用いれば、バクテリア間の遺伝子の水平伝搬の有無を解析することができる。 (5) Summary As described above, by using the sequence data analysis apparatus 1 (DNA analysis system) according to the present embodiment, it is possible to analyze the presence or absence of horizontal propagation of genes between bacteria.
[実施例3]
(1)概要
法医学などの分野では、DNAサンプルを解析して個人識別(HID:Human Identification)を行うニーズがある。個人識別のためには、サンプルDNA配列を参照ゲノム配列と比較して、その個人に特有な多型(遺伝的に継承された型)を調べる。このような多型には、一塩基多型(SNP, single nucleotide polymorphism)や、コピー数多型(CNV,copy number variation)や、構造多型(SV,structural variation)などがある。2つのサンプルで、一致する多型が多数検出されれば、2つのDNAサンプルは同一人物に由来する可能性が極めて高いと判断される。 [Example 3]
(1) Outline In fields such as forensic medicine, there is a need to analyze a DNA sample and perform personal identification (HID). For personal identification, the sample DNA sequence is compared with a reference genomic sequence to determine the polymorphism (genetically inherited type) unique to that individual. Such polymorphisms include single nucleotide polymorphism (SNP), copy number variation (CNV), structural polymorphism (SV), and structural variation. If a large number of matching polymorphisms are detected in two samples, it is determined that the two DNA samples are very likely to be from the same person.
そこで、本実施例では、2つのDNAサンプルに含まれる多型を検出し、その検出結果を比較してそれらのサンプルが同一人物に由来するか否かを判定することにより、個人識別(HID)を行う方法を説明する。
Therefore, in this embodiment, individual identification (HID) is performed by detecting polymorphisms contained in two DNA samples and comparing the detection results to determine whether or not these samples are derived from the same person. A method of performing will be described.
(2)全体構成
本実施例に係るDNA解析システムの基本構成は実施例1(図1)と同様である。ただし、本実施例のDNAシーケンサ109は、腫瘍DNAサンプル110と正常DNAサンプル111の代わりに、2つのサンプルH1及びH2を解析し、その解析結果であるリード配列データ1502を配列データ解析装置1に提供する。ここで、DNAシーケンサ109は、サンプルH1とH2に対してそれぞれ独立に解析を行い、それぞれのサンプルに対するリード配列データ1502生成する。 (2) Overall Configuration The basic configuration of the DNA analysis system according to this example is the same as that of Example 1 (FIG. 1). However, the DNA sequencer 109 of this embodiment analyzes two samples H1 and H2 instead of thetumor DNA sample 110 and the normal DNA sample 111, and sends the read sequence data 1502 as the analysis result to the sequence data analysis apparatus 1. provide. Here, the DNA sequencer 109 analyzes each of the samples H1 and H2 independently, and generates read sequence data 1502 for each sample.
本実施例に係るDNA解析システムの基本構成は実施例1(図1)と同様である。ただし、本実施例のDNAシーケンサ109は、腫瘍DNAサンプル110と正常DNAサンプル111の代わりに、2つのサンプルH1及びH2を解析し、その解析結果であるリード配列データ1502を配列データ解析装置1に提供する。ここで、DNAシーケンサ109は、サンプルH1とH2に対してそれぞれ独立に解析を行い、それぞれのサンプルに対するリード配列データ1502生成する。 (2) Overall Configuration The basic configuration of the DNA analysis system according to this example is the same as that of Example 1 (FIG. 1). However, the DNA sequencer 109 of this embodiment analyzes two samples H1 and H2 instead of the
(3)配列データ解析装置内のデータの流れ
図15を用い、本実施例の用途(多型の検出)に配列データ解析装置1を用いる場合のデータの流れを説明する。なお、参照ゲノム配列データ1501は、図2の参照ゲノム配列データ201と同一のデータであり、サンプルリード配列1502はサンプルH1またはH2のリード配列データである。以降のデータの流れは、図2で同じ符号を付けられている対応する部分と同一である。 (3) Data Flow in Sequence Data Analysis Device A data flow when using the sequencedata analysis device 1 for the application (detection of polymorphism) of this embodiment will be described with reference to FIG. The reference genome sequence data 1501 is the same data as the reference genome sequence data 201 of FIG. 2, and the sample lead sequence 1502 is the read sequence data of the sample H1 or H2. The subsequent flow of data is the same as the corresponding parts denoted by the same reference numerals in FIG.
図15を用い、本実施例の用途(多型の検出)に配列データ解析装置1を用いる場合のデータの流れを説明する。なお、参照ゲノム配列データ1501は、図2の参照ゲノム配列データ201と同一のデータであり、サンプルリード配列1502はサンプルH1またはH2のリード配列データである。以降のデータの流れは、図2で同じ符号を付けられている対応する部分と同一である。 (3) Data Flow in Sequence Data Analysis Device A data flow when using the sequence
(4)配列データ解析処理の内容
以下、図16を参照し、本実施例に係る配列データ解析処理の内容を詳細に説明する。本実施例の場合も、サンプルH1とH2を処理対象とする点を除き、図3で同じ符号を付けられている対応する部分と同一である。本実施例の場合、解析処理の結果として、サンプルH1内のブレークポイントBPとサンプルH2内のブレークポイントBPの推定結果が得られる。 (4) Contents of Sequence Data Analysis Processing Hereinafter, details of the sequence data analysis processing according to the present embodiment will be described in detail with reference to FIG. In the case of the present embodiment as well, it is the same as the corresponding portion given the same reference numeral in FIG. 3 except that the samples H1 and H2 are processed. In the case of the present embodiment, estimation results of the breakpoint BP in the sample H1 and the breakpoint BP in the sample H2 are obtained as a result of the analysis process.
以下、図16を参照し、本実施例に係る配列データ解析処理の内容を詳細に説明する。本実施例の場合も、サンプルH1とH2を処理対象とする点を除き、図3で同じ符号を付けられている対応する部分と同一である。本実施例の場合、解析処理の結果として、サンプルH1内のブレークポイントBPとサンプルH2内のブレークポイントBPの推定結果が得られる。 (4) Contents of Sequence Data Analysis Processing Hereinafter, details of the sequence data analysis processing according to the present embodiment will be described in detail with reference to FIG. In the case of the present embodiment as well, it is the same as the corresponding portion given the same reference numeral in FIG. 3 except that the samples H1 and H2 are processed. In the case of the present embodiment, estimation results of the breakpoint BP in the sample H1 and the breakpoint BP in the sample H2 are obtained as a result of the analysis process.
一般に、サンプルにCNVやSVが含まれていれば、その境界の位置にブレークポイントBPが現れる。従って、サンプルH1とH2から得られたブレークポイントBPの中に、互いに一致するものが多数見つかれば、2つのサンプルが同一人物に由来する可能性は極めて高くなる。サンプルH1から得られたブレークポイントBPの数をn1、サンプルH2から得られたブレークポイントBPの数をn2、サンプルH1とH2から共通に得られたブレークポイントBPの数をcとして、以下の2式が共に成立すれば、サンプルH1とサンプルH2は同一人物に由来すると判定する。
n1≧n0 かつ n2≧n0 …(式5)
c/n1≧r かつ c/n2≧r …(式6) In general, if a sample includes CNV or SV, a breakpoint BP appears at the boundary position. Therefore, if many breakpoints BP obtained from the samples H1 and H2 are found to match each other, the possibility that the two samples are derived from the same person is extremely high. Assuming that the number of breakpoints BP obtained from the sample H1 is n1, the number of breakpoints BP obtained from the sample H2 is n2, and the number of breakpoints BP obtained in common from the samples H1 and H2 is c, the following 2 If both equations hold, it is determined that sample H1 and sample H2 are from the same person.
n1 ≧ n0 and n2 ≧ n0 (Formula 5)
c / n1 ≧ r and c / n2 ≧ r (Formula 6)
ここで、n0とrは判定基準として事前に定めたパラメータである。また、式5が成立するが式6が成立しないときは、サンプルH1とサンプルH2は別の人物に由来すると判定する。また、式5が成立しないときは、判定不能とする。
Here, n0 and r are parameters determined in advance as judgment criteria. When Expression 5 is satisfied but Expression 6 is not satisfied, it is determined that Sample H1 and Sample H2 are derived from different persons. Further, when Expression 5 is not satisfied, it is determined that determination is impossible.
(5)まとめ
以上の通り、本実施例に係る配列データ解析装置1(DNA解析システム)を用いれば、個人識別を行うことができる。 (5) Summary As described above, personal identification can be performed by using the sequence data analysis apparatus 1 (DNA analysis system) according to this embodiment.
以上の通り、本実施例に係る配列データ解析装置1(DNA解析システム)を用いれば、個人識別を行うことができる。 (5) Summary As described above, personal identification can be performed by using the sequence data analysis apparatus 1 (DNA analysis system) according to this embodiment.
[実施例4]
(1)概要
癌に関連する構造変異(SA)の例は多数知られており、SAの境界には必ずブレークポイントBPが生じる。そこで、本実施例では、PE方式ではなくシングルエンド(SE)方式でDNAシーケンシングを行った場合、腫瘍サンプルの中に既知のSAが生じているか否かを判定する方法を説明する。 [Example 4]
(1) Overview Many examples of structural mutation (SA) related to cancer are known, and a breakpoint BP always occurs at the boundary of SA. Therefore, in this embodiment, a method for determining whether or not a known SA has occurred in a tumor sample when DNA sequencing is performed by a single end (SE) method instead of the PE method will be described.
(2)全体構成
本実施例に係るDNA解析システムの基本構成は実施例1(図1)と同様である。ただし、本実施例におけるDNAシーケンサ109は、SE方式でDNAシーケンシングを行う。また、シーケンシングの際に、正常サンプル111は不要である。 (2) Overall Configuration The basic configuration of the DNA analysis system according to this example is the same as that of Example 1 (FIG. 1). However, the DNA sequencer 109 in this embodiment performs DNA sequencing by the SE method. Further, thenormal sample 111 is not necessary for sequencing.
本実施例に係るDNA解析システムの基本構成は実施例1(図1)と同様である。ただし、本実施例におけるDNAシーケンサ109は、SE方式でDNAシーケンシングを行う。また、シーケンシングの際に、正常サンプル111は不要である。 (2) Overall Configuration The basic configuration of the DNA analysis system according to this example is the same as that of Example 1 (FIG. 1). However, the DNA sequencer 109 in this embodiment performs DNA sequencing by the SE method. Further, the
(3)配列データ解析装置内のデータの流れ
図17を用い、本実施例の用途に配列データ解析装置1を用いる場合のデータの流れを説明する。図17には、図2との対応部分に同一符号を付して示している。候補配列データAおよびB(1701)は既知のSAの境界周辺の配列であり、入力部105から配列データ入力部1702を通じて配列データ解析装置1内に取り込まれる。サンプルリード配列1703は、腫瘍サンプル110をSE方式でシーケンスして得られたリード配列データである。以降のデータの流れは、図2で同じ符号を付けられている対応する部分と同一である。 (3) Data Flow in Sequence Data Analysis Device With reference to FIG. 17, the data flow when the sequencedata analysis device 1 is used for the application of this embodiment will be described. In FIG. 17, parts corresponding to those in FIG. Candidate sequence data A and B (1701) are sequences around the boundary of the known SA, and are taken into the sequence data analysis apparatus 1 from the input unit 105 through the sequence data input unit 1702. The sample lead sequence 1703 is read sequence data obtained by sequencing the tumor sample 110 by the SE method. The subsequent flow of data is the same as the corresponding parts denoted by the same reference numerals in FIG.
図17を用い、本実施例の用途に配列データ解析装置1を用いる場合のデータの流れを説明する。図17には、図2との対応部分に同一符号を付して示している。候補配列データAおよびB(1701)は既知のSAの境界周辺の配列であり、入力部105から配列データ入力部1702を通じて配列データ解析装置1内に取り込まれる。サンプルリード配列1703は、腫瘍サンプル110をSE方式でシーケンスして得られたリード配列データである。以降のデータの流れは、図2で同じ符号を付けられている対応する部分と同一である。 (3) Data Flow in Sequence Data Analysis Device With reference to FIG. 17, the data flow when the sequence
(4)配列データ解析処理の内容
以下、図18を参照し、本実施例に係る配列データ解析処理の内容を詳細に説明する。図18には、図3との対応部分に同一符号を付して示している。本実施例の場合、ステップ311~314及びステップ321~327に代えて、ステップ1801が実行される。ステップ1801は、配列データ入力部1702により候補配列1701を読み込む処理である。 (4) Contents of Sequence Data Analysis Processing Hereinafter, details of the sequence data analysis processing according to the present embodiment will be described in detail with reference to FIG. In FIG. 18, parts corresponding to those in FIG. 3 are denoted by the same reference numerals. In this embodiment,step 1801 is executed instead of steps 311 to 314 and steps 321 to 327. Step 1801 is processing for reading the candidate sequence 1701 by the sequence data input unit 1702.
以下、図18を参照し、本実施例に係る配列データ解析処理の内容を詳細に説明する。図18には、図3との対応部分に同一符号を付して示している。本実施例の場合、ステップ311~314及びステップ321~327に代えて、ステップ1801が実行される。ステップ1801は、配列データ入力部1702により候補配列1701を読み込む処理である。 (4) Contents of Sequence Data Analysis Processing Hereinafter, details of the sequence data analysis processing according to the present embodiment will be described in detail with reference to FIG. In FIG. 18, parts corresponding to those in FIG. 3 are denoted by the same reference numerals. In this embodiment,
また、本実施例では、ステップ335~338に代えて、陽性の判定処理(ステップ1811)が実行される。また、本実施例では、ステップ332及び334で推定失敗(否定結果)が得られた場合、陰性の判定処理(ステップ1812)が実行される。これら判定処理では、判定結果が表示部103に伝えられる。なお、本実施例では、PEの場合のように同一種のゲノム参照座標を2次元位配置する必要がないので、2次元のプロット出力(ステップ342)は実行されない。その他の処理は、図3で同じ符号を付けられている対応する部分と同一である。
In this embodiment, a positive determination process (step 1811) is executed instead of steps 335 to 338. In this embodiment, when an estimation failure (negative result) is obtained in steps 332 and 334, a negative determination process (step 1812) is executed. In these determination processes, the determination result is transmitted to the display unit 103. In this embodiment, since it is not necessary to arrange the two-dimensional genome reference coordinates of the same type as in the case of PE, the two-dimensional plot output (step 342) is not executed. The other processes are the same as the corresponding parts denoted by the same reference numerals in FIG.
(5)まとめ
以上の通り、本実施例に係る配列データ解析装置1(DNA解析システム)を用いれば、既知のSAの境界位置にBPが存在する(陽性)と判定された場合は、そのSAが生じていると判定し、そうでない場合は、そのSAは生じていないと判定する。 (5) Summary As described above, when the sequence data analysis apparatus 1 (DNA analysis system) according to the present embodiment is used, if it is determined that BP exists (positive) at the boundary position of a known SA, the SA If this is not the case, it is determined that the SA has not occurred.
以上の通り、本実施例に係る配列データ解析装置1(DNA解析システム)を用いれば、既知のSAの境界位置にBPが存在する(陽性)と判定された場合は、そのSAが生じていると判定し、そうでない場合は、そのSAは生じていないと判定する。 (5) Summary As described above, when the sequence data analysis apparatus 1 (DNA analysis system) according to the present embodiment is used, if it is determined that BP exists (positive) at the boundary position of a known SA, the SA If this is not the case, it is determined that the SA has not occurred.
[実施例5]
(1)概要
癌に関連して融合遺伝子(GF:gene fusion)が発現している例は多数知られており、GFの融合位置には必ずBPが生じる。そこで、本実施例では、PE方式ではなくシングルエンド(SE)方式で腫瘍サンプルのcDNAシーケンシングを行った場合、腫瘍サンプルの中で既知のGFが発現しているか否かを判定する方法を説明する。 [Example 5]
(1) Outline Many examples are known in which a fusion gene (GF) is expressed in relation to cancer, and BP always occurs at the fusion position of GF. Therefore, in this embodiment, a method for determining whether or not a known GF is expressed in a tumor sample when cDNA sequencing of a tumor sample is performed by the single-ended (SE) method instead of the PE method. To do.
(2)全体構成
本実施例に係るcDNA解析システムの基本構成は実施例1(図1)と同様である。ただし、本実施例では、腫瘍DNAサンプル110の代わりに腫瘍cDNAサンプルを用い、DNAシーケンサ109はSE方式でcDNAのシーケンシングを行う。また、正常サンプル111は不要である。 (2) Overall Configuration The basic configuration of the cDNA analysis system according to this example is the same as that of Example 1 (FIG. 1). However, in this embodiment, a tumor cDNA sample is used instead of thetumor DNA sample 110, and the DNA sequencer 109 performs sequencing of the cDNA by the SE method. Further, the normal sample 111 is not necessary.
本実施例に係るcDNA解析システムの基本構成は実施例1(図1)と同様である。ただし、本実施例では、腫瘍DNAサンプル110の代わりに腫瘍cDNAサンプルを用い、DNAシーケンサ109はSE方式でcDNAのシーケンシングを行う。また、正常サンプル111は不要である。 (2) Overall Configuration The basic configuration of the cDNA analysis system according to this example is the same as that of Example 1 (FIG. 1). However, in this embodiment, a tumor cDNA sample is used instead of the
(3)配列データ解析装置内のデータの流れ
図17を用い、本実施例の用途に配列データ解析装置1を用いる場合のデータの流れを説明する。本実施例の場合、候補配列データAおよびB(1701)は、融合される2つの遺伝子の既知の配列であり、入力部105から配列データ入力部1702を通じて配列データ解析装置1内に取り込まれる。サンプルリード配列1703は、腫瘍cDNAサンプルをSE方式でシーケンスして得られたリード配列データである。以降のデータの流れは、図2で同じ符号を付けられている対応する部分と同一である。 (3) Data Flow in Sequence Data Analysis Device With reference to FIG. 17, the data flow when the sequencedata analysis device 1 is used for the application of this embodiment will be described. In the case of this embodiment, candidate sequence data A and B (1701) are known sequences of two genes to be fused, and are taken into the sequence data analysis apparatus 1 from the input unit 105 through the sequence data input unit 1702. The sample lead sequence 1703 is read sequence data obtained by sequencing a tumor cDNA sample by the SE method. The subsequent flow of data is the same as the corresponding parts denoted by the same reference numerals in FIG.
図17を用い、本実施例の用途に配列データ解析装置1を用いる場合のデータの流れを説明する。本実施例の場合、候補配列データAおよびB(1701)は、融合される2つの遺伝子の既知の配列であり、入力部105から配列データ入力部1702を通じて配列データ解析装置1内に取り込まれる。サンプルリード配列1703は、腫瘍cDNAサンプルをSE方式でシーケンスして得られたリード配列データである。以降のデータの流れは、図2で同じ符号を付けられている対応する部分と同一である。 (3) Data Flow in Sequence Data Analysis Device With reference to FIG. 17, the data flow when the sequence
(4)配列データ解析処理の内容
以下、図18を参照し、本実施例に係る配列データ解析処理の内容を詳細に説明する。本実施例の場合、本実施例の場合、ステップ1801では、配列データ入力部1702により候補配列1701が読み込まれる。ステップ1811とステップ1812では、それぞれ陽性と陰性の判定結果が表示部103に伝えられる。その他の処理は、図3で同じ符号を付けられている対応する部分と同一である。本実施例では、2つの遺伝子の既知配列AおよびB中にそれぞれブレークポイントBPがある(陽性)と判定された場合は、その2つの遺伝子の融合遺伝子が発現していると判定し、そうでない場合は、そのような融合遺伝子は発現していないと判定する。 (4) Contents of Sequence Data Analysis Processing Hereinafter, details of the sequence data analysis processing according to the present embodiment will be described in detail with reference to FIG. In the case of the present embodiment, in the case of the present embodiment, instep 1801, the candidate sequence 1701 is read by the sequence data input unit 1702. In step 1811 and step 1812, positive and negative determination results are transmitted to the display unit 103, respectively. The other processes are the same as the corresponding parts denoted by the same reference numerals in FIG. In this example, when it is determined that there is a breakpoint BP in each of the known sequences A and B of two genes (positive), it is determined that the fusion gene of the two genes is expressed; If so, it is determined that such a fusion gene is not expressed.
以下、図18を参照し、本実施例に係る配列データ解析処理の内容を詳細に説明する。本実施例の場合、本実施例の場合、ステップ1801では、配列データ入力部1702により候補配列1701が読み込まれる。ステップ1811とステップ1812では、それぞれ陽性と陰性の判定結果が表示部103に伝えられる。その他の処理は、図3で同じ符号を付けられている対応する部分と同一である。本実施例では、2つの遺伝子の既知配列AおよびB中にそれぞれブレークポイントBPがある(陽性)と判定された場合は、その2つの遺伝子の融合遺伝子が発現していると判定し、そうでない場合は、そのような融合遺伝子は発現していないと判定する。 (4) Contents of Sequence Data Analysis Processing Hereinafter, details of the sequence data analysis processing according to the present embodiment will be described in detail with reference to FIG. In the case of the present embodiment, in the case of the present embodiment, in
(5)まとめ
以上の通り、本実施例に係る配列データ解析装置1(DNA解析システム)を用いれば、腫瘍サンプルの中で既知のGFが発現しているか否かを判定することができる。 (5) Summary As described above, if the sequence data analysis apparatus 1 (DNA analysis system) according to the present embodiment is used, it can be determined whether or not a known GF is expressed in a tumor sample.
以上の通り、本実施例に係る配列データ解析装置1(DNA解析システム)を用いれば、腫瘍サンプルの中で既知のGFが発現しているか否かを判定することができる。 (5) Summary As described above, if the sequence data analysis apparatus 1 (DNA analysis system) according to the present embodiment is used, it can be determined whether or not a known GF is expressed in a tumor sample.
[他の実施例]
本発明は、上述した実施例に限定されるものでなく、様々な変形例を含んでいる。例えば、図19に示すように、データ解析装置1は、DNAシーケンサ109の機能の一部として実現されても良い。すなわち、DNAシーケンサ109は、データ解析装置1とシーケンシング部1091とで構成されても良い。ここで、シーケンシング部1091は、前述のシーケンシング動作を実行する。 [Other embodiments]
The present invention is not limited to the above-described embodiments, and includes various modifications. For example, as shown in FIG. 19, thedata analysis apparatus 1 may be realized as a part of the function of the DNA sequencer 109. That is, the DNA sequencer 109 may be configured by the data analysis device 1 and the sequencing unit 1091. Here, the sequencing unit 1091 performs the above-described sequencing operation.
本発明は、上述した実施例に限定されるものでなく、様々な変形例を含んでいる。例えば、図19に示すように、データ解析装置1は、DNAシーケンサ109の機能の一部として実現されても良い。すなわち、DNAシーケンサ109は、データ解析装置1とシーケンシング部1091とで構成されても良い。ここで、シーケンシング部1091は、前述のシーケンシング動作を実行する。 [Other embodiments]
The present invention is not limited to the above-described embodiments, and includes various modifications. For example, as shown in FIG. 19, the
なお、上述した実施例は、本発明を分かりやすく説明するために詳細に説明したものであり、必ずしも説明した全ての構成を備える必要はない。また、ある実施例の一部を他の実施例の構成に置き換えることができる。また、ある実施例の構成に他の実施例の構成を加えることもできる。また、各実施例の構成の一部について、他の実施例の構成の一部を追加、削除又は置換することもできる。
The above-described embodiment has been described in detail for easy understanding of the present invention, and it is not always necessary to have all the configurations described. In addition, a part of one embodiment can be replaced with the configuration of another embodiment. Moreover, the structure of another Example can also be added to the structure of a certain Example. In addition, with respect to a part of the configuration of each embodiment, a part of the configuration of another embodiment can be added, deleted, or replaced.
また、上述した各構成、機能、処理部、処理手段等は、それらの一部又は全部を、例えば集積回路で設計する等によりハードウェアで実現しても良い。また、上記の各構成、機能等は、プロセッサがそれぞれの機能を実現するプログラムを解釈し、実行することにより(すなわちソフトウェア的に)実現しても良い。各機能を実現するプログラム、テーブル、ファイル等の情報は、メモリ、ハードディスク、SSD(Solid State Drive)等の記憶装置、又は、ICカード、SDカード、DVD等の記憶媒体に格納することができる。また、制御線や情報線は、説明上必要と考えられるものを示すものであり、製品上必要な全ての制御線や情報線を表すものでない。実際にはほとんど全ての構成が相互に接続されていると考えて良い。
In addition, each of the above-described configurations, functions, processing units, processing means, and the like may be realized by hardware by designing a part or all of them with, for example, an integrated circuit. Each of the above-described configurations, functions, and the like may be realized by the processor interpreting and executing a program that realizes each function (that is, in software). Information such as programs, tables, and files that realize each function can be stored in a storage device such as a memory, a hard disk, or an SSD (Solid State Drive), or a storage medium such as an IC card, an SD card, or a DVD. Control lines and information lines indicate what is considered necessary for the description, and do not represent all control lines and information lines necessary for the product. In practice, it can be considered that almost all components are connected to each other.
1: 配列データ解析装置
108: ゲノム配列サーバ
109: DNAシーケンサ
211: ゲノムマッピング処理部
221:リード配列辞書作成部
231: DP抽出部
233: クラスタリング処理部
235: クラスタ評価部
241: 最小不一致率計算部
244: BP位置推定部
251: 2次元プロット表示出力部
252: 不一致率プロット表示出力部
1702: 候補配列入力部 1: Sequence data analysis device 108: Genome sequence server 109: DNA sequencer 211: Genome mapping processing unit 221: Read sequence dictionary creation unit 231: DP extraction unit 233: Clustering processing unit 235: Cluster evaluation unit 241: Minimum mismatch rate calculation unit 244: BP position estimation unit 251: Two-dimensional plot display output unit 252: Inconsistency rate plot display output unit 1702: Candidate sequence input unit
Claims (20)
- 試料DNA断片のシーケンシングデータを取得するデータ取得部と、
ゲノム参照座標を2次元に配置した2次元ゲノム参照座標に前記シーケンシングデータから得られるリード配列をマッピングして前記試料DNAの解析を行う解析部と
を有することを特徴とするデータ解析装置。 A data acquisition unit for acquiring sequencing data of sample DNA fragments;
A data analysis apparatus comprising: an analysis unit that analyzes the sample DNA by mapping a read sequence obtained from the sequencing data to a two-dimensional genome reference coordinate in which genome reference coordinates are arranged in two dimensions. - 請求項1に記載のデータ解析装置であって、
前記データ取得部は、前記シーケンシングデータとして、ペアエンドのシーケンシングデータを取得し、
前記解析部は、同一種の前記ゲノム参照座標を2次元に配置して前記2次元ゲノム参照座標とする
ことを特徴とするデータ解析装置。 The data analysis apparatus according to claim 1,
The data acquisition unit acquires paired-end sequencing data as the sequencing data,
The analysis unit arranges the genome reference coordinates of the same type in two dimensions to form the two-dimensional genome reference coordinates. - 請求項1に記載のデータ解析装置であって、
前記解析部は、
前記マッピングしたリード配列のクラスタリングによって前記解析を実行する
ことを特徴とするデータ解析装置。 The data analysis apparatus according to claim 1,
The analysis unit
The data analysis apparatus, wherein the analysis is performed by clustering the mapped lead sequences. - 請求項3に記載のデータ解析装置であって、
前記解析部は、
前記クラスタリング内の点の分布に基づいて、前記試料DNAのブレークポイントが存在する前記2次元ゲノム参照座標中の領域を推定する、
ことを特徴とするデータ解析装置。 The data analysis apparatus according to claim 3,
The analysis unit
Estimating a region in the two-dimensional genome reference coordinates where a breakpoint of the sample DNA exists based on a distribution of points in the clustering;
A data analysis apparatus characterized by that. - 請求項4に記載のデータ解析装置であって、
前記領域に含まれる配列に関してリード配列辞書への問合せを行うことで前記ブレークポイントを決定する、
ことを特徴とするデータ解析装置。 The data analysis device according to claim 4,
Determining the breakpoint by querying the lead sequence dictionary for sequences contained in the region;
A data analysis apparatus characterized by that. - 請求項5に記載のデータ解析装置であって、
前記解析部は、
前記問合せでマッチしたリード断片配列の位置を変更して前記領域を走査し、前記領域中の各点の塩基の一致/不一致に基づいて前記配列比較を行うことで前記ブレークポイントを決定する、
ことを特徴とするデータ解析装置。 The data analysis device according to claim 5,
The analysis unit
Scanning the region by changing the position of the lead fragment sequence matched by the query, and determining the breakpoint by performing the sequence comparison based on the base match / mismatch of each point in the region,
A data analysis apparatus characterized by that. - 請求項3に記載のデータ解析装置であって、
前記解析部は、
ペアエンド解析を行って前記シーケンシングデータを参照ゲノム配列と比較することで不整合ペアを抽出し、
前記不整合ペアを構成する2つのリード配列の端点座標を前記2次元ゲノム参照座標の両軸にプロットすることで前記マッピングを実行し、
前記マッピング結果に基づいて前記試料DNAのブレークポイントのゲノム座標位置を判定する
ことを特徴とするデータ解析装置。 The data analysis apparatus according to claim 3,
The analysis unit
Unpaired pairs are extracted by performing paired-end analysis and comparing the sequencing data to a reference genome sequence,
Executing the mapping by plotting the end point coordinates of the two lead sequences constituting the inconsistent pair on both axes of the two-dimensional genome reference coordinates;
A data analysis apparatus, wherein a genome coordinate position of a breakpoint of the sample DNA is determined based on the mapping result. - 請求項7に記載のデータ解析装置であって、
前記解析部は、
前記クラスタ内の複数の不整合ペアの端点が前記2次元ゲノム参照座標において所定角度の向きに並んでプロットされる場合に、前記複数の不整合ペアは共通のブレークポイントに起因すると判定する
ことを特徴とするデータ解析装置。 The data analysis device according to claim 7,
The analysis unit
Determining that the plurality of mismatched pairs are caused by a common breakpoint when the endpoints of the plurality of mismatched pairs in the cluster are plotted side by side at a predetermined angle in the two-dimensional genome reference coordinates. Characteristic data analysis device. - 請求項8に記載のデータ解析装置であって、
前記所定角度が45度である、ことを特徴とするデータ解析装置。 The data analysis apparatus according to claim 8, wherein
The data analysis apparatus characterized in that the predetermined angle is 45 degrees. - 請求項9に記載のデータ解析装置であって、
前記解析部は、
前記45度の向きに並んだ複数の不整合ペアに対応する座標端点のそれぞれに対して、サンプルDNAの断片長に相当する所定の距離だけ離れる斜め45度方向にある候補点を計算し、前記候補点が存在する領域に前記ブレークポイントが存在すると判定する
ことを特徴とするデータ解析装置。 The data analysis device according to claim 9, wherein
The analysis unit
For each of the coordinate end points corresponding to the plurality of mismatched pairs arranged in the 45 degree direction, a candidate point in the oblique 45 degree direction separated by a predetermined distance corresponding to the fragment length of the sample DNA is calculated, A data analysis apparatus characterized by determining that the breakpoint exists in an area where a candidate point exists. - 請求項8に記載のデータ解析装置であって、
前記解析部は、
ランダムに与えた点が前記所定角度に並んでプロットされる確率に基づいて前記判定の精度を算出する
ことを特徴とするデータ解析装置。 The data analysis apparatus according to claim 8, wherein
The analysis unit
A data analysis apparatus, wherein the accuracy of the determination is calculated based on a probability that randomly given points are plotted alongside the predetermined angle. - 請求項7に記載のデータ解析装置であって、
前記解析部は、
インサート長以上離れた前記端点座標を分離して前記クラスタリングを行う
ことを特徴とするデータ解析装置。 The data analysis device according to claim 7,
The analysis unit
The data analysis apparatus characterized by performing the clustering by separating the end point coordinates separated by an insert length or more. - 請求項3に記載のデータ解析装置であって、
前記解析部は、
前記クラスタを構成するそれぞれのリード配列が主要組織サンプル由来か正常組織サンプル由来かを判定し、前記判定結果に基づいて前記ブレークポイントが腫瘍特異的であるクラスタを抽出する
ことを特徴とするデータ解析装置。 The data analysis apparatus according to claim 3,
The analysis unit
A data analysis characterized by determining whether each lead sequence constituting the cluster is derived from a main tissue sample or a normal tissue sample, and extracting a cluster in which the breakpoint is tumor-specific based on the determination result apparatus. - 請求項1に記載のデータ解析装置であって、
前記マッピング結果及び前記解析結果を表示する表示部を更に有する
ことを特徴とするデータ解析装置。 The data analysis apparatus according to claim 1,
A data analysis apparatus further comprising a display unit for displaying the mapping result and the analysis result. - 請求項1に記載のデータ解析装置であって、
前記解析部は、前記シーケンスデータでペアをなすリードの1次元ゲノム参照座標での位置情報を生成し、1次元ゲノム参照座標を2次元に配置した2次元平面で前記位置情報を分析して、前記試料DNAの解析を行う
ことを特徴とするデータ解析装置。 The data analysis apparatus according to claim 1,
The analysis unit generates position information in a one-dimensional genome reference coordinate of a lead paired with the sequence data, analyzes the position information in a two-dimensional plane in which the one-dimensional genome reference coordinate is arranged in two dimensions, A data analysis apparatus for analyzing the sample DNA. - 試料DNA断片をシーケンシングし、シーケンシング結果をシーケンシングデータとして出力するDNAシーケンサ装置と、
前記シーケンシングデータを取得するデータ取得部と、ゲノム参照座標を2次元に配置した2次元ゲノム参照座標に前記シーケンシングデータから得られるリード配列をマッピングして前記試料DNAの解析を行う解析部とを有するデータ解析装置と、
を有するDNA解析システム。 A DNA sequencer device for sequencing sample DNA fragments and outputting the sequencing results as sequencing data;
A data acquisition unit for acquiring the sequencing data, and an analysis unit for analyzing the sample DNA by mapping a read sequence obtained from the sequencing data to a two-dimensional genome reference coordinate in which genome reference coordinates are arranged in two dimensions A data analysis device having
DNA analysis system comprising: - 請求項16に記載のデータ解析システムであって、
前記データ取得部は、前記シーケンシングデータとして、ペアエンドのシーケンシングデータを取得し、
前記解析部は、同一種の前記ゲノム参照座標を2次元に配置して前記2次元ゲノム参照座標とする
ことを特徴とするデータ解析システム。 The data analysis system according to claim 16, comprising:
The data acquisition unit acquires paired-end sequencing data as the sequencing data,
The data analysis system, wherein the analysis unit arranges the genome reference coordinates of the same type in two dimensions to serve as the two-dimensional genome reference coordinates. - 請求項16に記載のデータ解析システムであって、
前記解析部は、前記マッピングしたリード配列のクラスタリングによって前記解析を実行する
ことを特徴とするデータ解析システム。 The data analysis system according to claim 16, comprising:
The data analysis system, wherein the analysis unit performs the analysis by clustering the mapped lead sequences. - 請求項16に記載のデータ解析システムであって、
前記解析部は、前記シーケンスデータでペアをなすリードの1次元ゲノム参照座標での位置情報を生成し、1次元ゲノム参照座標を2次元に配置した2次元平面で前記位置情報を分析して、前記試料DNAの解析を行う
ことを特徴とするデータ解析システム。 The data analysis system according to claim 16, comprising:
The analysis unit generates position information in a one-dimensional genome reference coordinate of a lead paired with the sequence data, analyzes the position information in a two-dimensional plane in which the one-dimensional genome reference coordinate is arranged in two dimensions, A data analysis system for analyzing the sample DNA. - 記憶部と演算部を有する計算機が、
試料DNA断片のシーケンシングデータを取得する処理と、
ゲノム参照座標を2次元に配置した2次元ゲノム参照座標に前記シーケンシングデータから得られるリード配列をマッピングして前記試料DNAの解析を行う処理と
を実行することを特徴とするデータ解析方法。 A computer having a storage unit and a calculation unit
Processing to obtain sequencing data of sample DNA fragments;
And a process of analyzing the sample DNA by mapping a read sequence obtained from the sequencing data to a two-dimensional genome reference coordinate in which genome reference coordinates are arranged two-dimensionally.
Priority Applications (1)
| Application Number | Priority Date | Filing Date | Title |
|---|---|---|---|
| PCT/JP2015/056964 WO2016143062A1 (en) | 2015-03-10 | 2015-03-10 | Sequence data analyzer, dna analysis system and sequence data analysis method |
Applications Claiming Priority (1)
| Application Number | Priority Date | Filing Date | Title |
|---|---|---|---|
| PCT/JP2015/056964 WO2016143062A1 (en) | 2015-03-10 | 2015-03-10 | Sequence data analyzer, dna analysis system and sequence data analysis method |
Publications (1)
| Publication Number | Publication Date |
|---|---|
| WO2016143062A1 true WO2016143062A1 (en) | 2016-09-15 |
Family
ID=56878864
Family Applications (1)
| Application Number | Title | Priority Date | Filing Date |
|---|---|---|---|
| PCT/JP2015/056964 WO2016143062A1 (en) | 2015-03-10 | 2015-03-10 | Sequence data analyzer, dna analysis system and sequence data analysis method |
Country Status (1)
| Country | Link |
|---|---|
| WO (1) | WO2016143062A1 (en) |
Cited By (1)
| Publication number | Priority date | Publication date | Assignee | Title |
|---|---|---|---|---|
| CN110660451A (en) * | 2018-06-13 | 2020-01-07 | 广州华大基因医学检验所有限公司 | Method, equipment and application for determining whether fusion gene exists in biological sample |
Citations (4)
| Publication number | Priority date | Publication date | Assignee | Title |
|---|---|---|---|---|
| US20120197533A1 (en) * | 2010-10-11 | 2012-08-02 | Complete Genomics, Inc. | Identifying rearrangements in a sequenced genome |
| JP2014502513A (en) * | 2011-01-14 | 2014-02-03 | キージーン・エン・フェー | Genotyping based on paired-end random sequences |
| WO2014132497A1 (en) * | 2013-02-28 | 2014-09-04 | 株式会社日立ハイテクノロジーズ | Data analysis device and method therefor |
| JP2014533858A (en) * | 2011-11-18 | 2014-12-15 | ザ・リージェンツ・オブ・ザ・ユニバーシティー・オブ・カリフォルニアThe Regents Of The University Of California | BAMBAM: Parallel comparative analysis of high-throughput sequencing data |
-
2015
- 2015-03-10 WO PCT/JP2015/056964 patent/WO2016143062A1/en active Application Filing
Patent Citations (4)
| Publication number | Priority date | Publication date | Assignee | Title |
|---|---|---|---|---|
| US20120197533A1 (en) * | 2010-10-11 | 2012-08-02 | Complete Genomics, Inc. | Identifying rearrangements in a sequenced genome |
| JP2014502513A (en) * | 2011-01-14 | 2014-02-03 | キージーン・エン・フェー | Genotyping based on paired-end random sequences |
| JP2014533858A (en) * | 2011-11-18 | 2014-12-15 | ザ・リージェンツ・オブ・ザ・ユニバーシティー・オブ・カリフォルニアThe Regents Of The University Of California | BAMBAM: Parallel comparative analysis of high-throughput sequencing data |
| WO2014132497A1 (en) * | 2013-02-28 | 2014-09-04 | 株式会社日立ハイテクノロジーズ | Data analysis device and method therefor |
Cited By (2)
| Publication number | Priority date | Publication date | Assignee | Title |
|---|---|---|---|---|
| CN110660451A (en) * | 2018-06-13 | 2020-01-07 | 广州华大基因医学检验所有限公司 | Method, equipment and application for determining whether fusion gene exists in biological sample |
| CN110660451B (en) * | 2018-06-13 | 2023-04-28 | 广州华大基因医学检验所有限公司 | Method, device and application for determining whether fusion genes exist in biological sample |
Similar Documents
| Publication | Publication Date | Title |
|---|---|---|
| US11702708B2 (en) | Systems and methods for analyzing viral nucleic acids | |
| Deshpande et al. | Exploring the landscape of focal amplifications in cancer using AmpliconArchitect | |
| Cameron et al. | GRIDSS: sensitive and specific genomic rearrangement detection using positional de Bruijn graph assembly | |
| US10783984B2 (en) | De novo diploid genome assembly and haplotype sequence reconstruction | |
| Walker et al. | Pilon: an integrated tool for comprehensive microbial variant detection and genome assembly improvement | |
| Alioto et al. | A comprehensive assessment of somatic mutation detection in cancer using whole-genome sequencing | |
| US10262102B2 (en) | Systems and methods for genotyping with graph reference | |
| Zerbino et al. | Velvet: algorithms for de novo short read assembly using de Bruijn graphs | |
| Goubert et al. | A beginner’s guide to manual curation of transposable elements | |
| Chu et al. | REPdenovo: inferring de novo repeat motifs from short sequence reads | |
| Liu et al. | CUSHAW3: sensitive and accurate base-space and color-space short-read alignment with hybrid seeding | |
| US20120197533A1 (en) | Identifying rearrangements in a sequenced genome | |
| US10810239B2 (en) | Sequence data analyzer, DNA analysis system and sequence data analysis method | |
| US20150286775A1 (en) | String graph assembly for polyploid genomes | |
| US20150169823A1 (en) | String graph assembly for polyploid genomes | |
| Kremer et al. | Approaches for in silico finishing of microbial genome sequences | |
| KR20140006846A (en) | Data analysis of dna sequences | |
| Kearse et al. | The Geneious 6.0. 3 read mapper | |
| Jin et al. | Quickly identifying identical and closely related subjects in large databases using genotype data | |
| Connor et al. | Towards increased accuracy and reproducibility in SARS-CoV-2 next generation sequence analysis for public health surveillance | |
| WO2016143062A1 (en) | Sequence data analyzer, dna analysis system and sequence data analysis method | |
| Swiercz et al. | GRASShopPER—An algorithm for de novo assembly based on GPU alignments | |
| Ouchi et al. | GreenHill: a de novo chromosome-level scaffolding and phasing tool using Hi-C | |
| Jiang et al. | Long-read based novel sequence insertion detection with rCANID | |
| Dewey | Whole-genome alignments and polytopes for comparative genomics |
Legal Events
| Date | Code | Title | Description |
|---|---|---|---|
| 121 | Ep: the epo has been informed by wipo that ep was designated in this application |
Ref document number: 15884554 Country of ref document: EP Kind code of ref document: A1 |
|
| NENP | Non-entry into the national phase |
Ref country code: DE |
|
| 122 | Ep: pct application non-entry in european phase |
Ref document number: 15884554 Country of ref document: EP Kind code of ref document: A1 |
|
| NENP | Non-entry into the national phase |
Ref country code: JP |