WO2016136766A1 - 核酸配列増幅方法 - Google Patents
核酸配列増幅方法 Download PDFInfo
- Publication number
- WO2016136766A1 WO2016136766A1 PCT/JP2016/055314 JP2016055314W WO2016136766A1 WO 2016136766 A1 WO2016136766 A1 WO 2016136766A1 JP 2016055314 W JP2016055314 W JP 2016055314W WO 2016136766 A1 WO2016136766 A1 WO 2016136766A1
- Authority
- WO
- WIPO (PCT)
- Prior art keywords
- sequence
- primer
- nucleic acid
- acid sequence
- additional nucleic
- Prior art date
- Legal status (The legal status is an assumption and is not a legal conclusion. Google has not performed a legal analysis and makes no representation as to the accuracy of the status listed.)
- Ceased
Links
Images






Classifications
-
- C—CHEMISTRY; METALLURGY
- C12—BIOCHEMISTRY; BEER; SPIRITS; WINE; VINEGAR; MICROBIOLOGY; ENZYMOLOGY; MUTATION OR GENETIC ENGINEERING
- C12Q—MEASURING OR TESTING PROCESSES INVOLVING ENZYMES, NUCLEIC ACIDS OR MICROORGANISMS; COMPOSITIONS OR TEST PAPERS THEREFOR; PROCESSES OF PREPARING SUCH COMPOSITIONS; CONDITION-RESPONSIVE CONTROL IN MICROBIOLOGICAL OR ENZYMOLOGICAL PROCESSES
- C12Q1/00—Measuring or testing processes involving enzymes, nucleic acids or microorganisms; Compositions therefor; Processes of preparing such compositions
- C12Q1/68—Measuring or testing processes involving enzymes, nucleic acids or microorganisms; Compositions therefor; Processes of preparing such compositions involving nucleic acids
- C12Q1/6806—Preparing nucleic acids for analysis, e.g. for polymerase chain reaction [PCR] assay
-
- C—CHEMISTRY; METALLURGY
- C12—BIOCHEMISTRY; BEER; SPIRITS; WINE; VINEGAR; MICROBIOLOGY; ENZYMOLOGY; MUTATION OR GENETIC ENGINEERING
- C12Q—MEASURING OR TESTING PROCESSES INVOLVING ENZYMES, NUCLEIC ACIDS OR MICROORGANISMS; COMPOSITIONS OR TEST PAPERS THEREFOR; PROCESSES OF PREPARING SUCH COMPOSITIONS; CONDITION-RESPONSIVE CONTROL IN MICROBIOLOGICAL OR ENZYMOLOGICAL PROCESSES
- C12Q1/00—Measuring or testing processes involving enzymes, nucleic acids or microorganisms; Compositions therefor; Processes of preparing such compositions
- C12Q1/68—Measuring or testing processes involving enzymes, nucleic acids or microorganisms; Compositions therefor; Processes of preparing such compositions involving nucleic acids
- C12Q1/6844—Nucleic acid amplification reactions
- C12Q1/6851—Quantitative amplification
-
- C—CHEMISTRY; METALLURGY
- C12—BIOCHEMISTRY; BEER; SPIRITS; WINE; VINEGAR; MICROBIOLOGY; ENZYMOLOGY; MUTATION OR GENETIC ENGINEERING
- C12Q—MEASURING OR TESTING PROCESSES INVOLVING ENZYMES, NUCLEIC ACIDS OR MICROORGANISMS; COMPOSITIONS OR TEST PAPERS THEREFOR; PROCESSES OF PREPARING SUCH COMPOSITIONS; CONDITION-RESPONSIVE CONTROL IN MICROBIOLOGICAL OR ENZYMOLOGICAL PROCESSES
- C12Q1/00—Measuring or testing processes involving enzymes, nucleic acids or microorganisms; Compositions therefor; Processes of preparing such compositions
- C12Q1/68—Measuring or testing processes involving enzymes, nucleic acids or microorganisms; Compositions therefor; Processes of preparing such compositions involving nucleic acids
-
- C—CHEMISTRY; METALLURGY
- C12—BIOCHEMISTRY; BEER; SPIRITS; WINE; VINEGAR; MICROBIOLOGY; ENZYMOLOGY; MUTATION OR GENETIC ENGINEERING
- C12Q—MEASURING OR TESTING PROCESSES INVOLVING ENZYMES, NUCLEIC ACIDS OR MICROORGANISMS; COMPOSITIONS OR TEST PAPERS THEREFOR; PROCESSES OF PREPARING SUCH COMPOSITIONS; CONDITION-RESPONSIVE CONTROL IN MICROBIOLOGICAL OR ENZYMOLOGICAL PROCESSES
- C12Q1/00—Measuring or testing processes involving enzymes, nucleic acids or microorganisms; Compositions therefor; Processes of preparing such compositions
- C12Q1/68—Measuring or testing processes involving enzymes, nucleic acids or microorganisms; Compositions therefor; Processes of preparing such compositions involving nucleic acids
- C12Q1/6844—Nucleic acid amplification reactions
- C12Q1/686—Polymerase chain reaction [PCR]
-
- C—CHEMISTRY; METALLURGY
- C12—BIOCHEMISTRY; BEER; SPIRITS; WINE; VINEGAR; MICROBIOLOGY; ENZYMOLOGY; MUTATION OR GENETIC ENGINEERING
- C12Q—MEASURING OR TESTING PROCESSES INVOLVING ENZYMES, NUCLEIC ACIDS OR MICROORGANISMS; COMPOSITIONS OR TEST PAPERS THEREFOR; PROCESSES OF PREPARING SUCH COMPOSITIONS; CONDITION-RESPONSIVE CONTROL IN MICROBIOLOGICAL OR ENZYMOLOGICAL PROCESSES
- C12Q1/00—Measuring or testing processes involving enzymes, nucleic acids or microorganisms; Compositions therefor; Processes of preparing such compositions
- C12Q1/68—Measuring or testing processes involving enzymes, nucleic acids or microorganisms; Compositions therefor; Processes of preparing such compositions involving nucleic acids
- C12Q1/6869—Methods for sequencing
- C12Q1/6874—Methods for sequencing involving nucleic acid arrays, e.g. sequencing by hybridisation
Definitions
- the present invention relates to a nucleic acid sequence amplification method for preparing a sample for quantifying mRNA using a next-generation sequencer, in particular, a next-generation sequencer at a small number of cells, preferably at a single cell level.
- the present invention relates to a nucleic acid sequence amplification method that enables quantitative analysis of mRNA.
- Quantitative transcriptome analysis in single cells is an important tool for embryology, stem cell and cancer research.
- it is necessary to amplify cDNA produced by reverse transcription of mRNA in the single cell, and two methods are proposed as this amplification method.
- One is an amplification method by PCR, and the other is an amplification method by T7 RNA polymerase.
- PCR is used, the amplification efficiency is high, and it is a simple and highly stable method, so it is very useful for transcriptome analysis of a single cell.
- RNA-seq RNA sequencing
- Non-Patent Documents 6 to 10 In order to proceed with absolute quantification of transcripts, single molecule identification (UMI) in which a tag is attached to the 5 'side or 3' side of the first cDNA is performed (Non-Patent Documents 6 to 10). In addition, a method of analyzing by recognizing individual cells by a barcode sequence, a method of capturing a single cell by a microchannel, and the like have been proposed (Non-patent Documents 11 and 12).
- RNA-seq is often accompanied by PCR amplification as described above, but PCR does not have a 100% amplification rate, so the reproducibility of the copy number after amplification is particularly small when amplified from a small number of copies. bad.
- PCR does not have a 100% amplification rate, so the reproducibility of the copy number after amplification is particularly small when amplified from a small number of copies. bad.
- the analysis unit price per cell is high, so it is difficult to analyze many cells.
- the sample obtained by the conventional nucleic acid sequence amplification method is intended for the full length of cDNA, the longer the cDNA, the lower the quantitativeness of mRNA analysis using the next-generation sequencer.
- a method for amplifying a nucleic acid sequence for preparing a sample with higher quantitativeness at low cost is required.
- the following method is used to amplify cDNA using the poly-A sequence of mRNA, and after further fragmenting, a primer sequence is selectively added, so that only the 3 ′ end is added.
- a sample containing was successfully obtained.
- SC3-seq Single-cell-mRNA- 3'end-sequence
- the present invention relates to the following: [1] A method for preparing a nucleic acid population containing an amplification product retaining a relative relationship between gene expression levels in a biological sample,
- A A double-stranded DNA composed of an arbitrary additional nucleic acid sequence X, a poly T sequence, an mRNA sequence isolated from a biological sample, a poly A sequence and an optional additional nucleic acid sequence Y as a template, 5 'Includes a first primer, optionally containing an additional nucleic acid sequence X with an amine added, and optionally further comprising a poly T sequence downstream thereof; and an optional additional nucleic acid sequence Y, optionally comprising a poly Amplifying the double-stranded DNA using a second primer that may further comprise a T sequence;
- B a step of fragmenting the double-stranded DNA obtained by the step (a),
- C phosphorylating the 5 ′ end of the fragmented duplex DNA obtained by the step (b),
- D A method for
- a method comprising a step of amplifying the double-stranded DNA using a good fifth primer.
- the strand DNA is prepared by a method comprising the following steps: (I) a step of preparing primary strand cDNA by reverse transcription using mRNA isolated from a biological sample as a template and a sixth primer comprising said additional nucleic acid sequence Y and poly T sequence; (Ii) The primary strand cDNA obtained in the step (i) is subjected to a poly A tailing reaction, and a secondary primer is then used as a template using a seventh primer comprising the additional nucleic acid sequence X and the poly T sequence.
- a step of preparing a double-stranded DNA as a strand, and (iii) the double-stranded DNA obtained by the step (ii) contains the additional nucleic acid sequence X and optionally further contains a poly T sequence downstream thereof.
- Amplifying using a good eighth primer and a ninth primer which contains the additional nucleic acid sequence Y and optionally further may contain a poly T sequence downstream thereof.
- the step (c) further includes a step of selecting a fragmented double-stranded DNA having a size of 200 to 250 bases or 300 to 350 bases.
- the method according to claim 1. [6] The method according to any one of [1] to [5], wherein in step (a), amplification is performed by PCR of 2 to 8 cycles.
- step (f) The method according to any one of [1] to [6], wherein in step (f), the amplification is performed by PCR of 5 to 20 cycles.
- the step (iii) the amplification is performed by PCR of 5 to 30 cycles.
- a kit for preparing a cDNA population to be applied to the measurement of the amount of mRNA by a next-generation sequencer including: (A) a first primer that includes an optional additional nucleic acid sequence X with an amine added to the 5 ′ end and optionally further includes a poly-T sequence downstream thereof; (b) includes an optional additional nucleic acid sequence Y; A second primer that may further comprise a poly-T sequence downstream thereof (c) may comprise any additional nucleic acid sequence Z and said additional nucleic acid sequence Y in this order, optionally further comprising a poly-T sequence downstream thereof Third primer (d) Double-stranded DNA containing an arbitrary sequence V having thymine (T) as an overhang at the 3 ′ end (E) a fourth primer comprising the sequence V; (f) a fifth primer comprising the additional nucleic acid sequence Z and optionally further comprising the additional nucleic acid sequence Y downstream thereof [14] of (f) The kit according to [13], wherein the fifth primer further
- the present invention provides a reliable, quantitative, and extremely small amount of cDNA amplification technology that can be directly applied to oligonucleotide microarrays by a simple PCR method.
- the method of the present invention it is possible to synthesize and amplify a sufficient amount of template cDNA from a single cell for a microarray experiment in one day experiment.
- Comparison between the conventional method and the method of the present invention was performed using real-time PCR experiments using several gene products as probes, and it was confirmed that both systematic error (systematic error) and random error were remarkably improved. It was done.
- transcriptome analysis experiments conducted using the method of the present invention it was confirmed that quantitative analysis at the single cell level with much better reproducibility was possible than the conventional method. It was.
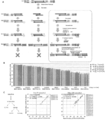
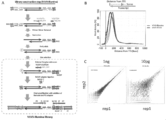
- FIG. 1A shows a conceptual diagram of SC3-seq.
- SC3-seq means that only the 3 'end side indicated by the broken line frame in the figure is to be analyzed.
- FIG. 1B shows a graph in which genes encoding 21,254 proteins annotated in the mouse mm10 database are arranged according to the length of the transcript (left figure).
- the right figure is a graph showing that when the total length of all transcripts is 60 Mbp, the total of 200 bp from the 3 'end of all transcripts is only 4 Mbp.
- FIG. 1C shows the SC3-seq scheme.
- the left figure shows the steps of cDNA synthesis and amplification, and the right figure shows the steps of library construction.
- FIG. 1A shows a conceptual diagram of SC3-seq.
- FIG. 1B shows a graph in which genes encoding 21,254 proteins annotated in the mouse mm10 database are arranged according to the length of the transcript (left figure).
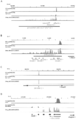
- 1D is a graph plotting average SC3-seq tracks (read density (RPM, ⁇ 1,000 reads) against the position of reads from the annotated TTS (transcription termination site) at 100 ng of RNA extracted from mESC.
- the red line indicates the track of the lead mapped with the sense strand
- the blue line indicates the track of the lead mapped with the antisense strand
- Fig. IE shows SC3 of the Pou5f1 and Nanog loci.
- -seq indicates the position of the lead
- the red peak indicates the lead mapped with the sense strand
- the blue peak indicates the lead mapped with the antisense strand
- FIG. 1G shows the number of genes (black bars) or the number of mis-annotated genes due to the expanded definition of TTS.
- the number of genes more than twice the definition of TTS expanded to 10 Kb ( ⁇ 2, ⁇ in Fig. 1F) 205 genes presenting 3, x 4) were detected by comparison with published RNA-seq data for the correct number of genes or mis-annotated genes.
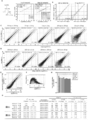
- Fig. 2A shows the amplified cDNA expressed by Q-PCR (CT value) for each SC3-seq [log 2 (RPM + 1)] (1 ng before SC3-seq library construction (middle)).
- FIG. 2B shows the amount of ERCC RNA and SC3-seq [SC 2 -seq [log 2 (RPM + 1)] in dilutions of total mESC RNA (MS01T01 and MS01T17, 100 ng and 10 pg, respectively). log 2 (RPM + 1)] is a graph showing the relationship between the level. SC3-seq data for ERCC spike-in RNA with more than 10 copies per 10 pg was used for the regression line.
- FIG. 1 shows the amount of ERCC RNA and SC3-seq [SC 2 -seq [log 2 (RPM + 1)] in dilutions of total mESC RNA (MS01T01 and MS01T17, 100 ng and 10 pg, respectively). log 2 (RPM + 1)] is a graph showing the relationship between the level. SC3-seq data for ERCC spike-in RNA with more than 10 copies per 10 pg was used for the regression line.
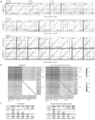
- 2C is a scatter plot showing a comparison between two independently amplified replicates from 100 ng, 10 ng, 1 ng, 100 pg and 10 pg of total mESC RNA.
- white and yellow regions indicate expression levels with a difference of 2 and 4 times, respectively.
- the number of copies per 10 pg total RNA detected by SC3-seq read of ERCC spike-in RNA in 100 ng RNA is indicated by a dotted line (vertical line) (from the right, 1,000 copies, 100 copies, 10 copies and 1 copy).
- 2D is a scatter plot showing a comparison between replicates from 10 ng, 1 ng, 100 pg, and 10 pg of total RNA of mESC and replicates from 100 ng of total RNA.
- white and yellow regions indicate expression levels with a difference of 2 and 4 times, respectively.
- the number of copies per 10 pg total RNA detected by SC3-seq read of ERCC spike-in RNA in 100 ng RNA is indicated by a dotted line (vertical line) (from the right, 1,000 copies, 100 copies, 10 copies and 1 copy).
- FIG. 2E shows a scatter plot comparing 100 ng average SC3-seq data (log 2 (RPM + 1)) of total RNA of mESC with average SC3-seq data of 10 pg total RNA.
- white and yellow regions indicate expression levels with a difference of 2 and 4 times, respectively.
- the number of copies per 10 pg total RNA detected by SC3-seq read of ERCC spike-in RNA in 100 ng RNA is indicated by a dotted line (vertical line) (from the right, 1,000 copies, 100 copies, 10 copies and 1 copy).
- FIG. 2F is a graph plotting standard deviation of gene expression level against gene expression level by SC3-seq in 8 10 pg RNA samples. Fig.
- FIG. 2G shows genes with minimum (min) and maximum (max) correlation coefficients (R 2 ) and differential expression of 2-fold and 4-fold (all gene expression and genes expressed over 20 copies per 10 pg) The relationship which compared the percentage of is shown.
- FIG. 2H is a graph showing the total number of mRNA molecules per 10 pg RNA calculated from the copy number of ERCC spike-in RNA in 100 ng, 10 ng, 1 ng, 100 pg and 10 pg mESC total RNA.
- FIG. 3A is a graph showing SC3-seq coverage from 10 pg total RNA as a function of expression level (log 2 (RPM + 1)) in 100 ng total RNA. The black line shows the average value of coverage in a single sample convolution.
- FIG. 3B is a graph showing the accuracy (Accuracy) of SC3-seq from 10 pg total RNA as a function of expression level (log 2 (RPM + 1)). The black line shows the average value of accuracy in a single sample.
- FIG. 3C shows 100 ng, 10 ng, 1 ng, 100 gene counts (log 2 (RPM + 1) ⁇ 4, ⁇ 2 times compared to the gene expression level determined by full-length reads) as the function of reads.
- FIG. 5 is a graph plotted for each SC3-seq from total RNA of pg and 10 pg mESC.
- Figure 3D shows 10 pg of mESC total RNA as a function of read, as a percentage ( ⁇ 2 fold compared to gene expression levels determined by full length reads) classified by the range of expression levels in 100 ng total RNA. Is a graph plotted for each SC3-seq.
- FIG. 1 shows 10 pg of mESC total RNA as a function of read, as a percentage ( ⁇ 2 fold compared to gene expression levels determined by full length reads) classified by the range of expression levels in 100 ng total RNA.
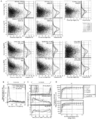
- 4A shows SC3-seq (100 ng (1 replication, MS01T01), 10 ng (1 replication, MS01T05) and 10 pg (1 replication, MS01T17)) diluted samples from total RNA and single Diluted sample from total RNA of HEK293 with 1 mESC (MS04T18) and single human ESC (MS04T66)), Smart-seq2 (1 ng (Smart-seq2_1ng, HEK_rep1) and 10 pg (Smart-seq2_10 pg, HEK_rep1) , And single mESC and single mouse embryonic fibroblasts (Smart-seq2_MEF, single replication)) and single cell RNA-seq (single human ESC (Yan_hESC_1) and full-length RNA- This is a graph plotting the expression level detected by seq (Ohta_mESC and Ohta_MEF) and the length of the transcript.The expression level by SC3-seq is expressed
- Fig. 4C is a graph showing the distribution of reads mapped at the 3 'end of transcripts by RNA-seq by cells
- Fig. 4C shows the mapping by length of transcripts by RNA-seq by three single cells.
- 4D shows all three single-cell RNA-seq methods (above) and short transcripts (less than 1 Kbp, 913 and 832 genes in mouse and human, respectively) ) (Below) detection limit (in mouse and human, gene expression levels higher than 6655th and 6217th, respectively (1/4 of all transcripts annotated for mouse and human), ⁇ log 2 RPM ⁇ 3.69 ⁇ 0.05 (SC3-seq), ⁇ log 2 FPKM ⁇ 2.21 ⁇ 1.28 (Yan et al.), And ⁇ log 2 FPKM ⁇ 2.92 ⁇ 0.27 (Picelli et al.), Compared to gene expression level by full length read And ⁇ 2 times) That.
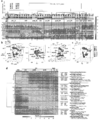
- FIGS. 5A and B show Unsupervised hierarchical clustering (UHC) (FIG. 5A) and epiblasts, primitive endoderm (PE) with all expressed genes (log 2 (RPM + 1) ⁇ 4, 12,010 genes in all samples)
- FIG. 5B shows a heat map (FIG. 5B) of expression levels of marker genes for trophectoderm (TE).
- Annotated cell types epiblast, PE, polar TE and wall TE were defined by classification, location and marker gene expression.
- FIG. 5C shows the results of the principal component analysis (PCA) of the cells with all the expressed genes. Shown as an expanded view on PC1 and PC2 (top) or PC1 and PC3 (bottom).
- 5D is a graph plotting the difference in mean gene expression between epiblast (9 samples) and PE (9 samples) (left) and between mTE (9 samples) and pTE (10 samples) (right). is there.
- the difference in gene expression indicates a difference of 4 times or more in one cell type having an average log 2 (RPM + 1) ⁇ 4.
- the genes whose expression is elevated in PE (504 gene), epiblast (309 gene), pTE (231 gene) and mTE (391 gene) are shown in blue, green, yellow and red, respectively.
- FIG. 5E is a graph showing the expression of genes whose expression is increased in mTE (left figure) or pTE (right figure) among the four cell types. In the figure, the bar in the box indicates the average expression level.
- FIG. 1 is a graph plotting the difference in mean gene expression between epiblast (9 samples) and PE (9 samples) (left) and between mTE (9 samples) and pTE (10 samples) (right). is there.
- the difference in gene expression indicates a difference of 4 times
- FIG. 5F shows the results of Gene ontology (GO) analysis of genes whose expression is increased by mTE (upper panel) or pTE (lower panel).
- FIG. 5G is a graph showing the average gene expression level calculated based on the copy number of ERCC spike-in RNA in four cell types. In the figure, the bar in the box indicates the average expression level.
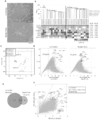
- FIG. 6A shows hiPSC colonies (585B1) cultured on SNL feeder cells (top figure) and phase contrast microscopic images of the same cells cultured on feeder-free conditions.
- FIG. 6B shows a heat map of UHC results and gene expression levels for all expressed genes (log 2 (RPM + 1) ⁇ 4, 12,406 genes in all samples).
- FIG. 6C shows the PCA results for all cells with all genes expressed.
- FIG. 6D shows hiPSC gene expression on feeder cells (left) and feeder-free conditions (right) with the maximum expression level in each group (MS04T72, MS04T67 and MS04T78 in FIG. 6C) with standard deviation (SD). The graph plotted against is shown. Genes with maximum gene expression levels of ⁇ 6 and SD of ⁇ 2 were defined as heterogeneously expressed genes (699 genes for hiPSC cultured on feeder cells, 61 genes for hiPSC in feeder-free conditions).
- FIG. 6E shows a Venn diagram representing the relationship of heterogeneously expressed genes in FIG. 6D.
- FIG. 6F shows a graph plotting SD values of gene expression levels in hiPSCs cultured on feeder cells and hiPSCs in feeder-free conditions.
- FIG. 7A shows a schematic diagram of the mechanism that allows library construction at the 3 'end with SC3-seq. 3 shows that after fragmentation, three fragments are generated: a fragment having a V3 tag at the 5 ′ end, a fragment having no tag, and a fragment having a V1 tag. All of these are polished and shown to be phosphorylated at the blunt end.
- the Int sequence is added only to the fragment having the 3 'end to which the V1 tag is added.
- FIG. 7B shows the results of Q-PCR of the amplification levels of ERCC spike-in RNA amplified from 100 ng, 10 ng, 1 ng, 100 pg, and 10 pg of ESC total RNA. The number of copies per 10 pg RNA and the corresponding ERCC code are shown.
- FIG. 7C shows the expression level (Q-PCR CT value) and SC3 ⁇ of the amplified cDNA (V1V3 cDNA from total RNA of 1 ng (middle, 4 samples) and 10 pg (right, 16 samples)).
- the graph which compared the expression level (CT value of Q-PCR) of a seq library is shown (it was set as MS01T05 and MS01T17 with respect to 1 ng and 10 pg of total RNA, respectively).
- the left figure shows a conceptual diagram of the comparison method.
- FIG. 8A shows the detection of reads at the Let7a-7d locus.
- FIG. 8B shows the detection of reads at the Mir290-295 locus.
- Non-coding D7Ertd143e represents the precursor of Mir290-295.
- the upper panel shows the mapping with the sense strand of SC3-seq
- the middle panel shows the mapping with the antisense strand of SC3-seq
- the lower panel shows the mapping with Ohta et al.
- FIG. 8C shows detection of reads at the Mir684-1 locus.
- a single miRNA is encoded in the intron of the gene encoding Dusp19.
- the upper panel shows the mapping with the sense strand of SC3-seq
- the middle panel shows the mapping with the antisense strand of SC3-seq
- the lower panel shows the mapping with Ohta et al.
- FIG. 8D shows detection of unclassified noncoding RNA (Gm19693) reads. Annotated with the reverse strand at the 3 'end of H2afz.
- the upper panel shows the mapping with the sense strand of SC3-seq
- the middle panel shows the mapping with the antisense strand of SC3-seq
- the lower panel shows the mapping with Ohta et al.
- Figure 9A shows mESC total RNA (100 ng: 2 replicates, 10 ng: 2 replicates, 1 ng: 4 replicates, 100 pg: 8 replicates, 10 pg: 16 replicates)
- the relationship between the amount of ERCC RNA after dilution and the calculated level of ERCC spike-in RNA by SC3-seq (log 2 (RPM + 1)) is shown.
- SC3-seq data for ERCC spike-in RNA with more than 10 copies per 10 pg was used for the regression line.
- FIG. 9B shows a heat map of the correlation coefficient (R 2 ) between all samples measured by SC3-seq from a dilution of total RNA of ESC and all samples amplified (the left figure is all The right figure shows the data with 20 or more copies of the expressed gene per 10 pg).
- FIG. 9C shows the maximum value (max) and the minimum value (min) of the pairwise correlation coefficient between the groups shown in FIG. 9B (the left figure shows the data for all the expressed genes, the right figure Shows data with 20 copies or more of the expressed gene per 10 pg).
- FIG. 10A shows a heat map of the correlation coefficient of diluted sample cans measured with diluted samples amplified with SC3-seq (left) and Smart-seq2 (right).
- FIG. 10B shows the maximum value (max) and the minimum value (min) of the pairwise correlation coefficient between the groups shown in FIG. 10A (the left figure is SC3-seq, the right figure is Smart-seq2). .
- 10C shows all RNA-seq transcripts (upper left), transcripts less than 1 Kbp (lower left), transcripts less than 750 bp (upper right) and transcripts less than 500 bp (upper right)
- the results of the detection limit analysis shown in the lower right figure are shown (in the mouse and human, respectively, the gene expression levels of the top 6555 and above and 6217 and above (1/4 of all transcripts annotated for mouse and human respectively) ) ⁇ Log 2 RPM ⁇ 3.69 ⁇ 0.05 (SC3-seq), ⁇ log 2 FPKM ⁇ 2.21 ⁇ 1.28 (Yan et al.) And ⁇ log 2 FPKM ⁇ 2.92 ⁇ 0.27 (Picelli et al.) ⁇ 2 times compared to gene expression level).
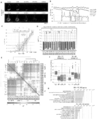
- FIG. 11A shows immunofluorescent staining analysis of the expression of marker genes (NANOG (epiblast), POU5F1 (epiblast and PE), GATA4 (PE) and CDX2 (TE)) in the preimplantation embryo on day E4.5. Results are shown. The scale bar is 100 ⁇ m.
- FIG. 11B shows marker genes (NANOG (epiblast), GATA4 (PE), CDX2 (TE) and Gapdh in single-cell amplified cDNA (67 cDNAs of quality confirmed) of E4.5 day pre-implantation embryo. The results of Q-PCR analysis of (housekeeping) expression are shown.
- FIG. 11A shows immunofluorescent staining analysis of the expression of marker genes (NANOG (epiblast), POU5F1 (epiblast and PE), GATA4 (PE) and CDX2 (TE)) in the preimplantation embryo on day E4.5. Results are shown.
- the scale bar is 100 ⁇ m.
- FIG. 11B shows marker genes (NA
- FIG. 11C shows a scatter plot comparing the ERCC spike-in RNA of the amplified sample measured by SC3-seq [log 2 (RPM + 1)] with the original copy number. The regression curve and correlation coefficient were calculated from the average of probes having a copy number of 10 or more.
- FIG. 11D shows the result of box plotting the distribution of gene expression levels in each cell.
- FIG. 11E shows a heat map of the correlation coefficient (R 2 ) between all germ cells.
- FIG. 11F shows the result of box plotting the expression level of a gene highly expressed in epiblast compared to PE (left) or a gene highly expressed in PE compared to epiblast (right). Show.
- FIG. 11C shows a scatter plot comparing the ERCC spike-in RNA of the amplified sample measured by SC3-seq [log 2 (RPM + 1)] with the original copy number. The regression curve and correlation coefficient were calculated from the average of probes having a copy number of 10 or more.
- FIG. 11D shows the
- FIG. 11G shows the results of GO analysis of a gene highly expressed in epiblast compared to PE (upper figure) or a gene highly expressed in PE compared to epiblast (lower figure).
- Fig. 12A shows the expression of cDNA (112 confirmed quality cDNAs) pluripotency genes (POU5F1, NANOG, SOX2) and GAPDH (housekeeping) amplified from hiPSCs (585A1 and 585B1) cultured on feeder cells or free of charge. The result of PCR analysis is shown.
- FIG. 12B shows a scatter plot comparing the ERCC spike-in RNA of the amplified sample measured by SC3-seq (log 2 (RPM + 1)) with the original copy number.
- FIG. 12C shows the result of box plotting the distribution of gene expression levels in each cell.
- FIG. 12D shows a heat map of the correlation coefficient (R 2 ) between all germ cells.
- FIG. 13A shows the results of expression gene analysis obtained from cynomolgus monkey embryos before and after implantation using SC3-seq. Heat expression levels of UHC and pluripotent cell markers, primitive endoderm markers, and differentiation markers associated with gastrulation in all expressed genes (log2 (RPM + 1) ⁇ 4, 18,353 genes in all samples) Shown by map.
- FIG. 13B and C show the PCA results for all expressed genes.
- FIG. 13D shows a heat map showing the expression level of a gene whose expression varies greatly in definitive cell development. The right shows the representative genes contained in each cluster and the results of Gene Ontology analysis.
- FIG. 14A shows a schematic diagram of library creation corresponding to illumina's next-generation sequencer (Miseq, Nextseq500, Hiseq2000 / 2500/3000/4000). The difference from the above-mentioned library for SOLiD5500xl is a part (red broken line) in which a DNA sequence designated by illumina is used for the tag.
- FIG. 14B is a graph plotting average SC3-seq tracks (read density (RPM, ⁇ 1,000 reads) against the position of reads from the annotated TTS (transcription termination site) in 1 ng of RNA extracted from mESC.
- Fig. 14C is a scatter plot showing a comparison between replicate products of two independently amplified replicates from 1 ng and 10 pg of mESC total RNA analyzed with Illumina Miseq.
- FIG. 15A shows an outline of the SC3-seq method for analyzing the above-described V1V3 by changing to a new DNA sequence called P1P2 and using illumina next-generation sequencers (Miseq, Nextseq500, Hiseq2000 / 2500/3000/4000). Show.
- FIGS. 15B and 15D show results obtained by analyzing cDNAs amplified from 1 ng and 10 pgRNA using V1V3 tag and P1P2 tag using illumina Miseq, respectively, and showing distribution of expression levels of all genes in box plots ( The number of genes detected as C) is shown as a bar graph (D).
- the present invention maintains the relative relationship of gene expression levels in biological samples
- a method for preparing a nucleic acid population containing the amplified product, and a nucleic acid population obtained by the method are provided.
- the “amplification product retaining the relative relationship of the gene expression level in the biological sample” means that the composition of the entire gene product group in the biological sample (quantity ratio between each gene product) is It means an amplification product (group) that is almost retained and has a level that can be applied to a standard protocol for quantifying mRNA using a next-generation sequencer.
- the “biological sample” refers to a biological species having poly A at the 3 ′ end of mRNA, for example, animals including mammals such as humans, mice, and cynomolgus monkeys, plants, fungi, and prokaryotic organisms. Means a cell.
- the present invention is expected to be applied to cells contained in embryos during development as biological samples and pluripotent stem cells having diversity.
- the number of cells as a biological sample is not particularly limited, but considering that the present invention can be amplified with good reproducibility while maintaining the relative relationship of gene expression levels in the biological sample, the number of cells. Can be applied to the cell level of 100 or less, several tens, one to several, and finally one.
- RNA sequencing also referred to as RNA-Seq
- RNA-Seq RNA sequencing
- RNA-Seq is the counting of mRNA having the sequence, that is, quantification, together with the sequencing of mRNA.
- next-generation sequencer those commercially available from illumina, Life Technologies, and Roche Diagnostic can be used.
- the method of the present invention includes the following steps.
- A any additional nucleic acid sequence X, poly T sequence, mRNA sequence isolated from a biological sample (actually a cDNA sequence corresponding to the mRNA sequence (hereinafter the same)), poly A sequence and any addition
- FIGS. 1C, 14A, and 15A The outline of the method of the present invention is shown in FIGS. 1C, 14A, and 15A. These drawings are only descriptions of examples of the method of the present invention, and those skilled in the art can implement the present invention with appropriate modifications. Hereinafter, each step of the method of the present invention will be described in detail with reference to FIGS. 1C and 15A.
- a double-stranded DNA composed of an arbitrary additional nucleic acid sequence X, poly T sequence, mRNA sequence isolated from a biological sample, poly A sequence and optional additional nucleic acid sequence Y used in this step is Can be prepared by a method comprising steps (i) to (iii) of (see WO2006 / 085616).
- the reverse transcription reaction time is preferably shortened to 5-10 minutes, more preferably about 5 minutes, so that the amplification efficiency in the subsequent PCR reaction does not depend on the length of the template cDNA.
- primary strand cDNA with equal length is synthesize
- the remaining primer may be degraded with exonuclease I or exonuclease T. Alternatively, it can be inactivated by modifying the 3 'side of the remaining primer with alkaline phosphatase or the like.
- the first primer used here and the second primer used in step (i) have different nucleic acid sequences from each other, but have a certain identity and do not contain a promoter sequence. .
- sixth and seventh primers will be described in more detail.
- seventh primer used in step (ii): additional nucleic acid sequence X and Y in additional nucleic acid sequence X and poly T sequence are different in arrangement.
- the additional nucleic acid sequences X and Y are further selected such that the Tm value of the common sequence in X and Y is lower than the Tm values in the sixth and seventh primers, respectively, and the value is as much as possible. Try to leave. By doing so, it is possible to prevent undesirable cross-annealing in which the sixth and seventh primers anneal to different sites during annealing in the subsequent PCR reaction.
- the Tm value of the consensus sequence is selected so as not to exceed the annealing temperature after annealing the sixth and seventh primers.
- the Tm value is the temperature at which half of the DNA molecules anneal with the complementary strand.
- the annealing temperature is set to a temperature that enables primer pairing, and is usually a temperature lower than the Tm value of the primer.
- the nucleic acid sequences of the sixth primer and the seventh primer have 77% or more, more preferably 78% or more, still more preferably 80 ⁇ 1%, and most preferably 79% identity.
- the upper limit of sequence identity is the upper limit% at which the Tm value of the common sequence of both primers does not exceed the annealing temperature.
- both the additional nucleic acid sequences X and Y have the identity of 55% or more, more preferably 57% or more, and further preferably 60 ⁇ 2%. It can also be defined as an array.
- the upper limit is the upper limit% at which the Tm value of the common sequence in the additional nucleic acid sequences X and Y does not exceed the annealing temperature in the PCR reaction.
- the added nucleic acid sequences X and Y in the sixth and seventh primers used preferably each have a palindromic sequence. Specifically, almost all restriction enzyme sites such as restriction enzyme sites such as AscI, BamHI, SalI, XhoI sites, and other EcoRI, EcoRIV, NruI, NotI have palindromic sequences. be able to.
- the nucleic acid molecule having the nucleic acid sequence shown in SEQ ID NO: 1 (atatctcgagggcgcgccggatcctttttttttttttttttttttttttttttttttttttttttttttttttttttttttttttttttttttttttttttttttttttttttttttttttttttttttttttttttttttttttttttttttttttttttttttttttttttttttttttttttttttttttttttttttttttttttttttttttttttttttttttttttttt
- the P2 (dT) 24 sequence (SEQ ID NO: 6: ctgccccgggttcctcattcttttttttttttttttttttttttttttttttttttttttttttttttttttttttttttttttttttttttttttttttttttttttttttttttttttttttttttttttttttttttttttttttttttttttttttttttttttttttttttttttttttttttttttttttttttttttttttttttttttttttttttttttttttttttttt
- the sixth and seventh primers to be used are primers having a higher specificity or a higher Tm value than those used in normal PCR.
- the annealing temperature can be brought close to the Tm value of the primer, thereby suppressing non-specific annealing. Since the annealing temperature is typically 55 ° C, the Tm value used for normal PCR is 60 ° C. Therefore, the annealing temperature of the primer used in the present invention is 60 ° C. or higher and lower than 90 ° C., preferably about 70 ° C., and most preferably 67 ° C.
- step (Iii) PCR amplification
- an eighth primer containing the additional nucleic acid sequence X and a ninth primer containing the additional nucleic acid sequence Y Add and perform PCR amplification.
- the eighth primer the seventh primer further including a poly T sequence downstream of the additional nucleic acid sequence X
- the ninth primer further includes a poly T sequence downstream of the additional nucleic acid sequence Y.
- a sixth primer may be used (FIG. 1C).
- the P1 sequence (SEQ ID NO: 8: ccactacgcctccgctttcctctctatg) can be used as the eighth primer
- the P2 sequence (SEQ ID NO: 10: ctgccccgggttcctcattct) can be used as the ninth primer (FIG. 15A).
- the PCR cycle can be appropriately changed. For example, PCR of 5 to 30 cycles is exemplified.
- mRNA contained in 100 ng of total RNA when mRNA contained in 100 ng of total RNA is used as a template, 7 cycles are exemplified, and similarly, when mRNA contained in 10 ng of total RNA is used as a template, 11 cycles are exemplified, When mRNA contained in 1 ng of total RNA is used as a template, 14 cycles are exemplified, and when mRNA contained in 100 pg of total RNA is used as a template, 17 cycles are exemplified, and in 10 pg of total RNA, When the contained mRNA is used as a template, 20 cycles are exemplified.
- non-specific annealing can be suppressed by bringing the annealing temperature in PCR amplification close to the Tm value of the primer used.
- the annealing temperature is 60 ° C. or higher and lower than 90 ° C., preferably about 70 ° C., most Preferably it is 67 degreeC.
- step (iii) the primary strand cDNA derived from the same starting sample is divided into a plurality of, for example, 3-10, preferably about 4 tubes, each of which is subjected to a PCR reaction and finally mixed again. preferable. By doing so, random errors are averaged and can be significantly suppressed.
- step (iii) The double-stranded DNA amplified in step (iii) is amplified together using, for example, ERCC spike-in RNA commercially available from Life Technologies, as a template, and the amount is compared with the estimated copy number. Thus, it can be confirmed whether or not the above-described amplification by PCR has been performed normally.
- a first primer including the additional nucleic acid sequence X to which an amine is added at the 5 ′ end, and a first primer including the additional nucleic acid sequence Y are included.
- an amine can be added to the 5 ′ end of the additional nucleic acid sequence X in the double-stranded DNA.
- the first and second primers may optionally further comprise a poly T sequence downstream of the additional nucleic acid sequences X and Y, respectively.
- the first primer an amine added to the 5 ′ end of the seventh primer used in step (ii), and the sixth primer used in step (i) as the second primer Can be used respectively (FIG. 1C).
- the first primer is obtained by adding an amine to the 5 ′ end of the eighth primer.
- the ninth primer can also be used as the second primer, respectively (FIG. 15A).
- the amplification in this step (a) is not particularly limited as long as an amine can be added to the 5 ′ end of the additional nucleic acid sequence X in the double-stranded DNA.
- the amplification is performed by 2 to 8 cycles of PCR, Preferably, there are 4 cycles.
- the amine to be added is not particularly limited as long as phosphorylation at the 5 ′ end in step (c) can be suppressed, but an amino group is preferably added.
- the step of fragmenting the double-stranded DNA obtained in the step (a) is a step of fragmenting the double-stranded DNA obtained in the step (a).
- Examples of DNA fragmentation include a method of dividing using ultrasonic waves and a method of using DNA fragmenting enzymes. In the present invention, a method of dividing using ultrasonic waves is preferably used.
- the step (c) is the step of 5% of the fragmented duplex DNA obtained by the step (b).
- This is a step of phosphorylating the terminal, and the phosphorylation can be performed using a nucleic acid kinase known per se.
- the amine-added 5 ′ end cannot be phosphorylated.
- the cut ends may not be smoothed. Therefore, after blunting the ends using a DNA polymerase, this step It is desirable to perform (c).
- a step of selecting fragmented double-stranded DNA having an arbitrary base length may be performed.
- This base length is not particularly limited as long as mRNA can be recognized by sequencing, but preferably 200 to 250 base length in Life Technologies SOLiD5500xl, and in illumina Miseq / NextSeq500 / Hiseq2000 / 2500/3000/4000. The length is 350 to 500 bases.
- the step of selecting DNA may be performed using any means known in the art such as a DNA adsorption method, a gel filtration method, and a gel electrophoresis method.
- a DNA adsorption method a DNA adsorption method
- a gel filtration method a gel electrophoresis method.
- BeckmanAMPCoulter AMPureXP beads it can be done easily.
- step (D) Using the double-stranded DNA phosphorylated at the 5 ′ end obtained in the step (c) as a template, a third primer containing any additional nucleic acid sequence Z and the additional nucleic acid sequence Y in this order Step of preparing cDNA using and adding adenine (A) to its 3 ′ end In this step (d), the double-stranded DNA phosphorylated at the 5 ′ end obtained in step (c) was used as a template. Using a third primer that further includes an optional additional nucleic acid sequence Z on the 5 ′ side of the second primer that includes the additional nucleic acid sequence Y (and optionally further a poly T sequence), the 5 ′ end is phosphorylated.
- the additional nucleic acid sequence Z is added to the double-stranded DNA thus prepared.
- the additional nucleic acid sequence Z can be added to the additional nucleic acid sequence Y in the double-stranded DNA.
- an enzyme having TdT activity that adds adenine (A) to the 3 ′ end as a DNA polymerase adenine (A) is added to the 3 ′ end of each strand of the double-stranded DNA.
- This step (d) is composed of mRNA sequence isolated from a biological sample phosphorylated at the 5 ′ end, poly A sequence, optional additional nucleic acid sequence Y, and optional additional nucleic acid sequence Z. Heavy chain DNA can be obtained.
- the arbitrary additional nucleic acid sequence Z is a sequence depending on the next-generation sequencer to be used, and can be performed using a sequence recommended by the manufacturer of the sequencer. For example, when SOLID5500XL of Life technologies is used, an Int sequence represented by SEQ ID NO: 3 (ctgctgtacggccaaggcgt) can be used as an arbitrary additional nucleic acid sequence Z.
- the Rd2SP sequence represented by SEQ ID NO: 13 (gtgactggagttcagacgtgtgctcttccgatc) can be used as the additional nucleic acid sequence Z.
- (E) A step of ligating the double-stranded DNA obtained in the step (d) with a double-stranded DNA containing an arbitrary sequence V having a thymine (T) as an overhang at the 3 ′ end.
- a double-stranded DNA comprising an arbitrary sequence V having a thymine (T) as an overhang at the 3 ′ end of the double-stranded DNA obtained in d) Is a double-stranded DNA having only one base (T) on the 3 ′ end side and no complementary strand, and the overhanging portion is similarly one base (5 base) at the 5 ′ end of the double-stranded DNA to be ligated ( A) When having an overhang complementary strand, ligation at the protruding end is possible.
- the sequence V is a sequence that depends on the next-generation sequencer to be used, and can be performed using, for example, a sequence commercially available from Life technologies or illumina.
- P1-T SEQ ID NO: 11: ccactacgcctccgctttcctctctatgt
- Rd1SP-T SEQ ID NO: 12: tctttccctacacgacctcttccgatct
- the fourth primer and the fifth primer to be used are sequences depending on the next-generation sequencer to be used.
- the fifth primer only needs to contain at least the additional nucleic acid sequence Z, and may optionally further include the additional nucleic acid sequence Y downstream thereof.
- the fifth primer further includes a barcode sequence, and preferably further includes an adapter sequence having an arbitrary sequence.
- the fourth primer and the fifth primer can be performed using sequences commercially available from Life technologies or illumina.
- the amplification is carried out by using a double-stranded DNA that is not amplified by the fourth primer and the fifth primer (a fragmented double-stranded DNA containing the 3 ′ end of the mRNA sequence or an internal sequence). If it decreases, the number of cycles is not particularly limited. For example, PCR of 5 to 30 cycles is exemplified, and preferably 9 cycles.
- the nucleic acid population of the present invention obtained by the above steps is useful as a sample for sequencing and measuring the number of nucleic acids when applied to a next-generation sequencer.
- a library containing a part of mRNA can be constructed with certainty. Therefore, since the amplified mRNA is excellent in quantification, it is possible to detect a more accurate expression level of comprehensive mRNA as compared with conventional RNA-Seq.
- the present invention provides a kit for preparing a cDNA population to be applied to the measurement of the amount of mRNA by a next-generation sequencer.
- the kit of the present invention may be constituted by the following primers described above; (A) a first primer comprising an optional additional nucleic acid sequence X (and optionally further a poly T sequence) with an amine added to the 5 ′ end; (b) an optional additional nucleic acid sequence Y (and optionally further a poly T sequence).
- a second primer comprising (c) an optional additional nucleic acid sequence Z and said additional nucleic acid sequence Y (and optionally further a poly T sequence) in this order (d) thymine (T) at the 3 ′ end A double-stranded DNA comprising any sequence V having an overhang (E) a fourth primer comprising said sequence V, and (f) a fifth primer comprising said additional nucleic acid sequence Z (and optionally further said additional nucleic acid sequence Y).
- the kit is for preparing a double-stranded DNA composed of an arbitrary additional nucleic acid sequence X, a poly T sequence, an mRNA sequence isolated from a biological sample, a poly A sequence, and an optional additional nucleic acid sequence Y.
- primer sets (G) a sixth primer comprising the additional nucleic acid sequence Y and a poly T sequence; (H) a seventh primer comprising the additional nucleic acid sequence X and a poly T sequence; (I) an eighth primer comprising the additional nucleic acid sequence X, optionally further comprising a poly T sequence downstream thereof; and (j) comprising the additional nucleic acid sequence Y, optionally comprising a poly T sequence downstream thereof.
- a ninth primer that may further be included may be further included.
- the sixth primer and the ninth primer may be the same, and the seventh primer and the eighth primer may be the same.
- the second primer and the ninth primer may be the same.
- the kit may further include other reagents necessary for the PCR reaction (eg, DNA polymerase, dNTP mix, buffer solution, etc.), other reagents necessary for the ligation reaction, reverse transcription reaction, terminal phosphorylation reaction, and the like. .
- reagents necessary for the PCR reaction eg, DNA polymerase, dNTP mix, buffer solution, etc.
- other reagents necessary for the ligation reaction eg, reverse transcription reaction, terminal phosphorylation reaction, and the like.
- RNA-extracted mice were performed according to the ethical guidance of Kyoto University.
- BVSC R8 a mouse embryonic stem cell (mESC) strain, was cultured according to a conventional method (Hayashi, K. et al, Cell, 146, 519-532, 2011). Extraction of total RNA from the cell line was performed using the RNeasy mini kit. (Qiagen (74104)) according to the manufacturer's manual.
- the extracted RNA is diluted with double-distilled water (DDW) to concentrations of 250 ng / ⁇ l, 25 ng / ⁇ l, 2.5 ng / ⁇ l, 250 pg / ⁇ l and 25 pg / ⁇ l, and single-cell mRNA 3- It was used for the quantitative evaluation of prime end sequencing (hereinafter referred to as SC3-seq).
- DSW double-distilled water
- iPSC lines 585A1 and 585B1 which are human iPS cells (hiPSC)
- KSR Knockout Serum Replacement
- 1% vol / vol
- GlutaMax Life Technologies (35050-061)
- 0.1 mM nonessential amino acids Life Technologies (11140-050)
- 4 ng / ml recombinant human bFGF Wako Pure Chemical Industries (064-04541)
- conventional culture on SNL feeder cells in DMEM / F12 Life Technologies (11330-32)
- DMEM / F12 Life Technologies (11330-32)
- M3148 2-mercaptoethanol
- V1V3-cDNA synthesis and amplification from isolated single cell RNA can be performed using existing methods (Kurimoto, K. et al, Nucleic Acids Res, 34, e42, 2006 or Kurimoto, K. et al, Nature protocols, 2, 739-752, 2007).
- RNA spike-in developed by Qiagen RNase inhibitor (0.4 U / sample) (Qiagen (129916)), Porcine Liver RNase inhibitor (0.4 U / sample) (Takara Bio (2311A)) and External RNA Controls Consortium (ERCC) Use of RNA (ERCC spike-in RNA) (Life Technologies (4456740)) and the number of PCR cycles per total RNA (7 cycles for 100 ng total RNA, 11 cycles for 10 ng total RNA, 1 ng total 14 cycles for RNA, 17 cycles for 100 pg total RNA, and 20 cycles for 10 pg total RNA) are different from the conventional method.
- P1P2-cDNA synthesis and amplification differs from V1V3-cDNA synthesis and amplification in the use of SuperScript4 (Life Technologies (18090200)) and KOD FX NEO (Toyobo (KFX-201)).
- SuperScript4 Life Technologies (18090200)
- KOD FX NEO Toyobo (KFX-201)
- ERCC spike-in RNA ERCC-00074 (9030 copies), ERCC-00004 (4515 copies), ERCC-00113 (2257 copies), RCC-00136 (112.8 copies) ), ERCC-00042 (282.2 copies), ERCC-00095 (70.5 copies), RCC-00019 (17.6 copies) and ERCC-00154 (4.4 copies), and RCC for mouse preimplantation embryos and hiPSCs -00096 (1806 copies), ERCC-00171 (451.5 copies), ERCC-00111 (56.4 copies) were used, and the genes listed in Table 1 were used for the endogenous genes.
- Q-PCR Quantitative PCR
- the cDNA was 30 ⁇ l Internal adaptor extension buffer (1 ⁇ ExTaq Buffer, 0.23 mM each dNTP, 0.67 ⁇ M IntV1 (dT) 24 primer (HPLC-purified) , 0.033 U / ⁇ l ExTaqHS) was subjected to a thermal cycler with 95 ° C. for 3 min, 67 ° C. for 2 min and 72 ° C.
- the cDNA was subjected to Final amplification buffer (1 ⁇ ExTaq buffer, 0.2 mM each dNTP, 1 ⁇ M P1 primer, 1 ⁇ M BarT0XX_IntV1 primer (HPLC -purified) (XX represents an integer of 2 digits, specific primers are listed in Table 2), 0.025 U / ⁇ l ExTaqHS), 3 min incubation at 95 ° C, 30 sec at 95 ° C, 9 cycles of 1 min at 67 ° C. and 1 min at 72 ° C. were applied to a thermal cycler with a program of 3 min at 72 ° C.
- Final amplification buffer (1 ⁇ ExTaq buffer, 0.2 mM each dNTP, 1 ⁇ M P1 primer, 1 ⁇ M BarT0XX_IntV1 primer (HPLC -purified) (XX represents an integer of 2 digits, specific primers are listed in Table 2)
- the cDNA library was purified using 1.2 volumes of AMPureXP and dissolved in 20 ⁇ l TE buffer.
- the quality and capacity of the constructed library were evaluated by LabChip GX or Bioanalyzer 2100 using a Qubit dsDNA HS assay kit (Life Technologies (Q32851)) and SOLiD Library TaqMan Quantitation kit (Life Technologies (4449639)).
- Amplification of the library on the beads by emulsion PCR was performed on the E120 scale using the SOLiD TM EZ Bead TM System (Life Technologies (4449639)) according to the manufacturer's manual.
- the obtained bead library was loaded on a flowchip and measured with 50 bp and 5 bp barcode plus Exact Call Chemistry (ECC) of SOLiD 5500XL system.
- ECC Exact Call Chemistry
- the purified cDNAs were diluted with double-distilled water (DDW) to 130 ⁇ l and fragmented using Covaris S2 or E210 (Covaris).
- End-polish buffer (1 ⁇ NEBnext End Repair Reaction buffer (NEB (B6052S)), 0.01 U / ⁇ l T4 DNA polymerase (NEB (M0203)) and 0.033 U / ⁇ l T4 polynucleotide kinase (NEB (M0201))
- NEB (B6052S) NEBnext End Repair Reaction buffer
- NEB (M0203) 0.01 U / ⁇ l T4 DNA polymerase
- 0.033 U / ⁇ l T4 polynucleotide kinase (M0201))
- the cDNA was 30 ⁇ l Internal adapter extension buffer (1 ⁇ ExTaq Buffer, 0.23 mM each dNTP, 0.67 ⁇ M Rd2SP-P2 primer (HPLC-purified), 0.033 U / ⁇ l ExTaqHS) was subjected to a thermal cycler with programs of 95 ° C. for 3 min, 60 ° C. for 2 min and 72 ° C. for 2 min.
- reaction was stopped by cooling with ice, 20 ⁇ l of Rd1SP-adaptor ligation buffer (10 ⁇ l of 5 ⁇ NEBNext Quick Ligation Reaction Buffer (NEB (B6058S)), 0.6 ⁇ l of 10 ⁇ M of the Rd1SP adaptor and 1 ⁇ l of T4 ligase (mixture of NEB (M0202M)) was added, followed by incubation at 20 ° C. for 15 minutes and 72 ° C. for 20 minutes.
- NEB NEBNext Quick Ligation Reaction Buffer
- the cDNA was subjected to Final amplification buffer (1 ⁇ KOD FX NEO buffer, 0.4 mM each dNTP, 0.3125 ⁇ M S5XX primer (XX is double digit) Integers, specific primers listed in Table 3), 0.3125 ⁇ M N7XX primer (HPLC-purified) (XX represents a two-digit integer, specific primers listed in Table 3), 0.02 U / ⁇ l KOD FX NEO), followed by incubation at 95 ° C for 3 min, 95 cycles for 10 sec, 1 min at 60 ° C and 1 min at 68 ° C for 9 cycles, then thermal at 68 ° C for 3 min It was subjected to a cycler and amplified by PCR.
- Final amplification buffer (1 ⁇ KOD FX NEO buffer, 0.4 mM each dNTP, 0.3125 ⁇ M S5XX primer (XX is double digit) Integers, specific primers listed in Table 3), 0.3
- the cDNA library was purified using 0.9-fold amount of AMPureXP and dissolved in 20 ⁇ l TE buffer.
- the quality and capacity of the constructed library were evaluated by a Qubit dsDNA HS assay kit (Life Technologies (Q32851)), KAPA Library Quantification Kits (KAPA (KK4828)), and LabChip GX or Bioanalyzer 2100.
- the obtained Library DNA was analyzed using Miseq Reagent kit v3, 150 cycle (illumina (MS-102-3001)).
- mapping adapter to reference genome or poly-A sequence was trimmed by cutadapt-1.3 and all reads were searched. However, trimmed reads below 30 bp were excluded. Adapter and poly-A sequences were confirmed in approximately 1-20% and 5% of total reads, respectively. Untrimmed and trimmed reads over 30 bp were mapped by tophat-1.4.1 / bowtie1.0.1 with the “-no-coverage-search” option for mouse genome mm10 and ERCC spike-in RNA.
- cufflinks-2.2.0 When evaluating the expression level of several genes, the cufflinks option “-max-mle-iterations” with the default of 5,000 resulted in “FAILED”, so the cufflinks option “-max-mle” -iterations ”was set to 50,000.
- the transcription termination site (TTS) of the reference gene was extended to more than 10 kb downstream in order to correctly estimate the expression level of a gene having a transcript longer than the reference in the 3 ′ direction.
- TTS transcription termination site
- ERCC spike-in RNA reads are normalized to the number of reads per million-mapped (RPM) by the total reads mapped on the genome used for gene expression analysis. It was. The mapped leads were visualized using igv-2.3.34. Conversion of mapped reads to expression levels with HTSeq-0.6.0 was consistent with the results with cufflinks-2.2.0 using the options described above.
- the determination of the optimal definition at the 3 'end of the transcript was performed by correcting the reference gene annotation gff3 file.
- the definition of the 3 'end of the transcript was expanded to 10 kb in units of 1 kb and to 100 kb in units of 10 kb, the expression levels of all genes were calculated. Genes whose expression levels were increased to 10%, 20%, 30%, 40%, 50%, 80%, 100%, 200% and 300% were counted.
- Accuracy as total RNA [log 2 (RPM + 1 ) ⁇ 1] Percentage of genes in amplified samples from 10 pg, 100 ng of total RNAs [log 2 (RPM + 1 ) ⁇ 1] Defined based on the number of genes detected in the sample amplified from The expressed gene was defined as the gene detected with [log 2 (RPM + 1) ⁇ 1] in the sample prepared with SC3-seq from 100 ng RNA. Multi-sample analysis (8 samples) for coverage and accuracy was performed by calculating coverage and accuracy under a detection definition in which 1 to 8 or more of the 8 amplified samples present leads.
- Oneway_analysis of variance (ANOVA) and qvalue function were used to calculate p-value and false discovery ratio, respectively, in order to recognize gene groups (DEG) with different expression among multiple groups.
- Gene ontology (GO) analysis was performed using the DAVID web tool.
- Anti-mouse NANOG (rat monoclonal) (eBioscience (eBio14-5761)), anti-mouse POU5F1 (mouse monoclonal) (Santa Cruz (sc-5279)), anti-mouse GATA4 (goat polyclonal) (Santa Cruz) (sc-1237)), anti-mouse CDX2 (rabbit monoclonal, clone EPR2764Y) (Abcam (ab76541)) was used.
- Secondary antibodies include Alexa Fluor 488 anti-rat IgG (Life Technologies (A21208)), Alexa Fluor 555 anti-rabbit (Life Technologies (A31572)), Alexa Fluor 568 anti-mouse IgG (Life Technologies (A10037)) and Alexa Fluor 647 anti-goat IgG (Life Technologies (A21447)) (all donkey polyclonal) was used. Fluorescence images were obtained using a confocal microscope (Olympus (FV1000)).
- SC3-seq design and construction Single-cell cDNA amplification used a high-density oligonucleotide microarray-like method of concentrating the 3 'end (Kurimoto, K., et al., Nucleic Acids Res, 34, e42 , 2006 and Kurimoto, K., et al., Nature protocols, 2, 739-752, 2007).
- the method involves analysis of heterogeneous cell types such as mouse blastocysts, elucidation of transcriptome in the development of primordial germ cells (PGC), and elucidation of neuronal cell types in the development of cerebral cortex Useful for analysis.
- PPC primordial germ cells
- a method for amplifying and sequencing the 3 'end of cDNA synthesized from a single cell is called SC3-seq, and the method is shown in Fig. 1C.
- cDNA was amplified from single-cell level RNA by a conventional method (FIG. 1C).
- the first cDNA strand was synthesized using V1 (dT) 24 primer, and the mRNA annealed with excess V1 (dT) 24 primer was digested with Exonuclease I and RNaseH, respectively, and the poly (dA) tail was the first It was added to the 3 ′ end of the cDNA strand.
- the second cDNA strand was synthesized using V3 (dT) 24 primer, and the resulting cDNA was used with V1 (dT) 24 primer and V3 (dT) 24 primer to determine the number of PCR cycles depending on the initial amount. (20 cell cycles per single cell or 10 ⁇ g pg total RNA).
- V1 (dT) 24 primer was used for the construction of the library (FIGS. 1C and 7A).
- the amplified cDNA was tagged by NH2-V3 (dT) 24 primer by PCR, the primer dimer was removed by purification three times by AMPureXP, and the tagged cDNA was fragmented by ultrasound. In addition, end-polish and size selection with AMPure®XP.
- the resulting 200-250 bp cDNA was denatured and annealed with an IntV1 (dT) 24-primer with an internal adapter extension sequence to capture the 3 'end. Ligation and sequence expansion using P1 adapter and final amplification using BarT0XX-IntV1 primer with P1 primer, 96-length barcode and IntV1 (dT) 24 primer.
- the final amplification product was sequenced from the end of the P1 adapter, and the 3 'end side of the mRNA at the locus was mapped. Since SC3-seq provides sequence reads only on the 3 'end of mRNA, the number of reads is a percentage of the absolute mRNA expression level regardless of the total length, and simpler and more accurate gene expression level quantification Bring. Normalized by sequence reads per million mapped reads and accurately quantified.
- RNA 100 ng (equivalent to 10,000 cells) 2 replicates, 10 ng (equivalent to 1,000 cells) 2 replicates, 1 ng (equivalent to 100 cells) 4 replicates, 100 pg (equivalent to 10 cells) ) 8 replicates and 10 pg (single cell equivalent) 16)
- RNA was collected with externalikespike-in ⁇ ⁇ ⁇ ⁇ RNA control developed by External RNA Controls Consortium (ERCC) and amplified (100 ng , 10 ng, 1 ng, 100 pg and 10 pg total RNA were used as initial PCR cycles of 7, 11, 14, ⁇ 17 and 20 respectively, and these were sequenced by SC3-seq.
- ERCC External RNA Controls Consortium
- FIG. 1D shows the average sequence read distribution of one 100 ng RNA amplification product by SC3-seq ( ⁇ 40-50% mapping efficiency).
- the mapping read contained many 3 'ends (150 bp upstream from TTS) of all mapped RefSeq genes. There were a few reads mapped in the antisense strand of the exon. This means that the V1 (dT) 24 primer is part of the amplification product by misannealing at the 5 ′ end of the cDNA for amplification (FIG. 1C).
- the SC3-seq track around the Pou5f1 locus presented a single peak that coincided with the 3 ′ end of the sense strand of Pou5f1 with a small peak in the antisense strand of exon (FIG. 1E).
- the SC3-seq read peak was observed downstream from the 3 ′ end of the annotated RefSeq transcript. This presents a matching locus upstream of the 3 ′ end of the transcript (FIGS. 1D and 1E).
- an SC3-seq peak was observed 1 Kb downstream of the 3 ′ end of Nanog (FIG. 1E).
- the number of genes presenting an increase in mapped reads increases with an expanded TTS definition from annotated TTS, and 450 genes by extending the TTS definition to 10 Kb
- the number of mapped leads has increased. Since we found that an extension up to 10 Kb or more was incorrectly annotated, we defined a peak detected within 10 Kb downstream from the annotated TTS indicating the expression of the immediately upstream gene, and analyzed the SC3-seq data . The analysis of the published RNA-seq data confirmed the stability of the mESC comprehensive RNA amount by this definition.
- spike RNA which was less than 30 copies in 10 pg RNA, showed insufficient amplification, but the SC3-seq read of ERCC spike-in RNA in all amplified libraries obtained by dilution. [Log 2 (RPM + 1)] values correlated with the original copy number (FIG. 2B) (indicating ERCC spike-in RNA copy number per 10 pg total RNA at each dilution). This made it possible to estimate the number of gene copies per 10 pg of RNA from the number of SC3-seq reads.
- RNA samples amplified from 10 pg (equivalent to 1 cell) of RNA showed good correlation, with 77.6% and 86.1% plotted in the 2-fold and 4-fold difference lines, respectively (FIGS. 2C and 2G).
- SC-seq coverage of 10 pg RNA using 8 amplification data (number of genes detected in 10 pg RNA (log 2 (RPM + 1) ⁇ 1) / 100 ng RNA (number of genes detected with log 2 (RPM + 1) ⁇ 1) and accuracy (100 ng RNAs (log 2 (RPM + 1) ⁇ 1) detected with an additional 10 pg RNA) (number of genes detected by log 2 (RPM + 1) ⁇ 1) was evaluated.
- the expressed gene was defined as a gene detected with [log 2 (RPM + 1) ⁇ 1] in a sample prepared by SC3-seq from 100 ng RNA.
- the coverage of a single amplified sample was plotted (black line in FIG. 3A). From previous reports and the above data (Figure 2), coverage is dependent on expression level, but the majority of the expressed genes (cumulative percentage, 94.1%) expressed more than 10 copies per 10 pg RNA It has been detected (Fig. 3A).
- the accuracy of single amplified samples was also plotted, confirming that 99.7% (cumulative percentage) of the detected genes were expressed in expression level regions of 10 copies or more per 10 pg of RNA ( Figure 3B). .
- SC3-seq is a short transcript ( ⁇ 500 bp) and requires a 0.2-mega mapped read (the gene expression level is higher than the top 6,555 genes (transcripts annotated in mice). 1/4 of product, log 2 RPM ⁇ 3.69 ⁇ 0.05), other methods require short transcripts ( ⁇ 500 bp) and 1 Mb or more mapped reads (less than 500 bp, gene expression levels Are the top 6,555 and 6,217+ genes (1/4 of mouse and human annotated transcripts, respectively), log 2 FPKM ⁇ 2.21 ⁇ 0.05 (Yan et al.) Or 2.92 ⁇ 0.27 (Picelli et al .)) (Figure 4D). These results suggest that SC3-seq is a more quantitative and effective method for transcriptome analysis of single cells than the conventional method.
- pre-implantation mouse embryos consist of at least three cell types: epiblast, primordial endoderm (PE) and trophectoderm (TE) Consists of.
- the previous two cells form an inner cell mass (ICM).
- ICM inner cell mass
- TE is in direct contact with two cell types, ICM, to form embryonic ectoderm (ExE) and part of the extra-embryonic tissue of blastocyst and later early nutrients. It is classified into mTE (wall TE) that forms blast layer giant cells.
- mTE wall TE
- SC3-seq we investigated whether cell types in blastocysts could be distinguished.
- genes with high expression in PE include Sparc, Lama1, Lamb1, Col4a1, Gata4, Gata6, Pdgfra and Sox17, and GO terms include “lipid biosynthesis process”, “glycolipid metabolism process” and “Embryogenesis during birth or hatch” was seen (FIGS. 5D and 11G).
- genes with different expression between pTE and mTE were searched. 218 genes highly expressed in pTE including Hspd1, Ddah1, Gsto1, and Dnmt3b were found, and many GO terms related to cell cycle such as “cell cycle”, “M phase” and “end of mitosis” (FIGS. 5D and 5F). Genes that are highly expressed in pTE compared to mTE are the same as in pTE and are expressed in epiblasts and PE ( Figure 5E), and these genes are down especially in blastocyst mTE It was confirmed that it was controlled.
- Detection of human iPS cell heterogeneity SC3-seq was investigated to detect gene expression heterogeneity in a homogeneous cell population. Gene expression was measured in hiPSC (on-feeder hiPSC) cultured on feeder cells and hiPSC (feeder-free hiPSC) cultured in feeder-free conditions. For this purpose, two hiPSC strains (585A1 and 585B1) were cultured on SNL feeder cells and in feeder-free conditions (a total of 112 single-cell cDNAs were obtained) (FIGS.
- on-feeder hiPSC the maximum expression level was log 2 (RPM + 1) ⁇ 6 and 630 genes with SD ⁇ 2 were found, but in feeder-free hiPSC, 109 genes were found. That is, it was shown that the SD value of on-feeder hiPSC was higher in all gene expression regions than the SD value of feeder-free iPSC, consistent with the results of PCA analysis.
- the SD value of the gene expression level of feeder-free iPSC is plotted against that of on-feeder hiPSC, the SD value is high in feeder-free iPSC including PK1B, UNC5D, SCGB3A2, HERC1, RPS4Y1 and RBM14 / RBM4 75 genes, ZFP42, ANXA3, LEFTY1, PTCD1 and LDOC1, including both feeder-free hiPSC and on-feeder hiPSC, have high SD values (SD ⁇ 2), and FGF19, CAV1, NODAL, SGK1, CTGF, and SFRP1 596 genes showing higher SD values with on-feeder hiPSC were found (FIGS. 6B, 6E and 6F).
- Each cell was defined and classified based on UHC clusters, pluripotent cell markers, primitive endoderm markers, and differentiation marker gene expression patterns associated with gastrulation (post_paTE; post-implantation embryo-derived wall side nutrition Ectoderm, preL_TE; late-implantation ectoderm from preimplantation embryo, HYP; preimplantation-derived blastodermal sublayer, preE_TE; early-implantation ectoderm from preimplantation embryo, ICM; inner cell mass from preimplantation embryo, pre_EPI: pre-implantation embryo-derived epiblast, postE_EPI; post-implantation embryo-derived early epiblast, postL_EPI; post-implantation embryo-derived late epiblast, Gast1, 2a, 2b; post-implantation embryo-derived gastrulation cells, YE ; Post-implantation embryo-derived yolk endoderm, ExMchy; post-implantation embryo-derived extracorporeal stromal cells).
- post_paTE post-implantation embryo-derived wall side nutrition Ectoderm, preL_TE
- FIGS. 13B and 13C show the results of PCA using all the expressed genes
- FIG. 13D shows the expression levels of genes that greatly change in expression during definitive cell development in a heat map. From the above, it was confirmed that cells of the same group showed similar gene expression patterns, which reflects that SC3-seq has high quantitativeness and reproducibility. These findings also indicate that SC3-seq was able to distinguish different cell populations and their expression patterns in the development of cynomolgus monkey epiblasts.
- FIG. 1 shows a schematic diagram of library creation corresponding to illumina's next-generation sequencers (Miseq, Nextseq500, Hiseq2000 / 2500/3000/4000) by changing the P1-T sequence in Fig. 1C to the Rd1SP-T sequence. .
- the average SC3-seq track (read density (RPM, x1,000 reads)) was plotted against 1 ng of RNA extracted from mESCs versus the position of reads from the annotated TTS (transcription termination site) (FIG. 14B). From 1 ng and 10 pg of total RNA of mESC, two independently amplified replicates were analyzed using the Illumina Miseq (FIG.
- FIG. 15A shows that the V1 (dT) 24 sequence used for cDNA amplification was converted to P2 (dT) 24 sequence and the V3 (dT) 24 sequence was converted to P1 (dT) 24 sequence in the analysis using the above-mentioned illumina Miseq.
- Rd2SPV1 (dT) 24 sequence was changed to Rd2SP-P2 sequence (SEQ ID NO: 15: gtgactggagttcagacgtgtgctcttccgatcctgccccgggttcctcattct). From 1 ng and 10 pg of total RNA of mESC, using P1 (dT) 24 sequence and P2 (dT) 24 sequence (P1P2 tag), two independently amplified replication products were used with illumina Miseq (FIG. 15B).
Landscapes
- Chemical & Material Sciences (AREA)
- Life Sciences & Earth Sciences (AREA)
- Organic Chemistry (AREA)
- Proteomics, Peptides & Aminoacids (AREA)
- Health & Medical Sciences (AREA)
- Zoology (AREA)
- Wood Science & Technology (AREA)
- Engineering & Computer Science (AREA)
- Analytical Chemistry (AREA)
- Molecular Biology (AREA)
- Immunology (AREA)
- Microbiology (AREA)
- Biotechnology (AREA)
- Biochemistry (AREA)
- Bioinformatics & Cheminformatics (AREA)
- General Engineering & Computer Science (AREA)
- General Health & Medical Sciences (AREA)
- Genetics & Genomics (AREA)
- Biophysics (AREA)
- Physics & Mathematics (AREA)
- Chemical Kinetics & Catalysis (AREA)
- Measuring Or Testing Involving Enzymes Or Micro-Organisms (AREA)
Abstract
Description
[1]生物学的試料における遺伝子発現量の相対的な関係を保持している増幅産物を含む核酸集団を調製する方法であって、
(a)任意の付加核酸配列X、ポリT配列、生物学的試料から単離したmRNA配列、ポリA配列および任意の付加核酸配列Yの順で構成される2重鎖DNAを鋳型として、5’末端にアミンを付加した任意の付加核酸配列Xを含み、任意でその下流にポリT配列をさらに含んでもよい第1のプライマーと、任意の付加核酸配列Yを含み、任意でその下流にポリT配列をさらに含んでもよい第2のプライマーとを用いて、該2重鎖DNAを増幅する工程、
(b)前記工程(a)により得られた2重鎖DNAを断片化する工程、
(c)前記工程(b)により得られた断片化2重鎖DNAの5’末端をリン酸化する工程、
(d)前記工程(c)により得られた5’末端がリン酸化された2重鎖DNAを鋳型として、任意の付加核酸配列Zおよび前記付加核酸配列Yをこの順序で含み、任意でその下流にポリT配列をさらに含んでもよい第3のプライマーを用いてcDNAを調製、該cDNAの3’末端へアデニン(A)を付加する工程、
(e)前記工程(d)により得られた2重鎖DNAへ、3’末端にチミン(T)をオーバーハングで有する任意の配列Vを含む2重鎖DNAを連結させる工程、および
(f)前記工程(e)により得られた2重鎖DNAを鋳型として、前記配列Vを含む第4のプライマーと、前記付加核酸配列Zを含み、任意でその下流に前記付加核酸配列Yをさらに含んでもよい第5のプライマーとを用いて、該2重鎖DNAを増幅する工程
を含む方法。
[2]前記工程(a)で用いる任意の付加核酸配列X、ポリT配列、生物学的試料から単離したmRNA配列、ポリA配列および任意の付加核酸配列Yの順で構成される2重鎖DNAが、次の工程を含む方法によって調製される、[1]に記載の方法:
(i)生物学的試料から単離したmRNAを鋳型として、前記付加核酸配列YおよびポリT配列とからなる第6のプライマーを用いて逆転写することにより一次鎖cDNAを調製する工程、
(ii)工程(i)により得られた一次鎖cDNAをポリAテーリング反応に付し、次いでこれを鋳型として、前記付加核酸配列XおよびポリT配列とからなる第7のプライマーを用いて二次鎖である2重鎖DNAを調製する工程、および
(iii)工程(ii)により得られた2重鎖DNAを、前記付加核酸配列Xを含み、任意でその下流にポリT配列をさらに含んでもよい第8のプライマーと、前記付加核酸配列Yを含み、任意でその下流にポリT配列をさらに含んでもよい第9のプライマーとを用いて増幅する工程。
[3]前記工程(b)における断片化が、超音波処理で行われる、[1]または[2]に記載の方法。
[4]前記工程(c)において、5’末端のリン酸化と同時に末端の平滑化を行う、[1]から[3]のいずれか1項に記載の方法。
[5]前記工程(c)において、さらに、200塩基から250塩基、または300塩基から350塩基の大きさの断片化2重鎖DNAを選択する工程を含む、[1]から[4]のいずれか1項に記載の方法。
[6]前記工程(a)において、増幅が、2から8サイクルのPCRによって行われる、[1]から[5]のいずれか1項に記載の方法。
[7]前記工程(f)において、増幅が、5から20サイクルのPCRによって行われる、[1]から[6]のいずれか1項に記載の方法。
[8]前記工程(iii)において、増幅が、5から30サイクルのPCRによって行われる、[2]から[7]のいずれか1項に記載の方法。
[9]前記工程(f)において用いる第5のプライマーが、さらにバーコード配列を含む、[1]から[8]のいずれか1項に記載の方法。
[10]生物学的試料が1個から数個の細胞である、[1]から[9]のいずれか1項に記載の方法。
[11]生物学的試料が1個の細胞である、[10]に記載の方法。
[12][1]から[11]に記載の方法で調製された核酸集団における前記増幅された2重鎖DNAの量を、次世代シーケンサーを用いて測定することを含む、当該核酸集団を調製した細胞に含まれるmRNA量の測定方法。
[13]以下を含む、次世代シーケンサーよるmRNA量の測定に適用するためのcDNA集団を調製するためのキット。
(a)5’末端にアミンを付加した任意の付加核酸配列Xを含み、任意でその下流にポリT配列をさらに含んでもよい第1のプライマー
(b)任意の付加核酸配列Yを含み、任意でその下流にポリT配列をさらに含んでもよい第2のプライマー
(c)任意の付加核酸配列Zおよび前記付加核酸配列Yをこの順序で含み、任意でその下流にポリT配列をさらに含んでもよい第3のプライマー
(d)3’末端にチミン(T)をオーバーハングで有する任意の配列Vを含む2重鎖DNA
(e)前記配列Vを含む第4のプライマー
(f)前記付加核酸配列Zを含み、任意でその下流に前記付加核酸配列Yをさらに含んでもよい第5のプライマー
[14]前記(f)の第5のプライマーが、さらにバーコード配列を含む、[13]に記載のキット。
[15](g)前記付加核酸配列YおよびポリT配列からなる第6のプライマー、
(h)前記付加核酸配列XおよびポリT配列からなる第7のプライマー、
(i)前記付加核酸配列Xを含み、任意でその下流にポリT配列をさらに含んでもよい第8のプライマー、および
(j)前記付加核酸配列Yを含み、任意でその下流にポリT配列をさらに含んでもよい第9のプライマー
をさらに含む、[13]または[14]に記載のキット。
[16]前記第6のプライマーと前記第9のプライマーとが同一、および/または、前記第7のプライマーと前記第8のプライマーとが同一である、[15]に記載のキット。
[17]前記第2のプライマーと前記第9のプライマーとが同一である、[15]または[16]に記載のキット。
[18]DNA増幅に用いるポリメラーゼをさらに含む、[13]から[17]のいずれか一項に記載のキット。
本発明は、生物学的試料における遺伝子発現量の相対的な関係を保持している増幅産物を含む核酸集団を調製する方法、およびその方法により得られた核酸集団を提供する。
本発明において、「生物学的試料における遺伝子発現量の相対的な関係を保持している増幅産物」とは、生物学的試料における遺伝子産物群全体の構成(各遺伝子産物間の量比)がほぼ保持されている増幅産物(群)であって、次世代シーケンサーによりmRNAを定量する標準プロトコルに適用できる水準が確保されている増幅産物(群)を意味する。
(a)任意の付加核酸配列X、ポリT配列、生物学的試料から単離したmRNA配列(実際にはmRNA配列に対応するcDNA配列である(以下同じ))、ポリA配列および任意の付加核酸配列Yの順で構成される2重鎖DNAを鋳型として、5’末端にアミンを付加した任意の付加核酸配列Xを含む第1のプライマーと、任意の付加核酸配列Yを含む第2のプライマーとを用いて、該2重鎖DNAを増幅する工程、
(b)前記工程(a)により得られた2重鎖DNAを断片化する工程、
(c)前記工程(b)により得られた断片化2重鎖DNAの5’末端をリン酸化する工程、
(d)前記工程(c)により得られた5’末端がリン酸化された2重鎖DNAを鋳型として、任意の付加核酸配列Zおよび前記付加核酸配列Yをこの順序で含む第3のプライマーを用いてcDNAを調製、該cDNAの3’末端へアデニン(A)を付加する工程、
(e)前記工程(d)により得られた2重鎖DNAへ、3’末端にチミン(T)をオーバーハングで有する任意の配列Vを含む2重鎖DNAを連結させる工程、および
(f)前記工程(e)により得られた2重鎖DNAを鋳型として、任意の配列Vを含む第4のプライマーと、前記付加核酸配列Zを含む第5のプライマーとを用いて、該2重鎖DNAを増幅する工程
生物学的試料から単離したmRNAを鋳型として、前記付加核酸配列YおよびポリT配列からなる第6のプライマーを用いて逆転写することにより一次鎖cDNAを調製する。
(i)により得られた一次鎖cDNAをポリAテーリング反応に付し、次いでこれを鋳型として、前記付加核酸配列XおよびポリT配列からなる第7のプライマーを用いて二次鎖である2重鎖DNAを調製する。
工程(i)にて用いる第6のプライマー:付加核酸配列YおよびポリT配列、および工程(ii)にて用いる第7のプライマー:付加核酸配列XおよびポリT配列、における付加核酸配列XおよびYは、互いに配列が異なる。cDNAの3’側と5’側に対して異なるプライマーを用いることによって、以後のPCR増幅において3’側と5’側を区別できる方向性をつけることができる。
アニーリング温度は典型的には55℃であるので、通常のPCRに用いられるTm値は60℃である。そこで、本発明に用いるプライマーのアニーリング温度は60℃以上90℃未満、好ましくは約70℃、最も好ましくは67℃である。
次に、工程(ii)にて得られた2重鎖DNAを鋳型として、前記付加核酸配列Xを含む第8のプライマーと、前記付加核酸配列Yを含む第9のプライマーを添加し、PCR増幅を行う。該第8のプライマーとして、付加核酸配列Xの下流にポリT配列をさらに含む前記第7のプライマーを、また、該第9のプライマーとして、付加核酸配列Yの下流にポリT配列をさらに含む前記第6のプライマーを用いてもよい(図1C)。また、illumina社次世代シークエンサーを用いる場合は、第8のプライマーとしてP1配列(配列番号8:ccactacgcctccgctttcctctctatg)、第9のプライマーとしてP2配列(配列番号10:ctgccccgggttcctcattct)を用いることもできる(図15A)。
使用する生物学的試料から単離したmRNAの量、すなわち使用する細胞数によって適宜、PCRのサイクルを変更して行うことが行うことができ、例えば、5から30サイクルのPCRが例示され、より好ましくは、100ngの全RNA中に含まれるmRNAを鋳型として用いた場合、7サイクルが例示され、同様に、10ngの全RNA中に含まれるmRNAを鋳型として用いた場合、11サイクルが例示され、1ngの全RNA中に含まれるmRNAを鋳型として用いた場合、14サイクルが例示され、100pgの全RNA中に含まれるmRNAを鋳型として用いた場合、17サイクルが例示され、10pgの全RNA中に含まれるmRNAを鋳型として用いた場合、20サイクルが例示される。
当該アミンの付加により、続く工程(c)においてmRNA配列の5’末端側のリン酸化を抑制することができ、mRNA配列の3’末端側のみを有するライブラリーを構築することを可能とする。本工程(a)での増幅は、2重鎖DNA中の付加核酸配列Xの5’末端にアミンを付加することができれば、特に限定されないが、例えば、2から8サイクルのPCRによって行われ、好適には、4サイクルである。付加されるアミンは工程(c)における5’末端のリン酸化を抑制し得る限り特に制限はないが、好ましくはアミノ基が付加される。
本工程(b)は、工程(a)で得られた2重鎖DNAを断片化する工程である。DNAの断片化は、超音波を用いて分裂させる方法やDNA断片化酵素を用いて行う方法が例示される、本発明では、超音波を用いて分裂させる方法が好適に用いられる。
本工程(c)は、工程(b)により得られた断片化2重鎖DNAの5’末端をリン酸化する工程であり、当該リン酸化は、自体公知の核酸キナーゼを用いて行うことができる。ただし、上述のとおり、アミンの付加された5’末端は、リン酸化することができない。工程(b)において、超音波を用いて断片化した場合、切断された末端が、平滑化されていない可能性があるので、DNAポリメラーゼを用いて、末端の平滑化を行ったのち、本工程(c)を行うことが望ましい。
本工程(c)の後、任意の塩基長の大きさの断片化2重鎖DNAを選択する工程を行っても良い。本塩基長は、シークエンスによりmRNAが認識できる長さであれば特に限定されないが、好ましくは、Life Technologies社SOLiD5500xlでは200塩基から250塩基長、illumina社Miseq/NextSeq500/Hiseq2000/2500/3000/4000では350塩基から500塩基長である。
本工程(d)では、工程(c)により得られた5’末端がリン酸化された2重鎖DNAを鋳型として、前記付加核酸配列Y(および任意でさらにポリT配列)を含む第2のプライマーの5’側にさらに任意の付加核酸配列Zを含む、第3のプライマーを用いて、該5’末端がリン酸化された2重鎖DNAへ該付加核酸配列Zを付加する工程である。当該工程では、工程(c)により得られた5’末端がリン酸化された2重鎖DNAを鋳型として、当該第3のプライマーを添加して、DNAポリメラーゼを用いて伸長反応を行うことにより、該付加核酸配列Zを該2重鎖DNA中の付加核酸配列Yに付加することができる。DNAポリメラーゼとして3’末端にアデニン(A)を付加するTdT活性を有する酵素を用いることにより、該2重鎖DNAの各鎖3’末端にアデニン(A)が付加される。本工程(d)により、5’末端がリン酸化された生物学的試料から単離したmRNA配列、ポリA配列、任意の付加核酸配列Yおよび任意の付加核酸配列Zの順で構成される2重鎖DNAを得ることができる。任意の付加核酸配列Zは、使用する次世代シークエンサーに依存した配列であり、当該シークエンサーの製造業者が推奨する配列を用いて行うことができる。例えば、Life technologies社のSOLiD5500XLを用いる場合、任意の付加核酸配列Zとして、配列番号3(ctgctgtacggccaaggcgt)で表されるInt配列を用いることができる。また、illumina社のMiseq/NextSeq500/Hiseq2000/2500/3000/4000を用いる場合、該付加核酸配列Zとして、配列番号13(gtgactggagttcagacgtgtgctcttccgatc)で表されるRd2SP配列を用いることができる。
センス鎖(工程(d)により得られた2重鎖DNAのうちmRNA配列のセンス鎖を含む鎖に連結する鎖)の3’末端にチミン(T)をオーバーハングで有する任意の配列Vを含む2重鎖DNAとは、3’末端側に1塩基(T)のみ相補鎖がない状態の2重鎖DNAであり、当該オーバーハング部分が、連結される2重鎖DNAの5’末端において、同様に1塩基(A)オーバーハングである相補鎖を有する場合、突出末端でのライゲーションが可能となる。本発明において、配列Vは、使用する次世代シークエンサーに依存した配列であり、例えば、Life technologies社やillumina社において市販されている配列を用いて行うことができる。具体的には、例えば、図1CにおけるP1-T(配列番号11:ccactacgcctccgctttcctctctatgt)や図15AにおけるRd1SP-T(配列番号12:tctttccctacacgacgctcttccgatct)(いずれもセンス鎖)を用いることができる。
本工程(f)において、用いる第4のプライマーおよび第5のプライマーは、使用する次世代シークエンサーに依存した配列である。第5のプライマーは、付加核酸配列Zを少なくとも含有していればよく、任意でその下流に前記付加核酸配列Yさらに含んでもよい。より好ましくは、第5のプライマーはバーコード配列をさらに含むことが望ましく、任意の配列を有するアダプター配列をさらに含んでいることが望ましい。例えば、当該第4のプライマーおよび第5のプライマーは、Life technologies社やillumina社において市販されている配列を用いて行うことができる。
本工程(f)において、増幅は、第4のプライマーおよび第5のプライマーで増幅されない2重鎖DNA(mRNA配列の3’末端側または内部配列を含む断片化2重鎖DNA)が相対的に減少すれば、特にサイクル数は限定されないが、例えば、5から30サイクルのPCRが例示され、好適には、9サイクルである。
本発明のキットは、上述した以下のプライマーによって構成されても良い;
(a)5’末端にアミンを付加した任意の付加核酸配列X(および任意でさらにポリT配列)を含む第1のプライマー
(b)任意の付加核酸配列Y(および任意でさらにポリT配列)を含む第2のプライマー
(c)任意の付加核酸配列Zおよび前記付加核酸配列Y(および任意でさらにポリT配列)をこの順序で含む第3のプライマー
(d)3’末端にチミン(T)をオーバーハングで有する任意の配列Vを含む2重鎖DNA
(e)前記配列Vを含む第4のプライマー、および
(f)前記付加核酸配列Z(および任意でさらに前記付加核酸配列Y)を含む第5のプライマー。
当該キットは、任意の付加核酸配列X、ポリT配列、生物学的試料から単離したmRNA配列、ポリA配列および任意の付加核酸配列Yの順で構成される2重鎖DNAを調製するための以下のプライマーセット:
(g)前記付加核酸配列YおよびポリT配列からなる第6のプライマー、
(h)前記付加核酸配列XおよびポリT配列からなる第7のプライマー、
(i)前記付加核酸配列Xを含み、任意でその下流にポリT配列をさらに含んでもよい第8のプライマー、および
(j)前記付加核酸配列Yを含み、任意でその下流にポリT配列をさらに含んでもよい第9のプライマー
をさらに含んでもよい。ここで、前記第6のプライマーと前記第9のプライマーとは同一であってよく、また、前記第7のプライマーと前記第8のプライマーとは同一であってよい。さらに、前記第2のプライマーと前記第9のプライマーとが同一であってもよい。
当該キットは、PCR反応に必要な他の試薬(例えば、DNAポリメラーゼ、dNTPミックス、緩衝液等)、ライゲーション反応、逆転写反応、末端リン酸化反応等に必要な他の試薬などをさらに含んでもよい。
マウスを用いた動物実験は、京都大学の倫理ガイダンスに従って行われた。マウス胚性幹細胞(mESC)株であるBVSC R8は従来法に従って培養し(Hayashi, K. et al, Cell, 146, 519-532, 2011)、細胞株からの全RNAの抽出は、RNeasy mini kit(Qiagen (74104))を用いて製造者マニュアルに従って行われた。抽出したRNAは、double-distilled water (DDW)により250 ng/μl, 25 ng/μl, 2.5 ng/μl, 250 pg/μlおよび25 pg/μlの濃度へと希釈し、single-cell mRNA 3-prime end sequencing(以下、SC3-seqという)の定量性評価に用いた。
単離した単一細胞のRNAからのV1V3-cDNA合成および増幅は、既存の方法(Kurimoto, K. et al, Nucleic Acids Res, 34, e42, 2006またはKurimoto, K. et al, Nature protocols, 2, 739-752, 2007)に従って行った。ただし、Qiagen RNase inhibitor(0.4 U/sample)(Qiagen (129916))、Porcine Liver RNase inhibitor(0.4 U/sample)(Takara Bio (2311A))およびExternal RNA Controls Consortium(ERCC)により開発されたspike-in RNA(ERCC spike-in RNA)(Life Technologies (4456740))の使用、ならびに全RNA量ごとのPCRサイクル数(100 ngの全RNAでは7 cycles、10 ngの全RNAでは11 cycles、1 ngの全RNAでは14 cycles、100 pgの全RNAでは17 cycles、10 pgの全RNAでは20 cycles)は、従来法とは異なる。P1P2-cDNAの合成および増幅は、SuperScript4(Life Technologies (18090200))とKOD FX NEO (Toyobo (KFX-201))の使用がV1V3-cDNA合成および増幅と異なる。ERCC spike-in RNAの全62,316または12,463コピーを、10 pgの全RNAまたは単一細胞あたりの溶解液に添加した。SC3-seqライブラリーの構築前に、増幅したcDNAの品質をERCC spike-in RNAおよび内在性遺伝子の定量PCR(Q-PCR)におけるCt valuesを調べること、およびLabChip GX(Perkin Elmer)またはBioanalyzer 2100(Agilent Technologies)によってcDNAフラグメントの割合を調べることで評価した。なお、mESCの全RNA希釈分析のためには、ERCC spike-in RNAとして、ERCC-00074(9030 copies)、ERCC-00004(4515 copies)、ERCC-00113(2257 copies)、RCC-00136(112.8 copies)、ERCC-00042(282.2 copies)、ERCC-00095(70.5 copies)、RCC-00019(17.6 copies)およびERCC-00154(4.4 copies)を用い、マウスの着床前胚およびhiPSCsのためには、RCC-00096(1806 copies)、ERCC-00171(451.5 copies)、ERCC-00111(56.4 copies)を用い、内在性遺伝子については、表1に記載の遺伝子を用いた。

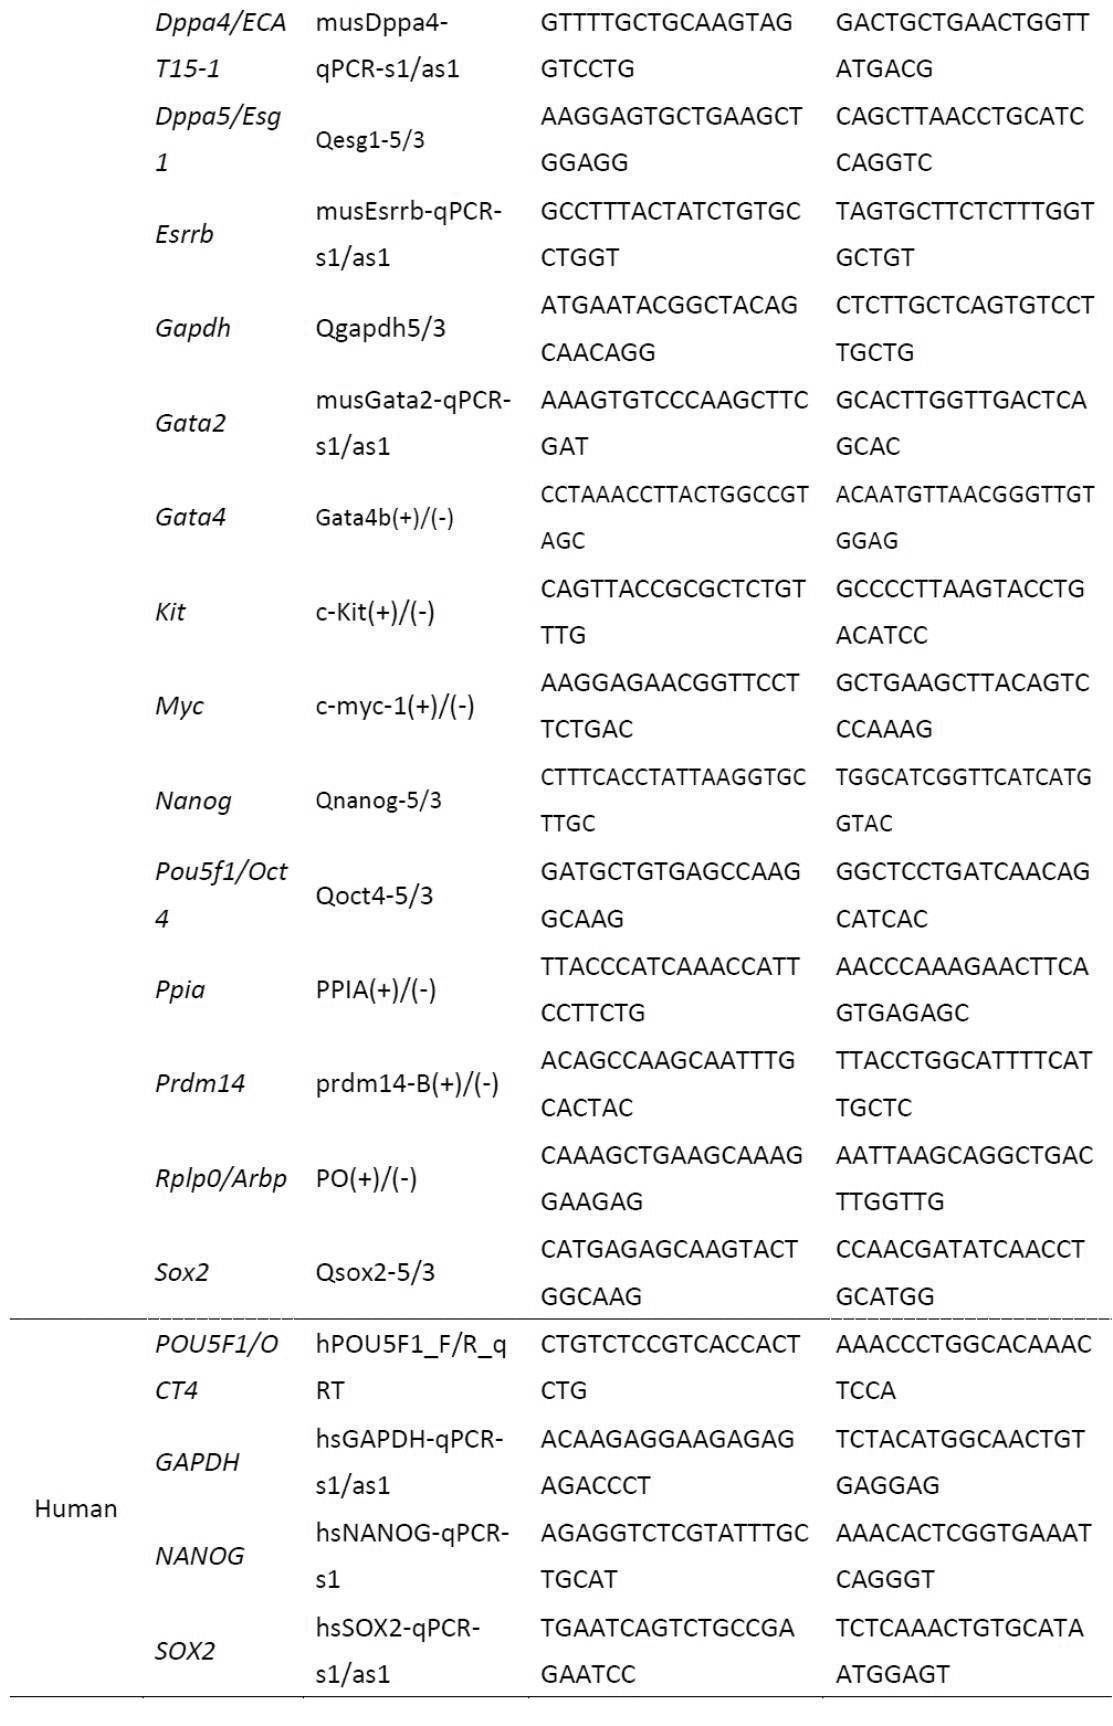
Q-PCRは、Power SYBR Green PCR Master mix(Life Technologies (4367659))を用いて、CFX384 real-time qPCR system(Bio-Rad)により製造者マニュアルに従って行った。プライマー配列は、表1に示す。
5 ngの増幅および品質確認済みのcDNAをpre-amplification buffer((1 × ExTaq buffer)(Takara Bio (RR006))、0.2 μMの各dNTP(Takara Bio (RR006))、0.01 μg/μl N-V3 (dT)24 primer(HPLC-purified, 5’側末端にアミン付加)、0.01 μg/μl V1(dT)24 primer (HPLC-purified)および0.025 U/μl ExTaqHS(Takara Bio (RR006)))に添加し、PCRを4サイクル回して増幅した。プライマーダイマーといった副産物を0.6 × volumeのAMPureXP beads(Beckman Coulter (A63881))を用いてサイズ選択により取り除いた。精製したcDNAsは、double-distilled water (DDW)で希釈して130 μlとし、Covaris S2またはE210(Covaris)を用いて断片化した。さらに、End-polish buffer(1 × NEBnext End Repair Reaction buffer(NEB (B6052S))、0.01 U/μlのT4 DNA polymerase(NEB (M0203))および0.033 U/μlのT4 polynucleotide kinase(NEB (M0201)))中で20℃、30分間処理することで末端ポリッシュを行い、0.8倍量のAMPureXPを加え、さらに20分間撹拌し、1.2倍量のAMPureXPに移し、cDNAを精製した。続いて、Int-adaptor配列と精製cDNAを提供するため、cDNAは30 μlのInternal adaptor extension buffer(1 × ExTaq Buffer、0.23 mMの各dNTP、0.67 μMのIntV1 (dT)24 primer (HPLC-purified)、0.033 U/μlのExTaqHS)中で95℃を3 min、67℃を2 minおよび72℃を2 minのプログラムでサーマルサイクラーに供した。反応は、氷冷することで停止させ、20 μlのP1-adaptor ligation buffer(10 μlの5 × NEBNext Quick Ligation Reaction Buffer(NEB (B6058S))、0.6 μlの5 μM of the P1-T adaptor(Life Technologies (4464411))および1 μlのT4 ligase(NEB (M0202M))の混合物)を加えた後、20℃で15分間、72℃で20分間インキュベーションした。1.2倍量のAMPure XPを添加し、cDNAの精製を2度行った後、cDNAをFinal amplification buffer(1 × ExTaq buffer、0.2 mMの各dNTP、1 μMのP1 primer、1 μMのBarT0XX_IntV1 primer (HPLC-purified)(XXは2ケタの整数を示し、具体的なプライマーは表2に列挙した)、0.025 U/μlのExTaqHS)に加え、95℃で3 minのインキュベーション後、95℃で30 sec、67℃で1 minおよび72℃で1 minを9 cycles、その後72℃で3 minのプログラムでサーマルサイクラーに供し、PCRによって増幅した。最後に、cDNAライブラリーは、1.2倍量のAMPureXPを用いて精製し、20 μl TE bufferへ溶解した。構築したライブラリーの品質と容量は、a Qubit dsDNA HS assay kit(Life Technologies (Q32851))およびSOLiD Library TaqMan Quantitation kit(Life Technologies (4449639))を用いてLabChip GXまたはBioanalyzer 2100により評価した。emulsion PCRによるビーズ上でのライブラリーの増幅は、SOLiDTM EZ BeadTM System(Life Technologies (4449639))を用いて、製造者マニュアルに従ってE120スケールで実施した。得られたビーズライブラリーは、flowchipに装填し、SOLiD 5500XL systemの50 bpおよび5 bp barcode plus Exact Call Chemistry (ECC)で測定した。
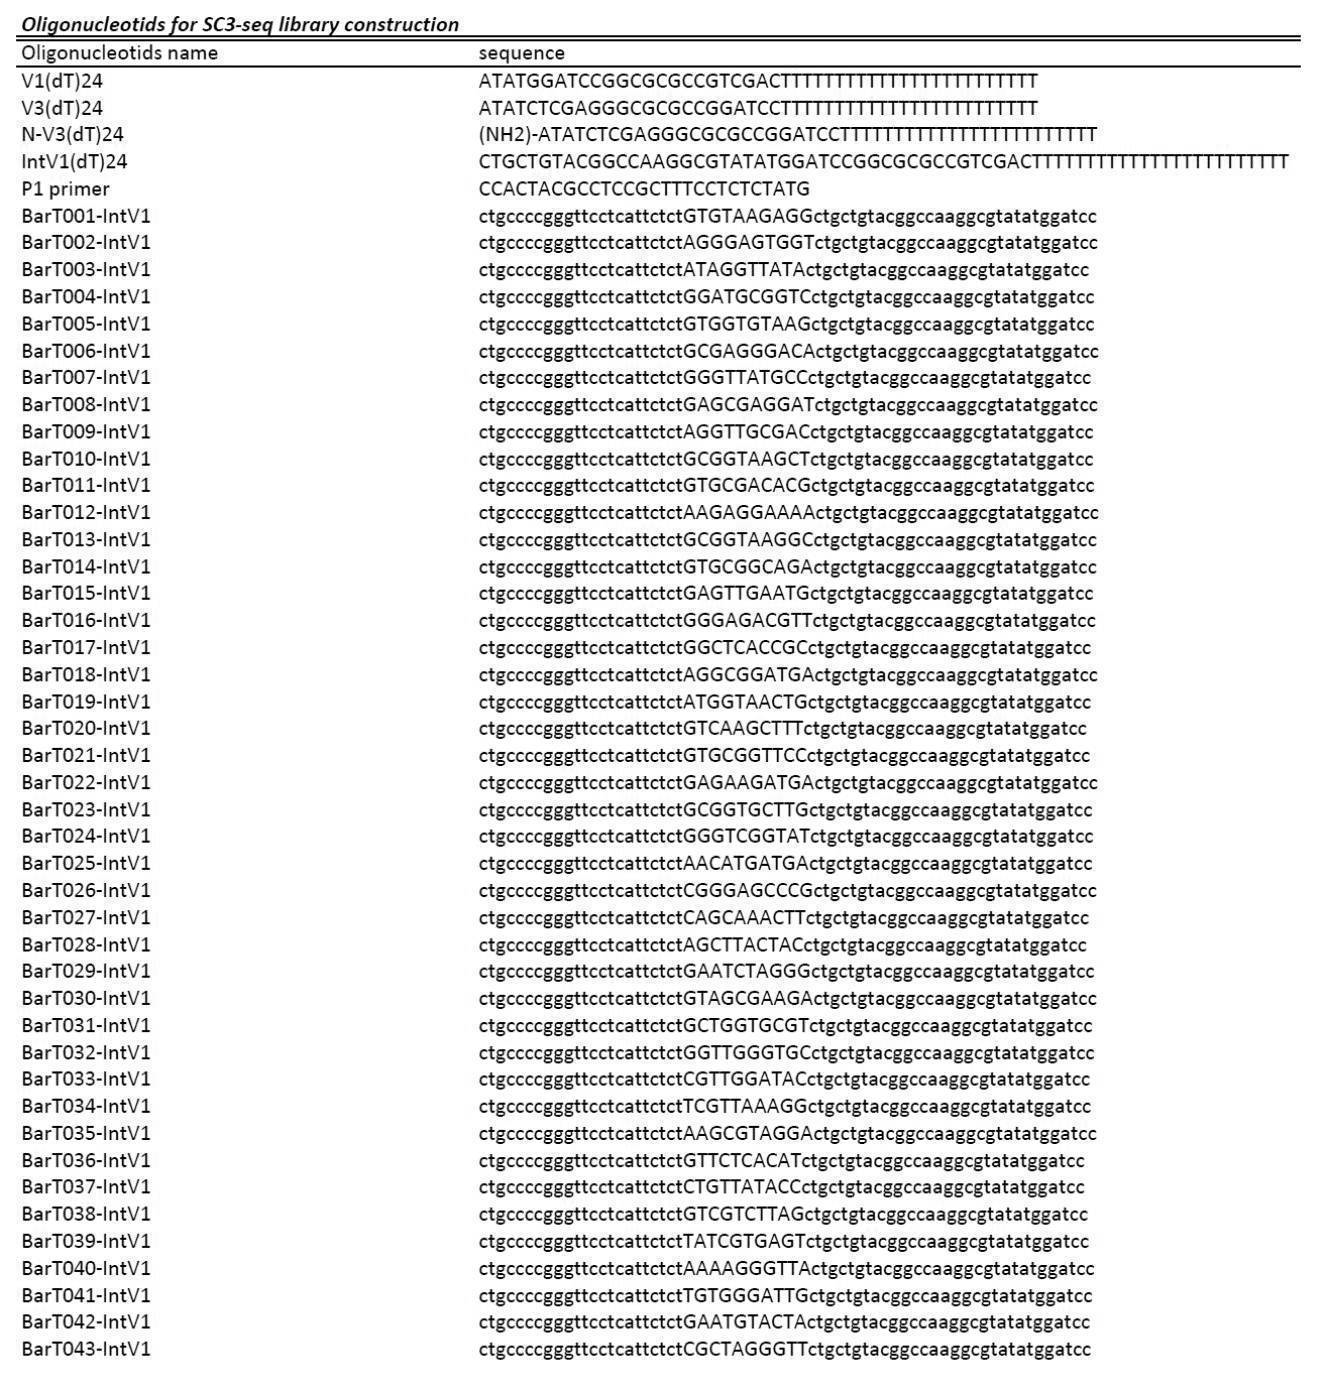
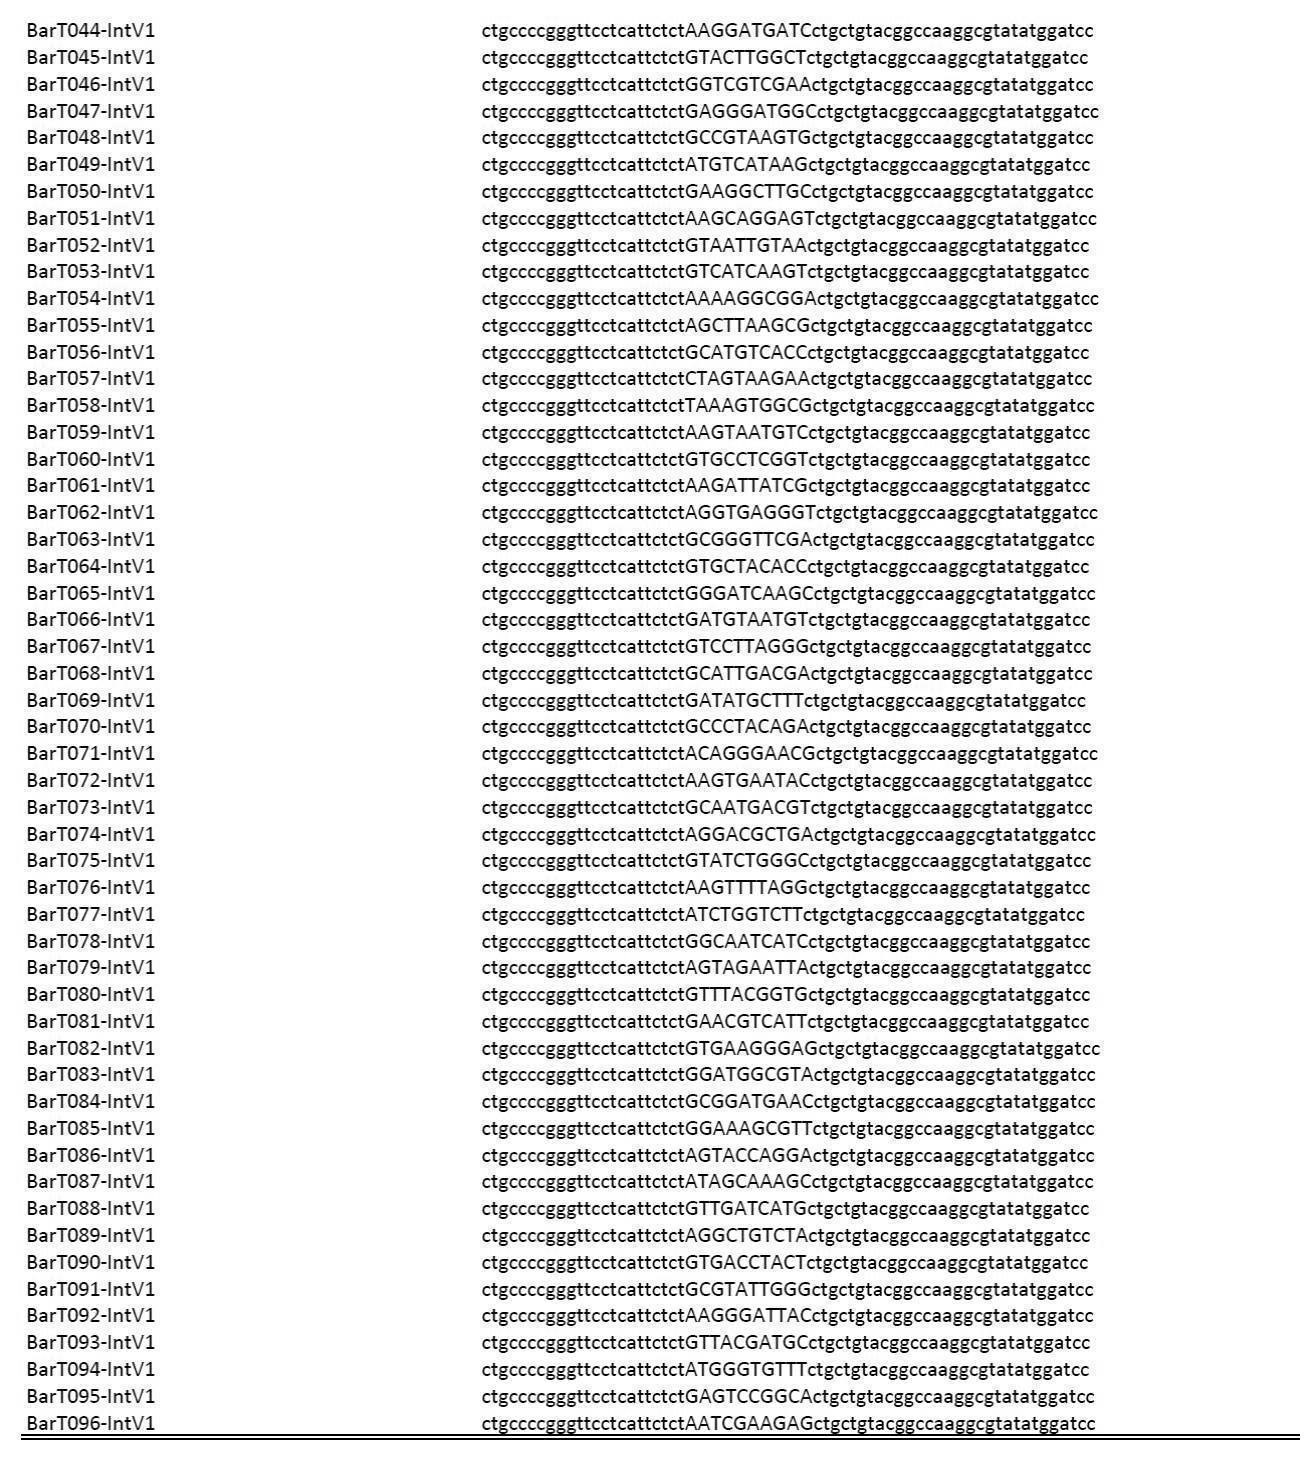
2 ngの増幅および品質確認済みのcDNAをpre-amplification buffer((1 × KOD FX NEO buffer)、0.4 μMの各dNTP(Takara Bio (RR006))、0.3 μM N-P1 primer(HPLC-purified, 5‘側末端にアミン付加)、0.3 μM P2 primer (HPLC-purified)および0.02 U/μl KOD FX NEO)に添加し、PCRを4サイクル回して増幅した。その後PCR産物を0.6 × volumeのAMPureXP beads(Beckman Coulter (A63881))を用いて精製した。精製したcDNAsは、double-distilled water (DDW)で希釈して130 μlとし、Covaris S2またはE210(Covaris)を用いて断片化した。さらに、End-polish buffer(1 × NEBnext End Repair Reaction buffer(NEB (B6052S))、0.01 U/μlのT4 DNA polymerase(NEB (M0203))および0.033 U/μlのT4 polynucleotide kinase(NEB (M0201)))中で20℃、30分間処理することで末端ポリッシュを行い、0.7倍量のAMPureXPを加え、さらに20分間撹拌し、0.9倍量のAMPureXPに移し、cDNAを精製した。続いて、Rd2SP-adaptor配列と精製cDNAを提供するため、cDNAは30 μlのInternal adaptor extension buffer(1 × ExTaq Buffer、0.23 mMの各dNTP、0.67 μMのRd2SP-P2 primer (HPLC-purified)、0.033 U/μlのExTaqHS)中で95℃を3 min、60℃を2 minおよび72℃を2 minのプログラムでサーマルサイクラーに供した。反応は、氷冷することで停止させ、20 μlのRd1SP-adaptor ligation buffer(10 μlの5 × NEBNext Quick Ligation Reaction Buffer(NEB (B6058S))、0.6 μlの10 μM of the Rd1SP adaptorおよび1 μlのT4 ligase(NEB (M0202M))の混合物)を加えた後、20℃で15分間、72℃で20分間インキュベーションした。0.8倍量のAMPure XPを添加し、cDNAの精製を2度行った後、cDNAをFinal amplification buffer(1 × KOD FX NEO buffer、0.4 mMの各dNTP、0.3125 μMのS5XX primer(XXは2ケタの整数を示し、具体的なプライマーは表3に列挙した)、0.3125 μMのN7XX primer (HPLC-purified) (XXは2ケタの整数を示し、具体的なプライマーは表3に列挙した)、0.02 U/μlのKOD FX NEO)に加え、95℃で3 minのインキュベーション後、95℃で10 sec、60℃で1 minおよび68℃で1 minを9 cycles、その後68℃で3 minのプログラムでサーマルサイクラーに供し、PCRによって増幅した。最後に、cDNAライブラリーは、0.9倍量のAMPureXPを用いて精製し、20 μl TE bufferへ溶解した。構築したライブラリーの品質と容量は、a Qubit dsDNA HS assay kit(Life Technologies (Q32851))、KAPA Library Quantification Kits(KAPA (KK4828)) 、およびLabChip GXまたはBioanalyzer 2100により評価した。得られたLibrary DNAはMiseq Reagent kit v3, 150cycle (illumina (MS-102-3001))を用いて解析した。
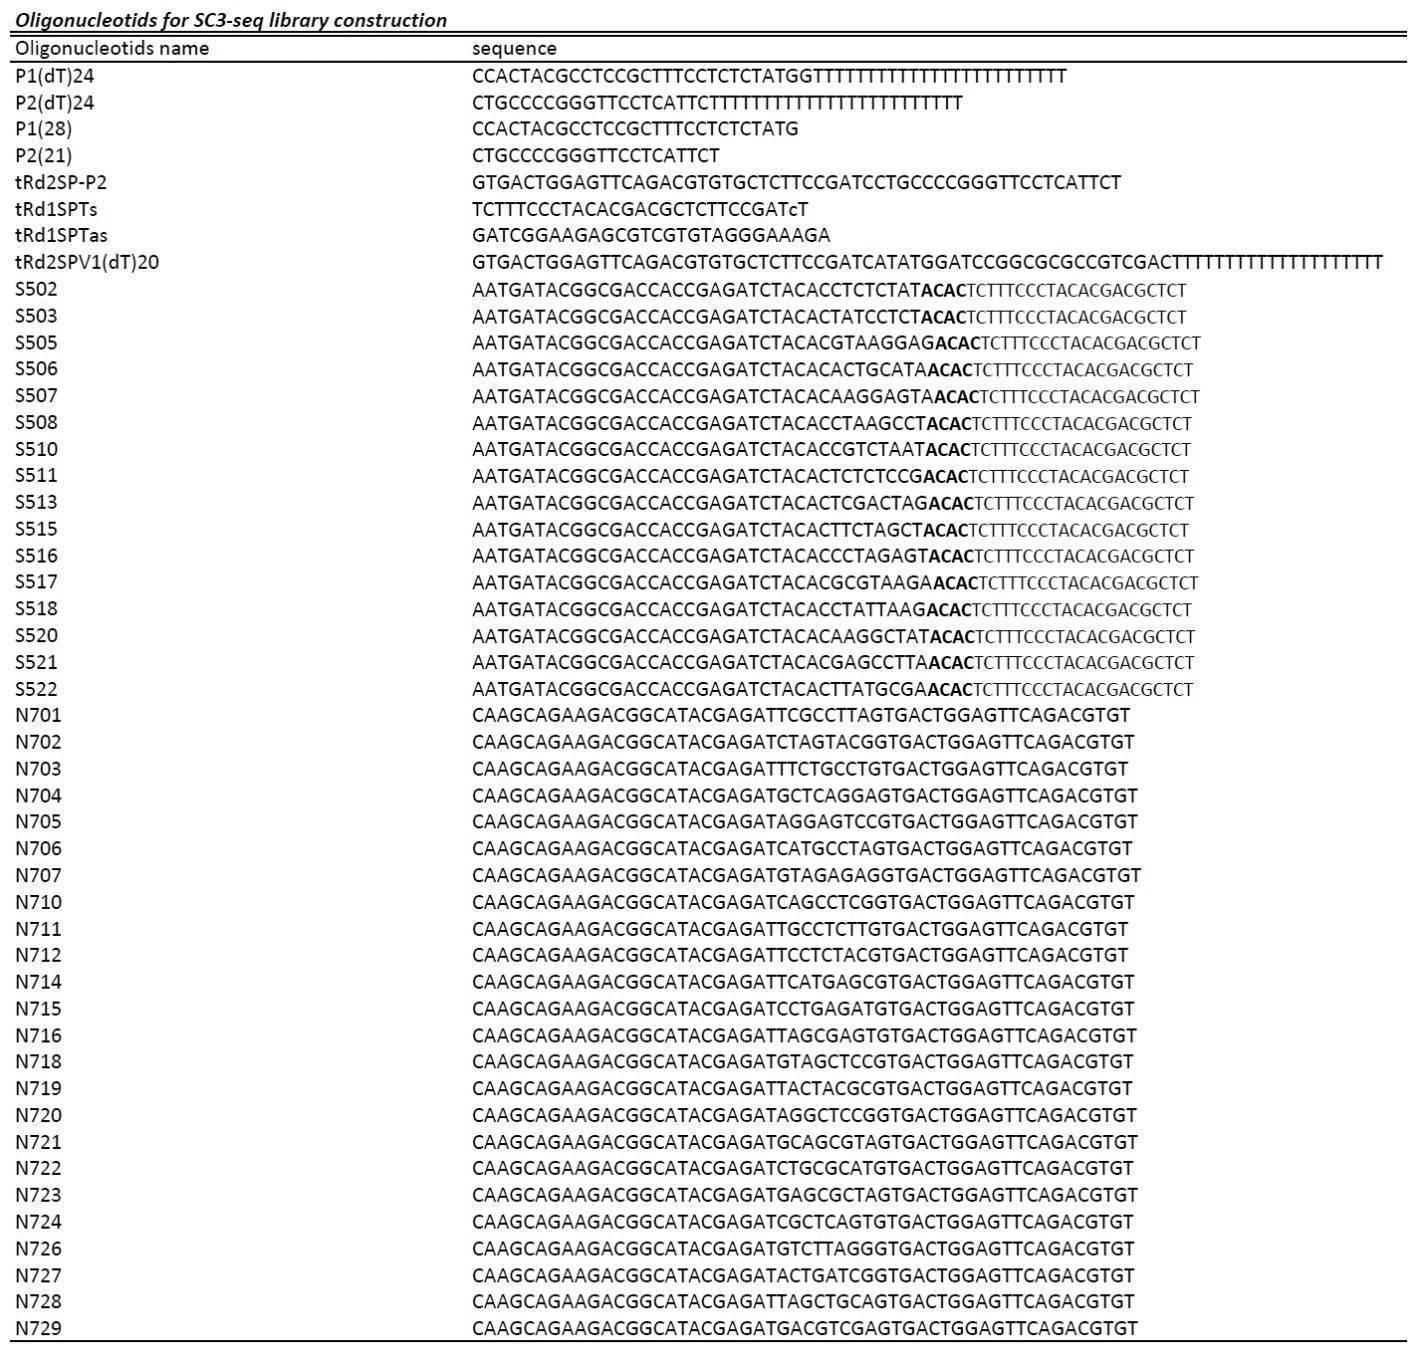
アダプターまたはpoly-A配列は、cutadapt-1.3によってトリムし、全てのリードを検索した。ただし、30 bp以下のトリムされたリードは排除した。アダプターおよびpoly-A配列は、それぞれ総リードの約1-20%および5%で確認された。30 bp以上のトリムされなかったリードおよびトリムされたリードは、mouse genome mm10およびERCC spike-in RNAの“-no-coverage-search”オプションでtophat-1.4.1/bowtie1.0.1によりマッピングされた。ゲノムおよびERCC上マッピングされたリードは、分離され、ゲノム上のリードは、“-compatible-hits-norm”、 “-no-length-correction”および“-library-type fr-secondstrand”オプションおよびextended TTS(転写終結サイト)でアノテーションされたmm10参照遺伝子を用いてcufflinks-2.2.0により発現レベルに変換した。いくつかの遺伝子の発現レベルを評価した際に、cufflinksのオプション “-max-mle-iterations”をデフォルトである5,000でおこなったところ “FAILED”の結果であったため、cufflinksのオプション “-max-mle-iterations”は50,000にセットした。cufflinksを用いた参照遺伝子のアノテーションのため、3’方向へ参照より長い転写産物を有する遺伝子の発現レベルを正しく見積もるため、10kb下流以上まで参照遺伝子の転写終結サイト(TTS)を拡張した。細胞あたりの転写コピー数を評価するため、ERCC spike-in RNAのリードは、遺伝子発現解析に用いたゲノム上にマッピングされた総リードによって、million-mappedリードあたりのリード数(RPM)に標準化された。マッピングされたリードは、igv-2.3.34を用いて視覚化された。HTSeq-0.6.0によるマッピングされたリードの発現レベルへの変換は、上述したオプションを用いたcufflinks-2.2.0による結果と一致した。
分析は、R software version 3.0.2およびExcel (Microsoft)を用いて行った。SC3-seqによる発現データは、図4ならびに図10Aおよび10B以外では、発現量としてlog2 (RPM+1)を用いて分析された。図4では、0.01未満のRPM/FPKM valuesは、相関係数の計算のため、0.01として行った。図10Aおよび10Bでは、0.1未満のRPM/FPKM valuesは、相関係数の計算のため、0.1として行った。
Gplotsおよびqvalue packagesを備えたR software version 3.1.1およびEXCELを用いて解析をおこなった。すべての発現データ解析は、log2 (RPM+1)値を用いて行われた。サンプルにおいてlog2(RPM+1)値は4以下である遺伝子(およそ20コピー/細胞)は、解析から除外した。Unsupervised hierarchical clustering (UHC)は、Euclidian distancesおよびWard distance functionsを備えたhclust functionを用いて行った。principal component analysis (PCA)は、スケーリングなしのprcomp functionを用いて行われた。
ホールマウント免疫蛍光解析のため、単離した胚は、4%パラホルムアルデヒドのPBS中で20分間室温で固定し、2%BSA/PBSで洗浄し、permeabilization solution (0.5% Triton X / 1.0% BSA / PBS)中で20分間、室温でインキュベートした。2%BSA/PBSで2度洗浄後、胚は一次抗体を含有する2% BSA/PBS中で4℃一夜インキュベートし、2%BSA/PBSで3度洗浄後、二次抗体および4,6-diamidino-2-phenylindole (DAPI)を含有する2%BSA/PBS中で1時間、室温でインキュベートし、2%BSA/PBSで3度洗浄した。VECTASHIELD Mounting Medium(Vector Laboratories (H-1000))を用いてマウントした。一次抗体として、anti-mouse NANOG(rat monoclonal)(eBioscience (eBio14-5761))、anti-mouse POU5F1(mouse monoclonal)(Santa Cruz (sc-5279))、anti-mouse GATA4(goat polyclonal)(Santa Cruz (sc-1237))、anti-mouse CDX2(rabbit monoclonal, clone EPR2764Y)(Abcam (ab76541))を用いた。二次抗体として、Alexa Fluor 488 anti-rat IgG(Life Technologies (A21208))、Alexa Fluor 555 anti-rabbit(Life Technologies (A31572))、Alexa Fluor 568 anti-mouse IgG(Life Technologies (A10037))およびAlexa Fluor 647 anti-goat IgG(Life Technologies (A21447))(全てdonkey polyclonal)を用いた。蛍光像は、共焦点顕微鏡(Olympus (FV1000))を用いて得られた。
Accession numbersは、本分野で一般的に用いられている次のデータを用いた;SC3-seq data (GSE63266, GSE74767)、RNA-seq data for mESCsおよびmouse embryonic fibroblasts (MEFs)(GSE45916) (Ohta, S., et al., Cell reports, 5, 357-366, 2013), SMART-seq2 data for MEF (GSE49321) (Picelli, S., et al., Nat Methods, 10, 1096-1098, 2013)およびsingle-cell RNA-seq data for hESCs. (GSE36552) (Yan, L., et al., Nat Struct Mol Biol, 20, 1131-1139, 2013)。
単一細胞cDNAの増幅は、高密度オリゴヌクレオチドマイクロアレイ様の3’末端側を濃縮する方法を用いた(Kurimoto, K., et al., Nucleic Acids Res, 34, e42, 2006およびKurimoto, K., et al., Nature protocols, 2, 739-752, 2007)。当該方法は、マウス胚盤胞など不均一な細胞種の解析、始原生殖細胞(PGC)の発生におけるトランスクリプトームの解明、大脳皮質の発生における神経細胞種の解明など多様性のある細胞の発生解析に有用である。本方法は、単一細胞でのトランスクリプトーム解析だけでなく多くの細胞を対象とする場合においても有用であることが示されている。本方法は、cDNAの全長を含む長いcDNAが合成され、RNA-seqにより解析されること狙って改良している。しかし、全長cDNAの合成効率の悪さおよび長いcDNAを増幅する際のバイアスの影響を考慮すると、cDNAの3’末端側の配列を増幅することが遺伝子発現レベルの適切な解析となると考えられた(図1A)。さらに、3’末端側の配列のみであれば、必要な配列長がより短くなり(図1B)、コスト面において有利である。
図1Fに示したように、マッピングされたリードの増加を提示する遺伝子数は、アノテーションされたTTSからTTSの定義の拡張により増加し、450遺伝子は、10 KbまでTTSの定義を拡張することによりマッピングされたリードが増加した。10 Kb以上までの拡張が、間違ってアノテーションすることを見出したため、直前の上流遺伝子の発現を示すアノテーションされたTTSから10 Kb下流以内で検出したピークを定義づけ、SC3-seqのデータを解析した。公開されたRNA-seqデータの解析によって、この定義付けによるmESCの網羅的RNA量の安定性を確認した。
SC3-seqの定量性を評価するため、全RNAの1 ng (100細胞相当)および10 pg (1細胞相当)から増幅されたcDNAにおける遺伝子数としてQ-PCRにより測定されたthreshold-cycle (CT)値と同じcDNAから用意されたライブラリーにおける同じ遺伝子セットのSC3-seqリードに対する[log2 (RPM+1)]値の関係を分析した。図2Aに示されたように、CT値とSC3-seqのリードは、両cDNAの間に相関関係を示した(1ngおよび10 pg RNAからのcDNAに対してそれぞれR2 = 0.9858および0.9428であった)。さらに、10 pgのRNAにおける30コピー以下であったspike RNAは、不十分な増幅を提示したが、希釈して得られた全ての増幅されたライブラリーにおけるERCC spike-in RNAのSC3-seqリードの[log2 (RPM+1)]値は、元のコピー数に相関した(図2B)(各希釈における10 pgの全RNAあたりのERCC spike-in RNAのコピー数を示した)。これにより、SC3-seqのリード数から10 pgのRNAあたりの遺伝子のコピー数を見積もることを可能とした。散布図分析により、100 ng(10,000細胞相当), 10 ng (1,000細胞相当)および1 ng (100細胞相当) のRNAから増幅したサンプルが、全ての遺伝子2倍差分直線内に全ての遺伝子が入り、非常に良い相関関係(それぞれ、R2 = 0.994,0.992および0.988)を示すことが確認された(図2Cおよび2G)。100 pg (10細胞相当)のRNAから増幅したサンプルは、2倍および4倍差分直線内にそれぞれ89.6%および97.8%がプロットされ、良い相関関係を示した(図2Cおよび2G)。10 pg (1細胞相当)のRNAから増幅したサンプルは、2倍および4倍差直線内にそれぞれ77.6%および86.1%がプロットされ、良い相関関係を示した(図2Cおよび2G)。増幅されたサンプルは、10 pgのRNAあたり20コピー以上発現していた遺伝子は良い相関関係を有しており、特に2倍および4倍差分直線内のそれぞれ85.4%および99.6%の遺伝子でR2 = 0.764であり、10 pgのRNAから増幅した遺伝子の相関性は高かった(図2Cおよび2G)。
SC3-seqの定量的な機能を比較するため、単一細胞のRNA-seqの他の方法と比較した。まず、SC3-seqおよび対照として他の方法により調製されたサンプルにおける発現レベルおよび転写産物の長さの関係を調べた。さらに、mESCおよびMEFの網羅的なRNA定量として公開されているRNA-seqとも比較した。図4Aに示されたように、対照サンプルは転写産物の長さおよび細胞種にかかわらず発現レベル領域の多様な分布を示した(Ohta_mESCsおよびOhta_MEFs)。平均の発現レベルが全ての転写産物の長さにおいて同様であった(発現レベルのモードは、log2 FPKM (fragment per kilobase per million mapped reads) = 2である)。おどろくべきことに、100 ngおよび10 pgのRNAのSC3-seqにより検出されたmESCにおける転写産物の長さの機能として、発現レベル領域の分布は、対照RNA-seqによるものと同様であった(図4A)。例えば、発現レベルのモードは全ての転写産物の長さにおいて同様であるように (およそlog2 RPM = 4)、転写産物の長さにかかわらず遺伝子の発現レベルは一定であった。この結果は、SC3-seqは、単一細胞レベルを初期マテリアルとして用いても全ての転写産物の長さの遺伝子発現を代替していることが示された。
E4.5日目の着床前のマウス胚は、少なくとも3つの細胞種、エピブラスト、始原内胚葉(PE)および栄養外胚葉(TE)から成る。前2つの細胞は、内部細胞塊(ICM)を形成している。解剖学的には、TEは2つの細胞種、ICMに直接接触して胚胎外胚葉(ExE)を形成するpTE(極性TE)と胚盤胞の胚体外組織の一部と後の初期の栄養芽層巨大細胞を形成するmTE(壁TE)に分類される。これまで、E4.5日目のpTEおよびmTE間の遺伝子発現の違いは報告されていない。SC3-seqを用いて、胚盤胞における細胞種の区別ができるか否かについて調べた。
SC3-seqにより、均一な細胞集団における遺伝子発現の不均一性を検出できるかを調べた。フィーダー細胞上で培養したhiPSC(on-feeder hiPSC)およびフィーダーフリー条件で培養したhiPSC(feeder-free hiPSC)での遺伝子発現を測定した。このため、2つのhiPSC株(585A1および585B1)をSNLフィーダー細胞上およびフィーダーフリー条件で培養し(全部で112個分の単一細胞cDNAを得た)(図6A、図12Aおよび12B)、細胞(on-feeder 585A1, on-feeder 585B1, feeder-free 585A1およびfeeder-free 585B1を、それぞれ7個, 7個, 8個, and 7個の単一細胞分)に対してSC3-seqを用いて分析を行った(図12C)。UHC分析により、on-feeder hiPSCおよびfeeder-free hiPSCが、細胞株の違いにかかわらず、2つの異なるクラスターに分類できることが見出された。ただし、一つのon-feeder hiPSCは、feeder-freeクラスターに分類され、一つのfeeder-free hiPSCは、on-feeder hiPSCに分類されたことを除いた(図6B)。このことから、on-feeder hiPSCおよびfeeder-free hiPSCは、とても似ているが区別できることを示唆している。続いて、PCA分析の結果、二つの異常値を除いて、feeder-free hiPSCが、互いに近くに分類され、on-feeder hiPSCは、PC2軸に沿って分散されることが見出された(図6C)。このことは、on-feeder hiPSCの遺伝子発現は、feeder-free hiPSCと比べてより不均一であることを示している。さらに、on-feeder hiPSCおよびfeeder-free hiPSCにおける遺伝子発現レベルに対する遺伝子発現レベルの標準偏差(SD)をプロットした(図6D)。on-feeder hiPSCにおいて、最大発現レベルであるlog2 (RPM+1) ≧ 6であり、SD ≧2である630遺伝子を見出したが、feeder-free hiPSCでは、109個であった。すなわち、PCA分析の結果と一致して、全ての遺伝子発現領域において、feeder-free iPSCのSD値と比較して、on-feeder hiPSCのSD値が高いことが示された。feeder-free iPSCの遺伝子発現レベルのSD値を、on-feeder hiPSCのものに対してプロットしたところ、PK1B, UNC5D, SCGB3A2, HERC1, RPS4Y1およびRBM14/RBM4を含むfeeder-free iPSCでSD値が高い75の遺伝子、ZFP42, ANXA3, LEFTY1, PTCD1およびLDOC1を含むfeeder-free hiPSCおよびon-feeder hiPSC共にSD値が高い(SD ≧2)遺伝子、ならびにFGF19, CAV1, NODAL, SGK1, CTGFおよびSFRP1を含むon-feeder hiPSCでより高いSD値を示す596個の遺伝子を見出した(図6B、6Eおよび6F)。以上の知見は、feeder-free hiPSCが、on-feeder hiPSCよりも遺伝子発現において均一性が高いことを示してい
る。SC3-seqは、均一細胞集団における遺伝子発現の不均一性を見出すための強力な方法であることが示唆された。
全ての関連する系列及びそれらの前駆体を含む、着床前(pre)及び着床後(post)の胚からの390個の代表的な細胞(pre:193細胞; post:197細胞)のトランスクリプトームを、SC3-seq法により調べた。UHCは、全ての細胞を2つの大きなクラスターに分類し、1つは少なくとも6つの異なるクラスターを有する着床前の細胞を主として構成され、もう1つは少なくとも7つの異なるクラスターを有する着床後の細胞のみから構成されていた(図13a)。それぞれの細胞は、UHCによるクラスターと、多能性細胞マーカー、原始内胚葉マーカー、原腸陥入に伴う分化マーカー遺伝子の発現パターンより定義し、分類した(post_paTE; 着床後胚由来壁側栄養外胚葉、 preL_TE;着床前胚由来後期栄養外胚葉、 HYP;着床前胚由来胚盤葉下層、preE_TE; 着床前胚由来早期栄養外胚葉、ICM;着床前胚由来内部細胞塊、pre_EPI;着床前胚由来エピブラスト、postE_EPI;着床後胚由来早期エピブラスト、postL_EPI;着床後胚由来後期エピブラスト、Gast1, 2a, 2b; 着床後胚由来原腸陥入細胞、YE;着床後胚由来卵黄内胚葉、ExMchy;着床後胚由来胚体外間質細胞)。図13B、Cは、全ての発現遺伝子によるPCAの結果を示し、図13Dは、胚体内細胞発生において大きく発現変動する遺伝子の発現レベルをヒートマップで示した。以上より、同一グループの細胞は、類似の遺伝子発現パターンを示すことが認められたが、これは、SC3-seqが、高い定量性・再現性を有することを反映している。また、これらの知見は、SC3-seqが、カニクイザルのエピブラストの発生において、様々な細胞集団や、それらの発現パターンを区別できることに成功した。
図14Aは、図1CのIntV1(dT)24 配列(配列番号4:ctgctgtacggccaaggcgtatatggatccggcgcgccgtcgactttttttttttttttttttttttt)をRd2SPV1(dT)20配列(配列番号14:gtgactggagttcagacgtgtgctcttccgatcatatggatccggcgcgccgtcgactttttttttttttttttttt)に、図1CのP1-T配列をRd1SP-T配列に変更することで、illumina社の次世代シークエンサー(Miseq, Nextseq500, Hiseq2000/2500/3000/4000)に対応したライブラリー作成の概略図を示す。mESCから抽出したRNAの1ngにおいて、平均SC3-seqトラック(リード密度(RPM, ×1,000リード)を、アノテーションされたTTS(転写終結サイト)からのリードの位置に対してプロットした(図14B)。mESCの全RNAの1 ngおよび10 pgから、2つの独立して増幅された複製産物を、上記illumina社Miseqを用いて解析した(図14C)。全RNAの1 ngから増幅したサンプルは、非常に良い相関関係(R2=0.972)を示した。尚、Miseqで解析できれば他の次世代シークエンサー(Nextseq500, Hiseq2000/2500/3000/4000)でも解析可能であることがillumina差はから公表されている。実際、本発明者らもHiseq2500でも解析可能であることを確認している(データは示さず)。
図15Aは、上記illumina社Miseqを用いた解析において、cDNA増幅の際に用いたV1 (dT)24配列をP2(dT)24 配列に、V3 (dT)24配列をP1(dT)24配列に変更し、さらにライブラリー作成の際に用いたV1(dT)24配列をP2配列に、N-V3 (dT)24配列(配列番号5:(NH2)-atatctcgagggcgcgccggatcctttttttttttttttttttttttt)をN-P1配列(配列番号9:(NH2)-ccactacgcctccgctttcctctctatg)に、Rd2SPV1(dT)24 配列をRd2SP-P2配列(配列番号15:gtgactggagttcagacgtgtgctcttccgatcctgccccgggttcctcattct)に変更した、SC3-seqの概略図を示す。mESCの全RNAの1 ngおよび10 pgから、P1(dT)24配列及びP2(dT)24配列(P1P2タグ)を利用し、2つの独立して増幅された複製産物をillumina社のMiseqを用いて解析した(図15B)。全RNAの1 ngから増幅したサンプルは、非常に良い相関関係(R2=0.974)を示した。全RNAの1ng及び10pgRNAより、それぞれV1 (dT)24 配列及びV3 (dT)24配列(V1V3タグ)を用いて増幅されたcDNAと、P1P2タグを用いて増幅されたcDNAを、illumina社Miseqを用いて解析し、全遺伝子の発現レベルの分布をボックスプロット(図15C)及び検出された遺伝子の数を棒グラフ(図15D)で示した。V1V3タグとP1P2タグを用いて増幅されたサンプルは、同様のパターンを示したが、PIP2タグを用いた場合には、VIV3タグを用いた場合と比較してやや良好な結果を示した。以上より、SC3-seqが、Life Technologies社SOLiD5500xl以外にも、より汎用性の高いillumina社Miseqを用いた解析にも適用可能であることが示された。
Claims (18)
- 生物学的試料における遺伝子発現量の相対的な関係を保持している増幅産物を含む核酸集団を調製する方法であって、
(a)任意の付加核酸配列X、ポリT配列、生物学的試料から単離したmRNA配列、ポリA配列および任意の付加核酸配列Yの順で構成される2重鎖DNAを鋳型として、5’末端にアミンを付加した任意の付加核酸配列Xを含み、任意でその下流にポリT配列をさらに含んでもよい第1のプライマーと、任意の付加核酸配列Yを含み、任意でその下流にポリT配列をさらに含んでもよい第2のプライマーとを用いて、該2重鎖DNAを増幅する工程、
(b)前記工程(a)により得られた2重鎖DNAを断片化する工程、
(c)前記工程(b)により得られた断片化2重鎖DNAの5’末端をリン酸化する工程、
(d)前記工程(c)により得られた5’末端がリン酸化された2重鎖DNAを鋳型として、任意の付加核酸配列Zおよび前記付加核酸配列Yをこの順序で含み、任意でその下流にポリT配列をさらに含んでもよい第3のプライマーを用いてcDNAを調製、該cDNAの3’末端へアデニン(A)を付加する工程、
(e)前記工程(d)により得られた2重鎖DNAへ、3’末端にチミン(T)をオーバーハングで有する任意の配列Vを含む2重鎖DNAを連結させる工程、および
(f)前記工程(e)により得られた2重鎖DNAを鋳型として、前記配列Vを含む第4のプライマーと、前記付加核酸配列Zを含み、任意でその下流に前記付加核酸配列Yをさらに含んでもよい第5のプライマーとを用いて、該2重鎖DNAを増幅する工程
を含む方法。 - 前記工程(a)で用いる任意の付加核酸配列X、ポリT配列、生物学的試料から単離したmRNA配列、ポリA配列および任意の付加核酸配列Yの順で構成される2重鎖DNAが、次の工程を含む方法によって調製される、請求項1に記載の方法:
(i)生物学的試料から単離したmRNAを鋳型として、前記付加核酸配列YおよびポリT配列とからなる第6のプライマーを用いて逆転写することにより一次鎖cDNAを調製する工程、
(ii)工程(i)により得られた一次鎖cDNAをポリAテーリング反応に付し、次いでこれを鋳型として、前記付加核酸配列XおよびポリT配列とからなる第7のプライマーを用いて二次鎖である2重鎖DNAを調製する工程、および
(iii)工程(ii)により得られた2重鎖DNAを、前記付加核酸配列Xを含み、任意でその下流にポリT配列をさらに含んでもよい第8のプライマーと、前記付加核酸配列Yを含み、任意でその下流にポリT配列をさらに含んでもよい第9のプライマーとを用いて増幅する工程。 - 前記工程(b)における断片化が、超音波処理で行われる、請求項1または2に記載の方法。
- 前記工程(c)において、5’末端のリン酸化と同時に末端の平滑化を行う、請求項1から3のいずれか1項に記載の方法。
- 前記工程(c)において、さらに、200塩基から250塩基、または300塩基から350塩基の大きさの断片化2重鎖DNAを選択する工程を含む、請求項1から4のいずれか1項に記載の方法。
- 前記工程(a)において、増幅が、2から8サイクルのPCRによって行われる、請求項1から5のいずれか1項に記載の方法。
- 前記工程(f)において、増幅が、5から20サイクルのPCRによって行われる、請求項1から6のいずれか1項に記載の方法。
- 前記工程(iii)において、増幅が、5から30サイクルのPCRによって行われる、請求項2から7のいずれか1項に記載の方法。
- 前記工程(f)において用いる第5のプライマーが、さらにバーコード配列を含む、請求項1から8のいずれか1項に記載の方法。
- 生物学的試料が1個から数個の細胞である、請求項1から9のいずれか1項に記載の方法。
- 生物学的試料が1個の細胞である、請求項10に記載の方法。
- 請求項1から11に記載の方法で調製された核酸集団における前記増幅された2重鎖DNAの量を、次世代シーケンサーを用いて測定することを含む、当該核酸集団を調製した細胞に含まれるmRNA量の測定方法。
- 以下を含む、次世代シーケンサーよるmRNA量の測定に適用するためのcDNA集団を調製するためのキット。
(a)5’末端にアミンを付加した任意の付加核酸配列Xを含み、任意でその下流にポリT配列をさらに含んでもよい第1のプライマー
(b)任意の付加核酸配列Yを含み、任意でその下流にポリT配列をさらに含んでもよい第2のプライマー
(c)任意の付加核酸配列Zおよび前記付加核酸配列Yをこの順序で含み、任意でその下流にポリT配列をさらに含んでもよい第3のプライマー
(d)3’末端にチミン(T)をオーバーハングで有する任意の配列Vを含む2重鎖DNA
(e)前記配列Vを含む第4のプライマー
(f)前記付加核酸配列Zを含み、任意でその下流に前記付加核酸配列Yをさらに含んでもよい第5のプライマー - 前記(f)の第5のプライマーが、さらにバーコード配列を含む、請求項13に記載のキット。
- (g)前記付加核酸配列YおよびポリT配列からなる第6のプライマー、
(h)前記付加核酸配列XおよびポリT配列からなる第7のプライマー、
(i)前記付加核酸配列Xを含み、任意でその下流にポリT配列をさらに含んでもよい第8のプライマー、および
(j)前記付加核酸配列Yを含み、任意でその下流にポリT配列をさらに含んでもよい第9のプライマー
をさらに含む、請求項13または14に記載のキット。 - 前記第6のプライマーと前記第9のプライマーとが同一、および/または、前記第7のプライマーと前記第8のプライマーとが同一である、請求項15に記載のキット。
- 前記第2のプライマーと前記第9のプライマーとが同一である、請求項15または16に記載のキット。
- DNA増幅に用いるポリメラーゼをさらに含む、請求項13から17のいずれか一項に記載のキット。
Priority Applications (2)
| Application Number | Priority Date | Filing Date | Title |
|---|---|---|---|
| US15/553,091 US11028426B2 (en) | 2015-02-23 | 2016-02-23 | Nucleic acid sequence amplification method |
| JP2017502400A JP6825768B2 (ja) | 2015-02-23 | 2016-02-23 | 核酸配列増幅方法 |
Applications Claiming Priority (2)
| Application Number | Priority Date | Filing Date | Title |
|---|---|---|---|
| JP2015033432 | 2015-02-23 | ||
| JP2015-033432 | 2015-02-23 |
Publications (1)
| Publication Number | Publication Date |
|---|---|
| WO2016136766A1 true WO2016136766A1 (ja) | 2016-09-01 |
Family
ID=56788777
Family Applications (1)
| Application Number | Title | Priority Date | Filing Date |
|---|---|---|---|
| PCT/JP2016/055314 Ceased WO2016136766A1 (ja) | 2015-02-23 | 2016-02-23 | 核酸配列増幅方法 |
Country Status (3)
| Country | Link |
|---|---|
| US (1) | US11028426B2 (ja) |
| JP (2) | JP6825768B2 (ja) |
| WO (1) | WO2016136766A1 (ja) |
Families Citing this family (1)
| Publication number | Priority date | Publication date | Assignee | Title |
|---|---|---|---|---|
| CN112094916B (zh) * | 2020-11-17 | 2021-02-19 | 苏州科贝生物技术有限公司 | 一种血浆游离dna肺癌基因联合检测试剂盒 |
Family Cites Families (2)
| Publication number | Priority date | Publication date | Assignee | Title |
|---|---|---|---|---|
| US6271002B1 (en) * | 1999-10-04 | 2001-08-07 | Rosetta Inpharmatics, Inc. | RNA amplification method |
| WO2006085616A1 (ja) * | 2005-02-10 | 2006-08-17 | Riken | 核酸配列増幅方法 |
-
2016
- 2016-02-23 JP JP2017502400A patent/JP6825768B2/ja active Active
- 2016-02-23 US US15/553,091 patent/US11028426B2/en active Active
- 2016-02-23 WO PCT/JP2016/055314 patent/WO2016136766A1/ja not_active Ceased
-
2020
- 2020-07-08 JP JP2020117947A patent/JP2020202830A/ja active Pending
Non-Patent Citations (3)
| Title |
|---|
| BECK AH ET AL.: "3'-End Sequencing for Expression Quantification (3SEQ) from Archival Tumor Samples", PLOS ONE, vol. 5, no. 1, 2010, pages e8768, ISSN: 1932-6203 * |
| LIANG J ET AL.: "Single- cell sequencing technologies: current and future", J. GENET. GENOMICS, vol. 41, no. 10, 2014, pages 513 - 528, ISSN: 1673-8527 * |
| NAKAMURA T ET AL.: "SC3-seq: a method for highly parallel and quantitative measurement of single- cell gene expression", NUCLEIC ACIDS RES., vol. 43, no. 9, 2015, pages e60, ISSN: 1362-4962 * |
Also Published As
| Publication number | Publication date |
|---|---|
| JP2020202830A (ja) | 2020-12-24 |
| US20180044714A1 (en) | 2018-02-15 |
| JP6825768B2 (ja) | 2021-02-03 |
| US11028426B2 (en) | 2021-06-08 |
| JPWO2016136766A1 (ja) | 2017-11-30 |
Similar Documents
| Publication | Publication Date | Title |
|---|---|---|
| Yu et al. | Dynamic reprogramming of H3K9me3 at hominoid-specific retrotransposons during human preimplantation development | |
| Xu et al. | Stage-specific H3K9me3 occupancy ensures retrotransposon silencing in human pre-implantation embryos | |
| AU2022202739B2 (en) | High-Throughput Single-Cell Sequencing With Reduced Amplification Bias | |
| Berrens et al. | Locus-specific expression of transposable elements in single cells with CELLO-seq | |
| Oomen et al. | An atlas of transcription initiation reveals regulatory principles of gene and transposable element expression in early mammalian development | |
| Liu et al. | Comprehensive characterization of distinct states of human naive pluripotency generated by reprogramming | |
| Nakamura et al. | SC3-seq: a method for highly parallel and quantitative measurement of single-cell gene expression | |
| Bleckwehl et al. | Enhancer-associated H3K4 methylation safeguards in vitro germline competence | |
| Gafni et al. | Derivation of novel human ground state naive pluripotent stem cells | |
| Durruthy-Durruthy et al. | The primate-specific noncoding RNA HPAT5 regulates pluripotency during human preimplantation development and nuclear reprogramming | |
| Virant-Klun et al. | Gene expression profiling of human oocytes developed and matured in vivo or in vitro | |
| US20240209435A1 (en) | Methods of identifying combinations of transcription factors | |
| Bui et al. | Retrotransposon expression as a defining event of genome reprograming in fertilized and cloned bovine embryos | |
| Brinkhof et al. | Characterization of bovine embryos cultured under conditions appropriate for sustaining human naïve pluripotency | |
| Brinkhof et al. | A mRNA landscape of bovine embryos after standard and MAPK-inhibited culture conditions: a comparative analysis | |
| Salazar‐Roa et al. | Transient exposure to miR‐203 enhances the differentiation capacity of established pluripotent stem cells | |
| US11441169B2 (en) | Methods of small-RNA transcriptome sequencing and applications thereof | |
| Hu et al. | Single‐cell RNA‐Seq reveals the earliest lineage specification and X chromosome dosage compensation in bovine preimplantation embryos | |
| JP2020202830A (ja) | 核酸配列増幅方法 | |
| Aguila et al. | Haploid androgenetic development of bovine embryos reveals imbalanced WNT signaling and impaired cell fate differentiation | |
| Lustig et al. | GATA transcription factors drive initial Xist upregulation after fertilization through direct activation of a distal enhancer element | |
| Chialastri et al. | Integrated single-cell sequencing reveals principles of epigenetic regulation of human gastrulation and germ cell development in a 3D organoid model | |
| RU2833615C2 (ru) | Высокопроизводительное секвенирование одиночной клетки со сниженной ошибкой амплификации | |
| US20240376520A1 (en) | Methods for fragmenting complementary dna | |
| Dai et al. | Unwinding of RNA G-quadruplexes induces mouse and human totipotency |
Legal Events
| Date | Code | Title | Description |
|---|---|---|---|
| 121 | Ep: the epo has been informed by wipo that ep was designated in this application |
Ref document number: 16755510 Country of ref document: EP Kind code of ref document: A1 |
|
| ENP | Entry into the national phase |
Ref document number: 2017502400 Country of ref document: JP Kind code of ref document: A |
|
| WWE | Wipo information: entry into national phase |
Ref document number: 15553091 Country of ref document: US |
|
| NENP | Non-entry into the national phase |
Ref country code: DE |
|
| 122 | Ep: pct application non-entry in european phase |
Ref document number: 16755510 Country of ref document: EP Kind code of ref document: A1 |