WO2016136442A1 - Image processing device - Google Patents
Image processing device Download PDFInfo
- Publication number
- WO2016136442A1 WO2016136442A1 PCT/JP2016/053623 JP2016053623W WO2016136442A1 WO 2016136442 A1 WO2016136442 A1 WO 2016136442A1 JP 2016053623 W JP2016053623 W JP 2016053623W WO 2016136442 A1 WO2016136442 A1 WO 2016136442A1
- Authority
- WO
- WIPO (PCT)
- Prior art keywords
- color
- image
- mask
- pixel
- lesion
- Prior art date
Links
Images


Classifications
-
- A—HUMAN NECESSITIES
- A61—MEDICAL OR VETERINARY SCIENCE; HYGIENE
- A61B—DIAGNOSIS; SURGERY; IDENTIFICATION
- A61B1/00—Instruments for performing medical examinations of the interior of cavities or tubes of the body by visual or photographical inspection, e.g. endoscopes; Illuminating arrangements therefor
- A61B1/00002—Operational features of endoscopes
- A61B1/00004—Operational features of endoscopes characterised by electronic signal processing
- A61B1/00009—Operational features of endoscopes characterised by electronic signal processing of image signals during a use of endoscope
- A61B1/000094—Operational features of endoscopes characterised by electronic signal processing of image signals during a use of endoscope extracting biological structures
-
- A—HUMAN NECESSITIES
- A61—MEDICAL OR VETERINARY SCIENCE; HYGIENE
- A61B—DIAGNOSIS; SURGERY; IDENTIFICATION
- A61B1/00—Instruments for performing medical examinations of the interior of cavities or tubes of the body by visual or photographical inspection, e.g. endoscopes; Illuminating arrangements therefor
- A61B1/00002—Operational features of endoscopes
- A61B1/00004—Operational features of endoscopes characterised by electronic signal processing
- A61B1/00009—Operational features of endoscopes characterised by electronic signal processing of image signals during a use of endoscope
- A61B1/000095—Operational features of endoscopes characterised by electronic signal processing of image signals during a use of endoscope for image enhancement
-
- A—HUMAN NECESSITIES
- A61—MEDICAL OR VETERINARY SCIENCE; HYGIENE
- A61B—DIAGNOSIS; SURGERY; IDENTIFICATION
- A61B1/00—Instruments for performing medical examinations of the interior of cavities or tubes of the body by visual or photographical inspection, e.g. endoscopes; Illuminating arrangements therefor
- A61B1/00002—Operational features of endoscopes
- A61B1/0002—Operational features of endoscopes provided with data storages
-
- A—HUMAN NECESSITIES
- A61—MEDICAL OR VETERINARY SCIENCE; HYGIENE
- A61B—DIAGNOSIS; SURGERY; IDENTIFICATION
- A61B1/00—Instruments for performing medical examinations of the interior of cavities or tubes of the body by visual or photographical inspection, e.g. endoscopes; Illuminating arrangements therefor
- A61B1/00002—Operational features of endoscopes
- A61B1/00039—Operational features of endoscopes provided with input arrangements for the user
- A61B1/0004—Operational features of endoscopes provided with input arrangements for the user for electronic operation
-
- A—HUMAN NECESSITIES
- A61—MEDICAL OR VETERINARY SCIENCE; HYGIENE
- A61B—DIAGNOSIS; SURGERY; IDENTIFICATION
- A61B1/00—Instruments for performing medical examinations of the interior of cavities or tubes of the body by visual or photographical inspection, e.g. endoscopes; Illuminating arrangements therefor
- A61B1/00002—Operational features of endoscopes
- A61B1/00043—Operational features of endoscopes provided with output arrangements
- A61B1/00045—Display arrangement
- A61B1/0005—Display arrangement combining images e.g. side-by-side, superimposed or tiled
-
- A—HUMAN NECESSITIES
- A61—MEDICAL OR VETERINARY SCIENCE; HYGIENE
- A61B—DIAGNOSIS; SURGERY; IDENTIFICATION
- A61B5/00—Measuring for diagnostic purposes; Identification of persons
- A61B5/0059—Measuring for diagnostic purposes; Identification of persons using light, e.g. diagnosis by transillumination, diascopy, fluorescence
- A61B5/0082—Measuring for diagnostic purposes; Identification of persons using light, e.g. diagnosis by transillumination, diascopy, fluorescence adapted for particular medical purposes
- A61B5/0084—Measuring for diagnostic purposes; Identification of persons using light, e.g. diagnosis by transillumination, diascopy, fluorescence adapted for particular medical purposes for introduction into the body, e.g. by catheters
-
- A—HUMAN NECESSITIES
- A61—MEDICAL OR VETERINARY SCIENCE; HYGIENE
- A61B—DIAGNOSIS; SURGERY; IDENTIFICATION
- A61B5/00—Measuring for diagnostic purposes; Identification of persons
- A61B5/103—Detecting, measuring or recording devices for testing the shape, pattern, colour, size or movement of the body or parts thereof, for diagnostic purposes
- A61B5/1032—Determining colour for diagnostic purposes
-
- G—PHYSICS
- G06—COMPUTING; CALCULATING OR COUNTING
- G06T—IMAGE DATA PROCESSING OR GENERATION, IN GENERAL
- G06T7/00—Image analysis
- G06T7/0002—Inspection of images, e.g. flaw detection
- G06T7/0012—Biomedical image inspection
-
- G—PHYSICS
- G06—COMPUTING; CALCULATING OR COUNTING
- G06T—IMAGE DATA PROCESSING OR GENERATION, IN GENERAL
- G06T7/00—Image analysis
- G06T7/10—Segmentation; Edge detection
- G06T7/11—Region-based segmentation
-
- G—PHYSICS
- G06—COMPUTING; CALCULATING OR COUNTING
- G06T—IMAGE DATA PROCESSING OR GENERATION, IN GENERAL
- G06T2207/00—Indexing scheme for image analysis or image enhancement
- G06T2207/10—Image acquisition modality
- G06T2207/10024—Color image
-
- G—PHYSICS
- G06—COMPUTING; CALCULATING OR COUNTING
- G06T—IMAGE DATA PROCESSING OR GENERATION, IN GENERAL
- G06T2207/00—Indexing scheme for image analysis or image enhancement
- G06T2207/10—Image acquisition modality
- G06T2207/10068—Endoscopic image
-
- G—PHYSICS
- G06—COMPUTING; CALCULATING OR COUNTING
- G06T—IMAGE DATA PROCESSING OR GENERATION, IN GENERAL
- G06T2207/00—Indexing scheme for image analysis or image enhancement
- G06T2207/30—Subject of image; Context of image processing
- G06T2207/30004—Biomedical image processing
- G06T2207/30096—Tumor; Lesion
Definitions
- the present invention relates to an image processing apparatus for processing an image of a living tissue.
- the lesioned part of living tissue exhibits a color different from that of a normal part.
- color endoscope devices With the improvement in the performance of color endoscope devices, it has become possible to identify lesions slightly different in color from normal tissues.
- an operator in order for an operator to accurately identify a lesion from a normal tissue due to a slight color difference on an endoscopic image, it is necessary to receive a long-term training under the guidance of an expert.
- even a skilled operator cannot easily identify a lesion from a slight color difference, and requires careful work.
- Patent Document 1 Japanese Patent Laid-Open No. 2014-18332
- Patent Document 2 Japanese Patent Laid-Open No. 2014-18332
- an electronic endoscope apparatus having a function of determining whether or not a subject is a lesioned part based on color information and changing a color of a pixel determined to be a lesioned part.
- the present invention has been made in view of the above circumstances, and an object of the present invention is to provide an image processing apparatus capable of clearly indicating a suspected lesion while maintaining sufficient image information of the lesion. It is to be.
- color image acquisition means for acquiring color image data representing a color image of a living tissue, and whether or not each pixel of the color image is a pixel of a lesion based on the color image data Image processing, comprising: a lesion determination unit that performs a determination; and a marking unit that adds a mark indicating the position of the lesion on the color image based on the determination result, wherein the mark is a mark through which the background color image is transparent
- the lesion determination unit includes a score table generation unit that generates a score table including a score indicating the severity of the lesion of the living tissue for each pixel of the color image, and the marking unit includes Based on the score table, the color image may be provided with the mark indicating the position and severity of the lesion.
- the marking means sets a mask that is a processing target area in the color image, calculates a representative value of the score in the mask, and marks the mask based on the representative value It is good.
- the marking unit sets a mask having a predetermined initial size, calculates a representative value for the initial size mask, changes the mask size according to the representative value, and sets the size. It is good also as a structure which attaches a mark so that the changed mask may be inscribed.
- the initial size may be a minimum mask size.
- the marking means may add a number of marks corresponding to the representative value in the mask.
- the marking unit may mark the color image while scanning the mask in the color image.
- the marking unit may set the mask so that it does not overlap with another set mask.
- the mark information already attached is not lost, and the accuracy of the mark information is maintained.
- the representative value may be an arithmetic mean, a weighted average, a median, a mode, or a root mean square.
- the means for generating the score table converts the color space of the color image data into a color space having one coordinate representing luminance or brightness and two coordinates representing color quality.
- a configuration may be provided that includes color space conversion means for conversion and score calculation means for calculating the score of each pixel based on the color quality of each pixel of the color image data.
- the means for generating the score table further comprises color enhancement means for performing color enhancement processing for increasing the contrast of the color quality in the boundary region of the pixel value range characteristic of the lesion
- the score calculation means may be configured to calculate the score of each pixel based on the pixel value after the color enhancement processing.
- the score calculation means may be configured to calculate the score of each pixel based on the distance from the reference point in the hue-saturation space or the chromaticity space.
- the lesioned part may be an inflamed part and the reference point may be blood color.
- the mark may be a symbol.
- the mark may be a color having transmittance.
- the mark may be a contour line of severity.
- the color image may be an electronic endoscopic image.
- a color image of a biological tissue is marked, and the shape and texture of the biological tissue can be grasped without referring to the color image before the marking. Diagnosis can be performed more easily and accurately.
- FIG. 1 is a block diagram showing a schematic configuration of an electronic endoscope apparatus according to an embodiment of the present invention. It is the block diagram which showed schematic structure of the circuit regarding the image processing of the electronic endoscope apparatus which concerns on embodiment of this invention. It is a figure which shows schematic structure of the storage area of an image memory. It is a flowchart which shows the procedure of the process which an image processing circuit performs. It is an example of the gain curve used for TE processing. It is a flowchart which shows the procedure of an effective pixel determination process. It is a flowchart which shows the procedure of a lesion determination process. It is the scatter diagram which plotted the pixel value of the biological tissue image in HS coordinate space. It is a flowchart which shows the procedure of a score calculation process.
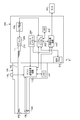
- FIG. 1 is a block diagram showing a configuration of an electronic endoscope apparatus 1 according to the first embodiment of the present invention.
- the electronic endoscope apparatus 1 includes an electronic scope 100, a processor 200, and a monitor 900.
- the processor 200 includes a system controller 202 and a timing controller 204.
- the system controller 202 executes various programs stored in the memory 212 and controls the entire electronic endoscope apparatus 1 in an integrated manner.
- the system controller 202 is connected to the operation panel 214.
- the system controller 202 changes each operation of the electronic endoscope apparatus 1 and parameters for each operation in accordance with an instruction from the operator input from the operation panel 214.
- the timing controller 204 outputs a synchronization signal for adjusting the operation timing of each unit to each circuit in the electronic endoscope apparatus 1.
- the lamp 208 emits the irradiation light L after being started by the lamp power igniter 206.
- the lamp 208 is, for example, a high-intensity lamp such as a xenon lamp, a halogen lamp, a mercury lamp, or a metal halide lamp, or an LED (Light-Emitting-Diode).
- the irradiation light L is broadband light (or white light including at least the visible light region) having a spectrum that mainly extends from the visible light region to the invisible infrared light region.
- the irradiation light L emitted from the lamp 208 is condensed on the incident end face of the LCB (Light Carrying Bundle) 102 by the condenser lens 210 and is incident on the LCB 102.
- LCB Light Carrying Bundle
- the irradiation light L incident on the LCB 102 propagates through the LCB 102, is emitted from the exit end face of the LCB 102 disposed at the tip of the electronic scope 100, and is irradiated onto the subject via the light distribution lens 104.
- the return light from the subject irradiated with the irradiation light L forms an optical image on the light receiving surface of the solid-state image sensor 108 via the objective lens 106.
- the solid-state image sensor 108 is a single color CCD (Charge Coupled Device) image sensor of a complementary color checkered color difference line sequential method.
- the solid-state image sensor 108 images an optical image of a subject formed on the light receiving surface and outputs an analog image signal. Specifically, the solid-state image sensor 108 accumulates an optical image formed by each pixel on the light receiving surface as a charge corresponding to the amount of light, and generates yellow Ye, cyan Cy, green G, and magenta Mg color signals. Then, the generated scanning lines are sequentially output by adding and mixing the color signals of two adjacent pixels in the vertical direction.
- CCD Charge Coupled Device
- the solid-state imaging element 108 is not limited to a CCD image sensor, and may be replaced with a CMOS (Complementary Metal Oxide Semiconductor) image sensor or other types of imaging devices.
- the solid-state image sensor 108 may also be one equipped with a primary color filter (Bayer array filter).
- a driver signal processing circuit 110 receives an analog imaging signal composed of the above scanning lines from the solid-state imaging device 108 in a field cycle.
- field may be replaced with “frame”.
- the field period and the frame period are 1/60 seconds and 1/30 seconds, respectively.
- the driver signal processing circuit 110 performs predetermined processing on the analog imaging signal input from the solid-state imaging device 108 and outputs the processed signal to the image processing circuit 220 of the processor 200.
- the driver signal processing circuit 110 also accesses the memory 120 and reads the unique information of the electronic scope 100.
- the unique information of the electronic scope 100 recorded in the memory 120 includes, for example, the number and sensitivity of the solid-state image sensor 108, the operable field rate, the model number, and the like.
- the driver signal processing circuit 110 outputs the unique information read from the memory 120 to the system controller 202.
- the system controller 202 performs various calculations based on the unique information of the electronic scope 100 and generates a control signal.
- the system controller 202 controls the operation and timing of various circuits in the processor 200 using the generated control signal so that processing suitable for the electronic scope connected to the processor 200 is performed.
- the timing controller 204 generates a synchronization signal according to the timing control by the system controller 202.
- the driver signal processing circuit 110 drives and controls the solid-state imaging device 108 at a timing synchronized with the field rate of the video signal generated by the processor 200 in accordance with the synchronization signal supplied from the timing controller 204.
- the image processing circuit 220 generates image data based on the imaging signal output from the electronic scope 100 under the control of the system controller 202.
- the image processing circuit 220 generates screen data for monitor display using the generated image data, converts the screen data into a video signal of a predetermined video format, and outputs the video signal.
- the video signal is input to the monitor 900, and a color image of the subject is displayed on the display screen of the monitor 900.
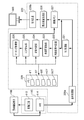
- FIG. 2 is a block diagram showing a schematic configuration of a circuit related to image processing of the electronic endoscope apparatus 1.
- the driver signal processing circuit 110 includes a drive circuit 112 and an AFE (Analog Front End) 114.
- the drive circuit 112 generates a drive signal for the solid-state image sensor 108 based on the synchronization signal.
- the AFE 114 performs noise removal, signal amplification / gain correction, and A / D conversion on the analog imaging signal output from the solid-state imaging device 108, and outputs a digital imaging signal. Note that the solid-state imaging device 108 or the image processing circuit 220 may perform all or part of the processing performed by the AFE 114 in the present embodiment.
- the image processing circuit 220 includes a basic processing unit 220a, an output circuit 220b, a TE (Tone enhancement) processing unit 221, an effective pixel determination unit 222, a color space conversion unit 223, a lesion determination unit 224, a score calculation unit 225, a marking A processing unit 226, an image memory 227, a display screen generation unit 228, and a memory 229 are provided. Processing performed by each unit of the image processing circuit 220 will be described later.
- FIG. 3A is a diagram illustrating a schematic configuration of a storage area included in the image memory 227.
- the image memory 227 of the present embodiment is provided with three storage areas P n , P e , and P m .
- the storage area P n is an area for storing normal observation image data N (image data representing the normal observation image NP) generated by the basic processing unit 220a.
- the storage area Pe is an area for storing tone-enhanced image data E (image data representing the tone-enhanced image EP) generated by the TE processing unit 221.
- the storage area P m is an area in which marking image data M (image data representing the marking image MP) generated by the marking processing unit 226 is stored.
- the memory 229 stores a flag table FT, a score table ST, a mask table MT, a hue correlation value table HCT, and a saturation correlation value table SCT.
- the flag table FT and the score table ST are numerical tables composed of a flag F (x, y) and a score Sc (x, y) indicating the analysis result for each pixel (x, y) of the normal observation image data N, respectively. is there.
- the flag F (x, y) is a parameter indicating the presence or absence of a lesion in the tissue imaged on the corresponding pixel (x, y)
- the score Sc (x, y) indicates the severity of the lesion. Is the parameter shown.
- the hue correlation value table HCT, the saturation correlation value table SCT, and the mask table MT will be described later.
- FIG. 4 is a flowchart showing a procedure of processing performed by the image processing circuit 220.
- the digital signal output from the AFE 114 is first subjected to general signal processing (basic processing S1) by the basic processing unit 220a, and normal observation image data N is generated.
- the digital image pickup signal output from the AFE 114 is converted into the luminance signal Y and the color difference signals Cb and Cr, and the primary colors for separating the primary color signals R, G and B from the luminance signal Y and the color difference signals Cb and Cr.
- Separation processing Separation processing, clamping processing for removing offset components, defect correction processing for correcting pixel values of defective pixels using pixel values of surrounding pixels, and imaging data (RAW data) consisting of single-color pixel values from full-color pixel values
- RAW data imaging data
- Compensates for demosaic processing (interpolation processing) that converts to image data, linear matrix processing that corrects the spectral characteristics of the image sensor using a color matrix, white balance processing that corrects the spectral characteristics of illumination light, and degradation of spatial frequency characteristics Contour correction etc. are included.
- driver signal processing circuit 110 or the solid-state image sensor 108 performs all or one part of the process which the basic process part 220a performs in this embodiment.
- the normal observation image data N generated by the basic processing unit 220a is input to the TE processing unit 221 and stored in the storage area P n of the image memory 227.
- the electronic endoscope apparatus 1 of the present embodiment is configured to operate in two operation modes: an image analysis mode and a normal observation mode.
- the operation mode is switched by a user operation on the operation unit 130 of the electronic scope 100 or the operation panel 214 of the processor 200. If the normal observation mode is set (S2: No), the process proceeds to S9.
- TE (tone enhancement) processing S3 When the image analysis mode is selected (S2: Yes), the TE processing S221 by the TE processing unit 221 is performed next.
- the TE process S3 performs gain adjustment that gives a non-linear gain (gain) to each primary color signal R, G, B of the normal observation image data N in order to increase the lesion determination accuracy, and is specific to the lesion to be determined.
- gain gain
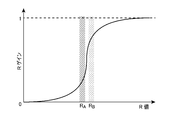
- the primary color signals R ′, G ′, B ′ (tone-enhanced image data E) are given to each primary color signal R, G, B by applying a non-linear gain as shown in FIG. ) Is acquired.
- a non-linear gain as shown in FIG. 5
- the gain curve in FIG. 5 from the boundary region R A characteristic gamut ulcers, inflammation over the boundary area R B of the characteristic color gamut, the slope is steeper.
- the TE treatment S3 changes the color of the inflamed part to red, the ulcer part to white, and the normal part to green. Therefore, when the tone-enhanced image data E generated by the TE process S3 is displayed on the monitor 900, the lesioned part (inflamed part or ulcer part) is easier than when the normal observation image data N before the TE process S3 is displayed. It can be visually recognized.
- the TE process S3 is an example of a color enhancement process applicable to the present invention. Instead of the TE process S3, the color quality, specifically, hue or saturation (or chromaticity) contrast is set. Other types of enhanced color enhancement processing may be used.
- Effective pixel determination processing S4 When the TE process S3 is completed, an effective pixel determination process S4 by the effective pixel determination unit 222 is then performed on the tone enhanced image data E. Note that the TE process S3 may be omitted, and the effective pixel determination process S4 may be performed on the normal observation image data N.
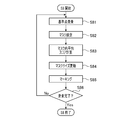
- FIG. 6 is a flowchart showing the procedure of the effective pixel determination process S4.
- the effective pixel determination process S4 is a process for determining whether or not the pixel value is suitable for image analysis, and is sequentially performed for all the pixels (x, y) constituting the image data.
- the effective pixel determination process S4 first, for each pixel (x, y), from the primary color signals R ′ (x, y), G ′ (x, y), B ′ (x, y) of the tone-enhanced image data E, The corrected luminance int (x, y) is calculated by the following formula 1 (S41).
- the corrected luminance int (x, y) is not a simple average of the primary color signals R ′ (x, y), G ′ (x, y), B ′ (x, y), It is obtained as a weighted average based on the specific visual sensitivity characteristics of a human (operator).
- appropriate exposure determination process S42 it is determined that the exposure is appropriate (S42: Yes) when at least one (or both) of the following two conditions (Equation 2 and Equation 3) is satisfied.
- the upper limit value of the corrected luminance int (x, y) (total light amount) is defined by Equation 2, and each primary color signal R ′ (x, y), G ′ (x, y), B ′ ( A lower limit value of x, y) is defined.
- the effective pixel determination unit 222 is stored in the memory 229.
- the value of the flag F (x, y) corresponding to the pixel (x, y) in the flag table FT is rewritten to “1” (S43).
- flag F (x, y) takes one of the flag values 0 to 2.
- the definition of each flag value is as follows. 0: Invalid pixel data 1: Normal or not determined (Pixel data valid) 2: Lesions (inflammation)
- the effective pixel determination unit 222 is determined. Rewrites the value of the flag F (x, y) in the flag table FT to “0” (S44).
- process S45 it is determined whether or not the process has been completed for all the pixels (x, y). The above processes S41 to S45 are repeated until the processing of all the pixels (x, y) is completed.
- the color space conversion process S5 is an HSI (Heu-Saturation-Intensity) defined by the three elements of hue (Hew), saturation (Saturation), and luminance (Intensity). This is a process of converting into a pixel value in space. Specifically, in the color space conversion process S5, primary color signals R ′ (x, y), G ′ (x, y), B ′ (x, y) of each pixel (x, y) of the tone-enhanced image data E. ) Is converted into hue H (x, y), saturation S (x, y), and luminance I (x, y).
- HSI Heu-Saturation-Intensity
- the data of the pixel (x, y) that is underexposed or excessively exposed is low in accuracy and lowers the reliability of the analysis result. Therefore, in the color space conversion process S5, the pixel (x, y) in which the value of the flag F (x, y) is set to “1” (that is, determined to be proper exposure in the above-described effective pixel determination process S4). Only done about.
- Determination image data J ⁇ H comprising the hue H (x, y), saturation S (x, y) and luminance I (x, y) of each pixel (x, y) generated by the color space conversion unit 223 (X, y), S (x, y), I (x, y) ⁇ are input to the lesion determination unit 224.
- a lesion determination process S6 using the determination image data J is then performed by the lesion determination unit 224.
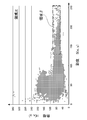
- the determination image data J is placed in any one of regions ⁇ and ⁇ (FIG. 8) described later on the HS space (hue-saturation space).
- This is a process of determining the state of the biological tissue (whether or not it is an inflamed part) copied to the pixel depending on whether it is plotted.
- the HS space is a space representing color quality (color elements excluding brightness and luminance) in the same manner as the chromaticity space.
- the lesion determination unit 224 is performed on the chromaticity space (for example, a * b * space).
- FIG. 7 is a flowchart showing the procedure of the lesion determination process S6.
- the lesion determination process S6 is sequentially performed for all the pixels (x, y) constituting the image data.
- the lesion determination processing S6 first, it is determined whether or not the data of each pixel (x, y) is valid with reference to the flag table FT (S61). If the value of the flag F (x, y) is “1” (pixel data valid), the inflammation determination process S62 is performed next. If the value of the flag F (x, y) is “0” (pixel data invalid), the process proceeds to the process S64 without performing the inflammation determination process S62.
- FIG. 8 is a scatter diagram in which determination image data J acquired from endoscopic image data of a plurality of inflammatory bowel disease patients is plotted on the HS space.
- the inflammation determination process S62 whether or not the determination image data J ⁇ (H (x, y), S (x, y) ⁇ ) of each pixel (x, y) is plotted in the region ⁇ in FIG. Specifically, when the determination image data J ⁇ (H (x, y), S (x, y) ⁇ ) satisfies both the following Expression 4 and Expression 5, The image data for determination J ⁇ (H (x, y), S (x, y) ⁇ ) satisfies at least one of Expression 4 and Expression 5.
- ⁇ S1 , ⁇ H1 and ⁇ H2 are correction values that can be set by the operator, and these corrections The severity of judgment (sensitivity) and the like can be appropriately adjusted by setting the value.
- process S64 it is determined whether or not the process has been completed for all the pixels (x, y). The above processes S61 to S64 are repeated until the processing of all the pixels (x, y) is completed.
- the score calculation process S7 is a process for calculating a score Sc (x, y), which is an evaluation value of the severity of a lesion, based on the pixel value of the determination image data J.
- the score calculation process S7 is sequentially performed for all the pixels (x, y) constituting the image data. Note that the score calculation algorithm described below is an example, and the present invention can be applied to the screen display of scores calculated by various algorithms.
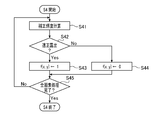
- FIG. 9 is a flowchart showing the procedure of the score calculation process S7.
- the flag table FT is read, and it is determined whether or not the value of the flag F (x, y) corresponding to the pixel (x, y) is “2” (inflammation) ( S71).
- I corr. (X, y): luminance after correction of judgment image data J S corr. (X, y): saturation after correction of judgment image data J I ref : blood sample data as a reference value Luminance S ref : Saturation of blood sample data as reference value ⁇ : Angle giving correlation coefficient (cos ⁇ ) between luminance value and saturation value of blood sample data Note that correlation coefficient between saturation and luminance of blood sample The (actual measurement value) was ⁇ 0.86, and ⁇ 149.32 (deg) was used.
- the hue distance D HUE (x, y) is calculated by Equation 7 (S73).
- the hue distance D HUE is a relative value of the hue of the determination image data J (x, y) with the hue H ref of the blood sample data as a reference.
- the hue correlation value HCV (x, y) is determined from the hue distance D HUE (x, y) (S74).
- the hue correlation value HCV (x, y) is a parameter having a strong correlation with the severity of the inflamed area.
- FIG. 10A is a graph illustrating the relationship between the hue distance D HUE and the hue correlation value HCV.
- the hue distance D HUE has a strong correlation with the severity of the inflamed area in a range within ⁇ 30 ° (hereinafter referred to as “hue approximate range R 11 ”), and other ranges (hereinafter referred to as “hue approximate outside range R”). 12 ”)) has little correlation.
- the hue correlation value HCV (x, y) of the present embodiment is set to 0.0, which is the minimum value in the hue approximation outside range R 12 , and the hue distance D HUE (x, y) in the hue approximation range R 11 . ) Is set to increase linearly as it approaches 0 °.
- the hue correlation value HCV (x, y) is standardized so that the minimum value is 0.0 and the maximum value is 1.0.
- the relationship between the hue distance D HUE and the hue correlation value HCV shown in FIG. 10A is stored in the memory 229 as the hue correlation value table HCT.
- the hue correlation value table HCT By referring to the hue correlation value table HCT, the hue correlation value HCV (x, y) corresponding to the hue distance D HUE (x, y) is acquired.
- the saturation distance D SAT (x, y) is calculated by Equation 8 (S75).
- the saturation distance D SAT (x, y) is a relative value of the saturation of the determination image data J (x, y) with reference to the saturation S ref of the blood sample data.
- FIG. 10B is a graph illustrating the relationship between the saturation distance DSAT and the saturation correlation value SCV.
- the saturation distance D SAT has a strong correlation with the severity of the inflamed area in a negative range (hereinafter referred to as “saturation approximate range R 22 ”) that is equal to or greater than a predetermined value, and a range that is less than or equal to a negative predetermined value ( (Hereinafter referred to as “saturation approximation outside range R 23 ”) has little correlation. Further, in a range where the saturation distance D SAT is zero or more, that is, a range where the saturation of the lesion pixel is not less than the saturation S ref of the blood sample data (hereinafter referred to as “saturation matching range R 21 ”), it is severe. The degree is considered extremely high.
- the saturation correlation value SCV of the present embodiment (x, y) is set to 1.0 of the maximum value in the saturation range match R 21, to 0.0 of the minimum value in the saturation approximation out of range R 23 is set, it is set to increase linearly in saturation approximation range R 22.
- the saturation correlation value SCV (x, y) is also a value that is standardized so that the minimum value is 0.0 and the maximum value is 1.0.
- the relationship between the saturation distance DSAT and the saturation correlation value SCV shown in FIG. 10B is stored in the memory 229 as the saturation correlation value table SCT.
- the saturation correlation value table SCT By referring to the saturation correlation value table SCT, the saturation correlation value SCV (x, y) corresponding to the saturation distance D SAT (x, y) is acquired.
- a correlation value CV (x, y) between the color of the lesion pixel (x, y) and the blood color is obtained by multiplying the hue correlation value HCV (x, y) and the saturation correlation value SCV (x, y).
- the correlation value CV (x, y) is also a standardized value so that the minimum value is 0.0 and the maximum value is 1.0. Further, the correlation value CV (x, y) is divided into 11 stages in increments of 0.1 points.
- process S80 it is determined whether or not the process has been completed for all pixels (x, y). The above processes S71 to S80 are repeated until the processing of all the pixels (x, y) is completed.
- the marking process S8 is a process for marking an image area in which lesion pixels are distributed with respect to the normal observation image NP so that the lesion part can be easily identified. Specifically, in the marking process 8 of the present embodiment, a symbol having a size corresponding to the severity in the image region (for example, “x” mark 330 in FIG. 16) is attached to the image region in which the lesion pixel is distributed. Is done.
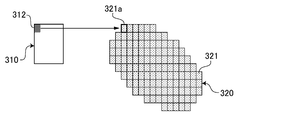
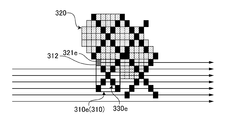
- FIG. 11 is a diagram for explaining how to proceed with the marking process S8 (scanning of the mask 310).
- a mask 310 that is an image region of a predetermined size is set in the normal observation image NP (and the score table ST), and the pixels 311 ( The mark 330 is added to the image in the mask 310 according to the score Sc in FIG.
- the size of the mask 310 (and the size of the mark 330 determined by the size of the mask) varies according to the score Sc of the pixel 311 in the mask 310.
- FIG. 12 shows a mask 310 having an initial size set in advance.
- the initial size of the mask 310 is set to 5 ⁇ 5 (the number of pixels in the horizontal direction ⁇ the number of pixels in the vertical direction).
- the initial size of the mask 310 is set according to, for example, the visibility of the mark 330 attached to the image in the mask 310 (for example, depending on the complexity of the shape of the mark 330 and the number of pixels on the display screen of the monitor 910). Is done.
- the initial size of the mask 310 is set to a minimum size so that as many marks 330 as possible can be displayed within a range in which good visibility of the marks 330 is ensured.
- the mask size is determined based on the score Sc with reference to the mask table MT stored in the memory 229.
- Table 1 is an example of a mask table MT used in the present embodiment.
- the mask size is set so as to increase in proportion to the score Sc, with the initial value (5 ⁇ 5) as the lower limit.
- the one at the upper left end (that is, the pixel having the smallest x coordinate and y coordinate) is referred to as a reference point 312.
- the position (x m , y m ) of this reference point 312 is defined as the position of the mask 310. Note that any pixel in the mask 310 may be set as the reference point 312.
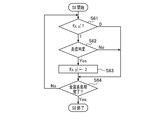
- FIG. 13 is a flowchart showing the procedure of the marking process S8.
- the marking process S8 first, the normal observation image data N (original image) stored in the storage area P n of the image memory 227 is duplicated and stored as an initial value of the marking image data M in the storage area P m .
- the score table ST is read from the memory 229, and the reference point 312 is scanned on the score table ST (S81).
- the marking processing unit 226 searches for a position (x, y) that satisfies both of the following conditions a and b while scanning the reference point 312 on the score table ST.
- Condition a lesion pixel [score Sc (x, y) is 0.1 or more]
- Condition b mark 310 already attached to mask 310 (more precisely, when mark 330 is attached) Do not overlap with mask 310)
- an average score Sc Avg. which is an arithmetic average of the scores Sc (x, y) of the pixels in the mask . Is calculated (S83).
- average score Sc Avg. Also, the value is normalized so that the minimum value is 0.0 and the maximum value is 1.0.
- the average score Sc Avg. Can be replaced by other numerical values (for example, weighted average, median, mode, root mean square, etc.) representing the score Sc (x, y) in the mask.
- process S86 it is determined whether or not scanning has been completed to the end of the score table ST.
- the above processes S81 to S86 are repeated until all the scores Sc (x, y) are scanned.
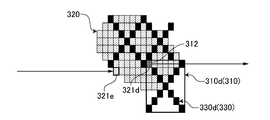
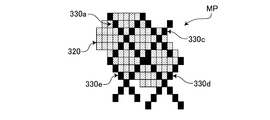
- the normal observation image data N (score table ST) in FIGS. 14 to 20 includes an image 320 of a lesion site composed of a plurality of lesion pixels 321.
- the initial size (5 ⁇ 5) mask 310a (broken line frame in FIG. 15) is set with the lesion pixel 321a as a reference point (S82). .
- Average score Sc Avg. Is 0.3, for example, from the mask table MT (Table 1), the average score Sc Avg.
- the mask size 7 ⁇ 7 corresponding to the value of is obtained, and the size of the mask 310a is changed to 7 ⁇ 7 (solid line frame in FIG. 15) (S84).
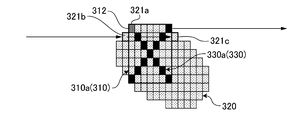
- a “x” mark 330a is attached to the marking image MP so as to be inscribed in the edge of the mask 310a (S85).
- “x” is used as the mark 330, but the mark 330 includes any mark (letters, numbers, symbols, pictograms, patterns, etc., except for those that block the entire mask 310. .) Can be used.
- the reference point 312 is scanned again (FIG. 16).
- the above condition b is not satisfied, and thus scanning is skipped. Since there is no lesion pixel 321 that satisfies both the conditions a and b in the line of the lesion pixel 321a, the scan moves to the next lower line, and the lesion pixel 321b is detected. However, when the mask 310 is set starting from the lesion pixel 321b, it interferes with the previously set mask 310a. Therefore, scanning is continued without setting the mask 310 in the lesion pixel 321b. The lesion pixel 321c is detected immediately after skipping the previously set mask 310a.
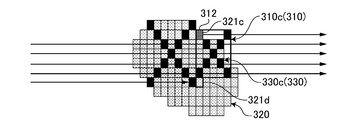
- an initial size (5 ⁇ 5) mask 310c (FIG. 17) is set starting from the lesion pixel 321c. Average score Sc Avg. However, if it is 0.1, for example, the corresponding mask size is not changed from the initial size (5 ⁇ 5), so the mask size is not updated, and an “x” mark 330c is attached so as to be inscribed in the edge of the mask 310c. Is done.
- the display screen generation process S9 is a process for generating display screen data to be displayed on the monitor 900 using various image data stored in the image memory 227.
- the display screen generation process S9 is performed by the display screen generation unit 228 of the image processing circuit 220. Done.
- the display screen generation unit 228 can generate a plurality of types of display screen data under the control of the system controller 202.
- the generated display screen data is subjected to processing such as gamma correction by the output circuit 220b, converted to a video signal of a predetermined video format, and output to the monitor 900 (output processing S10).
- FIG. 21 is an example of a display screen generated by the display screen generation processing S9, and is an analysis mode observation screen 340 displayed during endoscopic observation in the image analysis mode.
- the analysis mode observation screen 340 includes a date / time display area 341 for displaying the imaging date / time, a basic information display area 342 for displaying basic information related to the examination (for example, medical chart number, patient name, surgeon name), A normal image display area 344 for displaying the normal observation image NP (or tone-enhanced image EP) and an analysis image display area 345 for displaying the marking image MP (observation image after the marking process S8) are provided.
- the surgeon observes the endoscope while looking at the analysis mode observation screen 340. Specifically, endoscopic observation is performed while viewing the normal observation image NP (or tone-enhanced image EP) displayed in the normal image display area 344 while referring to the marking image MP displayed in the analysis image display area 345. Do. By observing the marked part in the marking image MP with particular care, an accurate diagnosis can be performed without overlooking the lesion.
- NP normal observation image
- EP tone-enhanced image EP
- the marking image MP is provided with a mark 330 through which the background normal observation image NP is transparent, endoscopic observation and diagnosis can be performed while viewing only the marking image MP. Therefore, for example, the analysis mode observation screen 340 including the large analysis image display area 345 without including the normal image display area 344 may be generated.
- the marking image MP in the marking image MP, the mark 330 indicating the position and severity of the lesion is attached on the image 320 of the lesion. Even a shallow surgeon can easily perform an accurate diagnosis based on an endoscopic image without overlooking a lesion or misunderstanding the severity.
- the marking image MP is provided with a mark 330 that does not completely cover the background (lesion site image 320) and allows a part of the background to pass through the gap (that is, has transparency). Thereby, since the shape and texture of a lesion part can be grasped also from marking image MP, it becomes possible to perform more efficient and more accurate diagnosis.
- the marking image MP is generated by attaching the mark 330 to the normal observation image NP.
- the mark 330 is attached to the tone-enhanced image EP and other images obtained by processing the normal observation image NP. It is good also as a structure which produces
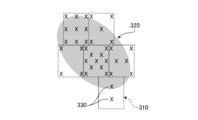
- FIG. 22 is a marking image MP of a first modification of the first embodiment of the present invention.
- the average score Sc Avg. A configuration is adopted in which the mask size is changed according to the condition, and the severity is expressed by the size of the mark 330.
- the first modified example not the mask size but the number of marks 330 attached in the mask 310 is the average score Sc Avg. Is set according to In this modification, the severity is expressed by the density of the mark 330.
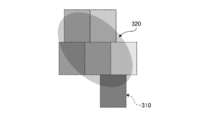
- FIG. 23 is a marking image MP of the second modified example of the first embodiment of the present invention.
- a configuration is employed in which marking is performed on the normal observation image NP by attaching characters and symbols in the mask 310.
- the average score Sc Avg is displayed by changing the color in the mask 310 (in other words, adding a color mark) to the normal observation image NP.
- the normal observation image NP is not filled with a single color (transmittance 0%) in the mask, but a color that gives a predetermined transparency (for example, transmittance 80%).
- a predetermined transparency for example, transmittance 80%.
- the mask size is set as small as 1 ⁇ 1 (or each pixel without setting the mask). It can also be configured to perform processing.
- the score Sc (x, y) and each pixel (x, y) of each pixel (x, y) are attached to the mask table MT (Table 1) in the first embodiment described above.
- a display color table in which the correspondence relationship with the power color Col (x, y) is stored is used.
- Table 3 shows an example of the display color table (24-bit color). It should be noted that an empty value (null value) indicating colorless and transparent is given to a pixel (x, y) whose score Sc (x, y) is zero (normal tissue). Not colored.
- the designation of the color to be assigned to each pixel (x, y) is not limited to designation by RGB, but may be designated by other color expressions (for example, hue and / or saturation).
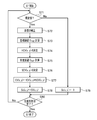
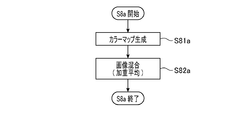
- FIG. 24 is a flowchart illustrating the procedure of the marking process S8a according to the second embodiment.
- the marking process S8a of the present embodiment is performed in place of the marking process S8 of the first embodiment described above. Further, the marking process S8a of the present embodiment is sequentially performed for all the pixels (x, y) constituting the normal observation image data N.
- a display color table (Table 3) is stored on the memory 229 as in the second modification of the first embodiment described above.
- the image memory 227 of the present embodiment stores color map image data CM (image data representing the color map image CMP) created in the marking process S8a.
- a storage area Pc is provided (see FIG. 3B).
- the marking process S8a first, the display color table stored in the memory 229 is referred to, and the color Col (x, y) applied to each pixel is determined based on the score Sc (x, y).
- the color Col (x, y) of pixels other than the lesion pixel is set to be colorless and transparent (null value).
- color map image data CM composed of the color Col (x, y) of each pixel (x, y) is generated and stored in the storage area P c of the memory 229 (S81a).
- an image mixing process S82a is performed in which the color map image CMP is given transparency and is superimposed on the normal observation image NP.
- the image mixing process S82a is a process of performing weighted averaging of the normal observation image data N and the color map image data CM. By performing the weighted average, the color map image CMP can be made transparent and can be superimposed on the normal observation image NP. Note that the weight of the normal observation image data N in the weighted average is determined by a preset transmittance of the color map image CMP. Marking image data M which has been generated by the image mixing process S82a is stored in the storage area P m of the image memory 227, the marking process S8a is completed.
- the pixel value N (x, y) of the observation image data N becomes the pixel value M (x, y) of the marking image data M as it is.
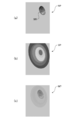
- FIG. 25A is a normal observation image NP that includes an image 320 of a lesioned part.
- FIG. 25B is an image (transmittance 0%) in which the color map image CMP is directly superimposed on the normal observation image NP.
- FIG. 25C shows a marking image MP generated by the image mixing process S82a of the present embodiment.
- the marking image MP generated by the image mixing process S82a visually recognizes a site estimated to be a lesion and an estimated severity by a color map. Can be grasped easily. Further, since the color map has transparency, the shape and texture of the lesioned part can be grasped to some extent from the marking image MP, and diagnosis can be performed more easily.
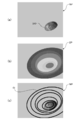
- the contour line CL of the core Sc (x, y) is displayed on the normal observation image NP so as to display the position of the lesioned part and the distribution of the severity with high visibility.
- FIG. 26 is a diagram for explaining a process of creating a contour line CL in the third embodiment.
- the display color table (Table 3) based on the core table ST generated from the normal observation image NP including the lesion image 320 shown in FIG.
- a color map image CMP shown in 26 (b) is generated.
- a contour line CL is generated by performing processing such as vector differentiation on the color map image data CM, for example, on the color map image CMP.
- the marking image MP of the present embodiment shown in FIG. 26C is generated.
- Embodiments of the present invention are not limited to those described above, and various modifications are possible within the scope of the technical idea of the present invention.
- the embodiment of the present invention also includes contents appropriately combined with embodiments or the like clearly shown in the specification or obvious embodiments.
- image analysis such as lesion determination is performed in the HSI space, but HSV based on hue, saturation, and value (or brightness) instead of the HSI space. It may be configured to perform image analysis in (HSB) space.
- one coordinate representing luminance or lightness such as CIE 1976 L * a * b * color space and YCbCr color space, and two representing color quality (for example, hue and saturation, or chromaticity).
- Image analysis can also be performed on other types of color spaces having coordinates.
- the TE process S3 is performed on the RGB space.
- the TE process S3 may be performed on the HSI space after the color space conversion process S5.
- contrast enhancement processing for example, a histogram equalization method for enhancing contrast by widening the distribution width of the histogram
- image sharpening processing using an unsharp mask filter for example, other types of image enhancement processing may be used.
- the above embodiment is an example in which the present invention is applied to endoscopy for inflammatory bowel disease, but the present invention can naturally be applied to endoscopy for other diseases.
- the above embodiment is an example in which only the severity of one kind of lesion (inflammation) is evaluated based on the observation image, and a mark corresponding to the severity is attached to the corresponding portion of the observation image.
- a configuration may be adopted in which the severity is determined for each of a plurality of types of lesions (for example, inflammation and ulcers that are characteristic of inflammatory bowel disease), and a mark corresponding to the severity is attached to the corresponding portion of the observation image.
- the display mode for example, the type and color of the symbol
- only the lesioned part is marked, but conversely, only the healthy part may be marked. Moreover, it is good also as a structure which attaches a different mark to each of a lesioned part and a healthy part.
- said embodiment displays the severity of a lesioned part using any one of a symbol, a contour line, and a display color
- it combines two or more of these three types of display modes, and a lesioned part is combined.
- You may display the severity of.
- it is good also as a structure which displays a severity by the combination of 2 or more of the kind, magnitude
- it is good also as a structure which displays a severity by the kind of a contour line (a continuous line, a broken line, a chain line, a wavy line, etc.), thickness, a color, or a combination of these two or more.
- the above embodiment is an example in which the present invention is applied to an electronic endoscope apparatus which is a form of a digital camera, but other types of digital cameras (for example, a digital still camera and a digital video camera) are used.
- the present invention can also be applied to such a system.
- diagnosis support for a lesion in a body surface tissue and diagnosis support for brain tissue during craniotomy can be performed.
Abstract
This image processing device comprises: a color image acquisition means that acquires color image data representing a color image of biological tissue; a lesion determination means that determines whether or not each pixel in the color image is a pixel of a lesion on the basis of the color image data; and a marking means that makes a mark indicating the position of the lesion on the color image on the basis of the determination result. The mark is a mark through which the color image in the background can be seen.
Description
本発明は、生体組織の画像を処理する画像処理装置に関する。
The present invention relates to an image processing apparatus for processing an image of a living tissue.
一般に、生体組織の病変部は正常な部位とは異なる色を呈する。カラー内視鏡装置の性能向上により、正常組織とわずかに色の異なる病変部の識別も可能になってきている。しかしながら、術者が内視鏡画像上のわずかな色の相違により正常組織から病変部を正確に識別できるようになるには、熟練者の指導下で長期間のトレーニングを受ける必要があった。また、熟練した術者であっても、わずかな色の違いから病変部を識別することは容易ではなく、慎重な作業が要求された。
In general, the lesioned part of living tissue exhibits a color different from that of a normal part. With the improvement in the performance of color endoscope devices, it has become possible to identify lesions slightly different in color from normal tissues. However, in order for an operator to accurately identify a lesion from a normal tissue due to a slight color difference on an endoscopic image, it is necessary to receive a long-term training under the guidance of an expert. Moreover, even a skilled operator cannot easily identify a lesion from a slight color difference, and requires careful work.
そこで、例えば、特開2014-18332号公報(以下、「特許文献1」と記す。)に、病変部の識別を容易にするために、白色光を使用して撮像した内視鏡画像データに対して、色情報に基づいて被写体が病変部か否かを判定し、病変部と判定された画素の色を変更する処理を行う機能を備えた電子内視鏡装置が提案されている。
Therefore, for example, in Japanese Patent Laid-Open No. 2014-18332 (hereinafter referred to as “Patent Document 1”), in order to facilitate identification of a lesion, endoscopic image data captured using white light is used. On the other hand, there has been proposed an electronic endoscope apparatus having a function of determining whether or not a subject is a lesioned part based on color information and changing a color of a pixel determined to be a lesioned part.
特許文献1の電子内視鏡装置が生成するマーキング画像は、病変部と疑われる箇所が明確に色分けされるが、診断に必要な病変部の像の情報が損なわれてしまうため、診断の際に通常観察画像と丁寧に見比べる必要があり、診断しにくいという不便があった。
In the marking image generated by the electronic endoscope apparatus of Patent Document 1, a portion suspected of being a lesion is clearly color-coded, but information on the image of a lesion necessary for diagnosis is impaired, so that a diagnosis image is lost. However, there is an inconvenience that it is difficult to make a diagnosis because it is necessary to carefully compare with a normal observation image.
本発明は上記の事情に鑑みてなされたものであり、その目的とするところは、病変部の像の情報を十分に維持しつつ、病変部と疑われる箇所を明示可能な画像処理装置を提供することである。
The present invention has been made in view of the above circumstances, and an object of the present invention is to provide an image processing apparatus capable of clearly indicating a suspected lesion while maintaining sufficient image information of the lesion. It is to be.
本発明の一実施形態によれば、生体組織のカラー画像を表すカラー画像データを取得するカラー画像取得手段と、カラー画像データに基づいて、カラー画像の各画素について病変部の画素か否かの判定をする病変判定手段と、判定の結果に基づいて、カラー画像上に病変部の位置を示す印を付すマーキング手段と、を備え、印は、背景のカラー画像が透ける印である、画像処理装置が提供される。
According to one embodiment of the present invention, color image acquisition means for acquiring color image data representing a color image of a living tissue, and whether or not each pixel of the color image is a pixel of a lesion based on the color image data Image processing, comprising: a lesion determination unit that performs a determination; and a marking unit that adds a mark indicating the position of the lesion on the color image based on the determination result, wherein the mark is a mark through which the background color image is transparent An apparatus is provided.
また、上記の画像処理装置において、病変判定手段が、カラー画像の画素毎に生体組織の病変の重症度を示すスコアを要素に含むスコアテーブルを生成するスコアテーブル生成手段を有し、マーキング手段が、スコアテーブルに基づいて、カラー画像上に病変部の位置及び重症度を示す前記印を付す構成としてもよい。
Further, in the above image processing apparatus, the lesion determination unit includes a score table generation unit that generates a score table including a score indicating the severity of the lesion of the living tissue for each pixel of the color image, and the marking unit includes Based on the score table, the color image may be provided with the mark indicating the position and severity of the lesion.
この構成によれば、カラー画像上に付される印から、病変の重症度に関する情報も得られるため、客観的なデータに基づく高度な診断が可能になる。
According to this configuration, since information on the severity of the lesion can be obtained from the mark attached on the color image, advanced diagnosis based on objective data becomes possible.
また、上記の画像処理装置において、マーキング手段が、カラー画像内に処理の対象領域であるマスクを設定し、マスク内のスコアの代表値を計算し、代表値に基づいてマスクに印を付す構成としてもよい。
Further, in the above image processing apparatus, the marking means sets a mask that is a processing target area in the color image, calculates a representative value of the score in the mask, and marks the mask based on the representative value It is good.
また、上記の画像処理装置において、マーキング手段が、所定の初期サイズのマスクを設定し、初期サイズのマスクについて代表値を計算し、代表値に応じてマスクの大きさを変更し、大きさを変更したマスクに内接するように印を付す構成としてもよい。
In the image processing apparatus, the marking unit sets a mask having a predetermined initial size, calculates a representative value for the initial size mask, changes the mask size according to the representative value, and sets the size. It is good also as a structure which attaches a mark so that the changed mask may be inscribed.
この構成によれば、病変の重症度が印の大きさによって示されるため、印が付された画像から重症度を直観的に把握することができる。
According to this configuration, since the severity of the lesion is indicated by the size of the mark, it is possible to intuitively grasp the severity from the marked image.
また、上記の画像処理装置において、初期サイズが、マスクの最小サイズである構成としてもよい。
In the above image processing apparatus, the initial size may be a minimum mask size.
また、上記の画像処理装置において、マーキング手段が、代表値に応じた数の印をマスク内に付す構成としてもよい。
In the above image processing apparatus, the marking means may add a number of marks corresponding to the representative value in the mask.
この構成によれば、病変の重症度が印の密度によって示されるため、印が付された画像から重症度を直観的に把握することができる。
According to this configuration, since the severity of the lesion is indicated by the density of the mark, it is possible to intuitively grasp the severity from the marked image.
また、上記の画像処理装置において、マーキング手段が、カラー画像内でマスクを走査させながらカラー画像上に印を付す構成としてもよい。
In the above image processing apparatus, the marking unit may mark the color image while scanning the mask in the color image.
また、上記の画像処理装置において、マーキング手段が、設定済みの他のマスクと重ならないようにマスクを設定する構成としてもよい。
In the above image processing apparatus, the marking unit may set the mask so that it does not overlap with another set mask.
この構成によれば、既に付された印の情報が失われることがなく、印の情報の精度が維持される。
According to this configuration, the mark information already attached is not lost, and the accuracy of the mark information is maintained.
また、上記の画像処理装置において、代表値が、相加平均、加重平均、中央値、最頻値及び二乗平均平方根のいずれかである構成としてもよい。
In the image processing apparatus, the representative value may be an arithmetic mean, a weighted average, a median, a mode, or a root mean square.
また、上記の画像処理装置において、スコアテーブルを生成する手段が、カラー画像データの色空間を、輝度又は明度を表す1つの座標と、色の質を表わす2つの座標と、を有する色空間に変換する色空間変換手段と、カラー画像データの各画素の色の質に基づいて、各画素のスコアを計算するスコア計算手段と、を備える構成としてもよい。
In the image processing apparatus, the means for generating the score table converts the color space of the color image data into a color space having one coordinate representing luminance or brightness and two coordinates representing color quality. A configuration may be provided that includes color space conversion means for conversion and score calculation means for calculating the score of each pixel based on the color quality of each pixel of the color image data.
また、上記の画像処理装置において、スコアテーブルを生成する手段が、病変部に特徴的な画素値の範囲の境界領域において色の質のコントラストを高める色彩強調処理を行う色彩強調手段を更に備え、スコア計算手段が、色彩強調処理後の画素値に基づいて各画素のスコアを計算する構成としてもよい。
Further, in the above image processing apparatus, the means for generating the score table further comprises color enhancement means for performing color enhancement processing for increasing the contrast of the color quality in the boundary region of the pixel value range characteristic of the lesion, The score calculation means may be configured to calculate the score of each pixel based on the pixel value after the color enhancement processing.
また、上記の画像処理装置において、スコア計算手段が、色相-彩度空間又は色度空間における基準点との距離に基づいて各画素のスコアを計算する構成としてもよい。
In the above image processing apparatus, the score calculation means may be configured to calculate the score of each pixel based on the distance from the reference point in the hue-saturation space or the chromaticity space.
また、上記の画像処理装置において、病変部が炎症部であり、基準点が血液の色である構成としてもよい。
In the above image processing apparatus, the lesioned part may be an inflamed part and the reference point may be blood color.
また、上記の画像処理装置において、印が記号である構成としてもよい。
In the above image processing apparatus, the mark may be a symbol.
また、上記の画像処理装置において、印が透過率を有する色である構成としてもよい。
In the above image processing apparatus, the mark may be a color having transmittance.
また、上記の画像処理装置において、印が重症度の等高線である構成としてもよい。
In the above image processing apparatus, the mark may be a contour line of severity.
また、上記の画像処理装置において、カラー画像が電子内視鏡画像である構成としてもよい。
In the above image processing apparatus, the color image may be an electronic endoscopic image.
本発明の一実施形態によれば、生体組織のカラー画像が透ける印が付され、印を付す前のカラー画像を参照しなくても生体組織の形状やテクスチャを把握することができるため、画像診断をより容易且つ正確に行うことが可能になる。
According to one embodiment of the present invention, a color image of a biological tissue is marked, and the shape and texture of the biological tissue can be grasped without referring to the color image before the marking. Diagnosis can be performed more easily and accurately.
以下、本発明の画像処理装置の実施形態について図面を参照しながら説明する。なお、以下においては、本発明の一実施形態として電子内視鏡システムを例に取り説明する。
Hereinafter, embodiments of the image processing apparatus of the present invention will be described with reference to the drawings. In the following, an electronic endoscope system will be described as an example of an embodiment of the present invention.
<第1実施形態>
[電子内視鏡装置1全体の構成]
図1は、本発明の第1実施形態の電子内視鏡装置1の構成を示すブロック図である。図1に示されるように、電子内視鏡装置1は、電子スコープ100、プロセッサ200及びモニタ900を備えている。 <First Embodiment>
[Configuration of the entire electronic endoscope apparatus 1]
FIG. 1 is a block diagram showing a configuration of anelectronic endoscope apparatus 1 according to the first embodiment of the present invention. As shown in FIG. 1, the electronic endoscope apparatus 1 includes an electronic scope 100, a processor 200, and a monitor 900.
[電子内視鏡装置1全体の構成]
図1は、本発明の第1実施形態の電子内視鏡装置1の構成を示すブロック図である。図1に示されるように、電子内視鏡装置1は、電子スコープ100、プロセッサ200及びモニタ900を備えている。 <First Embodiment>
[Configuration of the entire electronic endoscope apparatus 1]
FIG. 1 is a block diagram showing a configuration of an
プロセッサ200は、システムコントローラ202及びタイミングコントローラ204を備えている。システムコントローラ202は、メモリ212に記憶された各種プログラムを実行し、電子内視鏡装置1全体を統合的に制御する。また、システムコントローラ202は、操作パネル214に接続されている。システムコントローラ202は、操作パネル214より入力される術者からの指示に応じて、電子内視鏡装置1の各動作及び各動作のためのパラメーターを変更する。タイミングコントローラ204は、各部の動作のタイミングを調整する同期信号を電子内視鏡装置1内の各回路に出力する。
The processor 200 includes a system controller 202 and a timing controller 204. The system controller 202 executes various programs stored in the memory 212 and controls the entire electronic endoscope apparatus 1 in an integrated manner. The system controller 202 is connected to the operation panel 214. The system controller 202 changes each operation of the electronic endoscope apparatus 1 and parameters for each operation in accordance with an instruction from the operator input from the operation panel 214. The timing controller 204 outputs a synchronization signal for adjusting the operation timing of each unit to each circuit in the electronic endoscope apparatus 1.
ランプ208は、ランプ電源イグナイタ206による始動後、照射光Lを射出する。ランプ208は、例えば、キセノンランプ、ハロゲンランプ、水銀ランプ、メタルハライドランプ等の高輝度ランプやLED(Light Emitting Diode)である。照射光Lは、主に可視光領域から不可視である赤外光領域に広がるスペクトルを持つ広帯域光(又は少なくとも可視光領域を含む白色光)である。
The lamp 208 emits the irradiation light L after being started by the lamp power igniter 206. The lamp 208 is, for example, a high-intensity lamp such as a xenon lamp, a halogen lamp, a mercury lamp, or a metal halide lamp, or an LED (Light-Emitting-Diode). The irradiation light L is broadband light (or white light including at least the visible light region) having a spectrum that mainly extends from the visible light region to the invisible infrared light region.
ランプ208より射出された照射光Lは、集光レンズ210によりLCB(Light Carrying Bundle)102の入射端面に集光されてLCB102内に入射される。
The irradiation light L emitted from the lamp 208 is condensed on the incident end face of the LCB (Light Carrying Bundle) 102 by the condenser lens 210 and is incident on the LCB 102.
LCB102内に入射された照射光Lは、LCB102内を伝播して電子スコープ100の先端に配置されたLCB102の射出端面より射出され、配光レンズ104を介して被写体に照射される。照射光Lにより照射された被写体からの戻り光は、対物レンズ106を介して固体撮像素子108の受光面上で光学像を結ぶ。
The irradiation light L incident on the LCB 102 propagates through the LCB 102, is emitted from the exit end face of the LCB 102 disposed at the tip of the electronic scope 100, and is irradiated onto the subject via the light distribution lens 104. The return light from the subject irradiated with the irradiation light L forms an optical image on the light receiving surface of the solid-state image sensor 108 via the objective lens 106.
固体撮像素子108は、補色市松色差線順次方式の単板式カラーCCD(Charge Coupled Device)イメージセンサである。固体撮像素子108は、受光面上で結像した被写体の光学像を撮像して、アナログ撮像信号を出力する。具体的には、固体撮像素子108は、受光面上の各画素で結像した光学像を光量に応じた電荷として蓄積して、イエローYe、シアンCy、グリーンG、マゼンタMgの色信号を生成し、生成された垂直方向に隣接する2つの画素の色信号を加算し混合して得た走査線を順次出力する。なお、固体撮像素子108は、CCDイメージセンサに限らず、CMOS(Complementary Metal Oxide Semiconductor)イメージセンサやその他の種類の撮像装置に置き換えられてもよい。固体撮像素子108はまた、原色系フィルタ(ベイヤ配列フィルタ)を搭載したものであってもよい。
The solid-state image sensor 108 is a single color CCD (Charge Coupled Device) image sensor of a complementary color checkered color difference line sequential method. The solid-state image sensor 108 images an optical image of a subject formed on the light receiving surface and outputs an analog image signal. Specifically, the solid-state image sensor 108 accumulates an optical image formed by each pixel on the light receiving surface as a charge corresponding to the amount of light, and generates yellow Ye, cyan Cy, green G, and magenta Mg color signals. Then, the generated scanning lines are sequentially output by adding and mixing the color signals of two adjacent pixels in the vertical direction. Note that the solid-state imaging element 108 is not limited to a CCD image sensor, and may be replaced with a CMOS (Complementary Metal Oxide Semiconductor) image sensor or other types of imaging devices. The solid-state image sensor 108 may also be one equipped with a primary color filter (Bayer array filter).
電子スコープ100の接続部内には、ドライバ信号処理回路110が備えられている。ドライバ信号処理回路110には、上記の走査線からなるアナログ撮像信号がフィールド周期で固体撮像素子108より入力される。なお、以降の説明において「フィールド」は「フレーム」に置き替えてもよい。本実施形態において、フィールド周期、フレーム周期はそれぞれ、1/60秒、1/30秒である。ドライバ信号処理回路110は、固体撮像素子108より入力されるアナログ撮像信号に対して所定の処理を施してプロセッサ200の画像処理回路220に出力する。
In the connection part of the electronic scope 100, a driver signal processing circuit 110 is provided. The driver signal processing circuit 110 receives an analog imaging signal composed of the above scanning lines from the solid-state imaging device 108 in a field cycle. In the following description, “field” may be replaced with “frame”. In the present embodiment, the field period and the frame period are 1/60 seconds and 1/30 seconds, respectively. The driver signal processing circuit 110 performs predetermined processing on the analog imaging signal input from the solid-state imaging device 108 and outputs the processed signal to the image processing circuit 220 of the processor 200.
ドライバ信号処理回路110はまた、メモリ120にアクセスして電子スコープ100の固有情報を読み出す。メモリ120に記録される電子スコープ100の固有情報には、例えば、固体撮像素子108の画素数や感度、動作可能なフィールドレート、型番等が含まれる。ドライバ信号処理回路110は、メモリ120より読み出された固有情報をシステムコントローラ202に出力する。
The driver signal processing circuit 110 also accesses the memory 120 and reads the unique information of the electronic scope 100. The unique information of the electronic scope 100 recorded in the memory 120 includes, for example, the number and sensitivity of the solid-state image sensor 108, the operable field rate, the model number, and the like. The driver signal processing circuit 110 outputs the unique information read from the memory 120 to the system controller 202.
システムコントローラ202は、電子スコープ100の固有情報に基づいて各種演算を行い、制御信号を生成する。システムコントローラ202は、生成された制御信号を用いて、プロセッサ200に接続されている電子スコープに適した処理がなされるようにプロセッサ200内の各種回路の動作やタイミングを制御する。
The system controller 202 performs various calculations based on the unique information of the electronic scope 100 and generates a control signal. The system controller 202 controls the operation and timing of various circuits in the processor 200 using the generated control signal so that processing suitable for the electronic scope connected to the processor 200 is performed.
タイミングコントローラ204は、システムコントローラ202によるタイミング制御に従って、同期信号を生成する。ドライバ信号処理回路110は、タイミングコントローラ204から供給される同期信号に従って、プロセッサ200が生成するビデオ信号のフィールドレートに同期したタイミングで固体撮像素子108を駆動制御する。
The timing controller 204 generates a synchronization signal according to the timing control by the system controller 202. The driver signal processing circuit 110 drives and controls the solid-state imaging device 108 at a timing synchronized with the field rate of the video signal generated by the processor 200 in accordance with the synchronization signal supplied from the timing controller 204.
画像処理回路220は、システムコントローラ202による制御の下、電子スコープ100から出力される撮像信号に基づいて画像データを生成する。また、画像処理回路220は、生成された画像データを使用してモニタ表示用の画面データを生成し、この画面データを所定のビデオ・フォーマットのビデオ信号に変換して出力する。ビデオ信号はモニタ900に入力され、被写体のカラー画像がモニタ900の表示画面に表示される。
The image processing circuit 220 generates image data based on the imaging signal output from the electronic scope 100 under the control of the system controller 202. The image processing circuit 220 generates screen data for monitor display using the generated image data, converts the screen data into a video signal of a predetermined video format, and outputs the video signal. The video signal is input to the monitor 900, and a color image of the subject is displayed on the display screen of the monitor 900.
図2は、電子内視鏡装置1の画像処理に関する回路の概略構成を示したブロック図である。
FIG. 2 is a block diagram showing a schematic configuration of a circuit related to image processing of the electronic endoscope apparatus 1.
ドライバ信号処理回路110は、駆動回路112とAFE(Analog Front End)114を備えている。駆動回路112は、同期信号に基づいて固体撮像素子108の駆動信号を生成する。AFE114は、固体撮像素子108から出力されるアナログ撮像信号に対して、ノイズ除去、信号増幅・ゲイン補正及びA/D変換を行い、デジタル撮像信号を出力する。なお、本実施形態においてAFE114が行う処理の全部又は一部を固体撮像素子108又は画像処理回路220が行う構成としてもよい。
The driver signal processing circuit 110 includes a drive circuit 112 and an AFE (Analog Front End) 114. The drive circuit 112 generates a drive signal for the solid-state image sensor 108 based on the synchronization signal. The AFE 114 performs noise removal, signal amplification / gain correction, and A / D conversion on the analog imaging signal output from the solid-state imaging device 108, and outputs a digital imaging signal. Note that the solid-state imaging device 108 or the image processing circuit 220 may perform all or part of the processing performed by the AFE 114 in the present embodiment.
画像処理回路220は、基本処理部220a、出力回路220b、TE(Tone Enhancement:トーン強調)処理部221、有効画素判定部222、色空間変換部223、病変判定部224、スコア計算部225、マーキング処理部226、画像メモリ227、表示画面生成部228及びメモリ229を備えている。画像処理回路220の各部が行う処理については後述する。
The image processing circuit 220 includes a basic processing unit 220a, an output circuit 220b, a TE (Tone enhancement) processing unit 221, an effective pixel determination unit 222, a color space conversion unit 223, a lesion determination unit 224, a score calculation unit 225, a marking A processing unit 226, an image memory 227, a display screen generation unit 228, and a memory 229 are provided. Processing performed by each unit of the image processing circuit 220 will be described later.
図3(a)は、画像メモリ227が備える記憶領域の概略構成を示す図である。本実施形態の画像メモリ227には、3つの記憶領域Pn、Pe、Pmが設けられている。記憶領域Pnは、基本処理部220aが生成する通常観察画像データN(通常観察画像NPを表す画像データ)を記憶する領域である。記憶領域Peは、TE処理部221が生成するトーン強調画像データE(トーン強調画像EPを表す画像データ)を記憶する領域である。記憶領域Pmは、マーキング処理部226が生成するマーキング画像データM(マーキング画像MPを表す画像データ)を記憶する領域である。
FIG. 3A is a diagram illustrating a schematic configuration of a storage area included in the image memory 227. The image memory 227 of the present embodiment is provided with three storage areas P n , P e , and P m . The storage area P n is an area for storing normal observation image data N (image data representing the normal observation image NP) generated by the basic processing unit 220a. The storage area Pe is an area for storing tone-enhanced image data E (image data representing the tone-enhanced image EP) generated by the TE processing unit 221. The storage area P m is an area in which marking image data M (image data representing the marking image MP) generated by the marking processing unit 226 is stored.
また、図2に示されるように、メモリ229には、フラグテーブルFT、スコアテーブルST、マスクテーブルMT、色相相関値テーブルHCT及び彩度相関値テーブルSCTが格納される。フラグテーブルFT及びスコアテーブルSTは、それぞれ通常観察画像データNの各画素(x,y)に関する解析結果を示すフラグF(x,y)、スコアSc(x,y)から構成された数値テーブルである。具体的には、フラグF(x,y)は対応する画素(x,y)に写された組織の病変の有無を示すパラメーターであり、スコアSc(x,y)はその病変の重症度を示すパラメーターである。色相相関値テーブルHCT、彩度相関値テーブルSCT及びマスクテーブルMTについては後述する。
Also, as shown in FIG. 2, the memory 229 stores a flag table FT, a score table ST, a mask table MT, a hue correlation value table HCT, and a saturation correlation value table SCT. The flag table FT and the score table ST are numerical tables composed of a flag F (x, y) and a score Sc (x, y) indicating the analysis result for each pixel (x, y) of the normal observation image data N, respectively. is there. Specifically, the flag F (x, y) is a parameter indicating the presence or absence of a lesion in the tissue imaged on the corresponding pixel (x, y), and the score Sc (x, y) indicates the severity of the lesion. Is the parameter shown. The hue correlation value table HCT, the saturation correlation value table SCT, and the mask table MT will be described later.
[基本処理S1]
次に、画像処理回路220が行う処理について説明する。
図4は、画像処理回路220が行う処理の手順を示すフローチャートである。AFE114から出力されたデジタル信号は、先ず基本処理部220aによって一般的な信号処理(基本処理S1)が行われて、通常観察画像データNが生成される。 [Basic processing S1]
Next, processing performed by theimage processing circuit 220 will be described.
FIG. 4 is a flowchart showing a procedure of processing performed by theimage processing circuit 220. The digital signal output from the AFE 114 is first subjected to general signal processing (basic processing S1) by the basic processing unit 220a, and normal observation image data N is generated.
次に、画像処理回路220が行う処理について説明する。
図4は、画像処理回路220が行う処理の手順を示すフローチャートである。AFE114から出力されたデジタル信号は、先ず基本処理部220aによって一般的な信号処理(基本処理S1)が行われて、通常観察画像データNが生成される。 [Basic processing S1]
Next, processing performed by the
FIG. 4 is a flowchart showing a procedure of processing performed by the
基本処理S1には、AFE114から出力されたデジタル撮像信号を輝度信号Y及び色差信号Cb、Crに変換する処理、輝度信号Y及び色差信号Cb、Crから原色信号R、G、Bを分離する原色分離処理、オフセット成分を除去するクランプ処理、欠陥画素の画素値を周囲の画素の画素値を用いて補正する欠陥補正処理、単色の画素値からなる撮像データ(RAWデータ)をフルカラーの画素値からなる画像データに変換するデモザイク処理(補間処理)、カラーマトリクスを用いて撮像素子の分光特性を補正するリニアマトリクス処理、照明光のスペクトル特性を補正するホワイトバランス処理、空間周波数特性の劣化を補償する輪郭補正等が含まれる。
In the basic processing S1, the digital image pickup signal output from the AFE 114 is converted into the luminance signal Y and the color difference signals Cb and Cr, and the primary colors for separating the primary color signals R, G and B from the luminance signal Y and the color difference signals Cb and Cr. Separation processing, clamping processing for removing offset components, defect correction processing for correcting pixel values of defective pixels using pixel values of surrounding pixels, and imaging data (RAW data) consisting of single-color pixel values from full-color pixel values Compensates for demosaic processing (interpolation processing) that converts to image data, linear matrix processing that corrects the spectral characteristics of the image sensor using a color matrix, white balance processing that corrects the spectral characteristics of illumination light, and degradation of spatial frequency characteristics Contour correction etc. are included.
なお、本実施形態において基本処理部220aが行う処理の全部又は一部をドライバ信号処理回路110又は固体撮像素子108が行う構成としてもよい。
In addition, it is good also as a structure which the driver signal processing circuit 110 or the solid-state image sensor 108 performs all or one part of the process which the basic process part 220a performs in this embodiment.
基本処理部220aによって生成された通常観察画像データNは、TE処理部221に入力されると共に、画像メモリ227の記憶領域Pnに記憶される。
The normal observation image data N generated by the basic processing unit 220a is input to the TE processing unit 221 and stored in the storage area P n of the image memory 227.
[動作モード判定処理S2]
次に、画像解析モードに設定されているか否かが判断される(S2)。本発明の実施形態に係る画像解析モードは、画像データの各画素について色情報を解析し、色情報の解析結果から所定の判定基準に基づいて病変部が写された画素(以下「病変画素」という。)であるか否かを判定し、病変画素を識別表示する動作モードである。判定する病変の種類は、検査内容に応じて選択することができる。以下に説明する例は、炎症性腸疾患(IBD)の病変である炎症(浮腫や易出血性を含む赤変病変)の観察像に特有の色域の画素を抽出して、識別表示するものである。 [Operation Mode Determination Process S2]
Next, it is determined whether or not the image analysis mode is set (S2). In the image analysis mode according to the embodiment of the present invention, color information is analyzed for each pixel of the image data, and a pixel in which a lesion portion is copied based on a predetermined determination criterion from the analysis result of the color information (hereinafter referred to as “lesion pixel”). It is an operation mode in which it is determined whether or not a lesion pixel is identified. The type of lesion to be determined can be selected according to the examination content. In the example described below, pixels with a color gamut peculiar to the observation image of inflammation (redness lesions including edema and hemorrhagic bleeding) that are lesions of inflammatory bowel disease (IBD) are extracted and displayed for identification. It is.
なお、本実施形態の電子内視鏡装置1は、画像解析モードと通常観察モードの2つの動作モードで動作するように構成されている。動作モードは、電子スコープ100の操作部130やプロセッサ200の操作パネル214に対するユーザ操作によって切り換えられる。通常観察モードに設定されている場合は(S2:No)、処理はS9へ進む。
Note that the electronic endoscope apparatus 1 of the present embodiment is configured to operate in two operation modes: an image analysis mode and a normal observation mode. The operation mode is switched by a user operation on the operation unit 130 of the electronic scope 100 or the operation panel 214 of the processor 200. If the normal observation mode is set (S2: No), the process proceeds to S9.
[TE(トーン強調)処理S3]
画像解析モードが選択されている場合は(S2:Yes)、次にTE処理部221によるTE処理S3が行われる。TE処理S3は、病変の判定精度を上げるために、通常観察画像データNの各原色信号R,G,Bに対して非線形なゲイン(利得)を与えるゲイン調整を行い、判定対象の病変に特有の色域(特にその境界部)付近におけるダイナミックレンジを実質的に広げて、色表現の実効的な分解能を高める処理である。具体的には、TE処理S3では、各原色信号R,G,Bに対して、図5に示すような非線形のゲインを与えて原色信号R´,G´,B´(トーン強調画像データE)を取得する処理が行われる。例えば、図5のゲイン曲線は、潰瘍に特徴的な色域の境界領域RAから、炎症に特徴的な色域の境界領域RBにかけて、傾きが急峻になっている。このようなゲイン曲線に従ってゲインを与えることにより、境界領域RAから境界領域RBにかけて原色信号R´(原色信号Rに対してTE処理S3を施した信号)の実質的なダイナミックレンジを広げることができ、より精密な閾値判定が可能になる。 [TE (tone enhancement) processing S3]
When the image analysis mode is selected (S2: Yes), the TE processing S221 by theTE processing unit 221 is performed next. The TE process S3 performs gain adjustment that gives a non-linear gain (gain) to each primary color signal R, G, B of the normal observation image data N in order to increase the lesion determination accuracy, and is specific to the lesion to be determined. In this process, the dynamic range in the vicinity of the color gamut (especially its boundary) is substantially widened to increase the effective resolution of color expression. Specifically, in the TE processing S3, the primary color signals R ′, G ′, B ′ (tone-enhanced image data E) are given to each primary color signal R, G, B by applying a non-linear gain as shown in FIG. ) Is acquired. For example, the gain curve in FIG. 5, from the boundary region R A characteristic gamut ulcers, inflammation over the boundary area R B of the characteristic color gamut, the slope is steeper. By providing a gain in accordance with such gain curve, widening the substantial dynamic range of the primary color signals R'from the border region R A toward the boundary area R B (signal subjected to the TE process S3 is transmitted to the primary color signals R) This makes it possible to determine the threshold value more precisely.
画像解析モードが選択されている場合は(S2:Yes)、次にTE処理部221によるTE処理S3が行われる。TE処理S3は、病変の判定精度を上げるために、通常観察画像データNの各原色信号R,G,Bに対して非線形なゲイン(利得)を与えるゲイン調整を行い、判定対象の病変に特有の色域(特にその境界部)付近におけるダイナミックレンジを実質的に広げて、色表現の実効的な分解能を高める処理である。具体的には、TE処理S3では、各原色信号R,G,Bに対して、図5に示すような非線形のゲインを与えて原色信号R´,G´,B´(トーン強調画像データE)を取得する処理が行われる。例えば、図5のゲイン曲線は、潰瘍に特徴的な色域の境界領域RAから、炎症に特徴的な色域の境界領域RBにかけて、傾きが急峻になっている。このようなゲイン曲線に従ってゲインを与えることにより、境界領域RAから境界領域RBにかけて原色信号R´(原色信号Rに対してTE処理S3を施した信号)の実質的なダイナミックレンジを広げることができ、より精密な閾値判定が可能になる。 [TE (tone enhancement) processing S3]
When the image analysis mode is selected (S2: Yes), the TE processing S221 by the
なお、TE処理S3により、炎症部は赤く、潰瘍部は白く、正常部は緑色に色味が変化する。そのため、TE処理S3によって生成されたトーン強調画像データEをモニタ900に表示した場合、TE処理S3前の通常観察画像データNを表示した場合よりも病変部(炎症部や潰瘍部)を容易に視認することができる。なお、上記のTE処理S3は、本発明に適用可能な色彩強調処理の一例であり、TE処理S3に替えて、色の質、具体的には色相又は彩度(あるいは色度)のコントラストを高める他の種類の色彩強調処理を使用してもよい。
Note that the TE treatment S3 changes the color of the inflamed part to red, the ulcer part to white, and the normal part to green. Therefore, when the tone-enhanced image data E generated by the TE process S3 is displayed on the monitor 900, the lesioned part (inflamed part or ulcer part) is easier than when the normal observation image data N before the TE process S3 is displayed. It can be visually recognized. The TE process S3 is an example of a color enhancement process applicable to the present invention. Instead of the TE process S3, the color quality, specifically, hue or saturation (or chromaticity) contrast is set. Other types of enhanced color enhancement processing may be used.
[有効画素判定処理S4]
TE処理S3が完了すると、次にトーン強調画像データEに対して有効画素判定部222による有効画素判定処理S4が行われる。なお、TE処理S3を省略して、通常観察画像データNに対して有効画素判定処理S4を行うこともできる。 [Effective pixel determination processing S4]
When the TE process S3 is completed, an effective pixel determination process S4 by the effectivepixel determination unit 222 is then performed on the tone enhanced image data E. Note that the TE process S3 may be omitted, and the effective pixel determination process S4 may be performed on the normal observation image data N.
TE処理S3が完了すると、次にトーン強調画像データEに対して有効画素判定部222による有効画素判定処理S4が行われる。なお、TE処理S3を省略して、通常観察画像データNに対して有効画素判定処理S4を行うこともできる。 [Effective pixel determination processing S4]
When the TE process S3 is completed, an effective pixel determination process S4 by the effective
図6は、有効画素判定処理S4の手順を示すフローチャートである。有効画素判定処理S4は、画素値が画像解析に適したものであるか否かを判定する処理であり、画像データを構成する全ての画素(x,y)について順次行われる。有効画素判定処理S4では、まず各画素(x,y)について、トーン強調画像データEの原色信号R´(x,y),G´(x,y),B´(x,y)から、下記の数式1により補正輝度int(x,y)が計算される(S41)。
FIG. 6 is a flowchart showing the procedure of the effective pixel determination process S4. The effective pixel determination process S4 is a process for determining whether or not the pixel value is suitable for image analysis, and is sequentially performed for all the pixels (x, y) constituting the image data. In the effective pixel determination process S4, first, for each pixel (x, y), from the primary color signals R ′ (x, y), G ′ (x, y), B ′ (x, y) of the tone-enhanced image data E, The corrected luminance int (x, y) is calculated by the following formula 1 (S41).
なお、計算した補正輝度int(x,y)の値は、次の適正露出判定処理S42に使用される。また、数式1から分かるように、補正輝度int(x,y)は、原色信号R´(x,y),G´(x,y),B´(x,y)の単純平均ではなく、ヒト(術者)の比視感度特性に基づいた加重平均として求められる。
Note that the calculated value of the corrected brightness int (x, y) is used in the next appropriate exposure determination process S42. As can be seen from Equation 1, the corrected luminance int (x, y) is not a simple average of the primary color signals R ′ (x, y), G ′ (x, y), B ′ (x, y), It is obtained as a weighted average based on the specific visual sensitivity characteristics of a human (operator).
次に、各画素(x,y)について、処理S41において計算したトーン強調画像データEの補正輝度int(x,y)及び原色信号R´(x,y),G´(x,y),B´(x,y)に基づいて、画像解析に適した露出レベルであるか否かを判定する適正露出判定処理S42が行われる。適正露出判定処理S42では、次の2つの条件(数式2、数式3)の少なくとも一方(或いは、両方)を満たす場合に、適正露出(S42:Yes)と判定する。なお、数式2により補正輝度int(x,y)(全体の光量)の上限値が規定され、数式3により各原色信号R´(x,y),G´(x,y),B´(x,y)の下限値が規定されている。
Next, for each pixel (x, y), the corrected luminance int (x, y) of the tone-enhanced image data E calculated in step S41 and the primary color signals R ′ (x, y), G ′ (x, y), Based on B ′ (x, y), appropriate exposure determination processing S42 for determining whether or not the exposure level is suitable for image analysis is performed. In the appropriate exposure determination process S42, it is determined that the exposure is appropriate (S42: Yes) when at least one (or both) of the following two conditions (Equation 2 and Equation 3) is satisfied. The upper limit value of the corrected luminance int (x, y) (total light amount) is defined by Equation 2, and each primary color signal R ′ (x, y), G ′ (x, y), B ′ ( A lower limit value of x, y) is defined.
画素(x,y)について、数式2又は数式3(或いは、数式2及び数式3)を満たし、適正露出と判定されると(S42:Yes)、有効画素判定部222は、メモリ229に格納されているフラグテーブルFTの画素(x,y)に対応するフラグF(x,y)の値を「1」に書き換える(S43)。
When the pixel (x, y) satisfies Expression 2 or 3 (or Expression 2 and Expression 3) and is determined to be appropriate exposure (S42: Yes), the effective pixel determination unit 222 is stored in the memory 229. The value of the flag F (x, y) corresponding to the pixel (x, y) in the flag table FT is rewritten to “1” (S43).
なお、フラグF(x,y)は、0~2のいずれかのフラグ値をとる。各フラグ値の定義は以下の通りである。
0:画素データ無効
1:正常又は未判定(画素データ有効)
2:病変(炎症) Note that the flag F (x, y) takes one of the flag values 0 to 2. The definition of each flag value is as follows.
0: Invalid pixel data 1: Normal or not determined (Pixel data valid)
2: Lesions (inflammation)
0:画素データ無効
1:正常又は未判定(画素データ有効)
2:病変(炎症) Note that the flag F (x, y) takes one of the flag values 0 to 2. The definition of each flag value is as follows.
0: Invalid pixel data 1: Normal or not determined (Pixel data valid)
2: Lesions (inflammation)
また、適正露出判定処理S42において、数式2、数式3のいずれの条件も(或いは、いずれかの条件を)満たさず、露出不適正と判定されると(S42:No)、有効画素判定部222は、フラグテーブルFTのフラグF(x,y)の値を「0」に書き換える(S44)。
Also, in the appropriate exposure determination process S42, if neither of the expressions 2 and 3 is satisfied (or any of the conditions) and it is determined that the exposure is inappropriate (S42: No), the effective pixel determination unit 222 is determined. Rewrites the value of the flag F (x, y) in the flag table FT to “0” (S44).
次に、処理S45では、全ての画素(x,y)について処理が完了したかどうかが判定される。全ての画素(x,y)の処理が完了するまで、上記の処理S41~S45が繰り返される。
Next, in process S45, it is determined whether or not the process has been completed for all the pixels (x, y). The above processes S41 to S45 are repeated until the processing of all the pixels (x, y) is completed.
[色空間変換処理S5]
有効画素判定処理S4が完了すると、次にトーン強調画像データEに対して色空間変換部223により色空間変換処理S5が行われる。色空間変換処理S5は、RGB3原色で定義されるRGB空間の画素値を、色相(Hew)・彩度(Saturation)・輝度(Intensity)の3要素で定義されるHSI(Heu-Saturation-Intensity)空間の画素値に変換する処理である。具体的には、色空間変換処理S5において、トーン強調画像データEの各画素(x,y)の原色信号R´(x,y),G´(x,y),B´(x,y)が、色相H(x,y),彩度S(x,y),輝度I(x,y)に変換される。 [Color space conversion processing S5]
When the effective pixel determination process S4 is completed, the colorspace conversion unit 223 performs the color space conversion process S5 on the tone enhanced image data E. The color space conversion process S5 is an HSI (Heu-Saturation-Intensity) defined by the three elements of hue (Hew), saturation (Saturation), and luminance (Intensity). This is a process of converting into a pixel value in space. Specifically, in the color space conversion process S5, primary color signals R ′ (x, y), G ′ (x, y), B ′ (x, y) of each pixel (x, y) of the tone-enhanced image data E. ) Is converted into hue H (x, y), saturation S (x, y), and luminance I (x, y).
有効画素判定処理S4が完了すると、次にトーン強調画像データEに対して色空間変換部223により色空間変換処理S5が行われる。色空間変換処理S5は、RGB3原色で定義されるRGB空間の画素値を、色相(Hew)・彩度(Saturation)・輝度(Intensity)の3要素で定義されるHSI(Heu-Saturation-Intensity)空間の画素値に変換する処理である。具体的には、色空間変換処理S5において、トーン強調画像データEの各画素(x,y)の原色信号R´(x,y),G´(x,y),B´(x,y)が、色相H(x,y),彩度S(x,y),輝度I(x,y)に変換される。 [Color space conversion processing S5]
When the effective pixel determination process S4 is completed, the color
また、露出が不足又は過剰な画素(x,y)のデータは精度が低く、解析結果の信頼度を下げてしまう。そのため、色空間変換処理S5は、フラグF(x,y)の値が「1」に設定された(すなわち、上述の有効画素判定処理S4において適正露出と判定された)画素(x,y)についてのみ行われる。
In addition, the data of the pixel (x, y) that is underexposed or excessively exposed is low in accuracy and lowers the reliability of the analysis result. Therefore, in the color space conversion process S5, the pixel (x, y) in which the value of the flag F (x, y) is set to “1” (that is, determined to be proper exposure in the above-described effective pixel determination process S4). Only done about.
色空間変換部223によって生成された各画素(x,y)の色相H(x,y)、彩度S(x,y)及び輝度I(x,y)からなる判定用画像データJ{H(x,y),S(x,y),I(x,y)}は、病変判定部224に入力される。
Determination image data J {H comprising the hue H (x, y), saturation S (x, y) and luminance I (x, y) of each pixel (x, y) generated by the color space conversion unit 223 (X, y), S (x, y), I (x, y)} are input to the lesion determination unit 224.
[病変判定処理S6]
色空間変換処理S5が完了すると、次に病変判定部224により判定用画像データJを用いた病変判定処理S6が行われる。病変判定処理S6は、内視鏡画像の各画素(x,y)について、判定用画像データJがHS空間(色相-彩度空間)上の後述する領域α、β(図8)のいずれにプロットされるかによって、その画素に写された生体組織の状態(炎症部であるか否か)を判定する処理である。なお、HS空間は、色度空間と同様に、色の質(明るさ・輝度を除いた色の要素)を表す空間である。例えば、CIE 1976 L*a*b*色空間等の他の色空間上で画像解析を行う場合には、病変判定部224は色度空間(例えばa*b*空間)上で行われる。 [Lesion determination process S6]
When the color space conversion process S5 is completed, a lesion determination process S6 using the determination image data J is then performed by thelesion determination unit 224. In the lesion determination process S6, for each pixel (x, y) of the endoscopic image, the determination image data J is placed in any one of regions α and β (FIG. 8) described later on the HS space (hue-saturation space). This is a process of determining the state of the biological tissue (whether or not it is an inflamed part) copied to the pixel depending on whether it is plotted. Note that the HS space is a space representing color quality (color elements excluding brightness and luminance) in the same manner as the chromaticity space. For example, when image analysis is performed on another color space such as the CIE 1976 L * a * b * color space, the lesion determination unit 224 is performed on the chromaticity space (for example, a * b * space).
色空間変換処理S5が完了すると、次に病変判定部224により判定用画像データJを用いた病変判定処理S6が行われる。病変判定処理S6は、内視鏡画像の各画素(x,y)について、判定用画像データJがHS空間(色相-彩度空間)上の後述する領域α、β(図8)のいずれにプロットされるかによって、その画素に写された生体組織の状態(炎症部であるか否か)を判定する処理である。なお、HS空間は、色度空間と同様に、色の質(明るさ・輝度を除いた色の要素)を表す空間である。例えば、CIE 1976 L*a*b*色空間等の他の色空間上で画像解析を行う場合には、病変判定部224は色度空間(例えばa*b*空間)上で行われる。 [Lesion determination process S6]
When the color space conversion process S5 is completed, a lesion determination process S6 using the determination image data J is then performed by the
図7は、病変判定処理S6の手順を示すフローチャートである。病変判定処理S6は、画像データを構成する全ての画素(x,y)について順次行われる。病変判定処理S6では、まず、フラグテーブルFTを参照して、各画素(x,y)のデータが有効であるか否かを判断する(S61)。フラグF(x,y)の値が「1」(画素データ有効)であれば、次に炎症判定処理S62を行う。また、フラグF(x,y)の値が「0」(画素データ無効)であれば、炎症判定処理S62を行わずに、処理S64へ進む。
FIG. 7 is a flowchart showing the procedure of the lesion determination process S6. The lesion determination process S6 is sequentially performed for all the pixels (x, y) constituting the image data. In the lesion determination processing S6, first, it is determined whether or not the data of each pixel (x, y) is valid with reference to the flag table FT (S61). If the value of the flag F (x, y) is “1” (pixel data valid), the inflammation determination process S62 is performed next. If the value of the flag F (x, y) is “0” (pixel data invalid), the process proceeds to the process S64 without performing the inflammation determination process S62.
ここで、病変判定処理S6において行われる炎症判定処理S62について説明する。図8は、複数の炎症性腸疾患患者の内視鏡画像データから取得した判定用画像データJをHS空間上にプロットした散布図である。
Here, the inflammation determination process S62 performed in the lesion determination process S6 will be described. FIG. 8 is a scatter diagram in which determination image data J acquired from endoscopic image data of a plurality of inflammatory bowel disease patients is plotted on the HS space.
図8の散布図は、右側下方の破線で囲まれた領域βと、それ以外の領域αとに区分される。本発明者の研究により、炎症性腸疾患の内視鏡診断に熟練した医師によって炎症部と判断された部位の画素の大半が領域βにプロットされ、非炎症部と判断された部位の画素の大半が領域αにプロットされることが判明した。このことは、生体組織を撮像した内視鏡観察画像の色相(色合い)と彩度(鮮やかさ)の2つの情報により、生体組織の状態(炎症の有無)を十分な確度で判別できることを意味している。
8 is divided into a region β surrounded by a broken line on the lower right side and a region α other than that. According to the inventor's research, most of the pixels of the part determined to be inflamed by a doctor skilled in endoscopic diagnosis of inflammatory bowel disease are plotted in the region β, and the pixels of the part determined to be non-inflamed It was found that the majority is plotted in region α. This means that the state of the biological tissue (whether it is inflamed) can be determined with sufficient accuracy based on the two information of the hue (hue) and the saturation (brilliance) of the endoscopic observation image obtained by imaging the biological tissue. is doing.
炎症判定処理S62においては、各画素(x,y)の判定用画像データJ{(H(x,y),S(x,y)}が、図8の領域βにプロットされるか否かが判定される。具体的には、判定用画像データJ{(H(x,y),S(x,y)}が、以下の数式4及び数式5の両方を満たす場合に、領域βにプロットされる(すなわち炎症部の画素と判定される)。また、判定用画像データJ{(H(x,y),S(x,y)}は、数式4及び数式5の少なくとも一方を満たさない場合に、領域αにプロットされる(すなわち炎症部の画素ではないと判定される)。なお、δS1、δH1及びδH2は、術者によって設定可能な補正値であり、これらの補正値の設定によって判定の厳しさ(感度)等を適宜調整することができる。
In the inflammation determination process S62, whether or not the determination image data J {(H (x, y), S (x, y)}) of each pixel (x, y) is plotted in the region β in FIG. Specifically, when the determination image data J {(H (x, y), S (x, y)}) satisfies both the following Expression 4 and Expression 5, The image data for determination J {(H (x, y), S (x, y)}) satisfies at least one of Expression 4 and Expression 5. If not, it is plotted in the region α (that is, it is determined not to be a pixel of the inflamed part) Note that δ S1 , δ H1 and δ H2 are correction values that can be set by the operator, and these corrections The severity of judgment (sensitivity) and the like can be appropriately adjusted by setting the value.
画素(x,y)の判定用画像データJ{(H(x,y),S(x,y)}が領域βにプロットされる場合は(S62:Yes)、画素(x,y)に対応するフラグF(x,y)の値が「2」(炎症)に書き換えられ(S63)、処理S64に進む。また、判定用画像データJ{H(x,y),S(x,y)}が領域βにプロットされない場合は(S62:No)、フラグF(x,y)は書き換えられずに、処理S64に進む。
When the image data for determination J {(H (x, y), S (x, y)}) of the pixel (x, y) is plotted in the region β (S62: Yes), the pixel (x, y) The value of the corresponding flag F (x, y) is rewritten to “2” (inflammation) (S63), and the process proceeds to the process S64, and the determination image data J {H (x, y), S (x, y). )} Is not plotted in the region β (S62: No), the flag F (x, y) is not rewritten and the process proceeds to step S64.
処理S64では、全ての画素(x,y)について処理が完了したかどうかが判定される。全ての画素(x,y)の処理が完了するまで、上記の処理S61~S64が繰り返される。
In process S64, it is determined whether or not the process has been completed for all the pixels (x, y). The above processes S61 to S64 are repeated until the processing of all the pixels (x, y) is completed.
[スコア計算処理:S7]
病変判定処理S6が完了すると、次にスコア計算処理S7が行われる。スコア計算処理S7は、判定用画像データJの画素値に基づいて、病変部の重症度の評価値であるスコアSc(x,y)を計算する処理である。スコア計算処理S7は、画像データを構成する全ての画素(x,y)について順次行われる。なお、以下に説明するスコア計算のアルゴリズムは一例であり、本発明は様々なアルゴリズムにより算出したスコアの画面表示に適用することができる。 [Score calculation processing: S7]
When the lesion determination process S6 is completed, a score calculation process S7 is performed next. The score calculation process S7 is a process for calculating a score Sc (x, y), which is an evaluation value of the severity of a lesion, based on the pixel value of the determination image data J. The score calculation process S7 is sequentially performed for all the pixels (x, y) constituting the image data. Note that the score calculation algorithm described below is an example, and the present invention can be applied to the screen display of scores calculated by various algorithms.
[スコア計算の原理]
ここで、本実施形態のスコア計算の原理について簡単に説明する。炎症部は、血管の拡張及び血漿成分の血管外への漏出等を伴い、症状が進行するほど、表面の正常粘膜が脱落するため、血液の色に近付くことが知られている。そのため、炎症部の色と血液の色との相関の程度(後述する相関値CV)が、炎症部の重症度を示す良い指標となる。本実施形態では、各画素(x,y)の判定用画像データJ{H(x,y),S(x,y)}と血液の色(色相、彩度)との相関値CV(x,y)を計算して、これを炎症部の重症度を示すスコアSc(x,y)として使用する。 [Score calculation principle]
Here, the principle of the score calculation of this embodiment will be briefly described. It is known that the inflamed part comes close to the color of blood because the normal mucous membrane on the surface falls off as the symptom progresses with dilation of blood vessels and leakage of plasma components to the outside of the blood vessels. Therefore, the degree of correlation between the color of the inflamed part and the color of blood (correlation value CV described later) is a good index indicating the severity of the inflamed part. In the present embodiment, the correlation value CV (x) between the image data for determination J {H (x, y), S (x, y)} of each pixel (x, y) and the color of the blood (hue, saturation). , Y) is calculated and used as a score Sc (x, y) indicating the severity of the inflamed area.
[病変部の判定:S71]
図9は、スコア計算処理S7の手順を示すフローチャートである。スコア計算処理S7では、まずフラグテーブルFTが読み出され、画素(x,y)に対応するフラグF(x,y)の値が「2」(炎症)であるか否かが判断される(S71)。 [Decision of lesioned part: S71]
FIG. 9 is a flowchart showing the procedure of the score calculation process S7. In the score calculation process S7, first, the flag table FT is read, and it is determined whether or not the value of the flag F (x, y) corresponding to the pixel (x, y) is “2” (inflammation) ( S71).
フラグF(x,y)の値が「2」(炎症)である場合、すなわち画素(x,y)が病変画素である場合は(S71:Yes)、処理はS72へ進む。また、画素(x,y)が病変画素でない場合は(S71:No)、処理はS79へ進む。
If the value of the flag F (x, y) is “2” (inflammation), that is, if the pixel (x, y) is a lesion pixel (S71: Yes), the process proceeds to S72. If the pixel (x, y) is not a lesion pixel (S71: No), the process proceeds to S79.
[彩度の補正:S72]
血液や血液を含有する生体組織の画像の彩度は、輝度に依存することが知られている。具体的には、輝度と彩度は負の相関を有し、明るいほど彩度が低下する。S72では、本発明者が開発した以下の補正式(数式6)を使用して、判定用画像データJ(x,y)の輝度I(x,y)による彩度S(x,y)の変動が補正される。この補正により、スコア計算の精度を高めることができる。 [Saturation correction: S72]
It is known that the saturation of an image of blood or a biological tissue containing blood depends on luminance. Specifically, luminance and saturation have a negative correlation, and the saturation decreases as the brightness increases. In S72, the saturation S (x, y) based on the luminance I (x, y) of the image data for determination J (x, y) is calculated using the following correction formula (Formula 6) developed by the present inventor. Variations are corrected. This correction can improve the accuracy of score calculation.

Icorr.(x,y):判定用画像データJの補正後の輝度
Scorr.(x,y):判定用画像データJの補正後の彩度
Iref:基準値となる血液サンプルデータの輝度
Sref:基準値となる血液サンプルデータの彩度
θ:血液サンプルデータの輝度値と彩度値との相関係数(cosθ)を与える角度
なお、血液サンプルの彩度と輝度の相関係数(実測値)は-0.86であり、θ=149.32(deg)を使用した。
I corr. (X, y): luminance after correction of judgment image data J S corr. (X, y): saturation after correction of judgment image data J I ref : blood sample data as a reference value Luminance S ref : Saturation of blood sample data as reference value θ: Angle giving correlation coefficient (cosθ) between luminance value and saturation value of blood sample data Note that correlation coefficient between saturation and luminance of blood sample The (actual measurement value) was −0.86, and θ = 149.32 (deg) was used.
[色相距離DHUEの計算:S73]
次に、数式7により、色相距離DHUE(x,y)が計算される(S73)。色相距離DHUEは、血液サンプルデータの色相Hrefを基準とする、判定用画像データJ(x,y)の色相の相対値である。 [Calculation of Hue Distance D HUE : S73]
Next, the hue distance D HUE (x, y) is calculated by Equation 7 (S73). The hue distance D HUE is a relative value of the hue of the determination image data J (x, y) with the hue H ref of the blood sample data as a reference.

[色相相関値HCVの決定:S74]
次に、色相距離DHUE(x,y)から色相相関値HCV(x,y)が決定される(S74)。色相相関値HCV(x,y)は、炎症部の重症度と強い相関を有するパラメーターである。図10(a)は、色相距離DHUEと色相相関値HCVとの関係を図示したグラフである。色相距離DHUEは、±30°以内の範囲(以下「色相近似範囲R11」という。)において、炎症部の重症度と強い相関を有し、それ以外の範囲(以下「色相近似外範囲R12」という。)においては殆ど相関を有しない。そのため、本実施形態の色相相関値HCV(x,y)は、色相近似外範囲R12においては最小値の0.0に設定され、色相近似範囲R11においては色相距離DHUE(x,y)が0°に近づくほど線形的に増加するように設定されている。また、色相相関値HCV(x,y)は、最小値が0.0、最大値が1.0となるように規格化されている。 [Determination of Hue Correlation Value HCV: S74]
Next, the hue correlation value HCV (x, y) is determined from the hue distance D HUE (x, y) (S74). The hue correlation value HCV (x, y) is a parameter having a strong correlation with the severity of the inflamed area. FIG. 10A is a graph illustrating the relationship between the hue distance D HUE and the hue correlation value HCV. The hue distance D HUE has a strong correlation with the severity of the inflamed area in a range within ± 30 ° (hereinafter referred to as “hue approximate range R 11 ”), and other ranges (hereinafter referred to as “hue approximate outside range R”). 12 ")) has little correlation. Therefore, the hue correlation value HCV (x, y) of the present embodiment is set to 0.0, which is the minimum value in the hue approximation outside range R 12 , and the hue distance D HUE (x, y) in the hue approximation range R 11 . ) Is set to increase linearly as it approaches 0 °. The hue correlation value HCV (x, y) is standardized so that the minimum value is 0.0 and the maximum value is 1.0.
図10(a)に示す色相距離DHUEと色相相関値HCVとの関係は、色相相関値テーブルHCTとしてメモリ229に格納されている。色相相関値テーブルHCTを参照することにより、色相距離DHUE(x,y)に対応する色相相関値HCV(x,y)が取得される。
The relationship between the hue distance D HUE and the hue correlation value HCV shown in FIG. 10A is stored in the memory 229 as the hue correlation value table HCT. By referring to the hue correlation value table HCT, the hue correlation value HCV (x, y) corresponding to the hue distance D HUE (x, y) is acquired.
[彩度距離DSATの計算:S75]
次に、数式8により、彩度距離DSAT(x,y)が計算される(S75)。彩度距離DSAT(x,y)は、血液サンプルデータの彩度Srefを基準とする、判定用画像データJ(x,y)の彩度の相対値である。 [Saturation Distance D SAT Calculation: S75]
Next, the saturation distance D SAT (x, y) is calculated by Equation 8 (S75). The saturation distance D SAT (x, y) is a relative value of the saturation of the determination image data J (x, y) with reference to the saturation S ref of the blood sample data.

[彩度相関値SCVの決定:S76]
次に、彩度距離DSAT(x,y)から彩度相関値SCV(x,y)が決定される(S76)。彩度相関値SCV(x,y)も、炎症部の重症度と強い相関を有するパラメーターである。図10(b)は、彩度距離DSATと彩度相関値SCVとの関係を図示したグラフである。彩度距離DSATは、所定値以上の負の範囲(以下、「彩度近似範囲R22」という。)において、炎症部の重症度と強い相関を有し、負の所定値以下の範囲(以下「彩度近似外範囲R23」という。)においては殆ど相関を有しない。また、彩度距離DSATがゼロ以上の範囲、すなわち、病変画素の彩度が血液サンプルデータの彩度Sref以上となる範囲(以下「彩度一致範囲R21」という。)においては、重症度が極めて高いと考えられる。そのため、本実施形態の彩度相関値SCV(x,y)は、彩度一致範囲R21において最大値の1.0に設定され、彩度近似外範囲R23において最小値の0.0に設定され、彩度近似範囲R22において線形的に増加するように設定されている。また、彩度相関値SCV(x,y)も、最小値が0.0、最大値が1.0となるように規格化された値である。 [Determination of Saturation Correlation Value SCV: S76]
Next, the saturation correlation value SCV (x, y) is determined from the saturation distance D SAT (x, y) (S76). The saturation correlation value SCV (x, y) is also a parameter having a strong correlation with the severity of the inflamed area. FIG. 10B is a graph illustrating the relationship between the saturation distance DSAT and the saturation correlation value SCV. The saturation distance D SAT has a strong correlation with the severity of the inflamed area in a negative range (hereinafter referred to as “saturation approximate range R 22 ”) that is equal to or greater than a predetermined value, and a range that is less than or equal to a negative predetermined value ( (Hereinafter referred to as “saturation approximation outside range R 23 ”) has little correlation. Further, in a range where the saturation distance D SAT is zero or more, that is, a range where the saturation of the lesion pixel is not less than the saturation S ref of the blood sample data (hereinafter referred to as “saturation matching range R 21 ”), it is severe. The degree is considered extremely high. Therefore, the saturation correlation value SCV of the present embodiment (x, y) is set to 1.0 of the maximum value in the saturation range match R 21, to 0.0 of the minimum value in the saturation approximation out of range R 23 is set, it is set to increase linearly in saturation approximation range R 22. The saturation correlation value SCV (x, y) is also a value that is standardized so that the minimum value is 0.0 and the maximum value is 1.0.
図10(b)に示す彩度距離DSATと彩度相関値SCVとの関係は、彩度相関値テーブルSCTとしてメモリ229に格納されている。彩度相関値テーブルSCTを参照することにより、彩度距離DSAT(x,y)に対応する彩度相関値SCV(x,y)が取得される。
The relationship between the saturation distance DSAT and the saturation correlation value SCV shown in FIG. 10B is stored in the memory 229 as the saturation correlation value table SCT. By referring to the saturation correlation value table SCT, the saturation correlation value SCV (x, y) corresponding to the saturation distance D SAT (x, y) is acquired.
[相関値CVの計算:S77]
次に、色相相関値HCV(x,y)と彩度相関値SCV(x,y)との乗算により、病変画素(x,y)の色と血液の色との相関値CV(x,y)を得る。なお、相関値CV(x,y)も、最小値が0.0、最大値が1.0となるように規格化された値となる。また、相関値CV(x,y)は、0.1ポイント刻みで11段階に区分される。 [Calculation of correlation value CV: S77]
Next, a correlation value CV (x, y) between the color of the lesion pixel (x, y) and the blood color is obtained by multiplying the hue correlation value HCV (x, y) and the saturation correlation value SCV (x, y). ) The correlation value CV (x, y) is also a standardized value so that the minimum value is 0.0 and the maximum value is 1.0. Further, the correlation value CV (x, y) is divided into 11 stages in increments of 0.1 points.
[スコアSc更新:S78]
また、相関値CV(x,y)は炎症の重症度の良い指標となるため、スコアテーブルSTのスコアSc(x,y)の値が相関値CV(x,y)によって書き換えられる(S78)。 [Score Sc Update: S78]
In addition, since the correlation value CV (x, y) is an indicator of good severity of inflammation, the value of the score Sc (x, y) in the score table ST is rewritten with the correlation value CV (x, y) (S78). .
[スコアSc更新:S79]
また、画素(x,y)が病変画素でない場合は(S71:No)、上述した相関値CV(x,y)の計算を行わずに、スコアテーブルSTのスコアSc(x,y)の値が「0」に書き換えられる(S79)。これにより、少ない計算量で全ての画素(x,y)に対してスコアSc(x,y)を与えることができる。 [Score Sc Update: S79]
If the pixel (x, y) is not a lesion pixel (S71: No), the value of the score Sc (x, y) in the score table ST is not calculated without calculating the correlation value CV (x, y) described above. Is rewritten to "0" (S79). Thereby, the score Sc (x, y) can be given to all the pixels (x, y) with a small calculation amount.
処理S80では、全ての画素(x,y)について処理が完了したかどうかが判定される。全ての画素(x,y)の処理が完了するまで、上記の処理S71~S80が繰り返される。
In process S80, it is determined whether or not the process has been completed for all pixels (x, y). The above processes S71 to S80 are repeated until the processing of all the pixels (x, y) is completed.
[マーキング処理:S8]
スコア計算処理S7が完了すると、次にマーキング処理部226によりマーキング処理S8が行われる。マーキング処理S8は、病変部を容易に識別できるように、通常観察画像NPに対して病変画素が分布する画像領域に印を付す処理である。具体的には、本実施形態のマーキング処理8では、病変画素が分布する画像領域に、その画像領域における重症度に応じた大きさの記号(例えば、図16における「×」印330)が付される。 [Marking process: S8]
When the score calculation process S7 is completed, the markingprocess unit 226 performs a marking process S8. The marking process S8 is a process for marking an image area in which lesion pixels are distributed with respect to the normal observation image NP so that the lesion part can be easily identified. Specifically, in the marking process 8 of the present embodiment, a symbol having a size corresponding to the severity in the image region (for example, “x” mark 330 in FIG. 16) is attached to the image region in which the lesion pixel is distributed. Is done.
スコア計算処理S7が完了すると、次にマーキング処理部226によりマーキング処理S8が行われる。マーキング処理S8は、病変部を容易に識別できるように、通常観察画像NPに対して病変画素が分布する画像領域に印を付す処理である。具体的には、本実施形態のマーキング処理8では、病変画素が分布する画像領域に、その画像領域における重症度に応じた大きさの記号(例えば、図16における「×」印330)が付される。 [Marking process: S8]
When the score calculation process S7 is completed, the marking
図11は、マーキング処理S8の進め方(マスク310の走査)を説明する図である。本実施形態のマーキング処理S8は、通常観察画像NP(及びスコアテーブルST)内に、所定サイズの画像領域であるマスク310を設定し、マスク310を順次移動させながら、マスク310内の画素311(図12)のスコアScに応じてマスク310内の画像に印330を付すものである。
FIG. 11 is a diagram for explaining how to proceed with the marking process S8 (scanning of the mask 310). In the marking process S8 of the present embodiment, a mask 310 that is an image region of a predetermined size is set in the normal observation image NP (and the score table ST), and the pixels 311 ( The mark 330 is added to the image in the mask 310 according to the score Sc in FIG.
[マスクの構成]
本実施形態では、マスク310の大きさ(及び、マスクの大きさによって決まる印330の大きさ)が、マスク310内の画素311のスコアScに応じて変動する。図12は、予め設定された初期サイズのマスク310を示したものである。本実施形態では、マスク310の初期サイズは、5×5(水平方向の画素数×垂直方向の画素数)に設定されている。マスク310の初期サイズは、例えば、マスク310内の画像に付される印330の視認性(例えば、印330の形状の複雑さやモニタ910の表示画面の画素数等に依存する)に応じて設定される。具体的には、マスク310の初期サイズは、印330の良好な視認性が確保される範囲内で、できるだけ多くの印330を表示できるように、最小の大きさに設定される。 [Mask configuration]
In the present embodiment, the size of the mask 310 (and the size of themark 330 determined by the size of the mask) varies according to the score Sc of the pixel 311 in the mask 310. FIG. 12 shows a mask 310 having an initial size set in advance. In this embodiment, the initial size of the mask 310 is set to 5 × 5 (the number of pixels in the horizontal direction × the number of pixels in the vertical direction). The initial size of the mask 310 is set according to, for example, the visibility of the mark 330 attached to the image in the mask 310 (for example, depending on the complexity of the shape of the mark 330 and the number of pixels on the display screen of the monitor 910). Is done. Specifically, the initial size of the mask 310 is set to a minimum size so that as many marks 330 as possible can be displayed within a range in which good visibility of the marks 330 is ensured.
本実施形態では、マスク310の大きさ(及び、マスクの大きさによって決まる印330の大きさ)が、マスク310内の画素311のスコアScに応じて変動する。図12は、予め設定された初期サイズのマスク310を示したものである。本実施形態では、マスク310の初期サイズは、5×5(水平方向の画素数×垂直方向の画素数)に設定されている。マスク310の初期サイズは、例えば、マスク310内の画像に付される印330の視認性(例えば、印330の形状の複雑さやモニタ910の表示画面の画素数等に依存する)に応じて設定される。具体的には、マスク310の初期サイズは、印330の良好な視認性が確保される範囲内で、できるだけ多くの印330を表示できるように、最小の大きさに設定される。 [Mask configuration]
In the present embodiment, the size of the mask 310 (and the size of the
マスクサイズは、メモリ229に格納されたマスクテーブルMTを参照して、スコアScに基づいて決定される。表1は、本実施形態で使用されるマスクテーブルMTの一例である。本実施形態では、マスクサイズは、初期値(5×5)を下限とし、スコアScに比例して大きくなるように設定される。
The mask size is determined based on the score Sc with reference to the mask table MT stored in the memory 229. Table 1 is an example of a mask table MT used in the present embodiment. In the present embodiment, the mask size is set so as to increase in proportion to the score Sc, with the initial value (5 × 5) as the lower limit.

図12に示されるように、マスク310を構成する複数の画素311のうち、左上端のもの(すなわち、x座標及びy座標が共に最小の画素)を基準点312と呼ぶ。この基準点312の位置(xm,ym)がマスク310の位置として定義される。なお、マスク310内のいずれの画素を基準点312に設定してもよい。
As shown in FIG. 12, among the plurality of pixels 311 constituting the mask 310, the one at the upper left end (that is, the pixel having the smallest x coordinate and y coordinate) is referred to as a reference point 312. The position (x m , y m ) of this reference point 312 is defined as the position of the mask 310. Note that any pixel in the mask 310 may be set as the reference point 312.
[基準点の走査:S81]
図13は、マーキング処理S8の手順を示すフローチャートである。マーキング処理S8では、まず画像メモリ227の記憶領域Pnに記憶された通常観察画像データN(原画像)が複製され、マーキング画像データMの初期値として記憶領域Pmに記憶される。また、メモリ229からスコアテーブルSTが読み出され、スコアテーブルST上で基準点312の走査が行われる(S81)。本実施形態では、基準点312は、スコアテーブルSTの上端のライン(y=0)から下端のライン(y=ymax)へ、ライン毎に順次走査される(図11)。また、基準点312は、各ラインにおいて、左端(x=0)から右端(x=xmax)へ走査される。 [Reference Point Scan: S81]
FIG. 13 is a flowchart showing the procedure of the marking process S8. In the marking process S8, first, the normal observation image data N (original image) stored in the storage area P n of theimage memory 227 is duplicated and stored as an initial value of the marking image data M in the storage area P m . Further, the score table ST is read from the memory 229, and the reference point 312 is scanned on the score table ST (S81). In the present embodiment, the reference point 312 is sequentially scanned line by line from the top line (y = 0) to the bottom line (y = y max ) of the score table ST (FIG. 11). The reference point 312 is scanned from the left end (x = 0) to the right end (x = x max ) in each line.
図13は、マーキング処理S8の手順を示すフローチャートである。マーキング処理S8では、まず画像メモリ227の記憶領域Pnに記憶された通常観察画像データN(原画像)が複製され、マーキング画像データMの初期値として記憶領域Pmに記憶される。また、メモリ229からスコアテーブルSTが読み出され、スコアテーブルST上で基準点312の走査が行われる(S81)。本実施形態では、基準点312は、スコアテーブルSTの上端のライン(y=0)から下端のライン(y=ymax)へ、ライン毎に順次走査される(図11)。また、基準点312は、各ラインにおいて、左端(x=0)から右端(x=xmax)へ走査される。 [Reference Point Scan: S81]
FIG. 13 is a flowchart showing the procedure of the marking process S8. In the marking process S8, first, the normal observation image data N (original image) stored in the storage area P n of the
マーキング処理部226は、スコアテーブルST上で基準点312を走査させながら、以下の条件a及び条件bの両方を満たす位置(x,y)を探索する。
・条件a:病変画素[スコアSc(x,y)が0.1以上]であること
・条件b:マスク310が、既に付された印330(より正確には、印330を付したときのマスク310)と重ならないこと The markingprocessing unit 226 searches for a position (x, y) that satisfies both of the following conditions a and b while scanning the reference point 312 on the score table ST.
Condition a: lesion pixel [score Sc (x, y) is 0.1 or more] Condition b:mark 310 already attached to mask 310 (more precisely, when mark 330 is attached) Do not overlap with mask 310)
・条件a:病変画素[スコアSc(x,y)が0.1以上]であること
・条件b:マスク310が、既に付された印330(より正確には、印330を付したときのマスク310)と重ならないこと The marking
Condition a: lesion pixel [score Sc (x, y) is 0.1 or more] Condition b:
[マスク設定:S82]
上記の条件a及び条件bの両方を満たす位置(x,y)に到達すると、その位置で初期サイズ(5×5)のマスクが設定される(S82)。 [Mask setting: S82]
When the position (x, y) that satisfies both the conditions a and b is reached, an initial size (5 × 5) mask is set at that position (S82).
上記の条件a及び条件bの両方を満たす位置(x,y)に到達すると、その位置で初期サイズ(5×5)のマスクが設定される(S82)。 [Mask setting: S82]
When the position (x, y) that satisfies both the conditions a and b is reached, an initial size (5 × 5) mask is set at that position (S82).
[マスク内平均スコア計算:S83]
次に、マスク内の画素のスコアSc(x,y)の相加平均である平均スコアScAvg.を計算する(S83)。なお、平均スコアScAvg.も、最小値が0.0、最大値が1.0となるように規格化された値となる。また、平均スコアScAvg.は、マスク内のスコアSc(x,y)を代表する他の数値(例えば、加重平均、中央値、最頻値、二乗平均平方根等)により代替することもできる。 [In-mask average score calculation: S83]
Next, an average score Sc Avg. Which is an arithmetic average of the scores Sc (x, y) of the pixels in the mask . Is calculated (S83). In addition, average score Sc Avg. Also, the value is normalized so that the minimum value is 0.0 and the maximum value is 1.0. In addition, the average score Sc Avg. Can be replaced by other numerical values (for example, weighted average, median, mode, root mean square, etc.) representing the score Sc (x, y) in the mask.
[マスクサイズ更新S84]
次に、メモリ229に格納されたマスクテーブルMTを参照して、平均スコアScAvg.に対応するマスクサイズを読み取る。そして、読み取ったマスクサイズにマスク310のサイズを更新(マスク310を再設定)する(S84)。 [Mask Size Update S84]
Next, referring to the mask table MT stored in thememory 229, the average score Sc Avg. Read the mask size corresponding to. Then, the size of the mask 310 is updated to the read mask size (the mask 310 is reset) (S84).
次に、メモリ229に格納されたマスクテーブルMTを参照して、平均スコアScAvg.に対応するマスクサイズを読み取る。そして、読み取ったマスクサイズにマスク310のサイズを更新(マスク310を再設定)する(S84)。 [Mask Size Update S84]
Next, referring to the mask table MT stored in the
[マーキングS85]
次に、マーキング画像データMに対して、再設定後のマスク310の縁に内接するように、印330が付される(S85)。 [Marking S85]
Next, amark 330 is applied to the marking image data M so as to be inscribed in the edge of the reset mask 310 (S85).
次に、マーキング画像データMに対して、再設定後のマスク310の縁に内接するように、印330が付される(S85)。 [Marking S85]
Next, a
処理S86では、スコアテーブルSTの最後まで走査が完了したかどうかが判定される。全てのスコアSc(x,y)が走査されるまで、上記の処理S81~S86が繰り返される。
In process S86, it is determined whether or not scanning has been completed to the end of the score table ST. The above processes S81 to S86 are repeated until all the scores Sc (x, y) are scanned.
[マーキング処理の具体例:図14~20]
次に、図14~20を参照して、マーキング処理S8の具体例を説明する。図14~20の通常観察画像データN(スコアテーブルST)には、複数の病変画素321からなる病変部の画像320が含まれている。 [Specific examples of marking processing: FIGS. 14 to 20]
Next, a specific example of the marking process S8 will be described with reference to FIGS. The normal observation image data N (score table ST) in FIGS. 14 to 20 includes animage 320 of a lesion site composed of a plurality of lesion pixels 321.
次に、図14~20を参照して、マーキング処理S8の具体例を説明する。図14~20の通常観察画像データN(スコアテーブルST)には、複数の病変画素321からなる病変部の画像320が含まれている。 [Specific examples of marking processing: FIGS. 14 to 20]
Next, a specific example of the marking process S8 will be described with reference to FIGS. The normal observation image data N (score table ST) in FIGS. 14 to 20 includes an
図14に示されるように、スコアテーブルST上でマスク310の基準点312を左上からライン毎に順次走査させると(S81)、最初に病変画素321aが検出される。
As shown in FIG. 14, when the reference point 312 of the mask 310 is sequentially scanned line by line from the upper left on the score table ST (S81), the lesion pixel 321a is first detected.
病変画素321aにおいて、上記の条件a及び条件bの両方が満たされるため、病変画素321aを基準点として初期サイズ(5×5)のマスク310a(図15の破線枠)が設定される(S82)。
Since both the above condition a and condition b are satisfied in the lesion pixel 321a, the initial size (5 × 5) mask 310a (broken line frame in FIG. 15) is set with the lesion pixel 321a as a reference point (S82). .
次に、マスク310a内のスコアSc(x,y)の平均値(平均スコアScAvg.)が計算される(S83)。
Next, an average value (average score ScAvg. ) Of the scores Sc (x, y) in the mask 310a is calculated (S83).
平均スコアScAvg.の計算結果が例えば0.3であれば、マスクテーブルMT(表1)から、この平均スコアScAvg.の値に対応するマスクサイズ7×7が取得され、マスク310aの大きさが7×7(図15の実線枠)に変更される(S84)。
Average score Sc Avg. Is 0.3, for example, from the mask table MT (Table 1), the average score Sc Avg. The mask size 7 × 7 corresponding to the value of is obtained, and the size of the mask 310a is changed to 7 × 7 (solid line frame in FIG. 15) (S84).
そして、マーキング画像MPに対して、マスク310aの縁に内接するように、「×」印330aが付される(S85)。なお、本実施形態では印330として「×」が使用されるが、印330には任意の印(文字、数字、記号、絵文字、模様などを含む。但し、マスク310の全体を塞ぐものを除く。)を使用することができる。
Then, a “x” mark 330a is attached to the marking image MP so as to be inscribed in the edge of the mask 310a (S85). In this embodiment, “x” is used as the mark 330, but the mark 330 includes any mark (letters, numbers, symbols, pictograms, patterns, etc., except for those that block the entire mask 310. .) Can be used.
次に、再び、基準点312が走査される(図16)。以前に設定したマスク310a内は、上記の条件bを満たさないため、走査がスキップされる。病変画素321aのラインには、上記の条件a及び条件bの両方を満たす病変画素321が存在しないため、走査は一つ下のラインに移り、病変画素321bが検出される。しかし、病変画素321bを起点にマスク310を設定すると、以前に設定したマスク310aと干渉してしまう。そのため、病変画素321bではマスク310を設定せずに、走査を続行する。そして、以前に設定したマスク310aをスキップした直後に病変画素321cが検出される。
Next, the reference point 312 is scanned again (FIG. 16). In the previously set mask 310a, the above condition b is not satisfied, and thus scanning is skipped. Since there is no lesion pixel 321 that satisfies both the conditions a and b in the line of the lesion pixel 321a, the scan moves to the next lower line, and the lesion pixel 321b is detected. However, when the mask 310 is set starting from the lesion pixel 321b, it interferes with the previously set mask 310a. Therefore, scanning is continued without setting the mask 310 in the lesion pixel 321b. The lesion pixel 321c is detected immediately after skipping the previously set mask 310a.
病変画素321cにおいては、上記の条件a及び条件bの両方が満たされるため、病変画素321cを起点に初期サイズ(5×5)のマスク310c(図17)が設定される。マスク310c内の平均スコアScAvg.が、例えば0.1であれば、対応するマスクサイズは初期サイズ(5×5)と変わらないため、マスクサイズは更新されず、マスク310cの縁に内接するように「×」印330cが付される。
In the lesion pixel 321c, since both the condition a and the condition b are satisfied, an initial size (5 × 5) mask 310c (FIG. 17) is set starting from the lesion pixel 321c. Average score Sc Avg. However, if it is 0.1, for example, the corresponding mask size is not changed from the initial size (5 × 5), so the mask size is not updated, and an “x” mark 330c is attached so as to be inscribed in the edge of the mask 310c. Is done.
以降、同様に処理S81~S86が繰り返され、病変画素321dを起点に設定されたマスク310dに「×」印330dが付され(図18)、更に病変画素321eを起点に設定されたマスク310eに「×」印330eが付された後(図19)、通常観察画像データN(スコアテーブルST)の走査が完了する。その結果、通常観察画像データN上に、病変部の画像320の位置や、その重症度の分布を示す印330a、330c、330d、330eが付されたマーキング画像MPが得られる(図20)。生成されたマーキング画像データMは、画像メモリ227の記憶領域Pmに記憶される。
Thereafter, the processes S81 to S86 are repeated in the same manner, and the “x” mark 330d is added to the mask 310d set with the lesion pixel 321d as the starting point (FIG. 18), and further, the mask 310e set with the lesion pixel 321e as the starting point. After the “x” mark 330e is attached (FIG. 19), the scanning of the normal observation image data N (score table ST) is completed. As a result, a marking image MP with marks 330a, 330c, 330d, and 330e indicating the position of the lesion image 320 and the distribution of the severity is obtained on the normal observation image data N (FIG. 20). Marking image data M which has been produced is stored in the storage area P m of the image memory 227.
[表示画面生成処理~出力処理:S9~S10]
マーキング処理S8が完了すると、次に表示画面生成処理S9が行われる。表示画面生成処理S9は、画像メモリ227に記憶された各種画像データを使用して、モニタ900に表示するための表示画面データを生成する処理であり、画像処理回路220の表示画面生成部228によって行われる。表示画面生成部228は、システムコントローラ202の制御に応じて、複数種類の表示画面データを生成することができる。生成された表示画面データは、出力回路220bにより、ガンマ補正等の処理が行われた後、所定のビデオ・フォーマットのビデオ信号に変換され、モニタ900に出力される(出力処理S10)。 [Display screen generation processing to output processing: S9 to S10]
When the marking process S8 is completed, a display screen generation process S9 is performed next. The display screen generation process S9 is a process for generating display screen data to be displayed on themonitor 900 using various image data stored in the image memory 227. The display screen generation process S9 is performed by the display screen generation unit 228 of the image processing circuit 220. Done. The display screen generation unit 228 can generate a plurality of types of display screen data under the control of the system controller 202. The generated display screen data is subjected to processing such as gamma correction by the output circuit 220b, converted to a video signal of a predetermined video format, and output to the monitor 900 (output processing S10).
マーキング処理S8が完了すると、次に表示画面生成処理S9が行われる。表示画面生成処理S9は、画像メモリ227に記憶された各種画像データを使用して、モニタ900に表示するための表示画面データを生成する処理であり、画像処理回路220の表示画面生成部228によって行われる。表示画面生成部228は、システムコントローラ202の制御に応じて、複数種類の表示画面データを生成することができる。生成された表示画面データは、出力回路220bにより、ガンマ補正等の処理が行われた後、所定のビデオ・フォーマットのビデオ信号に変換され、モニタ900に出力される(出力処理S10)。 [Display screen generation processing to output processing: S9 to S10]
When the marking process S8 is completed, a display screen generation process S9 is performed next. The display screen generation process S9 is a process for generating display screen data to be displayed on the
図21は、表示画面生成処理S9によって生成される表示画面の一例であり、画像解析モードでの内視鏡観察中に表示される解析モード観察画面340である。解析モード観察画面340は、撮影日時が表示される日時表示領域341と、検査に関連する基本的な情報(例えば、カルテ番号、患者名、術者名)を表示する基本情報表示領域342と、通常観察画像NP(又はトーン強調画像EP)を表示する通常画像表示領域344と、マーキング画像MP(マーキング処理S8後の観察画像)を表示する解析画像表示領域345を備えている。
FIG. 21 is an example of a display screen generated by the display screen generation processing S9, and is an analysis mode observation screen 340 displayed during endoscopic observation in the image analysis mode. The analysis mode observation screen 340 includes a date / time display area 341 for displaying the imaging date / time, a basic information display area 342 for displaying basic information related to the examination (for example, medical chart number, patient name, surgeon name), A normal image display area 344 for displaying the normal observation image NP (or tone-enhanced image EP) and an analysis image display area 345 for displaying the marking image MP (observation image after the marking process S8) are provided.
表示画面生成処理S9において、表示画面生成部228は、画像メモリ227の記憶領域群Pnから通常観察画像データN(又は、記憶領域群Peからトーン強調画像データE)を読み出し、通常画像表示領域344に通常観察画像NP(又は、トーン強調画像EP)を表示する。また、画像メモリ227の記憶領域群Pmからマーキング画像データMを読み出し、解析画像表示領域345にマーキング画像MPを表示する。また、日時表示領域341及び基本情報表示領域342には、システムコントローラ202から提供された情報が表示される。
In the display screen generating process S9, the display screen generating unit 228, a normal observation image data N from the storage area group P n of the image memory 227 (or, tone emphasized image data E from the memory area group P e) reads the normal image display In the region 344, the normal observation image NP (or tone emphasis image EP) is displayed. Also, the marking image data M is read from the storage area group P m of the image memory 227 and the marking image MP is displayed in the analysis image display area 345. Information provided from the system controller 202 is displayed in the date display area 341 and the basic information display area 342.
術者は、解析モード観察画面340を見ながら内視鏡観察を行う。具体的には、解析画像表示領域345に表示されるマーキング画像MPを参照しつつ、通常画像表示領域344に表示される通常観察画像NP(又はトーン強調画像EP)を見ながら内視鏡観察を行う。マーキング画像MPにおいてマーキングされた部位について特に慎重に観察を行うことで、病変部を見落とすことなく、正確な診察を行うことができる。
The surgeon observes the endoscope while looking at the analysis mode observation screen 340. Specifically, endoscopic observation is performed while viewing the normal observation image NP (or tone-enhanced image EP) displayed in the normal image display area 344 while referring to the marking image MP displayed in the analysis image display area 345. Do. By observing the marked part in the marking image MP with particular care, an accurate diagnosis can be performed without overlooking the lesion.
また、本実施形態では、マーキング画像MPに、背景の通常観察画像NPが透ける印330が付されるため、マーキング画像MPのみを見ながら内視鏡観察及び診断を行うことができる。そのため、例えば、通常画像表示領域344を含まず、大きな解析画像表示領域345を含む解析モード観察画面340を生成する構成としてもよい。
Further, in the present embodiment, since the marking image MP is provided with a mark 330 through which the background normal observation image NP is transparent, endoscopic observation and diagnosis can be performed while viewing only the marking image MP. Therefore, for example, the analysis mode observation screen 340 including the large analysis image display area 345 without including the normal image display area 344 may be generated.
表示画面生成処理S9及び出力処理S10が完了すると、次に、内視鏡観察を継続するか否かが判断される(S11)。プロセッサ200の操作パネル214に対して、内視鏡観察終了又は電子内視鏡装置1の運転停止を指示するユーザ操作が行われる(S11:No)まで、上記の処理S1~S11が繰り返される。
When the display screen generation process S9 and the output process S10 are completed, it is next determined whether or not to continue endoscopic observation (S11). The above processes S1 to S11 are repeated until a user operation for instructing the operation panel 214 of the processor 200 to end the observation of the endoscope or stop the operation of the electronic endoscope apparatus 1 is performed (S11: No).
以上が本発明の第1実施形態の説明である。上述した本発明の第1実施形態の構成によれば、マーキング画像MPにおいて、病変部の位置及び重症度を示す印330が病変部の画像320上に付されるため、内視鏡観察の経験が浅い術者であっても、病変部を見落とすことや、重症度を見誤ることなく、内視鏡画像による正確な診断を容易に行うことができる。また、マーキング画像MPには、背景(病変部の画像320)を完全に覆わずに、背景の一部を隙間から透過させる(すなわち、透過性を有する)印330が付される。これにより、マーキング画像MPからも病変部の形状やテクスチャを把握することができるため、より効率的且つより正確な診断を行うことが可能になる。
The above is the description of the first embodiment of the present invention. According to the configuration of the first embodiment of the present invention described above, in the marking image MP, the mark 330 indicating the position and severity of the lesion is attached on the image 320 of the lesion. Even a shallow surgeon can easily perform an accurate diagnosis based on an endoscopic image without overlooking a lesion or misunderstanding the severity. In addition, the marking image MP is provided with a mark 330 that does not completely cover the background (lesion site image 320) and allows a part of the background to pass through the gap (that is, has transparency). Thereby, since the shape and texture of a lesion part can be grasped also from marking image MP, it becomes possible to perform more efficient and more accurate diagnosis.
なお、上述の第1実施形態では、通常観察画像NPに印330を付すことによってマーキング画像MPが生成されるが、トーン強調画像EPその他の通常観察画像NPを加工した画像に印330を付すことによってマーキング画像MPを生成する構成としてもよい。
In the first embodiment described above, the marking image MP is generated by attaching the mark 330 to the normal observation image NP. However, the mark 330 is attached to the tone-enhanced image EP and other images obtained by processing the normal observation image NP. It is good also as a structure which produces | generates marking image MP by.
<第1実施形態の第1変形例>
次に、上記に説明した本発明の第1実施形態の幾つかの変形例を説明する。
図22は、本発明の第1実施形態の第1変形例のマーキング画像MPである。上述した第1実施形態では、マスクサイズ更新処理S84において、マスク310内の平均スコアScAvg.に応じてマスクサイズを変更し、印330の大きさによって重症度を表現する構成が採用された。一方、第1変形例では、マスクサイズではなく、マスク310内に付す印330の数が、マスク310内の平均スコアScAvg.に応じて設定される。本変形例では、印330の密度によって重症度が表現される。 <First Modification of First Embodiment>
Next, several modifications of the first embodiment of the present invention described above will be described.
FIG. 22 is a marking image MP of a first modification of the first embodiment of the present invention. In the first embodiment described above, in the mask size update process S84, the average score Sc Avg. A configuration is adopted in which the mask size is changed according to the condition, and the severity is expressed by the size of themark 330. On the other hand, in the first modified example, not the mask size but the number of marks 330 attached in the mask 310 is the average score Sc Avg. Is set according to In this modification, the severity is expressed by the density of the mark 330.
次に、上記に説明した本発明の第1実施形態の幾つかの変形例を説明する。
図22は、本発明の第1実施形態の第1変形例のマーキング画像MPである。上述した第1実施形態では、マスクサイズ更新処理S84において、マスク310内の平均スコアScAvg.に応じてマスクサイズを変更し、印330の大きさによって重症度を表現する構成が採用された。一方、第1変形例では、マスクサイズではなく、マスク310内に付す印330の数が、マスク310内の平均スコアScAvg.に応じて設定される。本変形例では、印330の密度によって重症度が表現される。 <First Modification of First Embodiment>
Next, several modifications of the first embodiment of the present invention described above will be described.
FIG. 22 is a marking image MP of a first modification of the first embodiment of the present invention. In the first embodiment described above, in the mask size update process S84, the average score Sc Avg. A configuration is adopted in which the mask size is changed according to the condition, and the severity is expressed by the size of the
なお、本変形例では、上述した第1実施形態におけるマスクテーブルMT(表1)に替えて、マスク310内の平均スコアScAvg.とマスク内に付すべき印の数との対応関係が記憶されたマーク数テーブルが使用される。マーク数テーブルの例を表2に示す。

In this modification, instead of the mask table MT (Table 1) in the first embodiment described above, the average score Sc Avg. And a mark number table in which the correspondence between the number of marks to be added in the mask is stored. An example of the mark number table is shown in Table 2.
<第1実施形態の第2変形例>
図23は、本発明の第1実施形態の第2変形例のマーキング画像MPである。上述した第1実施形態では、マスク310内に文字や記号を付すことによって通常観察画像NPに対してマーキングを施す構成が採用された。一方、本変形例では、マスク310内の平均スコアScAvg.に応じて、通常観察画像NPに対してマスク310内の色を変更する(言い換えれば、色の印を付す)処理を施すことによって、病変部の位置やその重症度を表示するものである。 <Second Modification of First Embodiment>
FIG. 23 is a marking image MP of the second modified example of the first embodiment of the present invention. In the first embodiment described above, a configuration is employed in which marking is performed on the normal observation image NP by attaching characters and symbols in themask 310. On the other hand, in this modification, the average score Sc Avg. Accordingly, the position of the lesioned part and the severity thereof are displayed by changing the color in the mask 310 (in other words, adding a color mark) to the normal observation image NP.
図23は、本発明の第1実施形態の第2変形例のマーキング画像MPである。上述した第1実施形態では、マスク310内に文字や記号を付すことによって通常観察画像NPに対してマーキングを施す構成が採用された。一方、本変形例では、マスク310内の平均スコアScAvg.に応じて、通常観察画像NPに対してマスク310内の色を変更する(言い換えれば、色の印を付す)処理を施すことによって、病変部の位置やその重症度を表示するものである。 <Second Modification of First Embodiment>
FIG. 23 is a marking image MP of the second modified example of the first embodiment of the present invention. In the first embodiment described above, a configuration is employed in which marking is performed on the normal observation image NP by attaching characters and symbols in the
また、本変形例では、通常観察画像NPに対してマスク内を単一の色(透過率0%)で塗潰すのではなく、所定の透過性(例えば透過率80%)を与えた色が通常観察画像NPに付される。そのため、第1実施形態と同様に、マーキング画像MPにも病変部の像の情報が残されるため、病変部を所定の色で塗潰す従来の方法と比べて、正確な診断を容易に行うことが可能になる。
Also, in this modification, the normal observation image NP is not filled with a single color (transmittance 0%) in the mask, but a color that gives a predetermined transparency (for example, transmittance 80%). Usually attached to the observation image NP. For this reason, as in the first embodiment, since the image information of the lesioned part remains in the marking image MP, accurate diagnosis can be easily performed as compared with the conventional method of painting the lesioned part with a predetermined color. Is possible.
また、本変形例では、病変部に付される記号の形状を認識する必要が無いため、マスクの大きさを1×1まで小さく設定する(又は、マスクを設定せずに、1画素ごとに処理を行う)構成とすることもできる。
Further, in this modification, since it is not necessary to recognize the shape of the symbol attached to the lesioned part, the mask size is set as small as 1 × 1 (or each pixel without setting the mask). It can also be configured to perform processing.
なお、本変形例では、上述した第1実施形態におけるマスクテーブルMT(表1)に替えて、各画素(x,y)のスコアSc(x,y)と各画素(x,y)に付すべき色Col(x,y)との対応関係が記憶された表示色テーブルが使用される。表示色テーブル(24ビットカラー)の例を表3に示す。なお、スコアSc(x,y)の値がゼロ(正常組織)の画素(x,y)に対しては、無色透明を示す空の値(null値)が与えられるため、正常組織の画素は着色されない。また、各画素(x,y)に付すべき色の指定は、RGBによる指定に限らず、他の色表現(例えば、色相及び/又は彩度)によって指定することもできる。

In this modification, the score Sc (x, y) and each pixel (x, y) of each pixel (x, y) are attached to the mask table MT (Table 1) in the first embodiment described above. A display color table in which the correspondence relationship with the power color Col (x, y) is stored is used. Table 3 shows an example of the display color table (24-bit color). It should be noted that an empty value (null value) indicating colorless and transparent is given to a pixel (x, y) whose score Sc (x, y) is zero (normal tissue). Not colored. Also, the designation of the color to be assigned to each pixel (x, y) is not limited to designation by RGB, but may be designated by other color expressions (for example, hue and / or saturation).
<第2実施形態>
次に、本発明の第2実施形態について説明する。
図24は、第2実施形態のマーキング処理S8aの手順を示すフローチャートである。本実施形態のマーキング処理S8aは、上述した第1実施形態のマーキング処理S8に替えて行われる。また、本実施形態のマーキング処理S8aは、通常観察画像データNを構成する全ての画素(x,y)について順次行われる。 Second Embodiment
Next, a second embodiment of the present invention will be described.
FIG. 24 is a flowchart illustrating the procedure of the marking process S8a according to the second embodiment. The marking process S8a of the present embodiment is performed in place of the marking process S8 of the first embodiment described above. Further, the marking process S8a of the present embodiment is sequentially performed for all the pixels (x, y) constituting the normal observation image data N.
本実施形態の電子内視鏡装置1は、上述した第1実施形態の第2変形例と同じく、メモリ229上に表示色テーブル(表3)が格納されている。また、本実施形態の画像メモリ227には、記憶領域Pn、Pe、Pmの他に、マーキング処理S8aにおいて作成されるカラーマップ画像データCM(カラーマップ画像CMPを表す画像データ)が記憶される記憶領域Pcが設けられている(図3(b)参照)。
In the electronic endoscope apparatus 1 of the present embodiment, a display color table (Table 3) is stored on the memory 229 as in the second modification of the first embodiment described above. In addition to the storage areas P n , P e , and P m , the image memory 227 of the present embodiment stores color map image data CM (image data representing the color map image CMP) created in the marking process S8a. A storage area Pc is provided (see FIG. 3B).
[カラーマップ画像データ生成:S81a]
マーキング処理S8aでは、先ず、メモリ229に格納された表示色テーブルが参照され、スコアSc(x,y)に基づいて、各画素に適用される色Col(x,y)が決定される。なお、病変画素以外の画素の色Col(x,y)は無色透明(null値)に設定される。そして、各画素(x,y)の色Col(x,y)から構成されるカラーマップ画像データCMが生成され、メモリ229の記憶領域Pcに記憶される(S81a)。 [Color map image data generation: S81a]
In the marking process S8a, first, the display color table stored in thememory 229 is referred to, and the color Col (x, y) applied to each pixel is determined based on the score Sc (x, y). The color Col (x, y) of pixels other than the lesion pixel is set to be colorless and transparent (null value). Then, color map image data CM composed of the color Col (x, y) of each pixel (x, y) is generated and stored in the storage area P c of the memory 229 (S81a).
マーキング処理S8aでは、先ず、メモリ229に格納された表示色テーブルが参照され、スコアSc(x,y)に基づいて、各画素に適用される色Col(x,y)が決定される。なお、病変画素以外の画素の色Col(x,y)は無色透明(null値)に設定される。そして、各画素(x,y)の色Col(x,y)から構成されるカラーマップ画像データCMが生成され、メモリ229の記憶領域Pcに記憶される(S81a)。 [Color map image data generation: S81a]
In the marking process S8a, first, the display color table stored in the
[画像混合処理:S82a]
次に、カラーマップ画像CMPに透過性を与えて通常観察画像NP上に重ね合わせる画像混合処理S82aが行われる。画像混合処理S82aは、具体的には、通常観察画像データNとカラーマップ画像データCMとを加重平均する処理である。加重平均を行うことにより、カラーマップ画像CMPに透過性を与えて通常観察画像NPと重ね合わせることができる。なお、加重平均における通常観察画像データNの重みは、予め設定されたカラーマップ画像CMPの透過率により決定される。画像混合処理S82aによって生成されたマーキング画像データMは、画像メモリ227の記憶領域Pmに記憶され、マーキング処理S8aが完了する。なお、加重平均は、病変画素(スコアSc(x,y)>0)に対してのみ行われ、健常部(スコアSc(x,y)=0)の画素(x,y)については、通常観察画像データNの画素値N(x,y)がそのままマーキング画像データMの画素値M(x,y)となる。 [Image mixing processing: S82a]
Next, an image mixing process S82a is performed in which the color map image CMP is given transparency and is superimposed on the normal observation image NP. Specifically, the image mixing process S82a is a process of performing weighted averaging of the normal observation image data N and the color map image data CM. By performing the weighted average, the color map image CMP can be made transparent and can be superimposed on the normal observation image NP. Note that the weight of the normal observation image data N in the weighted average is determined by a preset transmittance of the color map image CMP. Marking image data M which has been generated by the image mixing process S82a is stored in the storage area P m of theimage memory 227, the marking process S8a is completed. Note that the weighted average is performed only on the lesion pixel (score Sc (x, y)> 0), and the pixel (x, y) of the healthy part (score Sc (x, y) = 0) is usually set. The pixel value N (x, y) of the observation image data N becomes the pixel value M (x, y) of the marking image data M as it is.
次に、カラーマップ画像CMPに透過性を与えて通常観察画像NP上に重ね合わせる画像混合処理S82aが行われる。画像混合処理S82aは、具体的には、通常観察画像データNとカラーマップ画像データCMとを加重平均する処理である。加重平均を行うことにより、カラーマップ画像CMPに透過性を与えて通常観察画像NPと重ね合わせることができる。なお、加重平均における通常観察画像データNの重みは、予め設定されたカラーマップ画像CMPの透過率により決定される。画像混合処理S82aによって生成されたマーキング画像データMは、画像メモリ227の記憶領域Pmに記憶され、マーキング処理S8aが完了する。なお、加重平均は、病変画素(スコアSc(x,y)>0)に対してのみ行われ、健常部(スコアSc(x,y)=0)の画素(x,y)については、通常観察画像データNの画素値N(x,y)がそのままマーキング画像データMの画素値M(x,y)となる。 [Image mixing processing: S82a]
Next, an image mixing process S82a is performed in which the color map image CMP is given transparency and is superimposed on the normal observation image NP. Specifically, the image mixing process S82a is a process of performing weighted averaging of the normal observation image data N and the color map image data CM. By performing the weighted average, the color map image CMP can be made transparent and can be superimposed on the normal observation image NP. Note that the weight of the normal observation image data N in the weighted average is determined by a preset transmittance of the color map image CMP. Marking image data M which has been generated by the image mixing process S82a is stored in the storage area P m of the
ここで、図25を参照して、画像混合処理S82aの効果を説明する。
図25(a)は、病変部の画像320を含む通常観察画像NPである。
図25(b)は、通常観察画像NP上にカラーマップ画像CMPをそのまま重ね合わせた画像(透過率0%)である。
図25(c)は、本実施形態の画像混合処理S82aによって生成されたマーキング画像MPである。
図25(b)と(c)との比較から明らかなように、画像混合処理S82aによって生成されたマーキング画像MPは、カラーマップにより、病変部と推定される部位や推定される重症度を視覚的に容易に把握することができる。また、カラーマップが透過性を有するため、病変部の形状やテクスチャも、マーキング画像MPからある程度把握することができ、診断をより容易に行うことが可能になる。 Here, the effect of the image mixing process S82a will be described with reference to FIG.
FIG. 25A is a normal observation image NP that includes animage 320 of a lesioned part.
FIG. 25B is an image (transmittance 0%) in which the color map image CMP is directly superimposed on the normal observation image NP.
FIG. 25C shows a marking image MP generated by the image mixing process S82a of the present embodiment.
As is clear from a comparison between FIGS. 25B and 25C, the marking image MP generated by the image mixing process S82a visually recognizes a site estimated to be a lesion and an estimated severity by a color map. Can be grasped easily. Further, since the color map has transparency, the shape and texture of the lesioned part can be grasped to some extent from the marking image MP, and diagnosis can be performed more easily.
図25(a)は、病変部の画像320を含む通常観察画像NPである。
図25(b)は、通常観察画像NP上にカラーマップ画像CMPをそのまま重ね合わせた画像(透過率0%)である。
図25(c)は、本実施形態の画像混合処理S82aによって生成されたマーキング画像MPである。
図25(b)と(c)との比較から明らかなように、画像混合処理S82aによって生成されたマーキング画像MPは、カラーマップにより、病変部と推定される部位や推定される重症度を視覚的に容易に把握することができる。また、カラーマップが透過性を有するため、病変部の形状やテクスチャも、マーキング画像MPからある程度把握することができ、診断をより容易に行うことが可能になる。 Here, the effect of the image mixing process S82a will be described with reference to FIG.
FIG. 25A is a normal observation image NP that includes an
FIG. 25B is an image (
FIG. 25C shows a marking image MP generated by the image mixing process S82a of the present embodiment.
As is clear from a comparison between FIGS. 25B and 25C, the marking image MP generated by the image mixing process S82a visually recognizes a site estimated to be a lesion and an estimated severity by a color map. Can be grasped easily. Further, since the color map has transparency, the shape and texture of the lesioned part can be grasped to some extent from the marking image MP, and diagnosis can be performed more easily.
<第3実施形態>
次に、本発明の第3実施形態について説明する。本実施形態は、通常観察画像NPにコアSc(x,y)の等高線CLを重ねて表示することにより、病変部の位置や重症度の分布を視認性良く表示するものである。 <Third Embodiment>
Next, a third embodiment of the present invention will be described. In the present embodiment, the contour line CL of the core Sc (x, y) is displayed on the normal observation image NP so as to display the position of the lesioned part and the distribution of the severity with high visibility.
図26は、第3実施形態における等高線CLの作成過程を説明する図である。本実施形態では、まず、図26(a)に示される病変部の画像320を含む通常観察画像NPから生成されたコアテーブルSTに基づいて、表示色テーブル(表3)を参照して、図26(b)に示されるカラーマップ画像CMPが生成される。このカラーマップ画像CMPに対して、例えばカラーマップ画像データCMに対するベクトル微分演算等の処理を行うことにより、等高線CLが生成される。このようにして生成された等高線CLを通常観察画像NP上に重ね合わせることにより、図26(c)に示される本実施形態のマーキング画像MPが生成される。
FIG. 26 is a diagram for explaining a process of creating a contour line CL in the third embodiment. In the present embodiment, first, referring to the display color table (Table 3) based on the core table ST generated from the normal observation image NP including the lesion image 320 shown in FIG. A color map image CMP shown in 26 (b) is generated. A contour line CL is generated by performing processing such as vector differentiation on the color map image data CM, for example, on the color map image CMP. By superposing the contour lines CL thus generated on the normal observation image NP, the marking image MP of the present embodiment shown in FIG. 26C is generated.
以上が本発明の例示的な実施形態の説明である。本発明の実施形態は、上記に説明したものに限定されず、本発明の技術的思想の範囲において様々な変形が可能である。例えば明細書中に例示的に明示される実施形態等又は自明な実施形態等を適宜組み合わせた内容も本発明の実施形態に含まれる。
This completes the description of the exemplary embodiment of the present invention. Embodiments of the present invention are not limited to those described above, and various modifications are possible within the scope of the technical idea of the present invention. For example, the embodiment of the present invention also includes contents appropriately combined with embodiments or the like clearly shown in the specification or obvious embodiments.
上記の実施形態では、HSI空間において病変の判定等の画像解析が行われるが、HSI空間の代わりに色相(hue)、彩度(saturation)及び明度(value(又はbrightness))を基底とするHSV(HSB)空間において画像解析を行う構成としてもよい。また、さらに、CIE 1976 L*a*b*色空間や、YCbCr色空間等、輝度又は明度を表す1つの座標と、色の質(例えば、色相及び彩度、あるいは色度)を表わす2つの座標とを有する他の種類の色空間上で画像解析を行うこともできる。
In the above embodiment, image analysis such as lesion determination is performed in the HSI space, but HSV based on hue, saturation, and value (or brightness) instead of the HSI space. It may be configured to perform image analysis in (HSB) space. In addition, one coordinate representing luminance or lightness, such as CIE 1976 L * a * b * color space and YCbCr color space, and two representing color quality (for example, hue and saturation, or chromaticity). Image analysis can also be performed on other types of color spaces having coordinates.
また、上記の実施形態では、TE処理S3がRGB空間上で行われているが、色空間変換処理S5の後にHSI空間上でTE処理S3を行う構成としてもよい。
In the above embodiment, the TE process S3 is performed on the RGB space. However, the TE process S3 may be performed on the HSI space after the color space conversion process S5.
また、TE処理S3(色彩強調処理)の代わりに、コントラスト強調処理(例えば、ヒストグラムの分布幅を広げることによりコントラストを強調するヒストグラム均等化法)や、アンシャープマスクフィルタを使用した画像鮮鋭化処理など、他の種類の画像強調処理を用いてもよい。
Further, instead of the TE processing S3 (color enhancement processing), contrast enhancement processing (for example, a histogram equalization method for enhancing contrast by widening the distribution width of the histogram) or image sharpening processing using an unsharp mask filter For example, other types of image enhancement processing may be used.
また、上記の実施形態は炎症性腸疾患の内視鏡検査に本発明を適用した例であるが、当然ながら他の疾患の内視鏡検査にも本発明を適用することができる。
The above embodiment is an example in which the present invention is applied to endoscopy for inflammatory bowel disease, but the present invention can naturally be applied to endoscopy for other diseases.
また、上記の実施形態は、観察画像に基づいて1種類の病変(炎症)の重症度のみを評価して、その重症度に応じた印を観察画像の該当箇所に付する例であるが、複数種類の病変(例えば、炎症性腸疾患に特徴的な病変である炎症と潰瘍)のそれぞれについて重症度を判定し、重症度に応じた印を観察画像の該当箇所に付する構成としてもよい。また、この場合には、病変の種類毎に表示態様(例えば、記号の種類や色)を変えてもよい。
In addition, the above embodiment is an example in which only the severity of one kind of lesion (inflammation) is evaluated based on the observation image, and a mark corresponding to the severity is attached to the corresponding portion of the observation image. A configuration may be adopted in which the severity is determined for each of a plurality of types of lesions (for example, inflammation and ulcers that are characteristic of inflammatory bowel disease), and a mark corresponding to the severity is attached to the corresponding portion of the observation image. . In this case, the display mode (for example, the type and color of the symbol) may be changed for each type of lesion.
また、上記の実施形態は、病変部にのみ印を付すものであるが、これとは逆に、健常部のみに印を付す構成としてもよい。また、病変部と健常部のそれぞれに異なる印を付す構成としてもよい。
In the above embodiment, only the lesioned part is marked, but conversely, only the healthy part may be marked. Moreover, it is good also as a structure which attaches a different mark to each of a lesioned part and a healthy part.
また、上記の実施形態は、記号、等高線及び表示色のいずれか一つを用いて病変部の重症度を表示するものであるが、これら3種類の表示態様の2つ以上を組み合わせて病変部の重症度を表示してもよい。また、記号の種類、大きさ、色の二つ以上の組み合わせによって重症度を表示する構成としてもよい。また、等高線の種類(実線、破線、鎖線、波線等)、太さ、色のいずれか又はこれらの二つ以上の組み合わせによって重症度を表示する構成としてもよい。
Moreover, although said embodiment displays the severity of a lesioned part using any one of a symbol, a contour line, and a display color, it combines two or more of these three types of display modes, and a lesioned part is combined. You may display the severity of. Moreover, it is good also as a structure which displays a severity by the combination of 2 or more of the kind, magnitude | size, and color of a symbol. Moreover, it is good also as a structure which displays a severity by the kind of a contour line (a continuous line, a broken line, a chain line, a wavy line, etc.), thickness, a color, or a combination of these two or more.
また、上記の実施形態は、本発明をデジタルカメラの一形態である電子内視鏡装置に適用した例であるが、他の種類のデジタルカメラ(例えば、デジタルスチルカメラやデジタルビデオカメラ)を使用したシステムに本発明を適用することもできる。例えば、本発明をデジタルスチルカメラに適用すると、体表組織の病変部の診断支援や開頭手術時の脳組織の診断支援を行うことができる。
In addition, the above embodiment is an example in which the present invention is applied to an electronic endoscope apparatus which is a form of a digital camera, but other types of digital cameras (for example, a digital still camera and a digital video camera) are used. The present invention can also be applied to such a system. For example, when the present invention is applied to a digital still camera, diagnosis support for a lesion in a body surface tissue and diagnosis support for brain tissue during craniotomy can be performed.
Claims (17)
- 生体組織のカラー画像を表すカラー画像データを取得するカラー画像取得手段と、
前記カラー画像データに基づいて、前記カラー画像の各画素について病変部の画素か否かの判定をする病変判定手段と、
前記判定の結果に基づいて、前記カラー画像上に前記病変部の位置を示す印を付すマーキング手段と、
を備え、
前記印は、背景の前記カラー画像が透ける印である、
画像処理装置。 Color image acquisition means for acquiring color image data representing a color image of a biological tissue;
A lesion determination means for determining whether or not each pixel of the color image is a pixel of a lesion based on the color image data;
Based on the result of the determination, marking means for attaching a mark indicating the position of the lesion on the color image;
With
The mark is a mark through which the color image of the background is transparent.
Image processing device. - 前記病変判定手段が、
前記カラー画像の画素毎に前記生体組織の病変の重症度を示すスコアを要素に含むスコアテーブルを生成するスコアテーブル生成手段を有し、
前記マーキング手段が、前記スコアテーブルに基づいて、前記カラー画像上に前記病変部の位置及び重症度を示す前記印を付す、
請求項1に記載の画像処理装置。 The lesion determination means is
Score table generating means for generating a score table including, as an element, a score indicating the severity of the lesion of the living tissue for each pixel of the color image;
The marking means attaches the mark indicating the position and severity of the lesion on the color image based on the score table,
The image processing apparatus according to claim 1. - 前記マーキング手段が、
前記カラー画像内に処理の対象領域であるマスクを設定し、
前記マスク内の前記スコアの代表値を計算し、
前記代表値に基づいて前記マスクに前記印を付す、
請求項2に記載の画像処理装置。 The marking means is
Set a mask, which is a processing target area, in the color image,
Calculating a representative value of the score in the mask;
Mark the mask based on the representative value;
The image processing apparatus according to claim 2. - 前記マーキング手段が、
所定の初期サイズのマスクを設定し、
前記初期サイズのマスクについて前記代表値を計算し、
前記代表値に応じて前記マスクの大きさを変更し、
大きさを変更した前記マスクに内接するように前記印を付す、
請求項3に記載の画像処理装置。 The marking means is
Set a mask with a predetermined initial size,
Calculating the representative value for the initial size mask;
Change the size of the mask according to the representative value,
The mark is attached so as to be inscribed in the mask whose size has been changed,
The image processing apparatus according to claim 3. - 前記初期サイズが、前記マスクの最小サイズである、
請求項4に記載の画像処理装置。 The initial size is a minimum size of the mask;
The image processing apparatus according to claim 4. - 前記マーキング手段が、
前記代表値に応じた数の前記印を前記マスク内に付す、
請求項3に記載の画像処理装置。 The marking means is
The number of the marks corresponding to the representative value is put in the mask.
The image processing apparatus according to claim 3. - 前記マーキング手段が、
前記カラー画像内で前記マスクを走査させながら前記カラー画像上に前記印を付す、
請求項3から請求項6のいずれか一項に記載の画像処理装置。 The marking means is
Marking the color image while scanning the mask in the color image;
The image processing apparatus according to any one of claims 3 to 6. - 前記マーキング手段が、
設定済みの他の前記マスクと重ならないように前記マスクを設定する、
請求項7に記載の画像処理装置。 The marking means is
Set the mask so that it does not overlap with other masks that have been set.
The image processing apparatus according to claim 7. - 前記代表値が、相加平均、加重平均、中央値、最頻値及び二乗平均平方根のいずれかである、
請求項3から請求項8のいずれか一項に記載の画像処理装置。 The representative value is any one of an arithmetic average, a weighted average, a median, a mode, and a root mean square.
The image processing apparatus according to any one of claims 3 to 8. - 前記スコアテーブル生成手段が、
前記カラー画像データの色空間を、輝度又は明度を表す1つの座標と、色の質を表わす2つの座標と、を有する色空間に変換する色空間変換手段と、
前記カラー画像データの各画素の色の質に基づいて、各画素のスコアを計算するスコア計算手段と、
を備える、
請求項2から請求項9のいずれか一項に記載の画像処理装置。 The score table generating means
Color space conversion means for converting the color space of the color image data into a color space having one coordinate representing luminance or brightness and two coordinates representing color quality;
Score calculating means for calculating a score of each pixel based on the color quality of each pixel of the color image data;
Comprising
The image processing apparatus according to any one of claims 2 to 9. - 前記スコアテーブル生成手段が、
病変部に特徴的な画素値の範囲の境界領域において色の質のコントラストを高める色彩強調処理を行う色彩強調手段を更に備え、
前記スコア計算手段が、
前記色彩強調処理後の画素値に基づいて各画素のスコアを計算する、
請求項10に記載の画像処理装置。 The score table generating means
A color enhancement means for performing a color enhancement process for increasing the contrast of the color quality in the boundary region of the range of pixel values characteristic of the lesion;
The score calculation means
Calculating a score of each pixel based on the pixel value after the color enhancement processing;
The image processing apparatus according to claim 10. - 前記スコア計算手段が、
色相-彩度空間又は色度空間における基準点との距離に基づいて各画素のスコアを計算する、
請求項10又は請求項11に記載の画像処理装置。 The score calculation means
Calculating a score for each pixel based on the hue-saturation space or the distance to the reference point in the chromaticity space;
The image processing apparatus according to claim 10 or 11. - 前記病変部が炎症部であり、
前記基準点が血液の色である、
請求項12に記載の画像処理装置。 The lesion is an inflamed area;
The reference point is blood color;
The image processing apparatus according to claim 12. - 前記印が記号である、
請求項1から請求項13のいずれか一項に記載の画像処理装置。 The mark is a symbol;
The image processing apparatus according to any one of claims 1 to 13. - 前記印が透過率を有する色である、
請求項1から請求項14のいずれか一項に記載の画像処理装置。 The mark is a color having transmittance,
The image processing apparatus according to any one of claims 1 to 14. - 前記印が前記重症度の等高線である、
請求項2に記載の画像処理装置。 The mark is a contour of the severity,
The image processing apparatus according to claim 2. - 前記カラー画像が電子内視鏡画像である、
請求項1から請求項16のいずれか一項に記載の画像処理装置。 The color image is an electronic endoscopic image;
The image processing apparatus according to any one of claims 1 to 16.
Priority Applications (3)
| Application Number | Priority Date | Filing Date | Title |
|---|---|---|---|
| CN201680000508.9A CN106068092B (en) | 2015-02-23 | 2016-02-08 | Image processing apparatus |
| EP16728210.2A EP3263006B1 (en) | 2015-02-23 | 2016-02-08 | Image processing device |
| US15/106,978 US10231600B2 (en) | 2015-02-23 | 2016-02-08 | Image processing apparatus |
Applications Claiming Priority (2)
| Application Number | Priority Date | Filing Date | Title |
|---|---|---|---|
| JP2015032714A JP6584090B2 (en) | 2015-02-23 | 2015-02-23 | Image processing device |
| JP2015-032714 | 2015-02-23 |
Publications (1)
| Publication Number | Publication Date |
|---|---|
| WO2016136442A1 true WO2016136442A1 (en) | 2016-09-01 |
Family
ID=56789399
Family Applications (1)
| Application Number | Title | Priority Date | Filing Date |
|---|---|---|---|
| PCT/JP2016/053623 WO2016136442A1 (en) | 2015-02-23 | 2016-02-08 | Image processing device |
Country Status (5)
| Country | Link |
|---|---|
| US (1) | US10231600B2 (en) |
| EP (1) | EP3263006B1 (en) |
| JP (1) | JP6584090B2 (en) |
| CN (1) | CN106068092B (en) |
| WO (1) | WO2016136442A1 (en) |
Cited By (2)
| Publication number | Priority date | Publication date | Assignee | Title |
|---|---|---|---|---|
| WO2019142689A1 (en) * | 2018-01-19 | 2019-07-25 | Hoya株式会社 | Processor for electronic endoscope and electronic endoscope system |
| US11602263B2 (en) | 2016-10-12 | 2023-03-14 | Olympus Corporation | Insertion system, method and computer-readable storage medium for displaying attention state information over plurality of times |
Families Citing this family (13)
| Publication number | Priority date | Publication date | Assignee | Title |
|---|---|---|---|---|
| US10806334B2 (en) | 2017-02-28 | 2020-10-20 | Verily Life Sciences Llc | System and method for multiclass classification of images using a programmable light source |
| JP6850225B2 (en) * | 2017-09-01 | 2021-03-31 | 富士フイルム株式会社 | Medical image processing equipment, endoscopy equipment, diagnostic support equipment, and medical business support equipment |
| KR101943011B1 (en) | 2018-01-22 | 2019-01-28 | 주식회사 뷰노 | Method for facilitating medical image reading and apparatus using the same |
| WO2019146079A1 (en) * | 2018-01-26 | 2019-08-01 | オリンパス株式会社 | Endoscope image processing device, endoscope image processing method, and program |
| EP3766079A1 (en) * | 2018-03-14 | 2021-01-20 | Koninklijke Philips N.V. | Scoring intravascular lesions and stent deployment in medical intraluminal ultrasound imaging |
| JP7171254B2 (en) | 2018-06-13 | 2022-11-15 | キヤノン株式会社 | Image processing device, imaging device, and image processing method |
| CN109222859A (en) * | 2018-08-03 | 2019-01-18 | 广州高通影像技术有限公司 | A kind of intelligent endoscope image system with AI auxiliary diagnosis function |
| CN109330566A (en) * | 2018-11-21 | 2019-02-15 | 佛山市第人民医院(中山大学附属佛山医院) | Wound monitoring method and device |
| JP7284814B2 (en) * | 2019-05-23 | 2023-05-31 | 富士フイルム株式会社 | Image processing device |
| CN111091536B (en) * | 2019-11-25 | 2023-04-07 | 腾讯科技(深圳)有限公司 | Medical image processing method, apparatus, device, medium, and endoscope |
| CN111358573B (en) * | 2020-02-26 | 2023-06-20 | 西安交通大学医学院第二附属医院 | Device and method for rapidly detecting and marking hyperspectral imaging operation area |
| CN113128402A (en) * | 2021-04-19 | 2021-07-16 | 国网江苏电动汽车服务有限公司 | System and method for identifying safety state of battery charging and replacing equipment |
| CN117257204B (en) * | 2023-09-19 | 2024-05-07 | 深圳海业医疗科技有限公司 | Endoscope control assembly control method and system |
Citations (6)
| Publication number | Priority date | Publication date | Assignee | Title |
|---|---|---|---|---|
| JP2003033327A (en) * | 2001-07-24 | 2003-02-04 | Fujitsu Ltd | Diagnostic support system via imaging information |
| JP2003260027A (en) * | 2003-02-06 | 2003-09-16 | Olympus Optical Co Ltd | Image processing unit for endoscope |
| JP2006025802A (en) * | 2003-06-17 | 2006-02-02 | Olympus Corp | Endoscope apparatus |
| JP2011177419A (en) * | 2010-03-03 | 2011-09-15 | Olympus Corp | Fluorescence observation device |
| JP2014018332A (en) | 2012-07-17 | 2014-02-03 | Hoya Corp | Image processor and endoscope apparatus |
| WO2014084134A1 (en) * | 2012-11-30 | 2014-06-05 | オリンパス株式会社 | Observation device |
Family Cites Families (5)
| Publication number | Priority date | Publication date | Assignee | Title |
|---|---|---|---|---|
| US6947784B2 (en) * | 2000-04-07 | 2005-09-20 | The General Hospital Corporation | System for digital bowel subtraction and polyp detection and related techniques |
| US20050027166A1 (en) | 2003-06-17 | 2005-02-03 | Shinya Matsumoto | Endoscope system for fluorescent observation |
| JP6027803B2 (en) * | 2012-07-17 | 2016-11-16 | Hoya株式会社 | Image processing apparatus and endoscope apparatus |
| JP5567168B2 (en) * | 2013-03-06 | 2014-08-06 | 富士フイルム株式会社 | Image processing apparatus and endoscope system |
| JP6097629B2 (en) * | 2013-04-26 | 2017-03-15 | Hoya株式会社 | Lesion evaluation information generator |
-
2015
- 2015-02-23 JP JP2015032714A patent/JP6584090B2/en active Active
-
2016
- 2016-02-08 WO PCT/JP2016/053623 patent/WO2016136442A1/en active Application Filing
- 2016-02-08 CN CN201680000508.9A patent/CN106068092B/en active Active
- 2016-02-08 EP EP16728210.2A patent/EP3263006B1/en active Active
- 2016-02-08 US US15/106,978 patent/US10231600B2/en active Active
Patent Citations (6)
| Publication number | Priority date | Publication date | Assignee | Title |
|---|---|---|---|---|
| JP2003033327A (en) * | 2001-07-24 | 2003-02-04 | Fujitsu Ltd | Diagnostic support system via imaging information |
| JP2003260027A (en) * | 2003-02-06 | 2003-09-16 | Olympus Optical Co Ltd | Image processing unit for endoscope |
| JP2006025802A (en) * | 2003-06-17 | 2006-02-02 | Olympus Corp | Endoscope apparatus |
| JP2011177419A (en) * | 2010-03-03 | 2011-09-15 | Olympus Corp | Fluorescence observation device |
| JP2014018332A (en) | 2012-07-17 | 2014-02-03 | Hoya Corp | Image processor and endoscope apparatus |
| WO2014084134A1 (en) * | 2012-11-30 | 2014-06-05 | オリンパス株式会社 | Observation device |
Non-Patent Citations (1)
| Title |
|---|
| See also references of EP3263006A4 |
Cited By (3)
| Publication number | Priority date | Publication date | Assignee | Title |
|---|---|---|---|---|
| US11602263B2 (en) | 2016-10-12 | 2023-03-14 | Olympus Corporation | Insertion system, method and computer-readable storage medium for displaying attention state information over plurality of times |
| WO2019142689A1 (en) * | 2018-01-19 | 2019-07-25 | Hoya株式会社 | Processor for electronic endoscope and electronic endoscope system |
| JPWO2019142689A1 (en) * | 2018-01-19 | 2020-12-17 | Hoya株式会社 | Electronic Endoscope Processor and Electronic Endoscope System |
Also Published As
| Publication number | Publication date |
|---|---|
| JP6584090B2 (en) | 2019-10-02 |
| EP3263006A4 (en) | 2018-11-14 |
| EP3263006B1 (en) | 2024-01-31 |
| EP3263006A1 (en) | 2018-01-03 |
| US20170112353A1 (en) | 2017-04-27 |
| JP2016154588A (en) | 2016-09-01 |
| CN106068092A (en) | 2016-11-02 |
| US10231600B2 (en) | 2019-03-19 |
| CN106068092B (en) | 2018-05-25 |
Similar Documents
| Publication | Publication Date | Title |
|---|---|---|
| JP6584090B2 (en) | Image processing device | |
| JP6346576B2 (en) | Image processing device | |
| US11701032B2 (en) | Electronic endoscope processor and electronic endoscopic system | |
| WO2016136700A1 (en) | Image processing device | |
| US8027533B2 (en) | Method of automated image color calibration | |
| JP6907398B2 (en) | Endoscope system | |
| WO2020066807A1 (en) | Electronic endoscope system | |
| CN112469323B (en) | Endoscope system | |
| CN112351723A (en) | Electronic endoscope system and data processing device | |
| JP7084546B2 (en) | Endoscope system | |
| CN106714651A (en) | Evaluation value calculation device and electronic endoscope system | |
| JP6531202B2 (en) | Image processing device | |
| US10646102B2 (en) | Processor for electronic endoscope, and electronic endoscope system | |
| CN109310303B (en) | Electronic endoscope processor and electronic endoscope system | |
| JP7455716B2 (en) | Endoscope processor and endoscope system |
Legal Events
| Date | Code | Title | Description |
|---|---|---|---|
| REEP | Request for entry into the european phase |
Ref document number: 2016728210 Country of ref document: EP |
|
| WWE | Wipo information: entry into national phase |
Ref document number: 15106978 Country of ref document: US Ref document number: 2016728210 Country of ref document: EP |
|
| 121 | Ep: the epo has been informed by wipo that ep was designated in this application |
Ref document number: 16728210 Country of ref document: EP Kind code of ref document: A1 |
|
| NENP | Non-entry into the national phase |
Ref country code: DE |