WO2016067483A1 - Estimated result display system, estimated result display method and estimated result display program - Google Patents
Estimated result display system, estimated result display method and estimated result display program Download PDFInfo
- Publication number
- WO2016067483A1 WO2016067483A1 PCT/JP2015/002296 JP2015002296W WO2016067483A1 WO 2016067483 A1 WO2016067483 A1 WO 2016067483A1 JP 2015002296 W JP2015002296 W JP 2015002296W WO 2016067483 A1 WO2016067483 A1 WO 2016067483A1
- Authority
- WO
- WIPO (PCT)
- Prior art keywords
- estimation
- learning model
- estimation result
- graph
- symbol
- Prior art date
Links
Images


Classifications
-
- G—PHYSICS
- G06—COMPUTING; CALCULATING OR COUNTING
- G06N—COMPUTING ARRANGEMENTS BASED ON SPECIFIC COMPUTATIONAL MODELS
- G06N7/00—Computing arrangements based on specific mathematical models
- G06N7/01—Probabilistic graphical models, e.g. probabilistic networks
-
- G—PHYSICS
- G06—COMPUTING; CALCULATING OR COUNTING
- G06N—COMPUTING ARRANGEMENTS BASED ON SPECIFIC COMPUTATIONAL MODELS
- G06N20/00—Machine learning
-
- G—PHYSICS
- G06—COMPUTING; CALCULATING OR COUNTING
- G06N—COMPUTING ARRANGEMENTS BASED ON SPECIFIC COMPUTATIONAL MODELS
- G06N20/00—Machine learning
- G06N20/20—Ensemble learning
-
- G—PHYSICS
- G06—COMPUTING; CALCULATING OR COUNTING
- G06N—COMPUTING ARRANGEMENTS BASED ON SPECIFIC COMPUTATIONAL MODELS
- G06N5/00—Computing arrangements using knowledge-based models
- G06N5/01—Dynamic search techniques; Heuristics; Dynamic trees; Branch-and-bound
-
- G—PHYSICS
- G06—COMPUTING; CALCULATING OR COUNTING
- G06T—IMAGE DATA PROCESSING OR GENERATION, IN GENERAL
- G06T11/00—2D [Two Dimensional] image generation
- G06T11/20—Drawing from basic elements, e.g. lines or circles
- G06T11/206—Drawing of charts or graphs
Definitions
- the present invention relates to an estimation result display system, an estimation result display method, and an estimation result display program for displaying an estimation result derived using a learning model.
- Non-Patent Document 1 when a prediction formula is automatically selected from a plurality of prediction formulas and a predicted value is calculated using the prediction formula, a graph of the predicted value and the actual value is displayed and selected. It is described that a graph showing the transition of the predicted formula is displayed.
- a learning model When deriving an estimation result such as a predicted value, a learning model may be automatically selected from a plurality of learning models, and the estimation result may be derived using the learning model.
- a method for selecting a learning model a method for determining whether or not various attributes included in estimation data satisfy various predetermined conditions, and selecting a learning model according to the determination result Is mentioned. Depending on whether or not one condition is satisfied, the condition to be determined whether or not the attribute is satisfied next may be changed. Examples of attributes included in the estimation data include temperature and precipitation, but the attributes are not limited to these.
- Non-Patent Document 1 describes that a graph of predicted values and actual values is displayed and a graph showing the transition of the selected prediction formula is displayed. In such a display mode, it is difficult for a human to recognize what kind of condition determination has been made and thus a prediction formula (learning model) has been selected.
- the human tends to show the tendency of the attribute in the estimation data when each learning model is selected. It is preferable that it can be estimated.
- the present invention provides an estimation result display system that allows a human to recognize what kind of condition judgment is made for the learning model when displaying the estimation result derived using the learning model.
- An object of the present invention is to provide an estimation result display method and an estimation result display program.
- the estimation result display system includes information representing a learning model selected according to a determination result of whether or not an attribute in the estimation data including one or more attributes satisfies one or more conditions; Input means for inputting information associated with the estimation result derived by the learning model, information representing the learning model used for deriving the estimation result, and the learning model It is characterized by comprising display means for associating and displaying the condition that has been determined as to whether or not the attribute in the estimation data is satisfied when selected.
- the estimation result display system is information representing a learning model selected according to a determination result of whether or not an attribute in the estimation data including one or more attributes satisfies one or more conditions. And an input means for inputting the information in which the estimation result derived from the learning model and the estimation data are input, the change over time of the estimation result and the change over time of the learning model are displayed, and And a display means for displaying a graph showing a change with time of the attribute.
- the estimation result display method is information representing a learning model selected according to a determination result of whether or not an attribute in the estimation data including one or more attributes satisfies one or more conditions. And the estimation result derived by the learning model are received, and the information representing the learning model used for deriving the estimation result and the learning model selected by the estimation result are selected. In this case, a condition that is a target for determining whether or not the attribute in the estimation data is satisfied is displayed in association with each other.
- the estimation result display method is information representing a learning model selected according to a determination result of whether or not an attribute in the estimation data including one or more attributes satisfies one or more conditions. And an input of information in which the estimation result derived by the learning model and the estimation data are associated with each other, and the time-dependent change of the estimation result and the time-dependent change of the learning model are displayed. A graph showing a change with time is displayed.
- the estimation result display program is information representing a learning model selected according to a determination result of whether or not an attribute in the estimation data including one or more attributes satisfies one or more conditions.
- an estimation result display program installed in a computer having an input means for inputting information in which the correlation between the estimation result and the estimation result derived from the learning model is input. Display that associates and displays the information that represents the learning model that was used to perform the determination, and whether or not the attribute in the estimation data satisfied when the learning model was selected Processing is executed.
- the estimation result display program is information representing a learning model selected according to a determination result of whether or not an attribute in the estimation data including one or more attributes satisfies one or more conditions.
- an estimation result display program installed in a computer having an input means for inputting information in which the estimation result derived by the learning model and the estimation data are associated with each other.
- a display process for displaying a change and a change with time of the learning model and displaying a graph showing a change with time of the attribute in the estimation data is executed.
- a human when an estimation result derived using a learning model is displayed, a human can recognize what kind of condition judgment is made as a result of the learning model being selected.
- FIG. 1 is a schematic diagram showing a learning device and an estimator.
- description will be made using a specific example in which the value of an objective variable such as water consumption is estimated (predicted) based on the values of explanatory variables such as temperature, precipitation, and wind speed.
- the learning device 11 generates a plurality of learning models by using learning data in advance.
- the learning model is a model for deriving an estimation result when estimation data is given. In other words, an estimation result is obtained by applying the learning model to the estimation data.
- the learning model is information indicating regularity established between the explanatory variable and the objective variable, which is derived from the learning data, for example.
- the learning model is generated in the form of an estimation formula. In this case, the estimation result is calculated by substituting the estimation data into the explanatory variable of the estimation formula.
- the case where the learning model is in the form of the estimation formula is taken as an example, but the format of the learning model is not necessarily the estimation formula.
- a plurality of learning models generated by the learning device 11 is used by the estimator 12.
- estimation data including one or more types of attributes is input to the estimator 12, and the estimator 12 includes an attribute included in the estimation data among a plurality of learning models that satisfies one or more conditions. Learning model is selected according to the determination result. Then, the estimator 12 derives an estimation result using the estimation data and the selected learning model. As illustrated, when the learning model is represented in the form of an estimation formula, the estimator 12 substitutes the attribute included in the input estimation data into the explanatory variable of the estimation formula, thereby obtaining the estimation result. What is necessary is just to calculate.
- a plurality of sets are input to the estimation result display system 1 of the present invention.
- Information representing the learning model is identification information of the learning model.
- other information for example, actually measured values may be associated and input to the estimation result display system 1.
- Each estimation result input to the estimation result display system 1 of the present invention is derived in advance by the estimator 12.
- FIG. 2 is a schematic diagram illustrating an example of a selection model.
- the selection model is a tree-structured model in which the learning model is a leaf node and the conditions other than the leaf node are related to the attribute in the estimation data is illustrated.
- each node other than the leaf node has two child nodes.
- the selection model is a tree structure model illustrated in FIG. 2 will be described as an example.
- the format of the selection model is not limited to the tree structure model.
- the selection model is also given to the estimator 12. Assume that the selection model illustrated in FIG. 2 is given to the estimator 12 and estimation data including temperature and precipitation values is input to the estimator 12. Then, the estimator 12 repeatedly selects one of the two child nodes depending on whether the attribute in the estimation data satisfies the condition indicated by the node, starting from the root node of the selected model. Trace the node while. Then, when the estimator 12 arrives at the leaf node, the estimator 12 selects the learning model indicated by the leaf node. Then, the estimator 12 derives an estimation result using the learning model and the estimation data. In the above example, the case where the estimation data including the temperature and the precipitation value is input is illustrated, but the attribute not described as the condition in the selection model may be included in the estimation data.
- the learning model 1 when the learning model 1 is selected, only the condition that “the temperature is 20 ° C. or higher” is determined. Further, when the learning model 2 or the learning model 3 is selected, a condition that “the temperature is 20 ° C. or higher” and a condition that “the precipitation amount is 10 mm / h or more” are respectively determined. Become.
- the selection model used when the estimator 12 selects a learning model is also input to the estimation result display system 1 of the present invention.
- FIG. 3 is a diagram illustrating a specific example of the estimation data input to the estimator 12.
- FIG. 3 shows a set of estimation data.
- Information corresponding to “row” in FIG. 3 is information corresponding to one estimation data.
- the estimation data includes one or more types of attributes.
- Information corresponding to the “column” in FIG. 3 is information indicating the attribute included in the estimation data.
- the estimation data includes an ID (identifier) for identifying the estimation data, a temperature value, a precipitation value, a wind speed value, and information indicating time.
- the set of estimation data is expressed in a table format, but the estimation data is not limited to the format shown in FIG.
- the estimation data includes temperature, precipitation, and wind speed as attributes.
- the estimator 12 calculates the estimation result by, for example, substituting the attribute value included in the estimation data into the explanatory variable of the estimation formula.
- FIG. 4 is a diagram illustrating a specific example of estimation result data that is information output from the estimator 12.
- FIG. 4 shows a set of estimation result data.
- Information corresponding to “row” in FIG. 4 is information corresponding to one estimation result data.
- the estimation result data includes, for example, an estimated value, information representing a learning model used to derive the estimated value, and estimation data used when selecting the learning model. Is information associated with each other.
- the estimation result data may include other information.
- the estimation result data includes an identifier for identifying the estimation result data, time information of the estimation data, and the like.
- the estimation data includes one or more types of attributes.
- the set of estimation result data is information indicating a series of estimation results that are continuous in time series, for example.
- an example of the operation of the estimator 12 has been described using a specific example.
- the selection model as described above may be referred to as a learning model, and a model for deriving an estimation result, such as an estimation formula, may be referred to as a component.
- a model for example, an estimation formula
- a model for selecting a learning model is referred to as a selection model.
- the selection model itself is a learning result.
- the selection model may be a learning result or manually generated information. Good.
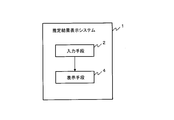
- FIG. FIG. 5 is a block diagram illustrating a configuration example of the estimation result display system according to the first embodiment of this invention.
- the estimation result display system 1 of the present embodiment includes an input unit 2, a condition specifying unit 3, and a display unit 4.
- the input means 2 includes information representing a learning model selected by the estimator 12 according to a determination result as to whether or not one or more attributes in the estimation data satisfy one or more conditions, and learning A plurality of sets of information (estimation result data) in which the estimation results derived by the model, the estimation data, and the actual measurement values are associated with each other are input.
- a set of estimation result data is input to the input unit 2.
- the estimation result is calculated as a value will be described as an example. Therefore, the estimation result may be referred to as an estimated value.
- the input means 2 receives the selection model used when the estimator 12 selects a learning model and display data for the selection model.
- the estimation result display system 1 may store the selected model once inputted and display data of the selected model in a storage device (not shown in FIG. 5).
- the selection model display data is data for displaying the selection model in a manner that can be grasped by a human.
- a leaf node represents a learning model
- each node other than the leaf node represents a condition for an attribute in the estimation data. Data is input.
- each node other than the leaf node has two child nodes.
- the input unit 2 includes information indicating a learning model, an estimation result, and an actual measurement for each set of information indicating a learning model, an estimation result, an actual measurement value, and estimation data (in other words, for each estimation result data).
- the value is sent to the display means 4 and the estimation data is sent to the condition specifying means 3.
- the estimation data in one estimation result data includes one or more types of attributes. This is the same in the other embodiments.
- the input means 2 is, for example, an input device or an input interface for inputting information.
- the condition specifying means 3 uses one or more attributes in the given estimation data and a selection model to determine whether the attributes are satisfied when the learning model is selected by the estimator 12 Identify the conditions that were.
- the condition specifying unit 3 traces the node starting from the root node of the selected model and repeatedly selecting one of the two child nodes depending on whether the attribute satisfies the condition indicated by the node. Then, the condition specifying unit 3 may specify a condition corresponding to the node traced until the leaf node is reached.
- the condition specifying unit 3 sends the specified condition to the display unit 4.
- condition that is a determination target of whether or not the attribute is satisfied when the learning model is selected by the estimator 12 may be input to the input unit 12 as an attribute included in the estimation result data.
- the display unit 4 displays the estimation result, the information indicating the learning model, and the condition that is the target for determining whether the attribute in the estimation data is satisfied when the learning model is selected. .
- This display mode varies depending on the embodiment.
- the display means 4 displays a scatter diagram in which the estimation results are represented by symbols. At this time, the display means 4 changes the type of the symbol according to the learning model, and the condition on which the attribute is determined when the learning model is selected is determined on the symbol. To express.
- a display example by the display unit 4 will be specifically described.
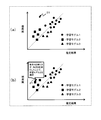
- FIG. 6 is a schematic diagram illustrating an example of a graph displayed by the display unit 4 in the first embodiment.
- the display unit 4 also displays a tree structure graph 41 (hereinafter referred to as a tree structure graph 41) representing the selected model based on the display data of the selected model.
- the display means 4 displays the nodes corresponding to the conditions in the tree structure graph 41 in individual colors or patterns (see FIG. 6). That is, each condition in the selected model is associated with a color or pattern.
- the display means 4 displays a scatter diagram representing the display results as symbols.
- the scatter diagram illustrated in FIG. 6 has an axis corresponding to the estimation result and an axis corresponding to the actual measurement value.
- FIG. 6 illustrates a case where the axis corresponding to the estimation result is the horizontal axis and the axis corresponding to the actual measurement value is the vertical axis.
- the display means 4 arranges the symbols representing the estimation results in the scatter diagram so that the estimation results are the coordinates in the horizontal axis direction and the actual measurement values corresponding to the estimation results are the coordinates in the vertical axis direction. Further, the type of symbol representing the estimation result is changed according to the learning model corresponding to the estimation result.
- a symbol representing an estimation result derived using the learning model 1 is a circle
- a symbol representing an estimation result derived using the learning model 2 is a rectangle
- an estimation derived using the learning model 3 The case where the symbol showing a result is made into the triangle is illustrated. Even when there are more types of learning models, the display unit 4 changes the types of symbols according to the learning models.
- the display means 4 does not necessarily have to change the symbols for every learning model.
- the display unit 4 may group learning models, and change the type of symbol representing the estimation result derived from the learning model for each group of learning models.
- the display unit 4 may change a symbol type representing an estimation result derived from a specific learning model among a plurality of learning models with another symbol type. This is the same in other embodiments.
- the display means 4 represents the condition that is the object of determination as to whether or not the attribute in the estimation data is satisfied when the learning model is selected, on a symbol in the scatter diagram. As described above, in the tree structure graph 41, nodes corresponding to the conditions are displayed in individual colors or patterns.
- the display means 4 uses the estimation data corresponding to the estimation result represented by the symbol and the condition specified by the condition specifying means 3 (the attribute in the estimation data is selected when the learning model from which the estimation result is derived is selected).
- the symbol is represented by a color or pattern corresponding to a condition that is a determination target of whether or not it is satisfied. A plurality of conditions may be specified for one symbol. In that case, the display means 4 represents the symbol with each color or pattern corresponding to the plurality of conditions.
- condition A the condition that “the temperature is 20 ° C. or higher”
- condition B the condition that “the precipitation amount is 10 mm / h or more”
- the display means 4 makes the symbol showing the estimation result corresponding to the learning model 2 a quadrangle combining a horizontal line pattern and a diagonal line pattern.
- the display unit 4 uses a symbol representing an estimation result corresponding to the learning model 3 as a triangle combining a horizontal line pattern and a diagonal line pattern.
- FIG. 6 illustrates the case where the display unit 4 changes the shape of the symbol according to the learning model and changes the color or pattern of the symbol according to the condition. However, the display unit 4 does not change the symbol according to the learning model.
- the shape or shape of the symbol may be changed according to conditions.
- the condition specifying means 3 and the display means 4 are realized by a CPU of a computer having a display device, for example.
- the CPU reads the estimation result display program from a program recording medium such as a computer program storage device (not shown in FIG. 5) and operates as the condition specifying means 3 and the display means 4 according to the estimation result display program.
- a program recording medium such as a computer program storage device (not shown in FIG. 5)
- a part of the display unit 4 that defines a graph and causes the display device to display the graph is realized by the CPU.
- the part that actually performs display is realized by a display device. This also applies to other embodiments described later.
- estimation result display system 1 may have a configuration in which two or more physically separated devices are connected by wire or wirelessly. This also applies to each embodiment described later.
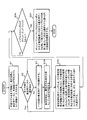
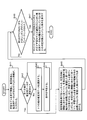
- FIG. 7 is a flowchart illustrating an example of processing progress of the first embodiment.
- the input means 2 includes a plurality of pieces of information in which information representing a learning model, an estimation result derived from the learning model, estimation data used at the time of selecting the learning model, and an actual measurement value are associated with each other.
- the set is input (step S1).
- the input unit 2 sends information indicating the learning model, an estimation result, and an actual measurement value to the display unit 4, and sends estimation data to the condition specifying unit 3.
- step S1 the selected model and display data for the selected model are also input to the input means 2.
- the estimation result display system 1 stores the selected model and display data for the selected model in a storage device (not shown in FIG. 5).
- condition specifying means 3 determines whether or not all sets of estimation data have been selected (step S2). If there remains a set for which estimation data is not selected (No in step S2), the condition specifying unit 3 selects one set of estimation data from the set (step S3).
- the condition specifying means 3 uses the estimation data selected in step S3 and the selected model, and when the learning model corresponding to the estimation data is selected by the estimator 12, the attribute in the estimation data is A condition that is a determination target of whether or not the condition is satisfied is specified (step S4). As described above, the condition specifying unit 3 selects one of the two child nodes based on whether the attribute in the estimation data satisfies the condition indicated by the node, starting from the root node of the selection model. Follow the nodes as you repeat. Then, the condition specifying unit 3 may specify a condition corresponding to the node traced until the leaf node is reached.
- step S3 estimation data including attributes of “temperature 18 ° C.” and “precipitation 15 mm / h” is selected in step S3. Further, it is assumed that the selection model illustrated in FIG. 2 is input.
- the condition specifying unit 3 traces the node starting from the root node illustrated in FIG. The root node corresponds to the condition A, and the condition specifying unit 3 determines that “temperature 18 ° C.” does not satisfy the condition A. As a result, the condition specifying unit 3 follows the node corresponding to the condition B from the root node. Then, the condition specifying means 3 determines that “precipitation 15 mm / h” satisfies the condition B, and arrives at the leaf node corresponding to the learning model 2. Therefore, in this example, the condition specifying unit 3 specifies the condition A and the condition B.
- the condition specifying unit 3 sends the specified condition to the display unit 4.
- step S4 the process proceeds to step S2.
- the display unit 4 displays the symbol representing the estimation result, the estimation result becomes the coordinate in the horizontal axis direction, and the actual measurement corresponding to the estimation result.
- a scatter diagram is displayed so that the values are coordinate values in the vertical axis direction.
- the display unit 4 changes the type of the symbol representing the estimation result in accordance with the learning model corresponding to the estimation result, and represents the condition corresponding to the learning model on the symbol (step S5).
- step S5 the display unit 4 displays the tree structure graph 41 together with the scatter diagram based on the display data of the selected model. At this time, the display unit 4 displays the node corresponding to the condition in the tree structure graph 41 with the color or pattern corresponding to the condition.
- the display unit 4 displays a scatter diagram and a tree structure graph 41 illustrated in FIG. 6 in step S5.
- the display unit 4 represents a symbol with a color or pattern corresponding to a condition that is a determination target whether or not the attribute in the estimation data is satisfied when the learning model is selected. . Therefore, the observer of the graph (hereinafter simply referred to as the observer) was the target of determining which condition the attribute satisfies when selecting the learning model used to derive the estimation result. Can be recognized. In other words, the observer can recognize the condition that causes the learning model selection result. As a result, for example, when the accuracy of the estimation result derived using the learning model is low, the selection model can be reviewed based on the factor by which the learning model is selected.
- the display means 4 changes the type of symbol representing the estimation result according to the learning model corresponding to the estimation result. Therefore, the observer can recognize which learning model was selected when the estimation result was derived.
- the axis corresponding to the estimation result is the horizontal axis
- the axis corresponding to the actual measurement value is the vertical axis.
- the learning model corresponding to the estimation data is not necessarily the learning model selected by the estimator 12.
- an analyst may manually select a learning model corresponding to the estimation data.
- the estimation result and information representing the learning model used when deriving the estimation result may be manually associated with each other. This is the same in other embodiments.
- FIG. FIG. 8 is a block diagram illustrating a configuration example of an estimation result display system according to the second embodiment of this invention.
- the estimation result display system 1 according to the second embodiment includes an input unit 2, a condition specifying unit 3, a display unit 4, and a cursor operation unit 7. Explanation of matters similar to those in the first embodiment will be omitted as appropriate.
- the input unit 2 is the same as the input unit 2 in the first embodiment. As in the first embodiment, the input unit 2 is selected by the estimator 12 according to the determination result of whether or not one or more attributes in the estimation data satisfy one or more conditions.
- a plurality of sets of information (estimation result data) in which information representing a learning model, an estimation result derived from the learning model, the estimation data, and an actual measurement value are associated with each other are input.
- the estimation result is calculated as a value will be described as an example. Therefore, the estimation result may be referred to as an estimated value.
- the selection model used when the estimator 12 selects a learning model is input to the input means 2.
- the estimation result display system 1 may store the selected model once input in a storage device (not shown in FIG. 8).
- the display data for the selected model may not be input to the input unit 2. This is because the tree structure graph 41 (see FIG. 6) need not be displayed in the present embodiment.
- the condition specifying unit 3 is the same as the condition specifying unit 3 in the first embodiment. However, in the second embodiment, the condition specifying unit 3 not only specifies the condition that is a determination target of whether or not the attribute in the estimation data is satisfied when the learning model is selected, It is preferable to determine whether or not the attribute satisfies the condition.
- the condition specifying unit 3 determines whether or not the attribute satisfies the specified condition will be described as an example.
- Cursor operation means 7 is a device for the observer to operate the cursor in the graph display screen.
- the cursor operation means 7 is a pointing device such as a mouse, a touch pad, a joystick, or a trackball.
- the display means 4 displays a scatter diagram in which the estimation results are represented by symbols. At this time, the display means 4 changes the type of the symbol according to the learning model.
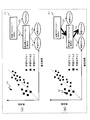
- FIG. 9 is a schematic diagram illustrating an example of a graph (scatter diagram in this embodiment) displayed by the display unit 4 in the second embodiment.
- FIG. 9A shows a scatter diagram in the displayed initial state.
- FIG. 9B shows a graph when a symbol representing an estimation result is point-and-clicked.
- the display means 4 displays, for example, a scatter diagram in which the axis corresponding to the estimation result is the horizontal axis and the axis corresponding to the actual measurement value is the vertical axis. At this time, the display means 4 arranges the symbols representing the estimation results in the scatter diagram so that the estimation results are the coordinates in the horizontal axis direction and the actual measurement values corresponding to the estimation results are the coordinates in the vertical axis direction. To do. Further, the type of symbol representing the estimation result is changed according to the learning model corresponding to the estimation result. This point is the same as in the first embodiment.
- the display means 4 displays a cursor 31 together with a scatter diagram.
- An initial state in which the cursor 31 is displayed together with the scatter diagram is illustrated in FIG.
- the display unit 4 changes the display position of the cursor 31 according to the movement of the cursor operation unit 7 operated by the observer.
- the display means 4 displays the attribute in the estimation data when the learning model corresponding to the estimation result indicated by the symbol is selected.
- the condition that is a target for determining whether or not the condition is satisfied is displayed on the scatter diagram.
- the display state of the scatter diagram at this time is illustrated in FIG. In the present embodiment, an example will be described in which the display unit 4 also displays a determination result as to whether or not an attribute satisfies the condition.
- the display means 4 satisfies the attribute in the estimation data when the learning model corresponding to the estimation result indicated by the symbol is selected.
- a description will be given by taking as an example the case of displaying the condition that has been a determination target of whether or not there is.
- the display unit 4 determines whether or not the attribute in the estimation data is satisfied when the learning model corresponding to the estimation result indicated by the symbol is selected. You may display the condition which became. This point is the same in other embodiments.
- FIG. 10 is a flowchart illustrating an example of processing progress of the second embodiment.
- the input means 2 includes a plurality of sets of information in which information representing a learning model, an estimation result derived from the learning model, estimation data used when selecting the learning model, and measured values are associated with each other, Input (step S11). For each set, the input unit 2 sends information indicating the learning model, an estimation result, and an actual measurement value to the display unit 4, and sends estimation data to the condition specifying unit 3.
- step S1 the selected model is also input to the input means 2.
- the estimation result display system 1 stores the selected model in a storage device (not shown in FIG. 8).
- the condition specifying unit 3 determines whether or not all sets of estimation data have been selected (step S12). If there remains a set for which estimation data is not selected (No in step S12), the condition specifying unit 3 selects one set of estimation data from the set (step S13). Steps S12 and S13 are the same as steps S2 and S3 in the first embodiment.
- the condition specifying means 3 uses the estimation data selected in step S13 and the selected model, and the attribute in the estimation data satisfies when the learning model corresponding to the estimation data is selected by the estimator 12.
- a condition that is a determination target of whether or not the image is determined is specified (step S14).
- the condition specifying means 3 also determines whether or not the attribute satisfies the specified condition.
- the operation in step S14 is the same as the operation in step S4 in the first embodiment. However, in the present embodiment, the condition specifying unit 3 sends the specified condition and the determination result as to whether or not the attribute satisfies the condition to the display unit 4.
- step S14 the process proceeds to step S12.
- step S12 the display unit 4 displays the symbol representing the estimation result, the estimation result becomes the coordinate in the horizontal axis direction, and the actual measurement corresponding to the estimation result.
- a scatter diagram is displayed so that the values are coordinate values in the vertical axis direction.
- the display unit 4 changes the type of the symbol representing the estimation result according to the learning model corresponding to the estimation result (step S15).
- the display unit 4 displays a cursor 31.
- step S15 the screen illustrated in FIG. 9A is displayed.
- step S16 the display means 4 determines whether or not any symbol in the scatter diagram has been pointed and clicked. If no symbol is point-and-clicked (No in step S16), the determination in step S16 is repeated.
- step S16 When any symbol is point-and-clicked (Yes in step S16), the display unit 4 satisfies the attribute in the estimation data when the learning model corresponding to the estimation result indicated by the symbol is selected. And the determination result of whether or not the attribute satisfies the condition are displayed (step S17).
- step S17 the screen illustrated in FIG. 9B is displayed.
- the display unit 4 displays information that “the learning model 2 is selected by satisfying the condition B without satisfying the condition A”. From such a display, the observer can recognize that the conditions A and B are the determination targets and that the attribute in the estimation data does not satisfy the condition A but satisfies the condition B.
- step S17 when the cursor 31 moves away from the symbol, the display unit 4 may repeat the operations after step S16.
- condition specifying unit 3 executes steps S13 and S14 for each set of associated information before displaying a scatter diagram.
- the condition specifying unit 3 selects the estimation data corresponding to the estimation result represented by the symbol, and after performing the same processing as step S14, the display unit 4 May execute step S17.
- This also applies to other embodiments that display information when a symbol is pointed and clicked or when an on-cursor state is entered.
- the display unit 4 displays the attribute in the estimation data when the learning model corresponding to the estimation result indicated by the symbol is selected.
- a condition that is a determination target of whether or not the condition is satisfied and a determination result of whether or not the attribute satisfies the condition are displayed. Therefore, the observer can recognize which condition was the target for determining whether or not the attribute is satisfied when selecting the learning model used for deriving the estimation result. It can be recognized whether or not the condition is satisfied. Therefore, as in the first embodiment, the observer can recognize a condition that causes a learning model selection result.
- the observer can recognize which learning model has been selected when deriving the estimation result.
- the observer can recognize the selected learning model with low estimation accuracy.
- FIG. 8 The estimation result display system according to the third embodiment of the present invention can be represented by the block diagram shown in FIG. 8 as with the estimation result display system according to the second embodiment. An embodiment will be described. A description of the same matters as in the second embodiment will be omitted as appropriate.
- the estimation result display system 1 includes an input unit 2, a condition specifying unit 3, a display unit 4, and a cursor operation unit 7 (see FIG. 8).
- the information input to the input unit 2 in the third embodiment is the same as the information input to the input unit 2 in the first embodiment.
- condition specifying means 3 selects one of the two child nodes from the root node of the selected model as a starting point depending on whether or not the attribute in the estimation data satisfies the condition indicated by the node. Repeat until the leaf node corresponding to the learning model arrives.
- the condition specifying means 3 specifies the route from the root node to the leaf node in the tree structure graph 41 by this processing. Nodes other than the leaf nodes on this route are nodes corresponding to the condition regarding the attribute in the estimation data. Therefore, specifying the route as described above specifies the condition that is a determination target whether or not the attribute is satisfied when the learning model corresponding to the leaf node is selected by the estimator 12. I can say that.
- the display means 4 displays a scatter diagram in which the estimation results are represented by symbols. At this time, the display means 4 changes the type of the symbol according to the learning model.
- the display unit 4 also displays a tree structure graph 41 (see FIG. 11) based on the display data for the selected model.
- FIG. 11 is a schematic diagram illustrating an example of a graph displayed by the display unit 4 in the third embodiment.
- FIG. 11A shows a graph in the displayed initial state.
- FIG. 11B shows a graph when a symbol representing an estimation result is point-and-clicked.
- the display means 4 displays, for example, a scatter diagram in which the axis corresponding to the estimation result is the horizontal axis and the axis corresponding to the actual measurement value is the vertical axis. At this time, the display means 4 arranges the symbols representing the estimation results in the scatter diagram so that the estimation results are the coordinates in the horizontal axis direction and the actual measurement values corresponding to the estimation results are the coordinates in the vertical axis direction. To do. Further, the type of symbol representing the estimation result is changed according to the learning model corresponding to the estimation result. This point is the same as in the first embodiment.
- the display means 4 also displays a tree structure graph 41 based on the display data of the selected model.
- the display unit 4 does not need to display the nodes corresponding to the conditions in the tree structure graph 41 in individual colors or patterns (see FIG. 11).
- the display means 4 also displays a cursor 31.
- FIG. 11A illustrates an initial state in which the scatter diagram, the tree structure graph 41, and the cursor 31 are displayed.
- the display unit 4 changes the display position of the cursor 31 according to the movement of the cursor operation unit 7 operated by the observer.
- the display unit 4 displays the tree structure specified by the condition specifying unit 3 based on the estimation data corresponding to the estimation result indicated by the symbol.
- the route on the graph 41 is highlighted.
- the display state at this time is illustrated in FIG.
- FIG. 12 is a flowchart illustrating an example of processing progress of the third embodiment. Steps S1 to S3 are the same as steps S1 to S3 in the first embodiment.
- the condition specifying means 3 specifies the path on the tree structure graph 41 using the estimation data selected in step S3 and the selected model (step S24).
- the condition specifying means 3 learns to select one of the two child nodes from the root node of the selection model as a starting point depending on whether the attribute in the estimation data satisfies the condition indicated by the node.
- a route on the tree structure graph 41 is specified by repeating until the leaf node corresponding to the model is reached.
- step S14 the process proceeds to step S2.
- step S2 When all sets of estimation data have been selected (Yes in step S2), the display unit 4 displays the symbol representing the estimation result, the estimation result becomes the coordinate in the horizontal axis direction, and the actual measurement corresponding to the estimation result. A scatter diagram is displayed so that the values are coordinate values in the vertical axis direction. At this time, the display unit 4 changes the type of the symbol representing the estimation result according to the learning model corresponding to the estimation result.
- the display unit 4 displays the tree structure graph 41 based on the display data of the selected model (step S25).
- the display means 4 also displays a cursor 31. In step S25, the screen illustrated in FIG. 11A is displayed.
- step S26 the display means 4 determines whether or not any symbol in the scatter diagram has been pointed and clicked. If no symbol is point-and-clicked (No in step S26), the determination in step S26 is repeated.
- step S26 When any symbol is point-and-clicked (Yes in step S26), the display unit 4 displays the path specified based on the estimation data corresponding to the estimation result indicated by the symbol on the tree structure graph 41. Highlighted above (step S27). In step S27, the screen illustrated in FIG. 11B is displayed. FIG. 11B shows an example in which the route is highlighted by thickening the link connecting the nodes, but the method for highlighting the route on the tree structure graph 41 is not particularly limited.
- step S27 when the cursor 31 moves away from the symbol, the display unit 4 may stop highlighting the route on the tree structure graph 41 and repeat the operations after step S26.
- step S26 the display unit 4 may determine whether any symbol is in the on-cursor state, and may proceed to step S27 when any symbol is in the on-cursor state.
- the nodes other than the leaf nodes on the route highlighted in step S27 are nodes corresponding to the condition regarding the attribute in the estimation data. Accordingly, the display unit 4 highlights the route in step S27, thereby determining whether or not the attribute in the estimation data is satisfied when the learning model from which the estimation result is derived is selected by the estimator 12. It can be said that the target condition is displayed. For example, in the example shown in FIG. 11B, when the learning model 2 from which the estimation result indicated by the point-and-click symbol is derived is selected, whether the attribute in the estimation data satisfies the condition A or not. It can also be seen that it has been determined whether or not the attribute in the estimation data satisfies the condition B. Therefore, the observer can recognize which condition is a determination target as to whether or not the attribute is satisfied when the learning model used for deriving the estimation result is selected. Therefore, the observer can recognize the condition that causes the learning model selection result.
- the observer can recognize which learning model has been selected when deriving the estimation result.
- the observer can recognize the selected learning model with low estimation accuracy.
- Embodiment 4 FIG.
- the estimation result display system according to the fourth embodiment of the present invention can be represented by the block diagram shown in FIG. 8 as in the estimation result display system according to the second embodiment. An embodiment will be described.
- the estimation result display system 1 includes an input unit 2, a condition specifying unit 3, a display unit 4, and a cursor operation unit 7 (see FIG. 8).
- the information input to the input unit 2 in the fourth embodiment is the same as the information input to the input unit 2 in the first embodiment.
- the display data for the selected model conditions for attributes in the estimation data are assigned to a plurality of axes, and a learning model corresponding to the conditions is placed in a space defined by the axes.
- the represented data is entered.
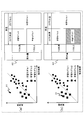
- FIG. 13 is an explanatory diagram illustrating an example of a selection model displayed based on such display data for the selection model.
- the selection model shown in FIG. 13 represents the same content as the selection model of the tree structure shown in FIG.
- conditions are assigned to two axes. Specifically, condition A (condition that the temperature is 20 ° C. or more) is assigned to the horizontal axis, and condition B (condition that the precipitation is 10 mm / h or more) is assigned to the vertical axis.
- the horizontal axis is divided into a range satisfying the condition A (range of 20 ° C. or higher) and a range not satisfied (less than 20 ° C.).
- the vertical axis is divided into a range satisfying the condition B (range of 10 mm / h or more) and a range not satisfying (range of less than 10 mm / h).
- the learning model 2 is selected regardless of whether other conditions are satisfied. Therefore, it is predetermined in the display data for the selection model that the space (region) defined by the range of the horizontal axis that satisfies the condition A corresponds to the learning model 1.
- the learning model 1 is selected. Therefore, it is predetermined in the display data of the selection model that the space (region) defined by the horizontal axis range that does not satisfy the condition A and the vertical axis range that satisfies the condition B corresponds to the learning model 2. .
- the learning model 3 is selected. Therefore, it is predetermined in the display data of the selection model that the space (region) defined by the range of the horizontal axis not satisfying the condition A and the range of the vertical axis not satisfying the condition B corresponds to the learning model 3. Yes.
- FIG. 13 a diagram representing the selection model is displayed as illustrated in FIG.
- the diagram shown in FIG. 13 is referred to as a selection model diagram.
- the case where one condition is assigned to each of the horizontal axis and the vertical axis is illustrated, but a plurality of conditions may be assigned to one axis. Further, the number of axes constituting the selection model diagram may be three.
- condition specifying unit 3 specifies a condition that is a determination target of whether or not the attribute in the estimation data is satisfied when the learning model is selected, and whether or not the attribute satisfies the condition. Determine whether.
- the display means 4 displays a scatter diagram in which the estimation results are represented by symbols. At this time, the display means 4 changes the type of the symbol according to the learning model.
- the display unit 4 also displays a selected model diagram based on the display data for the selected model.
- FIG. 14 is a schematic diagram showing an example of a graph displayed by the display means 4 in the fourth embodiment.
- FIG. 14A shows a graph in the displayed initial state.
- FIG. 14B shows a graph when the symbol representing the estimation result is point-and-clicked.
- the display means 4 displays, for example, a scatter diagram in which the axis corresponding to the estimation result is the horizontal axis and the axis corresponding to the actual measurement value is the vertical axis. At this time, the display means 4 arranges the symbols representing the estimation results in the scatter diagram so that the estimation results are the coordinates in the horizontal axis direction and the actual measurement values corresponding to the estimation results are the coordinates in the vertical axis direction. To do. Further, the type of symbol representing the estimation result is changed according to the learning model corresponding to the estimation result. This point is the same as in the first embodiment.
- the display means 4 also displays the selected model diagram 42 based on the display data for the selected model.
- the display means 4 also displays a cursor 31.
- FIG. 14A illustrates an initial state in which the scatter diagram, the selected model diagram 42, and the cursor 31 are displayed.
- the display unit 4 changes the display position of the cursor 31 according to the movement of the cursor operation unit 7 operated by the observer. Then, when any symbol in the scatter diagram is point-and-clicked, the display means 4 determines the result of determination by the condition specifying means 3 based on the estimation data corresponding to the estimation result indicated by the symbol ( The region in the selection model diagram 42 determined by the condition and whether or not the attribute in the estimation data satisfies the condition is highlighted. The display state at this time is illustrated in FIG.
- FIG. 15 is a flowchart illustrating an example of processing progress of the fourth embodiment.
- the input means 2 includes a plurality of pieces of information in which information representing a learning model, an estimation result derived from the learning model, estimation data used at the time of selecting the learning model, and an actual measurement value are associated with each other.
- the set is input (step S1).
- the input unit 2 sends information indicating the learning model, an estimation result, and an actual measurement value to the display unit 4, and sends estimation data to the condition specifying unit 3.
- step S1 the selected model and display data for the selected model are also input to the input means 2.
- the estimation result display system 1 stores the selected model and display data for the selected model in a storage device (not shown in FIG. 8).
- step S1 in the present embodiment as display data for the selected model, conditions for attributes in the estimation data are assigned to a plurality of axes, and a learning model corresponding to the conditions is displayed in a space defined by the axes. This is the same as step S ⁇ b> 1 in the first embodiment, except that the input data (selection model display data in the format illustrated in FIG. 13) is input.
- the display data for the selected model is data for displaying the selected model diagram 42, and the selected model may be the same as that in the first embodiment.
- the selection model may be a tree structure model. Data for displaying the selection model of the tree structure as a selection model diagram 42 is input as display data for the selection model.
- condition specifying means 3 determines whether or not all sets of estimation data have been selected (step S2). If there remains a set for which estimation data is not selected (No in step S2), the condition specifying unit 3 selects one set of estimation data from the set (step S3).
- the condition specifying means 3 uses the estimation data selected in step S3 and the selection model, and the attribute in the estimation data is satisfied when the learning model corresponding to the estimation data is selected by the estimator 12.
- the condition that is the target for determining whether or not it is present is identified (step S34).
- the condition specifying unit 3 also determines whether the attribute satisfies the condition.
- the condition specifying means 3 starts from the root node of the selected model as a starting point and selects one of the two child nodes depending on whether or not the attribute in the estimation data satisfies the condition indicated by the node. Step S34 may be executed by repeating until it arrives at.
- estimation data including attributes of “temperature 18 ° C.” and “precipitation 15 mm / h” is selected in step S3. Further, it is assumed that the selection model illustrated in FIG. 2 is input. In this case, the condition specifying means 3 specifies conditions A and B, and obtains a determination result that “temperature 18 ° C.” does not satisfy condition A and “precipitation 15 mm / h” satisfies condition B.
- the condition specifying unit 3 sends the specified condition and the determination result of whether or not the attribute satisfies the condition to the display unit 4.
- step S34 the process proceeds to step S2.
- step S2 When all sets of estimation data have been selected (Yes in step S2), the display unit 4 displays the symbol representing the estimation result, the estimation result becomes the coordinate in the horizontal axis direction, and the actual measurement corresponding to the estimation result. A scatter diagram is displayed so that the values are coordinate values in the vertical axis direction. At this time, the display unit 4 changes the type of the symbol representing the estimation result according to the learning model corresponding to the estimation result.
- the display unit 4 displays the selected model diagram 42 based on the display data for the selected model (step S35).
- the display means 4 also displays a cursor 31. In step S35, the image illustrated in FIG. 14A is displayed.
- step S36 the display means 4 determines whether or not any symbol in the scatter diagram has been point-and-clicked. If no symbol is point-and-clicked (No in step S36), the determination in step S36 is repeated.
- step S36 When any symbol is point-and-clicked (Yes in step S36), the display means 4 is based on the result of step S34 executed using the estimation data corresponding to the estimation result indicated by the symbol. A region in the selected model diagram 42 to be determined is highlighted (step S37). Specifically, the display unit 4 determines, for each condition specified in step S34, the determination result in step S34 (whether the attribute in the estimation data satisfies the condition) on the axis to which the condition is assigned. The range corresponding to is specified. The display unit 4 identifies a region including a portion where the ranges overlap among the divided regions in the selected model diagram 42, and highlights the region.
- condition A the display unit 4 specifies a range that does not satisfy the condition A on the horizontal axis (a range below 20 ° C.).
- the display unit 4 specifies a range (range of 10 mm / h or more) that satisfies the condition B on the vertical axis.
- FIG. 14B shows an example in which a background pattern (or color) may be added to the area corresponding to the learning model 2 to highlight the area.
- the highlighting method in step S37 may be another method.
- step S37 when the cursor 31 moves away from the symbol, the display means 4 may stop highlighting the area in the selected model diagram 42 and repeat the operations after step S36.
- step S36 the display unit 4 may determine whether any symbol is in the on-cursor state, and may proceed to step S37 when any symbol is in the on-cursor state.
- the region highlighted in step S37 corresponds to a range that satisfies or does not satisfy the condition in each axis.
- the region corresponding to the learning model 1 is a range on the vertical axis that satisfies the condition B (range of 10 mm / h or more) and a range that does not satisfy the condition B (range of less than 10 mm / h). Straddling. This means that it was not determined whether or not the attribute in the estimation data satisfies the condition B when the learning model 1 was selected.
- the observer can recognize which condition was the target for determining whether or not the attribute in the estimation data is satisfied when selecting the learning model used to derive the estimation result, It can be recognized whether or not the attribute satisfies the condition. Therefore, the observer can recognize the condition that causes the learning model selection result.
- the observer can recognize which learning model has been selected when deriving the estimation result.
- the observer can recognize the selected learning model with low estimation accuracy.
- the axis of the scatter diagram is not limited to the example shown in FIG.
- the two axes may correspond to attributes in the estimation data.
- the estimator 12 selects a learning model using at least a measured value of the traffic volume of the vehicle and a measured value of the NOx concentration in the air among the attributes included in the estimation data, Assume that it is estimated (discriminated) whether the measurement point of traffic volume and NOx concentration is “urban” or “countryside”.
- the display means 4 may display a scatter diagram having an axis corresponding to the traffic volume of the vehicle and an axis corresponding to the NOx concentration in the air.
- the manner in which the display unit 4 determines the symbols in the scatter diagram is, for example, that the display unit 4 determines the symbols according to the determination result (city or country), and also according to the learning model used for the determination.
- a symbol may be defined.
- the display unit 4 may change the shape of the symbol according to the determination result (city or country), and change the color or line type according to the learning model used for the determination.
- FIG. 31 is a diagram showing a specific example of such a display mode.
- FIG. 5 The estimation result display system according to the fifth embodiment of the present invention can be represented by the block diagram shown in FIG. 8 as in the estimation result display system according to the second embodiment. An embodiment will be described.
- the estimation result display system 1 of the fifth embodiment includes an input means 2, a condition specifying means 3, a display means 4, and a cursor operation means 7 (see FIG. 8).
- the input means 2 includes information representing a learning model selected by the estimator 12 according to a determination result as to whether or not one or more attributes in the estimation data satisfy one or more conditions, and learning A plurality of sets of information (estimation result data) in which the estimation result derived by the model is associated with the estimation data are input.
- the estimation result may be referred to as an estimated value.
- the information on the actual measurement value may not be included in each group. In this embodiment, in order to simplify the description, a case where information of actual measurement values is not input will be described as an example.
- the selection model used when the estimator 12 selects a learning model is input to the input means 2.
- the estimation result display system 1 may store the selected model once input in a storage device (not shown in FIG. 8).
- the display data for the selected model may not be input to the input unit 2. This is because the tree structure graph 41 (see FIG. 6 and the like) and the selection model diagram 42 (see FIG. 14) need not be displayed in the present embodiment.
- the condition specifying unit 3 is the same as the condition specifying unit 3 in the second embodiment.
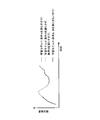
- the display unit 4 includes a first graph 71 in which symbols representing estimation results are arranged in a predetermined order, and a second graph in which symbols representing learning models corresponding to the estimation results are arranged in a predetermined order. 72 is displayed.
- the first graph 71 is a graph showing a change in the estimation result
- the second graph 72 is a graph showing a change in the selected learning model.
- FIG. 16 is a schematic diagram illustrating an example of an initial state of a graph displayed by the display unit 4 in the fifth embodiment.
- the horizontal axis of the first graph 71 and the horizontal axis of the second graph 72 are axes representing the order of sets in which information indicating learning models, estimation results, and the like are associated.
- FIG. 16 illustrates a case where this order is represented by time, and the horizontal axis of the first graph 71 and the horizontal axis of the second graph 72 each represent time.
- the time information corresponding to the information indicating the learning model input to the input unit 2 and the estimation result may be added.
- a set (estimation result data) of information representing a learning model, an estimation result, and information in which estimation data is associated may be input to the input unit 2 in order of time corresponding to the estimation result.
- the horizontal axis of the first graph 71 and the horizontal axis of the second graph 72 may not be axes representing time, but may be axes representing the input order of estimation result data, for example.
- the vertical axis of the first graph 71 is an axis corresponding to the estimation result.
- the vertical axis of the second graph 72 is an axis corresponding to the type of learning model, and has each piece of identification information of the learning model as coordinates.
- the display means 4 displays a first graph 71 in which the symbols representing the estimation results are arranged in a predetermined order (in this example, the order of times corresponding to the estimation results). More specifically, the display unit 4 calculates each symbol representing the estimation result as a value while arranging the symbols in a predetermined order (in this example, the order of time corresponding to the estimation result) along the horizontal axis. It arrange
- the display unit 4 uses the symbol representing the estimation result as the x coordinate (coordinate in the horizontal axis) as the order of the estimation result (for example, the order represented by the time), and the estimation result as the y coordinate ( It is arranged at a position to be the coordinate in the vertical axis direction).
- the type of each symbol representing the estimation result may be common.
- the display means 4 also displays a second graph 72 in which symbols representing the learning model are arranged in the same predetermined order as described above. More specifically, the display unit 4 arranges the symbols representing the learning model in the same predetermined order as described above along the horizontal axis, and the information representing the learning model (that is, identification information) is the coordinate in the vertical axis direction. It arrange
- the display unit 4 arranges the symbol representing the estimation result and the symbol representing the learning model corresponding to the estimation result at the common x-coordinate position. It is preferable that the display unit 4 displays the first graph 71 and the second graph 72 side by side so that the observer can easily recognize the correspondence between symbols having the same x coordinate.
- FIG. 16 exemplifies a case where the interval between symbols is short and the arrangement of symbols is recognized as a line in the first graph 71 and the second graph 72.
- the display unit 4 displays the attribute in the estimation data when the learning model corresponding to the estimation result indicated by the symbol is selected. Displays the condition that was the target for determining whether or not the condition is satisfied. In the present embodiment, an example will be described in which the display unit 4 also displays a determination result as to whether or not the attribute in the estimation data satisfies the condition.
- FIG. 17 shows an example of a display state when a symbol in the second graph 72 is point-and-cooked.
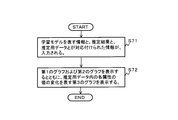
- FIG. 18 is a flowchart illustrating an example of processing progress of the fifth embodiment.
- a plurality of sets of information in which the information representing the learning model, the estimation result derived from the learning model, and the estimation data used when selecting the learning model are associated are input to the input unit 2 (Ste S41).
- the input unit 2 sends information indicating the learning model and the estimation result to the display unit 4, and sends estimation data to the condition specifying unit 3.
- step S41 the selection model is also input to the input means 2.
- the estimation result display system 1 stores the selected model in a storage device (not shown in FIG. 8).
- condition specifying means 3 determines whether or not all sets of estimation data have been selected (step S42). If there remains a set for which estimation data is not selected (No in step S42), the condition specifying unit 3 selects one set of estimation data from the set (step S43).
- the condition specifying means 3 uses the estimation data selected in step S43 and the selection model, and the attribute in the estimation data satisfies when the learning model corresponding to the estimation data is selected by the estimator 12.
- the condition that has been the target for determining whether or not it is present is identified (step S44).
- the condition specifying means 3 also determines whether or not the attribute satisfies the specified condition.
- the condition specifying unit 3 sends the specified condition and the determination result as to whether or not the attribute satisfies the condition to the display unit 4.
- Steps S41 to S44 are the same as steps S11 to S14 in the second embodiment.
- step S44 the process proceeds to step S42.
- step S42 the display unit 4 arranges the symbols representing the estimation results in a predetermined order along the horizontal axis, and the estimation results are displayed on the vertical axis.
- a first graph 71 arranged so as to have the direction coordinates is displayed.
- the display unit 4 also includes a second graph 72 in which symbols representing the learning model are arranged in a predetermined order along the horizontal axis so that the information representing the learning model has coordinates in the vertical axis direction. 1 is displayed together with the graph 71 (step S45).
- the display unit 4 displays a cursor 31. In step S45, the screen illustrated in FIG. 16 is displayed.
- step S46 the display means 4 determines whether or not any symbol in the second graph 72 has been pointed and clicked. If no symbol in the second graph 72 is pointed and clicked (No in step S46), the determination in step S46 is repeated.
- step S46 When any symbol in the second graph 72 is point-and-clicked (Yes in step S46), the display unit 4 displays the attribute in the estimation data when the learning model indicated by the symbol is selected.
- the condition for determining whether or not the condition is satisfied and the determination result as to whether or not the attribute satisfies the condition are displayed (step S47).
- step S47 the screen illustrated in FIG. 17 is displayed. In the example shown in FIG. 17, the information “select learning model 2 when condition A is not satisfied and condition B is satisfied” is displayed.
- step S47 when the cursor 31 moves away from the symbol, the display unit 4 may repeat the operations after step S46.
- step S46 the display unit 4 may determine whether any symbol is in an on-cursor state, and may proceed to step S47 when any symbol is in an on-cursor state.
- the display unit 4 displays the data in the estimation data when the learning model indicated by the symbol is selected.
- a condition that is a determination target of whether or not the attribute is satisfied and a determination result of whether or not the attribute satisfies the condition are displayed. Therefore, the observer can recognize which condition was the target for determining whether or not the attribute in the estimation data is satisfied when selecting the learning model used to derive the estimation result, It can also be recognized whether or not the attribute satisfies the condition. Therefore, the observer can recognize the condition that causes the learning model selection result.
- the display means 4 displays the first graph 71 and the second graph 72 so that the x coordinates of the corresponding symbols are common. Therefore, the observer can recognize which learning model has been selected when the estimation result is derived.
- Embodiment 6 In the fifth embodiment, by displaying the first graph 71 and the second graph 72, the observer recognizes which learning model has been selected when the estimation result is derived. In the sixth embodiment, the observer recognizes which learning model has been selected when deriving the estimation result using one graph.
- estimation result display system according to the sixth embodiment of the present invention can be represented by the block diagram shown in FIG. 8 similarly to the estimation result display system according to the second embodiment, the sixth result using FIG. An embodiment will be described.
- the estimation result display system 1 of the sixth embodiment includes an input unit 2, a condition specifying unit 3, a display unit 4, and a cursor operation unit 7 (see FIG. 8).
- the input unit 2 and the condition specifying unit 3 are the same as the input unit 2 and the condition specifying unit 3 in the fifth embodiment.
- the display means 4 is a graph that represents the estimation result as a symbol, and displays a graph in which the symbol type is changed according to the learning model corresponding to the estimation result.
- FIG. 19 is a schematic diagram illustrating an example of a graph displayed by the display unit 4 in the sixth embodiment.
- FIG. 19A shows a graph in the displayed initial state.
- FIG. 19B shows a graph when the symbol representing the estimation result is point-and-clicked.
- the horizontal axis of the graph displayed in the present embodiment is an axis representing the order of estimation results.
- FIG. 19 illustrates a case where the horizontal axis of the graph represents time. In this case, it suffices if information on the corresponding time is added to the estimation result input to the input unit 2.
- a set (estimation result data) of information representing a learning model, an estimation result, and information in which estimation data is associated may be input to the input unit 2 in order of time corresponding to the estimation result.
- the horizontal axis of the graph may not be an axis representing time, but may be an axis representing the input order of estimation result data, for example.
- the display means 4 displays a graph in which symbols representing the estimation results are arranged in a predetermined order (in this example, the order of times corresponding to the estimation results). More specifically, the display unit 4 calculates each symbol representing the estimation result as a value while arranging the symbols in a predetermined order (in this example, the order of time corresponding to the estimation result) along the horizontal axis. It arrange
- the display unit 4 uses the symbol representing the estimation result as the x coordinate (coordinate in the horizontal axis) as the order of the estimation result (for example, the order represented by the time), and the estimation result as the y coordinate ( It is arranged at a position to be the coordinate in the vertical axis direction). If the interval between symbols is short, the symbol sequence is recognized as a line.
- FIG. 19 illustrates a case where the interval between symbols is short and the arrangement of symbols is recognized as a line. In this case, the operation of the display unit 4 can also be expressed as displaying a line graph representing the transition of the estimation result.
- the display means 4 changes the type of the symbol representing the estimation result according to the learning model corresponding to the estimation result. That is, the display unit 4 represents a symbol representing an estimation result derived using the learning model 1, a symbol representing an estimation result derived using the learning model 2, and an estimation result derived using the learning model 3. Different symbols are arranged in the graph as symbols or the like. The same applies when there are more types of learning models selected when the estimation result is derived.
- the display unit 4 displays a line graph representing the transition of the estimation result
- the display unit 4 displays a graph in which the line attribute is changed according to the learning model corresponding to the estimation result.
- the display means 4 may change the color of the symbol or the shape of the symbol, for example, when changing the type of the symbol depending on the type of the learning model.
- the method of changing the symbol type is not particularly limited.
- the line attributes include, for example, the color of the line, the thickness of the line, the type of the line (for example, a solid line, a dotted line, a one-dot chain line, etc. ) Line appearance.
- Line attributes are not limited to line appearance.
- the display unit 4 in response to the operation of a line such as a point-and-click, the display unit 4 displays information indicating a learning model corresponding to the line. Also good.
- the display unit 4 displays when the learning model corresponding to the estimation result indicated by the symbol is selected. Displays the condition that was the target of determining whether the attribute is satisfied. The display state at this time is illustrated in FIG. In the present embodiment, an example will be described in which the display unit 4 also displays a determination result as to whether or not an attribute satisfies the condition.
- FIG. 20 is a flowchart illustrating an example of processing progress of the sixth embodiment. Steps S41 to S44 are the same as steps S41 to S44 in the fifth embodiment, and a description thereof will be omitted.
- step S42 When it is determined in step S42 that all sets of estimation data have been selected (Yes in step S42), the display unit 4 arranges the symbols representing the estimation results in a predetermined order along the horizontal axis. On the other hand, a graph is arranged so that each estimation result has a coordinate in the vertical axis direction, and a graph in which the type of symbol representing the estimation result is changed according to the learning model corresponding to the estimation result is displayed (step S55). ). The display unit 4 displays a cursor 31. In step S55, the screen illustrated in FIG. 19A is displayed.
- step S56 the display means 4 determines whether any symbol in the graph has been pointed and clicked. If no symbol is point-and-clicked (No in step S56), the determination in step S56 is repeated.
- step S56 When any symbol is point-and-clicked (Yes in step S56), the display unit 4 satisfies the attribute in the estimation data when the learning model corresponding to the estimation result indicated by the symbol is selected. And the determination result of whether or not the attribute satisfies the condition are displayed (step S57).
- step S57 the screen illustrated in FIG. 19B is displayed. In the example shown in FIG. 19B, information “select the learning model 2 when the condition A is not satisfied but the condition B is satisfied” is displayed.
- step S57 when the cursor 31 moves away from the symbol, the display unit 4 may repeat the operations after step S56.
- step S56 the display unit 4 may determine whether any symbol is in an on-cursor state, and may proceed to step S57 when any symbol is in an on-cursor state.
- the observer determines which condition satisfies the attribute in the estimation data when selecting the learning model used to derive the estimation result. It is possible to recognize whether or not the object is the target, and it is also possible to recognize whether or not the attribute satisfies the condition. Therefore, the observer can recognize the condition that causes the learning model selection result.
- the display unit 4 changes the type of symbol representing the estimation result according to the learning model corresponding to the estimation result. Therefore, the observer can recognize which learning model has been selected when the estimation result is derived.
- the display unit 4 displays information as illustrated in FIG. 19B when a symbol is pointed and clicked. This information may be displayed in a legend indicating the type of symbol.
- the display unit 4 may display the graph shown in FIG. 21 in step S55. In this case, the display unit 4 does not have to execute the processing after step S56 shown in FIG.
- the cursor operation means 7 may not be provided.
- Embodiment 7 FIG. In the seventh embodiment as well, the observer recognizes which learning model is selected when the estimation result is derived using one graph.
- estimation result display system according to the seventh embodiment of the present invention can be represented by the block diagram shown in FIG. 8 similarly to the estimation result display system according to the second embodiment, the seventh result is shown in FIG. An embodiment will be described.
- the estimation result display system 1 of the sixth embodiment includes an input unit 2, a condition specifying unit 3, a display unit 4, and a cursor operation unit 7 (see FIG. 8).
- the input unit 2 and the condition specifying unit 3 are the same as the input unit 2 and the condition specifying unit 3 in the fifth embodiment and the sixth embodiment.
- the display means 4 displays a graph representing the estimation result as a symbol.
- FIG. 22 is a schematic diagram illustrating an example of a graph displayed by the display unit 4 in the seventh embodiment.
- FIG. 22A shows a graph in the displayed initial state.
- FIG. 22B shows a graph when a symbol representing a fixed result is point-and-clicked.
- the horizontal axis of the graph displayed in the present embodiment is an axis representing the order of estimation results.
- FIG. 22 illustrates a case where the horizontal axis of the graph represents time. In this case, it suffices if information on the corresponding time is added to the estimation result input to the input unit 2.
- a set (estimation result data) of information representing a learning model, an estimation result, and information in which estimation data is associated may be input to the input unit 2 in order of time corresponding to the estimation result.
- the horizontal axis of the graph may not be an axis representing time, but may be an axis representing the input order of estimation result data, for example.
- the display means 4 displays a graph in which symbols representing the estimation results are arranged in a predetermined order (in this example, the order of times corresponding to the estimation results). More specifically, the display unit 4 calculates each symbol representing the estimation result as a value while arranging the symbols in a predetermined order (in this example, the order of time corresponding to the estimation result) along the horizontal axis. It arrange
- the display unit 4 uses the symbol representing the estimation result as the x coordinate (coordinate in the horizontal axis) as the order of the estimation result (for example, the order represented by the time), and the estimation result as the y coordinate ( It is arranged at a position to be the coordinate in the vertical axis direction). If the interval between symbols is short, the symbol sequence is recognized as a line. FIG. 22 illustrates a case where the interval between symbols is short and the arrangement of symbols is recognized as a line.
- the operation of the display unit 4 described here is the same as the operation of the display unit 4 in the sixth embodiment.
- the display unit 4 shares the types of all symbols.
- the display unit 4 displays the area in the graph in a divided manner according to the learning model corresponding to the estimation result indicated by the symbol. Hereinafter, this operation will be described.
- Symbols are arranged in the horizontal axis direction.
- the display unit 4 displays a boundary line perpendicular to the horizontal axis between the two symbols.
- a learning model corresponding to an estimation result indicated by a certain symbol (P) is “learning model 1”.
- the learning model corresponding to the estimation result indicated by the symbol (Q) following the symbol P is “learning model 2”.
- the display means 4 displays a boundary line perpendicular to the horizontal axis between the symbols P and Q.
- the boundary line is indicated by a broken line.
- the display means 4 may display a boundary line in the vicinity of the symbol that is the end point (see FIG. 22).
- Each symbol in the region sandwiched between two adjacent boundary lines represents an estimation result derived using a common learning model. Accordingly, each region between two adjacent boundary lines corresponds to one learning model.
- the display means 4 displays a region sandwiched between two adjacent boundary lines in a manner corresponding to the learning model corresponding to the region.
- the display unit 4 exemplifies a case where an identification number representing a learning model corresponding to the region is displayed in a region sandwiched between two adjacent boundary lines.
- the display unit 4 may display a region sandwiched between two adjacent boundary lines with a background color corresponding to the learning model corresponding to the region. For example, the display unit 4 sets the background color of the area corresponding to “learning model 1” to red or the background color of the area corresponding to “learning model 2” to blue, thereby learning corresponding to each area.
- a model may be presented.
- How to change the display mode of each area according to the type of learning model is not particularly limited.
- the display unit 4 displays the attribute in the estimation data when a learning model corresponding to the estimation result indicated by the symbol is selected. Displays the condition that was the target of determining whether or not The display state at this time is illustrated in FIG. In the present embodiment, an example will be described in which the display unit 4 also displays a determination result as to whether or not an attribute satisfies the condition.
- FIG. 23 is a flowchart illustrating an example of processing progress of the seventh embodiment. Steps S41 to S44 are the same as steps S41 to S44 in the fifth embodiment and the sixth embodiment, and a description thereof will be omitted.
- step S42 When it is determined in step S42 that all sets of estimation data have been selected (Yes in step S42), the display unit 4 arranges the symbols representing the estimation results in a predetermined order along the horizontal axis. Meanwhile, a graph arranged so that each estimation result is a coordinate in the vertical axis direction is displayed, and an area in the graph is divided and displayed according to a learning model corresponding to the estimation result indicated by the symbol (step S65). ). The display unit 4 displays a cursor 31. In step S65, the screen illustrated in FIG. 22A is displayed.
- step S57 whether or not the attribute in the estimation data is satisfied when the learning model corresponding to the estimation result indicated by the point-and-click symbol is selected together with the graph displayed in step S65.
- the condition that has been the determination target and the determination result of whether or not the attribute satisfies the condition are displayed.
- step S57 in the seventh embodiment a screen illustrated in FIG. 22B is displayed.
- step S57 when the cursor 31 moves away from the symbol, the display unit 4 may repeat the operations after step S56.
- step S56 the display unit 4 may determine whether any symbol is in an on-cursor state, and may proceed to step S57 when any symbol is in an on-cursor state.
- the observer when the observer selects the learning model used to derive the estimation result, which condition satisfies the attribute in the estimation data. It is possible to recognize whether or not the attribute has been determined, and also whether or not the attribute satisfies the condition. Therefore, the observer can recognize the condition that causes the learning model selection result.
- the display means 4 displays the area in the graph in a divided manner according to the learning model corresponding to the estimation result indicated by the symbol. Therefore, the observer can recognize which learning model has been selected when the estimation result represented by the symbol is derived.
- FIG. FIG. 24 is a block diagram illustrating a configuration example of an estimation result display system according to the eighth embodiment of this invention.
- the estimation result display system 1 according to the eighth embodiment includes an input unit 2 and a display unit 4.
- the input means 2 includes information representing a learning model selected by the estimator 12 according to a determination result as to whether or not one or more attributes in the estimation data satisfy one or more conditions, and learning A plurality of sets of information (estimation result data) in which the estimation result derived by the model is associated with the estimation data are input.
- the estimation result is calculated as a value will be described as an example. Therefore, the estimation result may be referred to as an estimated value.
- the estimation result display system 1 may store the selected model once input in a storage device (not shown in FIG. 24). In the present embodiment, a case where the selection model illustrated in FIG. 2 is input will be described as an example.
- the display means 4 is a graph that represents a change in the value of each attribute in the estimation data (similar to the first graph 71 and the second graph 72 in the fifth embodiment).
- the third graph is also displayed.
- FIG. 25 is a schematic diagram illustrating an example of a graph displayed by the display unit 4 in the eighth embodiment.
- the operation in which the display unit 4 displays the first graph 71 and the second graph 72 is the same as the operation in which the display unit 4 displays the first graph 71 and the second graph 72 in the fifth embodiment. The description is omitted.
- the third graph 73 is a graph representing a change in the value of each attribute in the estimation data.
- FIG. 25 illustrates an example in which estimation data including temperature and precipitation are input as attributes, and the display unit 4 displays a graph representing changes in temperature and precipitation as a third graph 73.
- FIG. 25 illustrates the case where the third graph 73 is represented in a heat map format represented by a color or pattern corresponding to the range to which the attribute value belongs.
- the horizontal axis of the third graph 73 is the same as the horizontal axis of the first graph 71 and the horizontal axis of the second graph 72. That is, the display unit 4 displays the symbol representing the estimation result, the symbol representing the learning model corresponding to the estimation result, and the x coordinate of the color or pattern representing the value of each attribute in the estimation data corresponding to the estimation result. Make common.
- FIG. 25 the case where the horizontal axis of each graph from 1st to 3 represents time is illustrated. As described in the fifth embodiment, the horizontal axis of each graph may not be an axis representing time.
- the display means 4 may display legends of colors and patterns used in the third graph 73.
- the display unit 4 refers to each node indicating a condition in the selected model, and uses a value used in the condition as one of a plurality of boundary values when the range of the attribute value is divided.
- the selection model illustrated in FIG. 2 includes a node indicating “condition that the temperature is 20 ° C. or higher”. Therefore, the display unit 4 uses 20 ° C. as one of a plurality of boundary values of the temperature range when the change in temperature is expressed in the heat map format in the third graph 73.
- the temperature range is divided into a range of less than 15 ° C., a range of 15 ° C. to less than 20 ° C., and a range of 20 ° C. or more, and “20 ° C.” is one of the boundary values. It is used as one.
- the display means 4 uses 10 mm / h as one of a plurality of boundary values in the precipitation range when the change in precipitation is expressed in the heat map format in the third graph 73.
- the precipitation range is divided into a range of 0 mm / h or more and less than 5 mm / h, a range of 5 mm / h or more and less than 10 mm / h, and a range of 10 mm / h or more.
- h is used as one of the boundary values.
- the display means 4 associates with the coordinate values of the vertical axis representing the type of learning model in the second graph 72, and the color according to the attribute range for selecting each type of learning model Alternatively, a pattern may be displayed.
- the display unit 4 may specify the attribute range for selecting the learning model of each type by tracing from each leaf node of the selection model to the root node.
- the attribute range for selecting the learning model 1 by tracing from the leaf node indicating the learning model 1 to the root node is “temperature 20 ° C. or higher”. Is identified. Then, the display unit 4 displays a color or pattern icon 75 representing “temperature 20 ° C. or higher” in the vicinity of the coordinate “1” on the vertical axis of the second graph 72.
- the display unit 4 has the attribute range for selecting the learning model 2 by tracing the leaf node representing the learning model 2 to the root node in the selection model shown in FIG. / H or higher ”and“ air temperature below 20 ° C. ”. Then, the display means 4 displays a color or pattern icon 76 representing “precipitation 10 mm / h or more” in the vicinity of the coordinate “2” on the vertical axis of the second graph 72. There are a plurality of colors or patterns corresponding to “temperature less than 20 ° C.”. In the example shown in FIG. 25, a case where a non-pattern white icon 77 is displayed as an icon indicating that the attribute range corresponds to a plurality of types of colors or patterns is illustrated.
- FIG. 26 is a flowchart illustrating an example of processing progress of the eighth embodiment.
- a plurality of sets of information in which the information representing the learning model, the estimation result derived from the learning model, and the estimation data used when selecting the learning model are associated are input to the input unit 2 (Ste S71).
- the input means 2 sends each set of input information to the display means 4.
- step S71 the selection model is also input to the input means 2.
- the estimation result display system 1 stores the selected model in a storage device (not shown in FIG. 24).
- the display means 4 displays the first graph 71 and the second graph 72, and also displays the third graph 73 representing the change in the value of each attribute in the estimation data (step S72).
- the operation of displaying the first graph 71 and the second graph 72 by the display unit 4 is the same as the operation of displaying the first graph 71 and the second graph 72 in the fifth embodiment.
- step S72 the screen illustrated in FIG. 25 is displayed.
- the display unit 4 does not have to display the cursor in step S72.
- the display unit 4 displays the third graph 73 by displaying a graph in the heat map format representing the color or pattern corresponding to the range to which the attribute value belongs for each type of attribute in the estimation data, Good.
- the third graph 73 may not be a heat map format graph.
- the third graph 73 may be a line graph indicating a change in attribute value.
- step S72 the display means 4 shares the horizontal axis of each of the first to third graphs. Moreover, it is preferable that the display means 4 displays each graph from 1st to 3rd in the upper stage, the middle stage, and the lower stage.
- the display means 4 refers to each node indicating a condition in the selected model, and uses a value used in the condition as one of boundary values when the range of the attribute value is divided. Since this point has already been described, the description thereof is omitted here.
- the display means 4 may display icons 75 to 77, etc. (see FIG. 25).
- the icons 75 to 77 associated with each coordinate value on the vertical axis representing the type of learning model need not be displayed.
- a value included in a condition such as “condition that the temperature is 20 ° C. or higher” may not be used as a boundary value when the range of attribute values is divided.
- the selection model may not be input to the input unit 2 in step S71.
- the display unit 4 may display a change in the value of the attribute on the third graph 73 for attributes other than the attribute used for selecting the learning model. This also applies to a modification of the present embodiment described later.
- a third graph 73 representing a change in the value of the attribute in the estimation data is represented. Therefore, the observer can observe the estimated value, the learning model used to derive the estimated value, and each attribute used when selecting the learning model in association with each other. Therefore, the observer can guess the tendency of the attribute when each learning model is selected.
- the boundary value when the range of the attribute value is divided corresponds to the value used in the condition in the selected model, so that the position where the learning model is switched in the second graph 72 and the third graph 73 The positions where the colors and patterns in the heat map are switched are aligned.
- the observer can grasp
- the observer can recognize which learning model has been selected when the estimation result is derived.
- FIG. 27 is an explanatory diagram illustrating an example of a screen displayed in the first modification of the eighth embodiment.
- the third graph 73 is referred to as an attribute graph 73.
- the display unit 4 may display the graph 81 illustrated in FIG. 27 instead of the first graph 71 and the second graph 72 in step S72.
- the display unit 4 arranges the symbols representing the estimation results in the predetermined order along the horizontal axis in the same manner as in the sixth embodiment. It is only necessary to display a graph arranged so that the type of symbol representing the estimation result is changed according to the learning model corresponding to the estimation result.
- the operation of the display unit 4 displaying the attribute graph 73 is the same as the operation of the display unit 4 displaying the third graph 73 in the eighth embodiment.
- the display means 4 shares the horizontal axis of the graph 81 illustrated in FIG. 27 with the horizontal axis of the attribute graph 73.
- the symbol in the graph 81 representing the estimation result and the x coordinate of the color or pattern representing the value of each estimation data corresponding to the estimation result are made common.
- FIG. 28 is an explanatory diagram illustrating an example of a screen displayed in the second modification of the eighth embodiment.
- the display unit 4 may display the graph 82 illustrated in FIG. 28 instead of the first graph 71 and the second graph 72 in step S72.
- the display means 4 arranges the symbols representing the estimation results in the predetermined order along the horizontal axis in the same manner as in the seventh embodiment, and each estimation result is represented by the coordinate in the vertical axis direction.
- the region in the graph may be divided and displayed according to the learning model corresponding to the estimation result indicated by the symbol.
- the operation of the display unit 4 displaying the attribute graph 73 is the same as the operation of the display unit 4 displaying the third graph 73 in the eighth embodiment.
- the display means 4 shares the horizontal axis of the graph 82 illustrated in FIG. 28 and the horizontal axis of the attribute graph 73.
- the symbol in the graph 82 representing the estimation result and the x coordinate of the color or pattern representing the value of each attribute corresponding to the estimation result are made common.
- the display unit 4 refers to each node indicating a condition in the selection model, and is one of boundary values when the attribute value range is divided. As such, the values used under the conditions may be used.
- the display means 4 does not display the second graph 72, so it is not necessary to display the icons 75 to 77 (see FIG. 25).
- FIG. 29 is a schematic block diagram showing a configuration example of a computer according to each embodiment of the present invention.
- the computer 1000 includes a CPU 1001, a main storage device 1002, an auxiliary storage device 1003, an interface 1004, a display device 1005, and an input device 1006.
- the estimation result display system 1 of each embodiment is implemented in a computer 1000.
- the operation of the estimation result display system 1 is stored in the auxiliary storage device 1003 in the form of a program (estimation result display program).
- the CPU 1001 reads out the program from the auxiliary storage device 1003, develops it in the main storage device 1002, and executes the above processing according to the program.
- the auxiliary storage device 1003 is an example of a tangible medium that is not temporary.
- Other examples of the non-temporary tangible medium include a magnetic disk, a magneto-optical disk, a CD-ROM, a DVD-ROM, and a semiconductor memory connected via the interface 1004.
- this program is distributed to the computer 1000 via a communication line, the computer 1000 that has received the distribution may develop the program in the main storage device 1002 and execute the above processing.
- the program may be for realizing a part of the above-described processing.
- the program may be a differential program that realizes the above-described processing in combination with another program already stored in the auxiliary storage device 1003.
- FIG. 30 is a block diagram showing an overview of the estimation result display system of the present invention.
- the estimation result display system of the present invention includes an input unit 91 and a display unit 92.
- the learning model selected according to the determination result of whether or not the attribute in the estimation data including one or more attributes satisfies one or more conditions is stored.
- Information in which the information to be represented and the estimation result derived by the learning model are associated with each other is input.
- the display unit 92 (for example, the display unit 4) is a target for determining whether or not the attribute in the estimation data is satisfied when the estimation result, information indicating the learning model, and the learning model is selected. Together with the selected conditions.
- the input means 2 includes information representing a learning model selected according to a determination result of whether or not an attribute in the estimation data including one or more attributes satisfies one or more conditions, and learning Information in which the estimation result derived by the model is associated with the estimation data may be input.
- the display means 4 may display a graph indicating a change in the attribute in the estimation data as well as a change in the estimation result and a change in the learning model.
- a human can infer the tendency of attributes in the estimation data when individual learning models are selected.
- An estimation result display system comprising: a display means for displaying in association with a condition that is a determination target of whether or not the attribute in the estimation data is satisfied.
- the said display means displays the scatter diagram which represented the estimation result by the symbol, changes the classification of the said symbol according to a learning model, and when the said learning model is selected, it is in the data for estimation
- the estimation result display system according to supplementary note 1, wherein a condition that is a determination target of whether or not the attribute is satisfied is represented on the symbol.
- the display means displays a scatter diagram in which the estimation result is represented by a symbol, changes the type of the symbol in accordance with a learning model, and any symbol in the scatter diagram has undergone a selection operation.
- the learning model corresponding to the estimation result indicated by the symbol that has undergone the selection operation is selected, the condition that is the target for determining whether or not the attribute in the estimation data is satisfied is displayed.
- Data for displaying a graph of the structure is input, and the display means displays a scatter diagram representing the estimation result as a symbol, changes the type of the symbol according to the learning model, and displays any of the scatter graphs.
- Appendix 1 displays a tree-structured graph that highlights the path from the root node of the tree-structure to the learning model corresponding to the estimation result indicated by the symbol that has received the selection-operation when the symbol has undergone a selection operation The estimation result display system described in 1.
- the input unit assigns conditions for attributes in the estimation data to a plurality of axes, and in the space defined by the axes, Display data representing a learning model according to a condition is input, and the display means displays a scatter diagram representing the estimation result as a symbol, changes the type of the symbol according to the learning model, and the scatter diagram.
- the estimation result according to supplementary note 1 wherein when any of the symbols is subjected to a selection operation, a location in the space corresponding to the learning model corresponding to the estimation result indicated by the symbol subjected to the selection operation is highlighted. Display system.
- the said display means displays the 2nd graph which arranged the symbol showing the learning model corresponding to an estimation result in the said predetermined order with the 1st graph which arranged the symbol showing the estimation result in the predetermined order Whether any attribute in the estimation data is satisfied when any of the symbols in the second graph is subjected to a selection operation and the learning model represented by the symbol subjected to the selection operation is selected.
- the estimation result display system according to supplementary note 1 for displaying the condition that has been a determination target.
- the display means is a graph in which symbols representing estimation results are arranged in a predetermined order, and displays a graph in which the type of the symbol is changed according to a learning model corresponding to the estimation results.
- the learning model corresponding to the estimation result represented by the symbol that received the selection operation is selected, the attribute in the estimation data is a target for determination.
- the estimation result display system according to supplementary note 1 for displaying conditions.
- the display means displays a graph in which symbols representing estimation results are arranged in a predetermined order, and displays the graph in a region divided according to a learning model corresponding to the estimation results indicated by the symbols.
- the input means includes information representing a learning model selected according to a determination result as to whether or not an attribute in the estimation data including one or more attributes satisfies one or more conditions.
- the estimation result derived by the learning model is associated with the estimation data, and the selection model for selecting the learning model is input, and the estimation data and the selection model are used.
- any one of appendix 1 to appendix 8 including condition identifying means for identifying a condition that is a determination target whether or not the attribute in the estimation data is satisfied when the learning model is selected Estimated result display system.
- the said display means displays the 2nd graph which arranged the symbol showing the learning model corresponding to an estimation result in the predetermined order with the 1st graph which is a line graph showing the time series transition of an estimation result. Whether any attribute in the estimation data is satisfied when any of the symbols in the second graph is subjected to a selection operation and the learning model represented by the symbol subjected to the selection operation is selected.
- the estimation result display system according to supplementary note 1 for displaying the condition that has been a determination target.
- the said display means is a line graph showing the time series transition of an estimation result, Comprising: The graph which changed the attribute of the line according to the learning model corresponding to an estimation result is displayed, On the line in the said line graph When a location has undergone a selection operation, it is determined whether or not the attribute in the estimation data is satisfied when a learning model corresponding to the estimation result represented by the location that has received the selection operation is selected.
- the estimation result display system according to supplementary note 1 for displaying the conditions.
- the said display means displays the line graph showing the time series transition of an estimation result, and classify
- the said line graph When the location on the line in the screen is subjected to a selection operation, whether the attributes in the estimation data are satisfied when the learning model corresponding to the estimation result represented by the location that received the selection operation is selected.
- the estimation result display system according to supplementary note 1, which displays the conditions that have become.
- An estimation result display system comprising display means for displaying a graph indicating changes.
- the display means displays a graph in a heat map format representing a color or a pattern corresponding to a range of attribute values as a graph showing a change in attributes in the estimation data over time, and ranges of attribute values
- the estimation result display system according to supplementary note 15, wherein a value used in a condition used when selecting a learning model is used as one of the plurality of boundary values.
- the said display means displays the 2nd graph which arranged the symbol showing the learning model corresponding to an estimation result in the said predetermined order with the 1st graph which arranged the symbol showing the estimation result in the predetermined order
- the estimated result display system according to supplementary note 15 or supplementary note 16, wherein the temporal change of the estimation result and the temporal change of the learning model are displayed.
- the said display means is a graph which arranged the symbol showing an estimation result in predetermined order, Comprising: By displaying the graph which changed the classification of the symbol according to the learning model corresponding to an estimation result, an estimation result
- the estimated result display system according to supplementary note 15 or supplementary note 16, wherein the temporal change of the learning model and the temporal change of the learning model are displayed.
- the said display means displays the graph which arranged the symbol showing an estimation result in the predetermined order, and classify
- An estimation result display method characterized in that a condition that is a determination target of whether or not an attribute in estimation data is satisfied is displayed in association with each other.
- the input of the information in which the estimated result and the estimation data are associated with each other is received, and the temporal change of the estimation result and the temporal change of the learning model are displayed, and the temporal change of the attribute in the estimation data is shown.
- An estimation result display method characterized by displaying a graph.
- An estimation result display program installed in a computer comprising an input means for inputting information associated with the estimated result, and used for deriving the estimation result to the estimation result in the computer Display processing that associates and displays the information representing the learning model that has been selected and the condition that is the determination target whether or not the attribute in the estimation data is satisfied when the learning model is selected Estimated result display program.
- An estimation result display program installed in a computer comprising an input means for inputting information in which the estimated result and the estimation data are input, the computer including an estimation result change over time and a learning model
- the examples shown in FIGS. 6, 9, 11 and 14 are display examples in which the estimation result and the actually measured value are compared and presented.
- the present invention is preferably applied to an estimation result display system that displays an estimation result derived using a learning model.
Abstract
Description
図5は、本発明の第1の実施形態の推定結果表示システムの構成例を示すブロック図である。本実施形態の推定結果表示システム1は、入力手段2と、条件特定手段3と、表示手段4とを備える。
FIG. 5 is a block diagram illustrating a configuration example of the estimation result display system according to the first embodiment of this invention. The estimation
図8は、本発明の第2の実施形態の推定結果表示システムの構成例を示すブロック図である。第2の実施形態の推定結果表示システム1は、入力手段2と、条件特定手段3と、表示手段4と、カーソル操作手段7とを備える。第1の実施形態と同様の事項については、適宜説明を省略する。
FIG. 8 is a block diagram illustrating a configuration example of an estimation result display system according to the second embodiment of this invention. The estimation
本発明の第3の実施形態の推定結果表示システムは、第2の実施形態の推定結果表示システムと同様に、図8に示すブロック図で表すことができるので、図8を用いて第3の実施形態を説明する。第2の実施形態と同様の事項については、適宜説明を省略する。
The estimation result display system according to the third embodiment of the present invention can be represented by the block diagram shown in FIG. 8 as with the estimation result display system according to the second embodiment. An embodiment will be described. A description of the same matters as in the second embodiment will be omitted as appropriate.
本発明の第4の実施形態の推定結果表示システムは、第2の実施形態の推定結果表示システムと同様に、図8に示すブロック図で表すことができるので、図8を用いて第4の実施形態を説明する。
The estimation result display system according to the fourth embodiment of the present invention can be represented by the block diagram shown in FIG. 8 as in the estimation result display system according to the second embodiment. An embodiment will be described.
本発明の第5の実施形態の推定結果表示システムは、第2の実施形態の推定結果表示システムと同様に、図8に示すブロック図で表すことができるので、図8を用いて第5の実施形態を説明する。 Embodiment 5. FIG.
The estimation result display system according to the fifth embodiment of the present invention can be represented by the block diagram shown in FIG. 8 as in the estimation result display system according to the second embodiment. An embodiment will be described.
第5の実施形態では、第1のグラフ71と第2のグラフ72を表示することで、推定結果を導出するときにどの学習モデルが選択されていたかを観察者に認識させる。第6の実施形態では、1つのグラフによって、推定結果を導出するときにどの学習モデルが選択されていたかを観察者に認識させる。 Embodiment 6. FIG.
In the fifth embodiment, by displaying the
第7の実施形態も、1つのグラフによって、推定結果を導出するときにどの学習モデルが選択されていたかを観察者に認識させる。 Embodiment 7. FIG.
In the seventh embodiment as well, the observer recognizes which learning model is selected when the estimation result is derived using one graph.
図24は、本発明の第8の実施形態の推定結果表示システムの構成例を示すブロック図である。第8の実施形態の推定結果表示システム1は、入力手段2と、表示手段4とを備える。 Embodiment 8. FIG.
FIG. 24 is a block diagram illustrating a configuration example of an estimation result display system according to the eighth embodiment of this invention. The estimation
2 入力手段
3 条件特定手段
4 表示手段
7 カーソル操作手段 DESCRIPTION OF
Claims (23)
- 一種類以上の属性を含む推定用データ内の属性が一種類以上の条件を満たしているか否かの判定結果に応じて選択された学習モデルを表す情報と、前記学習モデルによって導出された推定結果とが対応付けられた情報が入力される入力手段と、
前記推定結果に、前記推定結果を導出するのに用いられた前記学習モデルを表す情報、および、当該学習モデルが選択されたときに推定用データ内の属性が満たしているか否かの判定対象となっていた条件を、関連付けて表示する表示手段とを備える
ことを特徴とする推定結果表示システム。 Information representing a learning model selected according to a determination result of whether or not an attribute in the estimation data including one or more attributes satisfies one or more conditions, and an estimation result derived by the learning model And an input means for inputting information associated with
Information indicating the learning model used for deriving the estimation result, and a determination target whether or not the attribute in the estimation data is satisfied when the learning model is selected in the estimation result An estimation result display system comprising: a display means for displaying the associated conditions in association with each other. - 前記表示手段は、推定結果をシンボルで表した散布図を表示するとともに、学習モデルに応じて前記シンボルの種別を変え、かつ、前記学習モデルが選択されたときに推定用データ内の属性が満たしているか否かの判定対象となっていた条件を前記シンボル上で表す
請求項1に記載の推定結果表示システム。 The display means displays a scatter diagram representing the estimation results in symbols, changes the type of the symbols according to the learning model, and satisfies the attributes in the estimation data when the learning model is selected. The estimation result display system according to claim 1, wherein a condition that is a determination target of whether or not the image is represented on the symbol. - 前記表示手段は、推定結果をシンボルで表した散布図を表示するとともに、学習モデルに応じて前記シンボルの種別を変え、前記散布図内のいずれかのシンボルが選択操作を受けた場合に、当該選択操作を受けたシンボルが示す推定結果に対応する学習モデルが選択されたときに推定用データ内の属性が満たしているか否かの判定対象となっていた条件を表示する
請求項1に記載の推定結果表示システム。 The display means displays a scatter diagram representing the estimation result as a symbol, changes the type of the symbol according to a learning model, and when any symbol in the scatter diagram is subjected to a selection operation, The condition for which it was determined whether or not the attribute in the estimation data is satisfied when a learning model corresponding to the estimation result indicated by the symbol subjected to the selection operation is selected is displayed. Estimated result display system. - 前記入力手段に、学習モデルを選択するための選択モデルの表示用データとして、葉ノードが学習モデルを表し、葉ノード以外の各ノードが推定用データ内の属性に対する条件を表す木構造のグラフの表示用データが入力され、
前記表示手段は、推定結果をシンボルで表した散布図を表示するとともに、学習モデルに応じて前記シンボルの種別を変え、前記散布図内のいずれかのシンボルが選択操作を受けた場合に、前記木構造のルートノードから、前記選択操作を受けたシンボルが示す推定結果に対応する学習モデルまでの経路を強調表示した木構造のグラフを表示する
請求項1に記載の推定結果表示システム。 In the input means, as a display data of a selection model for selecting a learning model, a leaf node represents a learning model, and each node other than the leaf node represents a condition for an attribute in the estimation data. The display data is entered,
The display means displays a scatter diagram representing the estimation result as a symbol, changes the type of the symbol according to a learning model, and when any symbol in the scatter diagram is subjected to a selection operation, The estimation result display system according to claim 1, wherein a tree structure graph is displayed in which a route from a root node of the tree structure to a learning model corresponding to the estimation result indicated by the symbol subjected to the selection operation is highlighted. - 前記入力手段に、学習モデルを選択するための選択モデルの表示用データとして、推定用データ内の属性に対する条件を複数の軸に割り当て、前記軸によって規定される空間内に、前記条件に応じた学習モデルを表した表示用データが入力され、
前記表示手段は、推定結果をシンボルで表した散布図を表示するとともに、学習モデルに応じて前記シンボルの種別を変え、前記散布図内のいずれかのシンボルが選択操作を受けた場合に、前記選択操作を受けたシンボルが示す推定結果に対応する学習モデルに該当する前記空間内の箇所を強調表示する
請求項1に記載の推定結果表示システム。 As the display data for the selection model for selecting the learning model, the input means assigns a condition for the attribute in the estimation data to a plurality of axes, and in accordance with the condition in a space defined by the axis Display data representing the learning model is input,
The display means displays a scatter diagram representing the estimation result as a symbol, changes the type of the symbol according to a learning model, and when any symbol in the scatter diagram is subjected to a selection operation, The estimation result display system according to claim 1, wherein a location in the space corresponding to a learning model corresponding to an estimation result indicated by a symbol that has undergone a selection operation is highlighted. - 前記表示手段は、推定結果を表すシンボルを所定の順に並べた第1のグラフとともに、推定結果に対応する学習モデルを表すシンボルを前記所定の順に並べた第2のグラフを表示し、前記第2のグラフ中のいずれかのシンボルが選択操作を受けた場合に、当該選択操作を受けたシンボルが表す学習モデルが選択されたときに推定用データ内の属性が満たしているか否かの判定対象となっていた条件を表示する
請求項1に記載の推定結果表示システム。 The display means displays a second graph in which symbols representing learning models corresponding to the estimation results are arranged in the predetermined order together with a first graph in which symbols representing the estimation results are arranged in a predetermined order. When any of the symbols in the graph of FIG. 5 is subjected to a selection operation, it is determined whether or not the attribute in the estimation data is satisfied when the learning model represented by the symbol subjected to the selection operation is selected. The estimation result display system according to claim 1, wherein a condition that has been displayed is displayed. - 前記表示手段は、推定結果を表すシンボルを所定の順に並べたグラフであって、推定結果に対応する学習モデルに応じてシンボルの種別を変えたグラフを表示し、いずれかのシンボルが選択操作を受けた場合に、当該選択操作を受けたシンボルが表す推定結果に対応する学習モデルが選択されたときに推定用データ内の属性が満たしているか否かの判定対象となっていた条件を表示する
請求項1に記載の推定結果表示システム。 The display means is a graph in which symbols representing estimation results are arranged in a predetermined order, and displays a graph in which the type of symbol is changed according to a learning model corresponding to the estimation results, and any symbol performs a selection operation. When it is received, when the learning model corresponding to the estimation result represented by the symbol subjected to the selection operation is selected, a condition that is a determination target whether or not the attribute in the estimation data is satisfied is displayed. The estimation result display system according to claim 1. - 前記表示手段は、推定結果を表すシンボルを所定の順に並べたグラフを表示するとともに、シンボルが示す推定結果に対応する学習モデルに応じて前記グラフ内の領域を区分して表示し、いずれかのシンボルが選択操作を受けた場合に、当該選択操作を受けたシンボルが表す推定結果に対応する学習モデルが選択されたときに推定用データ内の属性が満たしているか否かの判定対象となっていた条件を表示する
請求項1に記載の推定結果表示システム。 The display means displays a graph in which symbols representing the estimation results are arranged in a predetermined order, and displays the graph by dividing the area in the graph according to the learning model corresponding to the estimation results indicated by the symbols, When a symbol is subjected to a selection operation, it is determined whether or not the attribute in the estimation data is satisfied when a learning model corresponding to the estimation result represented by the symbol subjected to the selection operation is selected. The estimation result display system according to claim 1. - 前記入力手段には、一種類以上の属性を含む推定用データ内の属性が一種類以上の条件を満たしているか否かの判定結果に応じて選択された学習モデルを表す情報と、前記学習モデルによって導出された推定結果と、前記推定用データとを対応付けた情報、および、学習モデルを選択するための選択モデルが入力され、
前記推定用データと、前記選択モデルとを用いて、学習モデルが選択されたときに推定用データ内の属性が満たしているか否かの判定対象となっていた条件を特定する条件特定手段を備える
請求項1から請求項8のうちのいずれか1項に記載の推定結果表示システム。 The input means includes information representing a learning model selected according to a determination result of whether or not an attribute in the estimation data including one or more attributes satisfies one or more conditions, and the learning model The information obtained by associating the estimation result derived by the estimation data with the estimation data and the selection model for selecting the learning model are input,
Using the estimation data and the selection model, there is provided condition specifying means for specifying a condition for determining whether or not an attribute in the estimation data is satisfied when a learning model is selected. The estimation result display system according to any one of claims 1 to 8. - 前記表示手段は、前記推定結果の値を、前記シンボルが位置する座標によって表した散布図を表示する
請求項1から請求項5のうちのいずれか1項に記載の推定結果表示システム。 The estimation result display system according to any one of claims 1 to 5, wherein the display means displays a scatter diagram in which the value of the estimation result is expressed by coordinates where the symbol is located. - 前記表示手段は、前記推定結果を、前記シンボルの種別によって表した散布図を表示する
請求項1から請求項5のうちのいずれか1項に記載の推定結果表示システム。 The estimation result display system according to any one of claims 1 to 5, wherein the display unit displays a scatter diagram representing the estimation result by a type of the symbol. - 前記表示手段は、推定結果の時系列推移を表す線グラフである第1のグラフとともに、推定結果に対応する学習モデルを表すシンボルを所定の順に並べた第2のグラフを表示し、前記第2のグラフ中のいずれかのシンボルが選択操作を受けた場合に、当該選択操作を受けたシンボルが表す学習モデルが選択されたときに推定用データ内の属性が満たしているか否かの判定対象となっていた条件を表示する
請求項1に記載の推定結果表示システム。 The display means displays a second graph in which symbols representing a learning model corresponding to the estimation result are arranged in a predetermined order together with a first graph that is a line graph representing a time series transition of the estimation result, and the second graph When any of the symbols in the graph of FIG. 5 is subjected to a selection operation, it is determined whether or not the attribute in the estimation data is satisfied when the learning model represented by the symbol subjected to the selection operation is selected. The estimation result display system according to claim 1, wherein a condition that has been displayed is displayed. - 前記表示手段は、推定結果の時系列推移を表す線グラフであって、推定結果に対応する学習モデルに応じて線の属性を変えたグラフを表示し、前記線グラフにおける線上の箇所が選択操作を受けた場合に、当該選択操作を受けた箇所が表す推定結果に対応する学習モデルが選択されたときに推定用データ内の属性が満たしているか否かの判定対象となっていた条件を表示する
請求項1に記載の推定結果表示システム。 The display means is a line graph representing a time series transition of an estimation result, and displays a graph in which line attributes are changed according to a learning model corresponding to the estimation result, and a position on the line in the line graph is a selection operation. When the learning model corresponding to the estimation result represented by the location that received the selection operation is selected, the condition that was the target for determining whether the attribute in the estimation data is satisfied is displayed. The estimation result display system according to claim 1. - 前記表示手段は、推定結果の時系列推移を表す線グラフを表示するともに、推定結果に対応する学習モデルに応じて前記線グラフ内の領域を区分して表示し、前記線グラフにおける線上の箇所が選択操作を受けた場合に、当該選択操作を受けた箇所が表す推定結果に対応する学習モデルが選択されたときに推定用データ内の属性が満たしているか否かの判定対象となっていた条件を表示する
請求項1に記載の推定結果表示システム。 The display means displays a line graph representing a time-series transition of the estimation result, and displays an area in the line graph according to a learning model corresponding to the estimation result. When the learning model corresponding to the estimation result represented by the location that received the selection operation is selected, the attribute in the estimation data is subject to determination. The estimation result display system according to claim 1, wherein conditions are displayed. - 一種類以上の属性を含む推定用データ内の属性が一種類以上の条件を満たしているか否かの判定結果に応じて選択された学習モデルを表す情報と、前記学習モデルによって導出された推定結果と、前記推定用データとが対応付けられた情報が入力される入力手段と、
推定結果の経時変化および学習モデルの経時変化を表示するとともに、前記推定用データ内の属性の経時変化を示すグラフを表示する表示手段とを備える
ことを特徴とする推定結果表示システム。 Information representing a learning model selected according to a determination result of whether or not an attribute in the estimation data including one or more attributes satisfies one or more conditions, and an estimation result derived by the learning model And input means for inputting information associated with the estimation data;
An estimation result display system comprising: a display unit that displays a change over time of the estimation result and a change over time of the learning model, and displays a graph indicating a change over time of the attribute in the estimation data. - 前記表示手段は、推定用データ内の属性の経時変化を示すグラフとして、属性の値の範囲に応じた色または模様を表すヒートマップ形式のグラフを表示し、
属性の値の範囲の複数の境界値の1つとして、学習モデルの選択時に用いられる条件で用いられる値を用いる
請求項15に記載の推定結果表示システム。 The display means displays a graph in a heat map format representing a color or a pattern according to a range of attribute values, as a graph showing changes in attributes in the estimation data over time,
The estimation result display system according to claim 15, wherein a value used in a condition used when selecting a learning model is used as one of a plurality of boundary values in the attribute value range. - 前記表示手段は、推定結果を表すシンボルを所定の順に並べた第1のグラフとともに、推定結果に対応する学習モデルを表すシンボルを前記所定の順に並べた第2のグラフを表示することによって、推定結果の経時変化および学習モデルの経時変化を表示する
請求項15または請求項16に記載の推定結果表示システム。 The display means displays a first graph in which symbols representing estimation results are arranged in a predetermined order, and a second graph in which symbols representing learning models corresponding to the estimation results are arranged in the predetermined order. The estimation result display system according to claim 15 or 16, wherein a change with time of the result and a change with time of the learning model are displayed. - 前記表示手段は、推定結果を表すシンボルを所定の順に並べたグラフであって、推定結果に対応する学習モデルに応じてシンボルの種別を変えたグラフを表示することによって、推定結果の経時変化および学習モデルの経時変化を表示する
請求項15または請求項16に記載の推定結果表示システム。 The display means is a graph in which symbols representing estimation results are arranged in a predetermined order, and displays a graph in which the type of the symbol is changed according to a learning model corresponding to the estimation results, so that the estimation results change over time and The estimation result display system according to claim 15 or 16, wherein a change with time of the learning model is displayed. - 前記表示手段は、推定結果を表すシンボルを所定の順に並べたグラフを表示するとともに、シンボルが示す推定結果に対応する学習モデルに応じて前記グラフ内の領域を区分して表示することによって、推定結果の経時変化および学習モデルの経時変化を表示する
請求項15または請求項16に記載の推定結果表示システム。 The display means displays a graph in which symbols representing estimation results are arranged in a predetermined order, and displays a region in the graph according to a learning model corresponding to the estimation results indicated by the symbols. The estimation result display system according to claim 15 or 16, wherein a change with time of the result and a change with time of the learning model are displayed. - 一種類以上の属性を含む推定用データ内の属性が一種類以上の条件を満たしているか否かの判定結果に応じて選択された学習モデルを表す情報と、前記学習モデルによって導出された推定結果とが対応付けられた情報の入力を受け付け、
前記推定結果に、前記推定結果を導出するのに用いられた前記学習モデルを表す情報、および、当該学習モデルが選択されたときに推定用データ内の属性が満たしているか否かの判定対象となっていた条件を、関連付けて表示する
ことを特徴とする推定結果表示方法。 Information representing a learning model selected according to a determination result of whether or not an attribute in the estimation data including one or more attributes satisfies one or more conditions, and an estimation result derived by the learning model And the input of information associated with
Information indicating the learning model used for deriving the estimation result, and a determination target whether or not the attribute in the estimation data is satisfied when the learning model is selected in the estimation result An estimation result display method characterized by displaying the associated conditions in association with each other. - 一種類以上の属性を含む推定用データ内の属性が一種類以上の条件を満たしているか否かの判定結果に応じて選択された学習モデルを表す情報と、前記学習モデルによって導出された推定結果と、前記推定用データとが対応付けられた情報の入力を受け付け、
推定結果の経時変化および学習モデルの経時変化を表示するとともに、前記推定用データ内の属性の経時変化を示すグラフを表示する
ことを特徴とする推定結果表示方法。 Information representing a learning model selected according to a determination result of whether or not an attribute in the estimation data including one or more attributes satisfies one or more conditions, and an estimation result derived by the learning model And the input of information associated with the estimation data,
An estimation result display method characterized by displaying a change over time of an estimation result and a change over time of a learning model, and displaying a graph showing a change over time of an attribute in the estimation data. - 一種類以上の属性を含む推定用データ内の属性が一種類以上の条件を満たしているか否かの判定結果に応じて選択された学習モデルを表す情報と、前記学習モデルによって導出された推定結果とが対応付けられた情報が入力される入力手段を備えるコンピュータに搭載される推定結果表示プログラムであって、
前記コンピュータに、
前記推定結果に、前記推定結果を導出するのに用いられた前記学習モデルを表す情報、および、当該学習モデルが選択されたときに推定用データ内の属性が満たしているか否かの判定対象となっていた条件を、関連付けて表示する表示処理
を実行させるための推定結果表示プログラム。 Information representing a learning model selected according to a determination result of whether or not an attribute in the estimation data including one or more attributes satisfies one or more conditions, and an estimation result derived by the learning model Is an estimation result display program installed in a computer having an input means for inputting information associated with
In the computer,
Information indicating the learning model used for deriving the estimation result, and a determination target whether or not the attribute in the estimation data is satisfied when the learning model is selected in the estimation result An estimation result display program for executing a display process for displaying the associated conditions in association with each other. - 一種類以上の属性を含む推定用データ内の属性が一種類以上の条件を満たしているか否かの判定結果に応じて選択された学習モデルを表す情報と、前記学習モデルによって導出された推定結果と、前記推定用データとが対応付けられた情報が入力される入力手段を備えるコンピュータに搭載される推定結果表示プログラムであって、
前記コンピュータに、
推定結果の経時変化および学習モデルの経時変化を表示するとともに、前記推定用データ内の属性の経時変化を示すグラフを表示する表示処理
を実行させるための推定結果表示プログラム。 Information representing a learning model selected according to a determination result of whether or not an attribute in the estimation data including one or more attributes satisfies one or more conditions, and an estimation result derived by the learning model And an estimation result display program installed in a computer comprising an input means for inputting information associated with the estimation data,
In the computer,
An estimation result display program for executing a display process for displaying a change over time of an estimation result and a change over time of a learning model, and displaying a graph showing a change over time of an attribute in the estimation data.
Priority Applications (3)
| Application Number | Priority Date | Filing Date | Title |
|---|---|---|---|
| EP15855787.6A EP3214585A4 (en) | 2014-10-28 | 2015-04-30 | Estimated result display system, estimated result display method and estimated result display program |
| US15/731,173 US10867251B2 (en) | 2014-10-28 | 2015-04-30 | Estimation results display system, estimation results display method, and estimation results display program |
| JP2016556179A JP6565925B2 (en) | 2014-10-28 | 2015-04-30 | Estimation result display system, estimation result display method, and estimation result display program |
Applications Claiming Priority (2)
| Application Number | Priority Date | Filing Date | Title |
|---|---|---|---|
| JP2014-219564 | 2014-10-28 | ||
| JP2014219564 | 2014-10-28 |
Publications (1)
| Publication Number | Publication Date |
|---|---|
| WO2016067483A1 true WO2016067483A1 (en) | 2016-05-06 |
Family
ID=55856859
Family Applications (1)
| Application Number | Title | Priority Date | Filing Date |
|---|---|---|---|
| PCT/JP2015/002296 WO2016067483A1 (en) | 2014-10-28 | 2015-04-30 | Estimated result display system, estimated result display method and estimated result display program |
Country Status (4)
| Country | Link |
|---|---|
| US (1) | US10867251B2 (en) |
| EP (1) | EP3214585A4 (en) |
| JP (1) | JP6565925B2 (en) |
| WO (1) | WO2016067483A1 (en) |
Cited By (7)
| Publication number | Priority date | Publication date | Assignee | Title |
|---|---|---|---|---|
| CN107818128A (en) * | 2016-09-13 | 2018-03-20 | 阿自倍尔株式会社 | Thermal map display device and thermal map display methods |
| JPWO2018131311A1 (en) * | 2017-01-10 | 2019-11-07 | 日本電気株式会社 | Sensing system, sensor node device, sensor measurement value processing method, and program |
| WO2020105161A1 (en) * | 2018-11-22 | 2020-05-28 | 株式会社ウフル | Edge device machine learning model switching system, edge device machine learning model switching method, program, and edge device |
| JP2021012501A (en) * | 2019-07-05 | 2021-02-04 | 国立研究開発法人物質・材料研究機構 | Machine learning support method and machine learning support device |
| JP2021068185A (en) * | 2019-10-23 | 2021-04-30 | 株式会社東芝 | End pressure control support device, end pressure control support method and computer program |
| WO2021095693A1 (en) * | 2019-11-14 | 2021-05-20 | キヤノン株式会社 | Information processing device, information processing method, and program |
| JP7309533B2 (en) | 2019-09-06 | 2023-07-18 | 株式会社日立製作所 | Model improvement support system |
Families Citing this family (2)
| Publication number | Priority date | Publication date | Assignee | Title |
|---|---|---|---|---|
| US10902276B2 (en) | 2016-12-22 | 2021-01-26 | Samsung Electronics Co., Ltd. | Apparatus and method for processing image |
| WO2019026703A1 (en) * | 2017-07-31 | 2019-02-07 | 株式会社エイシング | Learning-finished model integration method, device, program, ic chip, and system |
Citations (1)
| Publication number | Priority date | Publication date | Assignee | Title |
|---|---|---|---|---|
| JP2013196037A (en) * | 2012-03-15 | 2013-09-30 | Hitachi Ltd | Demand prediction system and demand prediction method |
Family Cites Families (9)
| Publication number | Priority date | Publication date | Assignee | Title |
|---|---|---|---|---|
| JP4017272B2 (en) * | 1998-12-16 | 2007-12-05 | 中国電力株式会社 | Plant state estimation / prediction apparatus and method |
| JP2005135287A (en) * | 2003-10-31 | 2005-05-26 | National Agriculture & Bio-Oriented Research Organization | Prediction device, method, and program |
| KR100660861B1 (en) | 2005-02-23 | 2006-12-26 | 삼성전자주식회사 | Apparatus for predicting semiconductor process result and controlling according to the result |
| US8176096B2 (en) * | 2008-12-18 | 2012-05-08 | Microsoft Corporation | Data visualization interactivity architecture |
| JP5851857B2 (en) * | 2012-01-20 | 2016-02-03 | アズビル株式会社 | Graph display device |
| US8909582B2 (en) | 2013-02-04 | 2014-12-09 | Nec Corporation | Hierarchical latent variable model estimation device, hierarchical latent variable model estimation method, and recording medium |
| JP5408380B1 (en) * | 2013-06-17 | 2014-02-05 | 富士ゼロックス株式会社 | Information processing program and information processing apparatus |
| US10452992B2 (en) * | 2014-06-30 | 2019-10-22 | Amazon Technologies, Inc. | Interactive interfaces for machine learning model evaluations |
| US10102480B2 (en) * | 2014-06-30 | 2018-10-16 | Amazon Technologies, Inc. | Machine learning service |
-
2015
- 2015-04-30 WO PCT/JP2015/002296 patent/WO2016067483A1/en active Application Filing
- 2015-04-30 JP JP2016556179A patent/JP6565925B2/en active Active
- 2015-04-30 EP EP15855787.6A patent/EP3214585A4/en not_active Withdrawn
- 2015-04-30 US US15/731,173 patent/US10867251B2/en active Active
Patent Citations (1)
| Publication number | Priority date | Publication date | Assignee | Title |
|---|---|---|---|---|
| JP2013196037A (en) * | 2012-03-15 | 2013-09-30 | Hitachi Ltd | Demand prediction system and demand prediction method |
Non-Patent Citations (2)
| Title |
|---|
| "Ippo Susunda Kikai Gakushu IoT de Gekizo suru Data no Katsuyo Genba ni Shinto", NIKKEI BIG DATA, 10 June 2014 (2014-06-10), pages 7 - 12, XP009503263 * |
| See also references of EP3214585A4 * |
Cited By (12)
| Publication number | Priority date | Publication date | Assignee | Title |
|---|---|---|---|---|
| CN107818128A (en) * | 2016-09-13 | 2018-03-20 | 阿自倍尔株式会社 | Thermal map display device and thermal map display methods |
| JPWO2018131311A1 (en) * | 2017-01-10 | 2019-11-07 | 日本電気株式会社 | Sensing system, sensor node device, sensor measurement value processing method, and program |
| US11514277B2 (en) | 2017-01-10 | 2022-11-29 | Nec Corporation | Sensing system, sensor node device, sensor measurement value processing method, and program |
| JP7206915B2 (en) | 2017-01-10 | 2023-01-18 | 日本電気株式会社 | SENSING SYSTEM, SENSOR NODE DEVICE, SENSOR MEASURED VALUE PROCESSING METHOD AND PROGRAM |
| WO2020105161A1 (en) * | 2018-11-22 | 2020-05-28 | 株式会社ウフル | Edge device machine learning model switching system, edge device machine learning model switching method, program, and edge device |
| JP6759488B1 (en) * | 2018-11-22 | 2020-09-23 | 株式会社ウフル | Edge device machine learning model switching system, edge device machine learning model switching method, program, and edge device |
| JP2021012501A (en) * | 2019-07-05 | 2021-02-04 | 国立研究開発法人物質・材料研究機構 | Machine learning support method and machine learning support device |
| JP7411977B2 (en) | 2019-07-05 | 2024-01-12 | 国立研究開発法人物質・材料研究機構 | Machine learning support method and machine learning support device |
| JP7309533B2 (en) | 2019-09-06 | 2023-07-18 | 株式会社日立製作所 | Model improvement support system |
| JP2021068185A (en) * | 2019-10-23 | 2021-04-30 | 株式会社東芝 | End pressure control support device, end pressure control support method and computer program |
| JP7463075B2 (en) | 2019-10-23 | 2024-04-08 | 株式会社東芝 | Terminal pressure control support device, terminal pressure control support method, and computer program |
| WO2021095693A1 (en) * | 2019-11-14 | 2021-05-20 | キヤノン株式会社 | Information processing device, information processing method, and program |
Also Published As
| Publication number | Publication date |
|---|---|
| JP6565925B2 (en) | 2019-08-28 |
| EP3214585A4 (en) | 2018-06-13 |
| US10867251B2 (en) | 2020-12-15 |
| JPWO2016067483A1 (en) | 2017-09-14 |
| EP3214585A1 (en) | 2017-09-06 |
| US20180330262A1 (en) | 2018-11-15 |
Similar Documents
| Publication | Publication Date | Title |
|---|---|---|
| JP6565925B2 (en) | Estimation result display system, estimation result display method, and estimation result display program | |
| CN104457772B (en) | For the technology being modified to digitized map data | |
| CN105589875B (en) | A kind of method and device that multi-trace is drawn | |
| CN104537355B (en) | It is a kind of to utilize image boundary information and the notable method for checking object of the connectivity of region | |
| JP7183790B2 (en) | SYSTEM ANALYSIS SUPPORT DEVICE, SYSTEM ANALYSIS SUPPORT METHOD AND PROGRAM | |
| CN107451619A (en) | A kind of small target detecting method that confrontation network is generated based on perception | |
| JP6565924B2 (en) | Estimation result display system, estimation result display method, and estimation result display program | |
| KR102562994B1 (en) | Method, apparatus and computer program for generating map including driving route of vehicle | |
| CN104462691A (en) | Method and device for implementation of intelligent drawing with mouse in dynamic geometric software | |
| CN104007920A (en) | Method for selecting waveforms on electronic test equipment | |
| JPWO2012172687A1 (en) | Program visualization device | |
| US10949755B2 (en) | Prediction result display system, prediction result display method, and prediction result display program | |
| WO2016129218A1 (en) | Display system for displaying analytical information, method, and program | |
| JP7165108B2 (en) | Work training system and work training support method | |
| JP5620355B2 (en) | measuring device | |
| CN104457790A (en) | Method for evaluating inductive effect of navigation product, testing device and construction method for testing device | |
| US7941759B2 (en) | Interactive analysis of network adjustment results | |
| JP5810790B2 (en) | Visualization processing program, visualization processing method, and visualization processing apparatus | |
| CN106503070B (en) | A kind of engine test data three-dimensional Waterfall plot method for reconstructing | |
| JP6165001B2 (en) | Waveform drawing apparatus and waveform drawing program | |
| WO2015159377A1 (en) | Design assistance device | |
| KR101370830B1 (en) | System and Method for Implementing User Interface | |
| KR20200128236A (en) | Automatic widget applying apparatus and method based on Machine-Learning | |
| US20160174127A1 (en) | Information processing apparatus, control method, and program | |
| KR101624971B1 (en) | Method and apparatus for presenting procedure instructions with flow-logic diagram |
Legal Events
| Date | Code | Title | Description |
|---|---|---|---|
| 121 | Ep: the epo has been informed by wipo that ep was designated in this application |
Ref document number: 15855787 Country of ref document: EP Kind code of ref document: A1 |
|
| ENP | Entry into the national phase |
Ref document number: 2016556179 Country of ref document: JP Kind code of ref document: A |
|
| REEP | Request for entry into the european phase |
Ref document number: 2015855787 Country of ref document: EP |
|
| WWE | Wipo information: entry into national phase |
Ref document number: 15731173 Country of ref document: US |
|
| NENP | Non-entry into the national phase |
Ref country code: DE |