WO2015141221A1 - Information processing device and error detection method - Google Patents
Information processing device and error detection method Download PDFInfo
- Publication number
- WO2015141221A1 WO2015141221A1 PCT/JP2015/001500 JP2015001500W WO2015141221A1 WO 2015141221 A1 WO2015141221 A1 WO 2015141221A1 JP 2015001500 W JP2015001500 W JP 2015001500W WO 2015141221 A1 WO2015141221 A1 WO 2015141221A1
- Authority
- WO
- WIPO (PCT)
- Prior art keywords
- abnormality
- information
- relationship
- state graph
- normal model
- Prior art date
Links
Images


Classifications
-
- G—PHYSICS
- G06—COMPUTING; CALCULATING OR COUNTING
- G06F—ELECTRIC DIGITAL DATA PROCESSING
- G06F11/00—Error detection; Error correction; Monitoring
- G06F11/30—Monitoring
- G06F11/3065—Monitoring arrangements determined by the means or processing involved in reporting the monitored data
- G06F11/3072—Monitoring arrangements determined by the means or processing involved in reporting the monitored data where the reporting involves data filtering, e.g. pattern matching, time or event triggered, adaptive or policy-based reporting
- G06F11/3079—Monitoring arrangements determined by the means or processing involved in reporting the monitored data where the reporting involves data filtering, e.g. pattern matching, time or event triggered, adaptive or policy-based reporting the data filtering being achieved by reporting only the changes of the monitored data
-
- G—PHYSICS
- G06—COMPUTING; CALCULATING OR COUNTING
- G06F—ELECTRIC DIGITAL DATA PROCESSING
- G06F11/00—Error detection; Error correction; Monitoring
- G06F11/07—Responding to the occurrence of a fault, e.g. fault tolerance
- G06F11/0703—Error or fault processing not based on redundancy, i.e. by taking additional measures to deal with the error or fault not making use of redundancy in operation, in hardware, or in data representation
- G06F11/079—Root cause analysis, i.e. error or fault diagnosis
-
- G—PHYSICS
- G06—COMPUTING; CALCULATING OR COUNTING
- G06F—ELECTRIC DIGITAL DATA PROCESSING
- G06F11/00—Error detection; Error correction; Monitoring
- G06F11/07—Responding to the occurrence of a fault, e.g. fault tolerance
- G06F11/0703—Error or fault processing not based on redundancy, i.e. by taking additional measures to deal with the error or fault not making use of redundancy in operation, in hardware, or in data representation
- G06F11/0706—Error or fault processing not based on redundancy, i.e. by taking additional measures to deal with the error or fault not making use of redundancy in operation, in hardware, or in data representation the processing taking place on a specific hardware platform or in a specific software environment
- G06F11/0718—Error or fault processing not based on redundancy, i.e. by taking additional measures to deal with the error or fault not making use of redundancy in operation, in hardware, or in data representation the processing taking place on a specific hardware platform or in a specific software environment in an object-oriented system
-
- G—PHYSICS
- G06—COMPUTING; CALCULATING OR COUNTING
- G06F—ELECTRIC DIGITAL DATA PROCESSING
- G06F11/00—Error detection; Error correction; Monitoring
- G06F11/07—Responding to the occurrence of a fault, e.g. fault tolerance
- G06F11/0703—Error or fault processing not based on redundancy, i.e. by taking additional measures to deal with the error or fault not making use of redundancy in operation, in hardware, or in data representation
- G06F11/0751—Error or fault detection not based on redundancy
-
- G—PHYSICS
- G06—COMPUTING; CALCULATING OR COUNTING
- G06F—ELECTRIC DIGITAL DATA PROCESSING
- G06F11/00—Error detection; Error correction; Monitoring
- G06F11/07—Responding to the occurrence of a fault, e.g. fault tolerance
- G06F11/0703—Error or fault processing not based on redundancy, i.e. by taking additional measures to deal with the error or fault not making use of redundancy in operation, in hardware, or in data representation
- G06F11/0766—Error or fault reporting or storing
- G06F11/0772—Means for error signaling, e.g. using interrupts, exception flags, dedicated error registers
-
- G—PHYSICS
- G06—COMPUTING; CALCULATING OR COUNTING
- G06F—ELECTRIC DIGITAL DATA PROCESSING
- G06F11/00—Error detection; Error correction; Monitoring
- G06F11/07—Responding to the occurrence of a fault, e.g. fault tolerance
- G06F11/0703—Error or fault processing not based on redundancy, i.e. by taking additional measures to deal with the error or fault not making use of redundancy in operation, in hardware, or in data representation
- G06F11/0766—Error or fault reporting or storing
- G06F11/0787—Storage of error reports, e.g. persistent data storage, storage using memory protection
-
- G—PHYSICS
- G06—COMPUTING; CALCULATING OR COUNTING
- G06F—ELECTRIC DIGITAL DATA PROCESSING
- G06F11/00—Error detection; Error correction; Monitoring
- G06F11/30—Monitoring
- G06F11/3003—Monitoring arrangements specially adapted to the computing system or computing system component being monitored
- G06F11/3017—Monitoring arrangements specially adapted to the computing system or computing system component being monitored where the computing system is implementing multitasking
-
- G—PHYSICS
- G06—COMPUTING; CALCULATING OR COUNTING
- G06F—ELECTRIC DIGITAL DATA PROCESSING
- G06F11/00—Error detection; Error correction; Monitoring
- G06F11/30—Monitoring
- G06F11/3003—Monitoring arrangements specially adapted to the computing system or computing system component being monitored
- G06F11/302—Monitoring arrangements specially adapted to the computing system or computing system component being monitored where the computing system component is a software system
-
- G—PHYSICS
- G06—COMPUTING; CALCULATING OR COUNTING
- G06F—ELECTRIC DIGITAL DATA PROCESSING
- G06F11/00—Error detection; Error correction; Monitoring
- G06F11/30—Monitoring
- G06F11/3065—Monitoring arrangements determined by the means or processing involved in reporting the monitored data
- G06F11/3086—Monitoring arrangements determined by the means or processing involved in reporting the monitored data where the reporting involves the use of self describing data formats, i.e. metadata, markup languages, human readable formats
-
- G—PHYSICS
- G06—COMPUTING; CALCULATING OR COUNTING
- G06F—ELECTRIC DIGITAL DATA PROCESSING
- G06F11/00—Error detection; Error correction; Monitoring
- G06F11/30—Monitoring
- G06F11/34—Recording or statistical evaluation of computer activity, e.g. of down time, of input/output operation ; Recording or statistical evaluation of user activity, e.g. usability assessment
- G06F11/3447—Performance evaluation by modeling
-
- H—ELECTRICITY
- H04—ELECTRIC COMMUNICATION TECHNIQUE
- H04L—TRANSMISSION OF DIGITAL INFORMATION, e.g. TELEGRAPHIC COMMUNICATION
- H04L41/00—Arrangements for maintenance, administration or management of data switching networks, e.g. of packet switching networks
- H04L41/06—Management of faults, events, alarms or notifications
- H04L41/0631—Management of faults, events, alarms or notifications using root cause analysis; using analysis of correlation between notifications, alarms or events based on decision criteria, e.g. hierarchy, tree or time analysis
-
- H—ELECTRICITY
- H04—ELECTRIC COMMUNICATION TECHNIQUE
- H04L—TRANSMISSION OF DIGITAL INFORMATION, e.g. TELEGRAPHIC COMMUNICATION
- H04L41/00—Arrangements for maintenance, administration or management of data switching networks, e.g. of packet switching networks
- H04L41/06—Management of faults, events, alarms or notifications
- H04L41/0677—Localisation of faults
-
- G—PHYSICS
- G06—COMPUTING; CALCULATING OR COUNTING
- G06F—ELECTRIC DIGITAL DATA PROCESSING
- G06F2201/00—Indexing scheme relating to error detection, to error correction, and to monitoring
- G06F2201/81—Threshold
Definitions
- the present invention relates to a technique for detecting a system abnormality.
- Patent Document 1 discloses a process monitoring apparatus.
- the process monitoring apparatus of Patent Document 1 operates as follows.
- the process monitoring device extracts a process requiring attention based on the static attribute of the process.
- the static attributes include, for example, a process name, a maker name of a program related to the process, a program (software) name, a version, a parent process name that started this process, and a process size.
- the process monitoring apparatus extracts a corresponding process as a process requiring attention when the current static attribute has changed from the past static attribute.
- the process monitoring apparatus extracts a corresponding process as a process requiring attention when there is no past static attribute.
- the parent process cannot be found, the process monitoring apparatus extracts the corresponding process as a process requiring attention.
- the process monitoring apparatus extracts the corresponding process as a process requiring attention.
- the process monitoring apparatus extracts the corresponding process as a process requiring attention.
- the process monitoring device issues an alarm for a process requiring attention based on the dynamic attribute.
- the dynamic attributes are, for example, a dynamic dedicated memory byte number, a dynamic shared memory byte number, a redirector transmission, a reception traffic rate, and a hard disk access rate.
- the process monitoring device when past dynamic attributes and current dynamic attributes can be discriminated using statistical methods, generates warnings and registers as monitored processes for the relevant sensitive processes. Execute.
- the process monitoring apparatus extracts a related process having a predetermined relationship with the process requiring attention, and sets the related process as a process to be monitored.
- the process having a predetermined relationship is, for example, a process having a clear parent-child relationship, a process having no clear parent-child relationship, but always started when a monitored process operates.
- Patent Document 2 discloses a technology related to the use of cloud computing in security applications.
- the system of Patent Document 2 operates as follows.
- the system monitors client traffic.
- the system compares the monitored traffic with the predicted traffic pattern corresponding to the operating mode of the client.
- the system determines whether a security threat is indicated based on the comparison result.
- the technique described in the above-mentioned prior art document has a problem in that it detects only an abnormality in individual element units or an abnormality due to a predefined attack pattern. In other words, for example, there is a problem that it is difficult to detect an abnormality caused by an unknown target-type attack on a computer system.
- Patent Document 1 only detects anomalies based on static attributes and dynamic attributes defined in advance for each process. This is because the technique described in Patent Document 1 only considers the parent-child relationship and the start-up synchronization in the extraction of related processes.
- Patent Document 2 only detects abnormalities in client traffic based on the predicted traffic pattern.
- An object of the present invention is to provide an information processing apparatus, a monitoring method, and a computer-readable non-transitory recording medium that records the program or the program for solving the above-described problems.
- An information processing apparatus acquires, in a time series, relationship change information indicating a change in relationship among a plurality of elements included in a system, and based on the relationship change information, the element is a vertex.
- a normalization model for generating a state graph having a relation between elements as an edge, and a normal model for generating a normal model in which the state graph is a set of conditions to be satisfied in the normal state of the system based on the relationship change information
- an abnormality detecting means for detecting an abnormality relating to the system based on the state graph and the normal model and outputting abnormality information indicating the detected abnormality.
- An abnormality detection method acquires relationship change information indicating a change in relationship of a plurality of elements included in a system in time series, and based on the relationship change information, the element is a vertex.
- a state graph having a relation between elements as an edge is generated, and based on the relationship change information, the state graph generates a normal model that is a set of conditions that should be satisfied in the normal state of the system.
- an abnormality relating to the system is detected, and abnormality information indicating the detected abnormality is output.
- a non-transitory computer-readable recording medium acquires relationship change information indicating a change in relationship among a plurality of elements included in the system in time series, and based on the relationship change information, A state graph having the element as a vertex and a relationship between the elements as an edge is generated, and based on the relationship change information, a normal model in which the state graph is a set of conditions to be satisfied in the normal state of the system is generated. Based on the state graph and the normal model, an abnormality relating to the system is detected, and abnormality information indicating the detected abnormality is output, and a program for causing the computer to execute processing is recorded.
- the present invention has an effect that it is possible to improve the detectability of a system abnormality.
- FIG. 1 is a block diagram showing the configuration of the information processing apparatus according to the first embodiment of the present invention.
- FIG. 2 is a block diagram illustrating a configuration of an information processing system including the information processing apparatus according to the first embodiment and a monitoring target system.
- FIG. 3 is a diagram illustrating an example of the relationship change information in the first embodiment.
- FIG. 4 is a diagram illustrating an example of a state graph according to the first embodiment.
- FIG. 5 is a conceptual diagram showing a relationship between elements represented by the state graph in the first embodiment.
- FIG. 6 is a diagram illustrating an example of a normal model according to the first embodiment.
- FIG. 7 is a diagram illustrating an example of abnormality information according to the first embodiment.
- FIG. 8 is a block diagram illustrating a hardware configuration of a computer that implements the information processing apparatus according to the first embodiment.
- FIG. 9 is a flowchart illustrating the operation of the information processing apparatus according to the first embodiment.
- FIG. 10 is a flowchart illustrating the operation of the information processing apparatus according to the first embodiment.
- FIG. 11 is a diagram illustrating an example of the relationship change information in the first embodiment.
- FIG. 12 is a diagram illustrating an example of a state graph according to the first embodiment.
- FIG. 13 is a block diagram showing the configuration of the information processing apparatus according to the second embodiment of the present invention.
- FIG. 14 is a diagram illustrating an example of abnormality information according to the second embodiment.
- FIG. 15 is a block diagram showing a configuration of an information processing apparatus according to the third embodiment of the present invention.
- FIG. 16 is a diagram illustrating an example of abnormality information according to the third embodiment.
- FIG. 17 is a block diagram showing a configuration of an information processing apparatus according to the fourth embodiment of the present invention.
- FIG. 18 is a diagram illustrating an example of abnormality information according to the fourth embodiment.
- FIG. 19 is a diagram illustrating another example of the abnormality information in the fourth embodiment.
- FIG. 20 is a block diagram showing a configuration of an information processing apparatus according to the fifth embodiment of the present invention.
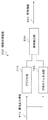
- FIG. 1 is a block diagram showing the configuration of the information processing apparatus 100 according to the first embodiment of the present invention.
- the information processing apparatus 100 includes a graphing unit 110, a normal model generation unit 120, and an abnormality detection unit 130. 1 may be a circuit in hardware units or a component divided into functional units of a computer device. Here, the components shown in FIG. 1 will be described as components divided into functional units of the computer apparatus.
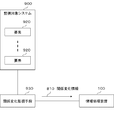
- FIG. 2 is a block diagram showing a configuration of the information processing system including the information processing apparatus 100, a monitoring target system (also simply referred to as “system”) 900, and a relationship change monitoring unit 930.
- system also simply referred to as “system”
- the monitored system 900 includes a plurality of elements 920. Each of the elements 920 has some relationship with each of the other elements 920.
- the monitoring target system 900 is an information processing system that includes a plurality of hosts (not shown) connected via a network, and a process (not shown) operates on the hosts.
- the monitoring target system 900 may be a social network.
- the monitoring target system 900 may be a set of data items (elements 920) having a certain structure.
- a set of data items having some structure is, for example, a set of files having a relationship between a hyperlink and a hyperlink.
- the monitoring target system 900 may be an arbitrary system.
- the relationship change monitoring unit 930 may be included in the monitoring target system 900.
- the relationship change monitoring unit 930 may be an agent that operates on the host, for example.
- the agent monitors the behavior of a process operating on the host and transmits a process event log to the information processing apparatus 100.
- the relationship change monitoring unit 930 may be, for example, a mail monitoring agent that operates on a mail server.
- the social network is a network constructed by a social networking service (SNS (Social Networking Service)).
- SNS Social Networking Service
- the mail monitoring agent monitors mail exchanged between users, and transmits a mail transmission / reception log to the information processing apparatus 100.
- the relationship change monitoring unit 930 may be an agent that operates on the SNS server.
- the agent monitors friend application information (message information) in SNS, connections between friends (increase in user connection information / link), changes thereof, and the like.
- the relationship change monitoring unit 930 may be an agent that operates on a web server, for example.
- the agent arbitrarily monitors, for example, changes in the generation and deletion of web pages, hyperlink relationships between web pages, and transmits an event log indicating the contents of the changes to the information processing apparatus 100.
- relationship change monitoring unit 930 may monitor the change in the relationship between any element 920 of any system and transmit the arbitrary relationship change information 810 to the information processing apparatus 100 regardless of the above-described example.
- the information processing apparatus 100 and the relationship change monitoring unit 930 are connected via a network (not shown). Note that, regardless of the example of FIG. 2, a plurality of relationship change monitoring units 930 that monitor the same or different monitoring target systems 900 may be connected to the information processing apparatus 100.
- the graphing unit 110 acquires the relationship change information 810 of the monitoring target system 900 from the relationship change monitoring unit 930, for example, in time series. Next, the graphing unit 110 generates a state graph 820 based on the acquired relationship change information 810, and outputs the state graph 820 to the abnormality detection unit 130.
- the relationship change information 810 is information indicating a change in relationship between the elements 920 included in the monitoring target system 900. Specifically, the relationship change information 810 is information transmitted from various relationship change monitoring means 930 as described above.
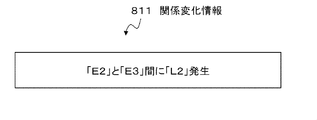
- FIG. 3 is a diagram illustrating an example of the relationship change information 811 that is a specific example of the relationship change information 810.
- the relationship change information 811 illustrated in FIG. 3 indicates an event “a relationship of type“ L2 ”has occurred between the element 920“ E2 ”and the element 920“ E3 ”” ”.
- “E2” and “E3” are identifiers of the element 920.
- the element 920 “E2” indicates the element 920 having the identifier “E2”.
- “L2” is an identifier of the type of relationship between the elements 920.
- the type “L2” indicates the type of the relationship between the elements 920 whose identifier is “L2”.
- the state graph 820 is a graph in which each of the elements 920 is a vertex (also referred to as a node or a node), and a relationship between the elements 920 is an edge (also referred to as a link, an edge, or a branch).
- the status graph 820 represents the relationship between the elements 920 in the monitoring target system 900.
- the relationship is, for example, a data transmission relationship that “data is transmitted between elements in a certain period” or a state in which data transmission can be performed between elements at a certain moment (or period). Data transmission relationship.
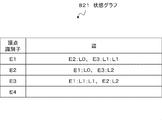
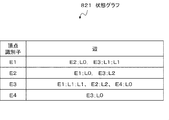
- FIG. 4 is a diagram illustrating an example of the state graph 821, which is a specific example of the state graph 820.
- the state graph 821 includes a record including a vertex identifier and an edge.
- the vertex identifier is an identifier of the element 920 that becomes the vertex.
- the side is information indicating a relationship between a vertex (element 920) specified by each vertex identifier and another vertex (element 920).
- the vertex identifier “E1” specifies the element 920 whose identifier is “E1”. Then, “E2; L0, E3; L1; L1” on the side corresponding to the vertex identifier “E1” indicates the following. First, the element 920 “E1” has an edge with the element 920 “E2”, and the attribute of the edge is “L0”. Second, the element 920 “E1” has two sides with the element 920 “E3”, and the attributes of the sides are both “L1”.
- a blank side indicates that the element 920 “E4” has no side with respect to any other element 920.
- the side indicates, for example, that the preparation for executing communication is completed between the elements 920 having the side.
- the attribute of the side indicates, for example, a protocol type of communication executed on the side. Note that the side and the attribute (for example, type) of the side are not limited to the above-described example, and may be arbitrary definitions indicating the relationship between the elements 920.
- edge “E3; L2” in the record with the vertex identifier “E2” and the edge “E2; L2” in the record with the vertex identifier “E3” are based on the relationship change information 811 shown in FIG. is there.
- state graph 820 may be any type of state graph 820 regardless of the above-described example.
- FIG. 5 is a conceptual diagram showing the relationship between the elements 920 represented by the state graph 821.
- the vertices are shown as circles, and the vertex identifiers are shown in the circles.
- the sides are indicated by line segments connecting the circles. For example, a line segment indicated by a solid line indicates a side whose type is “L0”. A line segment indicated by an alternate long and short dash line indicates a side whose type is “L1”. A line segment indicated by a two-dot chain line indicates an edge of type “L2”. An arrow indicates a direction from the side that generates the relationship to the outside.
- the normal model 830 is a set of conditions that the state graph 820 should satisfy in the normal state of the monitoring target system 900.
- FIG. 6 is a diagram illustrating an example of a normal model 831 that is a specific example of the normal model 830. As shown in FIG. 6, the normal model 831 includes a record including a condition type, a condition value, and a valid flag.
- condition value “upper limit value 2” in the record with the condition type “number of related vertices” is “the number of other elements 920 having an edge with one vertex (element 920) is 2 or less”
- condition value “upper limit value 6” of the record whose condition type is “degree” indicates a condition that “the number of sides from one vertex is 6 or less”.
- a record whose condition type is “side attribute” indicates a condition of a side attribute (for example, the type of relationship, the frequency, the direction indicating the relationship master, the time of occurrence of the relationship, etc.).
- the valid flag indicates whether or not the condition value included in the record is valid.
- the initial value of the valid flag is “invalid”.
- the normal model generation unit 120 uses a value obtained by adding a predetermined value to the average value of the “number of related vertices” of all vertices in a predetermined period, and the condition value of the record whose condition type is “number of related vertices” As good as
- the predetermined period is, for example, a period from the past specific time to the current time (referred to as period Pa).
- the predetermined period may be a period (referred to as a period Pb) from a current time to a past time that is a specific time backward.
- the predetermined period may be a period (referred to as a period Pc) from a specific first time in the past to a specific second time in the past.
- the predetermined period may be a period required to acquire a predetermined number of relationship change information 810. That is, the predetermined period is a period (referred to as a period Pd (vs. current time) or a period Pe (vs. past time)) that has acquired a recent predetermined number of relationship change information 810 with respect to the current time or a specific time in the past. It may be. Further, the predetermined period may be a predetermined intermittent period among the period Pa, the period Pb, the period Pc, or the period Pd. As described above, the normal model generation unit 120 can change the relationship change information of an arbitrary period such as a past fixed period (period Pc and period Pe) or a period that changes sequentially (period Pa, period Pb and period Pd).
- a normal model 830 may be generated based on 810.
- the normal model generation unit 120 When the normal model generation unit 120 generates the normal model 830 based on the relationship change information 810 in the period of time that changes sequentially, the normal model 830 is updated sequentially according to the input of the sequential relationship change information 810. .
- the normal model generation unit 120 may calculate a condition value for an arbitrary condition type using an arbitrary method based on the relationship change information 810.
- the normal model generation unit 120 sets the valid flag to “valid” when the condition value is generated or updated based on, for example, a predetermined number of relationship change information 810. Further, the normal model generation unit 120 may set the valid flag to “valid” when the condition value is generated or updated based on the relationship change information 810 for a predetermined period.
- the normal model 830 may include a record indicating the following types of conditions regardless of the above example.
- the normal model 830 may include a record of conditions for vertex attributes (for example, the type of the element 920 and the time when the vertex occurs).
- the normal model 830 may include a record of conditions for adjacent vertex attributes.
- the normal model 830 may include records of arbitrary conditions for the presence / absence of paths between vertices, the number, distance, and attributes of vertices and edges in the route.
- the normal model 830 may include a record of conditions for graph characteristics (eg, diameter, centrality, partial structure, etc.).
- the abnormality detection unit 130 detects an abnormality related to the monitoring target system 900 based on the state graph 820 and the normal model 830, and outputs abnormality information 840 indicating the detected abnormality.
- the abnormality information 840 is information that some abnormality of the monitoring target system 900 has been detected, for example. Further, the abnormality information 840 may include arbitrary information regarding the abnormality.
- the abnormality detection unit 130 may output the abnormality information 840 at an arbitrary timing. For example, the abnormality detection unit 130 outputs abnormality information 840 indicating the detected abnormality when a certain abnormality is detected. In addition, the abnormality detection unit 130 may hold the detected abnormality and output abnormality information 840 indicating the held abnormality in response to a request (a predetermined time or an instruction from the administrator). Furthermore, the abnormality detection unit 130 may detect an abnormality in the state graph 820 corresponding to the time (time range) included in the request.
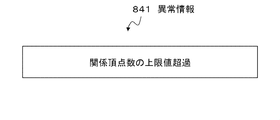
- FIG. 7 is a diagram illustrating an example of the abnormality information 841, which is a specific example of the abnormality information 840. As shown in FIG. 7, the abnormality information 841 indicates that the upper limit of the number of related vertices has been exceeded.
- FIG. 8 is a diagram illustrating a hardware configuration of a computer 700 that implements the information processing apparatus 100 according to the present embodiment.
- the computer 700 includes a CPU (Central Processing Unit) 701, a storage unit 702, a storage device 703, an input unit 704, an output unit 705, and a communication unit 706. Furthermore, the computer 700 includes a recording medium (or storage medium) 707 supplied from the outside.
- the recording medium 707 is a non-volatile recording medium (non-temporary recording medium) that stores information non-temporarily.
- the recording medium 707 may be a temporary recording medium that holds information as a signal.
- the CPU 701 controls the overall operation of the computer 700 by operating an operating system (not shown). For example, the CPU 701 reads the program and data from the recording medium 707 mounted on the storage device 703 and writes the read program and data to the storage unit 702.
- the program is, for example, a program for causing the computer 700 to execute operations of flowcharts shown in FIGS. 9 and 10 described later.
- the CPU 701 executes various processes as the graphing unit 110, the normal model generation unit 120, and the abnormality detection unit 130 shown in FIG. 1 according to the read program and based on the read data.
- the CPU 701 may download the program and its data to the storage unit 702 from an external computer (not shown) connected to a communication network (not shown).
- the storage unit 702 stores the program and data.
- the storage unit 702 may store relationship change information 810, a state graph 820, a normal model 830, abnormality information 840, and the like.
- the storage device 703 is, for example, any optical disk, flexible disk, magnetic optical disk, external hard disk, and semiconductor memory, and includes a recording medium 707.
- the storage device 703 (recording medium 707) stores the program in a computer-readable manner.
- the storage device 703 may store the data.
- the storage device 703 may store the relationship change information 810, the state graph 820, the normal model 830, the abnormality information 840, and the like.
- the input unit 704 receives an operation input by an operator and an input of information from the outside.
- Examples of the device used for the input operation include a mouse, a keyboard, a built-in key button, and a touch panel.
- the output unit 705 is realized by a display, for example.
- the output unit 705 is used, for example, for an input request to an operator by GUI (GRAPHICAL User Interface), an output presentation to the operator, or the like.
- GUI GRAAPHICAL User Interface
- the communication unit 706 realizes an interface with the relationship change monitoring unit 930.
- the communication unit 706 may be included as part of the graphing unit 110, the normal model generation unit 120, and the abnormality detection unit 130.
- the functional unit block of the information processing apparatus 100 shown in FIG. 1 is realized by the computer 700 having the hardware configuration shown in FIG.
- the means for realizing each unit included in the computer 700 is not limited to the above.
- the computer 700 may be realized by one physically coupled device, or may be realized by two or more physically separated devices connected by wire or wirelessly and by a plurality of these devices. .
- the CPU 701 may read and execute the program code stored in the recording medium 707.
- the CPU 701 may store the code of the program stored in the recording medium 707 in the storage unit 702, the storage device 703, or both. That is, this embodiment includes an embodiment of a recording medium 707 that stores the program (software) executed by the computer 700 (CPU 701) temporarily or non-temporarily.
- a storage medium that stores information non-temporarily is also referred to as a non-volatile storage medium.
- FIGS. 9 and 10 are flowcharts showing the operation of the present embodiment. Note that the processing according to this flowchart may be executed based on the above-described program control by the CPU 701. Further, the step name of the process is described with a symbol as in S610.
- the graphing unit 110 starts the operation of the flowchart illustrated in FIG. 9 when the relationship change information 810 is received.
- the graphing unit 110 receives the relationship change information 810 from the monitoring target system 900 via, for example, the communication unit 706 illustrated in FIG.
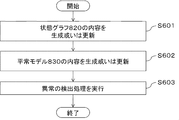
- the graphing unit 110 generates a state graph 820 based on the received relationship change information 810 (newly generated or updated) (step S601).
- the graphing unit 110 holds the state graph 820 in, for example, the storage unit 702 or the storage device 703 illustrated in FIG.
- the normal model generation unit 120 generates the content of the normal model 830 (newly generated or updated) based on the received relationship change information 810 (step S602). That is, first, the normal model generation unit 120 generates or updates the condition value of the record including the condition type related to the received relationship change information 810. The record is a record of the normal model 830. Second, the normal model generation unit 120 changes the setting of the validity flag of the record to “valid” when a predetermined condition (for example, the number of update of the condition value) is satisfied for the record. The normal model generation unit 120 holds the normal model 830 in, for example, the storage unit 702 or the storage device 703 illustrated in FIG.
- the abnormality detection unit 130 executes an abnormality detection process related to the monitoring target system 900 based on the state graph 820 and the normal model 830 (step S603). Thereafter, the process ends.
- the graphing unit 110, the normal model generating unit 120, and the abnormality detecting unit 130 operate in series in order. However, the graphing unit 110, the normal model generation unit 120, and the abnormality detection unit 130 may operate in parallel.
- the abnormality detection unit 130 executes an abnormality detection process every time the normal model generation unit 120 updates the contents of the normal model 830.
- the abnormality detection unit 130 may execute an abnormality detection process at an arbitrary timing (for example, when a specific time or an instruction from the administrator is received).
- each of the graphing unit 110 and the normal model generation unit 120 updates the state graph 820 and the normal model 830 each time the relationship change information 810 is received. However, each of the graphing unit 110 and the normal model generation unit 120 accumulates the received relationship change information 810, and at a specific timing, based on the accumulated relationship change information 810, the state graph 820 and the normal model 830, respectively. It may be generated or updated. The specific timing may be immediately before the abnormality detection unit 130 generates the abnormality information 840, for example.
- the abnormality detection unit 130 executes the operation of the flowchart shown in FIG. 10 below in step S603 of FIG.
- the anomaly detection unit 130 performs the process between step S630 and step S638 on all records of the normal model 830.
- the abnormality detection unit 130 acquires a record from the normal model 830 (step S631).
- the abnormality detection unit 130 determines whether the record is valid based on the valid flag (step S632). If the validity flag is “invalid” (NO in step S632), the process proceeds to step S638.
- the abnormality detection unit 130 When the validity flag is “valid” (YES in step S632), the abnormality detection unit 130 performs the process between step S633 and step S637 on all the confirmed values that can be extracted from the state graph 820. Execute.
- the anomaly detection unit 130 extracts a confirmed value corresponding to the condition type included in the record from the state graph 820 (step S634).
- the abnormality detection unit 130 determines whether or not the value to be confirmed matches the condition value included in the record (step S635).
- step S635 If the confirmed value matches the condition value (YES in step S635), the process proceeds to step S637.
- the abnormality detection unit 130 determines that an abnormality has occurred and includes abnormality information 840 so that information indicating the content of the abnormality is included. Is generated or updated (step S636).
- step S638 when the process has been executed for all extractable values to be extracted, the process proceeds to step S638, and when the unprocessed value to be confirmed remains, the process returns to step S634 (step S637). ).
- step S639 when the process is executed for all the records of the normal model 830, the process proceeds to step S639, and when the unprocessed record remains, the process returns to step S631 (step S638).
- the abnormality detection unit 130 outputs abnormality information 840 (step S639).
- the abnormality detection unit 130 outputs the abnormality information 840 via the output unit 705 shown in FIG. Further, the abnormality detection unit 130 may transmit the abnormality information 840 to a device (not shown) via the communication unit 706 illustrated in FIG. Further, the abnormality detection unit 130 may record the abnormality information 840 on the recording medium 707 via the storage device 703 illustrated in FIG.
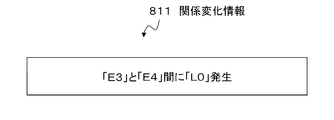
- the graphing unit 110 starts the operation of the flowchart illustrated in FIG. 9 when receiving the relationship change information 811 as illustrated in FIG. 11.
- FIG. 11 is a specific example of the relationship change information 810 indicating that the relationship “L0” has occurred between “E3” of the element 920 and “E4” of the element 920.
- step S601 of FIG. 9 the graphing unit 110 converts the state graph 820 (for example, the state graph 821 shown in FIG. 4 into the state graph 821 shown in FIG. 12) based on the received relationship change information 811 shown in FIG. )Update.
- the normal model generation unit 120 updates the contents of the normal model 830 (for example, the normal model 831 shown in FIG. 6) based on the received relationship change information 811. However, here, it is assumed that it is not necessary to update the contents of the normal model 830 (for example, the normal model 831).
- the abnormality detection unit 130 extracts a record whose condition type is “number of related vertices” from the normal model 830 (for example, the normal model 831).
- step S632 in FIG. 10 the abnormality detection unit 130 determines that the valid flag of the record is “valid”.
- step S634 of FIG. 10 the abnormality detection unit 130 sequentially extracts the confirmation values from the state graph 820 (for example, the state graph 821 shown in FIG. 12).
- the abnormality detection unit 130 sequentially determines whether or not the confirmed value matches the condition value (upper limit value 2) included in the record.
- the abnormality detection unit 130 has “3” as the number of elements 920 that are counterparts to the side of the record whose vertex identifier is “E4” (that is, the number of vertex relations). It is determined that the value does not match “2”.
- step S636 of FIG. 10 the abnormality detection unit 130 generates abnormality information 840 (for example, abnormality information 841 shown in FIG. 7) indicating that the vertex relation number exceeds the upper limit value.
- abnormality information 840 for example, abnormality information 841 shown in FIG. 7
- the anomaly detection unit 130 also executes processing for records whose condition types are “number of sides” and “side attribute”. However, here, there is no information to be added to the abnormality information 840 (for example, abnormality information 841) for the records whose condition types are “number of sides” and “side attribute”.
- the abnormality detection unit 130 outputs abnormality information 840 (for example, abnormality information 841 shown in FIG. 7).
- the effect of the present embodiment described above is that it becomes possible to improve the detectability of the system abnormality. For example, it becomes possible to detect system abnormalities due to unknown targeted attacks.
- the graphing unit 110 generates a state graph 820 based on the relationship change information 810.
- the normal model generation unit 120 generates a normal model 830 based on the relationship change information 810.
- the abnormality detection unit 130 generates abnormality information 840 based on the state graph 820 and the normal model 830.
- FIG. 13 is a block diagram showing the configuration of the information processing apparatus 200 according to the second embodiment of the present invention.
- the information processing apparatus 200 according to the present embodiment is different from the information processing apparatus 100 according to the first embodiment in that an abnormality detection unit 230 is included instead of the abnormality detection unit 130.
- the abnormality detection unit 230 calculates an abnormality degree indicating the degree of separation of the state graph 820 from the normal model 830 corresponding to the detected abnormality, and outputs abnormality information 840 including the abnormality degree.
- the abnormality detection unit 230 is the same as the abnormality detection unit 130 shown in FIG.
- the abnormality detection unit 230 determines that the value to be confirmed “3” is a condition value (upper limit value “2”) included in the record. ), Abnormal information 840 indicating that it is 50% apart is output.
- FIG. 14 is a diagram illustrating an example of the abnormality information 842 that is a specific example of the abnormality information 840 output from the abnormality detection unit 230.
- the first effect of the present embodiment described above is that, in addition to the effect of the first embodiment, it is possible to present the detection result about the abnormality of the system to the user in more detail.
- the reason is that the abnormality detection unit 230 outputs abnormality information 840 including the degree of abnormality.
- FIG. 15 is a block diagram showing a configuration of an information processing apparatus 300 according to the third embodiment of the present invention.
- the information processing apparatus 300 according to the present embodiment is different from the information processing apparatus 100 according to the first embodiment in that an abnormality detection unit 330 is included instead of the abnormality detection unit 130.
- the abnormality detection unit 330 outputs abnormality information 840 including information indicating a vertex (element 920) and a side (relationship between elements 920) related to the detected abnormality.
- the abnormality detection unit 330 is the same as the abnormality detection unit 130 shown in FIG.
- the abnormality detection unit 330 uses the vertex identifier “E3” for which the number of related vertices exceeds the identifier for the related vertex “E1”. , The abnormality information 840 including “E2” and “E3” is output.
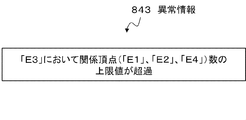
- FIG. 16 is a diagram illustrating an example of the abnormality information 843 that is a specific example of the abnormality information 840 output from the abnormality detection unit 330.
- the abnormality detection unit 330 may include the function of the abnormality detection unit 230 of the second embodiment.
- the abnormality detection unit 330 including the function of the abnormality detection unit 230 may calculate the degree of abnormality for each arbitrary side and vertex related to the detected abnormality.
- the first effect of the present embodiment described above is that, in addition to the effect of the first embodiment, it is possible to present the detection result about the abnormality of the system to the user in more detail.
- the abnormality detection unit 330 outputs abnormality information 840 including information indicating the apex and the edge related to the detected abnormality. For example, when an abnormality of a certain computer A is detected, the abnormality detection unit 330 outputs “abnormal communication with computer B in computer A” as abnormality information 840. That is, the user can know in detail that the part related to communication with the computer B in the computer A is abnormal as compared with the case where only “Computer A is abnormal” is output.
- FIG. 17 is a block diagram showing a configuration of an information processing apparatus 400 according to the fourth embodiment of the present invention.
- the information processing apparatus 400 according to the present embodiment is different from the information processing apparatus 100 according to the first embodiment in that an abnormality detection unit 430 is included instead of the abnormality detection unit 130.
- the abnormality detection unit 430 outputs abnormality information 840 including a chart for representing an abnormality generated based on the state graph 820 and the normal model 830.
- the chart for expressing the abnormality is a network diagram (details will be described later), a matrix (details will be described later), or any other chart.
- the abnormality detection unit 430 outputs abnormality information 840 representing an abnormality in the following manner. For example, the abnormality detection unit 430 increases the line width of a part of the state graph 820 corresponding to the abnormality, such as a graphic line or a character. In addition, the abnormality detection unit 430 may increase the size of a part of the state graph 820 corresponding to the abnormality, such as a graphic line or a character. In addition, the abnormality detection unit 430 may change the display color of a part corresponding to the abnormality on the state graph 820, such as a graphic line or a character. In addition, the abnormality detection unit 430 may change the background color of a part corresponding to the abnormality on the state graph 820, such as a graphic line or a character.
- the abnormality detection unit 430 may emphasize a portion corresponding to the abnormality on the state graph 820 according to the arrangement of the graphic, character, and matrix cells in the abnormality information 840. Specifically, the abnormality detection unit 430 may concentrate the figure of the part corresponding to the abnormality on the state graph 820 in a predetermined area in the network diagram (for example, the left side of the network diagram, near the center, etc.). In addition, the abnormality detection unit 430 arranges the list so that the cells corresponding to the abnormality on the state graph 820 are arranged in a predetermined order (for example, the order from the leftmost column and the top row) in the matrix. Alternatively, a matrix may be generated.
- the abnormality detection unit 430 may emphasize the part corresponding to the abnormality on the state graph 820 by any method and output the abnormality information 840 representing the abnormality.
- the anomaly detection unit 430 may further output a chart based on the normal model (hereinafter referred to as a normal model chart).
- a normal model chart For example, the abnormality detection unit 430 outputs the normal model chart so that the user can refer to the chart representing the abnormality and the normal model chart.
- the abnormality detection unit 430 may include the normal model chart in the abnormality information 840 or output it alone.
- the abnormality detection unit 430 may generate the normal model chart based on the normal model 830 generated by the normal model generation unit 120, for example.
- the abnormality detection unit 430 may acquire the normal model chart generated by the normal model generation unit 120.
- the normal model generation unit 120 generates a normal model chart from the normal model 830 based on a request from the abnormality detection unit 430 and outputs it.
- the normal model generation unit 120 may pass the normal model 830 to the graphing unit 110 based on a request from the abnormality detection unit 430, for example, and request generation of a normal model diagram.
- the normal model chart generated by the graphing unit 110 or the normal model generation unit 120 may be output directly or via the abnormality detection unit 430.
- the procedure for generating the normal model chart in the abnormality detection unit 430 or the normal model generation unit 120 may be, for example, the following procedure.
- the first process of the procedure is a process of comparing all vertex combinations (relationships between elements 920) with the normal model 830 and extracting vertex combinations determined to be normal.
- the second process of the procedure is a process of including the extracted vertex combination in the normal model chart.
- the abnormality detection unit 430 is the same as the abnormality detection unit 130 shown in FIG.
- FIG. 18 is a diagram illustrating an example of the abnormality information 844 represented by a network diagram, which is a specific example of the abnormality information 840 output from the abnormality detection unit 430.
- a circle indicates a vertex
- a character string in the circle indicates a vertex identifier.
- a line segment connecting the circles indicates a side.
- a double-line circle and a double-line segment are shown with emphasis on vertices (elements 920) and sides (relationship between elements 920) determined to be abnormal.
- the network diagram may be a network diagram of an arbitrary format regardless of the example of FIG. 18, and a display indicating an abnormality may also be an arbitrary format.
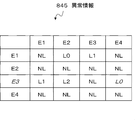
- FIG. 19 is a diagram illustrating an example of the abnormality information 845 represented by a matrix, which is a specific example of the abnormality information 840 output from the abnormality detection unit 430.
- the anomaly information 845 is a list of vertex identifiers on the horizontal axis (vertex identifiers on the top row), with the vertices specified in the list of vertex identifiers on the vertical axis (leftmost vertex identifiers) as vertices on the side (from the start).
- This is a matrix in which the specified vertices are vertices on the to (end) side of the side.
- the character string (for example, “L0”) in the cell of this matrix has the presence / absence of an edge from the vertex on the from side to the vertex on the to side (NL: no side, other than NL: side) and attributes (L0, L1 and L2).
- vertices and sides related to the abnormality are shown in italic letters.
- the matrix may be an arbitrary type of matrix regardless of the example of FIG. 19, and the display indicating the abnormality may also be an arbitrary type.
- the abnormality detection unit 430 arbitrarily selects an arbitrary abnormality chart representing an abnormality by an arbitrary technique on an arbitrary type of chart, and an arbitrary type of normal chart generated based on the normal model 830. May be output as abnormality information 840 alone or in combination.
- the abnormality detection unit 430 may superimpose and output a normal model chart on the abnormality chart.
- abnormality detection unit 430 may include the functions of the abnormality detection unit 230 of the second embodiment and the abnormality detection unit 330 of the third embodiment.
- the abnormality detection unit 430 may output display information that represents each temporal change of the state graph 820, the normal model 830, and the abnormality information 840 independently or arbitrarily.
- the time change is a change with the passage of time.
- the display information may be, for example, information indicating a change in state of any of the state graph 820, the normal model 830, and the abnormality information 840 as a moving image. Further, the display information may be information indicating the state at a plurality of time points of any one of the state graph 820, the normal model 830, and the abnormality information 840 side by side.
- the display information may be information updated in real time corresponding to the current time.
- the first effect of the present embodiment described above is that, in addition to the effect of the first embodiment, it is possible to present the detection result of the system abnormality to the user in a form that is easier for humans to understand. is there.
- the abnormality detection unit 430 outputs abnormality information 840 including a chart for representing the abnormality.
- the abnormality detection unit 430 outputs a normal model chart.
- the abnormality detection unit 430 outputs display information representing the temporal changes of the state graph 820, the normal model 830, and the abnormality information 840.
- the second effect of the present embodiment described above is to distinguish between vertices where normal communication occurs and vertices where abnormal communication occurs even when an abnormality actually occurs in the system. This is a possible point. Furthermore, by enabling this identification, it is possible to prevent the occurrence of abnormal communication in advance by permitting communication only between vertices where normal communication is considered to occur.
- the abnormality detection unit 430 or the normal model generation unit 120 compares all vertex combinations with the normal model 830 to extract a combination of vertices determined to be normal, and the extracted combination of vertices is a normal model. Include in chart. Secondly, the abnormality detection unit 430 outputs the normal model chart superimposed on the chart for representing the abnormality.
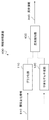
- FIG. 20 is a block diagram showing a configuration of an information processing apparatus 500 according to the fifth embodiment of the present invention.
- the information processing apparatus 500 in the present embodiment replaces the graphing unit 110 with the abnormality detection unit 130 in place of the graphing unit 110, as compared with the information processing apparatus 100 in the first embodiment.
- the difference is that it includes an abnormality detection unit 530 and further includes a history storage unit 540.
- the graphing unit 510 records, at a predetermined timing, information that can restore the state graph 820 at that time in the history storage unit 540 in association with the time at that time, for example.
- the predetermined timing is, for example, a predetermined time.
- the predetermined timing may be a timing at which the number of processes of the relationship change information 810 reaches a predetermined threshold.
- the predetermined timing may be any timing regardless of the above-described example.
- Information that can restore the state graph 820 at that time is, for example, a difference from the state graph 820 at any previous time point (for example, the previous time point). Further, the information that can restore the state graph 820 at that time may be the state graph 820 itself at that time.
- the graphing unit 510 records the latest state graph 820 as a provisional state graph in the history storage unit 540 and updates the time associated with the provisional state graph each time the relationship change information 810 is acquired. Also good. In this case, the graphing unit 510 may stop updating the provisional state graph at the predetermined timing and use the provisional state graph as the confirmed state graph 820.
- the graphing unit 510 is the same as the graphing unit 110 shown in FIG. 1 except for the points described above.
- the history storage unit 540 may further store the provisional state graph described above.
- the abnormality detection unit 530 may detect an abnormality related to the monitoring target system 900 based further on the provisional state graph stored in the history storage unit 540.
- the abnormality detection unit 530 is the same as the abnormality detection unit 130 shown in FIG. 1 except for the points described above.
- the abnormality detection unit 530 includes an abnormality detection unit 130 according to the first embodiment, an abnormality detection unit 230 according to the second embodiment, an abnormality detection unit 330 according to the third embodiment, and an abnormality detection unit according to the fourth embodiment. 430 may include any function.
- the display information in the modified example of the fourth embodiment may be information corresponding to the requested time range.
- the effect of the present embodiment described above is that the abnormality information 840 in the past state graph 820 for the current normal model 830 can be provided to the user in addition to the effect of the first embodiment.
- the graphing unit 510 records the state graph 820 in the history storage unit 540 at a predetermined timing, and the history storage unit 540 stores the state graph 820.
- the abnormality detection unit 530 detects an abnormality related to the monitored system 900 based on the state graph 820 and the normal model 830 stored in the history storage unit 540.
Abstract
Description
図1は、本発明の第1の実施形態に係る情報処理装置100の構成を示すブロック図である。 <<<< first embodiment >>>>
FIG. 1 is a block diagram showing the configuration of the
監視対象システム900は、複数の要素920を含む。そして、その要素920のそれぞれは、他のその要素920のそれぞれと何らかの関係を有する。 === Monitored
The monitored
関係変化監視手段930は、監視対象システム900に含まれる要素920間の、関係の変化を監視する。そして、関係変化監視手段930は、検出したその関係の変化を関係変化情報810として、情報処理装置100に送信する。尚、関係変化監視手段930は、監視対象システム900に含まれてもよい。 ===
The relationship
グラフ化部110は、例えば関係変化監視手段930から、監視対象システム900の関係変化情報810を時系列的に取得する。次に、グラフ化部110は、取得した関係変化情報810に基づいて、状態グラフ820を生成し、その状態グラフ820を異常検出部130へ出力する。 ===
The
関係変化情報810は、監視対象システム900に含まれる要素920間の、関係の変化を示す情報である。具体的には、関係変化情報810は、上述したように、さまざまな関係変化監視手段930から送信される情報である。 === Relation Information 810 ===
The relationship change information 810 is information indicating a change in relationship between the
状態グラフ820は、要素920のそれぞれを頂点(ノードあるいは節点とも呼ばれる)とし、及びそれらの要素920間の関係を辺(リンク、エッジ或いは枝とも呼ばれる)とする、グラフである。状態グラフ820は、監視対象システム900内の要素920間の関係を表す。ここで、その関係は、例えば、「ある期間に、要素間でデータが伝達された」というデータ伝達関係や、「ある瞬間(または期間)に、要素間でデータ伝達が行われうる状態である」というデータ伝達関係などである。 === State Graph 820 ===
The state graph 820 is a graph in which each of the
図5は、状態グラフ821で表される要素920間の、関係を示す概念図である。 === Relationship between
FIG. 5 is a conceptual diagram showing the relationship between the
平常モデル生成部120は、関係変化情報810に基づいて平常モデル830を生成し、その平常モデル830を異常検出部130へ出力する。その平常モデル830は、状態グラフ820が、監視対象システム900の平常時に満たすべき条件の集合である。 === Normal
The normal
図6は、平常モデル830の具体的な例である、平常モデル831の一例を示す図である。図6に示すように、平常モデル831は、条件種別と条件値と有効フラグとを含むレコードからなる。 === Normal model 830 ===
FIG. 6 is a diagram illustrating an example of a normal model 831 that is a specific example of the normal model 830. As shown in FIG. 6, the normal model 831 includes a record including a condition type, a condition value, and a valid flag.
異常検出部130は、状態グラフ820と平常モデル830とに基づいて、監視対象システム900に係る異常を検出し、検出した異常を示す異常情報840を出力する。 ===
The
図7は、異常情報840の具体的な例である、異常情報841の一例を示す図である。図7に示すように、異常情報841は、関係頂点数の上限値の超過が発生したことを示す。 The
FIG. 7 is a diagram illustrating an example of the abnormality information 841, which is a specific example of the abnormality information 840. As shown in FIG. 7, the abnormality information 841 indicates that the upper limit of the number of related vertices has been exceeded.
次に、本発明の第2の実施形態について図面を参照して詳細に説明する。以下、本実施形態の説明が不明確にならない範囲で、前述の説明と重複する内容については説明を省略する。 <<< Second Embodiment >>>
Next, a second embodiment of the present invention will be described in detail with reference to the drawings. Hereinafter, the description overlapping with the above description is omitted as long as the description of the present embodiment is not obscured.
異常検出部230は、検出した異常に対応する、平常モデル830からの状態グラフ820のかい離の度合いを示す異常度を算出し、その異常度を含む異常情報840を出力する。 ===
The
次に、本発明の第3の実施形態について図面を参照して詳細に説明する。以下、本実施形態の説明が不明確にならない範囲で、前述の説明と重複する内容については説明を省略する。 <<< Third Embodiment >>>
Next, a third embodiment of the present invention will be described in detail with reference to the drawings. Hereinafter, the description overlapping with the above description is omitted as long as the description of the present embodiment is not obscured.
異常検出部330は、検出した異常に関連する、頂点(要素920)及び辺(要素920間の関係)を示す情報を含む異常情報840を出力する。 ===
The
次に、本発明の第4実施形態について図面を参照して詳細に説明する。以下、本実施形態の説明が不明確にならない範囲で、前述の説明と重複する内容については説明を省略する。 <<< Fourth Embodiment >>>
Next, a fourth embodiment of the present invention will be described in detail with reference to the drawings. Hereinafter, the description overlapping with the above description is omitted as long as the description of the present embodiment is not obscured.
異常検出部430は、状態グラフ820と平常モデル830とに基づいて生成した、異常を表すための図表を含む異常情報840を出力する。異常を表すための図表は、ネットワーク図(詳細は後述)やマトリックス(詳細は後述)、その他の任意の図表である。 ===
The
異常検出部430は、状態グラフ820、平常モデル830及び異常情報840のそれぞれの時間的変化を、単独で或いは任意に関連付けて表す表示情報を出力してよい。尚、時間的変化とは、即ち時間の経過に伴う変化である。 <<< Modification of Fourth Embodiment >>>
The
次に、本発明の第5実施形態について図面を参照して詳細に説明する。以下、本実施形態の説明が不明確にならない範囲で、前述の説明と重複する内容については説明を省略する。 <<< Fifth Embodiment >>>
Next, a fifth embodiment of the present invention will be described in detail with reference to the drawings. Hereinafter, the description overlapping with the above description is omitted as long as the description of the present embodiment is not obscured.
グラフ化部510は、所定のタイミングで、その時点の状態グラフ820を復元可能な情報を、例えばその時点の時刻を関連付けて、履歴蓄積部540に記録する。その所定のタイミングは、例えば所定の時刻である。また、その所定のタイミングは、関係変化情報810の処理数が、所定の閾値に達するタイミングであってよい。その所定のタイミングは、上述の例に係わらず、任意のタイミングであってよい。その時点の状態グラフ820を復元可能な情報は、例えば、以前のいずれかの時点(例えば、1つ前の時点)の状態グラフ820からの差分である。また、その時点の状態グラフ820を復元可能な情報は、その時点の状態グラフ820そのものであってもよい。 ===
The
履歴蓄積部540は、状態グラフ820を記憶する。履歴蓄積部540は、更に、上述の暫定状態グラフを記憶してよい。 ===
The
異常検出部530は、履歴蓄積部540に記憶されている状態グラフ820と平常モデル830とに基づいて、監視対象システム900に係る異常を検出する。異常検出部530は、履歴蓄積部540に記憶されている暫定状態グラフに更に基づいて、監視対象システム900に係る異常を検出してよい。異常検出部530は、上述の点を除き、図1に示す異常検出部130と同等である。 ===
The
110 グラフ化部
120 平常モデル生成部
130 異常検出部
200 情報処理装置
230 異常検出部
300 情報処理装置
330 異常検出部
400 情報処理装置
430 異常検出部
500 情報処理装置
510 グラフ化部
530 異常検出部
540 履歴蓄積部
700 コンピュータ
701 CPU
702 記憶部
703 記憶装置
704 入力部
705 出力部
706 通信部
707 記録媒体
810 関係変化情報
811 関係変化情報
820 状態グラフ
821 状態グラフ
830 平常モデル
831 平常モデル
840 異常情報
841 異常情報
842 異常情報
843 異常情報
844 異常情報
845 異常情報
900 監視対象システム
920 要素
930 関係変化監視手段 DESCRIPTION OF
702
Claims (13)
- システムに含まれる複数の要素の、関係の変化を示す関係変化情報を時系列的に取得し、前記関係変化情報に基づいて、前記要素を頂点とし前記要素間の関係を辺とする状態グラフを生成するグラフ化手段と、
前記関係変化情報に基づいて、前記状態グラフが、前記システムの平常時に満たすべき条件の集合である平常モデルを生成する平常モデル生成手段と、
前記状態グラフと前記平常モデルとに基づいて、前記システムに係る異常を検出し、検出した前記異常を示す第1の異常情報を出力する異常検出手段と、を含む
情報処理装置。 A state graph is obtained in which a relationship change information indicating a change in relationship of a plurality of elements included in the system is acquired in time series, and based on the relationship change information, the element is a vertex and the relationship between the elements is an edge. A graphing means to generate;
Based on the relationship change information, a normal model generating means for generating a normal model in which the state graph is a set of conditions to be satisfied in the normal state of the system;
An information processing apparatus comprising: an abnormality detection unit that detects an abnormality related to the system based on the state graph and the normal model and outputs first abnormality information indicating the detected abnormality. - 前記システムは、ネットワークで接続された複数のホストを含み、
前記ホスト上で動作するプロセスは、前記頂点である
ことを特徴とする請求項1記載の情報処理装置。 The system includes a plurality of hosts connected by a network,
The information processing apparatus according to claim 1, wherein the process operating on the host is the vertex. - 前記異常検出手段は、前記検出した異常に対応する、前記平常モデルからの前記状態グラフのかい離の度合いを示す異常度を算出し、算出した前記異常度を少なくとも含む前記第1の異常情報を出力する
請求項1または2記載の情報処理装置。 The abnormality detection means calculates an abnormality level indicating a degree of separation of the state graph from the normal model corresponding to the detected abnormality, and outputs the first abnormality information including at least the calculated abnormality level The information processing apparatus according to claim 1 or 2. - 前記異常検出手段は、前記検出した異常に対応する、前記要素の識別情報及び前記要素間の関係の情報を少なくとも含む前記第1の異常情報を出力する
請求項1乃至3のいずれか1項に記載の情報処理装置。 The said abnormality detection means outputs the said 1st abnormality information corresponding to the said detected abnormality at least including the identification information of the said element and the information of the relationship between the said elements. The information processing apparatus described. - 前記異常検出手段は、前記状態グラフと前記第1の異常情報とに基づいて生成した異常を表すための図表を含む第2の異常情報を出力する
請求項1乃至4のいずれか1項に記載の情報処理装置。 5. The second abnormality information including a chart for representing an abnormality generated based on the state graph and the first abnormality information is output from the abnormality detection unit. Information processing device. - 前記異常検出手段は、全ての前記要素間の関係のうち、前記平常モデルと照らし合わせて平常と見なされる前記要素間の関係を抽出し、前記異常を表すための図表に抽出した前記要素間の関係を重畳して出力する
請求項5記載の情報処理装置。 The anomaly detection means extracts the relationship between the elements that are regarded as normal in comparison with the normal model among all the relationships between the elements, and extracts the relationship between the elements extracted in the chart for representing the anomaly The information processing apparatus according to claim 5, wherein the information is output with the relationship superimposed. - 前記異常検出手段は、前記状態グラフと前記平常モデルと前記第2の異常情報のそれぞれの時間的変化を、単独で或いは任意に関連付けて表す表示情報を出力する
請求項5または6記載の情報処理装置。 The information processing apparatus according to claim 5, wherein the abnormality detection unit outputs display information representing temporal changes of the state graph, the normal model, and the second abnormality information independently or in association with each other. apparatus. - 状態グラフを記憶する履歴蓄積手段を更に含み、
前記グラフ化手段は、前記状態グラフを前記履歴蓄積手段に記録し、
前記異常検出手段は、更に、前記履歴蓄積手段に記録された前記履歴状態グラフと前記平常モデルとに基づいて、前記システムに係る異常を検出する
請求項1乃至7のいずれか1項に記載の情報処理装置。 It further includes history storage means for storing the state graph,
The graphing means records the state graph in the history storage means,
8. The abnormality detection unit according to claim 1, further comprising: detecting an abnormality related to the system based on the history state graph recorded in the history storage unit and the normal model. 9. Information processing device. - 前記関係変化情報は、前記要素間の関係の発生、消滅及び変化、並びに要素の発生及び消滅の内、少なくともいずれかひとつを示す情報である
請求項1乃至8のいずれか1項に記載の情報処理装置。 The information according to any one of claims 1 to 8, wherein the relationship change information is information indicating at least one of occurrence, disappearance and change of a relationship between the elements, and occurrence and disappearance of an element. Processing equipment. - 前記平常モデルにおける前記条件は、前記頂点の属性、前記頂点に隣接する頂点の数、前記頂点に隣接する頂点の属性、前記辺の属性、前記頂点間の経路の有無、前記経路の本数、前記経路の距離、前記経路中の前記頂点の属性、前記経路中の前記辺の属性、及び状態グラフの特性の内、少なくともいずれかひとつの範囲を含む
請求項1乃至9のいずれか1項に記載の情報処理装置。 The conditions in the normal model are the attributes of the vertices, the number of vertices adjacent to the vertices, the attributes of vertices adjacent to the vertices, the attributes of the sides, the presence or absence of a path between the vertices, the number of the paths, The distance of a path | route, the attribute of the said vertex in the said path | route, the attribute of the said edge | side in the said path | route, and the characteristic of a state graph are included, At least any one range is included. Information processing device. - 請求項1乃至10のいずれか1項に記載の情報処理装置と、
前記システムを監視し、関係変化情報を送信する関係変化監視手段と、を含む、
情報処理システム。 The information processing apparatus according to any one of claims 1 to 10,
Relationship change monitoring means for monitoring the system and transmitting relationship change information;
Information processing system. - システムに含まれる複数の要素の、関係の変化を示す関係変化情報を時系列的に取得し、前記関係変化情報に基づいて、前記要素を頂点とし前記要素間の関係を辺とする状態グラフを生成し、
前記関係変化情報に基づいて、前記状態グラフが、前記システムの平常時に満たすべき条件の集合である平常モデルを生成し、
前記状態グラフと前記平常モデルとに基づいて、前記システムに係る異常を検出し、
検出した前記異常を示す異常情報を出力する
異常検知方法。 A state graph is obtained in which a relationship change information indicating a change in relationship of a plurality of elements included in the system is acquired in time series, and based on the relationship change information, the element is a vertex and the relationship between the elements is an edge. Generate
Based on the relationship change information, the state graph generates a normal model that is a set of conditions to be satisfied in the normal state of the system,
Based on the state graph and the normal model, detecting an abnormality related to the system,
An abnormality detection method for outputting abnormality information indicating the detected abnormality. - システムに含まれる複数の要素の、関係の変化を示す関係変化情報を時系列的に取得し、前記関係変化情報に基づいて、前記要素を頂点とし前記要素間の関係を辺とする状態グラフを生成し、
前記関係変化情報に基づいて、前記状態グラフが、前記システムの平常時に満たすべき条件の集合である平常モデルを生成し、
前記状態グラフと前記平常モデルとに基づいて、前記システムに係る異常を検出し、
検出した前記異常を示す異常情報を出力する、処理をコンピュータに実行させるプログラムを記録した
コンピュータ読み取り可能な非一時的記録媒体。 A state graph is obtained in which a relationship change information indicating a change in relationship of a plurality of elements included in the system is acquired in time series, and based on the relationship change information, the element is a vertex and the relationship between the elements is an edge. Generate
Based on the relationship change information, the state graph generates a normal model that is a set of conditions to be satisfied in the normal state of the system,
Based on the state graph and the normal model, detecting an abnormality related to the system,
A computer-readable non-transitory recording medium that records a program that outputs abnormality information indicating the detected abnormality and that causes a computer to execute processing.
Priority Applications (4)
| Application Number | Priority Date | Filing Date | Title |
|---|---|---|---|
| JP2016508539A JP6638644B2 (en) | 2014-03-20 | 2015-03-18 | Information processing apparatus and abnormality detection method |
| EP15765705.7A EP3121727B1 (en) | 2014-03-20 | 2015-03-18 | Information processing device and error detection method |
| CN201580015248.8A CN106104497B (en) | 2014-03-20 | 2015-03-18 | Information processing unit and method for detecting abnormality |
| US15/127,354 US10789118B2 (en) | 2014-03-20 | 2015-03-18 | Information processing device and error detection method |
Applications Claiming Priority (4)
| Application Number | Priority Date | Filing Date | Title |
|---|---|---|---|
| JP2014-058497 | 2014-03-20 | ||
| JP2014058497 | 2014-03-20 | ||
| JPPCT/JP2014/003007 | 2014-06-05 | ||
| PCT/JP2014/003007 WO2015140841A1 (en) | 2014-03-20 | 2014-06-05 | Anomaly-detecting information processing device and anomaly detection method |
Publications (1)
| Publication Number | Publication Date |
|---|---|
| WO2015141221A1 true WO2015141221A1 (en) | 2015-09-24 |
Family
ID=54143867
Family Applications (2)
| Application Number | Title | Priority Date | Filing Date |
|---|---|---|---|
| PCT/JP2014/003007 WO2015140841A1 (en) | 2014-03-20 | 2014-06-05 | Anomaly-detecting information processing device and anomaly detection method |
| PCT/JP2015/001500 WO2015141221A1 (en) | 2014-03-20 | 2015-03-18 | Information processing device and error detection method |
Family Applications Before (1)
| Application Number | Title | Priority Date | Filing Date |
|---|---|---|---|
| PCT/JP2014/003007 WO2015140841A1 (en) | 2014-03-20 | 2014-06-05 | Anomaly-detecting information processing device and anomaly detection method |
Country Status (5)
| Country | Link |
|---|---|
| US (1) | US10789118B2 (en) |
| EP (1) | EP3121727B1 (en) |
| JP (1) | JP6638644B2 (en) |
| CN (1) | CN106104497B (en) |
| WO (2) | WO2015140841A1 (en) |
Cited By (6)
| Publication number | Priority date | Publication date | Assignee | Title |
|---|---|---|---|---|
| WO2017094820A1 (en) * | 2015-12-02 | 2017-06-08 | 日本電気株式会社 | Assistance device, assistance method, and recording medium |
| JP2017151949A (en) * | 2016-02-18 | 2017-08-31 | エーオー カスペルスキー ラボAO Kaspersky Lab | System and method for protecting technological systems from cyber attacks |
| JPWO2018101070A1 (en) * | 2016-11-29 | 2019-10-24 | 日本電気株式会社 | Abnormality determination device, abnormality determination method, and abnormality determination program |
| JP2020060992A (en) * | 2018-10-11 | 2020-04-16 | 富士通株式会社 | Display control method, display control program, and display control device |
| US10909014B2 (en) | 2017-02-22 | 2021-02-02 | Nec Corporation | Information processing device, information processing system, monitoring method, and recording medium |
| JP2021110979A (en) * | 2020-01-06 | 2021-08-02 | 日本電気通信システム株式会社 | Autonomous mobile apparatus, learning apparatus, abnormality detection method and program |
Families Citing this family (13)
| Publication number | Priority date | Publication date | Assignee | Title |
|---|---|---|---|---|
| US10338986B2 (en) * | 2016-10-28 | 2019-07-02 | Microsoft Technology Licensing, Llc | Systems and methods for correlating errors to processing steps and data records to facilitate understanding of errors |
| WO2018216197A1 (en) * | 2017-05-26 | 2018-11-29 | 三菱電機ビルテクノサービス株式会社 | Anomaly seriousness computation system, anomaly seriousness computation device, and anomaly seriousness computation program |
| US20210264026A1 (en) * | 2018-06-13 | 2021-08-26 | Panasonic Intellectual Property Management Co., Ltd. | Unauthorized communication detection device, unauthorized communication detection method and manufacturing system |
| JP7063229B2 (en) * | 2018-10-24 | 2022-05-09 | オムロン株式会社 | Controllers and control programs |
| JP7276203B2 (en) * | 2020-03-06 | 2023-05-18 | 横河電機株式会社 | Information processing device, information processing method, and program |
| US11636090B2 (en) * | 2020-03-15 | 2023-04-25 | International Business Machines Corporation | Method and system for graph-based problem diagnosis and root cause analysis for IT operation |
| US11409769B2 (en) | 2020-03-15 | 2022-08-09 | International Business Machines Corporation | Computer-implemented method and system for attribute discovery for operation objects from operation data |
| US20220214677A1 (en) * | 2021-01-05 | 2022-07-07 | Samsung Electronics Company, Ltd. | Detecting anomalous events using a microcontroller |
| US11809471B2 (en) | 2021-10-15 | 2023-11-07 | EMC IP Holding Company LLC | Method and system for implementing a pre-check mechanism in a technical support session |
| US11941641B2 (en) | 2021-10-15 | 2024-03-26 | EMC IP Holding Company LLC | Method and system to manage technical support sessions using historical technical support sessions |
| US11915205B2 (en) | 2021-10-15 | 2024-02-27 | EMC IP Holding Company LLC | Method and system to manage technical support sessions using ranked historical technical support sessions |
| US20230236919A1 (en) * | 2022-01-24 | 2023-07-27 | Dell Products L.P. | Method and system for identifying root cause of a hardware component failure |
| CN114978877B (en) * | 2022-05-13 | 2024-04-05 | 京东科技信息技术有限公司 | Abnormality processing method, abnormality processing device, electronic equipment and computer readable medium |
Citations (2)
| Publication number | Priority date | Publication date | Assignee | Title |
|---|---|---|---|---|
| JP2010128673A (en) * | 2008-11-26 | 2010-06-10 | Nec Corp | Computer network, device, and method of detecting and specifying abnormality, and program thereof |
| JP2012221502A (en) * | 2011-04-08 | 2012-11-12 | Computer Associates Think Inc | Visualization of jvm and cross-jvm call stacks |
Family Cites Families (12)
| Publication number | Priority date | Publication date | Assignee | Title |
|---|---|---|---|---|
| US6141633A (en) * | 1997-02-28 | 2000-10-31 | Fujitsu Limited | Logical device verification method and apparatus |
| JP3755394B2 (en) * | 2000-09-29 | 2006-03-15 | 日本電気株式会社 | Electronic commerce audit system, electronic commerce audit method, and recording medium recording electronic commerce audit program |
| JP2008021274A (en) * | 2006-06-15 | 2008-01-31 | Interlex Inc | Process monitoring device and method |
| CN101083557B (en) | 2007-06-29 | 2010-05-26 | 中兴通讯股份有限公司 | SNMP based IP network cluster managerial approach |
| US7822850B1 (en) * | 2008-01-11 | 2010-10-26 | Cisco Technology, Inc. | Analyzing log files |
| WO2009097435A1 (en) * | 2008-01-29 | 2009-08-06 | Telcordia Technologies, Inc. | System and method for automated distributed diagnostics for networks |
| JP5428372B2 (en) | 2009-02-12 | 2014-02-26 | 日本電気株式会社 | Operation management apparatus, operation management method and program thereof |
| US8555381B2 (en) | 2009-04-01 | 2013-10-08 | Honeywell International Inc. | Cloud computing as a security layer |
| US8392760B2 (en) * | 2009-10-14 | 2013-03-05 | Microsoft Corporation | Diagnosing abnormalities without application-specific knowledge |
| US20130097183A1 (en) | 2011-10-14 | 2013-04-18 | Zenoss, Inc. | Method and apparatus for analyzing a root cause of a service impact in a virtualized environment |
| EP2695307B1 (en) * | 2012-03-06 | 2015-04-22 | Fraunhofer Gesellschaft zur Förderung der angewandten Forschung e.V. | Receiver |
| US8914317B2 (en) * | 2012-06-28 | 2014-12-16 | International Business Machines Corporation | Detecting anomalies in real-time in multiple time series data with automated thresholding |
-
2014
- 2014-06-05 WO PCT/JP2014/003007 patent/WO2015140841A1/en active Application Filing
-
2015
- 2015-03-18 US US15/127,354 patent/US10789118B2/en active Active
- 2015-03-18 JP JP2016508539A patent/JP6638644B2/en active Active
- 2015-03-18 EP EP15765705.7A patent/EP3121727B1/en active Active
- 2015-03-18 WO PCT/JP2015/001500 patent/WO2015141221A1/en active Application Filing
- 2015-03-18 CN CN201580015248.8A patent/CN106104497B/en active Active
Patent Citations (2)
| Publication number | Priority date | Publication date | Assignee | Title |
|---|---|---|---|---|
| JP2010128673A (en) * | 2008-11-26 | 2010-06-10 | Nec Corp | Computer network, device, and method of detecting and specifying abnormality, and program thereof |
| JP2012221502A (en) * | 2011-04-08 | 2012-11-12 | Computer Associates Think Inc | Visualization of jvm and cross-jvm call stacks |
Non-Patent Citations (2)
| Title |
|---|
| OSAMU AKASHI ET AL.: "IM-VIS: Inter-domain network-status visualization system based on information integration", IPSJ SIG NOTES, vol. 2009, no. 6, 21 January 2009 (2009-01-21), pages 75 - 82, XP055226561, ISSN: 0919-6072 * |
| See also references of EP3121727A4 * |
Cited By (10)
| Publication number | Priority date | Publication date | Assignee | Title |
|---|---|---|---|---|
| WO2017094820A1 (en) * | 2015-12-02 | 2017-06-08 | 日本電気株式会社 | Assistance device, assistance method, and recording medium |
| JPWO2017094820A1 (en) * | 2015-12-02 | 2018-10-04 | 日本電気株式会社 | Support device, support method, and program |
| US11372839B2 (en) | 2015-12-02 | 2022-06-28 | Nec Corporation | Anomalous event confirmation assistance apparatus, anomalous event confirmation assistance meithod, and recording medium |
| JP2017151949A (en) * | 2016-02-18 | 2017-08-31 | エーオー カスペルスキー ラボAO Kaspersky Lab | System and method for protecting technological systems from cyber attacks |
| JPWO2018101070A1 (en) * | 2016-11-29 | 2019-10-24 | 日本電気株式会社 | Abnormality determination device, abnormality determination method, and abnormality determination program |
| JP7167714B2 (en) | 2016-11-29 | 2022-11-09 | 日本電気株式会社 | Abnormality determination device, abnormality determination method, and abnormality determination program |
| US10909014B2 (en) | 2017-02-22 | 2021-02-02 | Nec Corporation | Information processing device, information processing system, monitoring method, and recording medium |
| US11914493B2 (en) | 2017-02-22 | 2024-02-27 | Nec Corporation | Information processing device, information processing system, monitoring method, and recording medium |
| JP2020060992A (en) * | 2018-10-11 | 2020-04-16 | 富士通株式会社 | Display control method, display control program, and display control device |
| JP2021110979A (en) * | 2020-01-06 | 2021-08-02 | 日本電気通信システム株式会社 | Autonomous mobile apparatus, learning apparatus, abnormality detection method and program |
Also Published As
| Publication number | Publication date |
|---|---|
| CN106104497A (en) | 2016-11-09 |
| CN106104497B (en) | 2019-07-16 |
| WO2015140841A1 (en) | 2015-09-24 |
| US10789118B2 (en) | 2020-09-29 |
| EP3121727B1 (en) | 2019-06-26 |
| JP6638644B2 (en) | 2020-01-29 |
| JPWO2015141221A1 (en) | 2017-04-06 |
| US20170132060A1 (en) | 2017-05-11 |
| EP3121727A4 (en) | 2017-11-29 |
| EP3121727A1 (en) | 2017-01-25 |
Similar Documents
| Publication | Publication Date | Title |
|---|---|---|
| WO2015141221A1 (en) | Information processing device and error detection method | |
| JP6747287B2 (en) | Information processing apparatus and monitoring method | |
| CN110121876B (en) | System and method for detecting malicious devices by using behavioral analysis | |
| US9853994B2 (en) | Attack analysis system, cooperation apparatus, attack analysis cooperation method, and program | |
| JP6239215B2 (en) | Information processing apparatus, information processing method, and information processing program | |
| US20160014148A1 (en) | Web anomaly detection apparatus and method | |
| JP6690646B2 (en) | Information processing apparatus, information processing system, information processing method, and program | |
| WO2016208159A1 (en) | Information processing device, information processing system, information processing method, and storage medium | |
| CN103955645A (en) | Method, device and system for detecting malicious process behavior | |
| US10091077B1 (en) | Systems and methods for detecting transactional message sequences that are obscured in multicast communications | |
| US20170308688A1 (en) | Analysis apparatus, analysis system, analysis method, and analysis program | |
| KR102469441B1 (en) | A method and an apparatus for monitoring global failure of virtual gateway cluster | |
| CN110619022B (en) | Node detection method, device, equipment and storage medium based on block chain network | |
| CN108804914B (en) | Abnormal data detection method and device | |
| US10282239B2 (en) | Monitoring method | |
| CN110941823A (en) | Threat information acquisition method and device | |
| JP7451476B2 (en) | System and method for cross-referencing forensic snapshots over time for root cause analysis | |
| US11163875B1 (en) | Discovery of computer system incidents to be remediated based on correlation between support interaction data and computer system telemetry data | |
| EP2975524B1 (en) | Information processing device | |
| JP6233414B2 (en) | Information processing apparatus, filtering system, filtering method, and filtering program | |
| US8667340B2 (en) | Method and system for distributed processing of alerts | |
| JP6364727B2 (en) | Information processing system, distributed processing method, and program | |
| JP2015095876A (en) | Plant-monitoring control system | |
| JP7468652B2 (en) | Distributed system, communication terminal, function recovery method, and program | |
| WO2019123449A1 (en) | A system and method for analyzing network traffic |
Legal Events
| Date | Code | Title | Description |
|---|---|---|---|
| 121 | Ep: the epo has been informed by wipo that ep was designated in this application |
Ref document number: 15765705 Country of ref document: EP Kind code of ref document: A1 |
|
| ENP | Entry into the national phase |
Ref document number: 2016508539 Country of ref document: JP Kind code of ref document: A |
|
| WWE | Wipo information: entry into national phase |
Ref document number: 15127354 Country of ref document: US |
|
| NENP | Non-entry into the national phase |
Ref country code: DE |
|
| REEP | Request for entry into the european phase |
Ref document number: 2015765705 Country of ref document: EP |
|
| WWE | Wipo information: entry into national phase |
Ref document number: 2015765705 Country of ref document: EP |