WO2015037446A1 - 褐色脂肪組織の測定方法及び測定装置 - Google Patents
褐色脂肪組織の測定方法及び測定装置 Download PDFInfo
- Publication number
- WO2015037446A1 WO2015037446A1 PCT/JP2014/072497 JP2014072497W WO2015037446A1 WO 2015037446 A1 WO2015037446 A1 WO 2015037446A1 JP 2014072497 W JP2014072497 W JP 2014072497W WO 2015037446 A1 WO2015037446 A1 WO 2015037446A1
- Authority
- WO
- WIPO (PCT)
- Prior art keywords
- hemoglobin concentration
- light
- measurement
- bat
- adipose tissue
- Prior art date
- Legal status (The legal status is an assumption and is not a legal conclusion. Google has not performed a legal analysis and makes no representation as to the accuracy of the status listed.)
- Ceased
Links
Images


Classifications
-
- A—HUMAN NECESSITIES
- A61—MEDICAL OR VETERINARY SCIENCE; HYGIENE
- A61B—DIAGNOSIS; SURGERY; IDENTIFICATION
- A61B5/00—Measuring for diagnostic purposes; Identification of persons
- A61B5/0059—Measuring for diagnostic purposes; Identification of persons using light, e.g. diagnosis by transillumination, diascopy, fluorescence
-
- A—HUMAN NECESSITIES
- A61—MEDICAL OR VETERINARY SCIENCE; HYGIENE
- A61B—DIAGNOSIS; SURGERY; IDENTIFICATION
- A61B5/00—Measuring for diagnostic purposes; Identification of persons
- A61B5/145—Measuring characteristics of blood in vivo, e.g. gas concentration or pH-value ; Measuring characteristics of body fluids or tissues, e.g. interstitial fluid or cerebral tissue
- A61B5/1455—Measuring characteristics of blood in vivo, e.g. gas concentration or pH-value ; Measuring characteristics of body fluids or tissues, e.g. interstitial fluid or cerebral tissue using optical sensors, e.g. spectral photometrical oximeters
-
- A—HUMAN NECESSITIES
- A61—MEDICAL OR VETERINARY SCIENCE; HYGIENE
- A61B—DIAGNOSIS; SURGERY; IDENTIFICATION
- A61B5/00—Measuring for diagnostic purposes; Identification of persons
- A61B5/48—Other medical applications
- A61B5/4869—Determining body composition
- A61B5/4872—Body fat
-
- A—HUMAN NECESSITIES
- A61—MEDICAL OR VETERINARY SCIENCE; HYGIENE
- A61B—DIAGNOSIS; SURGERY; IDENTIFICATION
- A61B5/00—Measuring for diagnostic purposes; Identification of persons
- A61B5/02—Detecting, measuring or recording for evaluating the cardiovascular system, e.g. pulse, heart rate, blood pressure or blood flow
- A61B5/026—Measuring blood flow
- A61B5/0261—Measuring blood flow using optical means, e.g. infrared light
-
- A—HUMAN NECESSITIES
- A61—MEDICAL OR VETERINARY SCIENCE; HYGIENE
- A61B—DIAGNOSIS; SURGERY; IDENTIFICATION
- A61B5/00—Measuring for diagnostic purposes; Identification of persons
- A61B5/145—Measuring characteristics of blood in vivo, e.g. gas concentration or pH-value ; Measuring characteristics of body fluids or tissues, e.g. interstitial fluid or cerebral tissue
- A61B5/14546—Measuring characteristics of blood in vivo, e.g. gas concentration or pH-value ; Measuring characteristics of body fluids or tissues, e.g. interstitial fluid or cerebral tissue for measuring analytes not otherwise provided for, e.g. ions, cytochromes
-
- A—HUMAN NECESSITIES
- A61—MEDICAL OR VETERINARY SCIENCE; HYGIENE
- A61B—DIAGNOSIS; SURGERY; IDENTIFICATION
- A61B5/00—Measuring for diagnostic purposes; Identification of persons
- A61B5/145—Measuring characteristics of blood in vivo, e.g. gas concentration or pH-value ; Measuring characteristics of body fluids or tissues, e.g. interstitial fluid or cerebral tissue
- A61B5/1455—Measuring characteristics of blood in vivo, e.g. gas concentration or pH-value ; Measuring characteristics of body fluids or tissues, e.g. interstitial fluid or cerebral tissue using optical sensors, e.g. spectral photometrical oximeters
- A61B5/14551—Measuring characteristics of blood in vivo, e.g. gas concentration or pH-value ; Measuring characteristics of body fluids or tissues, e.g. interstitial fluid or cerebral tissue using optical sensors, e.g. spectral photometrical oximeters for measuring blood gases
-
- A—HUMAN NECESSITIES
- A61—MEDICAL OR VETERINARY SCIENCE; HYGIENE
- A61B—DIAGNOSIS; SURGERY; IDENTIFICATION
- A61B5/00—Measuring for diagnostic purposes; Identification of persons
- A61B5/72—Signal processing specially adapted for physiological signals or for diagnostic purposes
- A61B5/7271—Specific aspects of physiological measurement analysis
- A61B5/7275—Determining trends in physiological measurement data; Predicting development of a medical condition based on physiological measurements, e.g. determining a risk factor
-
- G—PHYSICS
- G01—MEASURING; TESTING
- G01N—INVESTIGATING OR ANALYSING MATERIALS BY DETERMINING THEIR CHEMICAL OR PHYSICAL PROPERTIES
- G01N21/00—Investigating or analysing materials by the use of optical means, i.e. using sub-millimetre waves, infrared, visible or ultraviolet light
- G01N21/17—Systems in which incident light is modified in accordance with the properties of the material investigated
- G01N21/25—Colour; Spectral properties, i.e. comparison of effect of material on the light at two or more different wavelengths or wavelength bands
- G01N21/31—Investigating relative effect of material at wavelengths characteristic of specific elements or molecules, e.g. atomic absorption spectrometry
- G01N21/35—Investigating relative effect of material at wavelengths characteristic of specific elements or molecules, e.g. atomic absorption spectrometry using infrared light
- G01N21/359—Investigating relative effect of material at wavelengths characteristic of specific elements or molecules, e.g. atomic absorption spectrometry using infrared light using near infrared light
Definitions
- the present invention relates to a brown adipose tissue measuring method and measuring apparatus.
- Non-Patent Document 1 describes a method for measuring the temperature of brown adipocytes as an application of a non-contact type temperature measurement method using a near-infrared spectroscopy measurement method for a trace amount aqueous solution.
- brown fat cells are irradiated with infrared light, and the temperature of the brown fat cells is measured based on the absorbance.
- it is activated by administering noradrenaline to cultured BAT cells on a petri dish, and the temperature change of brown adipocytes is measured.
- WAT White Adipose Tissue
- BAT Brown Adipose Tissue; BAT that generates heat by burning fat when the surroundings are cold or after meals, etc.
- WAT is present throughout the body, but BAT is limited to the supraclavicular fossa, paraspinal cord, near the heart, and the like. BAT dissipates energy as heat by uncoupling protein (UCP-1) under cold conditions, etc., so it is easy to consume energy and is involved in the prevention of obesity and lifestyle-related diseases.
- UCP-1 uncoupling protein
- the present inventors gave a healthy adult a cold stimulus (room temperature 19 ° C, cools the sole with an ice bag) for 2 hours, and measured by FDG-PET / CT. FDG accumulation was observed. And even if it is the same test subject, since FDG accumulation is not confirmed unless cold stimulation is performed, it turned out that BAT which can be activated by cold stimulation exists also in an adult. Furthermore, the present inventors have found out that obesity (middle-aged fatness) associated with aging is due to a decrease in BAT, and even if BAT has a reduced function, it can be repeated by continuing active cold stimulation. It has been found that it is possible to activate and increase the amount, which leads to a decrease in body fat.
- the present invention has been made in view of such problems, and an object thereof is to provide a brown adipose tissue measurement method and measurement apparatus that can reduce the burden on the subject.
- a brown adipose tissue measurement method includes a light incident step of injecting near-infrared light from a light incident portion to a measurement site, A light detection step for detecting the light intensity of near-infrared light propagating through the light, and the oxygenated hemoglobin concentration, total hemoglobin concentration at the measurement site, obtained by a near-infrared spectroscopic measurement method based on the detection result in the light detection unit, And an operation step of calculating an index value relating to the amount of brown adipose tissue from at least one numerical value of the first parameter that increases or decreases according to the oxygenated hemoglobin concentration or the total hemoglobin concentration.
- the brown adipose tissue measurement method includes a light incident step in which near-infrared light is incident on the measurement site from the light incidence unit, and a light intensity of the near-infrared light that has propagated inside the measurement site in the light detection unit. And an index related to the amount of brown adipose tissue obtained from at least one of the scattering coefficient and deoxygenated hemoglobin concentration of the measurement site, which is obtained by a near-infrared spectroscopic measurement method based on the detection result in the light detection unit. And a calculation step for calculating a value.
- the brown adipose tissue measuring apparatus includes a light incident unit that makes near-infrared light incident on a measurement site, and a light detection unit that detects the light intensity of the near-infrared light that has propagated through the measurement site. And the oxygenated hemoglobin concentration, the total hemoglobin concentration, and the oxygenated hemoglobin concentration or the total hemoglobin concentration at the site to be measured, which are obtained by a near infrared spectroscopic measurement method based on the detection result in the light detection unit. And an arithmetic unit that calculates an index value related to the amount of brown adipose tissue from at least one numerical value of one parameter.
- the brown adipose tissue measuring apparatus includes a light incident unit that inputs near-infrared light to a measurement site, a light detection unit that detects the light intensity of near-infrared light that has propagated through the measurement site, and a light A calculation unit that calculates an index value related to the amount of brown adipose tissue from at least one of a scattering coefficient and a deoxygenated hemoglobin concentration of a measurement site, which is obtained by a near-infrared spectroscopy measurement method based on a detection result in the detection unit It is characterized by that.
- the calculation step increases or decreases according to the oxygenated hemoglobin concentration, total hemoglobin concentration, and oxygenated hemoglobin concentration or total hemoglobin concentration obtained by the near infrared spectroscopy measurement method.
- An index relating to the amount of BAT based on at least one of the first parameters (for example, absorption coefficient) (hereinafter referred to as hemoglobin concentration or the like) or based on at least one of the scattering coefficient and deoxygenated hemoglobin concentration The value is calculated.
- non-invasive measurement using near-infrared spectroscopy does not require the application of a cold load, enables measurement in a short time (for example, 5 minutes) at room temperature, and exposes the subject to radiation exposure. Also not accompanied. Therefore, according to this method and apparatus, the burden on the subject can be reduced.
- the PET apparatus is expensive and large.
- the near-infrared spectroscopic measurement device is cheaper and smaller than the PET device. Therefore, according to the above method and apparatus, BAT can be measured very easily.
- the burden on the subject can be reduced.
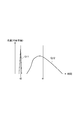
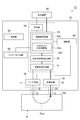
- FIG. 1 is a block diagram schematically showing a configuration of an embodiment of a measuring apparatus.
- FIG. 2 is a graph showing an example of temporal changes in the light intensity of the pulsed light emitted from the light incident part and the detection light detected in the light detection part.
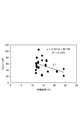
- FIG. 3 is a graph showing the correlation between the oxygenated hemoglobin concentration in the supraclavicular fossa and the body fat percentage as an example of the correlation stored in the storage unit.
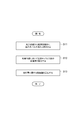
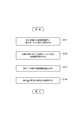
- FIG. 4 is a flowchart illustrating a measurement method according to an embodiment.
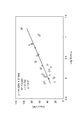
- FIG. 5 is a graph showing the relationship between oxygenated hemoglobin concentration and BAT activity in the supraclavicular fossa.
- FIG. 6 is a graph showing the relationship between the oxygenated hemoglobin concentration in the lower clavicle and the activity of BAT.
- FIG. 7 is a graph showing the relationship between oxygenated hemoglobin concentration and activity of BAT in the deltoid muscle.
- FIG. 8 is a graph showing the correlation between oxygenated hemoglobin concentration and body fat percentage in the supraclavicular fossa.
- FIG. 9 is a graph showing the correlation between oxygenated hemoglobin concentration and body fat percentage in the lower clavicle.
- FIG. 10 is a graph showing the correlation between oxygenated hemoglobin concentration and body fat percentage in the deltoid muscle.
- FIG. 11 is a graph showing a typical correlation between oxygenated hemoglobin concentration and body fat percentage.
- FIG. 12 is a graph showing an example of the relationship between subcutaneous fat thickness and measurement sensitivity.
- FIG. 13 is a graph showing the relationship between the corrected oxygenated hemoglobin concentration and the body fat percentage in the supraclavicular fossa.
- FIG. 14 is a graph showing the relationship between the corrected oxygenated hemoglobin concentration and the body fat percentage in the lower clavicle.
- FIG. 15 is a graph showing the relationship between the corrected oxygenated hemoglobin concentration and the body fat percentage in the deltoid muscle.
- FIG. 16 is a graph showing the relationship between the corrected oxygenated hemoglobin concentration and the activity of BAT in the supraclavicular fossa.
- FIG. 17 is a graph showing the relationship between the corrected oxygenated hemoglobin concentration in the lower clavicle and the activity of BAT.
- FIG. 18 is a graph showing the relationship between the corrected oxygenated hemoglobin concentration and the activity of BAT in the deltoid muscle.
- FIG. 19 is a graph showing the average value of oxygenated hemoglobin concentration after correction in (a) supraclavicular fossa, (b) lower clavicle, and (c) deltoid muscle.
- FIG. 20 is a graph showing the relationship between the total hemoglobin concentration corrected by the body fat percentage in the supraclavicular fossa and the activity of BAT.
- FIG. 21 is a graph showing the relationship between the total hemoglobin concentration corrected by the body fat percentage in the lower clavicle and the activity of BAT.
- FIG. 22 is a graph showing the relationship between the total hemoglobin concentration corrected by the body fat percentage in the deltoid muscle and the BAT activity.
- FIG. 23 is a graph showing the relationship between the absorption coefficient in the supraclavicular fossa and the activity of BAT.
- FIG. 24 is a graph showing the relationship between the absorption coefficient in the lower clavicle and the activity of BAT.
- FIG. 25 is a graph showing the relationship between the absorption coefficient of the deltoid muscle and the activity of BAT.
- FIG. 26 is a graph showing the correlation between the absorption coefficient and the body fat percentage in the supraclavicular fossa.
- FIG. 27 is a graph showing the correlation between the absorption coefficient and the body fat percentage at the lower part of the clavicle.
- FIG. 28 is a graph showing the correlation between the absorption coefficient and the body fat percentage in the deltoid muscle.
- FIG. 29 is a graph showing the relationship between the corrected absorption coefficient and the activity of BAT in the supraclavicular fossa.
- FIG. 30 is a graph showing the relationship between the corrected absorption coefficient in the lower clavicle and the activity of BAT.
- FIG. 31 is a graph showing the relationship between the corrected absorption coefficient of the deltoid muscle and the activity of BAT.
- FIG. 32 is a block diagram schematically showing the configuration of the second embodiment of the measuring apparatus.
- FIG. 33 is a graph showing the relationship between the scattering coefficient in the supraclavicular fossa and the activity of BAT.
- FIG. 34 is a graph showing the relationship between the scattering coefficient in the lower clavicle and the activity of BAT.
- FIG. 35 is a graph showing the relationship between the scattering coefficient in the deltoid muscle and the activity of BAT.
- FIG. 36 is a graph showing the correlation between the scattering coefficient and the body fat percentage in the supraclavicular fossa.
- FIG. 37 is a graph showing the correlation between the scattering coefficient and the body fat percentage at the lower part of the clavicle.
- FIG. 38 is a graph showing the correlation between the scattering coefficient and the body fat percentage in the deltoid muscle.
- FIG. 39 is a graph showing the relationship between deoxygenated hemoglobin concentration and BAT activity in the supraclavicular fossa.
- FIG. 40 is a graph showing the correlation between deoxygenated hemoglobin concentration and body fat percentage in the supraclavicular fossa.
- FIG. 41 is a block diagram schematically showing the configuration of the third embodiment of the measuring apparatus.
- FIG. 42 is a flowchart illustrating the operation of the measurement apparatus and the measurement method according to the third embodiment.
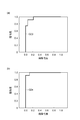
- FIG. 43 shows (a) an ROC curve of a discrimination result based on an index value calculated from the oxygenated hemoglobin concentration C HbO2 , and (b) an ROC curve of a discrimination result based on the index value calculated from the total hemoglobin concentration C tHb. is there.
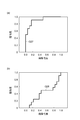
- FIG. 44 shows (a) a ROC curve of a discrimination result based on the index value calculated from the absorption coefficient ⁇ a (wavelength 760 nm), and (b) a discrimination based on the index value calculated from the absorption coefficient ⁇ a (wavelength 800 nm). It is a ROC curve of a result.
- FIG. 45 shows (a) the ROC curve of the discrimination result based on the index value calculated from the scattering coefficient ⁇ ′ s (wavelength 760 nm), and (b) the index value calculated from the scattering coefficient ⁇ ′ s (wavelength 800 nm). It is the ROC curve of the discrimination
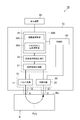
- FIG. 1 is a block diagram schematically showing the configuration of a first embodiment of a measuring apparatus according to the present invention.
- This measuring apparatus 1A is an apparatus that calculates an index value related to the BAT amount from a numerical value related to the hemoglobin concentration of the measurement site B of a living body obtained by time-resolved spectroscopic measurement using near infrared light.
- the measurement by the measuring apparatus 1A is performed at room temperature (constant temperature) and in a resting state.
- the numerical value related to the hemoglobin concentration refers to at least one of the oxygenated hemoglobin concentration, the total hemoglobin concentration, and the parameter that increases or decreases according to the oxygenated hemoglobin concentration or the total hemoglobin concentration.
- the parameter that increases or decreases according to the oxygenated hemoglobin concentration or the total hemoglobin concentration include parameters (absorption coefficient, etc.) used when the oxygenated hemoglobin concentration or the total hemoglobin concentration is calculated.
- the measurement site B all the sites of the living body can be mentioned. For example, the supraclavicular fossa with many BATs, the paraspinal cord, and the vicinity of the heart.
- the 1A includes a main body 70 and a display device 80.
- the main body 70 includes a light incident unit 10, a light detection unit 20, a calculation unit 30, a parameter input unit 50, and a control unit 60 that performs these controls.
- one light incident position S is set on the surface Ba of the measurement site B.
- the light incident part 10 includes a pulse light source 11 that generates pulsed light P (n) and a light incident light guide 12.
- the input end of the light incident light guide 12 is optically connected to the pulse light source 11.
- the output end of the light incident light guide 12 is disposed at the light incident position S of the measurement site B.
- the pulse light source 11 various devices such as a light emitting diode, a laser diode, and various pulse laser devices are used.
- the pulsed light P (n) generated in the pulsed light source 11 has a pulse time width that is short enough to measure the amount of change in the absorption coefficient of the measurement site B, and the light absorptance in the light absorption characteristics of the substance to be measured.
- Near-infrared pulsed light having a high wavelength as a center wavelength is used.
- n 3
- the wavelengths of the pulsed lights P (1) to P (3) are 760 nm, 795 nm, and 830 nm, respectively.
- the light incident light guide 12 for example, an optical fiber is used.
- the light detection unit 20 detects the pulsed light P (n) that has propagated through the measurement site B as detection light.
- one light detection position D is set on the surface Ba of the measurement site B.
- the light detection unit 20 includes a light detection light guide 21 and a light detector 22 that detects light and converts it into an electrical detection signal.
- the input end of the light detection light guide 21 is disposed at the light detection position D of the measurement site B.
- the output end of the light guide 21 for light detection is optically connected to the light detector 22.
- an optical fiber is used as the light guide 21 for light detection.
- the photodetector 22 various types such as a photomultiplier tube, a photodiode, an avalanche photodiode, and a PIN photodiode are used.
- the light detector 22 may be selected as long as it has a spectral sensitivity characteristic that can sufficiently detect the light intensity in the wavelength region of the pulsed light P (n) emitted from the pulsed light source 11. When the detection light is weak, a high sensitivity or high gain photodetector may be used.
- FIG. 2 is a graph showing an example of temporal changes in the light intensity of the pulsed light P (n) emitted from the light incident unit 10 and the detection light detected by the light detection unit 20.
- the vertical axis indicates the light amount (logarithmic scale), and the horizontal axis indicates time.
- Graph G11 is the time waveform of the pulsed light intensity incident from the light incident portion 10 to the measurement site B at time t 0 (the incident wave).
- Graph G12 is the time waveform of the detected light intensity corresponding to the incident pulsed light at time t 0 (detection waveform).
- the detected waveform is a certain distribution curve.
- the calculation unit 30 includes a time waveform measurement unit 31, a bio-optical property measurement unit 32, and a calculation processing unit 33.
- the time waveform measurement unit 31 is electrically connected to the light detector 22 and acquires a time waveform regarding the light intensity of the detection light based on the light detection signal from the light detector 22.
- a trigger signal indicating the light emission timing of the pulsed light P (n) is provided from the pulse light source 11 to the time waveform measuring unit 31.
- a time waveform at each measurement time is obtained.
- the bio-optical property measurement unit 32 calculates a parameter (for example, an absorption coefficient) representing the light absorption characteristic of the measurement site B.
- the calculation processing unit 33 includes a hemoglobin concentration calculation unit 33a and an index value calculation unit 33b.
- the hemoglobin concentration calculation unit 33a acquires a parameter representing the light absorption characteristics of the measurement site B from the bio-optical characteristic measurement unit 32, and performs a predetermined calculation to thereby obtain various hemoglobin concentrations (oxygenated hemoglobin concentration and oxygen concentration in the measurement site B). (Including at least one of the total hemoglobin concentrations).
- the index value calculation unit 33b increases or decreases according to the oxygenated hemoglobin concentration and the total hemoglobin concentration calculated by the hemoglobin concentration calculation unit 33a and the oxygenated hemoglobin concentration or the total hemoglobin concentration calculated by the bio-optical property measurement unit 32.
- An index value related to the BAT amount is calculated from at least one of parameters (for example, an absorption coefficient).
- the display device 80 is connected to the main body 70.
- the display device 80 displays the index value related to the BAT amount calculated by the index value calculation unit 33b of the calculation processing unit 33, and provides the index value to the person who performs the measurement and the subject.
- the bio-optical characteristic measurement unit 32 calculates the absorption coefficients ⁇ a and ⁇ for each wavelength ⁇ in the measurement site B.
- the absorption coefficients ⁇ a and 760 at a wavelength of 760 nm, the absorption coefficients ⁇ a and 795 at a wavelength of 795 nm, and the absorption coefficients ⁇ a and 830 at a wavelength of 830 nm are obtained, respectively.
- these absorption coefficient mu a, lambda is suitably determined, for example using a diffusion equation.
- the hemoglobin concentration calculation unit 33a of the calculation processing unit 33 solves simultaneous equations related to the absorption coefficients ⁇ a and ⁇ expressed by the following equation (1), thereby obtaining the oxygenated hemoglobin concentration (C HbO2 ) of the measurement site B and Deoxygenated hemoglobin concentration (C Hb ) is calculated.
- ⁇ HbO2 is the extinction coefficient of oxygenated hemoglobin at the wavelength ⁇
- ⁇ Hb ⁇ is the extinction coefficient of deoxygenated hemoglobin at the wavelength ⁇ , both of which are known values.
- the hemoglobin concentration calculation unit 33a calculates the total hemoglobin concentration (C tHb ) from these hemoglobin concentrations.
- the hemoglobin concentration calculation unit 33a can calculate the oxygen saturation (SO 2 ) from these hemoglobin concentrations as necessary.
- the index value calculation unit 33b of the calculation processing unit 33 is based on the oxygenated hemoglobin concentration and / or the total hemoglobin concentration calculated by the hemoglobin concentration calculation unit 33a and the parameter related to the body fat amount of the subject, and the index value related to the BAT amount. Is calculated.
- examples of the parameters related to the body fat mass of the subject include body fat percentage.
- a parameter relating to the body fat mass of the subject is input from the parameter input unit 50 and provided to the index value calculation unit 33b.
- the main unit 70 further includes a storage unit 40 such as a nonvolatile memory.
- storage part 40 memorize
- the index value calculation unit 33b uses the correlation data stored in the storage unit 40 to correct so that the influence of the body fat mass (mainly subcutaneous fat) on the oxygenated hemoglobin concentration and / or the total hemoglobin concentration is reduced.
- a numerical value is calculated as an index value related to the BAT amount.
- a univariate analysis analysis method is mentioned, for example.
- Examples of methods for measuring body fat percentage include caliper method, bioelectrical impedance method (BIA method), air displacement method, underwater weight weighing method, dual-energy X-ray absorption method (Dual-energy X-ray Absorptiometry). DXA method).
- Figure 3 shows, as an example of a correlation stored in the storage unit 40 is a graph showing the correlation between the body fat percentage oxygenated hemoglobin concentration of supraclavicular (C HbO2).
- the vertical axis represents oxygenated hemoglobin concentration (unit: ⁇ M), and the horizontal axis represents body fat percentage (unit:%).
- Correlation data between the oxygenated hemoglobin concentration in the supraclavicular fossa and the body fat percentage is suitably represented by, for example, an approximate straight line L1 shown in FIG.
- the correlation data stored in the storage unit 40 is not limited to one approximate line L1, and the approximate line may change as the number of data increases.
- the index value calculation unit 33b calculates the index value related to the BAT amount from the oxygenated hemoglobin concentration and / or the total hemoglobin concentration. However, the index value calculation unit 33b does not include the oxygenated hemoglobin concentration or the total hemoglobin.
- An index value related to the amount of BAT may be calculated from a parameter that increases or decreases in accordance with the concentration (for example, absorption coefficient ⁇ a , ⁇ , etc.), and BAT is calculated using both the parameter and the oxygenated hemoglobin concentration and / or the total hemoglobin concentration. You may calculate the index value regarding quantity. In that case, the memory
- FIG. 4 is a flowchart showing the measurement method according to the present embodiment.
- first, near-infrared pulsed light P (n) is incident on the measurement site B from the light incident part 10 (light incident step S11).
- the light detection unit 20 detects the light intensity of the near-infrared pulsed light P (n) propagated through the measurement site B (light detection step S12).
- the calculation unit 30 causes the oxygenated hemoglobin concentration and / or the total hemoglobin concentration and the oxygenated hemoglobin concentration or the total hemoglobin of the measurement site B to be measured. At least one numerical value is obtained from parameters that increase or decrease in accordance with the concentration (for example, absorption coefficients ⁇ a , ⁇ , etc.). And the calculating part 30 calculates the index value regarding BAT amount from this at least one numerical value (calculation step S13).
- the influence of the body fat amount is reduced by using the data relating to the body fat amount input from the parameter input unit 50 and the data stored in the storage unit 40 and representing the correlation between the at least one numerical value.
- the numerical value corrected in this way may be used as an index value related to the BAT amount.
- the inventors have now found that the activity of BAT can be evaluated by measuring the tissue accumulation degree of FDG using a PET apparatus.
- a PET apparatus it is necessary to activate the BAT by applying a long-time cold load to the subject, and the patient is rested for about 1 hour after the FDG injection until imaging. Since it is necessary and the subject needs to receive radiation, the burden on the subject is great. Furthermore, the measurable time is limited to winter.
- BAT has many capillaries, and when activated, the blood volume increases and the blood volume increases compared to WAT. Therefore, it is considered that the blood volume increases as the activity value of BAT (maximum value of FDG accumulation, SUV max ) increases.
- the oxygenated hemoglobin concentration and the total hemoglobin concentration obtained by the time-resolved spectroscopic measurement method which is a kind of the near infrared spectroscopic measurement method in the calculation unit 30 and the calculation step S13.
- an index value related to the BAT amount is calculated based on at least one numerical value among parameters (first parameters) such as an absorption coefficient that increases or decreases in accordance with these.
- the burden on the subject can be remarkably reduced. Furthermore, the measurable time is not limited. And if such a simple method becomes widespread, the subject can measure the amount of BAT without burden, and research on the BAT of the human body, such as development and evaluation of an obesity elimination method for adults, can be advanced.
- the PET apparatus is expensive and large.
- the near-infrared spectroscopic measurement apparatus can be configured to be cheaper and smaller than the PET apparatus. Therefore, according to the measurement apparatus 1A and the measurement method of the present embodiment, the measurement of BAT can be performed very simply.
- the near-infrared spectroscopy measurement method is used also in the nonpatent literature 1, in the nonpatent literature 1, the cultured cell is made into the measuring object and the temperature measurement of the cell is performed paying attention to the temperature of water.
- the measuring apparatus 1A and the measuring method according to the present embodiment pay attention to the relationship between the hemoglobin concentration and the like and the BAT amount, and the method described in Non-Patent Document 1 is aimed at quantifying the BAT amount. Is different.
- the body fat in the hemoglobin concentration or the like is obtained by using the data representing the correlation between the body fat mass parameter (second parameter) and the hemoglobin concentration or the like.
- a numerical value corrected so as to reduce the influence of the amount may be used as an index value related to the BAT amount.
- the hemoglobin concentration measured by near-infrared spectroscopy is susceptible to white adipose tissue (WAT) such as subcutaneous fat. That is, the absorbance of WAT is extremely small compared to muscle, and the individual difference in the amount of WAT, that is, the amount of body fat, is large. Therefore, the person with more body fat has a lower hemoglobin concentration, and the person with less body fat has a higher hemoglobin concentration. There is a tendency to be estimated. Moreover, since BAT promotes energy consumption, people with higher BAT activity values tend to have less body fat. Therefore, individual differences in body fat mass may be reflected directly as values such as hemoglobin concentration.
- WAT white adipose tissue
- the measurement apparatus 1A and the measurement method according to the present embodiment for example, data representing a correlation between a body fat amount parameter such as a body fat percentage and a hemoglobin concentration or the like is used, and the influence of the body fat amount included in the hemoglobin concentration or the like is influenced.
- the numerical value is corrected so as to decrease, and the corrected numerical value is used as an index value related to the BAT amount. Thereby, the influence on the index value by the body fat amount can be suppressed, and the BAT amount can be evaluated with higher accuracy.
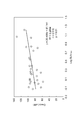
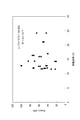
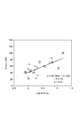
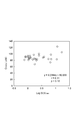
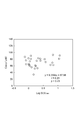
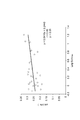
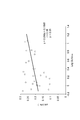
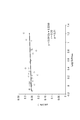
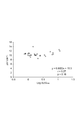
- FIG. 5 to 7 are graphs showing the relationship between the oxygenated hemoglobin concentration C HbO2 and the activity SUV max of BAT.
- FIG. 5 shows the relationship in the supraclavicular fossa
- FIG. 6 shows the relationship in the lower clavicle
- FIG. 7 shows the relationship in the deltoid muscle.
- the vertical axis represents oxygenated hemoglobin concentration C HbO2 (unit: ⁇ M)
- the horizontal axis represents the common logarithm of activity SUV max .
- a relational expression including x and y is an expression representing an approximate line
- R is a correlation coefficient of the approximate line.
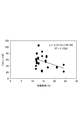
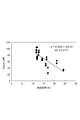
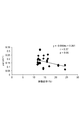
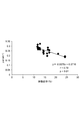
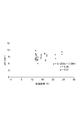
- FIG. 8 to 10 are graphs showing the correlation between the oxygenated hemoglobin concentration C HbO2 and the body fat percentage.
- FIG. 8 shows the relationship in the supraclavicular fossa
- FIG. 9 shows the relationship in the lower clavicle
- FIG. 10 shows the relationship in the deltoid muscle.
- the vertical axis represents oxygenated hemoglobin concentration C HbO2 (unit: ⁇ M)
- the horizontal axis represents body fat percentage (unit:%).
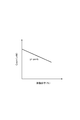
- FIG. 11 is a graph showing a typical correlation between oxygenated hemoglobin concentration C HbO2 and body fat percentage.
- the oxygenated hemoglobin concentration C HbO2 and the body fat percentage have a linear relationship.
- the relationship between the body fat percentage x (%) of all subjects and the oxygenated hemoglobin concentration y ( ⁇ M), y ax + b (2)
- the average value y 0 of the oxygenated hemoglobin concentration is calculated by multiplying the average value x 0 of the body fat percentage of all the subjects by a and adding b.
- y 0 ax 0 + b (5)
- corrected oxygenated hemoglobin concentration value C3 is calculated.
- the oxygenated hemoglobin concentration C HbO2 corrected to reduce the influence of the body fat percentage is obtained.
- correction method for the hemoglobin concentration and the like is not limited to the above.
- correction may be performed using other parameters related to the body fat mass. Examples of other parameters include subcutaneous fat thickness and fat amount estimated from spectral characteristics.
- FIG. 12 is a graph showing an example of the relationship between subcutaneous fat thickness and measurement sensitivity described in Non-Patent Document 6. Using such a relationship, the hemoglobin concentration or the like may be corrected.
- the measured hemoglobin concentration or the like is divided by the measurement sensitivity 0.7, so that when the subcutaneous fat is 0 mm (that is, subcutaneous fat) It is possible to obtain a hemoglobin concentration or the like from which the influence of the thickness is removed.
- FIGS. 13 to 15 are graphs showing the relationship between the corrected oxygenated hemoglobin concentration C HbO2 and the body fat percentage.
- FIG. 13 shows the relationship in the supraclavicular fossa
- FIG. 14 shows the relationship in the lower clavicle
- FIG. 15 shows the relationship in the deltoid muscle.
- the vertical axis represents the corrected oxygenated hemoglobin concentration C HbO2 (unit: ⁇ M)
- the horizontal axis represents the body fat percentage (unit:%). 13 to 15, it can be seen that the slope of the approximate line and the correlation coefficient R are extremely small, and the oxygenated hemoglobin concentration C HbO2 is hardly affected by the body fat percentage.
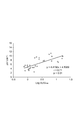
- FIGS. 16 to 18 are graphs showing the relationship between the corrected oxygenated hemoglobin concentration C HbO2 and the BAT activity SUV max .
- FIG. 16 shows the relationship in the supraclavicular fossa
- FIG. 17 shows the relationship in the lower clavicle
- FIG. 18 shows the relationship in the deltoid muscle.
- the vertical axis represents oxygenated hemoglobin concentration C HbO2 (unit: ⁇ M)
- the horizontal axis represents the common logarithm of activity SUV max .
- FIGS. 16 to 18 only in the supraclavicular fossa BAT is present, a strong correlation between the activity of SUV max of oxygenated hemoglobin concentration and BAT has been found. Accordingly, the BAT activity SUV max can be accurately evaluated based on the corrected oxygenated hemoglobin concentration C HbO2 .
- FIG. 19 is a graph showing the comparison, where (a) is the supraclavicular fossa, (b) is the lower clavicle, and (c) is the average value of the corrected oxygenated hemoglobin concentration C HbO2 (unit: ⁇ M) in the deltoid muscle. Represents.
- the corrected oxygenated hemoglobin concentration C HbO2 of the BAT detector is significantly higher than that of the non-BAT detector. Further, only in the supraclavicular fossa, a strong correlation was observed between the corrected oxygenated hemoglobin concentration C HbO2 and the BAT activity SUV max . Such a tendency was not observed at a site where BAT hardly existed (lower clavicle and deltoid muscle).
- the result of this example shows that the oxygenated hemoglobin concentration C HbO2 by time-resolved spectroscopic measurement reflects a large number of capillaries existing in BAT in the supraclavicular fossa where BAT exists. .
- the result of this example shows that the oxygenated hemoglobin concentration C HbO2 can quantitatively evaluate BAT. Therefore, the oxygenated hemoglobin concentration C HbO2 by time-resolved spectroscopic measurement can be used as an index value for the BAT amount. Further, the oxygenated hemoglobin concentration C HbO2 corrected using a parameter relating to the body fat amount such as the body fat percentage is used as a more accurate index value.
- FIG. 20 to 22 are graphs showing the relationship between the total hemoglobin concentration C tHb corrected by the body fat percentage and the BAT activity SUV max .
- FIG. 20 shows the relationship in the supraclavicular fossa
- FIG. 21 shows the relationship in the lower clavicle
- FIG. 22 shows the relationship in the deltoid muscle.
- the vertical axis represents the total hemoglobin concentration C tHb (unit: ⁇ M)
- the horizontal axis represents the common logarithm of the activity SUV max .
- 20 to 22 as in the case of oxygenated hemoglobin concentration C HbO2 , only in the supraclavicular fossa where BAT exists, there is a strong correlation between the total hemoglobin concentration C tHb and the activity SUV max of BAT. It was found. Therefore, the total hemoglobin concentration C tHb can also be handled as an index value related to the BAT amount.
- the absorption coefficient ⁇ a also increase or decrease according to the increase or decrease of the oxygenated hemoglobin concentration C HbO2 or the total hemoglobin concentration C tHb. Therefore, it is clear that there is a strong correlation between the BAT activity SUV max . Therefore, such a parameter can also be handled as an index value related to the BAT amount.
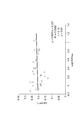
- FIG. 23 to FIG. 25 are graphs showing the relationship between the absorption coefficient ⁇ a and the BAT activity SUV max .
- FIG. 23 shows the relationship in the supraclavicular fossa
- FIG. 24 shows the relationship in the lower clavicle
- FIG. 25 shows the relationship in the deltoid muscle.
- the vertical axis represents the absorption coefficient ⁇ a (unit: cm ⁇ 1 ), and the horizontal axis represents the common logarithm of the activity SUV max .
- the absorption coefficient mu a is a numerical value at a wavelength of 800 nm.
- FIG. 26 to 28 are graphs showing the correlation between the absorption coefficient ⁇ a and the body fat percentage.
- FIG. 26 shows the relationship in the supraclavicular fossa
- FIG. 27 shows the relationship in the lower clavicle
- FIG. 28 shows the relationship in the deltoid muscle.
- the vertical axis represents the absorption coefficient ⁇ a (unit: cm ⁇ 1 )
- the horizontal axis represents the body fat percentage (unit:%).
- FIG. 29 to FIG. 31 are graphs showing the relationship between the corrected absorption coefficient ⁇ a and the BAT activity SUV max .
- FIG. 29 shows the relationship in the supraclavicular fossa
- FIG. 30 shows the relationship in the lower clavicle
- FIG. 31 shows the relationship in the deltoid muscle.
- the vertical axis represents the absorption coefficient ⁇ a (unit: cm ⁇ 1 )
- the horizontal axis represents the common logarithm of the activity SUV max .
- the correction method of the absorption coefficient mu a is not limited to univariate analysis. For example, instead of the body fat percentage, correction may be performed using other parameters related to the body fat mass. Examples of other parameters include subcutaneous fat thickness and fat amount estimated from spectral characteristics.
- FIG. 32 is a block diagram schematically showing the configuration of the second embodiment of the measuring apparatus according to the present invention.
- the measuring device 1B of the present embodiment includes a calculating unit 30B instead of the calculating unit 30 of the measuring device 1A of the first embodiment.
- the calculation unit 30B includes a calculation processing unit 35 instead of the calculation processing unit 33 of the calculation unit 30 of the first embodiment.
- the calculation processing unit 35 includes a hemoglobin concentration calculation unit 35a and an index value calculation unit 35b.
- the hemoglobin concentration calculation unit 35a acquires a parameter representing the light absorption characteristic of the measurement site B from the bio-optical property measurement unit 32, and performs a predetermined calculation, thereby deoxygenated hemoglobin concentration (C Hb ) in the measurement site B. Is calculated.
- the method for calculating the deoxygenated hemoglobin concentration (C Hb ) is the same as in the first embodiment. Further, unlike the measurement apparatus 1A, the measurement apparatus 1B does not include the storage unit 40 and the parameter input unit 50.
- the bio-optical property measurement unit 32 calculates the scattering coefficient ⁇ ′ s of the measurement site B based on the time waveform obtained by the time waveform measurement unit 31.
- the scattering coefficient ⁇ ′ s is a concept including a converted scattering coefficient.
- the index value calculation unit 35b acquires the scattering coefficient ⁇ ′ s of the measurement site B from the bio-optical characteristic measurement unit 32, and the deoxygenated hemoglobin concentration (C Hb ) calculated by the hemoglobin concentration calculation unit 35a, and Then, an index value related to the BAT amount is calculated from at least one of the scattering coefficients ⁇ ′ s calculated by the bio-optical property measuring unit 32.
- step S13 an index value related to the BAT amount is calculated from at least one of the scattering coefficient ⁇ ′ s and the deoxygenated hemoglobin concentration (C Hb ).
- the present inventors have found that a significant correlation exists between the scattering coefficient ⁇ ′ s and the deoxygenated hemoglobin concentration (C Hb ) and the amount of BAT after the study. It was. Therefore, according to the measurement apparatus 1B and the measurement method of the present embodiment described above, as in the first embodiment, the burden on the subject can be remarkably reduced, and the BAT measurement can be performed very easily. Can do.
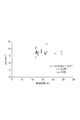
- FIGS. 33 to 35 are graphs showing the relationship between the scattering coefficient ⁇ ′ s and the activity SUV max of the BAT.
- FIG. 33 shows the relationship in the supraclavicular fossa
- FIG. 34 shows the relationship in the lower clavicle
- FIG. 35 shows the relationship in the deltoid muscle.
- the vertical axis represents the scattering coefficient ⁇ ′ s (unit: cm ⁇ 1 ), and the horizontal axis represents the common logarithm of the activity SUV max .
- the scattering coefficient ⁇ ′ s is a numerical value at a wavelength of 760 nm.
- FIG. 36 shows the relationship in the supraclavicular fossa
- FIG. 37 shows the relationship in the lower clavicle
- FIG. 38 shows the relationship in the deltoid muscle.
- the vertical axis represents the scattering coefficient ⁇ ′ s (unit: cm ⁇ 1 )
- the horizontal axis represents the body fat percentage (unit:%).
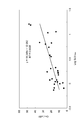
- FIG. 39 is a graph showing the relationship between the deoxygenated hemoglobin concentration (C Hb ) and the BAT activity SUV max , showing the relationship in the supraclavicular fossa.
- the vertical axis represents the deoxygenated hemoglobin concentration (C Hb ) (unit: ⁇ M), and the horizontal axis represents the common logarithm of the activity SUV max .
- a strong correlation was found between deoxygenated hemoglobin concentration (C Hb ) and BAT activity SUV max in the supraclavicular fossa where BAT was present. Therefore, it was shown that the activity SUV max of BAT can be accurately evaluated based on the deoxygenated hemoglobin concentration (C Hb ).
- FIG. 40 is a graph showing the correlation between the deoxygenated hemoglobin concentration (C Hb ) and the body fat percentage, and shows the relationship in the supraclavicular fossa.
- the vertical axis represents deoxygenated hemoglobin concentration (C Hb ) (unit: ⁇ M), and the horizontal axis represents body fat percentage (unit:%).
- C Hb deoxygenated hemoglobin concentration
- body fat percentage unit:%
- FIG. 41 is a block diagram schematically showing the configuration of the third embodiment of the measuring apparatus according to the present invention.
- the measurement apparatus 1C of the present embodiment includes a calculation unit 30C instead of the calculation unit 30 of the measurement apparatus 1A of the first embodiment.
- the calculation unit 30C further includes a determination unit 34 in addition to the configuration of the calculation unit 30 of the first embodiment. Since the configuration of the calculation unit 30C excluding the determination unit 34 is the same as that of the calculation unit 30, detailed description thereof is omitted.
- the discriminating unit 34 is provided with an index value related to the BAT amount from the index value calculating unit 33b of the processing unit 33.
- the discrimination unit 34 discriminates whether the subject's BAT amount is negative or positive by comparing the index value with a predetermined threshold value. Specifically, the determination unit 34 determines positive when the index value exceeds the threshold value, and determines negative when the index value does not exceed the threshold value. This determination result is displayed together with an index value related to the BAT amount on the display device 80, for example.
- FIG. 42 is a flowchart showing the operation and the measuring method of the measuring apparatus 1C according to the present embodiment.
- a determination step S14 is provided in addition to the measurement method according to the first embodiment (see FIG. 4).
- the determination unit 34 determines whether the BAT amount of the subject is negative or positive by comparing the index value related to the BAT amount calculated in the calculation step S13 with a predetermined threshold value. .
- the burden on the subject can be remarkably reduced, and the BAT measurement can be performed very easily.
- the boundary between negative and positive BAT amounts is said to be about 2.0 in SUV max , and at present, discrimination between negative and positive is performed by visual observation of a radiographer based on a PET image.
- the BAT amount can be accurately evaluated as described in the first example, so whether the BAT amount is negative or positive can be easily and accurately determined. Can be determined.
- determination part 34 of this embodiment can also be provided in the calculating part 30B of 2nd Embodiment.
- a receiver operating characteristic is obtained by using a discrimination result in the discrimination unit 34 (discrimination step S14) and a visual discrimination result based on the PET image. ) Created a curve.
- FIGS. FIG. 43A is an ROC curve of a discrimination result based on the index value calculated from the oxygenated hemoglobin concentration C HbO2 .
- 43B shows the total hemoglobin concentration C tHb
- FIG. 44A shows the absorption coefficient ⁇ a (wavelength 760 nm)
- FIG. 44B shows the absorption coefficient ⁇ a (wavelength 800 nm)
- FIG. 45B is the scattering coefficient ⁇ ′ s (wavelength 800 nm)
- FIG. 46A is the ROC curve based on the index values calculated from the deoxygenated hemoglobin concentration C Hb. It is.
- FIG. 46B shows a ROC curve of a discrimination result based on the index value calculated from the oxygen saturation SO 2 . 43 to 46, the vertical axis represents the positive degree (also referred to as sensitivity or positive predictive value), and the horizontal axis represents the value obtained by subtracting the false negative degree (specificity (also referred to as negative predictive value) from 1). ). Moreover, in any ROC curve, the correction by the parameter regarding the body fat mass is not performed.
- the BAT measuring method and measuring apparatus are not limited to the above-described embodiments, and various other modifications are possible.
- the hemoglobin concentration is calculated using the time-resolved spectroscopic measurement method in the above embodiment, but as the near infrared spectroscopic measurement method used in the calculation unit and the calculation step of the present invention, for example, phase modulation spectroscopy, Various methods such as space-resolved spectroscopy and micro-beer-lambert method can be applied.
- the light incident step in which the near infrared light is incident on the measurement site from the light incidence unit, and the near infrared light that has propagated inside the measurement site in the light detection unit.
- the light detection step for detecting the light intensity and the oxygenated hemoglobin concentration, the total hemoglobin concentration, and the oxygenated hemoglobin concentration or the total of the measurement site determined by the near infrared spectroscopy based on the detection result in the light detection unit
- the light incident step in which near-infrared light is incident on the measurement site from the light incidence unit, and the near-infrared that propagates in the measurement site in the light detection unit Brown fat from at least one of the scattering coefficient and deoxygenated hemoglobin concentration of the site to be measured, which is determined by the light detection step for detecting the light intensity of light and the near-infrared spectroscopy measurement method based on the detection result in the light detection unit And a calculation step for calculating an index value related to the tissue amount.
- the light incident part that makes the near infrared light incident on the measurement site and the light detection that detects the light intensity of the near infrared light propagated inside the measurement site.
- the oxygenated hemoglobin concentration, total hemoglobin concentration, and oxygenated hemoglobin concentration or total hemoglobin concentration of the measurement site which are obtained by the near-infrared spectroscopy measurement method based on the detection results of the light detection unit
- a calculation unit that calculates an index value related to the BAT amount from at least one numerical value of the first parameters.
- a light incident unit that enters near-infrared light into the measurement site and light detection that detects the light intensity of the near-infrared light that has propagated through the measurement site.
- the body fat contained in at least one numerical value is calculated using data representing the correlation between the second parameter relating to the body fat mass and at least one numerical value or measurement sensitivity. It is good also as a structure which makes the numerical value correct
- the brown adipose tissue measurement apparatus further includes a storage unit that stores data representing a correlation between the second parameter relating to the body fat mass and at least one numerical value or measurement sensitivity, and the calculation unit stores the data. The numerical value corrected so as to reduce the influence of the body fat amount contained in at least one numerical value may be used as the index value related to the BAT amount.
- the hemoglobin concentration measured by near infrared spectroscopy is easily affected by WAT.
- the absorbance of WAT is extremely small compared to muscle, and the individual difference in the amount of WAT, that is, the amount of body fat is large. Therefore, the higher the body fat, the lower the hemoglobin concentration, and the lower the body fat, the higher the estimated hemoglobin concentration. There is a tendency to be deceived.
- BAT promotes energy consumption, people with higher BAT activity values tend to have less body fat.
- the numerical value corrected so as to reduce the influence of the body fat amount contained in the hemoglobin concentration or the like is obtained. Since the index value is related to the BAT amount, the BAT amount can be evaluated with higher accuracy.
- the brown adipose tissue measurement method may further include a determination step of determining whether the brown adipose tissue amount is negative or positive by comparing an index value with a threshold value.
- the brown adipose tissue measuring apparatus may be configured such that the calculation unit determines whether the amount of brown adipose tissue is negative or positive by comparing the index value with a threshold value. In the brown adipose tissue measurement method and measurement apparatus described above, whether the BAT amount is negative or positive can be easily and accurately determined based on the high evaluation accuracy.
- the present invention can be used as a brown adipose tissue measurement method and measurement apparatus that can reduce the burden on the subject.
- DESCRIPTION OF SYMBOLS 1A ... Measuring apparatus, 10 ... Light incident part, 11 ... Pulse light source, 12 ... Light guide for light incidence, 20 ... Light detection part, 21 ... Light guide for light detection, 22 ... Light detector, 30 ... Calculation part, 31 ... time waveform measurement unit, 32 ... bio-optical characteristic measurement unit, 33 ... calculation processing unit, 33a ... hemoglobin concentration calculation unit, 33b ... index value calculation unit, 40 ... storage unit, 50 ... parameter input unit, 60 ... control unit, DESCRIPTION OF SYMBOLS 70 ... Main-body part, 80 ... Display apparatus, B ... Measuring part, D ... Light detection position, L1 ... Approximate straight line, P (n) ... Near infrared pulse light, S ... Light incident position.
Landscapes
- Health & Medical Sciences (AREA)
- Life Sciences & Earth Sciences (AREA)
- Physics & Mathematics (AREA)
- Engineering & Computer Science (AREA)
- General Health & Medical Sciences (AREA)
- Pathology (AREA)
- Veterinary Medicine (AREA)
- Heart & Thoracic Surgery (AREA)
- Medical Informatics (AREA)
- Molecular Biology (AREA)
- Surgery (AREA)
- Animal Behavior & Ethology (AREA)
- Biomedical Technology (AREA)
- Public Health (AREA)
- Biophysics (AREA)
- Spectroscopy & Molecular Physics (AREA)
- Optics & Photonics (AREA)
- Physiology (AREA)
- Artificial Intelligence (AREA)
- Signal Processing (AREA)
- Psychiatry (AREA)
- Computer Vision & Pattern Recognition (AREA)
- Analytical Chemistry (AREA)
- General Physics & Mathematics (AREA)
- Immunology (AREA)
- Biochemistry (AREA)
- Cardiology (AREA)
- Chemical & Material Sciences (AREA)
- Hematology (AREA)
- Measurement Of The Respiration, Hearing Ability, Form, And Blood Characteristics Of Living Organisms (AREA)
- Investigating Or Analysing Materials By Optical Means (AREA)
Priority Applications (3)
| Application Number | Priority Date | Filing Date | Title |
|---|---|---|---|
| DE112014004196.3T DE112014004196T5 (de) | 2013-09-12 | 2014-08-27 | Messverfahren und Messvorrichtung für braunes Fettgewebe |
| US14/917,581 US10478122B2 (en) | 2013-09-12 | 2014-08-27 | Measurement method and measurement device for brown adipose tissue |
| GB1605950.3A GB2534735B (en) | 2013-09-12 | 2014-08-27 | Measurement method and measurement device for brown adipose tissue |
Applications Claiming Priority (4)
| Application Number | Priority Date | Filing Date | Title |
|---|---|---|---|
| JP2013-189632 | 2013-09-12 | ||
| JP2013189632 | 2013-09-12 | ||
| JP2014006914A JP6224464B2 (ja) | 2013-09-12 | 2014-01-17 | 褐色脂肪組織の測定方法及び測定装置 |
| JP2014-006914 | 2014-01-17 |
Publications (1)
| Publication Number | Publication Date |
|---|---|
| WO2015037446A1 true WO2015037446A1 (ja) | 2015-03-19 |
Family
ID=52665559
Family Applications (1)
| Application Number | Title | Priority Date | Filing Date |
|---|---|---|---|
| PCT/JP2014/072497 Ceased WO2015037446A1 (ja) | 2013-09-12 | 2014-08-27 | 褐色脂肪組織の測定方法及び測定装置 |
Country Status (5)
| Country | Link |
|---|---|
| US (1) | US10478122B2 (enExample) |
| JP (1) | JP6224464B2 (enExample) |
| DE (1) | DE112014004196T5 (enExample) |
| GB (2) | GB2534735B (enExample) |
| WO (1) | WO2015037446A1 (enExample) |
Families Citing this family (2)
| Publication number | Priority date | Publication date | Assignee | Title |
|---|---|---|---|---|
| US10827974B2 (en) * | 2016-01-22 | 2020-11-10 | The Regents Of The University Of California | Predicting weight loss and fat metabolism using optical signal changes in fat |
| JP7705640B2 (ja) * | 2021-01-18 | 2025-07-10 | 浜松ホトニクス株式会社 | 分析装置及び分析方法 |
Citations (1)
| Publication number | Priority date | Publication date | Assignee | Title |
|---|---|---|---|---|
| JP2002516398A (ja) * | 1998-05-15 | 2002-06-04 | グラクソ グループ リミテッド | 赤外サーモグラフィー |
Family Cites Families (2)
| Publication number | Priority date | Publication date | Assignee | Title |
|---|---|---|---|---|
| EP1272101A2 (en) * | 2000-04-13 | 2003-01-08 | National Research Council of Canada Ltd. | Tissue viability/health monitor utilizing near infrared spectroscopy |
| WO2009067501A2 (en) * | 2007-11-19 | 2009-05-28 | Joslin Diabetes Center, Inc. | Infrared thermography for monitoring brown adipose tissue |
-
2014
- 2014-01-17 JP JP2014006914A patent/JP6224464B2/ja active Active
- 2014-08-27 GB GB1605950.3A patent/GB2534735B/en active Active
- 2014-08-27 DE DE112014004196.3T patent/DE112014004196T5/de active Pending
- 2014-08-27 GB GB1805155.7A patent/GB2560268B/en active Active
- 2014-08-27 US US14/917,581 patent/US10478122B2/en active Active
- 2014-08-27 WO PCT/JP2014/072497 patent/WO2015037446A1/ja not_active Ceased
Patent Citations (1)
| Publication number | Priority date | Publication date | Assignee | Title |
|---|---|---|---|---|
| JP2002516398A (ja) * | 1998-05-15 | 2002-06-04 | グラクソ グループ リミテッド | 赤外サーモグラフィー |
Non-Patent Citations (1)
| Title |
|---|
| ATSUSHI OZAKI: "Temperature Measurement of Brown Adipose Cells Using Near-Infrared Spectroscopy", THE JAPAN SOCIETY OF MECHANICAL ENGINEERS THERMAL ENGINEERING CONFERENCE 2007 KOEN RONBUNSHU, 2007, pages 393 - 394 * |
Also Published As
| Publication number | Publication date |
|---|---|
| GB2534735A (en) | 2016-08-03 |
| US20160220183A1 (en) | 2016-08-04 |
| GB201805155D0 (en) | 2018-05-16 |
| GB2534735B (en) | 2018-08-01 |
| GB2560268A (en) | 2018-09-05 |
| JP2015077387A (ja) | 2015-04-23 |
| DE112014004196T5 (de) | 2016-06-23 |
| JP6224464B2 (ja) | 2017-11-01 |
| GB2560268B (en) | 2018-12-05 |
| US10478122B2 (en) | 2019-11-19 |
Similar Documents
| Publication | Publication Date | Title |
|---|---|---|
| KR101399907B1 (ko) | 조직 산소화의 측정 | |
| US8199322B2 (en) | Apparatus and method for determining analyte concentrations | |
| US8175665B2 (en) | Method and apparatus for spectroscopic tissue analyte measurement | |
| CN102058393A (zh) | 基于反射光谱测量的皮肤生理参数与光学特性参数的测量方法和系统 | |
| JP5527658B2 (ja) | 散乱吸収体測定方法及び装置 | |
| Potapova et al. | Evaluation of microcirculatory disturbances in patients with rheumatic diseases by the method of diffuse reflectance spectroscopy | |
| JP5674093B2 (ja) | 濃度定量装置及び濃度定量方法並びにプログラム | |
| Yadav et al. | Comparative study of different measurement sites using NIR based non-invasive glucose measurement system | |
| RU2510506C2 (ru) | Способ определения оптических и биофизических параметров биоткани | |
| CN111973169B (zh) | 一种有效肝血流指数的评估方法及检测装置、存储介质 | |
| JP2012085877A (ja) | 濃度定量装置及び濃度定量方法並びにプログラム | |
| JP6043276B2 (ja) | 散乱吸収体測定装置及び散乱吸収体測定方法 | |
| EP3315943B1 (en) | Scattering absorber measurement device and scattering absorber measurement method | |
| JP6224464B2 (ja) | 褐色脂肪組織の測定方法及び測定装置 | |
| JP2012081123A (ja) | 濃度定量装置及び濃度定量方法並びにプログラム | |
| Rogatkin et al. | Metrological support of methods and devices for noninvasive medical spectrophotometry | |
| Ndabakuranye et al. | Bi-modal system-on-chip platform for bilirubin monitoring by using photometric and temporal degradation approaches | |
| Kumar et al. | Diffuse reflectance-based spectroscopic technique for real-time estimation of localized blood oxygenation parameters from human fingertips: a preliminary study | |
| Shapovalov et al. | A non-invasive method for spectroscopic blood glucose monitoring | |
| Kanishyna et al. | Study of tissue microcirculation disorders after tooth extraction by photoplethysmography in diabetic patients | |
| JP7705640B2 (ja) | 分析装置及び分析方法 | |
| Kuroiwa et al. | Adiposity in Humans | |
| RU2501522C2 (ru) | Способ определения концентрации гемоглобина в биологических тканях | |
| Tse et al. | Spatially resolved 2D attenuation image of a semi-infinite non-homogeneous tissue from diffuse reflectance | |
| Jiang et al. | Monte Carlo simulation on how optical clearing technique influences predicting precision of non-invasive optical blood glucose sensing |
Legal Events
| Date | Code | Title | Description |
|---|---|---|---|
| 121 | Ep: the epo has been informed by wipo that ep was designated in this application |
Ref document number: 14844239 Country of ref document: EP Kind code of ref document: A1 |
|
| WWE | Wipo information: entry into national phase |
Ref document number: 14917581 Country of ref document: US |
|
| WWE | Wipo information: entry into national phase |
Ref document number: 112014004196 Country of ref document: DE Ref document number: 1120140041963 Country of ref document: DE |
|
| ENP | Entry into the national phase |
Ref document number: 201605950 Country of ref document: GB Kind code of ref document: A Free format text: PCT FILING DATE = 20140827 |
|
| 122 | Ep: pct application non-entry in european phase |
Ref document number: 14844239 Country of ref document: EP Kind code of ref document: A1 |